Attached files
| file | filename |
|---|---|
| 8-K - FORM 8-K - Chesapeake Lodging Trust | d8k.htm |
 6/10/2010
Exhibit 99.1 |
 1
Disclaimer
6/10/2010
We make forward-looking statements in this presentation that are subject to risks and
uncertainties. These forward-looking statements include information about possible or
assumed future results of our business, financial condition, liquidity, results of operations, plans and objectives. When we use the words “believe,”
“expect,” “anticipate,” “estimate,” “plan,”
“continue,” “intend,” “should,” “may” or similar expressions, we intend to identify forward-looking statements. Statements
regarding the following subjects, among others, may be forward-looking by their nature: our
business and investment strategy, including our ability to identify suitable properties to
acquire; our forecasted operating results; completion of any pending transactions; our ability to obtain adequate debt or equity financing to
complete acquisitions and to maintain future financing arrangements; market trends in our industry,
interest rates, real estate values, the debt securities markets or the general economy; our
expected leverage levels; and our expectations for economic trends and recoveries, and the impact of those on the lodging industry
generally and the market segments in which we intend to operate, in particular.
The forward-looking statements are based on our beliefs, assumptions and expectations of our
future performance, taking into account all information currently available to us. You should
not place undue reliance on these forward-looking statements. These beliefs, assumptions and expectations can change as a result
of many possible events or factors, not all of which are known to us. If a change occurs, our
business, financial condition, liquidity and results of operations may vary materially from
those expressed in our forward-looking statements. Additionally, the following factors could cause actual results to vary from our forward-
looking statements:
changes in our business or investment strategy;
availability to us, and the terms of, capital for use in our future growth;
our ability to reach agreement with prospective sellers and acquire additional hotel properties on
favorable terms or at all; the extent to which the general U.S. or international economy recovers, and the resultant effect on
our industry and the market segments in which we operate; the degree and nature of
our competition; availability of and our ability to retain qualified personnel;
our ability to maintain our qualification as a REIT;
general volatility of the capital markets and the market price of our common shares;
actions and initiatives of the U.S. government, changes to U.S. government policies and the execution
and impact of these actions, initiatives and policies; changes in interest rates; and
the other factors discussed in our IPO prospectus, including those set forth under the sections
titled “Risk factors,” “Management’s discussion and analysis of financial
condition and results of operations” and “Our business.” Any forward-looking statement speaks only as of the date on which it is made. Except as required
by law, we are not obligated to, and do not intend to, publicly update or revise any
forward-looking statements, whether as a result of new information, future events or otherwise.
This presentation may contain statistics and other data that may have been obtained from or compiled
from information made available by third-party service providers.
|
 2
Key Investment Highlights
Extensive industry relationships including strategic relationship with
Hyatt to drive pipeline
Experienced
management
team
with
strong
public
company
track
record
Improving industry fundamentals
Growth-oriented capital structure/favorable valuation
Compelling market opportunity validated by recent acquisitions and
current pipeline
6/10/2010 |
 3
Who We Are and What We Have Done
Recently formed lodging REIT that went public in January 2010
Raised gross proceeds of $180.2M in public and private offerings
Pending revolving credit facility with capacity up to $115.0M
Committed $183.0M of proceeds to purchase three hotels:
Hyatt Regency Boston
498 rooms
Hilton Checkers LA
188 rooms
Courtyard Anaheim
153 rooms
Led by experienced senior management and strong board
6/10/2010 |
 4
Veteran Management Team & Diverse and Experienced Board
Veteran Management Team
Experienced management team led by James Francis, CEO & President, Doug
Vicari, EVP & CFO, Rick Adams, SVP & CIO, and Graham Wootten, SVP
& CAO Management has experience over several market cycles, through a
variety of industry conditions and platforms
Team worked successfully together previously at Highland Hospitality
Lodging industry experience in excess of 20 years
Diverse and Experienced Board
5 independent board members, with 2 former Highland Hospitality members:
Thomas Natelli, Non-Executive Chairman (former Highland member)
Thomas Eckert, Independent Trustee
John Hill, Independent Trustee (former Highland member)
George McKenzie, Independent Trustee
Jeffrey Nuechterlein, Independent Trustee
Strong corporate governance with a focus on delivering shareholder value
Independent non-executive Chairman
Board will be elected annually
Broad real estate/public company experience
6/10/2010 |
 5
Highland Hospitality IPO and related
transactions on 12/16/2003
2003 to 2007 –
Purchased 30 hotels for
approximately $1.3 billion:
Portfolio included Hyatt, Westin, Marriott and
Hilton hotels
Implemented value-added renovation and
capital programs
Built an outstanding team and corporate culture
Experienced management team with
outstanding staff support
Accomplished Board of Directors with
effective oversight role
–
Ranked 2nd in corporate governance in
lodging REITs by Real Estate Portfolio
magazine
¹
2007 –
Strategic exit from public markets
through sale to JER at $19.50/share
Highland Hospitality Track Record
1
Source: Real Estate Portfolio magazine; July/August 2005 issue
2
Source: FactSet
3
Represents share price performance following Highland Hospitality’s exit from
the market on 7/17/07 through 1/14/10 7/17/2007:
Sale to
JER at $19.50/share
Ticker
Change
LHO
(52.4%)
DRH
(51.7%)
HST
(48.4%)
SHO
(67.1%)
12/16/2003:
IPO at
$10.00/share
Note: Represents total return at $19.50 per share received at the time of sale to
JER for one share purchased at the IPO price of $10.00 per share (assuming
reinvestment of all cash dividends paid by Highland on its common stock for
all periods following its IPO in additional shares of common stock on the
dividend payment dates) Highland
Hospitality
–
Share
price
performance
²
Selected Peer Share
Price
Performance
³
Highland
Hospitality
–
Background
6/10/2010 |
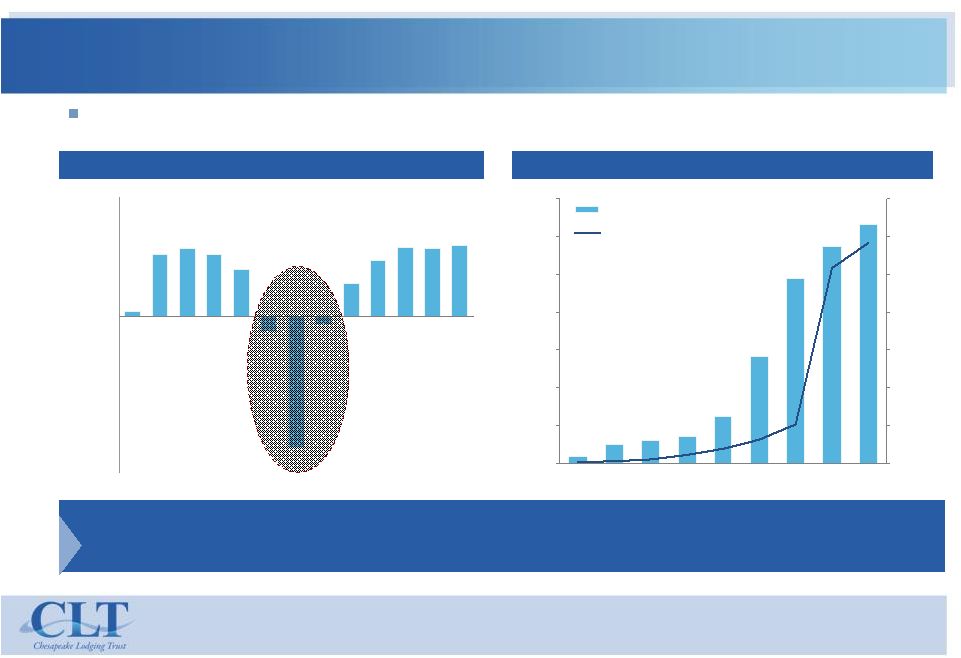
 6
Record Levels Of Transaction Activity (2003 –
2009)
1
Source: Commercial Mortgage Alert for total U.S. CMBS issuance including lodging-related
issuance 2
Sources: Property level transactions: HVS; Corporate Privatizations: SNL Financial LC. Property level
transaction volume includes only transactions greater than $10mm.
U.S.
Hotel
Transaction
Activity
(2003
–
2009)
-
$bn
²
U.S.
CMBS
Issuance
(2003
–
2009)
-
$bn
¹
$78
$93
$169
$203
$230
$12
$3
$0
$50
$100
$150
$200
$250
2003
2004
2005
2006
2007
2008
2009
$5.5
$12.1
$17.7
$23.1
$49.3
$4.3
$788 billion of CMBS issued
High
volume
of
lodging
transactions
were
fueled
by
record
levels
of
debt
financing
available
to
the
commercial real estate industry
$114.1
billion of hotel assets purchased
$2.1
6/10/2010
$8.6
$13.2
$16.3
$12.4
$4.5
$6.7
$36.9
$4.8
$0.7
$3.5
$0.0
$5.0
$10.0
$15.0
$20.0
$25.0
$30.0
$35.0
$40.0
$45.0
$50.0
$55.0
$60.0
$65.0
2003
2004
2005
2006
2007
2008
2009
Corporate Privatizations ($52.3bn)
Property Level Transactions ($61.7bn) |
   7
High Leverage + Significant RevPAR
Decline = Opportunity
U.S.
Distressed
Hotel
Loans
Volume
(3/2008
–
3/2010)
²
0.5%
7.8%
8.6%
7.8%
5.9%
(1.9%)
(16.7%)
(1.0%)
4.1%
7.0%
8.7%
8.6%
8.9%
(20.0%)
(15.0%)
(10.0%)
(5.0%)
0.0%
5.0%
10.0%
15.0%
2003
2004
2005
2006
2007
2008
2009
2010E
2011E
2012E
2013E
2014E
2015E
U.S.
RevPAR
Annual
%
Change
(2003A
–
2015E)
¹
We believe declining cash flows and valuations combined with high levels of property
debt are leading
to
increasing
levels
of
foreclosures,
restructurings
and
distressed
hotel
sales
We believe current industry dynamics will create attractive opportunities to acquire
high quality hotel properties, at prices well below replacement costs, with
attractive yields and significant upside potential
$31.6
$28.7
$2.5
$3.0
$3.6
$6.2
$14.2
$24.4
$0.8
$0.0
$5.0
$10.0
$15.0
$20.0
$25.0
$30.0
$35.0
3 / 08
6 / 08
9 / 08
12 / 08
3 / 09
6 / 09
9 / 09
12 / 09
3 / 10
0
200
400
600
800
1,000
1,200
1,400
Distressed Hotel Loans ($bn)
Number of Distressed Hotel Loans
6/10/2010
1
Source: 2003A-2009A: Smith Travel Research, 2010E-2015E: HVS
2
Source: © Real Capital Analytics, Inc. (www.rcanalytics.com). Note: Distress includes loans in
foreclosure, bankruptcy, and restructured/modified statuses |
 8
Current Environment Will Create Attractive Acquisition
Opportunities
Universe of Sellers
High property and corporate level leverage
Severe recent decline in operating
performance
Insufficient cash flow available to address
debt service and capital requirements
Debt balance in excess of current property
values
Capital requirements from brands and
management companies
Existing public and private hotel owners
National and regional banks
Insurance companies and pension funds
Branded hotel companies
Real estate mezzanine debt investors
CMBS special servicers
Drivers
Management believes opportunities will be created to acquire hotel properties from
both opportunistic sellers and financially distressed
owners/participants 6/10/2010 |
 9
Upper-upscale segment
Hyatt
®
and
Hyatt
Regency
®
Hilton
®
Marriott
®
Renaissance
®
Sheraton
®
Westin
®
Upscale hotels in unique locations
Hyatt
Place
®
Courtyard
by
Marriott
®
Hilton
Garden
Inn
®
Independent boutique hotels in unique locations
Markets
Segments
Top 25 Metropolitan Statistical Areas (“MSAs”)
High barrier to entry markets with limited supply
growth
Markets with solid demand growth due to multiple
demand generators, including corporate, convention,
leisure and government
Chesapeake’s Hotel Investment Strategy
Investment focus will primarily be on upper-upscale hotels in major business,
airport and convention markets in the United States and, on a selective
basis, premium select-service hotels
6/10/2010 |
 10
Strategic Sourcing Agreement with Hyatt
Hyatt commitment
Alignment of interest with widely recognized
hospitality company with industry-leading hotel
brands
IPO investment of $8.5M or 4.8% of Chesapeake's
outstanding common equity
3-year sourcing agreement intended to deliver
benefits to both companies
Preferred manager relationship with pre-
negotiated agreements
Hyatt retains right to manage or franchise in
certain situations
We believe the strategic Sourcing Agreement with Hyatt will enhance our ability to
execute
our business strategy
6/10/2010 |
 11
Extensive Industry Relationships Create A Strong
Sourcing Platform
Public REITs
Hyatt
sourcing agreement
Other global branded hotel
companies
(Marriott, Starwood,
Hilton, etc.)
Commercial real estate
and
hotel brokers
Chesapeake
Investment
Opportunities
Independent third-party
management companies
Private equity funds and
other institutional owners
Lenders such as national
and regional banks,
insurance companies, &
mezzanine debt investors
CMBS special
servicers
6/10/2010 |
 12
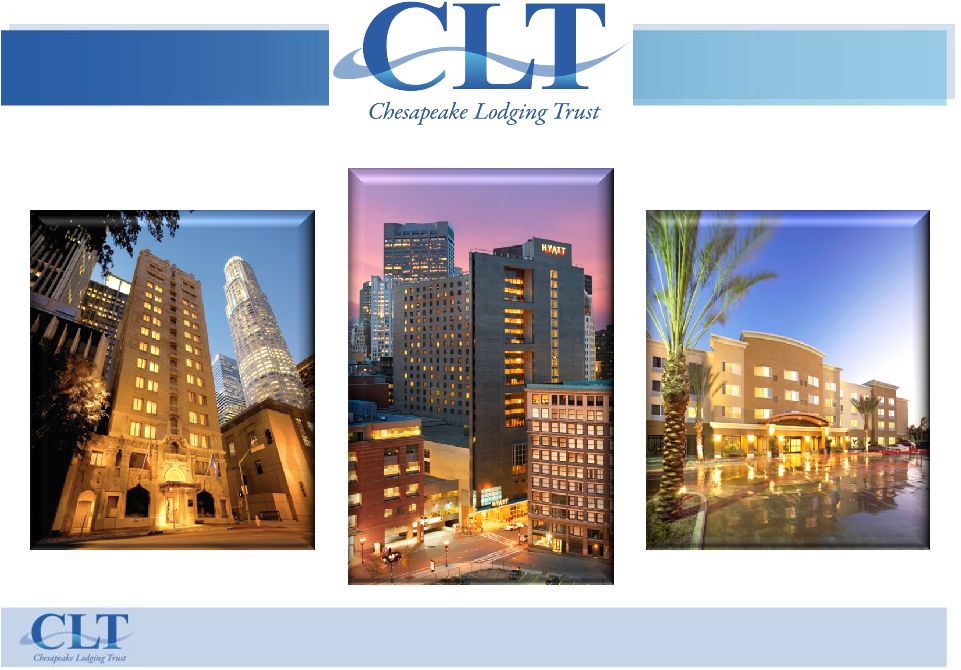
Completed Acquisition –
Hyatt Regency Boston
$112 million purchase price ($225,000 per key)
Full-service, upper-upscale
Boston, Massachusetts (located within Boston’s
Financial District and the Downtown Crossing)
498 rooms
Contemporary guestrooms and suites with more
than 20,000 sq. ft. of meeting and function space,
including a 5,000 sq. ft. grand ballroom
Peak-to-Trough
NOI
¹
:
40%
Purchased from Hyatt
1
Peak and trough represent 2007 and 2009, respectively
6/10/2010 |
 13
Completed Acquisition –
Hilton Checkers Los Angeles
$46 million purchase price ($245,000 per key)
Full-service, Four-Diamond, upper-upscale
Los Angeles, California (located in the heart of the
financial and business district)
188 rooms
Recognized as the only deluxe, European-styled
boutique property in downtown LA
Peak-to-Trough
NOI
¹
:
30%
1
Peak and trough represent 2008 and 2009, respectively
6/10/2010 |
 14
Pending Acquisition –
Courtyard Anaheim at Disneyland
Resort
$25 million purchase price ($163,000 per key)
Select-service, upscale
Anaheim, California (one block from the Anaheim
Convention Center and four blocks from the
Disneyland Resort)
153 rooms
Contemporary public spaces with guestrooms
averaging over 400 sq. ft. with 18 larger family
friendly “kid suites”
Peak-to-Trough
NOI
¹
:
25%
1
Peak and trough represent 2007 and 2009, respectively
6/10/2010 |
 15
Pipeline
One
hotel
under
signed
LOI
(over
$75M
with
400+
rooms;
top
5
market)
LOIs
issued on 3 additional hotels for approximately $80M total
Pipeline activity continues to increase each month
Actively
working
on
an
additional
15
–
20
targets
with
over
5,000
rooms
6/10/2010
Disclaimer: Our ability to complete the acquisitions in our pipeline depends on many factors,
including our ability to reach agreements with the prospective sellers, satisfactory diligence
reviews and our access to sufficient funding. We cannot assure that any of these deals will be completed. |
 16
Lodging Industry Fundamentals
Lodging industry is cyclical and has historically rebounded following economic
downturns In 2008, the lodging industry began experiencing a significant
downturn 2009
RevPAR
declined
16.7%
¹
for
the
full
year,
a
significantly
larger
decline
than
the
two
most
recent
lodging industry downturns in 1991 and 2001/2002
2010
RevPAR
is
expected
to
decline
slightly
¹
,
however,
lodging
demand
has
recently
begun
showing
signs of improvement as the economy recovers and business fundamentals stabilize
New supply leading into this downturn was moderate compared to the last two
downturns and is expected
to
remain
constrained
²
Lodging
industry
has
experienced
prolonged
RevPAR
growth
following
past
industry
downturns
1991:
9
consecutive
years
of
annual
RevPAR
growth
totaling
44.5%
³
2001/2002:
5
consecutive
years
of
annual
RevPAR
growth
totaling
33.5%
³
We believe that the expected growth in demand, coupled with a supply constrained
environment can result in
significant
RevPAR
growth
HVS
projects
total
RevPAR
growth
of
43.2%
4
through
2015
1
Source:
2009A:
Smith
Travel
Research,
2010E:
HVS
2
Source:
1998A
–
2009A:
Smith
Travel
Research,
20010E
–
2015E:
HVS
3
Source:
1992A
–
2002A:
Smith
Travel
Research
4
Source:
2010E
–
2015E:
HVS;
represents
total
growth
rate
between
2010
–
2015
based
on
projected
RevPAR
6/10/2010 |
 17
Low Supply Growth Coupled With High Demand Creates
RevPAR
Growth
U.S. RevPAR, Room Supply, and Room Demand Annual % change
(1988 –
2015E)
Source: 1988A-2009A: Smith Travel Research, 2010E-2015E: HVS
6/10/2010
(17.5%)
(12.5%)
(7.5%)
(2.5%)
2.5%
7.5%
12.5%
1988
1989
1990
1991
1992
1993
1994
1995
1996
1997
1998
1999
2000
2001
2002
2003
2004
2005
2006
2007
2008
2009
2010E
2011E
2012E
2013E
2014E
2015E
RevPAR
Supply
Demand |
 18
$30
$35
$40
$45
$50
$55
$60
$65
$70
1988
1991
1994
1997
2000
2003
2006
2009
600
650
700
750
800
850
900
950
1,000
1,050
1,100
1988
1991
1994
1997
2000
2003
2006
2009
Strong Sustained Growth Through Multiple Business Cycles
U.S.
Room
Demand
–
Annual
Aggregate
Room
Nights
(millions)
Source: 1988A-2009A: Smith Travel Research
U.S.
Annual
RevPAR
–
Each
RevPAR
peak
has
been
at
a
higher
level
than
the
prior
peak
6/10/2010 |
 19
2010 Industry Trends: Stabilization Has Begun
Statistic
% Change
Y-O-Y
Occupancy
53.6%
3.0%
ADR
$96.73
(3.4)%
RevPAR
$51.82
(0.6)%
Supply
2.7%
Demand
5.7%
Source: Smith Travel Research
April 2010 YTD
6/10/2010
Statistic
% Change
Y-O-Y
Occupancy
58.1%
5.3%
$97.81
ADR
(1.6)%
RevPAR
$56.86
3.7%
Supply
2.6%
Demand
8.1%
March & April 2010 |
 20
Growth-oriented Capital Structure With No Legacy Issues
Clean
balance
sheet/No
legacy
issues
Revolving credit facility to be put in place to provide flexibility and additional
growth capital $85 million with accordion up to $115 million
Initial maturity in 2012 with one-year extension option
Debt financing policy
Target overall debt level of up to 50% of aggregate hotel purchase prices
Intend to utilize secured property level mortgages
Dividend policy
Pay out a minimum of 90% of REIT taxable income
Expect to pay cash dividends out of current income
Chesapeake
will
have
no
legacy
issues
and
be
able
to
focus
on
sourcing,
underwriting
and
acquiring high-quality hotel properties
6/10/2010 |
 21
Purchasing Power/Capacity
Net IPO Proceeds
169
$
Revolving Credit Facility
85
Less: Working Capital
(5)
Less: Completed and Pending Acquisitions
Hyatt Regency Boston
(112)
Hilton Checkers Los Angeles
(46)
Courtyard Anaheim at Disneyland Resort
(25)
Completed and Pending Acquisitions
(183)
Net
66
$
Plus: Incremental Leverage (45%)
30
Gross
96
$
($ in millions)
6/10/2010 |
 22
Key Investment Highlights
Extensive industry relationships including strategic relationship with
Hyatt to drive pipeline
Experienced
management
team
with
strong
public
company
track
record
Improving industry fundamentals
Growth-oriented capital structure/favorable valuation
Compelling market opportunity validated by recent acquisitions and
current pipeline
6/10/2010 |