Attached files
| file | filename |
|---|---|
| 8-K - 8-K - STARWOOD PROPERTY TRUST, INC. | a10-11690_18k.htm |
Exhibit 99.1
|
|
Starwood Property Trust, Inc. NAREIT REITWeek 2010 June 10, 2010 |
|
|
1 Forward-Looking Statements This presentation contains forward-looking statements within the meaning of the federal securities laws. These forward-looking statements are based on the Company’s current expectations and beliefs, as well as a number of assumptions concerning future events. These statements are subject to risks, uncertainties, assumptions and other important factors, many of which are outside the Company’s control, that could cause actual results to differ materially from the results discussed in the forward-looking statements. You are cautioned not to place undue reliance on such forward-looking statements because actual results may vary materially from those expressed or implied. All forward-looking statements are based on information available to the Company on this date and the Company assumes no obligation to, and expressly disclaims any obligation to, update or revise any forward-looking statements, whether as a result of new information, future events or otherwise. For a further discussion of these and other factors that could cause our future results to differ materially from any forward-looking statements, see the section entitled “Risk Factors” in our Annual Report on Form 10-K for the year ended December 31, 2009 and subsequent filings with the SEC. This presentation contains statistics and other data that has been obtained from or compiled from information made available by third-party service providers. We have not independently verified such statistics or data. |
|
|
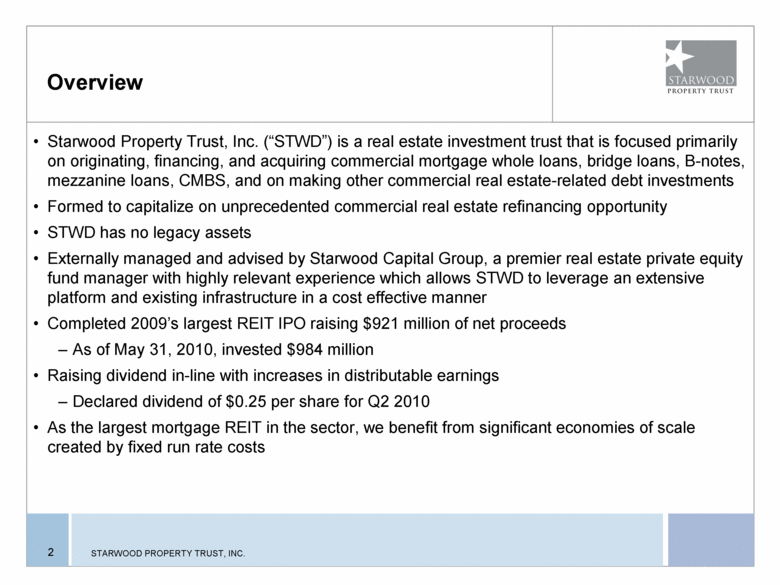
Overview Starwood Property Trust, Inc. (“STWD”) is a real estate investment trust that is focused primarily on originating, financing, and acquiring commercial mortgage whole loans, bridge loans, B-notes, mezzanine loans, CMBS, and on making other commercial real estate-related debt investments Formed to capitalize on unprecedented commercial real estate refinancing opportunity STWD has no legacy assets Externally managed and advised by Starwood Capital Group, a premier real estate private equity fund manager with highly relevant experience which allows STWD to leverage an extensive platform and existing infrastructure in a cost effective manner Completed 2009’s largest REIT IPO raising $921 million of net proceeds As of May 31, 2010, invested $984 million Raising dividend in-line with increases in distributable earnings Declared dividend of $0.25 per share for Q2 2010 As the largest mortgage REIT in the sector, we benefit from significant economies of scale created by fixed run rate costs 2 |
|
|
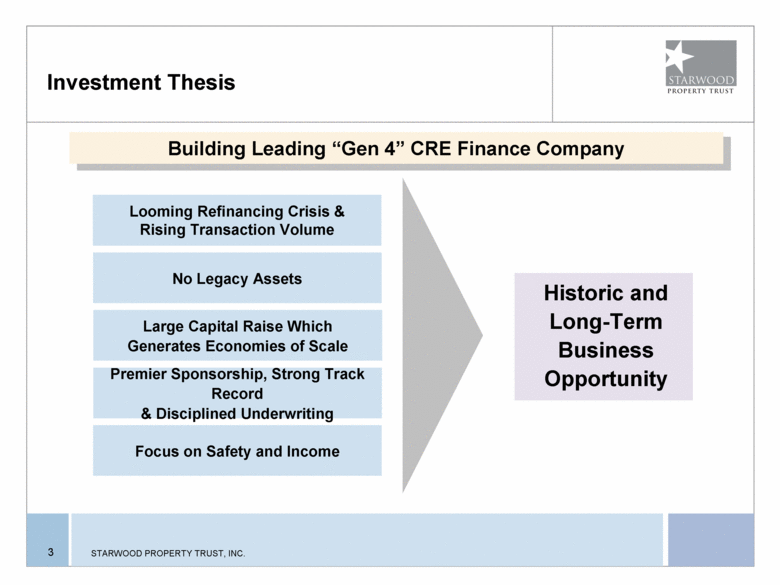
Investment Thesis 3 Building Leading “Gen 4” CRE Finance Company Historic and Long-Term Business Opportunity No Legacy Assets Large Capital Raise Which Generates Economies of Scale Looming Refinancing Crisis & Rising Transaction Volume Premier Sponsorship, Strong Track Record & Disciplined Underwriting Focus on Safety and Income |
|
|
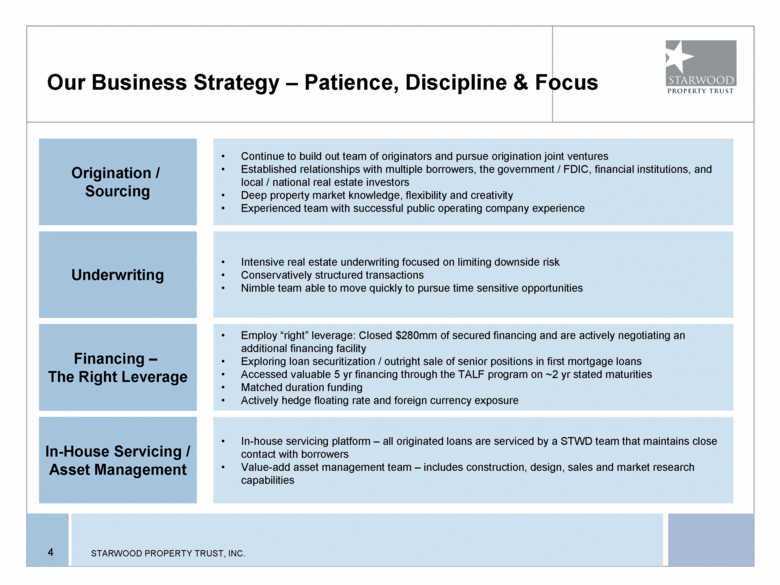
4 Origination / Sourcing Underwriting In-House Servicing / Asset Management Continue to build out team of originators and pursue origination joint ventures Established relationships with multiple borrowers, the government / FDIC, financial institutions, and local / national real estate investors Deep property market knowledge, flexibility and creativity Experienced team with successful public operating company experience Intensive real estate underwriting focused on limiting downside risk Conservatively structured transactions Nimble team able to move quickly to pursue time sensitive opportunities In-house servicing platform – all originated loans are serviced by a STWD team that maintains close contact with borrowers Value-add asset management team – includes construction, design, sales and market research capabilities Financing – The Right Leverage Employ “right” leverage: Closed $280mm of secured financing and are actively negotiating an additional financing facility Exploring loan securitization / outright sale of senior positions in first mortgage loans Accessed valuable 5 yr financing through the TALF program on ~2 yr stated maturities Matched duration funding Actively hedge floating rate and foreign currency exposure Our Business Strategy – Patience, Discipline & Focus |
|
|
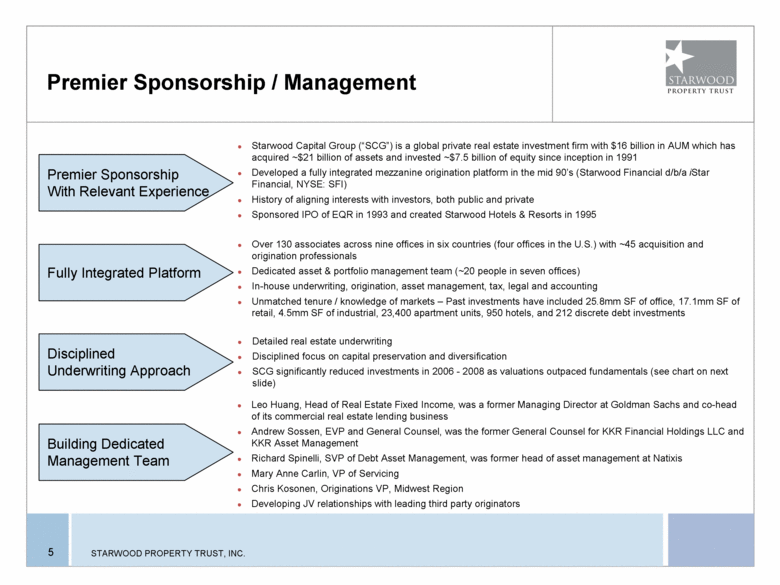
5 Starwood Capital Group (“SCG”) is a global private real estate investment firm with $16 billion in AUM which has acquired ~$21 billion of assets and invested ~$7.5 billion of equity since inception in 1991 Developed a fully integrated mezzanine origination platform in the mid 90’s (Starwood Financial d/b/a iStar Financial, NYSE: SFI) History of aligning interests with investors, both public and private Sponsored IPO of EQR in 1993 and created Starwood Hotels & Resorts in 1995 Premier Sponsorship With Relevant Experience Building Dedicated Management Team Leo Huang, Head of Real Estate Fixed Income, was a former Managing Director at Goldman Sachs and co-head of its commercial real estate lending business Andrew Sossen, EVP and General Counsel, was the former General Counsel for KKR Financial Holdings LLC and KKR Asset Management Richard Spinelli, SVP of Debt Asset Management, was former head of asset management at Natixis Mary Anne Carlin, VP of Servicing Chris Kosonen, Originations VP, Midwest Region Developing JV relationships with leading third party originators Disciplined Underwriting Approach Fully Integrated Platform Over 130 associates across nine offices in six countries (four offices in the U.S.) with ~45 acquisition and origination professionals Dedicated asset & portfolio management team (~20 people in seven offices) In-house underwriting, origination, asset management, tax, legal and accounting Unmatched tenure / knowledge of markets – Past investments have included 25.8mm SF of office, 17.1mm SF of retail, 4.5mm SF of industrial, 23,400 apartment units, 950 hotels, and 212 discrete debt investments Detailed real estate underwriting Disciplined focus on capital preservation and diversification SCG significantly reduced investments in 2006 - 2008 as valuations outpaced fundamentals (see chart on next slide) Premier Sponsorship / Management |
|
|
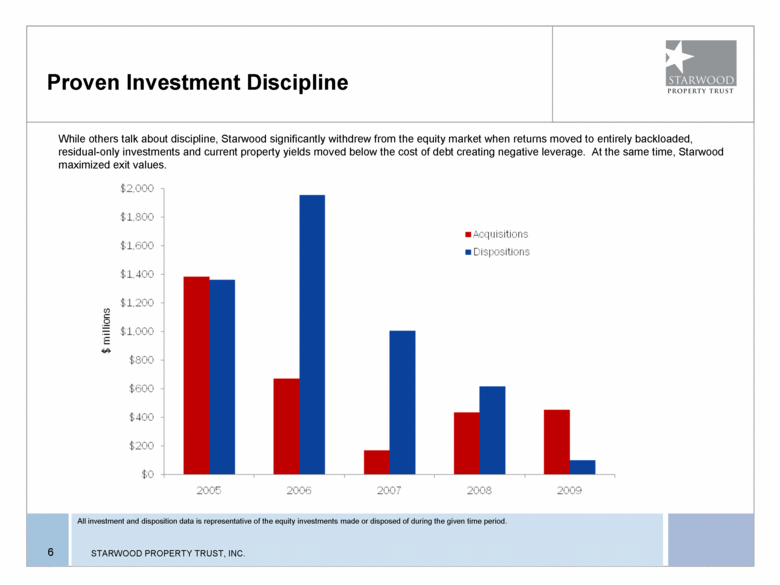
All investment and disposition data is representative of the equity investments made or disposed of during the given time period. While others talk about discipline, Starwood significantly withdrew from the equity market when returns moved to entirely backloaded, residual-only investments and current property yields moved below the cost of debt creating negative leverage. At the same time, Starwood maximized exit values. Proven Investment Discipline 6 |
|
|
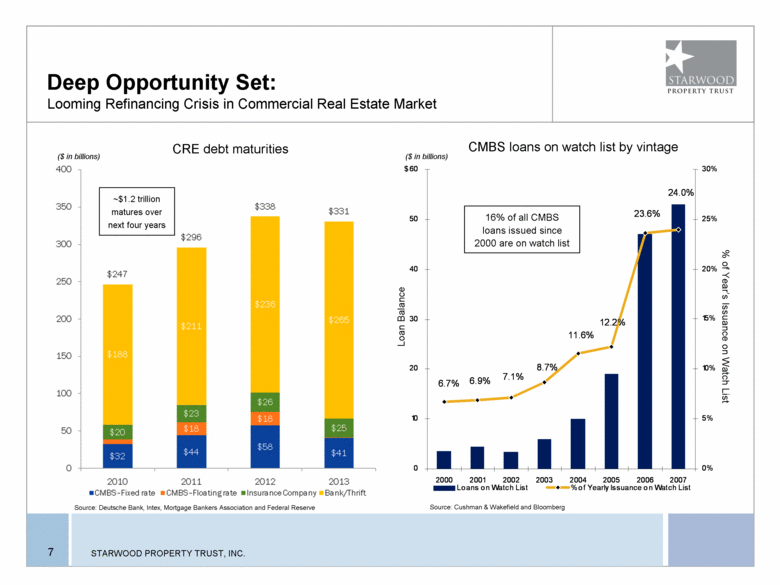
Looming Refinancing Crisis in Commercial Real Estate Market CRE debt maturities Source: Deutsche Bank, Intex, Mortgage Bankers Association and Federal Reserve CMBS loans on watch list by vintage Source: Cushman & Wakefield and Bloomberg Loan Balance % of Year’s Issuance on Watch List ($ in billions) ~$1.2 trillion matures over next four years ($ in billions) 16% of all CMBS loans issued since 2000 are on watch list Deep Opportunity Set: 7 0 10 20 30 40 50 $60 2000 2001 2002 2003 2004 2005 2006 2007 2008 CMBS Loan Balance on Watch List 24.0% 23.6% 12.2% 11.6% 8.7% 7.1% 6.9% 6.7% 0 10 20 30 40 50 $60 2000 2001 2002 2003 2004 2005 2006 2007 0% 5% 10% 15% 20% 25% 30% Loans on Watch List % of Yearly Issuance on Watch List |
|
|
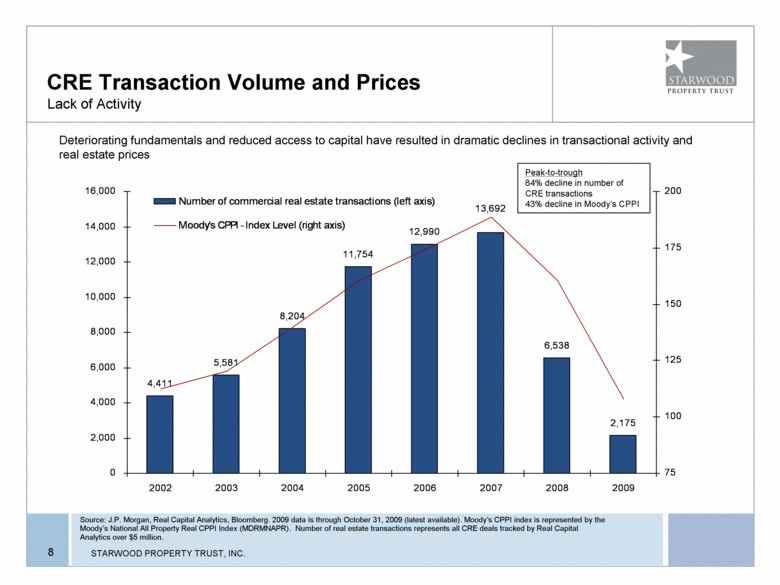
Deteriorating fundamentals and reduced access to capital have resulted in dramatic declines in transactional activity and real estate prices Source: J.P. Morgan, Real Capital Analytics, Bloomberg. 2009 data is through October 31, 2009 (latest available). Moody’s CPPI index is represented by the Moody’s National All Property Real CPPI Index (MDRMNAPR). Number of real estate transactions represents all CRE deals tracked by Real Capital Analytics over $5 million. Peak-to-trough 84% decline in number of CRE transactions 43% decline in Moody’s CPPI CRE Transaction Volume and Prices Lack of Activity 8 4,411 5,581 8,204 11,754 12,990 6,538 2,175 13,692 0 2,000 4,000 6,000 8,000 10,000 12,000 14,000 16,000 2002 2003 2004 2005 2006 2007 2008 2009 75 100 125 150 175 200 Number of commercial real estate transactions (left axis) Moody's CPPI - Index Level (right axis) |
|
|
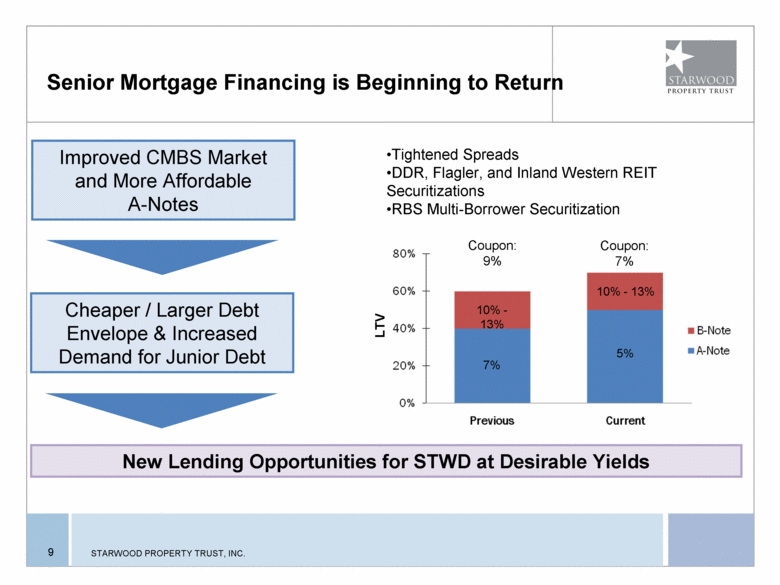
Senior Mortgage Financing is Beginning to Return 9 Improved CMBS Market and More Affordable A-Notes Cheaper / Larger Debt Envelope & Increased Demand for Junior Debt New Lending Opportunities for STWD at Desirable Yields Tightened Spreads DDR, Flagler, and Inland Western REIT Securitizations RBS Multi-Borrower Securitization Coupon: 7% 10% - 13% 5% Coupon: 9% 10% - 13% 7% LTV |
|
|
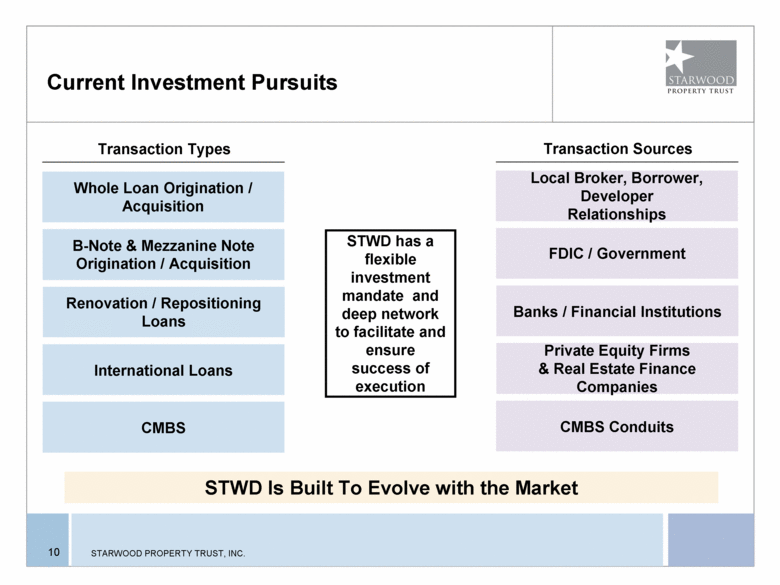
Current Investment Pursuits 10 STWD Is Built To Evolve with the Market B-Note & Mezzanine Note Origination / Acquisition Renovation / Repositioning Loans Whole Loan Origination / Acquisition International Loans CMBS FDIC / Government Banks / Financial Institutions Local Broker, Borrower, Developer Relationships Private Equity Firms & Real Estate Finance Companies CMBS Conduits Transaction Types Transaction Sources STWD has a flexible investment mandate and deep network to facilitate and ensure success of execution |
|
|
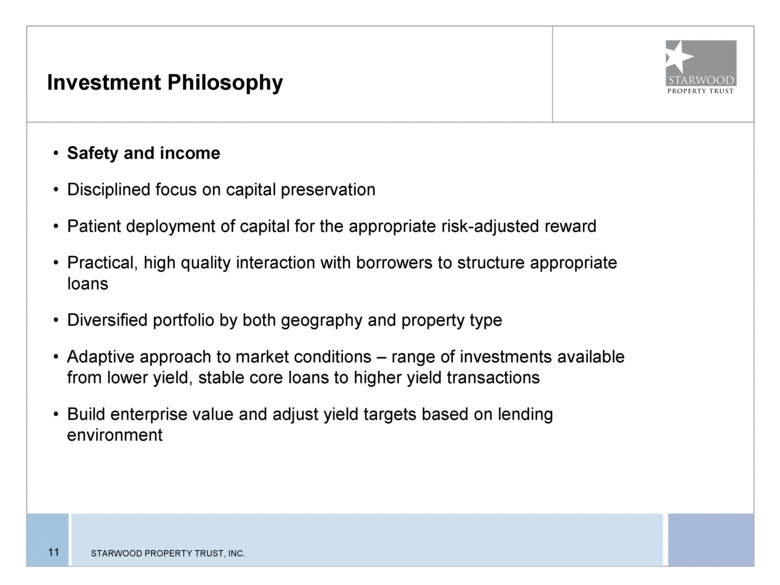
Investment Philosophy Safety and income Disciplined focus on capital preservation Patient deployment of capital for the appropriate risk-adjusted reward Practical, high quality interaction with borrowers to structure appropriate loans Diversified portfolio by both geography and property type Adaptive approach to market conditions – range of investments available from lower yield, stable core loans to higher yield transactions Build enterprise value and adjust yield targets based on lending environment 11 |
|
|
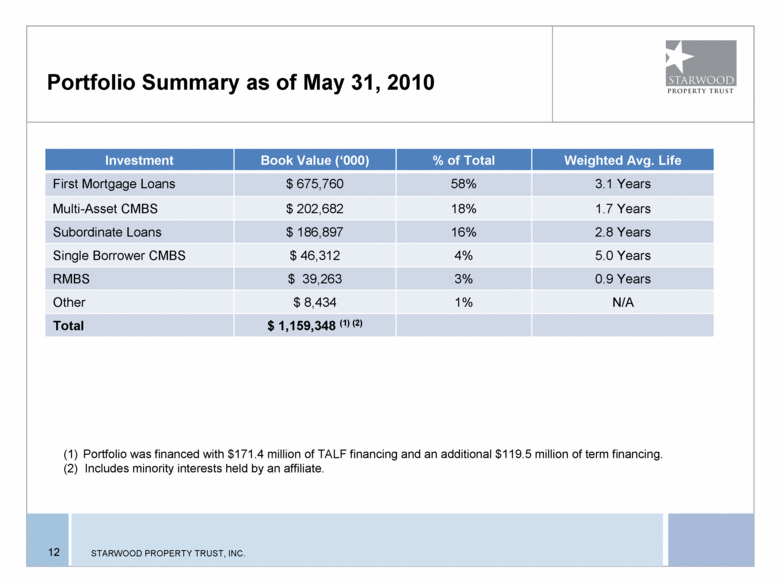
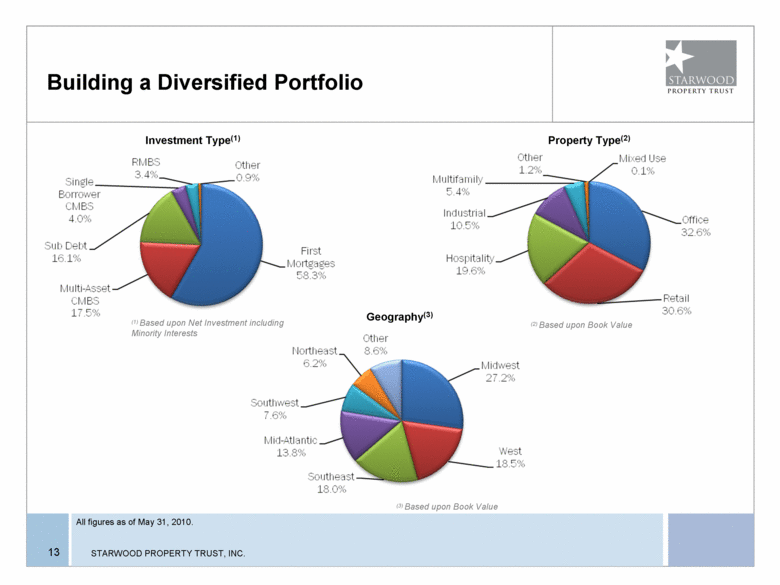
Portfolio Summary as of May 31, 2010 12 Investment Book Value (‘000) % of Total Weighted Avg. Life First Mortgage Loans $ 675,760 58% 3.1 Years Multi-Asset CMBS $ 202,682 18% 1.7 Years Subordinate Loans $ 186,897 16% 2.8 Years Single Borrower CMBS $ 46,312 4% 5.0 Years RMBS $ 39,263 3% 0.9 Years Other $ 8,434 1% N/A Total $ 1,159,348 (1) (2) Portfolio was financed with $171.4 million of TALF financing and an additional $119.5 million of term financing. (2) Includes minority interests held by an affiliate. |
|
|
Building a Diversified Portfolio 13 (1) Based upon Net Investment including Minority Interests Investment Type(1) Property Type(2) Geography(3) All figures as of May 31, 2010. (2) Based upon Book Value (3) Based upon Book Value |
|
|
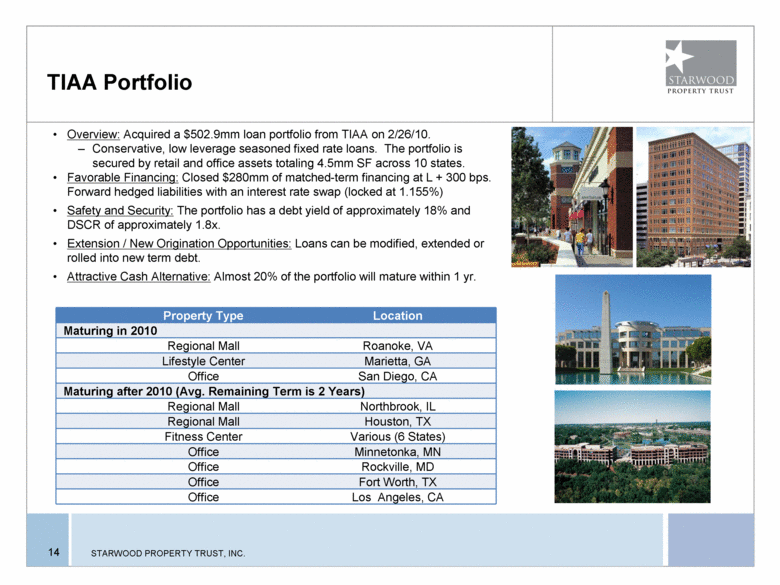
TIAA Portfolio 14 Overview: Acquired a $502.9mm loan portfolio from TIAA on 2/26/10. Conservative, low leverage seasoned fixed rate loans. The portfolio is secured by retail and office assets totaling 4.5mm SF across 10 states. Favorable Financing: Closed $280mm of matched-term financing at L + 300 bps. Forward hedged liabilities with an interest rate swap (locked at 1.155%) Safety and Security: The portfolio has a debt yield of approximately 18% and DSCR of approximately 1.8x. Extension / New Origination Opportunities: Loans can be modified, extended or rolled into new term debt. Attractive Cash Alternative: Almost 20% of the portfolio will mature within 1 yr. Property Type Location Maturing in 2010 Regional Mall Roanoke, VA Lifestyle Center Marietta, GA Office San Diego, CA Maturing after 2010 (Avg. Remaining Term is 2 Years) Regional Mall Northbrook, IL Regional Mall Houston, TX Fitness Center Various (6 States) Office Minnetonka, MN Office Rockville, MD Office Fort Worth, TX Office Los Angeles, CA |
|
|
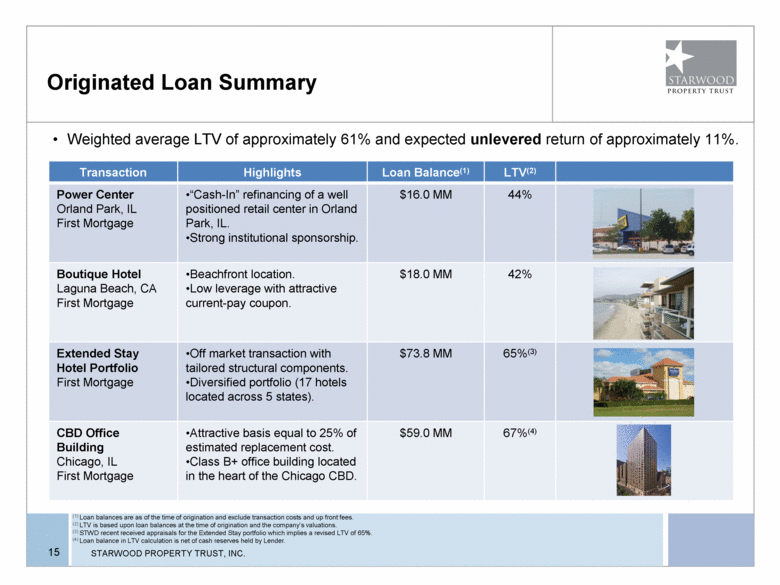
Originated Loan Summary 15 Transaction Highlights Loan Balance(1) LTV(2) Power Center Orland Park, IL First Mortgage “Cash-In” refinancing of a well positioned retail center in Orland Park, IL. Strong institutional sponsorship. $16.0 MM 44% Boutique Hotel Laguna Beach, CA First Mortgage Beachfront location. Low leverage with attractive current-pay coupon. $18.0 MM 42% Extended Stay Hotel Portfolio First Mortgage Off market transaction with tailored structural components. Diversified portfolio (17 hotels located across 5 states). $73.8 MM 65%(3) CBD Office Building Chicago, IL First Mortgage Attractive basis equal to 25% of estimated replacement cost. Class B+ office building located in the heart of the Chicago CBD. $59.0 MM 67%(4) (1) Loan balances are as of the time of origination and exclude transaction costs and up front fees. (2) LTV is based upon loan balances at the time of origination and the company’s valuations. (3) STWD recent received appraisals for the Extended Stay portfolio which implies a revised LTV of 65%. (4) Loan balance in LTV calculation is net of cash reserves held by Lender. Weighted average LTV of approximately 61% and expected unlevered return of approximately 11%. |
|
|
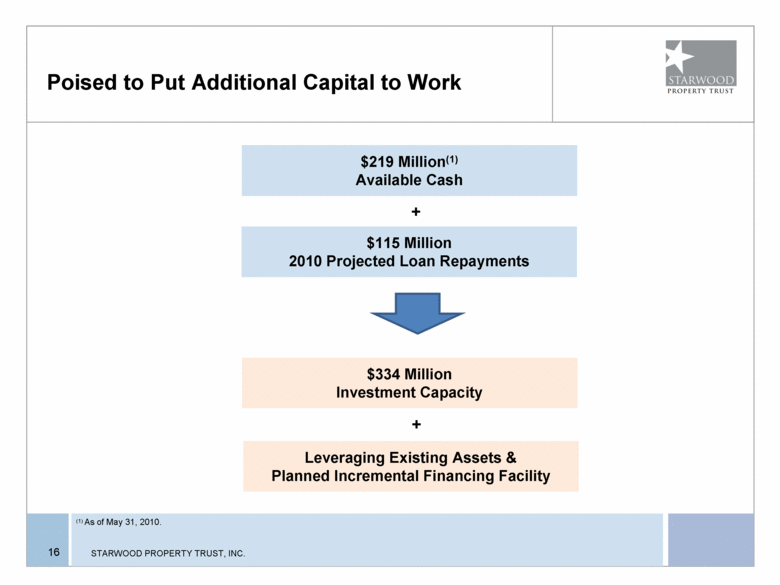
16 Poised to Put Additional Capital to Work $219 Million(1) Available Cash $115 Million 2010 Projected Loan Repayments + (1) As of May 31, 2010. $334 Million Investment Capacity + Leveraging Existing Assets & Planned Incremental Financing Facility |
|
|
Investment Summary Focused on safety and income Utilize modest leverage and continue active capital deployment into new investments Provide fast, nimble tailored solutions Build a diversified portfolio with a mixture of shorter and longer term investments that is appropriate for the current interest rate and economic environment Apply Starwood Capital Group real estate underwriting expertise to generate enhanced risk adjusted returns 17 |

