Attached files
| file | filename |
|---|---|
| 8-K - 8-K - FiberTower CORP | a10-11729_28k.htm |
Exhibit 99.1
|
|
FiberTower Corporation RBC Capital Markets Technology, Media and Communications Conference June 10, 2010 |
|
|
Safe Harbor Statement Statements included in this presentation which are not historical in nature are “forward-looking” statements, as that term is defined in the Private Securities Litigation Reform Act of 1995 or by the Securities and Exchange Commission, or SEC, in its rules, regulations and releases. Forward-looking statements relate to expectations, beliefs, projections, future plans and strategies, anticipated events or trends and similar expressions concerning matters that are not historical facts. These include statements regarding, among other things, our future financial performance and results of operations, guidance for expected ranges of 2010 revenue, Adjusted EBITDA and capital expenditures, our financial and business prospects, the deployment of services, capital requirements, financing prospects, planned capital expenditures, expected cost per site, anticipated customer growth, expansion plans, and anticipated cash balances. There are many risks, uncertainties and other factors that can prevent the achievement of goals or cause results to differ materially form those expressed or implied by these forward-looking statements including, among other things, negative cash flows and operating losses, additional liquidity requirements, potential loss of significant customers, downturns in the wireless communications industry, regulatory costs and restrictions, potential loss of FCC licenses, equipment supply disruptions and cost increases, competition from alternative backhaul service providers and technologies, along with those risk factors described in the Company’s Annual Reports on Form 10-K and Quarterly Reports on Form 10-Q, as filed with the SEC. |
|
|
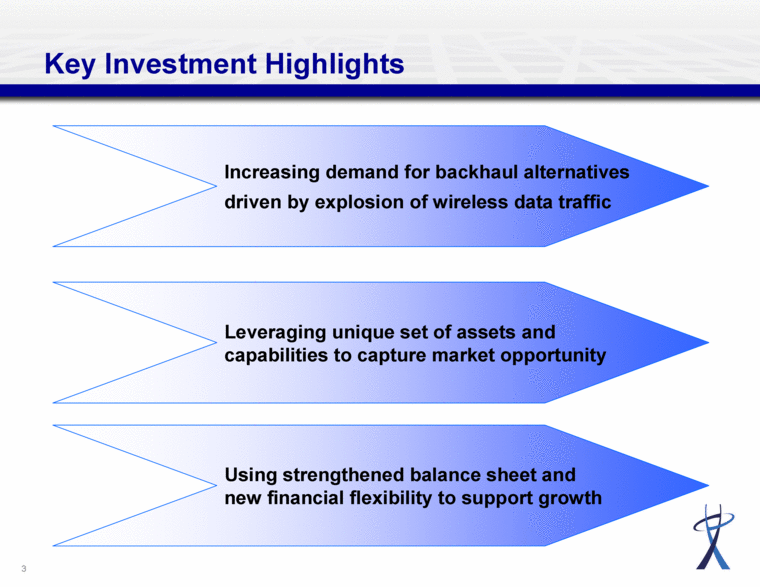
Increasing demand for backhaul alternatives driven by explosion of wireless data traffic Using strengthened balance sheet and new financial flexibility to support growth Leveraging unique set of assets and capabilities to capture market opportunity Key Investment Highlights |
|
|
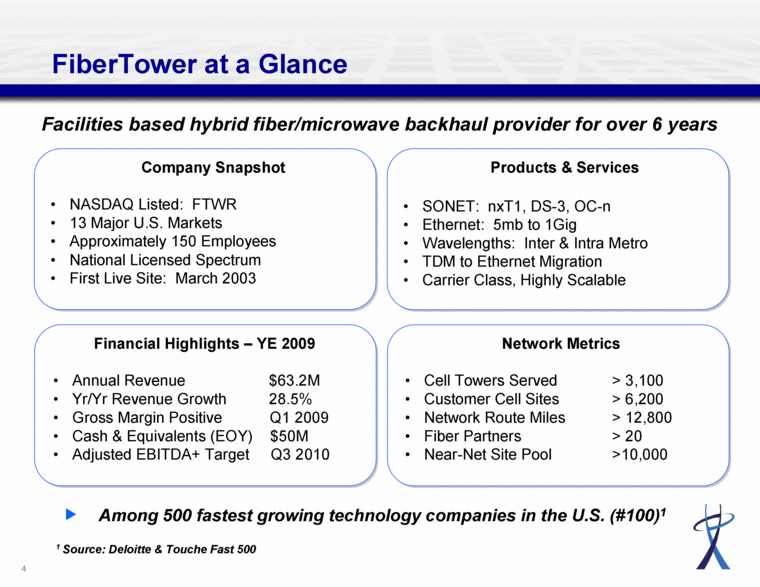
Financial Highlights – YE 2009 Annual Revenue $63.2M Yr/Yr Revenue Growth 28.5% Gross Margin Positive Q1 2009 Cash & Equivalents (EOY) $50M Adjusted EBITDA+ Target Q3 2010 Network Metrics Cell Towers Served > 3,100 Customer Cell Sites > 6,200 Network Route Miles > 12,800 Fiber Partners > 20 Near-Net Site Pool >10,000 Products & Services SONET: nxT1, DS-3, OC-n Ethernet: 5mb to 1Gig Wavelengths: Inter & Intra Metro TDM to Ethernet Migration Carrier Class, Highly Scalable Company Snapshot NASDAQ Listed: FTWR 13 Major U.S. Markets Approximately 150 Employees National Licensed Spectrum First Live Site: March 2003 FiberTower at a Glance Facilities based hybrid fiber/microwave backhaul provider for over 6 years 1 Source: Deloitte & Touche Fast 500 Among 500 fastest growing technology companies in the U.S. (#100)1 |
|
|
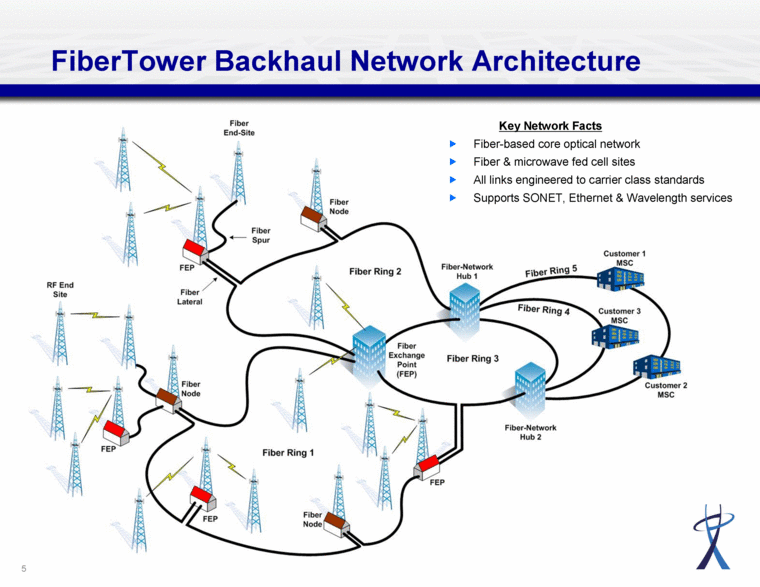
5 FiberTower Backhaul Network Architecture Key Network Facts Fiber-based core optical network Fiber & microwave fed cell sites All links engineered to carrier class standards Supports SONET, Ethernet & Wavelength services |
|
|
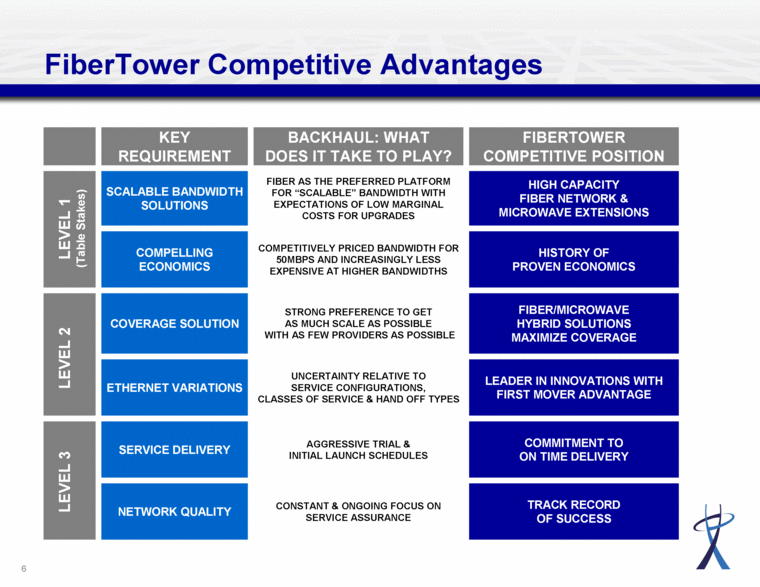
FiberTower Competitive Advantages FIBERTOWER COMPETITIVE POSITION BACKHAUL: WHAT DOES IT TAKE TO PLAY? KEY REQUIREMENT TRACK RECORD OF SUCCESS CONSTANT & ONGOING FOCUS ON SERVICE ASSURANCE NETWORK QUALITY COMMITMENT TO ON TIME DELIVERY AGGRESSIVE TRIAL & INITIAL LAUNCH SCHEDULES SERVICE DELIVERY LEADER IN INNOVATIONS WITH FIRST MOVER ADVANTAGE UNCERTAINTY RELATIVE TO SERVICE CONFIGURATIONS, CLASSES OF SERVICE & HAND OFF TYPES ETHERNET VARIATIONS FIBER/MICROWAVE HYBRID SOLUTIONS MAXIMIZE COVERAGE STRONG PREFERENCE TO GET AS MUCH SCALE AS POSSIBLE WITH AS FEW PROVIDERS AS POSSIBLE COVERAGE SOLUTION HISTORY OF PROVEN ECONOMICS COMPETITIVELY PRICED BANDWIDTH FOR 50MBPS AND INCREASINGLY LESS EXPENSIVE AT HIGHER BANDWIDTHS COMPELLING ECONOMICS HIGH CAPACITY FIBER NETWORK & MICROWAVE EXTENSIONS FIBER AS THE PREFERRED PLATFORM FOR “SCALABLE” BANDWIDTH WITH EXPECTATIONS OF LOW MARGINAL COSTS FOR UPGRADES SCALABLE BANDWIDTH SOLUTIONS LEVEL 3 LEVEL 2 LEVEL 1 (Table Stakes) |
|
|
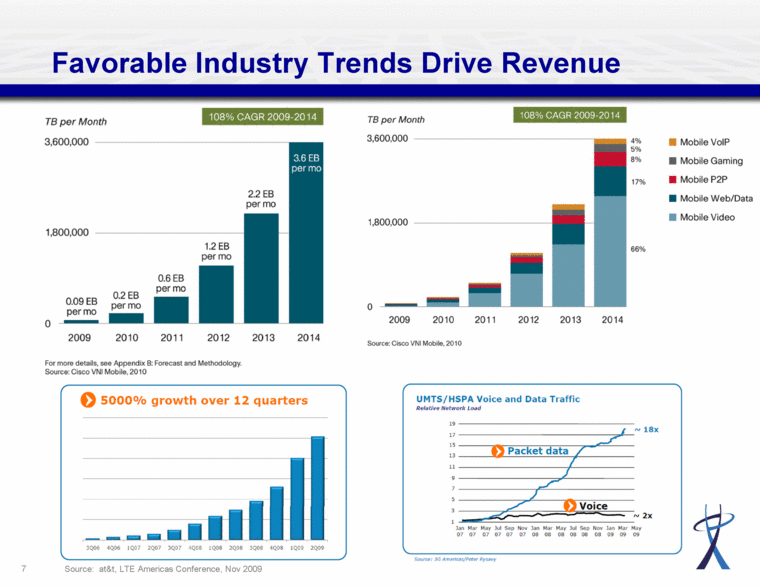
Favorable Industry Trends Drive Revenue Source: at&t, LTE Americas Conference, Nov 2009 |
|
|
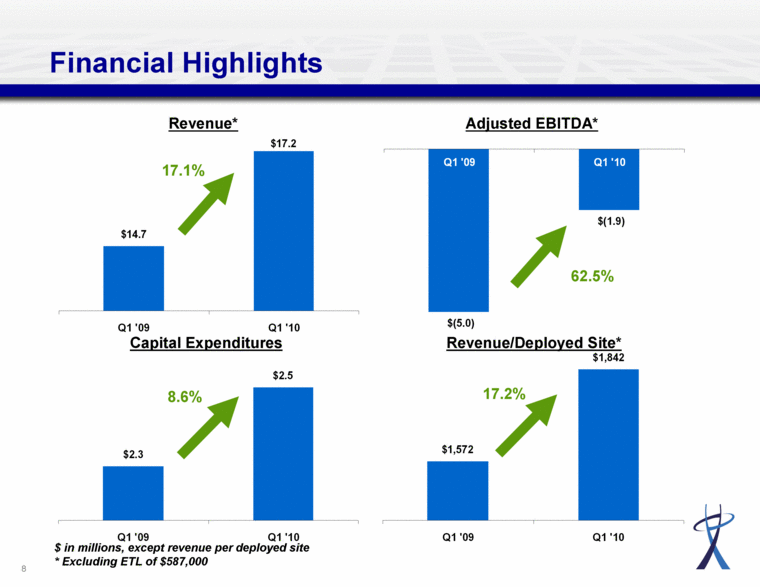
Financial Highlights Adjusted EBITDA* Capital Expenditures Revenue/ Deployed Site* Revenue* $ in millions, except revenue per deployed site * Excluding ETL of $587,000 17.1% 17.2% 62.5% 8.6% $(5.0) $(1.9) Q1 '09 Q1 '10 $2.3 $2.5 Q1 '09 Q1 '10 $14.7 $17.2 Q1 '09 Q1 '10 Q1 '09 Q1'10 |
|
|
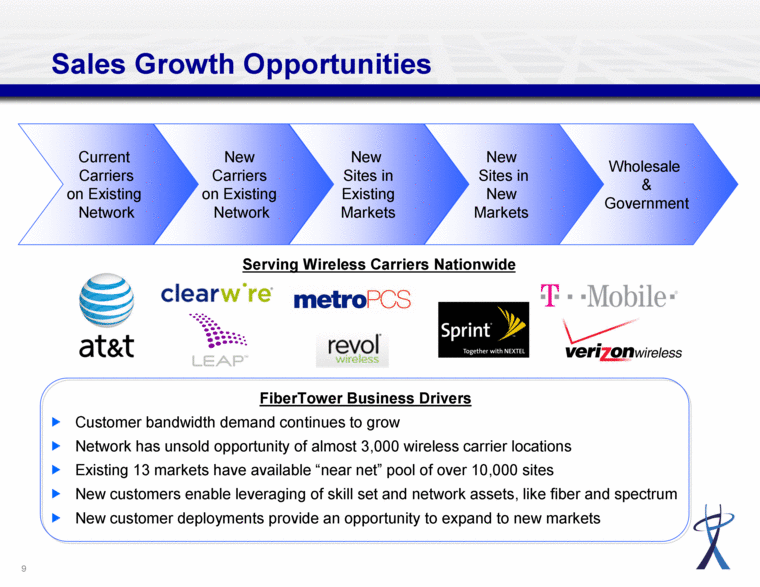
Sales Growth Opportunities Serving Wireless Carriers Nationwide Current Carriers on Existing Network New Carriers on Existing Network New Sites in Existing Markets Wholesale & Government New Sites in New Markets FiberTower Business Drivers Customer bandwidth demand continues to grow Network has unsold opportunity of almost 3,000 wireless carrier locations Existing 13 markets have available “near net” pool of over 10,000 sites New customers enable leveraging of skill set and network assets, like fiber and spectrum New customer deployments provide an opportunity to expand to new markets |
|
|
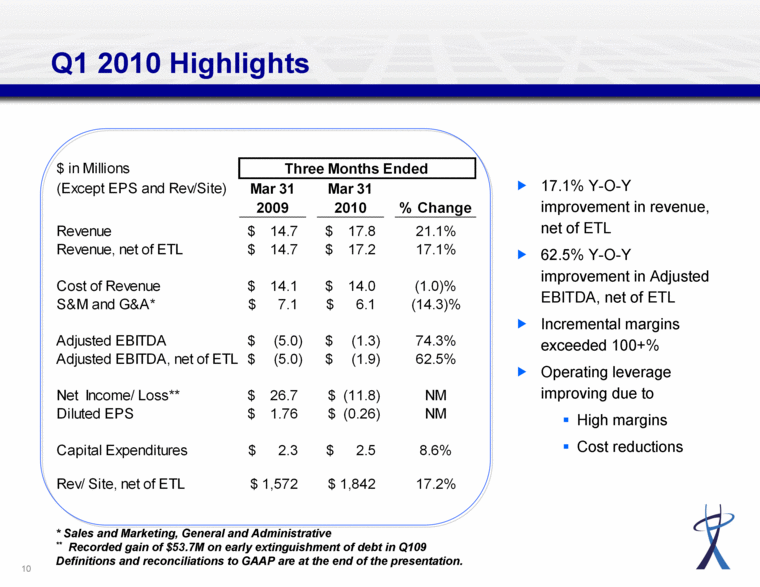
Q1 2010 Highlights 17.1% Y-O-Y improvement in revenue, net of ETL 62.5% Y-O-Y improvement in Adjusted EBITDA, net of ETL Incremental margins exceeded 100+% Operating leverage improving due to High margins Cost reductions * Sales and Marketing, General and Administrative ** Recorded gain of $53.7M on early extinguishment of debt in Q109 Definitions and reconciliations to GAAP are at the end of the presentation. $ in Millions Three Months Ended (Except EPS and Rev/Site) Mar 31 Mar 31 2009 2010 % Change Revenue $14.7 $17.8 21.1% Revenue, net of ETL $14.7 $17.2 17.1% Cost of Revenue $14.1 $14.0 (1.0)% S&M and G&A* $7.1 $6.1 (14.3)% Adjusted EBITDA $(5.0) $(1.3) 74.3% Adjusted EBITDA, net of ETL $(5.0) $(1.9) 62.5% Net Income/ Loss** $26.7 ($0.0) $(11.8) NM Diluted EPS $1.76 $(0.26) NM Capital Expenditures $2.3 $2.5 8.6% Rev/ Site, net of ETL $1,572 $1,842 17.2% |
|
|
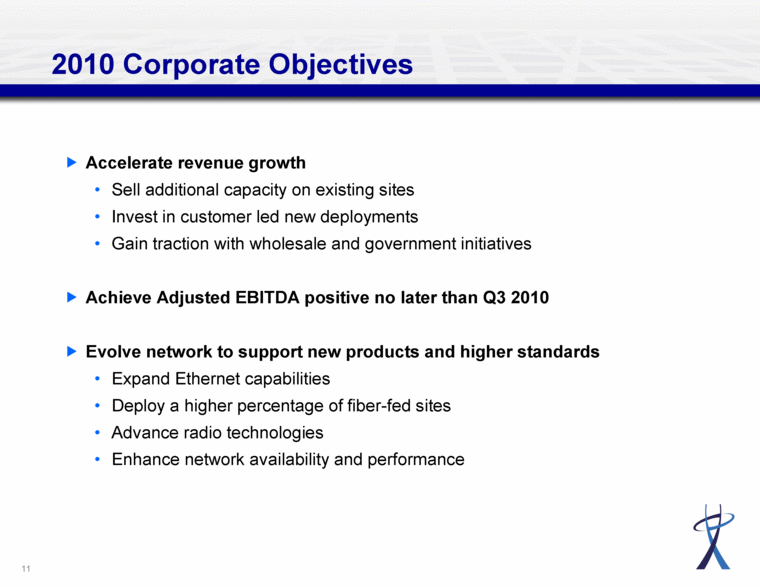
2010 Corporate Objectives Accelerate revenue growth Sell additional capacity on existing sites Invest in customer led new deployments Gain traction with wholesale and government initiatives Achieve Adjusted EBITDA positive no later than Q3 2010 Evolve network to support new products and higher standards Expand Ethernet capabilities Deploy a higher percentage of fiber-fed sites Advance radio technologies Enhance network availability and performance |
|
|
Appendix |
|
|
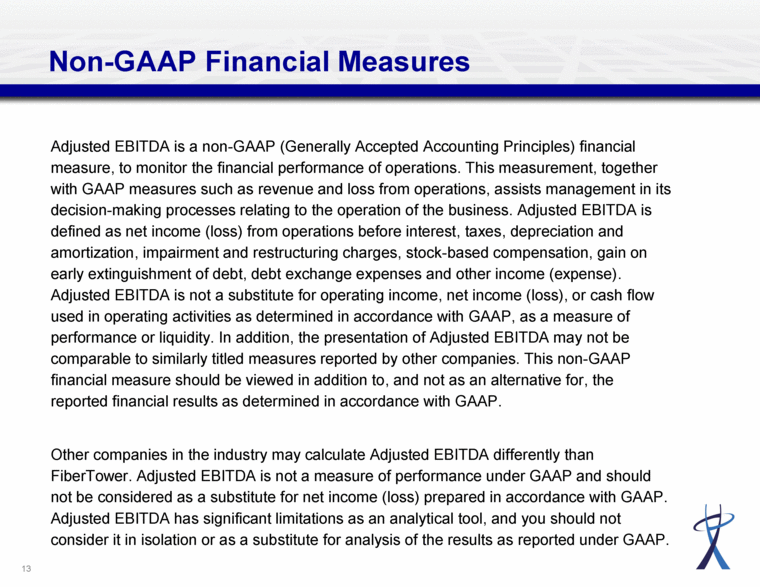
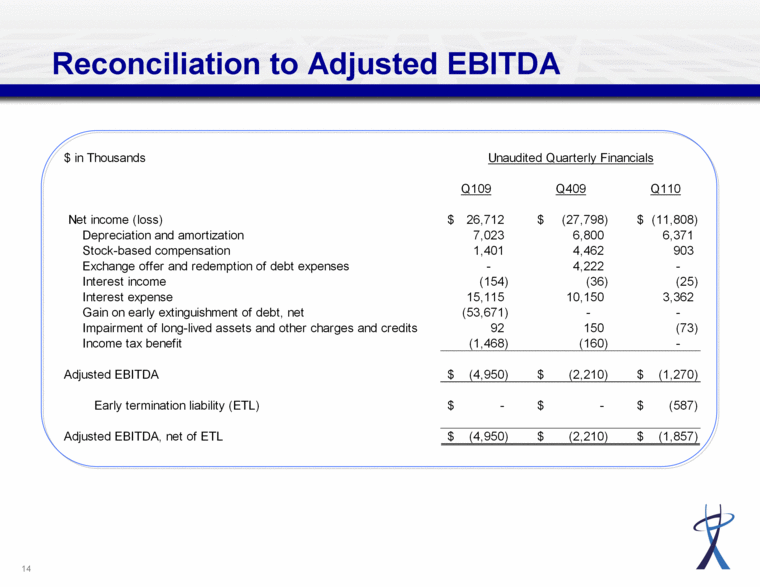
Non-GAAP Financial Measures Adjusted EBITDA is a non-GAAP (Generally Accepted Accounting Principles) financial measure, to monitor the financial performance of operations. This measurement, together with GAAP measures such as revenue and loss from operations, assists management in its decision-making processes relating to the operation of the business. Adjusted EBITDA is defined as net income (loss) from operations before interest, taxes, depreciation and amortization, impairment and restructuring charges, stock-based compensation, gain on early extinguishment of debt, debt exchange expenses and other income (expense). Adjusted EBITDA is not a substitute for operating income, net income (loss), or cash flow used in operating activities as determined in accordance with GAAP, as a measure of performance or liquidity. In addition, the presentation of Adjusted EBITDA may not be comparable to similarly titled measures reported by other companies. This non-GAAP financial measure should be viewed in addition to, and not as an alternative for, the reported financial results as determined in accordance with GAAP. Other companies in the industry may calculate Adjusted EBITDA differently than FiberTower. Adjusted EBITDA is not a measure of performance under GAAP and should not be considered as a substitute for net income (loss) prepared in accordance with GAAP. Adjusted EBITDA has significant limitations as an analytical tool, and you should not consider it in isolation or as a substitute for analysis of the results as reported under GAAP. |
|
|
Reconciliation to Adjusted EBITDA Adjusted EBITDA, net of ETL $ in Thousands Unaudited Quarterly Financials Q109 Q409 Q110 Net income (loss) $26,712 $(27,798) $(11,808) Depreciation and amortization 7,023 6,800 6,371 Stock-based compensation 1,401 4,462 903 Exchange offer and redemption of debt expenses - 4,222 - Interest income (154) (36) (25) Interest expense 15,115 10,150 3,362 Gain on early extinguishment of debt, net (53,671) - - Impairment of long-lived assets and other charges and credits 92 150 (73) Income tax benefit (1,468) (160) - Adjusted EBITDA $(4,950) $(2,210) $(1,270) Early termination liability (ETL) $- $- $(587) Adjusted EBITDA, net of ETL $(4,950) $(2,210) $(1,857) |

