Attached files
| file | filename |
|---|---|
| 8-K - FORM 8-K - LOCAL Corp | a56423e8vk.htm |
| EX-99.1 - EX-99.1 - LOCAL Corp | a56423exv99w1.htm |
Exhibit 99.2
| Local.com Corporate Presentation June 2010 |
| Forward Looking Statements; Non-GAAP Financial Measures Forward-Looking Statements: All statements other than statements of historical fact included in this document regarding our anticipated financial position, business strategy and plans and objectives of our management for future operations, are forward-looking statements. When used in this document, words such as 'anticipate,' 'believe,' 'estimate,' 'plans,' 'expect,' 'intend,' 'projects,' and similar expressions and phrases, as they relate to Local.com or our management, identify forward-looking statements. Any forward-looking statements are based on the beliefs of our management as well as assumptions made by and information currently available to our management. Actual results could differ materially from those contemplated by the forward-looking statements as a result of certain factors, including, but not limited to, our ability to monetize the Local.com domain, incorporate our local-search technologies, market the Local.com domain as a destination for consumers seeking local-search results, grow our business by enhancing our local-search services, successfully expand and implement our direct subscription advertising sales efforts, increase the number of businesses that purchase our subscription advertising products, expand our Advertiser and Distribution Networks, integrate and effectively utilize our acquisitions' technologies, develop our products and sales, marketing, finance and administrative functions and successfully integrate our expanded infrastructure, as well as our dependence on major advertisers, competitive factors and pricing pressures, changes in legal and regulatory requirements, and general economic conditions. Any forward-looking statements reflect our current views with respect to future events and are subject to these and other risks, uncertainties and assumptions relating to our operations, results of operations, growth strategy and liquidity. All subsequent written and oral forward- looking statements attributable to us or persons acting on our behalf are expressly qualified in their entirety by this paragraph. Our Annual Report on Form 10-K, subsequent Quarterly Reports on Form 10-Q, recent Current Reports on Form 8-K, and other Securities and Exchange Commission filings discuss the foregoing risks as well as other important risk factors that could contribute to such differences or otherwise affect our business, results of operations and financial condition. The forward-looking statements in this release speak only as of the date they are made. We undertake no obligation to revise or update publicly any forward-looking statement for any reason. This document includes the non-GAAP financial measure of "Adjusted Net Income/Loss" which we define as net income/loss excluding: provision for income taxes; interest and other income (expense), net; depreciation; amortization; stock based compensation charges, warrant revaluation charges and non-recurring items. Adjusted Net Income/Loss, as defined above, is not a measurement under GAAP. Adjusted Net Income/Loss is reconciled to net loss and loss per share, which we believe are the most comparable GAAP measures, in the company's press release dated April 22, 2010, as furnished on the Company's Form 8-K filed with the Securities and Exchange Commission on April 22, 2010. Management believes that Adjusted Net Income/Loss provides useful information to investors about the company's performance because it eliminates the effects of period-to-period changes in income from interest on the company's cash and marketable securities, expense from the company's financing transactions and the costs associated with income tax expense, capital investments, stock-based compensation expense, warrant revaluation charges, and non-recurring charges which are not directly attributable to the underlying performance of the company's business operations. Management uses Adjusted Net Income/Loss in evaluating the overall performance of the company's business operations. A limitation of non-GAAP Adjusted Net Income/Loss is that it excludes items that often have a material effect on the company's net income and earnings per common share calculated in accordance with GAAP. Therefore, management compensates for this limitation by using Adjusted Net Income/Loss in conjunction with GAAP net loss and loss per share measures. The company believes that Adjusted Net Income/Loss provides investors with an additional tool for evaluating the company's core performance, which management uses in its own evaluation of overall performance, and as a base-line for assessing the future earnings potential of the company. While the GAAP results are more complete, the company prefers to allow investors to have this supplemental metric since, with reconciliation to GAAP (as noted above), it may provide greater insight into the company's financial results. The non-GAAP measures should be viewed as a supplement to, and not as a substitute for, or superior to, GAAP net income or earnings per share. |
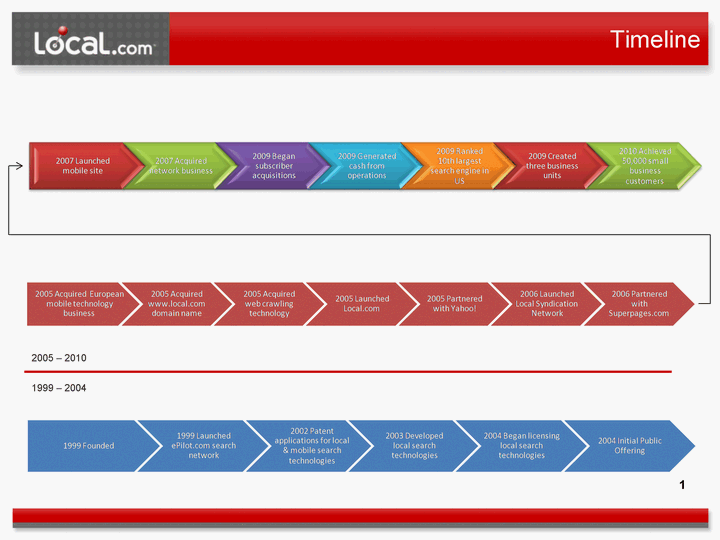
| Timeline 1999 - 2004 2005 - 2010 1 |
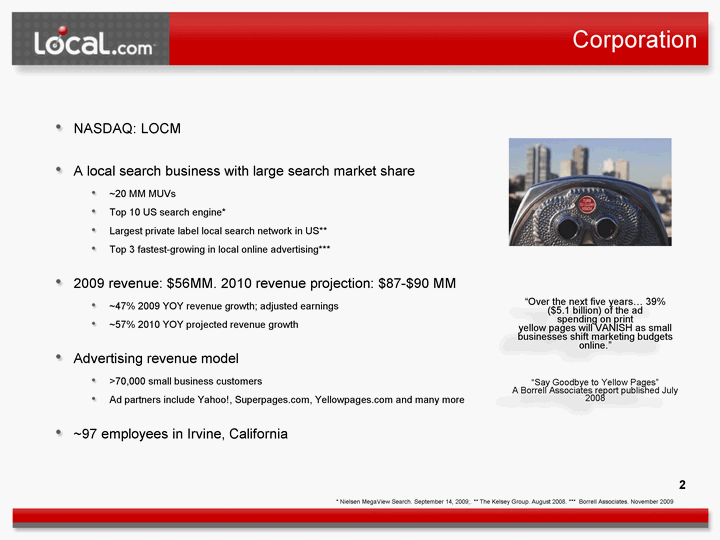
| Corporation NASDAQ: LOCM A local search business with large search market share ~20 MM MUVs Top 10 US search engine* Largest private label local search network in US** Top 3 fastest-growing in local online advertising*** 2009 revenue: $56MM. 2010 revenue projection: $87-$90 MM ~47% 2009 YOY revenue growth; adjusted earnings ~57% 2010 YOY projected revenue growth Advertising revenue model >70,000 small business customers Ad partners include Yahoo!, Superpages.com, Yellowpages.com and many more ~97 employees in Irvine, California * Nielsen MegaView Search. September 14, 2009;. ** The Kelsey Group. August 2008. *** Borrell Associates. November 2009 2 "Over the next five years... 39% ($5.1 billion) of the ad spending on print yellow pages will VANISH as small businesses shift marketing budgets online." "Say Goodbye to Yellow Pages" A Borrell Associates report published July 2008 |

| Three Business Units Product and Technology Consumers Proprietary search traffic About 15MM MUVs 58% of revenue Regional Media Partner traffic About 5MM MUVs 28% of revenue Over 800 network sites Advertisers From ad partners and... >70k direct subscribers 15% of (direct) revenue All numbers as of Q4, 2009 3 |
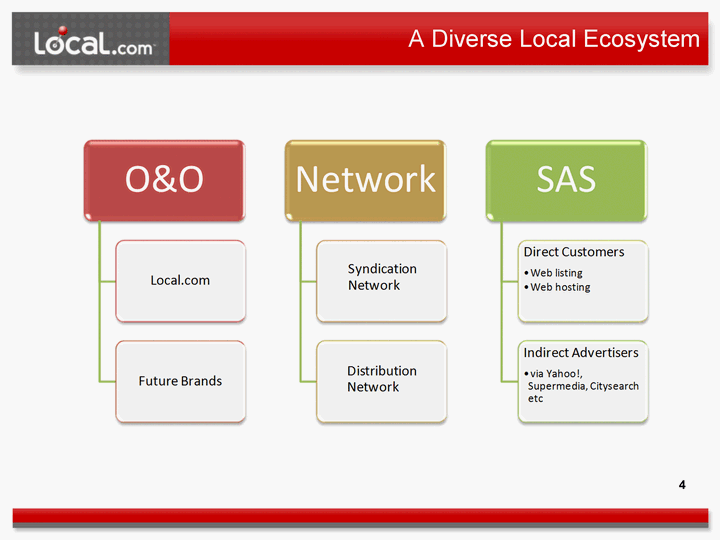
| A Diverse Local Ecosystem Product and Technology 4 |
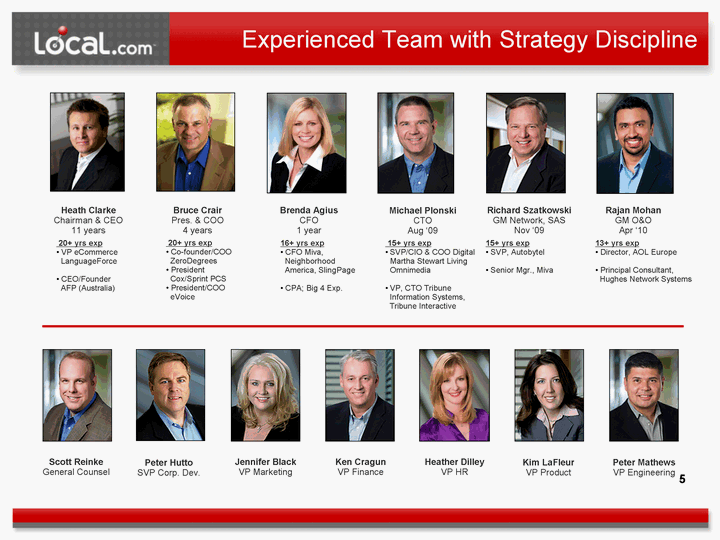
| Experienced Team with Strategy Discipline Heath Clarke Chairman & CEO 11 years Bruce Crair Pres. & COO 4 years Brenda Agius CFO 1 year Peter Hutto SVP Corp. Dev. 20+ yrs exp VP eCommerce LanguageForce CEO/Founder AFP (Australia) 20+ yrs exp Co-founder/COO ZeroDegrees President Cox/Sprint PCS President/COO eVoice 16+ yrs exp CFO Miva, Neighborhood America, SlingPage CPA; Big 4 Exp. 15+ yrs exp SVP/CIO & COO Digital Martha Stewart Living Omnimedia VP, CTO Tribune Information Systems, Tribune Interactive Michael Plonski CTO Aug '09 Richard Szatkowski GM Network, SAS Nov '09 15+ yrs exp SVP, Autobytel Senior Mgr., Miva Jennifer Black VP Marketing Ken Cragun VP Finance Heather Dilley VP HR Scott Reinke General Counsel Kim LaFleur VP Product Peter Mathews VP Engineering 5 Rajan Mohan GM O&O Apr '10 13+ yrs exp Director, AOL Europe Principal Consultant, Hughes Network Systems |

| Why Local Search? * Jupiter Research, Paid Search Through 2009. ** The Kelsey Group The future of search advertising is: Commercial search is inherently local About 80% of our incomes are spent within 25 miles of our homes 38% of searches on the internet today are commercial* 24% of searches are LOCAL and COMMERCIAL Local searchers CONVERT into buyers LOCAL + COMMERCIAL = explicit search = greater purchasing intent Advertisers targeting consumers where they spend their time Consumers spending more time searching online Search is directional - an explicit need Advertisers are increasingly favoring local online advertising "...we expect local search growth to outpace top-line search growth through 2013... Local businesses... are going to make a sustained effort to build Web sites, buy search, add content and actively manage their online presence." The Kelsey Group; March 2009 L-O-C-A-L 6 |
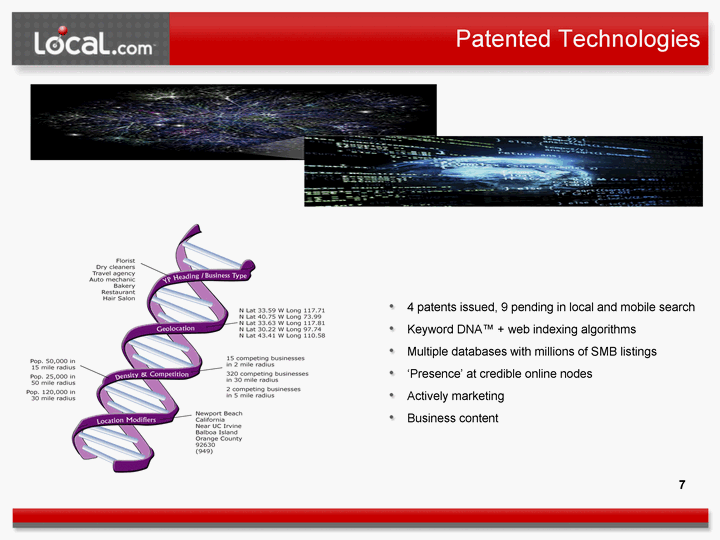
| Patented Technologies 4 patents issued, 9 pending in local and mobile search Keyword DNA(tm) + web indexing algorithms Multiple databases with millions of SMB listings 'Presence' at credible online nodes Actively marketing Business content 11 7 |
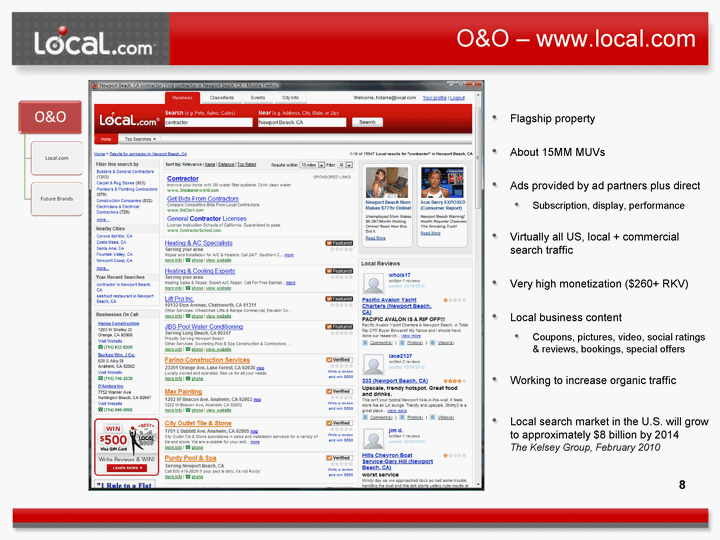
| O&O - www.local.com Flagship property About 15MM MUVs Ads provided by ad partners plus direct Subscription, display, performance Virtually all US, local + commercial search traffic Very high monetization ($260+ RKV) Local business content Coupons, pictures, video, social ratings & reviews, bookings, special offers Working to increase organic traffic Local search market in the U.S. will grow to approximately $8 billion by 2014 The Kelsey Group, February 2010 8 |
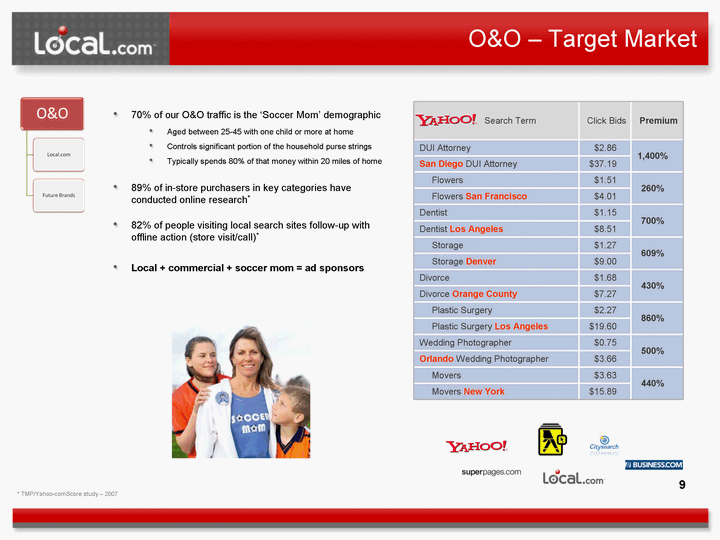
| O&O - Target Market 70% of our O&O traffic is the 'Soccer Mom' demographic Aged between 25-45 with one child or more at home Controls significant portion of the household purse strings Typically spends 80% of that money within 20 miles of home 89% of in-store purchasers in key categories have conducted online research* 82% of people visiting local search sites follow-up with offline action (store visit/call)* Local + commercial + soccer mom = ad sponsors Search Term Click Bids Premium DUI Attorney $2.86 1,400% San Diego DUI Attorney $37.19 1,400% Flowers $1.51 260% Flowers San Francisco $4.01 260% Dentist $1.15 700% Dentist Los Angeles $8.51 700% Storage $1.27 609% Storage Denver $9.00 609% Divorce $1.68 430% Divorce Orange County $7.27 430% Plastic Surgery $2.27 860% Plastic Surgery Los Angeles $19.60 860% Wedding Photographer $0.75 500% Orlando Wedding Photographer $3.66 500% Movers $3.63 440% Movers New York $15.89 440% * TMP/Yahoo-comScore study - 2007 9 |
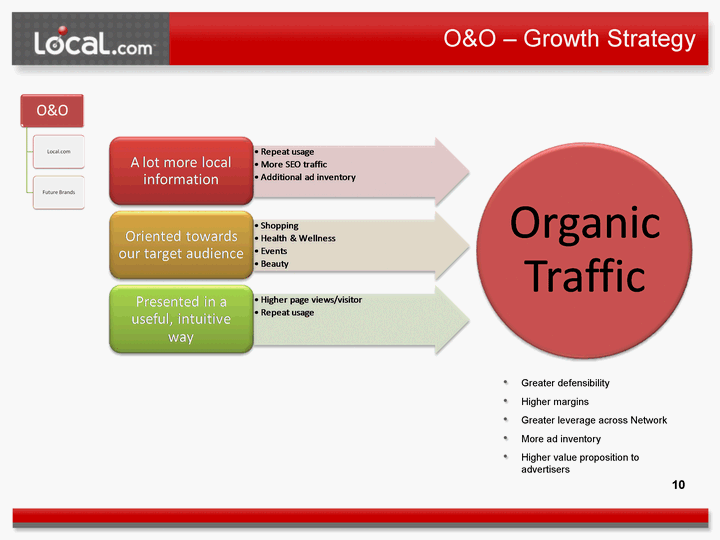
| O&O - Growth Strategy Greater defensibility Higher margins Greater leverage across Network More ad inventory Higher value proposition to advertisers 10 |
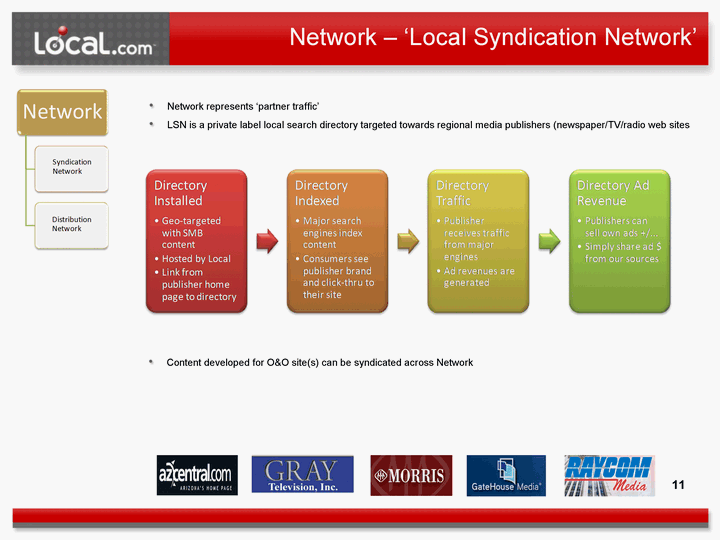
| Network - 'Local Syndication Network' Content developed for O&O site(s) can be syndicated across Network Network represents 'partner traffic' LSN is a private label local search directory targeted towards regional media publishers (newspaper/TV/radio web sites 11 |
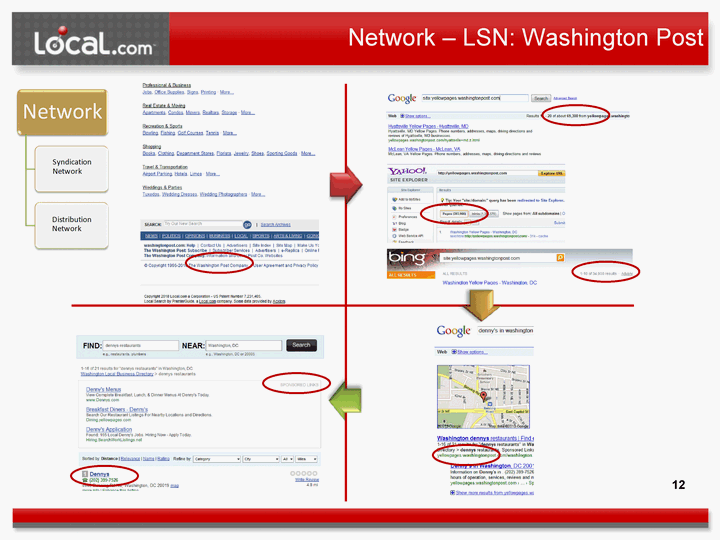
| Network - LSN: Washington Post 12 |
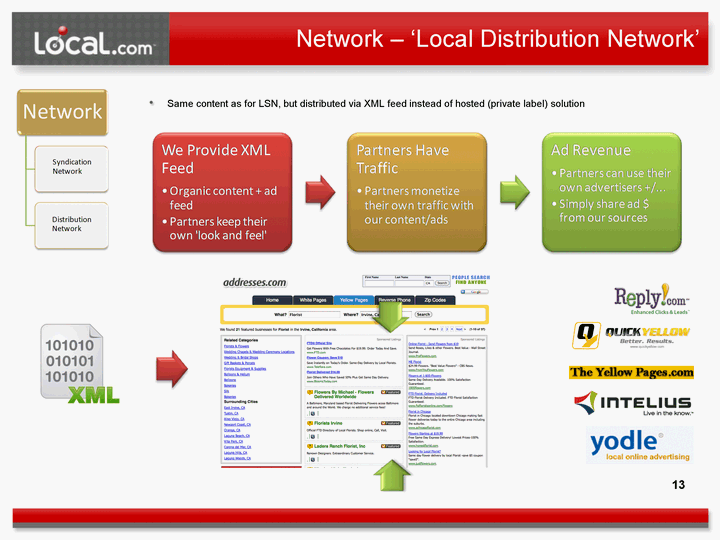
| Network - 'Local Distribution Network' 13 Same content as for LSN, but distributed via XML feed instead of hosted (private label) solution |
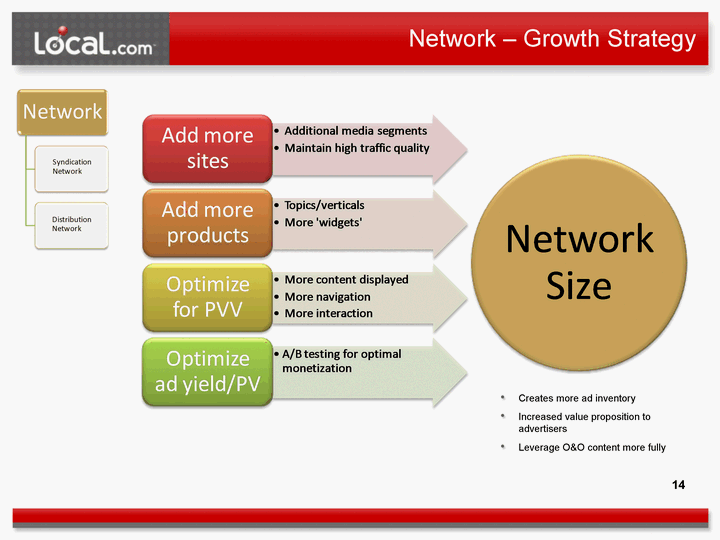
| Network - Growth Strategy Creates more ad inventory Increased value proposition to advertisers Leverage O&O content more fully 14 |
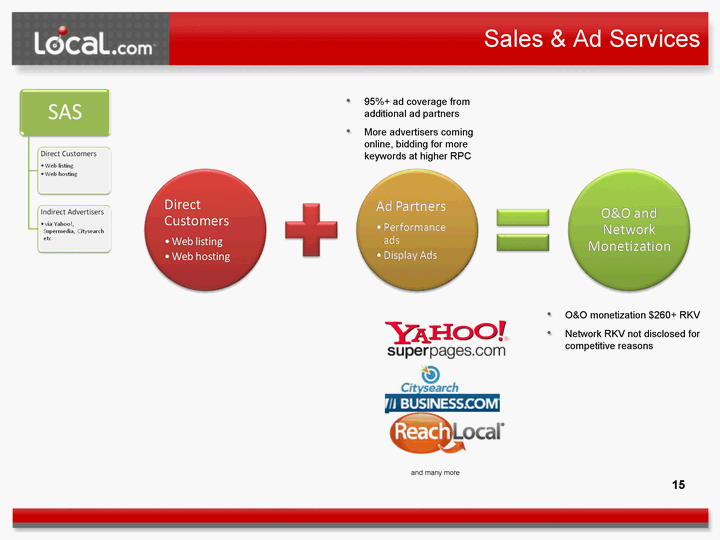
| Sales & Ad Services 95%+ ad coverage from additional ad partners More advertisers coming online, bidding for more keywords at higher RPC O&O monetization $260+ RKV Network RKV not disclosed for competitive reasons and many more 15 |
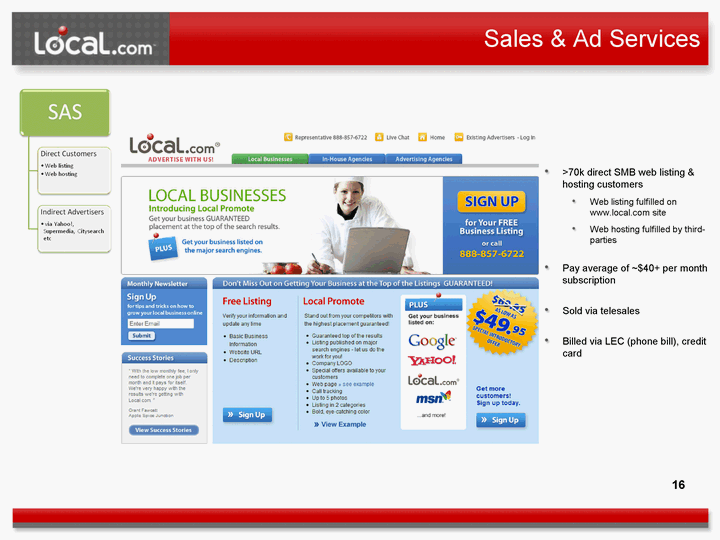
| Sales & Ad Services >70k direct SMB web listing & hosting customers Web listing fulfilled on www.local.com site Web hosting fulfilled by third- parties Pay average of ~$40+ per month subscription Sold via telesales Billed via LEC (phone bill), credit card 16 |
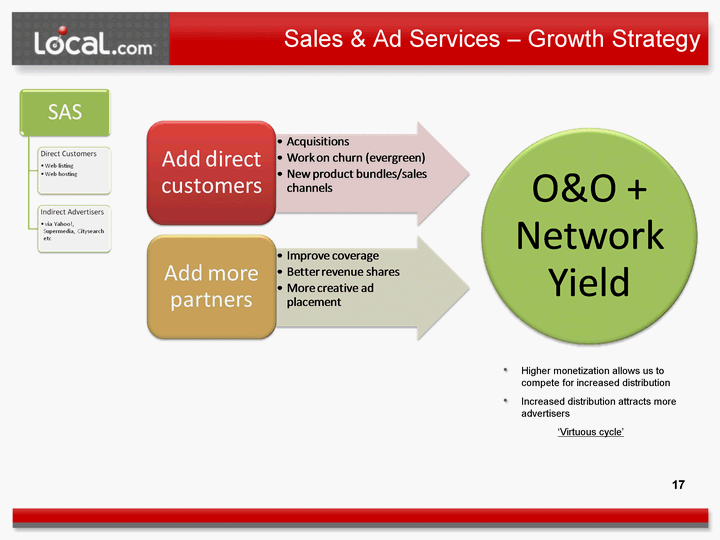
| Sales & Ad Services - Growth Strategy Higher monetization allows us to compete for increased distribution Increased distribution attracts more advertisers 'Virtuous cycle' 17 |
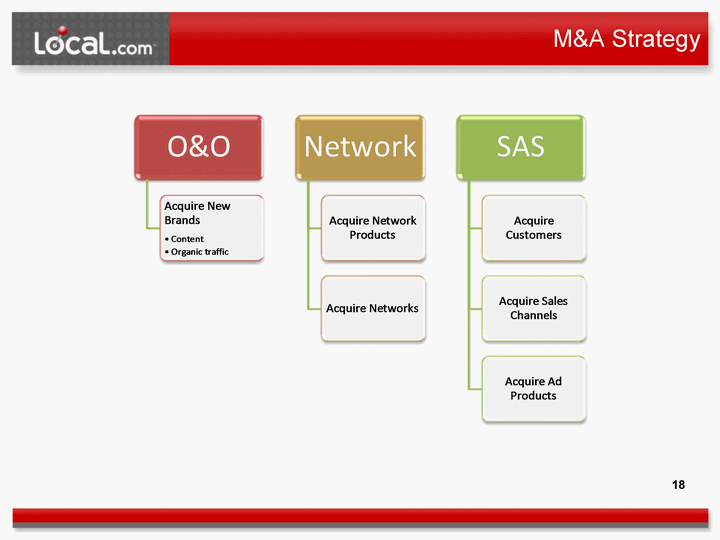
| M&A Strategy 18 |

| Revenues & Adjusted EPS Mid-range of Guidance Revenues $mil Adjusted Net Income/share Adjusted Net Income (Loss) = Net income (loss) before interest, taxes, depreciation, amortization, stock-based compensation, warrant revaluation charges, and non-recurring Items 19 |
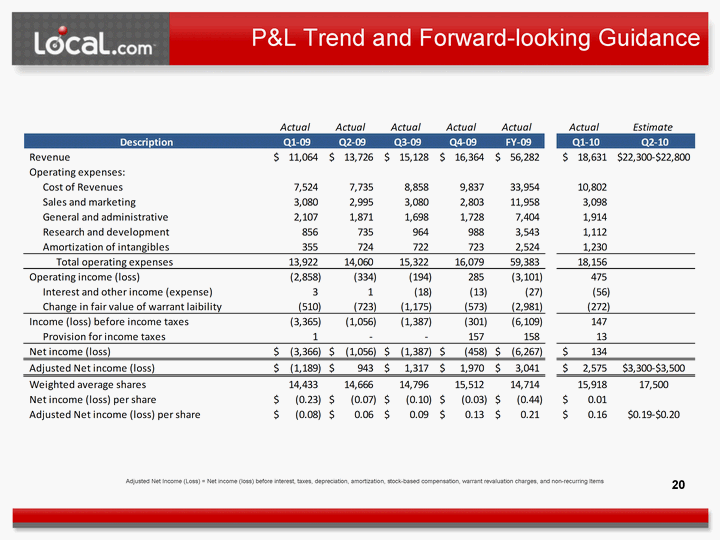
| P&L Trend and Forward-looking Guidance 20 Adjusted Net Income (Loss) = Net income (loss) before interest, taxes, depreciation, amortization, stock-based compensation, warrant revaluation charges, and non-recurring Items |
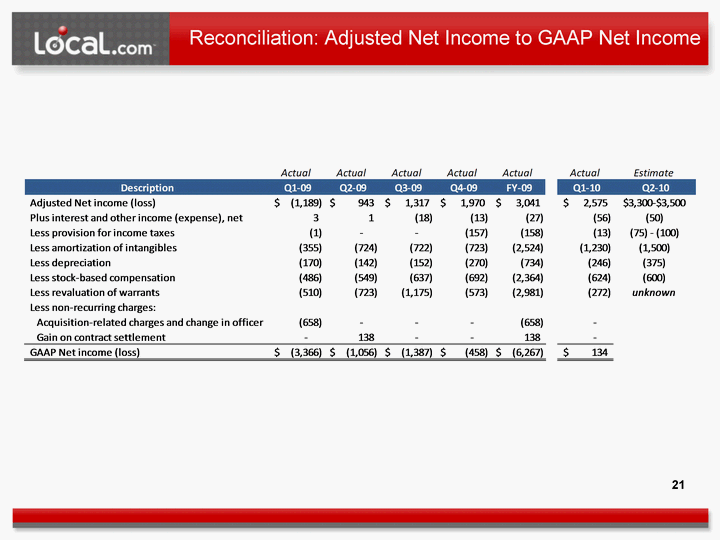
| Reconciliation: Adjusted Net Income to GAAP Net Income 21 |
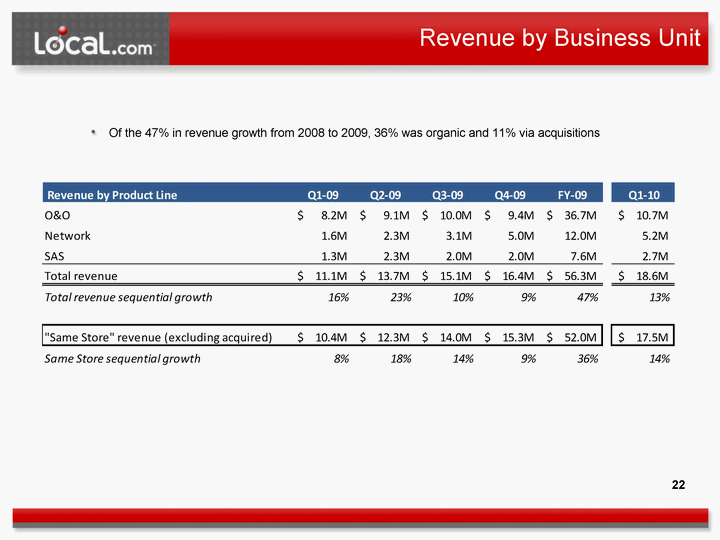
| Revenue by Business Unit 22 Of the 47% in revenue growth from 2008 to 2009, 36% was organic and 11% via acquisitions |
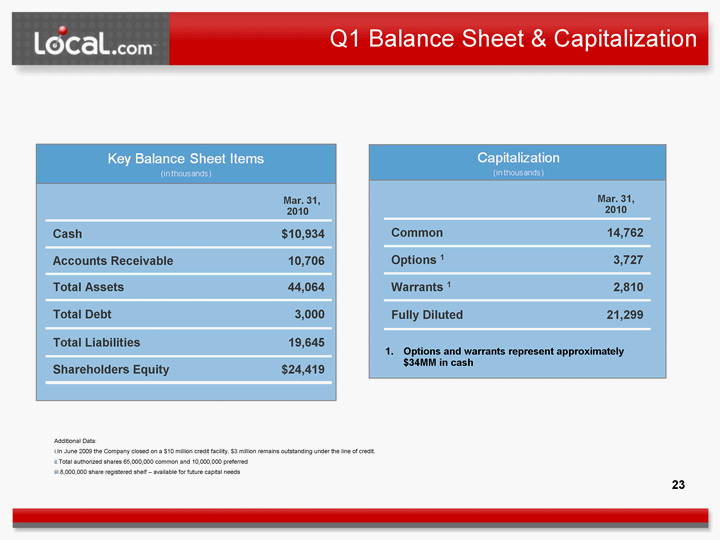
| Q1 Balance Sheet & Capitalization Mar. 31, 2010 Cash $10,934 $10,934 Accounts Receivable 10,706 10,706 Total Assets 44,064 44,064 Total Debt 3,000 3,000 Total Liabilities 19,645 19,645 Shareholders Equity $24,419 $24,419 Mar. 31, 2010 Common 14,762 Options 1 3,727 Warrants 1 2,810 Fully Diluted 21,299 Options and warrants represent approximately $34MM in cash Additional Data: In June 2009 the Company closed on a $10 million credit facility. $3 million remains outstanding under the line of credit. Total authorized shares 65,000,000 common and 10,000,000 preferred 8,000,000 share registered shelf - available for future capital needs 23 |

| Thank You Heath Clarke - CEO hclarke@local.com Brenda Agius - CFO bagius@local.com 949 784 0800 http://corporate.local.com Local search for business, products & services |
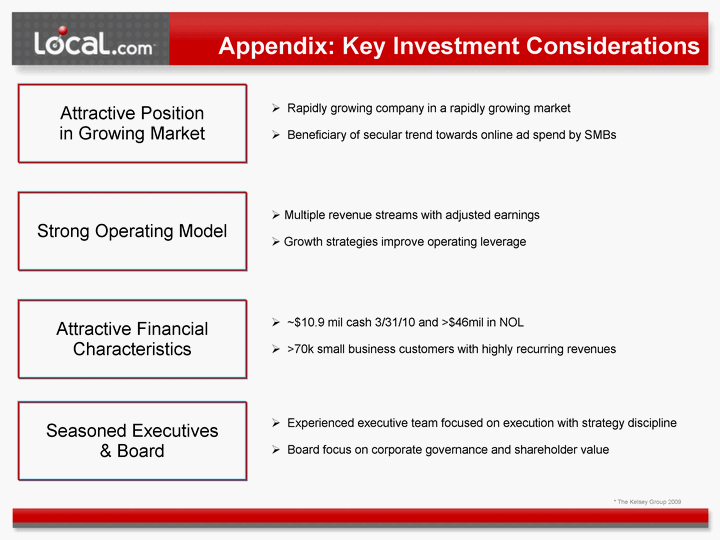
| Appendix: Key Investment Considerations Attractive Position in Growing Market Attractive Financial Characteristics Strong Operating Model Seasoned Executives & Board Rapidly growing company in a rapidly growing market Beneficiary of secular trend towards online ad spend by SMBs Multiple revenue streams with adjusted earnings Growth strategies improve operating leverage ~$10.9 mil cash 3/31/10 and >$46mil in NOL >70k small business customers with highly recurring revenues Experienced executive team focused on execution with strategy discipline Board focus on corporate governance and shareholder value * The Kelsey Group 2009 |