Attached files
| file | filename |
|---|---|
| EX-23.1 - CONSENT OF PRICEWATERHOUSECOOPERS LLP - MOTRICITY INC | dex231.htm |
| EX-10.25 - ADVISORY AGREEMENT - MOTRICITY INC | dex1025.htm |
Table of Contents
As filed with the Securities and Exchange Commission on June 7, 2010
Registration No. 333-164471
UNITED STATES
SECURITIES AND EXCHANGE COMMISSION
WASHINGTON, D.C. 20549
AMENDMENT NO. 7 TO
FORM S-1
REGISTRATION STATEMENT
UNDER
THE SECURITIES ACT OF 1933
Motricity, Inc.
(Exact name of registrant as specified in its charter)
| Delaware | 3663 | 20-1059798 | ||
| (State of incorporation) | (Primary Standard Industrial Classification Code Number) |
(I.R.S. Employer Identification Number) |
601 108th Avenue Northeast
Suite 800
Bellevue, WA 98004
(425) 957-6200
(Address, including zip code, and telephone number, including area code, of registrant’s principal executive offices)
Richard E. Leigh, Jr.
601 108th Avenue Northeast
Suite 800
Bellevue, WA 98004
(425) 957-6200
(Name, address, including zip code, and telephone number, including area code, of agent for service)
Copies of all communications, including communications sent to agent for service, should be sent to:
| Mark D. Director Christian O. Nagler Kirkland & Ellis LLP 601 Lexington Avenue New York, New York 10022 (212) 446-4800 (212) 446-4900 (facsimile) |
William H. Hinman, Jr. Simpson Thacher & Bartlett LLP 2550 Hanover Street Palo Alto, California 94304 (650) 251-5000 (650) 251-5002 (facsimile) |
Approximate date of commencement of proposed sale to the public: As soon as practicable after this registration statement becomes effective.
If any of the securities being registered on this form are to be offered on a delayed or continuous basis pursuant to Rule 415 under the Securities Act of 1933, check the following box. ¨
If this form is filed to register additional securities for an offering pursuant to Rule 462(b) under the Securities Act, check the following box and list the Securities Act registration statement number of the earlier effective registration statement for the same offering. ¨
If this form is a post-effective amendment filed pursuant to Rule 462(c) under the Securities Act, check the following box and list the Securities Act registration statement number of the earlier effective registration statement for the same offering. ¨
If this form is a post-effective amendment filed pursuant to Rule 462(d) under the Securities Act, check the following box and list the Securities Act registration statement number of the earlier effective registration statement for the same offering. ¨
Indicate by check mark whether the registrant is a large accelerated filer, an accelerated filer, a non-accelerated filer, or a smaller reporting company. See the definitions of “large accelerated filer,” “accelerated filer” and “smaller reporting company” in Rule 12b-2 of the Exchange Act.
| Large accelerated filer ¨ |
Accelerated filer ¨ | |
| Non-accelerated filer x (Do not check if a smaller reporting company) |
Smaller reporting company ¨ |
The registrant hereby amends this registration statement on such date or dates as may be necessary to delay its effective date until the registrant shall file a further amendment which specifically states that this registration statement shall thereafter become effective in accordance with Section 8(a) of the Securities Act of 1933 or until the registration statement shall become effective on such date as the Securities and Exchange Commission acting pursuant to said Section 8(a), may determine.
Table of Contents
The information in this preliminary prospectus is not complete and may be changed. We and the selling stockholders may not sell these securities until the registration statement filed with the Securities and Exchange Commission is effective. This prospectus is not an offer to sell these securities and we are not soliciting an offer to buy these securities in any jurisdiction where the offer or sale is not permitted.
SUBJECT TO COMPLETION, DATED JUNE 7, 2010
6,750,000 Shares

Motricity, Inc.
Common Stock
This is an initial public offering of shares of common stock of Motricity, Inc. Motricity is offering 6,750,000 shares in this offering.
Prior to this offering, there has been no public market for the common stock. It is currently estimated that the initial public offering price per share will be between $14.00 and $16.00. We have applied to list our common stock on the NASDAQ Global Market under the symbol “MOTR”.
See “Risk Factors” beginning on page 13 to read about factors you should consider before buying shares of the common stock.
Neither the Securities and Exchange Commission nor any other regulatory body has approved or disapproved of these securities or passed upon the accuracy or adequacy of this prospectus. Any representation to the contrary is a criminal offense.
| Per Share | Total | |||
| Initial public offering price |
$ | $ | ||
| Underwriting discount |
$ | $ | ||
| Proceeds, before expenses, to Motricity |
$ | $ |
To the extent that the underwriters sell more than 6,750,000 shares of common stock, the underwriters have the option to purchase up to an additional 1,012,500 shares from the selling stockholders at the initial public offering price less the underwriting discount. Motricity will not receive any of the proceeds from the sale of the shares sold by the selling stockholders.
The underwriters expect to deliver the shares against payment in New York, New York on or about , 2010.
| J.P. Morgan |
Goldman, Sachs & Co. | |
| Deutsche Bank Securities | RBC Capital Markets | |
| Baird | Needham & Company, LLC | Pacific Crest Securities | ||
Prospectus dated , 2010.
Table of Contents

Table of Contents
| Page | ||
| 1 | ||
| 8 | ||
| 13 | ||
| 32 | ||
| 34 | ||
| 35 | ||
| 36 | ||
| 38 | ||
| 41 | ||
| MANAGEMENT’S DISCUSSION AND ANALYSIS OF FINANCIAL CONDITION AND RESULTS OF OPERATIONS |
44 | |
| 78 | ||
| 92 | ||
| 98 | ||
| 132 | ||
| 136 | ||
| 143 | ||
| 151 | ||
| MATERIAL UNITED STATES FEDERAL INCOME TAX CONSIDERATIONS TO NON-UNITED STATES HOLDERS |
154 | |
| UNDERWRITING (CONFLICTS OF INTEREST) |
157 | |
| 162 | ||
| 162 | ||
| 163 | ||
| F-1 |
Through and including , 2010 (the 25th day after the date of this prospectus), all dealers effecting transactions in these securities, whether or not participating in this offering, may be required to deliver a prospectus. This is in addition to a dealer’s obligation to deliver a prospectus when acting as an underwriter and with respect to an unsold allotment or subscription.
No dealer, salesperson or other person is authorized to give any information or to represent anything not contained in this prospectus. You must not rely on any unauthorized information or representations. This prospectus is an offer to sell only the shares offered hereby, but only under circumstances and in jurisdictions where it is lawful to do so. The information contained in this prospectus is current only as of its date.
i
Table of Contents
This summary highlights key information contained elsewhere in this prospectus. It does not contain all of the information that you should consider in making your investment decision. For a more complete understanding of us and this offering, you should read and consider the entire prospectus, including the information set forth under “Risk Factors,” “Management’s Discussion and Analysis of Financial Condition and Results of Operations” and the financial statements and related notes thereto before deciding whether to invest in our common stock. Except as otherwise required by the context, references to “Company,” “we,” “us” and “our” are to Motricity, Inc. We use the term “wireless carrier” throughout this prospectus for simplicity, and by its use we intend to reference traditional carriers that provide mobile services over their own network as well as non-carrier mobile service providers that provide mobile services over the networks of others. We also use the phrases “4 of the top 10 global wireless carriers” and “4 of the top 10 global wireless data providers”; both refer to 4 of the top 10 wireless carriers by total wireless data revenue.
Motricity
Overview
We are a leading provider of mobile data solutions that enable wireless carriers to deliver high value mobile data services to their subscribers. We provide a comprehensive suite of hosted, managed service offerings, which include services to access the Internet using a mobile device, services to market and distribute a wide range of mobile content and applications, messaging services and billing support and settlement services. These services enable wireless carriers to deliver customized, carrier-branded mobile data services. Our mCore service delivery platform provides the tools for mobile subscribers to easily locate and access personally relevant and location-based content and services, engage in social networking and download content and applications. We also leverage our data-rich insights into subscriber behavior and our user interface expertise to provide a highly personalized mobile data experience and targeted mobile marketing solutions. By enabling wireless carriers to deliver a personalized subscriber experience, we enhance their ability to attract and retain mobile subscribers, increase the average revenue per user for mobile data services, or mobile data ARPU, and reduce network overhead and operating costs. We also facilitate effective monetization for mobile content and application providers by making it easier for them to reach millions of targeted subscribers with customized offerings.
Our mCore platform provides mobile subscribers with access to over 30 million unique pieces of third-party content or applications that we optimize and deliver to over 2,000 different mobile phone models, ranging from entry level feature phones to smartphones. We have access to more than 200 million mobile subscribers through our customers, and we currently provide mobile data services to approximately 35 million of these subscribers monthly. Our operations are predominantly based in the U.S., with international operations in the United Kingdom, the Netherlands, Indonesia and Singapore. Our customers include 4 of the top 10 global wireless carriers based on total wireless data revenue: Verizon Wireless, AT&T, Sprint and T-Mobile USA. Since 2005, Motricity has generated over $2.5 billion in gross revenue for our carrier customers through the sale of content and applications and powered over 50 billion page views through access to the mobile Internet. For the year ended December 31, 2009, we generated revenue of $113.7 million and incurred a net loss of $16.3 million. For the twelve months ended March 31, 2010, we generated revenue of $119.5 million and incurred a net loss of $10.9 million.
Industry Background
An extensive mobile data services ecosystem has developed, consisting of numerous industry participants including wireless carriers, mobile device manufacturers, operating system developers,
1
Table of Contents
and mobile content and application providers. This ecosystem is changing rapidly as new mobile devices and operating systems are introduced into the market, new mobile content and applications are developed, and as mobile subscribers demand an enhanced and personalized subscriber experience. Today’s mobile subscribers expect their mobile device to be able to do more than make phone calls or send a text message—they want to be able to access information, check email, keep up with their social networks, and download the latest content and applications.
Wireless carriers operate in a highly competitive market and face growing challenges to attract and retain mobile subscribers and increase total mobile data ARPU. Historically, many wireless carriers provided mobile data services directly to their mobile subscribers through internally developed proprietary solutions. Over time, the wireless ecosystem has become increasingly complex, with evolving technologies and a proliferation of mobile devices running different operating systems. Accordingly, it has become more difficult for wireless carriers to manage the rapid evolution of this wireless data ecosystem on their own. Additionally, the growth dynamics of the mobile data services market has attracted non-carrier participants, including Apple and Google, into the market, threatening carriers ability to monetize their significant marketing and capital investments. These relatively new entrants are offering access to mobile content and applications through their own solutions and are capturing an increasing portion of the market.
The Motricity Solution
Through our mCore service delivery platform, we provide a comprehensive suite of managed service offerings to access the Internet using a mobile device, to market and distribute a wide range of mobile content and applications, and for messaging services and billing support and settlement, which deliver numerous benefits to the following participants in the mobile data ecosystem:
Wireless Carriers. We use customizable, modular solutions that help wireless carriers rapidly develop, deploy and bill for mobile data services. Our managed services platform reduces wireless carrier network overhead and operating costs, and simplifies the relationships between wireless carriers and content and application providers.
Mobile Content and Application Providers. We facilitate effective monetization for mobile content and application providers by providing access to millions of mobile subscribers on a targeted and non-targeted basis across carriers. Our mCore platform also facilitates user-friendly uploading of content and applications, ensures efficient billing and settlement, and provides quality assurance for delivery of mobile content and applications.
Mobile Subscribers. Wireless carriers can select from some or all of our services to construct and deliver a customized, carrier-branded, and highly personalized mobile data experience that allows their mobile subscribers to easily locate and access personally relevant, location-based content and services, engage in social networking, and download, send and receive digital media. In addition, the mCore service delivery platform allows mobile subscribers to manage the content and applications that they use most frequently.
Our Strengths
| Ÿ | Strong Relationships with Wireless Carriers. We have been an integral partner with our wireless carrier customers, assisting them with key phases of their mobile data services strategies, including design, development, deployment, provisioning, management, billing and customer support. |
| Ÿ | Deep Integration within the Mobile Data Ecosystem. Through our deep integration with our wireless carrier customers’ systems, and our integration with a growing number of content and |
2
Table of Contents
| application providers, we facilitate the delivery of an enhanced mobile data experience to our customers’ mobile subscribers. |
| Ÿ | Highly Scalable Platform. Our mCore service delivery platform has been built using flexible modular architecture that enables wireless carriers to deliver a highly scalable and highly reliable, carrier-branded subscriber experience. |
| Ÿ | Comprehensive Expertise in Managed Service Operations. Through the delivery of MaaS, Mobile as a Service™, solution, we develop, implement and operate a very large and complex managed service environment, servicing approximately 35 million non-messaging based users monthly across multiple carriers and geographies with a carrier-grade level of quality and reliability. |
| Ÿ | Expansive Device Portfolio and Onboarding Process. We customize, test and maintain highly personalized mobile data experiences for an ever-expanding population of mobile devices ranging from entry level feature phones to smartphones utilizing advanced operating systems such as Symbian, Blackberry, Android, Windows Mobile and webOS. |
| Ÿ | Significant Insights into Subscriber Behavior and Effective User Experiences. Our mCore platform can capture a wide range of subscriber behavior and usage patterns across multiple carriers. |
| Ÿ | Independence and Neutrality. We are content, network, operating system and mobile device type independent, which enables our interests to be closely aligned with our wireless carrier customers’ interests. |
Our Growth Strategy
| Ÿ | Focus our efforts on expanding the breadth of our solutions with industry leading participants and leveraging our strong relationships with 4 of the top 10 global wireless carriers; |
| Ÿ | Expand our business into developed and emerging international markets such as those in Southeast Asia, India and Latin America; |
| Ÿ | Advance our technological leadership through the enhancement of the mCore platform, and the introduction of new solutions that increase the total value we provide to our carrier and enterprise customers; |
| Ÿ | Leverage our core competencies, technologies, and existing market position to broaden our offerings and customer base and advance into new market segments; |
| Ÿ | Enhance our smartphone solutions to fully capitalize on the extensive capabilities of these devices and their significant market adoption; and |
| Ÿ | Gain additional scale and technology through opportunistic acquisitions that expand our total market opportunity, provide complementary technologies and solutions, and aid our international expansion efforts. |
Risk Factors
Our business is subject to numerous risks, as more fully described in the section entitled “Risk Factors” beginning on page 13. You should consider carefully such risks before deciding to invest in our common stock. These risks include, among others:
| Ÿ | we depend on a limited number of customers for a substantial portion of our revenues, and the loss of a key customer or any significant adverse change in the size or terms of a contract with a key customer could significantly reduce our revenues; |
3
Table of Contents
| Ÿ | the mobile data service industry is, and likely will continue to be, characterized by rapid technological changes, which will require us to develop new service enhancements, and could render our existing services obsolete; |
| Ÿ | the market in which we operate is highly competitive and many of our competitors have significantly greater resources; and |
| Ÿ | open mobile phone operating systems and new business models may reduce the wireless carriers’ influence over access to mobile data services, and may reduce the total size of our market opportunity. |
Additional Information
Our company began as Power By Hand LLC, an Oklahoma limited liability company, formed in 2001. In 2003, PBH Holdings LLC, an Oklahoma limited liability company, acquired all of Power By Hand LLC’s membership interests and PBH Holdings, LLC subsequently reincorporated in Delaware in 2003. In 2004, we formed Power By Hand, Inc., a Delaware corporation, which merged with PBH Holdings, LLC, and PinPoint Networks, Inc. that same year, with Power By Hand, Inc. as the surviving entity. In 2004, we changed our name from Power By Hand, Inc. to Motricity, Inc.
On December 28, 2007, we acquired the mobile division of InfoSpace, Inc., which we refer to as InfoSpace Mobile, for a cash purchase price of $135 million and the assumption of certain liabilities. The acquisition was a key element in the broad strategic realignment of our business. We viewed InfoSpace Mobile as a competing provider of mobile content solutions and services for the wireless industry that had strong relationships with several large wireless carriers. Through its mCore platform, InfoSpace Mobile offered many of the same services we provided to our customers through our Fuel platform. InfoSpace Mobile also operated a large development organization, with an emphasis on professional services for their carrier customers. In the acquisition, in addition to acquiring the mCore platform and a number of leased U.S. datacenter facilities, we acquired a 224-person employee base, additional contracts with certain of our new and pre-existing customers, including AT&T and Verizon Wireless, and the Bellevue, Washington office facilities that we now use as our corporate headquarters.
Our corporate headquarters is located at 601 108th Avenue Northeast, Suite 800, Bellevue, Washington 98004. Our telephone number is (425) 957-6200. Our website address is www.motricity.com. Information contained on our website is not incorporated by reference into this prospectus, and you should not consider information contained on our website to be part of this prospectus or in deciding whether to purchase shares of our common stock. “Motricity” and other trademarks of ours appearing in this prospectus are our property. This prospectus contains additional trade names and trademarks of ours and of other companies. We do not intend our use or display of other companies’ trade names or trademarks to imply an endorsement or sponsorship of us by such companies, or any relationship with any of these companies.
4
Table of Contents
THE OFFERING
| Common stock offered by us |
6,750,000 shares |
| Underwriters’ option to purchase shares from the selling stockholders |
1,012,500 shares |
| Total common stock to be outstanding after this offering |
38,592,617 shares |
| Use of proceeds |
We estimate that we will receive proceeds of approximately $86.2 million from our offering of our common stock, after deducting underwriting discounts and commissions and estimated offering expenses payable by us, assuming the shares are offered at $15.00 per share, which is the midpoint of the estimated offering price range shown on the front cover page of this prospectus. We plan to use the net proceeds from this offering to fund investments and acquisitions. However, we currently have no commitments with respect to any such investments or acquisitions. In addition, we expect to use up to $1 million to pay a portion of the fees to be paid to Advanced Equities, Inc. for their advisory services provided to us in connection with this offering. One million dollars of the fee was paid previously. See “Use of Proceeds” for additional details. We will not receive any proceeds from the sale of shares by the selling stockholders. See “Principal and Selling Stockholders.” |
| Dividend Policy |
We currently do not expect to pay dividends or make any other distribution on our common stock in the foreseeable future. Our ability to pay dividends on our common stock is also limited by the covenants of our credit facility and may be further restricted by the terms of any future debt or preferred securities. See “Dividend Policy” for additional details. |
| Proposed trading symbol on NASDAQ Global Market |
“ MOTR ” |
| Risk Factors |
Investment in our common stock involves a high degree of risk. You should read and consider the information set forth under the heading “Risk Factors” beginning on page 13 and all other information included in this prospectus before deciding to invest in our common stock. |
| Conflicts of Interest |
Affiliates of Advanced Equities, Inc. beneficially own more than 10% of our company. Because of this beneficial ownership and because we agreed to pay Advanced Equities, Inc. an advisory fee of up to $2 million in connection with this offering, Advanced Equities, Inc. may be deemed a statutory underwriter. Since Advanced Equities, Inc.’s affiliates |
5
Table of Contents
| beneficially own more than 10% of our company, the underwriters are deemed to have a “conflict of interest” under Rule 2720 of the Conduct Rules of the National Association of Securities Dealers, Inc., which are overseen by the Financial Industry Regulatory Authority, Inc. Accordingly, this offering is being conducted in compliance with the applicable provisions of Rule 2720. Pursuant to that rule, the appointment of a “qualified independent underwriter” (as such term is defined in Rule 2720) is not necessary in connection with this offering as the members primarily responsible for managing the public offering do not have a conflict of interest, are not affiliates of any member that has a conflict of interest, and meet the requirements of paragraph (f)(12)(E) of Rule 2720. |
The number of shares of our common stock that will be outstanding after this offering is based on 31,842,617 shares, the number of shares outstanding at March 31, 2010, and unless we specifically state otherwise, the information in this prospectus:
| Ÿ | reflects a 15-for-1 reverse stock split of our common stock expected to be approved by our stockholders and effected prior to the effective date of the registration statement of which this prospectus is a part; |
| Ÿ | assumes that our common stock will be sold at $15.00 per share, which is the midpoint of the estimated offering price range shown on the front cover page of this prospectus; |
| Ÿ | assumes that the underwriters will not exercise their option to purchase additional shares; |
| Ÿ | reflects the conversion of all outstanding redeemable preferred stock and preferred stock, other than Series H, since we have received the necessary consents for such conversion, as of March 31, 2010 into 24,101,205 shares of common stock effective upon the consummation of this offering based on an assumed initial public offering price of $15.00 per share, the midpoint of the price range shown on the front cover page of this prospectus; |
| Ÿ | excludes 1,178,706 shares of common stock issuable upon the exercise of stock options outstanding as of March 31, 2010, at a weighted average exercise price of $10.67 per share, and 1,471,567 shares of our common stock reserved for future grants under our 2004 Stock Incentive Plan; |
| Ÿ | excludes 1,986,288 shares of our common stock reserved for future grants under our 2010 Long Term Incentive Plan, 333,333 shares of common stock issuable upon the exercise of options granted under this plan at an exercise price of $20.40 that will be outstanding at the consummation of this offering and 446,000 shares of common stock issuable upon the exercise of options with an exercise price equal to the public offering price that will be granted under this plan and will be outstanding at the consummation of this offering; |
| Ÿ | excludes 2,973,911 shares of common stock issuable upon the exercise of warrants to purchase shares of common stock, at a weighted average exercise price of $16.23; |
| Ÿ | excludes 594,639 shares of common stock issuable upon the exercise of warrants to purchase 8,919,591 shares of Series I redeemable preferred stock at an exercise price of $0.97 that upon consummation of this offering will represent warrants to purchase shares of common stock at an exercise price of $14.54 per share; |
6
Table of Contents
| Ÿ | excludes a total of 33,154 shares of common stock issuable upon the exercise of warrants to purchase a combined 292,198 shares of Series A and B redeemable preferred stock (convertible into 13,676 shares of common stock) and 19,478 shares of common stock, respectively, that upon consummation of this offering will represent warrants to purchase shares of common stock at a combined weighted average exercise price of $3.26 per share. The common stock issuable upon conversion of the Series A and B redeemable preferred stock at the consummation of this offering has been determined using an assumed initial public offering price of $15.00 per share, the midpoint of the price range shown on the front cover page of this prospectus; and |
| Ÿ | excludes 2,188,748 shares of common stock issuable upon the conversion of our Series H preferred stock as of March 31, 2010. |
7
Table of Contents
SUMMARY HISTORICAL CONSOLIDATED FINANCIAL DATA
The following tables summarize the consolidated financial data for our business. You should read these tables along with our “Management’s Discussion and Analysis of Financial Condition and Results of Operations,” “Risk Factors” and our consolidated financial statements and related notes included elsewhere in this prospectus.
We derived the summary consolidated statements of operations and cash flows data for 2007, 2008 and 2009, set forth below, from our audited consolidated financial statements included elsewhere in this prospectus. The consolidated statements of operations and cash flows data for the three months ended March 31, 2009 and 2010, and the consolidated balance sheet data as of March 31, 2010, are derived from our unaudited consolidated financial statements included elsewhere in this prospectus. We have prepared the unaudited information on the same basis as the audited consolidated financial statements and have included, in our opinion, all adjustments, consisting only of normal recurring adjustments, that we consider necessary for a fair presentation of the financial information set forth in those statements. In light of our acquisition of InfoSpace Mobile, on December 28, 2007, our financial statements only reflect the impact of the acquisition from that date, and therefore comparisons with prior periods are not necessarily meaningful. Our historical results do not necessarily indicate results that may be expected for any future period.
8
Table of Contents
| Years Ended December 31, | Three Months Ended March 31, |
|||||||||||||||||||
| 2007 | 2008 | 2009 | 2009 | 2010 | ||||||||||||||||
| (In thousands, except per share data) | ||||||||||||||||||||
| Consolidated Statement of Operations Data: |
||||||||||||||||||||
| Revenue |
||||||||||||||||||||
| Managed services |
$ | 31,772 | $ | 85,677 | $ | 81,403 | $ | 20,222 | $ | 20,881 | ||||||||||
| Professional services |
3,399 | 17,474 | 32,292 | 3,054 | 8,199 | |||||||||||||||
| Total revenues |
35,171 | 103,151 | 113,695 | 23,276 | 29,080 | |||||||||||||||
| Operating expenses |
||||||||||||||||||||
| Direct third-party expenses |
3,709 | 5,451 | 9,485 | 1,171 | 1,305 | |||||||||||||||
| Datacenter and network operations, excluding depreciation |
9,468 | 33,000 | 31,786 | 8,683 | 8,034 | |||||||||||||||
| Product development and sustainment, excluding depreciation |
16,229 | 52,261 | 31,389 | 7,677 | 8,182 | |||||||||||||||
| Sales and marketing, excluding depreciation |
7,119 | 10,228 | 11,900 | 2,989 | 3,655 | |||||||||||||||
| General and administrative, excluding depreciation |
10,334 | 26,052 | 20,841 | 5,175 | 5,264 | |||||||||||||||
| Depreciation and amortization(1) |
10,322 | 21,559 | 13,208 | 3,777 | 3,041 | |||||||||||||||
| Restructuring(2) |
1,283 | 3,236 | 2,058 | 235 | 407 | |||||||||||||||
| Goodwill and long-lived asset impairment charges(3) |
26,867 | 29,130 | 5,806 | — | — | |||||||||||||||
| Abandoned transaction charge(4) |
2,600 | — | — | — | — | |||||||||||||||
| Total operating expenses |
87,931 | 180,917 | 126,473 | 29,707 | 29,888 | |||||||||||||||
| Operating loss |
(52,760 | ) | (77,766 | ) | (12,778 | ) | (6,431 | ) | (808 | ) | ||||||||||
| Other income (expense), net |
1,155 | 2,714 | (1,627 | ) | (96 | ) | (258 | ) | ||||||||||||
| Provision for income taxes |
— | 1,776 | 1,896 | 444 | 467 | |||||||||||||||
| Loss from continuing operations |
(51,605 | ) | (76,828 | ) | (16,301 | ) | (6,971 | ) | (1,533 | ) | ||||||||||
| Loss from discontinued operations(5) |
(24,928 | ) | (1,072 | ) | — | — | — | |||||||||||||
| Loss from sale of discontinued operations(5) |
(1,360 | ) | (127 | ) | — | — | — | |||||||||||||
| Net loss |
(77,893 | ) | (78,027 | ) | (16,301 | ) | (6,971 | ) | (1,533 | ) | ||||||||||
| Accretion of redeemable preferred stock and Series D1 preferred dividends |
(8,095 | ) | (22,427 | ) | (23,956 | ) | (5,987 | ) | (6,400 | ) | ||||||||||
| Net loss attributable to common stockholders |
$ | (85,988 | ) | $ | (100,454 | ) | $ | (40,257 | ) | $ | (12,958 | ) | $ | (7,933 | ) | |||||
| Basic and fully diluted net loss per share attributable to common stockholders(6) |
$(14.84) | $(17.19) | $(6.85) | $(2.20) | $(1.38) | |||||||||||||||
| Weighted-average number of shares of common stock used in computing basic net loss per share attributable to common stockholders(6) |
5,796 | 5,843 | 5,878 | 5,887 | 5,753 | |||||||||||||||
| Pro forma net loss attributable to holders of common stock (unaudited)(6) |
$ | (31,245 | ) | $ | (17,815 | ) | ||||||||||||||
| Pro forma basic and fully diluted net loss per share (unaudited)(6) |
$ | (0.84 | ) | $ | (0.48 | ) | ||||||||||||||
| Weighted-average number of shares of common stock used in computing pro forma basic and fully diluted net loss per share (unaudited)(6) |
37,106 | 37,468 | ||||||||||||||||||
9
Table of Contents
| As of March 31, 2010 | |||||||
| Actual | Pro Forma As Adjusted(7) | ||||||
| (In thousands) | |||||||
| Consolidated Balance Sheet Data: |
|||||||
| Cash and cash equivalents |
$ | 25,408 | $ | 113,406 | |||
| Working capital |
23,459 | 112,105 | |||||
| Total assets |
161,518 | 247,111 | |||||
| Total long-term debt and capital lease obligations |
— | — | |||||
| Total redeemable preferred stock |
423,624 | 51,028 | |||||
| Total stockholders’ equity (deficit) |
(296,162 | ) | 167,949 | ||||
| Years Ended December 31, | Three Months Ended March 31, |
|||||||||||||||||||
| 2007 | 2008 | 2009 | 2009 | 2010 | ||||||||||||||||
| (In thousands) | ||||||||||||||||||||
| Consolidated Statement of Cash Flows Data: |
||||||||||||||||||||
| Cash flows from operating activities |
$ | (41,499 | ) | $ | (28,745 | ) | $ | 33,101 | $ | (1,794 | ) | $ | (8,028 | ) | ||||||
| Cash flows from investing activities |
(133,507 | ) | (14,735 | ) | 408 | 92 | (1,149 | ) | ||||||||||||
| Cash flows from financing activities |
236,275 | (9,644 | ) | (11,956 | ) | (833 | ) | (1,332 | ) | |||||||||||
| Investments in property and equipment included within investing activities |
(4,594 | ) | (8,389 | ) | (4,890 | ) | (2,243 | ) | (1,186 | ) | ||||||||||
| Years Ended December 31, | Three Months Ended March 31, |
|||||||||||||||||||
| 2007 | 2008 | 2009 | 2009 | 2010 | ||||||||||||||||
| (In thousands) | ||||||||||||||||||||
| Other Financial Data (unaudited): |
||||||||||||||||||||
| Adjusted EBITDA(8) |
$ | (11,000 | ) | $ | (21,497 | ) | $ | 10,473 | $ | (1,887 | ) | $ | 3,145 | |||||||
| (1) | Depreciation and amortization by function: |
| Years Ended December 31, | Three Months Ended March 31, | ||||||||||||||
| 2007 | 2008 | 2009 | 2009 | 2010 | |||||||||||
| (In thousands) | |||||||||||||||
| Datacenter and network operations |
$ | 7,310 | $ | 16,824 | $ | 8,890 | $ | 2,497 | $ | 1,992 | |||||
| Product development and sustainment |
1,548 | 2,237 | 1,962 | 586 | 428 | ||||||||||
| Sales and marketing |
307 | 2,075 | 1,960 | 572 | 524 | ||||||||||
| General and administrative |
1,157 | 423 | 396 | 122 | 97 | ||||||||||
| Depreciation and amortization |
$ | 10,322 | $ | 21,559 | $ | 13,208 | $ | 3,777 | $ | 3,041 | |||||
| (2) | Our restructuring charges relate to costs associated with closing and relocating facilities, relocating certain key employees and severance costs following the acquisition of InfoSpace Mobile. See “Management’s Discussion and Analysis of Financial Condition and Results of Operations” for further details. |
| (3) | The impairments in 2008 and 2009 relate primarily to integration activities following our acquisition of InfoSpace Mobile in December 2007 and to certain non-core operating assets. The 2007 impairments relate to goodwill due primarily to changes in consumer purchase habits. See “Management’s Discussion and Analysis of Financial Condition and Results of Operations” for further details. |
| (4) | In 2007, we issued a warrant to purchase common stock to an affiliate of an existing investor as a fee for providing a financing commitment in connection with a proposed transaction that was not completed. |
10
Table of Contents
| (5) | In connection with a business strategy reassessment initiated in 2007, we exited the direct to consumer business and a business we refer to as media and entertainment (“media and entertainment”) at various times during 2007 and 2008. |
| (6) | See Note 13 to our consolidated financial statements for the method used to compute basic and diluted net loss per share attributable to common stockholders and pro forma basic and diluted net loss per share attributable to common stockholders. |
| (7) | The Pro Forma As Adjusted column of this consolidated balance sheet data table reflects (a) the conversion of all outstanding shares of redeemable preferred stock and preferred stock, other than Series H, into 24,101,205 shares of common stock upon the closing of this offering, (b) the issuance and sale by us of 6,750,000 shares of common stock in this offering at an initial public offering price of $15.00 per share, (c) the receipt of proceeds of this offering after deducting estimated underwriting discounts and commissions and other offering expenses payable by us, (d) the reclassification of the redeemable preferred stock warrant liability to additional paid-in capital, and (e) the recording of stock-based compensation expense due to the vesting of restricted stock triggered by the closing of this offering is as if these events had occurred as of March 31, 2010. The Pro Forma As Adjusted Information set forth in this table is illustrative only and will be adjusted based on the actual initial public offering price and other terms of this offering determined at pricing. A $1.00 increase (decrease) in the assumed initial public offering price of $15.00 per share would increase (decrease) each of pro forma as adjusted cash and cash equivalents, working capital, total assets and total stockholders’ equity (deficit) by approximately $6.3 million, assuming the number of shares offered by us, as set forth on the cover page of this prospectus, remains the same and after deducting estimated underwriting discounts and commissions and other offering expenses payable by us. |
| (8) | See our discussion of Adjusted EBITDA as a non-GAAP financial measure immediately following these footnotes. |
Reconciliation of Adjusted EBITDA to Net Loss From Continuing Operations
We define Adjusted EBITDA as net loss from continuing operations plus interest expense, provision for income taxes, depreciation and amortization, stock-based compensation expense, restructuring, asset impairments and abandoned transaction charges, and less interest and other income (expense), net. Adjusted EBITDA is not a measure of liquidity calculated in accordance with accounting principles generally accepted in the U.S., referred to herein as GAAP, and should be viewed as a supplement to, not a substitute for, our results of operations presented on the basis of GAAP. Adjusted EBITDA does not purport to represent cash flow provided by, or used in, operating activities as defined by GAAP. Our statement of cash flows presents our cash flow activity in accordance with GAAP. Furthermore, Adjusted EBITDA is not necessarily comparable to similarly-titled measures reported by other companies.
We believe Adjusted EBITDA is used by and is useful to investors and other users of our financial statements in evaluating our operating performance because it provides them with an additional tool to compare business performance across companies and across periods. We believe that:
| Ÿ | EBITDA is widely used by investors to measure a company’s operating performance without regard to items such as interest expense, taxes, depreciation and amortization, which can vary substantially from company to company depending upon accounting methods and book value of assets, capital structure and the method by which assets were acquired; and |
| Ÿ | investors commonly adjust EBITDA to eliminate the effect of restructuring and stock-based compensation expenses, which vary widely from company to company and impair comparability. |
11
Table of Contents
We use Adjusted EBITDA:
| Ÿ | as a measure of operating performance to assist in comparing performance from period to period on a consistent basis; |
| Ÿ | as a measure for planning and forecasting overall expectations and for evaluating actual results against such expectations; and |
| Ÿ | in communications with the board of directors, stockholders, analysts and investors concerning our financial performance. |
A reconciliation of Adjusted EBITDA to net loss from continuing operations, the most directly comparable GAAP measure, for each of the fiscal periods indicated is as follows:
| Years Ended December 31, | Three Months Ended March 31, |
|||||||||||||||||||
| 2007 | 2008 | 2009 | 2009 | 2010 | ||||||||||||||||
| (Unaudited, in thousands) | ||||||||||||||||||||
| Loss from continuing operations |
$ | (51,605 | ) | $ | (76,828 | ) | $ | (16,301 | ) | $ | (6,971 | ) | $ | (1,533 | ) | |||||
| Other income (expense), net |
(1,155 | ) | (2,714 | ) | 1,627 | 96 | 258 | |||||||||||||
| Provision for income taxes |
— | 1,776 | 1,896 | 444 | 467 | |||||||||||||||
| Depreciation and amortization |
10,322 | 21,559 | 13,208 | 3,777 | 3,041 | |||||||||||||||
| Restructuring, asset impairments and abandoned transaction charges |
30,750 | 32,366 | 7,864 | 235 | 407 | |||||||||||||||
| Stock-based compensation |
688 | 2,344 | 2,179 | 532 | 505 | |||||||||||||||
| Adjusted EBITDA |
$ | (11,000 | ) | $ | (21,497 | ) | $ | 10,473 | $ | (1,887 | ) | $ | 3,145 | |||||||
12
Table of Contents
Investing in our common stock involves a high degree of risk. You should carefully consider and evaluate all of the information in this prospectus, including the risks and uncertainties described below, which we believe describe the most significant, but not all, risks of an investment in our common stock, before making a decision to invest in our common stock. The occurrence of any of the following risks and uncertainties could harm our business, financial condition, results of operations or growth prospects. As a result, the trading price of our common stock could decline, and you could lose all or part of your investment.
Risks Related to Our Business and Operations
We depend on a limited number of customers for a substantial portion of our revenues. The loss of a key customer or any significant adverse change in the size or terms of a contract with a key customer could significantly reduce our revenues.
We depend, and expect to continue to depend, on a limited number of significant worldwide wireless carriers for a substantial portion of our revenues. Currently, 4 of the top 10 global wireless carriers use our services. In the event that one or more of these major wireless carriers decides to reduce or stop using our managed and professional services, we could be forced to shift our marketing focus to smaller wireless carriers, which could result in lower revenues than expected and increased business development, marketing and sales expenses. This could cause our business to be less profitable and our results of operations to be adversely affected.
In addition, a change in the timing or size of a purchase by any one of our key customers could result in significant variations in our revenue and operating results. Our operating results for the foreseeable future will continue to depend on our ability to effect sales to a small number of customers. Any revenue growth will depend on our success in selling additional services to our large customers and expanding our customer base to include additional customers that deploy our solutions in large-scale networks serving significant numbers of subscribers.
In 2009, we generated approximately 53% and 20% of our total revenue from contracts with AT&T Mobility LLC and its affiliates, or AT&T, and Verizon Wireless and its affiliates, respectively. For the three months ended March 31, 2010, we generated approximately 40% and 39% of our total revenue from contracts with AT&T and Verizon Wireless, respectively. No other customer accounted for more than 10% of our revenues in 2009 or in the first three months of 2010. Our current five largest customers accounted for approximately 84% of our revenues in 2009 and 90% of our revenues for the three months ended March 31, 2010. Certain of our customer agreements expire in mid to late 2010, including agreements with AT&T and Verizon Wireless. Failure to renew our agreements with AT&T, Verizon Wireless or our other large customers would materially reduce our revenue and have a material adverse effect on our business, operating results and financial condition. See “Management’s Discussion and Analysis of Financial Condition and Results of Operations—Overview” and “Business—Customers and Vendors—Customers” for more information.
The mobile data services industry is, and likely will continue to be, characterized by rapid technological changes, which will require us to develop new service enhancements, and could render our existing services obsolete.
The market for content and applications for mobile devices is characterized by rapid technological change, with frequent variations in user requirements and preferences, frequent new product and service introductions embodying new technologies and the emergence of new industry standards and practices. Our success will depend, in part, on our ability to enhance and expand our existing services,
13
Table of Contents
develop new technology that addresses the increasingly sophisticated and varied needs of wireless carriers and their subscribers, respond to technological advances and emerging industry standards and practices and license leading technologies that will be useful in our business in a cost-effective and timely way. We may not be able to successfully use new technologies or adapt our current and planned services to new customer requirements or emerging industry standards. The introduction of new products embodying new technologies or the emergence of new industry standards could render our existing services obsolete, unmarketable or uncompetitive from a pricing standpoint.
The market in which we operate is highly competitive and many of our competitors have significantly greater resources.
The mobile data communications services market is rapidly evolving and intensely competitive. Our competitors include mobile device manufacturers, search engines, portals and directories, and wireless service integrators. Competition in the wireless industry throughout the world continues to increase at a rapid pace as consumers, businesses and governments realize the market potential of wireless communications products and services. In addition, new competitors or alliances among competitors could emerge and rapidly acquire significant market share, to our detriment. There may be additional competitive threats from companies introducing new and disruptive solutions. Some of our competitors may be better positioned than we are. Although we have attained a significant position in the industry, many of our current and potential competitors may have advantages over us, including:
| Ÿ | longer operating histories and market presence; |
| Ÿ | greater name recognition; |
| Ÿ | access to larger customer bases; |
| Ÿ | single source solutions that deliver mobile devices, hardware, services and infrastructure; |
| Ÿ | economies of scale and cost structure advantages; |
| Ÿ | greater sales and marketing, manufacturing, distribution, technical, financial and other resources; and |
| Ÿ | government support. |
These competitors also have established or may establish financial or strategic relationships among themselves or with our existing or potential customers or other third parties. In addition, some of our competitors have used and may continue to use aggressive pricing or promotional strategies, have stronger relationships on more favorable terms with wireless carriers and may devote substantially greater resources to system development than we do. These relationships may affect customers’ decisions to purchase services from us.
We also face competition from existing service providers in the international markets in which we already compete or may enter. For example, in India we compete with numerous companies, some of which are solely focused on the local mobile data services market, are directly owned and managed by local citizens. These factors could provide local competitors with advantages over us, particularly if the local government enacts laws or policies that favor local competitors or restrict or disadvantage us because our international operations are part of a U.S.-domiciled company. Other competitors in international markets are subsidiaries of larger companies with established local operations, and with greater experience and resources. In other countries that we may enter, there may be incumbent competitors presently selling data services products. These incumbents may have competitive advantages that could impede our expansion and growth in these countries.
14
Table of Contents
Competition for our employees is intense and failure to recruit and retain skilled personnel could negatively affect our financial results as well as our ability to maintain relationships with clients and drive future growth.
We provide sophisticated mobile data delivery platforms and services to our customers. To attract and retain customers, we believe we need to demonstrate professional acumen and build trust and strong relationships, and that we must identify, recruit, retain and motivate new hardware and software engineers, programmers, technical support personnel and marketing and sales representatives. Competition is intense for skilled personnel with engineering, product development, technical and marketing and sales experience, and we may not be able to identify individuals that possess the necessary skills and experience, or we may not be able to employ these individuals on acceptable terms and conditions, or at all. Moreover, competition has been increasing the cost of hiring and retaining skilled professionals, a trend which could adversely affect our operating margins and financial results. Our business and growth may suffer if we are unable to hire and retain skilled personnel.
We rely heavily on our executive officers and other key employees for the success of our business and the loss of our executive team whether to a competitor or otherwise could adversely impact our business.
We believe our success will depend in part upon retaining the services of executive officers and other key employees. Many of our executive officers joined our company within the last two years and we operate in a very competitive environment. Although we have employment agreements with many of our key employees, such employees may receive employment offers that are competitive with or more attractive than their existing employment terms with us. If our executive officers or non-executive key employees leave and we cannot replace them with suitable candidates quickly, we could experience difficulty in managing our business properly. This could harm our business prospects, client relationships, employee morale and financial results. We currently maintain a key-person life insurance policy on our chief executive officer.
Open mobile phone operating systems and new business models may reduce the wireless carriers’ influence over access to mobile data services, and may reduce the total size of our market opportunity.
The majority of our revenue is based on mobile subscribers accessing mobile content and applications through our customers’ carrier-branded mobile solutions. However, with the growth of the iPhone and smartphone business models, our customers’ services may be bypassed or become inaccessible. These business models, which exclude carrier participation beyond transport, along with the introduction of more mobile phones with open operating systems that allow mobile subscribers to browse the Internet and, in some cases, download applications from sources other than a carrier’s branded services, create a risk that some carriers will choose to allow this non-branded Internet access without offering a competitive value-added carrier-branded experience as part of their solution set. These so-called “open operating systems” include Symbian, BlackBerry, Android, Windows Mobile and webOS. We believe wireless carriers need to offer branded services that can compete head-to-head with the new business models and open technologies in order to retain mobile subscribers and increase ARPU. Although our solutions are designed to help wireless carriers deliver a high value, competitive mobile data experience, if mobile subscribers do not find these carrier-branded services compelling, there is a risk that mobile subscribers will use open operating systems to bypass carrier-branded services and access the mobile Internet. It is also possible one or more wireless carriers will adopt a non-carrier branded, third-party web portal model. To the extent this occurs, the total available market opportunity for providing our current services and solutions to carriers may be reduced.
15
Table of Contents
Our sales cycle can be long, which may make our revenues and operating results less predictable.
Wireless carriers must typically make substantial investments to deploy our mobile data services solution. As a result, the typical sales cycle for our services is long, averaging nine to twelve months per customer. Many of the potential customers for our services have only recently begun to evaluate the benefits of expanding their offerings of mobile services, and many have only recently designated personnel to evaluate, procure and implement new mobile services. We believe that we may be required to spend a significant amount of time and resources educating potential customers on the use and benefits of our services, and in turn, we expect potential customers to spend a significant amount of time performing internal reviews and obtaining authorization to purchase our services. Furthermore, the emerging and evolving nature of mobile data technological standards and services may lead potential customers to postpone purchasing decisions.
We have a history of net operating losses and may continue to suffer losses in the future.
For the years ended December 31, 2005, 2006, 2007, 2008, and 2009, we had net losses of approximately $22.5 million, $55.2 million, $77.9 million, $78.0 million and $16.3 million, respectively. For the three months ended and as of March 31, 2010, we had a net loss of approximately $1.5 million and an accumulated deficit of approximately $313.7 million. If we cannot become profitable, our financial condition will deteriorate, and we may be unable to achieve our business objectives.
We compete with in-house mobile data solutions similar to those we offer.
The mobile data service industry is evolving rapidly to address changing industry standards and the introduction of new technologies and network elements. Wireless carriers are constantly reassessing their approaches to delivering mobile data to their subscribers, and one or more of our customers could decide to deploy an in-house mobile data delivery service solution that competes with our services. Even if the mobile data delivery services offered by a mobile service provider’s in-house solution were more limited than those provided by our services, a wireless carrier may elect to accept limited functionality or services in lieu of providing a third party access to its network. An increase in the use of in-house solutions by wireless carriers could have an adverse effect on our business, operating results and financial condition.
We have a significant relationship with a development vendor, and changes to that relationship may result in delays or disruptions that could harm our business.
We rely upon development vendors to provide additional capacity for our technical development and quality assurance services. Our primary development vendor is GlobalLogic, Inc., a software research and development company providing software development services primarily from its offices in India and Ukraine. Our current agreement with GlobalLogic terminates on December 29, 2011. GlobalLogic may only terminate this agreement for cause. If GlobalLogic were, for any reason, to cease operations, we might be unable to replace it on a timely basis with a comparably priced provider. We would also have to expend time and resources to train any new development vendor that might replace GlobalLogic. If GlobalLogic were to suffer an interruption in its business, or experience delays, disruptions or quality control problems in its software development operations, or if we had to change development vendors, our ability to provide services to our customers would be delayed and our business, operating results and financial condition would be adversely affected.
16
Table of Contents
Demand for our managed and professional services depends on increases in carrier subscribers’ use of mobile data services and mobile devices to access the mobile Internet and on our customers’ continued investment and improvement in wireless networks.
Our services comprise a mobile data service delivery platform that enables wireless carriers to monitor and charge their subscribers for access to mobile applications, content and programs that are developed by third parties and hosted by us. The majority of our revenue is based on mobile subscribers accessing mobile content and applications through our customers’ carrier-branded mobile solutions. Our ability to generate revenues from our services will depend on the extent to which businesses and consumers continue to adopt and use mobile devices to access the mobile Internet and to receive products and services via their mobile devices. While many consumers use mobile devices to communicate, the majority of consumers do not presently use mobile devices to access the mobile Internet or obtain other products or services. Consumers and businesses may not significantly increase their use of mobile data services and mobile devices to access the mobile Internet and to obtain products and services as quickly as our business model contemplates. If consumers do not continue to increase their use of mobile data services, our business, operating results and financial condition will be adversely impacted.
Further, increased demand by consumers for mobile data services delivered over wireless networks will be necessary to justify capital expenditure commitments by wireless carriers to invest in the improvement and expansion of their networks. Demand for mobile data services might not continue to increase if there is limited availability or market acceptance of mobile devices designed for such services; the multimedia content offered through wireless networks does not attract widespread interest; or the quality of service available through wireless networks does not meet consumer expectations. If long-term expectations for mobile data services are not realized or do not support a sustainable business model, wireless carriers may not commit significant capital expenditures to upgrade their networks to provide these services, the demand for our services will decrease, and we may not be able to increase our revenues or become profitable in the future.
If we are unable to protect the confidentiality of our proprietary information, the value of our technology could be adversely affected.
Our business relies upon certain unpatented or unregistered intellectual property rights and proprietary information, including the mCore platform. Consequently, although we take measures to keep our key intellectual property rights and proprietary information confidential, we may not be able to protect our technology from independent invention by third parties. We currently attempt to protect most of our key intellectual property through a combination of trade secret, copyright and other intellectual property laws and by entering into employee, contractor and business partner confidentiality agreements. Such measures, however, provide only limited protection, and under certain circumstances we may not be able to prevent the disclosure of our intellectual property, or the unauthorized use or reverse engineering or independent development of our technology. This may allow our existing and potential competitors to develop products and services that are competitive with, or superior to, our services.
Further, we intend to expand our international presence by targeting countries with large populations and propensities for adopting new technologies. However, many of these countries’ intellectual property laws are not as stringent as those of the U.S. Effective patent, copyright, trademark and trade secret protections may be unavailable or limited in some foreign countries. As a result, we may not be able to effectively prevent competitors in these countries from using or infringing our intellectual property rights, which would reduce our competitive advantage and ability to compete in these regions or otherwise harm our business. In the future, we may also have to resort to litigation to enforce our intellectual property rights, which could result in substantial costs and divert our management’s attention and resources. In addition, such litigation may not be successful.
17
Table of Contents
Consolidation in the telecommunications industry may reduce the number of our customers and negatively impact our financial performance.
The telecommunications industry continues to experience consolidation and an increased formation of alliances among telecommunications service providers and between telecommunications service providers and other entities. Should one of our significant customers consolidate with another company or enter into such an alliance and decide either to use a different mobile data service provider or to manage its transactions internally, it could have a negative material impact on our prospects. These consolidations and alliances may cause us to lose customers or require us to reduce prices as a result of enhanced customer leverage, which would have a material adverse effect on our business. We may not be able to offset the effects of any price reductions. We may not be able to expand our customer base to make up any decreases in revenue if we lose customers or if our transaction volumes decline.
We expect that our revenue will fluctuate, which could cause our stock price to decline.
Our revenue is subject to fluctuations due to the timing of sales of high-dollar professional services projects. Because these projects occur at irregular intervals and the dollar values vary based on customer needs, we may experience quarter-to-quarter fluctuations in revenue. In addition, any significant delays in the deployment of our services, unfavorable sales trends in our existing service categories, or changes in the spending behavior of wireless carriers could adversely affect our revenue growth. If our revenue fluctuates or does not meet the expectations of securities analysts and investors, our stock price would likely decline.
Our customer contracts lack uniformity and often are complex, which subjects us to business and other risks.
Our customers include some of the largest wireless carriers which have substantial purchasing power and negotiating leverage. As a result, we typically negotiate contracts on a customer- bycustomer basis and sometimes accept contract terms not favorable to us in order to close a transaction, including indemnity, limitation of liability, refund, penalty or other terms that could expose us to significant financial or operating risk. If we are unable to effectively negotiate, enforce and accurately and timely account and bill for contracts with our key customers, our business and operating results may be adversely affected.
In addition, we have contractual indemnification obligations to our customers, most of which are unlimited in nature. If we are required to fulfill our indemnification obligations relating to third-party content or operating systems that we provide to our customers, we intend to seek indemnification from our suppliers, vendors, and content providers to the full extent of their responsibility. Even if the agreement with such supplier, vendor or content provider contains an indemnity provision, it may not cover a particular claim or type of claim or may be limited in amount or scope. As a result, we may or may not have sufficient indemnification from third parties to cover fully the amounts or types of claims that might be made against us. Any significant indemnification obligation to our customers could have a material adverse effect on our business, operating results and financial condition.
We provide service level commitments to our customers, which could cause us to incur financial penalties if the stated service levels are not met for a given period and could significantly reduce our revenue.
Our customer agreements provide service level commitments on a monthly basis. Our service level commitment varies by customer. If we are unable to meet the stated service level commitments or suffer extended periods of unavailability and/or degraded performance of our service, we may incur financial penalties. Our revenue could be significantly impacted if we suffer unscheduled downtime that exceeds the allowed downtimes under our agreements with our customers. The failure to meet our
18
Table of Contents
contractual level of service availability may require us to credit affected customers for a significant portion of their monthly fees, not just the value for the period of the downtime. As a result, failure to deliver services for a relatively short duration could result in our incurring significant financial penalties. Service level penalties represented 4% of total revenue in 2008, 1% of total revenue in 2009 and 3% of total revenue for the three months ended March 31, 2010. Any system failure, extended service outages, errors, defects or other performance problems with our managed and professional services could harm our reputation and may damage our customers’ businesses.
We use datacenters to deliver our platform and services. Any disruption of service at these facilities could harm our business.
We host our services and serve all of our customers from five datacenter facilities located around the U.S. We operate two datacenter facilities located in Washington State. The other three facilities are operated by third parties in Georgia, Massachusetts and North Carolina. We do not control the operations at the third-party facilities. All of these facilities are vulnerable to damage or interruption from earthquakes, hurricanes, floods, fires, terrorist attacks, power losses, telecommunications failures and similar events. They also could be subject to break-ins, computer viruses, denial of service attacks, sabotage, intentional acts of vandalism and other misconduct. The occurrence of a natural disaster or an act of terrorism, a decision to close the third-party facilities without adequate notice or other unanticipated problems could result in lengthy interruptions in our services. Although we maintain off-site tape backups of our customers’ data, we do not currently operate or maintain a backup datacenter for any of our services, which increases our vulnerability to interruptions or delays in our service. Interruptions in our services might harm our reputation, reduce our revenue, cause us to incur financial penalties, subject us to potential liability and cause customers to terminate their contracts.
Capacity constraints could disrupt access to our services, which could affect our revenue and harm our reputation.
Our service goals of performance, reliability and availability require that we have adequate capacity in our computer systems to cope with the volume of traffic through our mCore service delivery platform. As our operations grow in size and scope, we will need to improve and upgrade our systems and infrastructure to offer our customers and their subscribers enhanced services, capacity, features and functionality. The expansion of our systems and infrastructure will require us to commit substantial financial, operational and technical resources before the volume of our business rises, with no assurance that our revenues will grow. If our systems cannot be expanded in a timely manner to cope with increased traffic we could experience disruptions in service, lower customer and subscriber satisfaction and delays in the introduction of new services. Any of these problems could impair our reputation and cause our revenue to decline.
Our research and development investments may not lead to successful new services or enhancements.
We will continue to invest in research and development for the introduction of new enhancements to existing services designed to improve the capacity, data processing rates and features of our services. We must also continue to develop new features and to improve functionality of our platform based on specific customer requests and anticipated market needs. Research and development in the mobile data services industry, however, is complex, expensive and uncertain. We believe that we must continue to dedicate a significant amount of resources to research and development efforts to maintain our competitive position. If we continue to expend a significant amount of resources on research and development, but our efforts do not lead to the successful introduction of service enhancements that are competitive in the marketplace, there could be a material adverse effect on our business, operating results, financial condition and market share.
19
Table of Contents
Our solutions are complex and may take longer to develop than anticipated, and we may not recognize revenue from new service enhancements until after we have incurred significant development costs.
Most of our services must be tailored to meet customer specifications. In addition, our international customers often require significant customization of our platform to meet local needs. As a result, we often develop new features and enhancements to our existing services. These new features and enhancements often take substantial time to develop because of their complexity and because customer specifications sometimes change during the development cycle. We often do not recognize revenue from new services or enhancements until we have incurred significant development costs. In addition to delayed recognition of revenue from such new services and enhancements, our operating results will suffer if the new services or enhancements fail to meet our customers’ expectations.
We believe our long-term success depends, in part, on our ability to expand the sales of our services to customers located outside of the U.S. As a result, our business is susceptible to risks associated with international sales and operations.
In addition to the U.S., we currently operate in the United Kingdom, the Netherlands, Indonesia and Singapore, and we intend to expand our offering of mobile data services into a number of additional international markets in the near future. As a result, we are subject to the additional risks of conducting business outside the U.S., which may include:
| Ÿ | increased costs associated with localization of our services, including translations into foreign languages and adaptation to local practices and regulatory requirements; |
| Ÿ | longer accounts receivable payment cycles and difficulties in collecting accounts receivable; |
| Ÿ | difficulties managing and staffing international operations; |
| Ÿ | delays resulting from difficulty in obtaining export licenses, tariffs and other trade barriers and restrictions on export or import of technology; |
| Ÿ | less stringent intellectual property protections; |
| Ÿ | unexpected changes in, or impositions of, legislative, regulatory or tax requirements and burdens of complying with a wide variety of foreign laws and other factors beyond our control; |
| Ÿ | general geopolitical risks in connection with international operations, such as political, social and economic instability; |
| Ÿ | compliance with anti-corruption and bribery laws, including the Foreign Corrupt Practices Act of 1977; |
| Ÿ | changes in diplomatic, trade or business relationships; |
| Ÿ | foreign currency fluctuations that may substantially affect the dollar value of our revenue and costs in foreign markets; |
| Ÿ | foreign exchange controls that may prevent or limit our ability to repatriate income earned in foreign markets; and |
| Ÿ | increased financial accounting and reporting burdens. |
We have limited experience operating in foreign jurisdictions and are rapidly building our international operations. Operating in international markets requires significant management attention and financial resources. The investment and additional resources required to establish operations and manage growth in other countries may not produce desired levels of revenue or profitability.
20
Table of Contents
Our ability to use net operating and certain built-in losses to reduce future tax payments may be limited by provisions of the Internal Revenue Code, and may be subject to further limitation as a result of future transactions.
Sections 382 and 383 of the Internal Revenue Code of 1986, as amended, contain rules that limit the ability of a company that undergoes an ownership change, which is generally any change in ownership of more than 50% of its stock over a three-year period, to utilize its net operating loss and tax credit carryforwards and certain built-in losses recognized in the years after the ownership change. These rules generally operate by focusing on ownership changes involving stockholders who directly or indirectly own 5% or more of the stock of a company and any change in ownership arising from a new issuance of stock by the company. Generally, if an ownership change occurs, the yearly taxable income limitation on the use of net operating loss and tax credit carryforwards and certain built-in losses is equal to the product of the applicable long term tax exempt rate and the value of the company’s stock immediately before the ownership change. As a result, we may be unable to offset our taxable income with losses, or our tax liability with credits, before such losses and credits expire.
In addition, it is possible that future transactions (including issuances of new shares of our common stock and sales of shares of our common stock) will cause us to undergo one or more additional ownership changes. In that event, we generally would not be able to use our pre-change loss or certain built-in losses prior to such ownership change to offset future taxable income in excess of the annual limitations imposed by Sections 382 and 383 and those attributes already subject to limitations (as a result of our prior ownership changes) may be subject to more stringent limitations.
Our ability to sell our services is highly dependent on the quality of our support and services offerings, and our failure to offer high quality support and services would have a material adverse effect on our sales and results of operations.
Our customers depend on our support organization to resolve issues relating to our mCore service delivery platform. We believe that a high level of support is critical for the successful marketing and sale of our services and future enhancements to mCore. Failure to effectively assist our customers in deploying their mobile data portals and storefronts, quickly resolve post-deployment issues, and otherwise provide effective ongoing support would adversely affect our ability to sell our services to existing customers and could harm our reputation among potential customers. In addition, as we expand our operations internationally, our support organization will face additional challenges, including those associated with delivering support, training and documentation in languages other than English. As a result, our failure to maintain high quality support and services could have a material adverse effect on our business, operating results and financial condition.
We rely on the development of content and applications by third parties, and if wireless carriers and their subscribers do not find such content compelling, our sales could decline.
Our business is dependent on the availability of content and applications for mobile devices that wireless carriers and their subscribers find useful and compelling. A significant percentage of our revenue is derived from the sale of applications and content through storefronts and portals we operate for our wireless carrier customers. We also believe that demand for our services will increase as the number of applications and the volume of mobile content increases because our services facilitate the navigation and organization of large numbers of applications and large amounts of content. We do not develop applications or content; rather, we facilitate the sale and consumption of applications and content developed by third parties through our wireless carrier customers. If third-party developers fail to create content and applications that wireless carriers and their subscribers find useful and compelling, our sales would decline, and that would have a significant adverse effect on our business, operating results and financial condition.
21
Table of Contents
Our solutions may contain undetected software errors, which could harm our reputation and adversely affect our business.
Our solutions are highly technical and have contained and may contain undetected errors, defects or security vulnerabilities. Some errors in our solutions may only be discovered after a solution has been deployed and used by our wireless carrier customers. Any errors, defects or security vulnerabilities discovered in our solutions after commercial release could result in loss of revenue or delay in revenue recognition, loss of customers and increased service cost, any of which could adversely affect our business, operating results and financial condition. In addition, we could face claims for product liability, tort or breach of warranty. Defending a lawsuit, regardless of its merit, is costly and may divert management’s attention away from the business and adversely affect the market’s perception of us and our services. In addition, if our business liability insurance coverage is inadequate or future coverage is unavailable on acceptable terms or at all, our operating results and financial condition could be adversely impacted.
We may engage in acquisitions that could disrupt our business, cause dilution to our stockholders and harm our business, operating results or financial condition.
We expect to make selective domestic and international acquisitions of, and investments in, businesses that offer complementary products, services and technologies, augment our market coverage, and/or enhance our technological capabilities. We may also enter into strategic alliances or joint ventures to achieve these goals. We may not be able to identify suitable acquisition, investment, alliance, or joint venture opportunities or consummate any such transactions or relationships on terms and conditions acceptable to us. Such transactions or relationships that we enter into may not be successful. In addition, acquisitions and investments outside of the U.S. involve unique risks related to integration of operations across different cultures and languages, currency risks and the particular economic, political and regulatory risks associated with specific countries.
These transactions or any other acquisitions or dispositions involve risks and uncertainties, which may have a material adverse effect on our business. The integration of acquired businesses may not be successful and could result in disruption to other parts of our business. In addition, the integration may require that we incur significant restructuring charges. To integrate acquired businesses, we must implement our management information systems, operating systems and internal controls, and assimilate and manage the personnel of the acquired operations. The difficulties of the integrations may be further complicated by such factors as geographic distances, lack of experience operating in the geographic market or industry sector of the acquired business, delays and challenges associated with integrating the business with our existing businesses, diversion of management’s attention from daily operations of the business, potential loss of key employees and customers of the acquired business, the potential for deficiencies in internal controls at the acquired business, performance problems with the acquired business’ technology, difficulties in entering markets in which we have no or limited direct prior experience, exposure to unanticipated liabilities of the acquired business, insufficient revenues to offset increased expenses associated with the acquisition, and our ability to achieve the growth prospects and synergies expected from any such acquisition. Even when an acquired business has already developed and marketed products and services, there can be no assurance that product or service enhancements will be made in a timely fashion or that all pre-acquisition due diligence will have identified all possible issues that might arise with respect to such acquired assets.
Any acquisition may also cause us to assume liabilities, record goodwill and non-amortizable intangible assets that will be subject to impairment testing and potential impairment charges, incur amortization expense related to certain intangible assets, increase our expenses and working capital requirements, and subject us to litigation, which would reduce our return on invested capital. Failure to
22
Table of Contents
manage and successfully integrate the acquisitions we make could materially harm our business and operating results.
Any future acquisitions may require additional debt or equity financing, which in the case of debt financing, will increase our leverage and, in the case of equity financing, would be dilutive to our existing stockholders. Any decline in our perceived credit-worthiness associated with an acquisition could adversely affect our ability to borrow and result in more restrictive borrowing terms. As a result of the foregoing, we also may not be able to complete acquisitions or strategic transactions in the future to the same extent as in the past, or at all. These and other factors could harm our ability to achieve anticipated levels of profitability at acquired operations or realize other anticipated benefits of an acquisition, and could adversely affect our business, financial condition and results of operations.
If we fail to manage future growth effectively, our business could be harmed.
We have experienced, and expect to continue to experience, rapid growth. Our revenue from continuing operations grew from $17.9 million during the year ended December 31, 2005 to $119.5 million during the twelve months ended March 31, 2010. We also increased the number of our full-time employees from 272 at December 31, 2005 to 355 at March 31, 2010. This growth has placed significant demands on our management, operational and financial infrastructure. To manage growth effectively, we must continue to improve and enhance our managerial, operational and financial controls, and train and manage our employees, and expand our employee base. We must also manage new and existing relationships with customers, suppliers, business partners and other third parties. These activities will require significant expenditures and allocation of valuable management resources. If we fail to maintain the efficiency of our organization as we grow, our profit margins may decrease, and we may be unable to achieve our business objectives.
In recent years, we have recognized significant impairment losses related to our goodwill, intangible assets and property and equipment. Additional impairment losses may be recognized which would adversely affect our financial results.
We are required under GAAP to test goodwill for impairment annually and to assess our amortizable intangible assets and long-lived assets, as well as goodwill, for impairment when events or changes in circumstance indicate the carrying value may not be recoverable. Such impairment losses totaled $26.9 million, $29.1 million and $5.8 million in 2007, 2008 and 2009, respectively. Factors which have led to impairments in the past include changes in business strategy, restructuring of the business in connection with acquisitions, actual performance of acquired businesses below our expectations and expiration of customer contracts. Unanticipated events or changes in circumstances could impact our ability to recover the carrying value of some or all of these assets. In addition, we expect to make additional acquisitions in the future which would increase the amount of such assets on our books that would be subject to potential future impairment. In the event any of our current or future assets became impaired, the associated impairment charge could adversely impact our results of operations.
Our business involves the use, transmission and storage of confidential information, and the failure to properly safeguard such information could result in significant reputational harm and monetary damages.
Our business activities involve the use, transmission and storage of confidential information. We believe that we take commercially reasonable steps to protect the security, integrity and confidentiality of the information we collect and store, but there is no guarantee that inadvertent or unauthorized disclosure will not occur or that third parties will not gain unauthorized access to this information despite our efforts. If such unauthorized disclosure or access does occur, we may be required, under existing and proposed laws, to notify persons whose information was disclosed or accessed. We may
23
Table of Contents
also be subject to claims of breach of contract for such disclosure, investigation and penalties by regulatory authorities and potential claims by persons whose information was disclosed. The unauthorized disclosure of information may result in the termination of one or more of our commercial relationships and/or a reduction in customer confidence and usage of our services, which would have a material adverse effect on our business, operating results and financial condition.
We may be subject to liability for our use or distribution of information that we receive from third parties.
As part of our business, we obtain content and commercial information from third parties. When we distribute this information, we may be liable for the data contained in that information. There is a risk that we may be subject to claims related to the distribution of such content such as defamation, negligence, intellectual property infringement, violation of privacy or publicity rights and product or service liability, among others. Laws or regulations of certain jurisdictions may also deem some content illegal, which may expose us to additional legal liability. We also gather personal information from subscribers in order to provide personalized services. Gathering and processing this personal information may subject us to legal liability for, among other things, defamation, negligence, invasion of privacy and product or service liability. We are also subject to laws and regulations, both in the U.S. and abroad, regarding the collection and use of subscriber information. If we do not comply with these laws and regulations, we may be exposed to legal liability.
Some of the agreements by which we obtain content do not contain indemnity provisions in our favor. Even if a given contract does contain indemnity provisions, they may not cover a particular claim or type of claim or the party granting indemnity may not have the financial resources to cover the claim. Our insurance coverage may be inadequate to cover fully the amounts or types of claims that might be made. Any liability that we incur as a result of content we receive from third parties could adversely impact our results of operations.
Actual or perceived security vulnerabilities in mobile devices could negatively affect our business.
The security of mobile devices and wireless networks is critical to our business. Individuals or groups may develop and deploy viruses, worms and other malicious software programs that attack mobile devices and wireless networks. Security experts have identified computer worms targeted specifically at mobile devices. Security threats could lead some mobile subscribers to reduce or delay their purchases of mobile content and applications in an attempt to reduce the security threat posed by viruses, worms and other malicious software. Wireless carriers and device manufacturers may also spend more on protecting their wireless networks and mobile devices from attack, which could delay adoption of new mobile devices that tend to include more features and functionalities that facilitate increased use of mobile data services. Actual or perceived security threats, and reactions to such threats, could reduce our revenue or require unplanned expenditures on new security initiatives.
If we fail to maintain proper and effective internal controls or are unable to remediate the deficiencies in our internal controls, our ability to produce accurate and timely financial statements could be impaired and investors’ views of us could be harmed.
Ensuring that we have adequate internal financial and accounting controls and procedures in place so that we can produce accurate financial statements on a timely basis is a costly and time-consuming effort. Our internal control over financial reporting is a process designed to provide reasonable assurance regarding the reliability of financial reporting and the preparation of financial statements in accordance with GAAP. We are in the process of documenting and reviewing our internal controls and procedures. Beginning with fiscal year 2011, we will be required to comply with
24
Table of Contents
Section 404 of the Sarbanes-Oxley Act of 2002, or the Sarbanes-Oxley Act, which requires annual management assessment of the effectiveness of our internal control over financial reporting and a report by our independent auditors addressing this assessment. Our compliance with Section 404 will require that we incur additional expense and expend management time on compliance-related issues. If we or our independent registered public accounting firm identify deficiencies in our internal control over financial reporting that are deemed to be material weaknesses, the market’s confidence in our financial statements could decline and the market price of our common stock could be adversely impacted.
With respect to fiscal year 2007, we and our independent registered public accounting firm identified a material weakness in our internal controls over financial reporting. The material weakness related to insufficient personnel within our accounting function and inadequate accounting policies and procedures documentation. With respect to fiscal years 2008 and 2009, we and our independent registered public accounting firm identified significant deficiencies in our internal controls over financial reporting but they did not create a material weakness. While we have made efforts to improve our accounting policies and procedures, additional deficiencies and weaknesses may be identified. If material weaknesses or deficiencies in our internal controls exist and go undetected, our financial statements could contain material misstatements that, when discovered in the future could cause us to fail to meet our future reporting obligations and cause the price of our common stock to decline.
Claims by others that we infringe their intellectual property rights could force us to incur significant costs.
We cannot be certain that our services do not and will not infringe the intellectual property rights of others. Many parties in the telecommunications and software industries have begun to apply for and obtain patent protection for innovative proprietary technologies and business methods. Given that our platform interacts with various participants in the mobile data ecosystem, existing or future patents protecting certain proprietary technology and business methods may preclude us from using such proprietary technology or business methods, or may require us to pay damages for infringement or fees to obtain a license to use the proprietary technology or business methods (which may not be available or, if available, may be on terms that are unacceptable), or both, which would increase our cost of doing business. In addition, litigation concerning intellectual property rights and the infringement of those rights, including patents, trademarks and copyrights, has grown significantly over the last several years and is likely to grow further in the future. If we become the subject of infringement claims, we may be forced into litigation, which will require us to devote significant resources and management time and attention to defend against such infringement claims. If it is determined that our services infringe the intellectual property rights of a third party, we may be required to pay damages or enjoined from using that technology or forced to obtain a license (which may not be available or, if available, may be on terms that are unacceptable) and/or pay royalties to continue using that technology. The assertion of intellectual property infringement claims against our technology could have a material adverse effect on our business, operating results and financial condition.
Government regulation of the mobile industry is evolving, and unfavorable changes or our failure to comply with regulations could harm our business and operating results.
As the mobile industry continues to evolve, we believe greater regulation by federal, state or foreign governments or regulatory authorities becomes more likely. For example, we believe increased regulation is likely in the area of data privacy, and laws and regulations applying to the solicitation, collection, processing or use of personal or consumer information, could affect our customers’ ability to use and share data, potentially reducing our ability to utilize this information for the purpose of continued improvement of the overall mobile subscriber experience. In addition, any regulation of the requirement to treat all content and application provider services the same over the mobile Internet,
25
Table of Contents
sometimes referred to as net neutrality regulation, could reduce our customers’ ability to make full use of the value of our services. Further, taxation of services provided over the Internet or other charges imposed by government agencies or by private organizations to access the Internet may be imposed. Any regulation imposing greater fees for Internet use or restricting information exchange over the Internet could result in a decline in the use of the mobile Internet and the viability of mobile data service providers, which could harm our business and operating results. Finally, any further or more restrictive regulation of the ability of wireless carriers to include charges for goods and services in a mobile subscriber’s bill or their ability to offer up these capabilities to third parties, such as ourselves, on a bill-on-behalf-of basis could negatively impact our business.
Our use of open source software could limit our ability to commercialize our services.
We have incorporated open source software into our services. Although we closely monitor our use of open source software, the terms of many open source licenses to which we are subject have not been interpreted by U.S. or foreign courts, and there is a risk that such licenses could be construed in a manner that imposes unanticipated conditions or restrictions on our ability to commercialize our services. In that event, we could be required to seek licenses from third parties in order to continue offering our services, to re-engineer our products or to discontinue sales of our services, any of which could materially adversely affect our business.
Our failure to raise additional capital or generate the cash flows necessary to expand our operations and invest in our services could reduce our ability to compete successfully.
In the future, we may require additional amounts of capital to execute our business plan. We may require capital to complete planned upgrades and enhancements to our products and services, increase our investment in capital equipment to support new and existing customers, extend our marketing and sales efforts, expand internationally and make strategic acquisitions if attractive opportunities become available. Our future capital requirements will depend on many factors, including the time and cost of our service enhancements, the rate of mobile data subscriber growth, the acceptance rate of mobile devices as multi-functional computing platforms, the demand for wireless applications, the time and cost of successfully entering into new customer contracts and the amount of investment needed to achieve our sales and marketing objectives.
Based on our current cash balances and projected revenues, and taking into account the additional capital we expect to receive from this offering, we estimate that we will have sufficient capital to execute our near term business plans and maintain positive cash flow. However, this may not be the case. Further, we may not have sufficient capital to take advantage of opportunities for strategic acquisitions of significant complementary or competitive businesses that could enhance our business and operating results. If we raise additional equity financing, our stockholders may experience significant dilution of their ownership interests and the per share value of our common stock could decline. If we engage in debt financing, we may be required to accept terms that further restrict our ability to incur additional indebtedness and force us to maintain specified liquidity or other ratios. We may not be able to raise any additional capital that we may require on terms acceptable to us or at all. If we cannot obtain financing on commercially reasonable terms when needed, we may not be able to pursue some elements of our current strategy and business plan, and we may not be able to achieve our financial objectives.
26
Table of Contents
Risks Related to this Offering and Ownership of Our Common Stock
There is no established trading market for our common stock, and the market price of our common stock may be highly volatile or may decline regardless of our operating performance.
There has been no public market for our common stock prior to this offering. If you purchase shares of our common stock in this offering, you will pay a price that was not established in the public trading markets. The initial public offering price for our shares will be determined through negotiations among the underwriters, the selling stockholders and us. This initial public offering price may vary from the market price of our common stock following this offering. If you purchase shares of our common stock in this offering, you may not be able to resell your shares above the initial public offering price, and you may suffer a loss on your investment. In addition, an active trading market for our common stock following this offering may not develop or, if developed, may not be sustained. An inactive market may also impair our ability to raise capital to continue to fund operations by selling stock and may impair our ability to acquire other companies or assets by using our common stock as consideration.
Broad market and industry factors also may adversely affect the market price of our common stock, regardless of our actual operating performance. Factors that could cause wide fluctuations in the stock price may include, among other things:
| Ÿ | actual or anticipated variations in our financial condition and operating results; |
| Ÿ | overall conditions or trends in our industry; |
| Ÿ | addition or loss of significant customers; |
| Ÿ | competition from existing or new products; |
| Ÿ | changes in the market valuations of companies perceived by investors to be comparable to us; |
| Ÿ | announcements by us or our competitors of technological innovations, new services or service enhancements; |
| Ÿ | announcements by us or our competitors of significant acquisitions, strategic partnerships, divestitures or capital commitments; |
| Ÿ | announcements of investigations or regulatory scrutiny of our operations or lawsuits filed against us; |
| Ÿ | additions or departures of key personnel; |
| Ÿ | changes in the estimates of our operating results or changes in recommendations by any securities or industry analysts that elect to follow our common stock; and |
| Ÿ | sales of our common stock by us or our stockholders, including sales by our directors and officers. |
In addition, the stock market in general, and the market for technology companies in particular, has experienced extreme price and volume fluctuations that have often been unrelated or disproportionate to the operating performance of those companies. These broad market and industry fluctuations, as well as general economic, political and market conditions such as recessions, interest rate changes or international currency fluctuations, may negatively impact the market price of our common stock. These fluctuations may be even more pronounced in the trading market for our common stock immediately following this offering. In addition, in the past, following periods of volatility in the overall market and the market price of a particular company’s securities, securities class action litigation has often been instituted against these companies. We may be the target of this type of litigation in the future. Securities litigation, if instituted against us, could result in substantial costs and a diversion of our management’s attention and resources, whether or not we are successful in such litigation.
27
Table of Contents
Requirements associated with being a public company will increase our costs, as well as divert company resources and management’s attention, and affect our ability to attract and retain qualified board members and executive officers.
Prior to this offering, we have not been subject to the reporting requirements of the Securities Exchange Act of 1934, or the Exchange Act, or the other rules and regulations of the SEC or any securities exchange relating to public companies. We will comply with Section 404(a) (management’s report on financial reporting) under the Sarbanes-Oxley Act for the year ending December 31, 2010 and will comply with Section 404(b) (auditor’s attestation) no later than the year ending December 31, 2011. We are working with our legal, independent accounting, and financial advisors to identify those areas in which changes or enhancements should be made to our financial and management control systems to manage our growth and obligations as a public company. Some such areas include corporate governance, corporate control, internal audit, disclosure controls and procedures, and financial reporting and accounting systems. We have made, and will continue to make, changes in these and other areas. However, the expenses that will be required in order to prepare adequately for becoming a public company could be material. Compliance with the various reporting and other requirements applicable to public companies will also require considerable time and attention of management. We cannot predict or estimate the amount of the additional costs we may incur, the timing of such costs or the impact that our management’s attention to these matters will have on our business. In addition, the changes we make may not be sufficient to satisfy our obligations as a public company on a timely basis or at all.
In addition, being a public company could make it more difficult or more costly for us to obtain certain types of insurance, including directors’ and officers’ liability insurance, and we may be forced to accept reduced policy limits and coverage or incur substantially higher costs to obtain the same or similar coverage. The impact of these events could also make it more difficult for us to attract and retain qualified persons to serve on our board of directors, our board committees and our executive team.
Our principal stockholders may exert substantial influence over us and may exercise their control in a manner adverse to your interests.
Upon completion of this offering and assuming no exercise of an option to purchase additional shares by the underwriters, funds affiliated with Advanced Equities, Inc., Koala Holding LP and other entities affiliated with Carl C. Icahn, funds affiliated with Technology Crossover Ventures and New Enterprise Associates, Inc., will own 9,439,226, 4,529,888, 3,222,114 and 3,143,939 shares, respectively, or approximately 23.7%, 11.4%, 8.4% and 8.1%, respectively, of our outstanding common stock. Koala Holding LP owns substantially all of our outstanding shares of Series H preferred stock. Because a limited number of persons may exert substantial influence over us, transactions could be difficult or impossible to complete without the support of those persons. It is possible that these persons will exercise control over us in a manner adverse to your interests.
In our amended and restated certificate of incorporation, we renounce and provide for a waiver of the corporate opportunity doctrine as it relates to the funds affiliated with New Enterprise Associates, Inc., Technology Crossover Ventures, Koala Holding LP and any person or entity affiliated with these investors, we refer to all such persons as exempted persons. As a result, these exempted persons will have no fiduciary duty to present corporate opportunities to us. These exempted persons are in the business of making investments in companies and may, from time to time, acquire and hold interests in businesses that compete directly or indirectly with us. They may also pursue, for their own accounts, acquisition opportunities that may be complementary to our business, and, as a result, those acquisition opportunities may not be available to us. So long as these exempted persons continue to own a significant amount of our common stock, they will continue to be able to strongly influence or effectively control our decisions, including director and officer appointments, potential mergers or
28
Table of Contents
acquisitions, asset sales and other significant corporate transactions. These potential conflicts of interest could have a material adverse effect on our business, financial condition, results of operations or prospects if attractive corporate opportunities are directed by the exempted persons to themselves or their other affiliates instead of to us.
So long as 10% of the Series H preferred stock remains outstanding, without the consent of at least a majority of the then outstanding shares of Series H preferred stock, we may not, among other things, (i) amend or waive any provision of our certificate of incorporation or bylaws so as to affect the Series H preferred stock adversely; (ii) incur indebtedness other than with respect to (x) vendors, service providers, trade creditors, employees, independent contractors and equipment lessors, in each case, in the ordinary course of business, (y) intercompany indebtedness, and (z) indebtedness not to exceed $42 million outstanding under credit facilities; (iii) pay dividends or make certain stock repurchases; or (iv) issue capital stock ranking senior or pari passu to the Series H preferred stock. In addition, holders of our Series H preferred stock will have the right to designate two members to our board of directors. The Series H preferred stock will provide for cumulative dividends at a rate of 8% per annum, accruing daily from the date of the consummation of this offering, to be paid quarterly in additional shares of Series H preferred stock. The holders of Series H preferred stock will have one vote for each share of common stock into which such holders’ shares could then be converted at the time, and with respect to such vote, will have voting rights and powers equal to the voting rights and powers of the holders of our common stock. As long as the Series H preferred stock remains outstanding and receives dividends, the voting rights for holders of the Series H preferred stock will increase by approximately 2% every quarter.
For more information regarding ownership of our outstanding stock by our principal and selling stockholders and the rights associated with our Series H preferred stock, see the sections of this prospectus entitled “Principal and Selling Stockholders” and “Description of Capital Stock.”
Future sales of our common stock may cause our stock price to decline.
If our existing stockholders sell, or indicate an intention to sell, substantial amounts of our common stock in the public market following this offering, the market price of our common stock could decline. These sales might also make it more difficult for us to sell additional equity securities at a time and price that we deem appropriate. Based on 7,741,412 shares of common stock outstanding as of March 31, 2010, upon completion of this offering, we will have 38,592,617 shares of common stock outstanding (excluding 2,188,748 shares of common stock issuable upon the conversion of our Series H preferred stock as of March 31, 2010). Of these outstanding shares, all of the shares of our common stock sold in this offering will be freely tradable in the public market, except for any shares held by our affiliates as defined in Rule 144 of the Securities Act.
We, our directors and executive officers and substantially all of our stockholders, including the selling stockholders, have agreed with the underwriters, subject to certain exceptions, not to dispose of or hedge any shares of our common stock or any securities convertible into, or exercisable or exchangeable for, shares of our common stock for a period of 180 days from the date of this prospectus, which may be extended upon the occurrence of specified events, except with the prior written consent of J.P. Morgan Securities Inc. and Goldman, Sachs & Co. However, J.P. Morgan Securities Inc. and Goldman, Sachs & Co., in their sole discretion, may release any of the securities subject to these lock-up agreements at any time without notice.
After the expiration of the lock-up agreements and other contractual restrictions that prohibit transfers for at least 180 days after the date of this prospectus, up to 31,842,617 restricted securities may be sold into the public market in the future without registration under the Securities Act to the extent permitted under Rule 144. Of these restricted securities, approximately 20 million shares will be available for sale approximately 180 days after the date of this prospectus subject to volume or other
29
Table of Contents
limits under Rule 144. In addition, once the lock-up agreements and the other contractual restrictions expire, stockholders holding approximately 27 million shares of these restricted securities will have registration rights that could allow those holders to sell their shares freely through a future registration statement filed under the Securities Act. See the section of this prospectus entitled “Certain Relationships and Related Party Transactions—Registration Rights Agreement” for more information on these registration rights.
Furthermore, 1,986,288 shares of common stock reserved for issuance pursuant to stock options that will be outstanding immediately following the closing of this offering and 3,457,855 shares available for grant under our equity incentive plans following the closing of this offering, if issued or granted, will become eligible for sale in the public market once permitted by provisions of various vesting agreements, lock-up agreements and Rule 144, as applicable. We intend to file a registration statement on Form S-8 under the Securities Act to register approximately 6 million shares of our common stock for issuance under these equity incentive plans. For additional information, see the section of this prospectus entitled “Shares Eligible for Future Sale.” If these additional shares of common stock are, or if it is perceived that they will be, sold in the public market, the trading price of our common stock could decline.
Our historical financial statements may not be indicative of future performance.
In light of our acquisition of the mobile division of InfoSpace on December 28, 2007, our operating results only reflect the impact of the acquisition from that date, and therefore comparisons with prior periods are difficult. As a result, our limited historical financial performance as owners of the mobile division of InfoSpace may make it difficult for stockholders to evaluate our business and results of operations to date and to assess our future prospects and viability. Furthermore, our brief operating history has resulted in revenue and profitability growth rates that may not be indicative of our future results of operations. As a result, the price of our common stock may be volatile.
In addition, we exited two lines of business in 2007 and 2008, our direct to consumer business, which was sold in two transactions in 2007 and 2008, and a business we refer to as media and entertainment, which was discontinued in 2008. The loss from discontinued operations in the 2008 period includes losses from these discontinued businesses.
As a result of the foregoing factors, our historical results of operations are not necessarily indicative of the operating results to be expected in the future.
If securities or industry analysts do not publish research or reports about our business, if they adversely change their recommendations regarding our common stock, or if our operating results do not meet their expectations, our stock price and trading volume could decline.
The trading market for our common stock will be influenced by the research and reports that securities or industry analysts publish about us or our business. We do not have any control over these reports or analysts. If any of the analysts who cover our company downgrades our stock, or if our operating results do not meet the analysts’ expectations, our stock price could decline. Moreover, if any of these analysts ceases coverage of our company or fails to publish regular reports on our business, we could lose visibility in the financial markets, which in turn could cause our stock price and trading volume to decline.
We currently do not intend to pay dividends on our common stock and, as a result, your only opportunity to achieve a return on your investment is if the price of our common stock appreciates.
We have never declared or paid any dividends on our common stock and currently do not expect to declare or pay dividends on our common stock in the foreseeable future. Instead, we anticipate that all of
30
Table of Contents
our earnings in the foreseeable future will be used in the operation and growth of our business. Any determination to pay dividends in the future will be at the discretion of our board of directors. In addition, our ability to pay dividends on our common stock is currently limited by the covenants of our credit facility and may be further restricted by the terms of any future debt or preferred securities. Accordingly, your only opportunity to achieve a return on your investment in our company may be if the market price of our common stock appreciates and you sell your shares at a profit. The market price for our common stock may never exceed, and may fall below, the price that you pay for such common stock.
You will experience immediate and substantial dilution in the book value of your common stock as a result of this offering.
The initial public offering price of our common stock is considerably more than the pro forma, net tangible book value per share of our outstanding common stock. This reduction in the value of your equity is known as dilution. This dilution occurs in large part because our earlier investors paid substantially less than the initial public offering price when they purchased their shares. Investors purchasing common stock in this offering will incur immediate dilution of $11.56 in pro forma, net tangible book value per share of common stock, based on the assumed initial public offering price of $15.00 per share, which is the midpoint of the price range listed on the front cover page of this prospectus. In addition, following this offering, purchasers in the offering will have contributed 21.6% of the total consideration paid by our stockholders to purchase shares of common stock. The exercise of outstanding options and warrants and the conversion of our Series H preferred stock (including additional shares of Series H preferred stock paid as dividends to the holders of such Series H preferred stock after the consummation of this offering) into common stock will result in further dilution. For a further description of the dilution that you will experience immediately after this offering, see the section of this prospectus entitled “Dilution.” In addition, if we raise funds by issuing additional securities, the newly-issued shares will further dilute your percentage ownership of our company.
Our management will have broad discretion over the proceeds we receive in this offering and might not apply the proceeds in ways that increase the value of your investment.
Our management will have broad discretion to use our net proceeds from this offering, and you will be relying on their judgment regarding the application of these proceeds. Our management might not apply our net proceeds of this offering in ways that increase the value of your investment. We expect to use the net proceeds from this offering to fund investments in, or acquisitions of, complementary businesses, services or products. However, we currently have no commitments with respect to any such investments or acquisitions. In addition, we expect to use up to $1 million to pay a portion of the fees to be paid to Advanced Equities, Inc. for their advisory services provided to us in connection with this offering. Our management might not be able to yield a significant return, if any, on any investment of these net proceeds. You will not have the opportunity to influence our decisions on how to use our net proceeds from this offering.
Congress has enacted new legislation that affects the taxation of common stock held by or through foreign entities.
Recently enacted legislation generally will impose a withholding tax of 30% on dividend income from our common stock and the gross proceeds of a disposition of our common stock paid to certain foreign entities after December 31, 2012, unless the foreign entity complies with certain conditions or an exception applies. Please see “Material United States Federal Income Tax Considerations to Non-United States Holders—New Legislation Affecting Taxation of Common Stock Held By or Through Foreign Entities” for more information.
31
Table of Contents
SPECIAL NOTE REGARDING FORWARD-LOOKING STATEMENTS
This prospectus contains statements that do not directly or exclusively relate to historical facts. As a general matter, forward-looking statements reflect our current expectations and projections relating to our financial condition, results of operations, plans, objectives, future performance and business. We generally identify forward looking statements by terminology such as “outlook,” “believes,” “expects,” “potential,” “continues,” “may,” “will,” “should,” “seeks,” “approximately,” “predicts,” “intends,” “plans,” “estimates,” “anticipates,” or the negative version of those words or other comparable words, but the absence of these words does not necessarily mean that a statement is not forward-looking. Examples of forward-looking statements include, but are not limited to, statements we make regarding “our expectation that international revenue will increase in absolute dollars and as a percentage of our total revenue” and “our anticipated levels of capital expenditures during the next year.”
Any forward-looking statements contained in this prospectus are based upon our historical performance, current plans, estimates, expectations and other factors we believe are appropriate under the circumstances. The inclusion of this forward-looking information should not be regarded as a representation by us, the underwriters or any other person that the future plans, estimates or expectations contemplated by us will be achieved. Such forward-looking statements are subject to various risks and uncertainties and assumptions relating to our operations, financial results, financial condition, business prospects, growth strategy and liquidity. If one or more of these or other risks or uncertainties materialize, or if our underlying assumptions prove to be incorrect, our actual results may vary materially from those indicated in these statements.
The following uncertainties and factors, among others (including the factors described in the section entitled “Risk Factors” in this prospectus), could affect our future performance and cause actual results to differ materially from those expressed or implied by forward-looking statements:
| Ÿ | our expectations regarding our revenues, expenses and operations and our ability to sustain profitability; |
| Ÿ | our anticipated cash needs and our estimates regarding our capital requirements; |
| Ÿ | our ability to expand our customer base and relationships with wireless carriers and content and application providers; |
| Ÿ | our ability to expand our service offerings; |
| Ÿ | our anticipated growth strategies and sources of new revenues; |
| Ÿ | unanticipated trends and challenges in our business and the markets in which we operate; |
| Ÿ | our ability to recruit and retain qualified employees and staff our operations appropriately; |
| Ÿ | our ability to estimate accurately for purposes of preparing our consolidated financial statements; |
| Ÿ | our international expansion plans; |
| Ÿ | compliance with governmental regulations; and |
| Ÿ | our spending of the net proceeds from this offering. |
These factors should not be construed as exhaustive and should be read in conjunction with the other cautionary statements that are included in this prospectus.
Any forward-looking statement made by us in this prospectus speaks only as of the date on which it is made. Unless required by law, we do not undertake any obligation to update or review any
32
Table of Contents
forward-looking statement, whether as a result of new information, future developments or otherwise. You should, however, review the factors and risks we describe in the reports we will file from time to time with the Securities and Exchange Commission, after the date of this prospectus.
This prospectus contains statistical data that was derived from industry publications and reports, including the Yankee Group’s “Global Mobile Forecast,” December 2009; “Content Delivery Platforms: The Multimedia Service Delivery Vehicle,” February 2007; “North America ConnectedView Forecast,” March 2010; “Link Data: North America Mobile Carrier Monitor,” March 2010; “Link Data: Asia-Pacific Mobile Carrier Monitor,” March 2010; and “Link Data: Europe Mobile Carrier Monitor,” March 2010. In the fourth quarter of 2009, Yankee Group updated its Content Delivery Platform report and intends to issue the updated report in the first half of 2010. These industry publications generally indicate that they have obtained their information from sources believed to be reliable, but do not guarantee the accuracy and completeness of their information. Although we have not independently verified the data contained in these industry publications and reports, based on our industry experience we believe that the publications are reliable and the conclusions contained in the publications and reports are reasonable.
In addition, this prospectus contains statistical data on pages 78-79 from a custom report prepared by Yankee Group at our request. We have filed a consent from Yankee Group to use this information as an exhibit to this registration statement.
33
Table of Contents
We estimate that we will receive net proceeds of approximately $86.2 million from the sale of 6,750,000 shares of common stock in this offering at the assumed initial public offering price of $15.00 per share, the midpoint of the range set forth on the front cover page of this prospectus, after deducting underwriting commissions and discounts of $7.1 million and estimated expenses of $7.9 million. We will not receive any proceeds from the sale of shares by the selling stockholders. See “Principal and Selling Stockholders.”
A $1.00 increase (decrease) in the assumed initial public offering price of $15.00 per share, the midpoint of the range set forth on the front cover page of this prospectus, would increase (decrease) the net proceeds to us from this offering by $6.3 million, after deducting the estimated underwriting discounts and commissions and estimated offering expenses payable by us.
We plan to use the net proceeds of the offering to fund investments in, and acquisitions of, competitive and complementary businesses, products or technologies. We do not, however, have agreements or commitments for any specific investments or acquisitions at this time. In addition, we expect to use up to $1 million to pay a portion of the fees to be paid to Advanced Equities, Inc. for their advisory services provided to us in connection with this offering. One million dollars of the fee was paid previously. See “Certain Relationships and Related Party Transactions—Series F, G, H and I Financing Rounds.”
Pending use of the net proceeds from this offering, we intend to invest the remaining net proceeds in short-term, interest-bearing investment grade securities.
34
Table of Contents
We currently expect to retain future earnings, if any, for use in the operation and expansion of our business and do not intend to declare or pay any cash dividends on our common stock in the foreseeable future. Our ability to pay cash dividends on our common stock is limited by the covenants of our credit facility and may be further restricted by the terms of any future debt or preferred securities. See “Management’s Discussion and Analysis of Financial Condition and Results of Operations—Liquidity and Capital Resources—Credit Facility” and “Description of Capital Stock—Preferred Stock.”
35
Table of Contents
The following table sets forth our cash and cash equivalents and capitalization as of March 31, 2010:
| Ÿ | on an actual basis; and |
| Ÿ | on a pro forma, as adjusted, basis to give effect to: |
| Ÿ | the sale by us of 6,750,000 shares of our common stock at an assumed initial public offering price of $15.00 per share, the midpoint of the range set forth on the front cover page of this prospectus, after deducting underwriting discounts and commissions and estimated offering expenses payable by us; |
| Ÿ | the conversion of 247,111,155 shares of our preferred and redeemable preferred stock (other than shares of Series H preferred stock) to 18,343,903 common shares at fixed conversion rates; |
| Ÿ | the conversion of 64,102,881 shares of our redeemable preferred stock to 5,757,302 common shares based on an assumed initial public offering price of $15.00 per share, the midpoint of the range set forth on the front cover page of this prospectus; |
| Ÿ | the reclassification of the redeemable preferred stock warrant liability to additional paid-in capital; and |
| Ÿ | the recording of approximately $16.3 million stock-based compensation expense due to the vesting of restricted stock triggered by the closing of this offering. |
You should read the following table in conjunction with our consolidated financial statements and related notes, “Selected Historical Consolidated Financial Data” and “Management’s Discussion and Analysis of Financial Condition and Results of Operations,” included elsewhere in this prospectus.
| As of March 31, 2010 | ||||||||
| Actual | Pro Forma, As Adjusted(1) |
|||||||
| (Unaudited) | ||||||||
| (In millions) | ||||||||
| Cash and cash equivalents |
$ | 25.4 | $ | 113.4 | ||||
| Debt: |
||||||||
| Current portion of long-term debt |
$ | — | $ | — | ||||
| Long-term debt, less current portion |
— | — | ||||||
| Total debt |
— | — | ||||||
| Redeemable preferred stock, $0.001 par value; 334,793,787 shares authorized, 324,959,604 shares issued and outstanding, actual, 40,000,000 shares authorized, 21,084,337 shares issued and outstanding, pro forma as adjusted |
423.6 | 51.0 | ||||||
| Stockholders’ equity (deficit) |
||||||||
| Preferred stock, $0.001 par value; 7,613,944 shares authorized, 7,338,769 shares issued and outstanding, actual, 310,000,000 shares authorized, no shares issued and outstanding, pro forma as adjusted |
17.4 | — | ||||||
| Common stock, $0.001 par value; 625,000,000 shares authorized, 7,741,412 shares issued and outstanding, actual, 625,000,000 shares authorized, 38,592,617 shares issued and outstanding, pro forma as adjusted |
0.1 | 0.2 | ||||||
| Additional paid-in capital |
— | 497.8 | ||||||
| Accumulated deficit |
(313.7 | ) | (330.0 | ) | ||||
| Accumulated other comprehensive income |
— | — | ||||||
| Total stockholders’ equity (deficit) |
(296.2 | ) | 168.0 | |||||
| Total capitalization |
$ | 127.4 | $ | 219.0 | ||||
36
Table of Contents
| (1) | Each $1.00 increase (decrease) in the assumed initial public offering price of $15.00 per share would increase (decrease), respectively, the amount of additional paid-in capital, total stockholders’ equity (deficit) and total capitalization by approximately $6.3 million, assuming the number of shares offered by us, as set forth on the front cover page of this prospectus, remains the same and after deducting the estimated underwriting discounts and commissions and estimated offering expenses payable by us. |
The outstanding share information set forth above is as of March 31, 2010 and:
| Ÿ | excludes 1,178,706 shares of common stock issuable upon the exercise of stock options, at a weighted average exercise price of $10.67 per share and 1,471,567 shares of our common stock reserved for future grants under our 2004 Stock Incentive Plan; |
| Ÿ | excludes 1,986,288 shares of our common stock reserved for future grants under our 2010 Long Term Incentive Plan, 333,333 shares of common stock issuable upon the exercise of options granted under this plan at an exercise price of $20.40 that will be outstanding at the consummation of this offering and 446,000 shares of common stock issuable upon the exercise of options with an exercise price equal to the public offering price that will be granted under this plan and will be outstanding at the consummation of this offering; |
| Ÿ | excludes 2,973,911 shares of common stock issuable upon the exercise of warrants to purchase shares of common stock, at a weighted average exercise price of $16.23; |
| Ÿ | excludes 594,639 shares of common stock issuable upon the exercise of warrants to purchase 8,919,591 shares of Series I redeemable preferred stock at an exercise price of $0.97 that upon consummation of this offering will represent warrants to purchase shares of common stock at an exercise price of $14.54 per share; |
| Ÿ | excludes a total of 33,154 shares of common stock issuable upon the exercise of warrants to purchase a combined 292,198 shares of Series A and B redeemable preferred stock (convertible into 13,676 shares of common stock) and 19,478 shares of common stock that upon consummation of this offering will represent warrants to purchase shares of common stock at a combined weighted average exercise price of $3.26 per share. The common stock issuable upon conversion of the Series A and B redeemable preferred stock at the consummation of this offering has been determined using an assumed initial public offering price of $15.00 per share, the midpoint of the price range shown on the front cover page of this prospectus; and |
| Ÿ | excludes 2,188,748 shares of common stock issuable upon the conversion of our Series H preferred stock. |
37
Table of Contents
As of March 31, 2010, our net tangible book value was $41.3 million or $5.34 per share of common stock. If you invest in our common stock, your investment will be diluted immediately to the extent of the difference between the public offering price per share of our common stock and the pro forma net tangible book value per share of our common stock after this offering. Our pro forma net tangible book value as of March 31, 2010 was approximately $46.6 million, or $1.46 per share of common stock. Pro forma net tangible book value per share represents the amount of our total tangible assets, less our total liabilities, divided by the number of shares of common stock outstanding as of March 31, 2010, after giving effect to the conversion of all outstanding shares of our redeemable preferred stock and preferred stock, other than Series H, into 24,101,205 shares of common stock immediately prior to the closing of this offering and a 15-for-1 reverse stock split of our common stock expected to be approved by our stockholders and effected prior to the effective date of the registration statement of which this prospectus is a part.
Net tangible book value dilution per share to new investors represents the difference between the amount per share paid by purchasers of shares of common stock in this offering and the pro forma net tangible book value per share of common stock immediately after the completion of this offering. After giving effect to our sale of shares of common stock in this offering at the initial public offering price of $15.00 per share and deducting the underwriting discounts and commissions and estimated offering expenses payable by us, our pro forma net tangible book value as of March 31, 2010 would have been $132.9 million, or $3.44 per share. This represents an immediate increase in net tangible book value of $1.98 per share to existing stockholders and an immediate dilution in net tangible book value of $11.56 per share to investors purchasing common stock in this offering, as illustrated by the following table:
| Initial public offering price per share |
$ | 15.00 | |
| Pro forma net tangible book value per share prior to this offering as of March 31, 2010 |
1.46 | ||
| Increase in pro forma net tangible book value per share attributable to investors purchasing shares in this offering |
1.98 | ||
| Pro forma net tangible book value per share after this offering |
3.44 | ||
| Dilution in pro forma net tangible book value per share to new investors |
$ | 11.56 | |
A $1.00 increase (decrease) in the assumed initial public offering price of $15.00 per share, the midpoint of the price range set forth on the front cover page of this prospectus, would increase (decrease) our pro forma net tangible book value after this offering by $6.3 million, our pro forma net tangible book value per share after this offering by $0.19 per share, and the dilution to new investors in this offering by $0.81 per share, assuming the number of shares of common stock offered by us, as set forth on the front cover page of this prospectus, remains the same and after deducting the estimated underwriting discounts and commissions and offering expenses payable by us.
38
Table of Contents
The following table summarizes, on the same pro forma basis as of March 31, 2010, the differences between the existing stockholders and the new stockholders in this offering with respect to the number of shares purchased from us, the total consideration paid, and the average price per share paid before deducting the underwriting discounts and commissions and estimated offering expenses payable by us. The calculations, with respect to shares purchased by new investors in this offering, reflect an assumed initial public offering price of $15.00 per share, the midpoint of the price range set forth on the front cover page of this prospectus.
| Shares Purchased | Total Consideration | Average Price Per Share | ||||||||||||
| Number | Percentage | Amount (in millions) |
Percentage | |||||||||||
| Existing stockholders |
31,842,617 | 82.5 | % | $ | 366.6 | 78.4 | % | $ | 11.51 | |||||
| New investors |
6,750,000 | 17.5 | 101.3 | 21.6 | $ | 15.00 | ||||||||
| Total |
38,592,617 | 100.0 | % | $ | 467.9 | 100.0 | % | |||||||
If the underwriters’ option to purchase additional shares is exercised in full, sales by the selling stockholders in this offering will cause the number of shares owned by existing stockholders to be reduced to 30,830,117 shares or approximately 79.9% of the total number of shares of our common stock outstanding after this offering.
A $1.00 increase (decrease) in the assumed initial public offering price of $15.00 per share, the midpoint of the price range set forth on the front cover page of this prospectus, would increase (decrease) total consideration paid by new investors in this offering and by all investors by $6.8 million and would increase (decrease) the percentage of total consideration paid by new investors to 22.8% before deducting the estimated underwriting discounts and commissions and offering expenses payable by us in connection with this offering.
To the extent any outstanding options and warrants are exercised, new investors will experience further dilution. From the date of consummation of this offering, the outstanding Series H preferred stock will receive cumulative dividends at a rate of 8% per annum, accruing daily, to be paid quarterly in additional shares of Series H preferred stock. As a result, upon the conversion of our Series H preferred stock into common stock, new investors will experience further dilution.
If all stock options and warrants to purchase shares of our common stock with exercise prices less than the initial public offering price are exercised, the number of shares held by existing stockholders will increase to 36,247,252 shares of our common stock, or 84.3% of the total number of shares of our common stock outstanding after this offering.
If all shares of our Series H preferred stock outstanding as of March 31, 2010 are converted into common stock, the number of shares held by existing stockholders will increase to 34,031,365 shares of our common stock, or 83.4% of the total number of shares of our common stock outstanding after this offering.
The outstanding share information set forth in the table above is as of March 31, 2010 and:
| Ÿ | excludes 1,178,706 shares of common stock issuable upon the exercise of stock options, at a weighted average exercise price of $10.67 per share and 1,471,567 shares of our common stock reserved for future grants under our 2004 Stock Incentive Plan; |
| Ÿ | excludes 1,986,288 shares of our common stock reserved for future grants under our 2010 Long Term Incentive Plan, 333,333 shares of common stock issuable upon the exercise of options granted under this plan at an exercise price of $20.40 that will be outstanding at the |
39
Table of Contents
| consummation of this offering and 446,000 shares of common stock issuable upon the exercise of options with an exercise price equal to the public offering price that will be granted under this plan and will be outstanding at the consummation of this offering; |
| Ÿ | excludes 2,973,911 shares of common stock issuable upon the exercise of warrants to purchase shares of common stock, at a weighted average exercise price of $16.23; |
| Ÿ | excludes 594,639 shares of common stock issuable upon the exercise of warrants to purchase 8,919,591 shares of Series I redeemable preferred stock at an exercise price of $0.97 that upon consummation of this offering will represent warrants to purchase shares of common stock at an exercise price of $14.54 per share; |
| Ÿ | excludes a total of 33,154 shares of common stock issuable upon the exercise of warrants to purchase a combined 292,198 shares of Series A and B redeemable preferred stock (convertible into 13,676 shares of common stock) and 19,478 shares of common stock, respectively, that upon consummation of this offering will represent warrants to purchase shares of common stock at a combined weighted average exercise price of $3.26 per share. The common stock issuable upon conversion of the Series A and B redeemable preferred stock at the consummation of this offering has been determined using an assumed initial public offering price of $15.00 per share, the midpoint of the price range shown on the front cover page of this prospectus; and |
| Ÿ | excludes 2,188,748 shares of common stock issuable upon the conversion of our Series H preferred stock. |
40
Table of Contents
SELECTED HISTORICAL CONSOLIDATED FINANCIAL DATA
The selected historical consolidated financial data set forth below as of December 31, 2008 and 2009 and for the years ended December 31, 2007, 2008 and 2009 have been derived from our audited consolidated financial statements included elsewhere in this prospectus. The selected historical financial data as of December 31, 2007 and for the year ended December 31, 2006 have been derived from our audited consolidated financial statements not included in this prospectus. The selected historical financial data as of December 31, 2005 and 2006 and for the year ended December 31, 2005 have been derived from our unaudited consolidated financial statements not included in this prospectus. In light of our acquisition of InfoSpace Mobile, on December 28, 2007, our financial statements only reflect the impact of that acquisition since that date, and therefore comparisons with prior periods are difficult.
The selected consolidated financial data as of and for the three months ended March 31, 2009 and 2010 have been derived from our unaudited consolidated financial statements included elsewhere in this prospectus. The results of operations for the three months ended March 31, 2010 are not necessarily indicative of the operating results to be expected for the full fiscal year.
The unaudited information was prepared on a basis consistent with that used in preparing our audited consolidated financial statements and includes all adjustments, consisting of normal recurring adjustments, which are necessary for a fair presentation of our financial position, results of operations and cash flows for the unaudited periods.
The following selected consolidated financial data is not necessarily indicative of the results of future operations and should be read in conjunction with “Management’s Discussion and Analysis of Financial Condition and Results of Operations,” and our consolidated financial statements and related notes included elsewhere in this prospectus.
41
Table of Contents
| Years Ended December 31, | Three Months Ended March 31, |
|||||||||||||||||||||||||||
| 2005 | 2006 | 2007 | 2008 | 2009 | 2009 | 2010 | ||||||||||||||||||||||
| (Unaudited) | (Unaudited) |
|||||||||||||||||||||||||||
| (In thousands, except per share data) |
||||||||||||||||||||||||||||
| Condensed Consolidated Statement of Operations Data: |
||||||||||||||||||||||||||||
| Total revenues |
$ | 17,875 | $ | 21,903 | $ | 35,171 | $ | 103,151 | $ | 113,695 | $ | 23,276 | $ | 29,080 | ||||||||||||||
| Operating expenses |
||||||||||||||||||||||||||||
| Direct third-party expenses |
3,797 | 2,201 | 3,709 | 5,451 | 9,485 | 1,171 | 1,305 | |||||||||||||||||||||
| Datacenter and network operations(1) |
2,625 | 9,561 | 9,468 | 33,000 | 31,786 | 8,683 | 8,034 | |||||||||||||||||||||
| Product development and sustainment(1) |
8,190 | 24,617 | 16,229 | 52,261 | 31,389 | 7,677 | 8,182 | |||||||||||||||||||||
| Sales and marketing(1) |
8,717 | 8,403 | 7,119 | 10,228 | 11,900 | 2,989 | 3,655 | |||||||||||||||||||||
| General and administrative(1) |
9,632 | 11,239 | 10,334 | 26,052 | 20,841 | 5,175 | 5,264 | |||||||||||||||||||||
| Depreciation and amortization(1) |
2,997 | 5,925 | 10,322 | 21,559 | 13,208 | 3,777 | 3,041 | |||||||||||||||||||||
| Restructuring(2) |
180 | 1,084 | 1,283 | 3,236 | 2,058 | 235 | 407 | |||||||||||||||||||||
| Goodwill and long-lived asset impairment charges(3) |
— | — | 26,867 | 29,130 | 5,806 | — | — | |||||||||||||||||||||
| Abandoned transaction charge(4) |
— | — | 2,600 | — | — | — | — | |||||||||||||||||||||
| Total operating expenses |
36,138 | 63,030 | 87,931 | 180,917 | 126,473 | 29,707 | 29,888 | |||||||||||||||||||||
| Operating loss |
(18,263 | ) | (41,127 | ) | (52,760 | ) | (77,766 | ) | (12,778 | ) | (6,431 | ) | (808 | ) | ||||||||||||||
| Other income (expense), net |
124 | (1,110 | ) | 1,155 | 2,714 | (1,627 | ) | (96 | ) | (258 | ) | |||||||||||||||||
| Loss from continuing operations, before income tax |
(18,139 | ) | (42,237 | ) | (51,605 | ) | (75,052 | ) | (14,405 | ) | (6,527 | ) | (1,066 | ) | ||||||||||||||
| Provision for income taxes |
— | — | — | 1,776 | 1,896 | 444 | 467 | |||||||||||||||||||||
| Loss from continuing operations |
(18,139 | ) | (42,237 | ) | (51,605 | ) | (76,828 | ) | (16,301 | ) | (6,971 | ) | (1,533 | ) | ||||||||||||||
| Cumulative effect of accounting change |
(235 | ) | — | — | — | — | — | — | ||||||||||||||||||||
| Loss from discontinued operations(5) |
(4,081 | ) | (12,960 | ) | (24,928 | ) | (1,072 | ) | — | — | — | |||||||||||||||||
| Loss from sale of discontinued operations(5) |
— | — | (1,360 | ) | (127 | ) | — | — | — | |||||||||||||||||||
| Net loss |
(22,455 | ) | (55,197 | ) | (77,893 | ) | (78,027 | ) | (16,301 | ) | (6,971 | ) | (1,533 | ) | ||||||||||||||
| Accretion of redeemable preferred stock and Series D1 preferred dividends |
(2,784 | ) | (5,942 | ) | (8,095 | ) | (22,427 | ) | (23,956 | ) | (5,987 | ) | (6,400 | ) | ||||||||||||||
| Net loss attributable to common stockholders |
$ | (25,239 | ) | $ | (61,139 | ) | $ | (85,988 | ) | $ | (100,454 | ) | $ | (40,257 | ) | $ | (12,958 | ) | $ | (7,933 | ) | |||||||
| Net loss per share attributable to common stockholders – basic and diluted |
||||||||||||||||||||||||||||
| Continuing operations |
$ | (3.79 | ) | $ | (8.42 | ) | $ | (10.30 | ) | $ | (16.99 | ) | $ | (6.85 | ) | $ | (2.20 | ) | $ | (1.38 | ) | |||||||
| Discontinued operations |
(0.73 | ) | (2.26 | ) | (4.54 | ) | (0.20 | ) | — | — | — | |||||||||||||||||
| Total net loss per share attributable to common stockholders |
$ | (4.52 | ) | $ | (10.68 | ) | $ | (14.84 | ) | $ | (17.19 | ) | $ | (6.85 | ) | $ | (2.20 | ) | $ | (1.38 | ) | |||||||
| Weighted average common shares outstanding – basic and diluted (6) |
5,583 | 5,726 | 5,796 | 5,843 | 5,878 | 5,887 | 5,753 | |||||||||||||||||||||
| Pro forma net loss attributable to holders of common stock (unaudited)(6) |
$ | (31,245 | ) | $ | (17,815 | ) | ||||||||||||||||||||||
| Pro forma basic and fully diluted net loss per share (unaudited)(6) |
$ | (0.84 | ) | $ | (0.48 | ) | ||||||||||||||||||||||
| Weighted average number of shares of common stock used in computing pro forma basic and fully diluted net loss per share (unaudited)(6) |
37,106 | 37,468 | ||||||||||||||||||||||||||
| Consolidated Balance Sheet Data: | (Unaudited) | (Unaudited) | ||||||||||||||||||||||||||
| Cash and cash equivalents |
$ | 21,958 | $ | 6,143 | $ | 67,418 | $ | 14,299 | $ | 35,945 | $ | 11,730 | $ | 25,408 | ||||||||||||||
| Working capital |
17,688 | 5,769 | 74,478 | 30,698 | 28,303 | 26,441 | 23,459 | |||||||||||||||||||||
| Total assets |
68,611 | 114,599 | 289,391 | 195,447 | 174,176 | 182,844 | 161,518 | |||||||||||||||||||||
| Total long-term debt and capital lease obligations, less current portion |
4,031 | 5,344 | 16,295 | 3,234 | — | 2,389 | — | |||||||||||||||||||||
| Total redeemable preferred stock |
77,450 | 164,037 | 372,406 | 394,135 | 417,396 | 399,951 | 423,624 | |||||||||||||||||||||
| Total stockholders’ deficit |
(30,084 | ) | (88,142 | ) | (152,510 | ) | (249,867 | ) | (288,821 | ) | (261,916 | ) | (296,162 | ) | ||||||||||||||
42
Table of Contents
| (1) | Depreciation and amortization is not included in each respective operating expense category. The allocation by function is as follows: |
| Years Ended December 31, | Three Months Ended March 31, | ||||||||||||||||||||
| 2005 | 2006 | 2007 | 2008 | 2009 | 2009 | 2010 | |||||||||||||||
| (Unaudited) | (Unaudited) | ||||||||||||||||||||
| (In thousands) |
|||||||||||||||||||||
| Datacenter and network operations |
$ | 487 | $ | 2,938 | $ | 7,310 | $ | 16,824 | $ | 8,890 | $ | 2,497 | $ | 1,992 | |||||||
| Product development and sustainment |
— | 1,462 | 1,548 | 2,237 | 1,962 | 586 | 428 | ||||||||||||||
| Sales and marketing |
— | 4 | 307 | 2,075 | 1,960 | 572 | 524 | ||||||||||||||
| General and administrative |
2,510 | 1,521 | 1,157 | 423 | 396 | 122 | 97 | ||||||||||||||
| Depreciation and amortization |
$ | 2,997 | $ | 5,925 | $ | 10,322 | $ | 21,559 | $ | 13,208 | $ | 3,777 | $ | 3,041 | |||||||
| (2) | Our restructuring charges relate to costs associated with closing and relocating facilities, relocating certain key employees and severance costs following the acquisition of InfoSpace Mobile. See “Management’s Discussion and Analysis of Financial Condition and Results of Operations” for further details. |
| (3) | The impairments in 2008 and 2009 relate primarily to integration activities following our acquisition of InfoSpace Mobile in December 2007 and to certain non-core operating assets. The 2007 impairments relate to goodwill due primarily to changes in consumer purchase habits. See “Management’s Discussion and Analysis of Financial Condition and Results of Operations” for further details. |
| (4) | In 2007, we issued a warrant to purchase common stock to an affiliate of an existing investor as a fee for providing a financing commitment in connection with a proposed transaction that was not completed. |
| (5) | In connection with a business strategy reassessment initiated in 2007, we exited the direct to consumer and media and entertainment businesses at various times during 2007 and 2008. |
| (6) | See Note 13 to our consolidated financial statements for a description of the method used to compute basic and diluted net loss per share attributable to common stockholders and pro forma basic and diluted net loss per share attributable to common stockholders. |
43
Table of Contents
MANAGEMENT’S DISCUSSION AND ANALYSIS OF
FINANCIAL CONDITION AND RESULTS OF OPERATIONS
The following discussion and analysis of our financial condition and results of operations should be read in conjunction with our consolidated financial statements and related notes included elsewhere in this prospectus. In addition to historical consolidated financial information, the following discussion contains forward-looking statements that reflect our plans, estimates and opinions. Our actual results could differ materially from those discussed in the forward-looking statements. Factors that could cause or contribute to these differences include those discussed below and elsewhere in this prospectus, particularly in “Risk Factors.”
Overview
We are a leading provider of mobile data solutions and services that enable wireless carriers to deliver high value mobile data services to their subscribers. We provide a comprehensive suite of hosted, managed service offerings, including mobile web portal, storefront, messaging, and billing support and settlement, which enables wireless carriers to deliver customized, carrier-branded mobile data services to their wireless subscribers. Our mCore service delivery platform provides the tools for mobile subscribers to easily locate and access personally relevant and location-based content and services, engage in social networking and download content and applications. We also leverage our data-rich insights into subscriber behavior and our user interface expertise to provide a highly personalized subscriber experience and targeted mobile marketing solutions. Our mCore platform provides mobile subscribers with access to over 30 million unique pieces of third-party content or applications that we optimize for delivery to over 2,000 different mobile phone models, ranging from entry level feature phones to smartphones. Since 2005, Motricity has generated over $2.5 billion in gross revenue for our carrier customers through the sale of content and applications and powered over 50 billion page views through access to the mobile Internet. For the year ended December 31, 2009, we generated revenue of $113.7 million and incurred a net loss of $16.3 million. For the three months ended March 31, 2010, we generated revenue of $29.1 million and incurred a net loss of $1.5 million. We have access to over 200 million mobile subscribers through our U.S. wireless carrier customers, and we currently provide mobile data services to approximately 35 million of these subscribers monthly.
The majority of our revenue consists of managed services revenue, charged on a monthly basis to our wireless carrier and other customers under contracts with initial terms ranging from one to three years in duration. Managed services revenue consists of fees we charge to manage, host and support our solutions and to provide other related services to our customers, and includes both fixed fees and variable, activity-based charges. In addition, we charge professional service fees to customize, implement, and enhance our solutions. Our wireless carrier customers include the five largest providers in the U.S., by number of subscribers. Revenue from these customers accounted for 84% of our total revenue for the year ended December 31, 2009, with AT&T and Verizon Wireless accounting for 53% and 20% of total revenue, respectively. Revenue from these five customers accounted for 90% of our total revenue for the three months ended March 31, 2010, with AT&T and Verizon Wireless accounting for 40% and 39% of that revenue, respectively. In addition to wireless carriers, our customers include content and application providers. We generated approximately 95% and 96% of our total revenue in the U.S. during the year ended December 31, 2009 and the three months ended March 31, 2010, respectively. As we pursue expansion opportunities with international wireless carriers, we expect international revenue to increase in absolute dollars and as a percentage of our total revenue.
We expect our growth to be heavily dependent upon our ability to maintain strong relationships with 4 of the top 10 global wireless carriers, which represent our largest customers, as well as our ability to develop new relationships with wireless carriers in developed and emerging markets, such as Southeast Asia, India and Latin America. In addition, we expect our growth to depend upon the increased adoption of our mCore service delivery platform by our customers and an increase in the
44
Table of Contents
activity conducted on our platform by our customers’ subscribers. The failure of any of our significant carrier customers to renew existing contracts on favorable terms, such as Verizon Wireless, which has a contract up for renewal in 2010 that represents all of our 2009 revenue from Verizon, and AT&T, which has a contract up for renewal in 2010 that represents 23% of our 2009 revenue from AT&T, would have a material adverse impact on our results of operations and future growth prospects. Our ability to achieve and sustain profitability will be affected as we incur additional expenses to expand our sales, marketing, development and general and administrative capabilities. As we establish and expand our operational capabilities internationally, we will incur additional operating expenses and capital-related costs.
We were founded in 2001 with a mission to develop a mobile data services business, and our strategy has evolved as the mobile data services industry has developed and expanded. We focused originally on Palm-based technology and related solutions which dominated the mobile data services market before wireless data services based on cellular telephony technology were developed and widely deployed by the wireless carriers. As the wireless data services market has developed we expanded the scope and nature of our data services to support wireless carriers and their subscribers. Since 2003, we have completed eight acquisitions as part of the process of developing and expanding our mobile services business. These included initial acquisitions of companies primarily engaged in the Palm-based data services market and subsequent acquisitions of companies engaged in the wireless data services market, as the wireless carriers and handset manufacturers came to dominate the mobile data services market. In December 2007, in our largest acquisition to date, we acquired the assets of the mobile division of InfoSpace, Inc., which we refer to as InfoSpace Mobile, a competing provider of mobile content solutions and services for the wireless industry. Due to the rapidly evolving nature of the mobile data services market and changes in our business strategy over time, in each of the last several years we have recognized impairment charges related to both acquired and internally developed assets. In addition, we have exited our direct to consumer and media and entertainment businesses, which are reflected as discontinued operations in our consolidated financial statements. These discontinued businesses include our original mobile data services business and several of our earlier acquisitions. As a consequence of the rapidly evolving nature of our business and our limited operating history, we believe that period-to-period comparisons of revenue and operating results are not necessarily meaningful and should not be relied upon as indications of future performance.
The InfoSpace Mobile Acquisition and Business Strategy Realignment
In December 2007, we acquired InfoSpace Mobile for a cash purchase price of $135 million and the assumption of certain liabilities. The acquisition was a key element in the broad strategic realignment of our business. We viewed InfoSpace Mobile as a competing provider of mobile content solutions and services for the wireless industry that had strong relationships with several large wireless carriers. Through its mCore platform, InfoSpace Mobile offered many of the same services we provided to our customers through our then existing platform, called Fuel. InfoSpace Mobile also operated a large development organization, with an emphasis on professional services work. In the acquisition, in addition to acquiring the mCore platform and a number of leased U.S. datacenter facilities, we acquired a 224-person employee base, additional contracts with certain new and pre-existing customers, including AT&T and Verizon Wireless, and the Bellevue, Washington office facilities that we now use as our corporate headquarters. We financed the acquisition through the issuance of $177.3 million of Series I redeemable preferred stock and warrants.
Since completing the InfoSpace Mobile acquisition, we have significantly restructured our business. Due to the similar capabilities and features of the mCore and Fuel platforms, we conducted an evaluation of the mCore and Fuel platforms and concluded that it would be inefficient to continue managing and developing two incompatible technologies. As a result, we elected to phase out our legacy Fuel platform and began migrating our customers to an enhanced version of the acquired
45
Table of Contents
mCore platform. In 2008, we moved our headquarters from Durham, North Carolina to Bellevue, Washington. In mid-2008, we adopted several business initiatives to increase the operating efficiencies of the combined business, including eliminating redundant positions and functions, outsourcing a portion of our development activities to India and consolidating our network operations into five datacenters. In addition, we have more recently begun to move our business focus toward the sale of comprehensive managed services solutions, utilizing our more standardized architecture, and to de-emphasize the more highly customized, professional services intensive approach. We believe that this evolution of our business strategy will accelerate innovation in our service offerings for the benefit of our wireless carrier customers and their subscribers while reducing costs to the carriers.
Prior to the InfoSpace Mobile acquisition, we provided mobile data services to wireless carriers and content and application providers using our proprietary Fuel platform. In addition, we operated two other lines of business, direct to consumer and media and entertainment. In 2007 and 2008, in connection with this business strategy realignment, we sold our direct to consumer business and discontinued our media and entertainment business. We then heightened our focus on our existing managed services model predominately for the wireless carriers. As part of our plan to pursue this more focused business strategy, our board of directors and our chief executive officer recruited additional senior management executives with substantial experience working with large carriers and managing significantly larger business organizations. In the first half of 2009, we completed the migration of all of our customers from the Fuel platform to mCore, except for AT&T’s storefront. We expect AT&T to fully migrate to the mCore platform in the second half of 2010.
Key Components of Our Results of Operations
Sources of revenue
Our revenue is earned predominantly under contracts ranging from one to three years in duration with our wireless carrier and other customers. Under the typical contract, we provide one or more of our managed services, for which we charge fixed, periodic or variable, activity-based fees (or a combination of both), and often also charge professional service fees to implement the specific mCore solutions required by the customer. We typically charge fixed monthly managed service fees to host the solutions and provide other support and services as required by the customer. Managed service fees vary by contract based on a number of factors including the scope of the solutions deployed, IT processing and bandwidth capacity requirements and the nature and scope of any other support or services required by the customer. Surcharges are typically included for excessive IT capacity requirements based on customer usage. Professional service fees primarily relate to work required for the initial customization and implementation of our mCore solutions for customers, as well as for customer-specified enhancements, extensions or other customization of the solutions following initial implementation. Professional services are typically provided on a fixed fee basis, depending on the scope and complexity of the individual project. Professional services fees from time to time may include charges for computer hardware and third-party software related to implementing our solutions.
Most of our customer contracts include a variable fee based on one of several measures, including the number of wireless subscribers who use our mCore solutions each month, the aggregate dollar volume or number of transactions processed, or specified rates for individual transactions processed, depending on the specific type of service involved. We typically receive a monthly subscription fee from our wireless carrier customers for each active portal user, where active usage is defined as utilizing the service at least one to three times per calendar month depending on the customer contract. We also receive from our wireless carrier customers a portion of the gross dollars generated by all transactions conducted through our digital storefronts, ranging from approximately 3% to 15%. In addition, from our content and application provider customers, we typically receive either a share of gross dollars generated for each premium message, or a fee for each standard message, delivered through the mCore platform. Individual carrier and
46
Table of Contents
content provider contracts often contain monthly minimum charges for usage-based fees or transaction-based charges for all or a portion of the contract term, based on various factors including the size of the customer’s subscriber base and the expected rate of subscriber usage of our services.
Due to the nature of the services we provide, our customer contracts contain monthly service level requirements that typically require us to pay financial penalties if we fail to meet the required service levels. We recognize these penalties, when incurred, as a reduction in revenue. Typical service level requirements address down time or slow response of our services that impact mobile subscribers and response time in addressing customer requests. Potential penalties vary by contract and range from near zero to as much as 100% of monthly recurring revenue, depending on the severity and duration of the service issue. Service level penalties represented 4% of total revenue in 2008 (during integration of the InfoSpace Mobile acquisition), 1% of total revenue in 2009 and 3% of total revenue during the three months ended March 31, 2010.
Operating expenses
We classify our operating expenses into six categories: direct third-party, datacenter and network operations, product development and sustainment, sales and marketing, general and administrative and depreciation and amortization. Our operating expenses consist primarily of personnel costs, which include salaries, bonuses, commissions, payroll taxes, employee benefit costs and stock-based compensation expense. Other operating expenses include datacenter and office facility expenses, computer hardware, software and related maintenance and support expenses, bandwidth costs, and marketing and promotion, legal, audit, tax consulting and other professional service fees. We charge stock-based compensation expense resulting from the amortization of the fair value of stock option grants to each option holder’s functional area. We allocate certain facility-related and other common expenses such as rent, office and IT desktop support to functional areas based on headcount.
Direct Third-Party Expenses. Our direct third-party expenses consist of the costs of certain content that we contract for directly on behalf of our wireless carrier customers, as well as certain computer hardware and software that we acquire on behalf of one major carrier customer. We expect these costs to increase as a percentage of revenue as we directly contract for additional content for our carrier customers and to the extent licensing costs for customer-specific, third-party software increase.
Datacenter and Network Operations. Datacenter and network operations expenses consist primarily of personnel and outsourcing costs for operating our datacenters, which host our mCore solutions on behalf of our customers. Additional expenses include facility rents, power, bandwidth capacity and software maintenance and support. We have been consolidating our datacenters since the InfoSpace Mobile acquisition, which has reduced datacenter and network operations costs. We expect, however, to expand our datacenter and our network capabilities in order to support the expected growth in mobile data usage by mobile subscribers. We expect our datacenter and network operations expenses to increase in absolute dollars but to decrease as a percentage of revenue over time.
Product Development and Sustainment. Product development expenses primarily consist of personnel costs and costs from our development vendors. Our product development efforts include improving and extending the functionality and performance of our service delivery platform, developing new solutions, customizing and implementing our solution set for our customers and providing other service and support functions for our solutions. Product development costs related to software used solely on an internal basis to provide our services, which we refer to as internal use software, are capitalized and amortized over the expected asset life. We expect that product development expenses will increase in absolute dollars as we continue to enhance and expand our suite of solutions and services, but will decline as a percentage of revenue over time.
47
Table of Contents
Sales and Marketing. Sales and marketing expenses primarily consist of personnel costs for our sales and marketing staff, commissions earned by our sales personnel and the cost of marketing programs. In order to continue to grow our business and awareness of our services, we expect that we will commit additional resources to our sales and marketing efforts. We expect that sales and marketing expenses will increase in absolute dollars and as a percentage of revenue over time as we work to expand our U.S. and international customer bases.
General and Administrative. General and administrative expenses, referred to herein as G&A, primarily consist of personnel costs for our executive, finance, legal, human resources and administrative personnel, as well as legal, accounting and other professional fees and facilities-related expenses. We expect our G&A expenses to increase in absolute dollars, but decrease as a percentage of revenue over time.
Depreciation and Amortization. Depreciation and amortization expenses consist primarily of depreciation on computer hardware and leasehold improvements in our datacenters, depreciation of capitalized software development costs, and amortization of purchased intangibles. We expect that depreciation and amortization expenses will increase in absolute dollars as we continue to expand our datacenters and our suite of solutions, but decline as a percentage of revenue over time.
Other income (expense), net
Other income and other expenses, net consists of interest we earn on our cash and cash equivalents, interest expense we incur as a result of our borrowings, if any, and non-operating income and expenses. It also includes income or expense relating to changes in the fair value of our outstanding warrants to purchase redeemable preferred shares.
Income tax provision
Income tax expenses for 2008, 2009 and for the first three months of 2010 primarily consist of a deferred U.S. tax provision for the difference between book and tax treatment of goodwill associated with the acquisition of the InfoSpace Mobile assets. Due to our history of operating losses, we have accumulated substantial net operating and capital losses, which constitute the majority of our deferred tax assets. Because of our history of operating losses, we maintain full valuation allowances against these deferred tax assets and consequently are not recognizing any tax benefit related to our current pre-tax losses. If we achieve sustained profitability, subject to certain provisions of the U.S. federal tax laws that may limit our use of these accumulated losses, we will evaluate whether we should eliminate or reduce the valuation allowances which would result in immediate recognition of a tax benefit and we would begin recording income tax provisions based on our earnings and applicable statutory tax rates going forward. Due to our large net operating loss carryforwards, we do not expect to pay U.S. federal income taxes in the next several years.
Critical Accounting Policies and Estimates
Our consolidated financial statements are prepared in accordance with accounting principles generally accepted in the U.S. The preparation of our financial statements and related disclosures requires us to make estimates, assumptions and judgments that affect the reported amount of assets, liabilities, revenue, costs and expenses, and related disclosures. We base our estimates and assumptions on historical experience and other factors that we believe to be reasonable under the circumstances. We evaluate our estimates and assumptions on an ongoing basis. Our actual results may differ from these estimates under different assumptions and conditions.
The following critical accounting policies are those accounting policies that, in our view, are most important in the portrayal of our financial condition and results of operations. Our critical accounting
48
Table of Contents
policies and estimates include those involved in recognition of revenue, business combinations, software development costs, valuation of goodwill, valuation of long-lived and intangible assets, provision for income taxes, accounting for stock-based compensation and discontinued operations. Note 2 to our financial statements included elsewhere in this prospectus provides additional information about these critical accounting policies, as well as our other significant accounting policies.
Revenue recognition
We derive our revenues from contracts that include individual or varying combinations of our managed services and often include professional service fees to customize and implement the specific software platform solutions required by the customer. We recognize revenue when all of the following conditions are satisfied: (i) there is persuasive evidence of an arrangement; (ii) delivery has occurred; (iii) the fee is fixed or determinable; and (iv) collectability of the fee is reasonably assured. The timing of revenue recognition in each case depends upon a variety of factors, including the specific terms of each arrangement and the nature of our deliverables and obligations.
Our customer contracts may consist of professional service fees, a fixed monthly managed service fee to host the software platform solution, and a variable monthly subscription fee based on one of three measures: the number of wireless subscribers using our software solutions each month; the aggregate dollar volume or number of transactions processed; or specified rates for individual transactions processed. Certain arrangements also include minimum monthly fee provisions, monthly fees for providing additional managed services required by the customer and/or service level requirements related to the hosted solutions which often entail financial penalties for non-compliance. Professional service fees typically include both initial fees to customize and implement the specific software solution and fees to enhance the functionality of the software solution, which may occur any time during the contractual term of the arrangement.
Under our contracts where the customer does not have the right to take possession of the software, we determine the pattern of revenue recognition of the combined deliverables as a single unit of accounting. The professional service fees associated with the arrangement are not considered to be a separate earnings process because the services do not have stand-alone value to the customer. Such customers do not have the ability to benefit, resell or realize value from such services without the associated hosting services. Consequently, the professional service revenue is deferred and recognized monthly on a ratable basis together with the hosting services over the longer of the contractual term of the arrangement or the estimated period the customer is expected to benefit from the software platform or enhancement representing the period over which the hosting services are expected to be utilized. In determining the expected benefit period, we assess factors such as historical trends, data used to establish pricing in the arrangement, discussions with customers in negotiating the arrangement and the period over which the customer could be expected to recover and earn a reasonable return on the professional service fee. At December 31, 2009 and March 31, 2010, our balance sheets reflected deferred revenue of $11.8 million and $4.9 million, respectively, which consists primarily of such professional service fees. We consider the variable activity-based fees to be contingent fees and recognize revenue monthly as the contingency is resolved, the fees are earned and the amount of the subscription fee can be reliably measured. For purposes of classifying the arrangement consideration as managed services or professional services revenue on our statement of operations, we allocate the arrangement consideration based on the contractually stated amounts for each component. The pricing of our professional services is based on the expected level of effort necessary to complete a software solution. We believe this best approximates the fair value of the professional service fees if they were a separate unit of accounting.
Under certain arrangements, the customer has the right to take possession of the software, and it is feasible for the customer to either self-host the software on its own hardware or contract with another
49
Table of Contents
entity for the hosting service without significant penalty. Such multiple element arrangements are analyzed under software revenue guidance to assess the elements for separation and recognition. The fixed monthly hosting fee to host the software solution is not considered essential to the functionality of other elements, is described in the contract such that the total price of the arrangement would be expected to vary as the result of the inclusion or exclusion of the services and we have established vendor-specific objective evidence of fair value through substantive renewal rates included in the contract. Accordingly we account for the hosting fee element of the arrangement separately and recognize the hosting fee as managed services revenue on a monthly basis as earned. The variable monthly subscription fee is considered a contingent fee and is recognized as managed services revenue monthly when the contingency is resolved and the related fee is earned. We then use the residual method to allocate the arrangement consideration to the professional services element for revenue recognition purposes. We recognize the professional service revenues using the cost-to-cost percentage of completion method of accounting. We recognize the revenue based on the ratio of costs incurred to the estimated total costs at completion. Should the customer elect to self-host the software, the hosting fee is eliminated and the variable subscription fee becomes the licensing fee. No customer has elected to self-host as of March 31, 2010. If a contract which previously did not have a right to self-host without significant penalty is amended to include such a right, we reassess the contract under the above software revenue guidance.
We provide premium messaging services to subscribers of wireless carriers on behalf of third-party vendors and earn a fixed percentage of the related revenue. We bill the carriers for transactions conducted by their subscribers and provide settlement services for the third-party vendors based on payments received from the carriers. We have determined it is appropriate to record our net share of the billings to carriers as service revenue rather than the gross billing amount. The primary considerations for this determination are:
| Ÿ | the third-party vendor sells its content or service directly to the wireless carriers’ subscribers and is considered the primary obligor; |
| Ÿ | the carriers have a contractual relationship with their subscribers and are directly responsible for billing and collecting premium messaging fees from their subscribers and resolving billing disputes; |
| Ÿ | the carriers establish gross pricing for the transactions; |
| Ÿ | the wireless carriers generally pay us a fixed percentage of premium messaging revenues actually collected from their subscribers; and |
| Ÿ | we have limited risks, including no inventory risk and limited credit risk, because the carriers generally bear the risk of collecting fees from their subscribers and we are obligated to remit to the third-party vendor only their share of the funds we actually receive from the carrier. |
Business combinations
We have completed eight business combinations since 2003. The purchase price of an acquisition is allocated to the tangible and intangible assets acquired and liabilities assumed based on their estimated fair values as of the acquisition date, with any amount in excess of such allocations designated as goodwill. We make significant judgments and assumptions in determining the fair value of acquired assets and assumed liabilities, especially with respect to acquired intangibles. Using different assumptions in determining fair value could materially impact the purchase price allocation and our financial position and results of operations.
Several methods are commonly used to determine fair value. For intangible assets, we typically use the “income method.” This method starts with our forecast of all expected future net cash flows.
50
Table of Contents
These cash flows are then adjusted to present value by applying an appropriate discount rate that reflects the risk factors associated with the cash flow streams. Some of the more significant estimates and assumptions inherent in the income method and other methods include:
| Ÿ | the amount and timing of projected future cash flows; |
| Ÿ | the discount rate selected to measure the risks inherent in the future cash flows; |
| Ÿ | the acquired company’s competitive position; and |
| Ÿ | the assessment of the asset’s life cycle and the competitive trends impacting the asset, including consideration of any technical, legal, regulatory, or economic barriers to entry. |
Software development costs
We capitalize certain software development costs, including the costs to develop new software products or significant enhancements to existing software products, which are developed or obtained for internal use. We capitalize software development costs when application development begins, it is probable that the project will be completed, and the software will be used as intended. Such capitalized costs are amortized on a straight-line basis over the estimated useful life of the related asset, which is generally three years. Costs associated with preliminary project stage activities, training, maintenance and all post implementation stage activities are expensed as incurred.
Software development costs related to software products to be sold, leased or otherwise marketed, however, are capitalized when technological feasibility has been established. In 2010, we have focused on developing software products that can be leveraged across various customers. As such, we have capitalized costs, including direct labor and related overhead. Amortization of capitalized software development costs will begin as each product is available for general release to customers. Amortization will be computed on an individual product basis for those products available for market and will be recognized based on the product’s estimated economic life. Unamortized capitalized software development costs determined to be in excess of net realizable value of the product are expensed immediately.
Valuation of goodwill
Our business acquisitions typically result in the recording of goodwill, and we periodically assess whether the recorded value of goodwill has become impaired. We test for potential impairment annually, in the fourth quarter of each year, and whenever events or changes in circumstances indicate that the carrying amount of goodwill may not be recoverable. Testing for impairment of goodwill involves estimating the fair value of the associated reporting unit and comparing it to its carrying value. If the estimated fair value is lower than the carrying value, then a more detailed assessment is performed comparing the fair value of the reporting unit to the fair value of the assets and liabilities plus the goodwill carrying value of the reporting unit. If the fair value of the reporting unit is less than the fair value of its assets and liabilities plus goodwill, then an impairment charge is recognized to reduce the carrying value of goodwill by the difference.
The process of evaluating the potential impairment of goodwill is highly subjective and requires significant judgment. We use valuation techniques consistent with the market approach and income approach to measure fair value for purposes of impairment testing. An estimate of fair value can be affected by many assumptions, requiring that management make significant judgments in arriving at these estimates, including the expected operational performance of our businesses in the future, market conditions and other factors. Although there are inherent uncertainties in this assessment process, the estimates and assumptions we use to estimate future cash flows—including sales volumes, pricing, market penetration, competition, technological obsolescence and discount rates—are
51
Table of Contents
consistent with our internal planning. Significant changes in these estimates or their related assumptions in the future could result in an impairment charge related to our goodwill.
The $74.7 million of recorded goodwill at December 31, 2008, December 31, 2009 and March 31, 2010 relates entirely to our acquisition of InfoSpace Mobile. In conjunction with our strategy reassessment in 2007 to focus primarily on the mobile network operator business and prior impairment or disposition of goodwill in our other reporting units, we have combined the reporting unit for our 2006 U.S. messaging acquisition, GoldPocket Wireless, Inc., which we refer to as GPW, with our mobile network operator reporting unit resulting in one enterprise level reporting unit for purposes of our fourth quarter 2008 annual impairment test. Our impairment test in the fourth quarter of 2009 indicated we had significant excess of fair value over the net book value of our Company such that a 50% decrease in our projected net cash flow or a doubling of the discount rate would not have resulted in impairment of our goodwill.
In 2007 and 2008, we fully impaired $33.7 million of goodwill associated with acquisitions completed prior to our acquisition of InfoSpace Mobile. In the third quarter of 2008, it became apparent that revenue from GPW would not achieve expectations, which resulted in a goodwill impairment charge of $6.8 million. During 2007, we recorded a $26.9 million impairment charge related to goodwill associated with our mobile network operator reporting unit, which represents our primary operations, and our GPW reporting unit. The annual impairment test performed on the mobile network operator reporting unit, prior to inclusion of the InfoSpace Mobile assets and operations, indicated that changes in consumer purchasing habits were resulting in lower revenues and net cash flows than originally expected, requiring a goodwill impairment of $12.1 million. The annual impairment test performed on the GPW reporting unit indicated that unanticipated competitive dynamics in the marketplace were resulting in lower revenues and net cash flows than originally expected, requiring a goodwill impairment of $14.8 million.
Valuation of long-lived and intangible assets
We periodically evaluate events or changes in circumstances that indicate the carrying amount of our long-lived and intangible assets may not be recoverable or that the useful lives of the assets may no longer be appropriate. Factors which could trigger an impairment review or a change in the remaining useful life of our long-lived and intangible assets include significant underperformance relative to historical or projected future operating results, significant changes in our use of the assets or in our business strategy, loss of or changes in customer relationships and significant negative industry or economic trends. When indications of impairment arise for a particular asset or group of assets, we assess the future recoverability of the carrying value of the asset (or asset group) based on an undiscounted cash flow analysis. If carrying value exceeds projected, net, undiscounted cash flows, an additional analysis is performed to determine the fair value of the asset (or asset group), typically a discounted cash flow analysis, based on an income and/or cost approach, and an impairment charge is recorded for the excess of carrying value over fair value.
The process of assessing potential impairment of our long-lived and intangible assets is highly subjective and requires significant judgment. An estimate of future undiscounted cash flow can be affected by many assumptions, requiring that management make significant judgments in arriving at these estimates. Although there are inherent uncertainties in this assessment process, the estimates and assumptions we use to estimate future cash flows including sales volumes, pricing, market penetration, competition and technological obsolescence are consistent with our internal planning. Significant future changes in these estimates or their related assumptions could result in an impairment charge related to individual or groups of these assets.
Our intangible assets, other than goodwill, of $10.7 million at December 31, 2009 and $11.5 million at March 31, 2010, relate primarily to customer relationships associated with our acquisition of
52
Table of Contents
InfoSpace Mobile. We are amortizing the recorded value of the customer relationships over an estimated useful life of approximately eight years utilizing a variable methodology.
During 2009, we recognized impairment charges of $5.8 million related primarily to our GPW long-lived and intangible assets. In June 2009, we received notification that our future revenue stream associated with a significant messaging customer obtained as part of the GPW acquisition would likely be eliminated. We performed an impairment analysis, which resulted in impairment charges of $1.9 million and $3.3 million associated with the GPW customer list and GPW capitalized software, respectively.
During 2008, we recorded long-lived and intangible asset impairment charges of $22.3 million. These impairment charges included $8.4 million related to software assets acquired in the InfoSpace Mobile acquisition based on information received indicating it was likely that two significant customers would no longer be utilizing our search and storefront solutions. We also recognized impairments of $12.7 million related to restructuring of the business following the InfoSpace Mobile acquisition. The $12.7 million included $8.2 million to impair computer software, furniture and fixtures and leasehold improvements associated with moving our headquarters to Bellevue, Washington and the planned consolidation and shutdown of certain datacenter facilities. The other restructuring-related impairment of $4.5 million was associated with the planned early shutdown of and migration of customers from the Fuel software solution platform to the mCore platform. We had redundant software solution platforms as a result of the InfoSpace Mobile acquisition and, based on specific migration plans developed in cooperation with our customers during the third quarter, it was determined the Fuel platform would not generate sufficient revenues to recover the remaining carrying value of the software platform. As a result, we impaired the remaining software carrying value. The remaining $1.2 million impairment related to the remaining customer relationship intangible from our M7 Networks, Inc. acquisition in 2005, as we no longer had customers utilizing that technology.
Income taxes
We are subject to federal and various state income taxes in the U.S., and to a lesser extent, income-based taxes in various foreign jurisdictions, including, but not limited to, the Netherlands, the United Kingdom, Canada, Indonesia and Singapore, and we use estimates in determining our provision for these income taxes and the recognition of deferred tax assets. Deferred tax assets, related valuation allowances, current tax liabilities and deferred tax liabilities are determined separately by tax jurisdiction. In making these determinations, we estimate tax assets, related valuation allowances, current tax liabilities and deferred tax liabilities, and we assess temporary differences resulting from differing treatment of items for tax and accounting purposes. We recognize only tax positions that are “more likely than not” to be sustained based solely on their technical merits. Although we believe that our tax estimates are reasonable, the ultimate tax determination involves significant judgment that is subject to audit by tax authorities in the ordinary course of business.
At December 31, 2009, our gross deferred tax assets consisted primarily of domestic net operating losses and book to tax differences in fixed assets, as well as research and development credit carryforwards. As of December 31, 2009, we had U.S. federal and state net operating loss carryforwards of approximately $222 million and $89 million, respectively, which begin to expire at varying dates starting in 2019 for U.S. federal income tax purposes and in the current year for state income tax purposes. Because of our history of generating operating losses, we maintain full valuation allowances against these deferred tax assets and consequently do not recognize tax benefits for our current operating losses. If we achieve sustained profitability, we will assess the likelihood that the deferred tax assets will be realized through the ability to utilize them to offset our expected future tax obligations, subject to certain provisions of the U.S. federal tax laws that may limit our use of these accumulated losses. If we determine it is likely that all or a portion of the deferred tax assets will be
53
Table of Contents
realized, we will eliminate or reduce the corresponding valuation allowances which would result in immediate recognition of an associated tax benefit. Going forward, we will reassess the need for any remaining valuation allowances or the necessity to recognize additional valuation allowances in the future based on our then current and expected future financial performance. In the event we do eliminate all or a portion of the valuation allowances in the future, we will begin recording income tax provisions based on our earnings and applicable statutory tax rates from that time forward.
As a result of the InfoSpace Mobile asset acquisition at the end of 2007, we record a U.S. tax provision each subsequent period for the difference between book and tax treatment of goodwill associated with the acquisition. The tax amortization of the goodwill results in a deferred tax liability which does not provide a source of income for purposes of evaluating the realizability of the deferred tax assets. This results in recognition of income tax each period through 2022 corresponding to the tax amortization period of the goodwill. This provision has no cash tax implications absent liquidation of our Company and would otherwise only be adjusted or reversed to the extent our book goodwill balance would be impaired in the future.
Stock-based compensation
Prior to January 1, 2006, we accounted for share-based awards, including stock options, to employees using the intrinsic value method. Under the intrinsic value method, compensation expense was measured on the date of award as the difference, if any, between the deemed fair value of our common stock and the option exercise price, multiplied by the number of options granted. The option exercise prices and fair value of our common stock are determined by our board of directors based on a review of various objective and subjective factors. No compensation expense was recorded for stock options issued to employees prior to January 1, 2006 because all options were granted in fixed amounts and with fixed exercise prices at least equal to the fair value of our common stock at the date of grant.
Effective January 1, 2006, we changed our accounting treatment to recognize compensation expense based on the fair value of all share-based awards granted, modified, repurchased or cancelled on or after that date. This compensation expense is recognized on a straight-line basis over the requisite service period for all time-based vesting awards. We continue to account for share-based awards granted prior to January 1, 2006 under the intrinsic value method.
For share-based awards subsequent to January 1, 2006, we estimate the fair value of such awards, including stock options, using the Black-Scholes option-pricing model. Determining the fair value of share-based awards requires the use of subjective assumptions, including the expected term of the award and expected stock price volatility. The assumptions used in calculating the fair value of share-based awards granted since January 1, 2008, are set forth below:
| Year Ended December 31, 2008 |
Year Ended December 31, 2009 |
Three Months Ended March 31, 2010 | ||||
| Expected life of options granted |
5 years | 5 years | 5 years | |||
| Expected volatility |
58% | 50% - 58% | 50% | |||
| Range of risk-free interest rates |
2.8% - 3.3% | 1.7% - 2.3% | 2.3% | |||
| Expected dividend yield |
0% | 0% | 0% |
The assumptions used in determining the fair value of share-based awards represent our best estimates, but these estimates involve inherent uncertainties. As a result, if factors change, and we use different assumptions, our share-based compensation could be materially different in the future. The risk-free interest rate used for each grant is based on a U.S. Treasury instrument with a term similar to the expected term of the share-based award. The expected term of options has been estimated
54
Table of Contents
utilizing the vesting period of the option, the contractual life of the option and our option exercise history. Because there was no public market for our common stock prior to this offering, we lacked company-specific historical and implied volatility information. Therefore, in estimating our expected stock volatility, we have taken into account volatility information of publicly-traded peer companies, and we expect to continue to use this methodology until such time as we have adequate historical data regarding the volatility of our publicly-traded stock price. Also, we recognize compensation expense for only the portion of options that are expected to vest. Accordingly, we estimated future forfeitures of stock options based on our historical forfeiture rate, taking into account unusual events such as employee attrition due to the relocation of our headquarters to Bellevue, Washington. If our actual forfeiture rate varies from our historical rates and estimates, additional adjustments to compensation expense may be required in future periods.
All our employee stock options were granted at exercise prices equal to the fair value of common stock as of the grant date, except for the December 11, 2009 grant with an exercise price of $15.00 per share, as described further below. As of March 31, 2010, we had $2.5 million of unrecognized compensation expense related to unvested employee stock options, which will be recognized over a weighted-average period of 2.2 years.
The following table summarizes by grant date the number of stock options granted from January 1, 2008 through March 31, 2010, and the per share exercise price per share of each option grant:
| Date of Grant |
Stock Options Granted | Exercise Price | |||
| January 1, 2008 |
370,140 | $ | 12.00 | ||
| February 7, 2008 |
110,371 | 12.00 | |||
| February 5, 2009 |
117,250 | 12.15 | |||
| May 4, 2009 |
28,867 | 12.15 | |||
| December 11, 2009 |
14,967 | 15.00 | |||
| December 11, 2009 |
15,800 | 19.65 | |||
| December 14, 2009 |
19,933 | 19.65 | |||
| February 9, 2010 |
21,190 | 19.65 | |||
| February 12, 2010 |
666 | 19.65 | |||
| March 8, 2010 |
6,597 | 20.40 | |||
The fair value of our common stock, for the purpose of determining the grant prices of our common stock option grants, is ultimately approved by our board of directors after an extensive process involving the audit committee, management, and a third-party valuation firm. The board of directors initially delegates the valuation process to the audit committee. The audit committee works with management, and starting in 2008, also began working with a third-party valuation firm to develop each valuation. The audit committee then presents the resulting valuation to the full board of directors, and recommends its approval, which has historically been adopted. Our board of directors exercised judgment in determining the estimated fair value of our common stock on the date of grant based on various factors, including:
| Ÿ | the prices for our redeemable preferred stock sold to outside investors in arm’s-length transactions; |
| Ÿ | the rights, preferences and privileges of our redeemable preferred stock relative to those of our common stock; |
| Ÿ | our operating and financial performance; |
| Ÿ | the hiring of key personnel; |
| Ÿ | our stage of development and revenue growth; |
55
Table of Contents
| Ÿ | the lack of an active public market for our common and preferred stock; |
| Ÿ | industry information such as market growth and volume; |
| Ÿ | the execution of strategic and customer agreements; |
| Ÿ | the risks inherent in the development and expansion of our service offerings; |
| Ÿ | the likelihood of achieving a liquidity event, such as an initial public offering or a sale of our company given prevailing market conditions and the nature of and history of our business; and |
| Ÿ | the acquisitions of companies that we have completed. |
We believe consideration of these factors by our board of directors was a reasonable approach to estimating the fair value of our common stock for those periods. Estimation of the fair value of our common stock requires complex and subjective judgments, however, and there is inherent uncertainty in our estimate of fair value.
The fair value of our common stock as of the January 1, 2008 and February 7, 2008 grant dates was estimated by the board of directors to be $12.00 per share. Due to the proximity of the acquisition of InfoSpace Mobile in December 2007 to these grants, the issuance of the Series I redeemable preferred stock to a subset of existing and new investors to fund the acquisition was considered the most objective approach to estimating the fair value of our common stock for purposes of these grants. We sold 190.8 million shares of Series I redeemable preferred stock at a price of $0.9694 per share. Each share is convertible into .0667 shares of common stock and has a liquidation preference equal to the $0.9694 issue price plus cumulative unpaid dividends of $0.038776 per annum, whether declared or not. Based on the pre-money valuation associated with the Series I preferred stock issuance of $295 million, which was negotiated between our board of directors and investors participating in the Series I financing round, and the Series I proceeds of $185 million, we estimated the fair value of the common stock to be $12.00 by deducting the liquidation preferences of Series A, B, C, D and E as of such date from the post-money valuation of $480 million and divided by the number of fully diluted shares outstanding as of such date.
In early 2008, following the closing of the acquisition of InfoSpace Mobile in December 2007, we finalized our plans to integrate the business and initiated implementation of the plans, including relocating our headquarters to Bellevue, Washington. Significant progress was also made during that period toward the eventual disposition of the discontinued business lines. We updated our financial forecasts as of April 2008 based on the progress made in the integration process, the additional knowledge of the InfoSpace Mobile business gained and initiatives undertaken to increase revenues and reduce operating expenses of the combined business.
We engaged an independent third-party valuation firm to assist the board of directors in performing a contemporaneous valuation of our common stock as of April 30, 2008, for stock option grants. The enterprise value was calculated by using an asset-based approach, a market-based approach, determined primarily by the recent issuance of the Series I redeemable preferred stock, and an income-based approach. After considering these methods, we relied primarily on the income-based approach utilizing the discounted cash flow method to determine enterprise value. The discounted cash flow analysis incorporated three different scenarios based on different exit or terminal values, each incorporating three different market condition assumptions which were probability weighted. Assumptions utilized in each discounted cash flow scenario were:
| Ÿ | our expected revenue, operating performance, cash flow for the current and future years, determined as of the valuation date based on our estimates; |
| Ÿ | a discount rate, which is applied to discretely forecasted future cash flows in order to calculate the present value of those cash flows; and |
56
Table of Contents
| Ÿ | a terminal value multiple, which is applied to our last year of discretely forecasted operating results to calculate the residual value of our future cash flows. |
The enterprise value was then allocated to our shares of redeemable preferred stock, preferred stock, warrants to purchase shares of redeemable preferred stock and common stock, and common stock, using option pricing theory. This methodology treats the various components of our capital structure as a series of call options on the proceeds expected from a future liquidity event. These call options are then valued using the Black-Scholes option pricing model. This model estimates the fair value of each individual security based on the enterprise value of the Company and assumptions based on the securities’ rights and preferences. The option pricing method also requires assumptions regarding the anticipated timing of a potential liquidity event, such as an initial public offering, and the estimated volatility of our equity securities. For this purpose, an initial public offering was assumed to occur in three to five years and estimates of the volatility of our stock were based on available information on the volatility of capital stock of comparable publicly traded companies. The value of each of the call options is deducted from the enterprise value with the remainder being the value attributed to the common stock. A discount for lack of marketability of 20% was applied to arrive at the fair value of our common stock. On the basis of this analysis the board of directors estimated the fair value of our common stock to be $12.15 per share as of April 30, 2008, which was substantially unchanged from the $12.00 valuation as of the closing of the InfoSpace Mobile acquisition.
Over the remainder of 2008 and the early part of 2009, we completed much of the post-acquisition integration of InfoSpace Mobile and other restructuring of our business. Financial results were better than expected over this period but economic conditions continued to deteriorate which reduced our confidence in our longer-term forecasts and expectations regarding the timing and potential for a public stock offering. For common stock valuation purposes, the impact of the improved short-term operating performance was assumed to be offset by the greater uncertainty regarding future prospects. On this basis, the board of directors estimated that the fair value of our common stock continued to be $12.15 per share on February 5, 2009 and May 4, 2009.
In the second quarter of 2009, we experienced improvements in our operating performance and in the economic outlook, including in the capital markets, which led our board of directors to perform another valuation of our common stock, after an extensive process described herein involving the audit committee, management and a third-party valuation firm. Greater than expected operating efficiencies achieved recently, higher projections of future growth with greater confidence and giving greater weight to a public stock offering in a two-year time frame resulted in an increase in value to $15.00 per share as of June 30, 2009. Our compensation committee approved stock option grants, primarily for new employees, on August 5, 2009 subject to completion of this valuation. Prior to completion of the valuation for June 30, 2009, the board of directors determined the need to perform another common stock valuation as of September 30, 2009, based on events during the third quarter. Our operating performance continued to improve during the third quarter and discussions occurred with several investment banks regarding a potential initial public offering of our common stock in 2010. Based primarily on greater weight placed on a near-term public stock offering and a reduction in the discount for the lack of marketability from 20% used in earlier valuations to 5%, the common stock was valued at $19.65 per share as of September 30, 2009. Since the valuations as of June 30, 2009 and September 30, 2009 were both finalized by the board of directors on December 11, 2009, the options approved on August 5, 2009, were granted at the $15.00 price, but due to the increase in fair value of our common stock to $19.65, will be treated as “in the money” grants on December 11, 2009.
Restricted stock is granted to certain employees as part of their total compensation package. All grants of restricted stock prior to October 25, 2006 are fully vested except for 24,509 shares which vest in April 2010. All restricted shares granted on or after October 25, 2006 are subject to a double trigger vesting requirement consisting of time-based vesting and occurrence of a qualified sale or qualified
57
Table of Contents
public offering which would include the offering contemplated by this prospectus. These employees are not required to be employed as of the occurrence of a qualified event to receive shares for which the time-based vesting has occurred based on the period of their employment. If no qualified event occurs within 10 years, the stock is forfeited. Under these terms, vesting of the shares is not probable until a qualified event is probable; therefore, no compensation expense has been recognized related to the grant of these shares of restricted stock. Upon closing of a qualified sale or qualified public offering, those shares subject to the double trigger for which time-based vesting has occurred will become vested and we will immediately recognize compensation expense for those shares. Had a qualified event occurred on March 31, 2010, the compensation expense recognized immediately would have been $16.3 million and additional compensation expense of approximately $13.2 million will be recognized over a weighted-average period of 2.9 years.
As of March 5, 2010, we updated our valuation of our common stock utilizing a methodology consistent with that described for the valuation work of our common stock in 2009, including the involvement of the audit committee, management and a third-party valuation firm. Based primarily on updates to our financial projections to incorporate current performance and market conditions, we determined the common stock was valued at $20.40 per share as of March 5, 2010. As part of the assessment, we increased the discount for the lack of marketability to 7.5% to reflect the market conditions for initial public offerings. The estimated offering price range shown on the front cover of the prospectus is based on a variety of factors, including but not limited to, general economic conditions and financial market conditions. The price range is lower than the March 5, 2010 valuation due to the overall impact of these factors.
Discontinued operations
In connection with our business strategy reassessment initiated in 2007, we exited two lines of business in 2007 and 2008, the results of which are reflected in our operating results as discontinued operations. The discontinued lines of business were direct to consumer, which was sold in two transactions in 2007 and 2008, and media and entertainment, which was discontinued in 2008. We have reclassified all of the revenues and associated operating expenses which would no longer be incurred upon disposition of the business to discontinued operations for all periods presented. Any gains and losses from the sale of the businesses are also reported in discontinued operations.
58
Table of Contents
Results of Operations
The following tables set forth components of our results of operations, including both continuing and discontinued operations, for the periods indicated:
| Years Ended December 31, | Three Months Ended March 31, |
|||||||||||||||||||
| 2007 | 2008 | 2009 | 2009 | 2010 | ||||||||||||||||
| Unaudited | ||||||||||||||||||||
| (In thousands) | ||||||||||||||||||||
| Revenue |
||||||||||||||||||||
| Managed services |
$ | 31,772 | $ | 85,677 | $ | 81,403 | $ | 20,222 | $ | 20,881 | ||||||||||
| Professional services |
3,399 | 17,474 | 32,292 | 3,054 | 8,199 | |||||||||||||||
| Total revenues |
35,171 | 103,151 | 113,695 | 23,276 | 29,080 | |||||||||||||||
| Operating expenses |
||||||||||||||||||||
| Direct third-party expenses |
3,709 | 5,451 | 9,485 | 1,171 | 1,305 | |||||||||||||||
| Datacenter and network operations, excluding depreciation |
9,468 | 33,000 | 31,786 | 8,683 | 8,034 | |||||||||||||||
| Product development and sustainment, excluding depreciation |
16,229 | 52,261 | 31,389 | 7,677 | 8,182 | |||||||||||||||
| Sales and marketing, excluding depreciation |
7,119 | 10,228 | 11,900 | 2,989 | 3,655 | |||||||||||||||
| General and administrative, excluding depreciation |
10,334 | 26,052 | 20,841 | 5,175 | 5,264 | |||||||||||||||
| Depreciation and amortization |
10,322 | 21,559 | 13,208 | 3,777 | 3,041 | |||||||||||||||
| Restructuring |
1,283 | 3,236 | 2,058 | 235 | 407 | |||||||||||||||
| Goodwill and long-lived asset impairment charges |
26,867 | 29,130 | 5,806 | — | — | |||||||||||||||
| Abandoned transaction charge |
2,600 | — | — | — | — | |||||||||||||||
| Total operating expenses |
87,931 | 180,917 | 126,473 | 29,707 | 29,888 | |||||||||||||||
| Operating loss |
(52,760 | ) | (77,766 | ) | (12,778 | ) | (6,431 | ) | (808 | ) | ||||||||||
| Other income (expense), net |
||||||||||||||||||||
| Other income (expense) |
79 | 1,892 | (1,657 | ) | (82 | ) | (258 | ) | ||||||||||||
| Interest and investment income, net |
2,157 | 1,315 | 250 | 80 | — | |||||||||||||||
| Interest expense |
(1,081 | ) | (493 | ) | (220 | ) | (94 | ) | — | |||||||||||
| Other income (expense), net |
1,155 | 2,714 | (1,627 | ) | (96 | ) | (258 | ) | ||||||||||||
| Loss from continuing operations, before income tax |
(51,605 | ) | (75,052 | ) | (14,405 | ) | (6,527 | ) | (1,066 | ) | ||||||||||
| Provision for income taxes |
— | 1,776 | 1,896 | 444 | 467 | |||||||||||||||
| Loss from continuing operations |
(51,605 | ) | (76,828 | ) | (16,301 | ) | (6,971 | ) | (1,533 | ) | ||||||||||
| Loss from discontinued operations |
(24,928 | ) | (1,072 | ) | — | — | — | |||||||||||||
| Loss from sale of discontinued operations |
(1,360 | ) | (127 | ) | — | — | — | |||||||||||||
| Net loss |
$ | (77,893 | ) | $ | (78,027 | ) | $ | (16,301 | ) | $ | (6,971 | ) | $ | (1,533 | ) | |||||
59
Table of Contents
Depreciation and amortization by function:
| Years Ended December 31, | Three Months Ended March 31, | ||||||||||||||
| 2007 | 2008 | 2009 | 2009 | 2010 | |||||||||||
| (In thousands) | |||||||||||||||
| Datacenter and network operations |
$ | 7,310 | $ | 16,824 | $ | 8,890 | $ | 2,497 | $ | 1,992 | |||||
| Product development and sustainment |
1,548 | 2,237 | 1,962 | 586 | 428 | ||||||||||
| Sales and marketing |
307 | 2,075 | 1,960 | 572 | 524 | ||||||||||
| General and administrative |
1,157 | 423 | 396 | 122 | 97 | ||||||||||
| Total depreciation and amortization |
$ | 10,322 | $ | 21,559 | $ | 13,208 | $ | 3,777 | $ | 3,041 | |||||
| Years Ended December 31, | Three Months Ended March 31, |
||||||||||||||
| 2007 | 2008 | 2009 | 2009 | 2010 | |||||||||||
| As a Percentage of Total Revenues from |
|||||||||||||||
| Total revenues |
100 | % | 100 | % | 100 | % | 100 | % | 100 | % | |||||
| Operating expenses |
|||||||||||||||
| Direct third-party expenses |
11 | 5 | 8 | 5 | 4 | ||||||||||
| Datacenter and network operations, excluding depreciation |
27 | 32 | 28 | 38 | 28 | ||||||||||
| Product development and sustainment, excluding depreciation |
46 | 51 | 28 | 33 | 28 | ||||||||||
| Sales and marketing, excluding depreciation |
20 | 10 | 10 | 13 | 13 | ||||||||||
| General and administrative, excluding depreciation |
29 | 25 | 18 | 22 | 18 | ||||||||||
| Depreciation and amortization |
29 | 21 | 12 | 16 | 10 | ||||||||||
| Other charges |
87 | 31 | 7 | 1 | 2 | ||||||||||
| Total operating expenses |
250 | 175 | 111 | 128 | 103 | ||||||||||
| Operating loss |
(150 | ) | (75 | ) | (11 | ) | (28 | ) | (3 | ) | |||||
| Other income (expense), net |
3 | 3 | (1 | ) | 0 | (1 | ) | ||||||||
| Loss from continuing operations, before income tax |
(147 | ) | (73 | ) | (13 | ) | (28 | ) | (4 | ) | |||||
| Provision for income taxes |
0 | 2 | 2 | 2 | 1 | ||||||||||
| Loss from continuing operations |
(147 | )% | (74 | )% | (14 | )% | (30 | )% | (5 | )% | |||||
Three Months Ended March 31, 2010 Compared to Three Months Ended March 31, 2009
Total Revenues
| Three Months Ended March 31, |
Change | |||||||||||
| 2009 | 2010 | $ | % | |||||||||
| (Dollars in thousands) | ||||||||||||
| Managed services |
$ | 20,222 | $ | 20,881 | $ | 659 | 3.3 | % | ||||
| Professional services |
3,054 | 8,199 | 5,145 | 168.5 | ||||||||
| Total revenues |
$ | 23,276 | $ | 29,080 | $ | 5,804 | 24.9 | % | ||||
Our total revenues increased $5.8 million, or 24.9%, for the three months ended March 31, 2010 compared to the corresponding 2009 period. Managed services revenues accounted for 71.8% and 86.9% of our revenues for the three month periods ended March 31, 2010 and 2009, respectively, while professional services accounted for 28.2% and 13.1%, respectively. The $5.1 million increase in
60
Table of Contents
professional services revenues includes $4.9 million of revenues recognized due to an amendment of a contract with a customer during the quarter which established that the arrangement meets the self-host criteria for revenue recognition. As a result of this amendment the contract met the criteria for recognition of the balance of the setup fee that had been previously deferred. The amendment converted the managed service component of the contract from a fixed monthly fee arrangement with predetermined periodic increases to a fixed monthly subscription fee plus a variable monthly subscription fee based on usage.
Managed service revenues increased $0.7 million, or 3.3% for the three months ended March 31, 2010 compared to the prior year period due to higher storefront revenues. Variable user- and transaction-based fees made up approximately 52% and 76% of our managed services revenues for the three months ended March 31, 2010 and 2009, respectively, the decrease due primarily to conversion of a storefront contract from a transaction based to a fixed fee arrangement upon extension of the contract early in the fourth quarter of 2009. The average monthly number of users of our non-messaging based solutions decreased to approximately 34.4 million for the three months ended March 31, 2010 from 34.5 million in the comparable period of 2009.
We generated 96% of our revenues in the U.S. for the three months ended March 31, 2010. Revenues from our five largest customers, represented 90% of our total revenues for the three months ended March 31, 2010, with AT&T and Verizon Wireless accounting for 40% and 39% of total revenues, respectively. For the three months ended March 31, 2009, revenues from our five largest customers represented 88% of our total revenues, with AT&T and Verizon Wireless accounting for 44% and 25% of total revenues, respectively. No other customers accounted for more than 10% of our revenues during these periods.
Operating expenses
| Three Months Ended March 31, |
Change | ||||||||||||
| 2009 | 2010 | $ | % | ||||||||||
| (Dollars in thousands) | |||||||||||||
| Direct third-party expenses |
$ | 1,171 | $ | 1,305 | $ | 134 | 11.4 | % | |||||
| Datacenter and network operations, excluding depreciation |
8,683 | 8,034 | (649 | ) | (7.5 | ) | |||||||
| Product development and sustainment, excluding depreciation |
7,677 | 8,182 | 505 | 6.6 | |||||||||
| Sales and marketing, excluding depreciation |
2,989 | 3,655 | 666 | 22.3 | |||||||||
| General and administrative, excluding depreciation |
5,175 | 5,264 | 89 | 1.7 | |||||||||
| Depreciation and amortization |
3,777 | 3,041 | (736 | ) | (19.5 | ) | |||||||
| Restructuring |
235 | 407 | 172 | 73.2 | |||||||||
| Total operating expenses |
$ | 29,707 | $ | 29,888 | $ | 181 | 0.6 | % | |||||
Our operating expenses were $29.9 million for the three months ended March 31, 2010 compared to $29.7 million for the three months ended March 31, 2009. The increase of $0.2 million, or 0.6%, consists of increases in most expense categories, largely offset by expense reductions in datacenter and network operations and depreciation and amortization.
Direct third party expenses
Direct third party expenses increased $0.1 million, or 11.4%, for the three months ended March 31, 2010 compared to the corresponding 2009 period. The increase is due primarily to higher usage-based licensing expenses for customer-specific third-party software as user volume increases.
61
Table of Contents
Datacenter and network operations, excluding depreciation
Datacenter and network operations expense, excluding depreciation, decreased $0.6 million, or 7.5%, for the three months ended March 31, 2010 compared to the corresponding 2009 period. The decrease is primarily due to cost savings from consolidating datacenter operations and renegotiating certain vendor contracts.
Product development and sustainment, excluding depreciation
Product development and sustainment expense, excluding depreciation, increased $0.5 million, or 6.6%, for the three months ended March 31, 2010 compared to the corresponding 2009 period. The additional expense primarily relates to the recognition of $1.2 million in deferred expenses associated with the deferred revenues recognized during the first quarter of 2010 due to amendment of a customer contract.
Sales and marketing, excluding depreciation
Sales and marketing expense, excluding depreciation, increased $0.7 million, or 22.3%, for the three months ended March 31, 2010 compared to the corresponding 2009 period. The increase is due to higher personnel expenses, primarily from our international expansion efforts.
General and administrative, excluding depreciation
General and administrative expense, excluding depreciation, increased $0.1 million, or 1.7%, for the three months ended March 31, 2010 compared to the corresponding 2009 period. The increase is due to additional strategy consulting fees incurred.
Depreciation and amortization
Depreciation and amortization expense decreased $0.7 million, or 19.5%, for the three months ended March 31, 2010 compared to the corresponding 2009 period. The decrease is primarily due to the datacenter consolidation and certain assets from the InfoSpace Mobile acquisition now being fully depreciated.
Restructuring
During the first quarter of 2009, we incurred $0.2 million of restructuring charges related to the relocation of our headquarters from Durham, North Carolina to Bellevue, Washington in 2008. In the first quarter of 2010, we incurred a $0.4 million expense upon disposition of the remaining asset held for sale related to the relocation.
Other income (expense), net
| Three Months Ended March 31, |
Change | |||||||||||
| 2009 | 2010 | |||||||||||
| (In thousands) | ||||||||||||
| Other income (expense) |
$ | (82 | ) | $ | (258 | ) | $ | (176 | ) | |||
| Interest and investment income, net |
80 | — | (80 | ) | ||||||||
| Interest expense |
(94 | ) | — | 94 | ||||||||
| Total other income (expense), net |
$ | (96 | ) | $ | (258 | ) | $ | (162 | ) | |||
62
Table of Contents
Other expense of $0.3 million for the three months ended March 31, 2010 consists primarily of expense related to the increase in fair value of our warrants to purchase redeemable preferred shares. The higher net interest and investment income in the first three months of 2009 reflects the higher investments in marketable securities during the period. We did not incur any interest expense in the first quarter of 2010 due to the repayment of our remaining outstanding debt in April 2009.
Provision for income taxes
| Three Months Ended March 31, |
Change | |||||||||||
| 2009 | 2010 | $ | % | |||||||||
| (Dollars in thousands) | ||||||||||||
| Provision for income taxes |
$ | 444 | $ | 467 | $ | 23 | 5.2 | % | ||||
Income tax expense for the three months ended March 31, 2010 and 2009 primarily consist of a deferred U.S. tax provision for the difference between book and tax treatment of goodwill associated with the acquisition of InfoSpace Mobile. We maintain a full valuation allowance against our net deferred tax assets which precludes us from recognizing a tax benefit for our current operating losses. Our lack of profitability historically is a key factor in concluding there is insufficient evidence of our ability to realize any future benefits from our deferred tax assets.
Net loss
| Three Months Ended March 31, |
Change | ||||||||||
| 2009 | 2010 | ||||||||||
| (In thousands) | |||||||||||
| Net loss |
$ | (6,971 | ) | $ | (1,533 | ) | $ | 5,438 | |||
The major factor leading to the $5.4 million decrease in net loss to $1.5 million was the $5.8 million increase in total revenues resulting from increases in professional service and managed service revenues of $5.1 million and $0.7 million, respectively. Total operating expenses were largely the same in both periods.
Year ended December 31, 2009 compared to the year ended December 31, 2008
Total revenues
| Year Ended December 31, |
Change | ||||||||||||
| 2008 | 2009 | $ | % | ||||||||||
| (Dollars in thousands) | |||||||||||||
| Managed services |
$ | 85,677 | $ | 81,403 | $ | (4,274 | ) | (5.0 | )% | ||||
| Professional services |
17,474 | 32,292 | 14,818 | 84.8 | |||||||||
| Total revenues |
$ | 103,151 | $ | 113,695 | $ | 10,544 | 10.2 | % | |||||
Our total revenues increased $10.5 million, or 10.2%, for the year ended December 31, 2009 compared to the year ended December 31, 2008. Managed services revenue accounted for 71.6% and 83.1% of our revenue for the years ended December 31, 2009 and 2008, respectively, while professional services accounted for 28.4% and 16.9%, respectively. The increase in revenues was due to the $14.8 million increase in professional services revenue, partially offset by the $4.3 million reduction in managed services revenue. The increase in professional services revenue was primarily due to a large portal customization and implementation project, which included $4.4 million of associated third-party computer hardware and software revenue, completed during 2009 for which we
63
Table of Contents
recognized the revenue based on completion milestones. Our professional services revenue can vary significantly from period to period due to the timing and magnitude of large customization and implementation projects.
The decrease in managed services revenue in 2009 consisted primarily of a $3.6 million reduction in storefront revenue due to the expiration of several small contracts and a $3.7 million reduction in storefront revenue due to declining transaction activity from two large customers. User- and transactional-based fees made up approximately 74% and 70% of our managed services revenue for 2008 and 2009, respectively, the decrease being primarily due to the decline in storefront transaction volumes. The average monthly number of users of our non-messaging based solutions increased to approximately 35 million in 2009 from approximately 33 million in 2008, although related managed services revenue did not increase due to mix changes among customers and associated pricing differences. The storefront contract expirations will not significantly impact managed services revenue comparisons with 2010 revenue as the expirations occurred late in 2008 or early in 2009. Managed services revenues are expected to increase in 2010 due in part to recent storefront contract modifications. The large portal project and two smaller portal implementation projects completed in the latter part of 2009 are expected to result in higher managed service revenues as the number of mobile subscriber utilizing those services increases.
We generated 95% of our revenue in the U.S. for the year ended December 31, 2009. Revenue from our current five largest customers, represented 84% of our total revenue for the year ended December 31, 2009, with AT&T and Verizon Wireless accounting for 53% and 20% of total revenue, respectively. For the year ended December 31, 2008, revenue from our five largest customers represented 67% of our total revenue, with AT&T and Verizon Wireless accounting for 42% and 12% of total revenue, respectively. No other customers accounted for more than 10% of our revenue during these periods.
Operating expenses
| Year Ended December 31, |
Change | ||||||||||||
| 2008 | 2009 | $ | % | ||||||||||
| (Dollars in thousands) | |||||||||||||
| Direct third-party expenses |
$ | 5,451 | $ | 9,485 | $ | 4,034 | 74.0 | % | |||||
| Datacenter and network operations, excluding depreciation |
33,000 | 31,786 | (1,214 | ) | (3.7 | ) | |||||||
| Product development and sustainment, excluding depreciation |
52,261 | 31,389 | (20,872 | ) | (39.9 | ) | |||||||
| Sales and marketing, excluding depreciation |
10,228 | 11,900 | 1,672 | 16.3 | |||||||||
| General and administrative, excluding depreciation |
26,052 | 20,841 | (5,211 | ) | (20.0 | ) | |||||||
| Depreciation and amortization |
21,559 | 13,208 | (8,351 | ) | (38.7 | ) | |||||||
| Restructuring |
3,236 | 2,058 | (1,178 | ) | (36.4 | ) | |||||||
| Goodwill and long-lived asset impairment charges |
29,130 | 5,806 | (23,324 | ) | (80.1 | ) | |||||||
| Total operating expenses |
$ | 180,917 | $ | 126,473 | $ | (54,444 | ) | (30.1 | )% | ||||
Our operating expenses were $126.5 million for the year ended December 31, 2009 compared to $180.9 million for the year ended December 31, 2008. The decrease of $54.4 million, or 30.1%, is primarily attributable to the $20.9 million decrease in product development expense, the $5.2 million decrease in general and administrative expense, the $8.4 million decrease in depreciation and amortization expense and significantly lower goodwill and long-lived asset impairment charges for year ended December 31, 2009 compared to the prior year period. Excluding the impact of restructuring and goodwill and long-lived asset impairment charges, operating expenses decreased $29.9 million during
64
Table of Contents
2009, even though direct third-party expenses increased $4.0 million. The reduction is primarily driven by approximately $16 million of cost efficiencies from outsourcing a portion of our development activities to India and operating efficiencies resulting from the integration and restructuring activities we initiated in 2008 after the acquisition of InfoSpace Mobile. These activities included the relocation of our corporate headquarters to Bellevue, Washington, the cost efficiencies from outsourcing a portion of our development activities and consolidation of our datacenters.
Direct third-party expenses
Direct third-party expenses increased $4.0 million, or 74.0%, for the year ended December 31, 2009 compared to the corresponding 2008 period. The increase is primarily due to the cost of third-party computer hardware and software purchased on behalf of a major customer as part of a large custom portal development and implementation project.
Datacenter and network operations, excluding depreciation
Datacenter and network operations expense, excluding depreciation, decreased $1.2 million, or 3.7%, for the year ended December 31, 2009 compared to the corresponding 2008 period. The decrease is primarily due to lower labor related costs, as we have consolidated datacenter operations since completing the InfoSpace Mobile acquisition in December 2007.
Product development and sustainment, excluding depreciation
Product development and sustainment expense, excluding depreciation, decreased $20.9 million, or 39.9%, for the year ended December 31, 2009 compared to the corresponding 2008 period. The decrease is primarily due to approximately $16 million of cost efficiencies from outsourcing a portion of our development activities to India. The remaining expense reduction was due primarily to lower labor-related costs as a result of operating efficiencies realized from the integration and restructuring activities we initiated in 2008.
Sales and marketing, excluding depreciation
Sales and marketing expense, excluding depreciation, increased $1.7 million, or 16.3%, for the year ended December 31, 2009 compared to the corresponding 2008 period. The increase is due to increases in our sales and marketing headcount as we grow the business.
General and administrative, excluding depreciation
General and administrative expense, excluding depreciation, decreased $5.2 million, or 20.0%, for the year ended December 31, 2009 compared to the corresponding 2008 period. The decrease is primarily due to lower labor-related costs as a result of operating efficiencies realized from the integration and restructuring activities we initiated in 2008.
Depreciation and amortization
Depreciation and amortization expense decreased $8.4 million, or 38.7%, for the year ended December 31, 2009 compared to the corresponding 2008 period. The decrease is primarily due to lower depreciation expense as a result of consolidating datacenters, impairing the remaining value of certain datacenter assets determined to be no longer recoverable and impairing certain capitalized software development costs and other amortized intangibles as noted in the long-lived asset impairment charges discussed below.
65
Table of Contents
Restructuring
During the year ended December 31, 2009, we incurred $2.1 million of restructuring charges to close our office in the United Kingdom, move our remaining employees in Durham, North Carolina from our former headquarters facility to a smaller facility and assign the lease for our former headquarters facility to a third party.
During the year ended December 31, 2008, we incurred $3.2 million of restructuring charges related to relocating our headquarters and certain key personnel to Bellevue, Washington and eliminating redundant functions and positions as a result of the InfoSpace Mobile acquisition.
Goodwill and long-lived asset impairment charges
The $5.8 million of impairments in the 2009 period relate primarily to writing off the remaining asset balances of $1.9 million and $3.3 million associated with the GPW customer list and capitalized software, respectively.
The $29.1 million of impairments in the 2008 period consisted of:
| Ÿ | $12.7 million related to restructuring of the business following the InfoSpace Mobile acquisition, including $8.2 million to impair computer software, furniture and fixtures and leasehold improvements associated with moving our headquarters to Bellevue, Washington and the planned shutdown of certain datacenter facilities, as well as $4.5 million for the planned shutdown of the Fuel software solution platform; |
| Ÿ | $6.8 million to impair the remaining GPW goodwill; |
| Ÿ | $4.6 million related to software assets from the InfoSpace Mobile acquisition based on our pricing decision to bundle our search functionality with our portal solution; |
| Ÿ | $3.8 million related to software assets from the InfoSpace Mobile acquisition based on the likelihood that two significant customers would no longer be utilizing our storefront solution; and |
| Ÿ | $1.2 million to impair the remaining customer relationship intangible from our acquisition of M7 Networks, Inc. in 2005. |
Other income (expense), net
| Year Ended December 31, |
Change | |||||||||||
| 2008 | 2009 | |||||||||||
| (In thousands) | ||||||||||||
| Other income (expense) |
$ | 1,892 | $ | (1,657 | ) | $ | (3,549 | ) | ||||
| Interest and investment income, net |
1,315 | 250 | (1,065 | ) | ||||||||
| Interest expense |
(493 | ) | (220 | ) | 273 | |||||||
| Total other income (expense), net |
$ | 2,714 | $ | (1,627 | ) | $ | (4,341 | ) | ||||
Other expense of $1.7 million for the year ended December 31, 2009 consists primarily of $1.5 million in expense related to the increase in fair value of our warrants to purchase redeemable preferred shares. Other income of $1.9 million for the year ended December 31, 2008 is primarily the result of billings to InfoSpace, Inc. (during an agreed transition period) for use of shared facilities acquired as part of the InfoSpace Mobile acquisition at the end of 2007. The higher net interest and investment income in 2008 primarily reflects the higher average cash and investment balances during the 2008 period relative to 2009. Our interest expense decreased to $0.2 million for the year ended December 31, 2009 compared to $0.5 million for the year ended December 31, 2008, due to the repayment of our remaining outstanding debt in April 2009.
66
Table of Contents
Provision for income taxes
| Year Ended December 31, |
Change | |||||||||||
| 2008 | 2009 | $ | % | |||||||||
| (Dollars in thousands) | ||||||||||||
| Provision for income taxes |
$ | 1,776 | $ | 1,896 | $ | 120 | 6.8 | % | ||||
Income tax expense for years ended December 31, 2009 and 2008 primarily consists of a U.S. tax provision for the difference between book and tax treatment of goodwill associated with the acquisition of InfoSpace Mobile. We maintain a full valuation allowance against our net deferred tax assets which precludes us from recognizing a tax benefit for our current operating losses. Our lack of profitability historically is a key factor in concluding that there is insufficient evidence of our ability to realize any future benefits from our deferred tax assets.
Discontinued operations
| Year Ended December 31, |
Change | |||||||||
| 2008 | 2009 | |||||||||
| (In thousands) | ||||||||||
| Loss from discontinued operations |
$ | (1,072 | ) | $ | — | $ | 1,072 | |||
| Loss from sale of discontinued operations |
$ | (127 | ) | $ | — | $ | 127 | |||
The loss from discontinued operations in 2008 consists of losses from the portion of the direct to consumer business line sold in 2008 and the media and entertainment business that was discontinued in 2008.
Net loss
| Year Ended December 31, |
Change | ||||||||||
| 2008 | 2009 | ||||||||||
| (In thousands) | |||||||||||
| Net loss |
$ | (78,027 | ) | $ | (16,301 | ) | $ | 61,726 | |||
The major factors leading to the $61.7 million decrease in net loss to $16.3 million were:
| Ÿ | A $10.5 million increase in revenue resulting from increased professional services revenues, partially offset by reduced managed services revenue; |
| Ÿ | A $54.4 million reduction in total operating expenses due primarily to a $23.3 million reduction in impairment charges, approximately $16 million expense reduction associated with the outsourcing of certain development activities to India and the remaining reduction was due to the late 2008 completion of many major elements of the plan to integrate the InfoSpace Mobile acquisition. This plan included elimination of most redundant functions and staffing, the relocation of our headquarters to Bellevue, Washington, and consolidation of certain datacenters; and |
| Ÿ | A $1.2 million reduction in losses from discontinued operations and related losses upon disposition. |
These improvements in operating results were partially offset by a $4.3 million reduction in other income (expense), net due primarily to the absence of fees in 2009 that were charged to InfoSpace, Inc. in 2008 (during an agreed transition period) for InfoSpace’s use of certain facilities that we acquired in the InfoSpace Mobile acquisition at the end of 2007.
67
Table of Contents
Year ended December 31, 2008 compared to the year ended December 31, 2007
Total revenues
| Year Ended December 31, | Change | |||||||||||
| 2007 | 2008 | $ | % | |||||||||
| (Dollars in thousands) | ||||||||||||
| Managed services |
$ | 31,772 | $ | 85,677 | $ | 53,905 | 169.7 | % | ||||
| Professional services |
3,399 | 17,474 | 14,075 | 414.1 | ||||||||
| Total revenues |
$ | 35,171 | $ | 103,151 | $ | 67,980 | 193.3 | % | ||||
Our total revenues were $103.2 million for the year ended December 31, 2008 compared to $35.2 million for the year ended December 31, 2007, an increase of $68.0 million, or 193.3%. This increase was primarily attributable to the acquisition of InfoSpace Mobile at the end of 2007. InfoSpace Mobile generated approximately $55 million of revenue in 2007, prior to our acquisition of the business. The organic growth of Motricity revenue was approximately 13% from 2007 to 2008, and the growth rate from the acquired InfoSpace Mobile business was slightly higher at 15%. In both instances, we believe this growth represents additional revenues from existing customers. The structure of the customer arrangements under the InfoSpace Mobile business model resulted in a higher percentage of revenue from professional services relative to Motricity, which is reflected in the high growth in professional services revenue in our 2008 results.
Operating expenses
| Year Ended December 31, | Change | ||||||||||||
| 2007 | 2008 | $ | % | ||||||||||
| (Dollars in thousands) | |||||||||||||
| Direct third-party expenses |
$ | 3,709 | $ | 5,451 | $ | 1,742 | 47.0 | % | |||||
| Datacenter and network operations, excluding depreciation |
9,468 | 33,000 | 23,532 | 248.5 | |||||||||
| Product development and sustainment, excluding depreciation |
16,229 | 52,261 | 36,032 | 222.0 | |||||||||
| Sales and marketing, excluding depreciation |
7,119 | 10,228 | 3,109 | 43.7 | |||||||||
| General and administrative, excluding depreciation |
10,334 | 26,052 | 15,718 | 152.1 | |||||||||
| Depreciation and amortization |
10,322 | 21,559 | 11,237 | 108.9 | |||||||||
| Restructuring |
1,283 | 3,236 | 1,953 | 152.2 | |||||||||
| Goodwill and long-lived asset impairment charges |
26,867 | 29,130 | 2,263 | 8.4 | |||||||||
| Abandoned transaction charge |
2,600 | — | (2,600 | ) | — | ||||||||
| Total operating expenses |
$ | 87,931 | $ | 180,917 | $ | 92,986 | 105.7 | % | |||||
Our operating expenses were $180.9 million for the year ended December 31, 2008 compared to $87.9 million for the year ended December 31, 2007, an increase of $93.0 million, or 105.7%. In 2008, operating expenses were significantly higher relative to 2007 as a result of our acquisition of InfoSpace Mobile. We operated for much of 2008 with duplicate work forces and facilities in North Carolina and Washington while we executed acquisition integration activities and relocated our headquarters to Bellevue, Washington. As a percentage of revenue, our total operating expenses decreased to 175% for the year ended December 31, 2008 compared to 250% for 2007, primarily as a result of the significant revenue increase, proportionately lower asset impairment charges and decreases in other operating expenses in the second half of 2008 as initial integration activities were completed.
Direct third-party expenses
Direct third-party expenses of $5.5 million for the year ended December 31, 2008 represents an increase of $1.7 million, or 47.0%, compared to 2007. Direct third-party expenses as a percentage of
68
Table of Contents
revenue decreased to 5.3% for the year ended December 31, 2008 compared to 10.5% in 2007, reflecting better leverage on content-related expenses in 2008 primarily as a result of the significant increase in revenue.
Datacenter and network operations, excluding depreciation
Datacenter and network operations expense, excluding depreciation, increased $23.5 million, or 248.5%, for the year ended December 31, 2008 compared to the corresponding 2007 period. The increase is primarily due to the acquisition of InfoSpace Mobile, which had multiple, large datacenters with higher operating expenses. We operated for most of 2008 with duplicate infrastructure and also incurred additional operating expenses in connection with integrating the acquired infrastructure.
Product development and sustainment, excluding depreciation
Product development and sustainment expense, excluding depreciation, increased $36.0 million, or 222.0%, for the year ended December 31, 2008 compared to 2007. The increase is primarily due to the acquisition of InfoSpace Mobile at the end of 2007. InfoSpace Mobile operated with a substantially larger development organization, in part due to greater emphasis on professional services work, and relied more heavily on the use of higher cost contract labor. In addition, we operated for most of 2008 with duplicate resources to support and integrate the two different software infrastructures, mCore and Fuel, which are based on different technologies.
Sales and marketing, excluding depreciation
Sales and marketing expense, excluding depreciation, increased $3.1 million, or 43.7%, for the year ended December 31, 2008 compared to 2007. The increase is primarily due to the acquisition of InfoSpace Mobile. Sales and marketing expense as a percentage of revenue decreased to 9.9% for the year ended December 31, 2008 compared to 20.2% in 2007. The reduction in expenses as a percentage of revenue reflects our decision to reduce marketing and certain sales activities while we revamped our service offerings during the process of integrating the InfoSpace Mobile acquisition, including the mCore and Fuel solution and service platforms. During this integration process we enhanced and extended the capabilities of the mCore platform to provide a more comprehensive and robust offering, and thereafter began to market and sell services utilizing that platform more aggressively.
General and administrative, excluding depreciation
G&A expense, excluding depreciation, increased $15.7 million, or 152.1%, for the year ended December 31, 2008 compared to 2007. The increase was primarily due to the acquisition of InfoSpace Mobile, as we were operating with duplicate infrastructure and conducting acquisition integration activities for much of the year. G&A expense as a percentage of revenue decreased to 25.3% for the year ended December 31, 2008 compared to 29.4% in 2007, due mainly to elimination of redundant functions and staffing in the second half of 2008.
Depreciation and amortization
Depreciation and amortization expense increased from $10.3 million in 2007 to $21.6 million in 2008, or 108.9%, due to the InfoSpace Mobile acquisition at the end of 2007. A total of $58.4 million of property and equipment and amortizable intangible assets was recorded as part of the purchase price allocation for the acquisition. This increased the balance of our depreciable and amortizable assets by 193%, which resulted in the higher depreciation expense in 2008.
69
Table of Contents
Restructuring
During the year ended December 31, 2008, we incurred restructuring charges related to relocating our headquarters and certain key personnel to Bellevue, Washington, and eliminating redundant functions and positions following completion of the InfoSpace Mobile acquisition.
In the first half of 2007, we closed our San Diego and Los Angeles, California offices and relocated employees to our corporate headquarters (then located in Durham, North Carolina).
Goodwill and long-lived asset impairment charges
The $29.1 million of impairment charges in the 2008 period consisted of:
| Ÿ | $12.7 million related to restructuring of the business following the InfoSpace Mobile acquisition, including $8.2 million to impair computer software, furniture and fixtures and leasehold improvements associated with moving our headquarters to Bellevue, Washington and the planned shutdown of certain datacenter facilities, as well as $4.5 million for the planned shutdown of the Fuel software solution platform; |
| Ÿ | $6.8 million to impair the remaining GPW goodwill; |
| Ÿ | $4.6 million related to software assets from the InfoSpace Mobile acquisition based on our pricing decision to bundle our search functionality with our portal solution; |
| Ÿ | $3.8 million related to software assets from the InfoSpace Mobile acquisition based on the likelihood that two significant customers would no longer be utilizing our storefront solution; and |
| Ÿ | $1.2 million to impair the remaining customer relationship intangible from our acquisition of M7 Networks, Inc. in 2005. |
In 2007, we recorded asset impairment charges of $26.9 million to write off the goodwill associated with our mobile network operator reporting unit, which represents our primary operations, and a large portion of the goodwill associated with the GPW reporting unit. The annual impairment test performed on the mobile network operator reporting unit indicated that changes in consumer purchasing habits were producing lower revenues and margins than originally forecasted, resulting in a goodwill impairment of $12.1 million. In addition, the annual impairment test performed on the GPW reporting unit indicated that unanticipated competitive dynamics in the messaging marketplace generated lower revenues and cash flows than were originally projected, resulting in a goodwill impairment of $14.8 million.
Abandoned transaction charge
In 2007, we issued a warrant to purchase common shares to an affiliate of an existing investor as consideration for a financing commitment in connection with a proposed transaction that was not completed. The expense of $2.6 million represents the fair value of the warrant upon issuance.
Other income (expense), net
| Year Ended December 31, | ||||||||||||
| 2007 | 2008 | Change | ||||||||||
| (In thousands) | ||||||||||||
| Other income |
$ | 79 | $ | 1,892 | $ | 1,813 | ||||||
| Interest and investment income, net |
2,157 | 1,315 | (842 | ) | ||||||||
| Interest expense |
(1,081 | ) | (493 | ) | 588 | |||||||
| Total other income (expense), net |
$ | 1,155 | $ | 2,714 | $ | 1,559 | ||||||
70
Table of Contents
Other income of $1.9 million for 2008 is primarily the result of billings to InfoSpace, Inc. (during an agreed transition period) for use of facilities that we acquired as part of the InfoSpace Mobile acquisition at the end of 2007. Our interest and investment income, net of interest expense, was $0.8 million for the year ended December 31, 2008 compared to $1.1 million for the year ended December 31, 2007 due to higher average cash and investment balances during 2007 and lower average debt balances during 2008.
Provision for income taxes
| Year Ended December 31, | |||||||||
| 2007 | 2008 | Change | |||||||
| (In thousands) | |||||||||
| Income tax provision |
$ | — | $ | 1,776 | $ | 1,776 | |||
The income tax provision for the year ended December 31, 2008 primarily consists of a deferred U.S. tax provision for the difference between book and tax treatment of goodwill associated with the acquisition of the InfoSpace Mobile assets. We maintain a full valuation allowance against our net deferred tax assets which precludes us from recognizing a tax benefit for our current operating losses. Our lack of profitability historically is a key factor in concluding there is insufficient evidence of our future ability to realize any future benefits from our deferred tax assets.
Discontinued operations
| Year Ended December 31, | Change | ||||||||||
| 2007 | 2008 | ||||||||||
| (In thousands) | |||||||||||
| Loss from discontinued operations |
$ | (24,928 | ) | $ | (1,072 | ) | $ | 23,856 | |||
| Loss from sale of discontinued operations |
(1,360 | ) | (127 | ) | 1,233 | ||||||
The loss from discontinued operations in both periods consists primarily of losses from the direct to consumer business line sold in two transactions in 2007 and 2008 and the media and entertainment business discontinued in 2008. The substantially higher losses in 2007 resulted primarily from high marketing and operating expenses related to the media and entertainment business, which were largely mitigated late in 2007 in conjunction with the decision to wind down the business. Results for 2007 also include a goodwill impairment of $2.9 million related to the direct to consumer business.
Net loss
| Year Ended December 31, | Change | |||||||||||
| 2007 | 2008 | |||||||||||
| (In thousands) |
||||||||||||
| Net loss |
$ | (77,893 | ) | $ | (78,027 | ) | $ | (134 | ) | |||
The net losses for both periods were consistent, although different factors contributed to the losses in each year as follows:
| Ÿ | The InfoSpace Mobile acquisition, combined with revenue growth from both former InfoSpace Mobile and Motricity customer accounts resulted in 2008 revenue growth of $68.0 million, or 193.3%, compared to 2007. The growth in revenue was more than offset by the additional cost structure acquired as part of InfoSpace Mobile. |
| Ÿ | A $93.0 million (105.7%) increase in operating expenses from 2007 to 2008 primarily reflects the significant cost structure acquired in the InfoSpace Mobile acquisition. The operating expenses that experienced the most significant increases in 2008 included datacenter and |
71
Table of Contents
| network operations, which was up 248.5%, product development and sustainment, which was up 222.0%, G&A, which was up 152.1%, and depreciation and amortization, which was up 108.9%. |
| Ÿ | In 2007, the net loss included losses from discontinued operations and related sales of $26.3 million compared to losses of $1.2 million in 2008. |
Quarterly Results of Operations
The following table sets forth our unaudited quarterly consolidated statements of operations and other data for the year ended December 31, 2009 and the three months ended March 31, 2010. We have prepared the unaudited statement of operations data on the same basis as the audited consolidated financial statements included in this prospectus, and have included, in our opinion, all adjustments, consisting only of normal recurring adjustments, that we consider necessary for a fair presentation of the financial information set forth in those statements. Quarterly results are not necessarily indicative of the operating results to be expected for the full fiscal year. You should read this data together with our consolidated financial statements and the related notes included elsewhere in this prospectus.
| For the Three Months Ended, | ||||||||||||||||||||
| March 31, 2009 | June 30, 2009 | September 30, 2009 | December 31, 2009 | March 31, 2010 | ||||||||||||||||
| (In thousands, except per share data) | ||||||||||||||||||||
| Revenue |
||||||||||||||||||||
| Managed services |
$ | 20,222 | $ | 20,314 | $ | 20,417 | $ | 20,450 | $ | 20,881 | ||||||||||
| Professional services |
3,054 | 16,694 | 7,672 | 4,872 | 8,199 | |||||||||||||||
| Total revenues |
23,276 | 37,008 | 28,089 | 25,322 | 29,080 | |||||||||||||||
| Operating expenses |
||||||||||||||||||||
| Direct third-party expenses |
1,171 | 5,366 | 1,611 | 1,337 | 1,305 | |||||||||||||||
| Datacenter and network operations, excluding depreciation |
8,683 | 7,786 | 7,185 | 8,132 | 8,034 | |||||||||||||||
| Product development and sustainment, excluding depreciation |
7,677 | 9,739 | 6,672 | 7,301 | 8,182 | |||||||||||||||
| Sales and marketing, excluding depreciation |
2,989 | 2,763 | 2,708 | 3,440 | 3,655 | |||||||||||||||
| General and administrative, excluding depreciation |
5,175 | 4,495 | 5,270 | 5,901 | 5,264 | |||||||||||||||
| Depreciation and amortization |
3,777 | 3,205 | 3,248 | 2,978 | 3,041 | |||||||||||||||
| Restructuring |
235 | 712 | 1,010 | 101 | 407 | |||||||||||||||
| Goodwill and long-lived asset impairment charges |
— | 5,488 | 318 | — | — | |||||||||||||||
| Total operating expenses |
29,707 | 39,554 | 28,022 | 29,190 | 29,888 | |||||||||||||||
| Operating income (loss) |
(6,431 | ) | (2,546 | ) | 67 | (3,868 | ) | (808 | ) | |||||||||||
| Other income (expense), net |
(96 | ) | (198 | ) | (1,342 | ) | 9 | (258 | ) | |||||||||||
| Loss from continuing operations, before income taxes |
(6,527 | ) | (2,744 | ) | (1,275 | ) | (3,859 | ) | (1,066 | ) | ||||||||||
| Provision for income taxes |
444 | 444 | 517 | 491 | 467 | |||||||||||||||
| Net loss |
(6,971 | ) | (3,188 | ) | (1,792 | ) | (4,350 | ) | (1,533 | ) | ||||||||||
| Accretion of redeemable preferred stock and Series D1 preferred dividends |
(5,987 | ) | (5,987 | ) | (5,992 | ) | (5,990 | ) | (6,400 | ) | ||||||||||
| Net loss attributable to common stockholders |
$ | (12,958 | ) | $ | (9,175 | ) | $ | (7,784 | ) | $ | (10,340 | ) | $ | (7,933 | ) | |||||
| Basic and fully diluted net loss per share attributable to common stockholders |
$ | (2.20 | ) | $ | (1.55 | ) | $ | (1.31 | ) | $ | (1.79 | ) | $ | (1.38 | ) | |||||
| Weighted-average number of shares of common stock used in computing basic net loss per share attributable to common stockholders |
5,887 | 5,930 | 5,931 | 5,767 | 5,753 | |||||||||||||||
| Other Data |
||||||||||||||||||||
| Percentage of managed services revenue that varies with number of users and transactions |
76 | % | 74 | % | 70 | % | 57 | % | 52 | % | ||||||||||
| Average non-messaging based solution users (in millions) |
34.5 | 35.6 | 35.5 | 34.3 | 34.4 | |||||||||||||||
72
Table of Contents
During the fourth quarter of 2009, we identified certain correcting adjustments in our financial results for the nine months ended September 30, 2009. These adjustments increased our net loss by $0.3 million, $0.06 million and $0.8 million in the quarters ended March 31, June 30 and September 30, 2009, respectively, and have been corrected in each of the quarters presented in the table above.
A reconciliation of Adjusted EBITDA to net loss from continuing operations for each of the quarterly periods is as follows:
| For the Three Months Ended, | ||||||||||||||||||||
| March 31, 2009 |
June 30, 2009 |
September 30, 2009 |
December 31, 2009 |
March 31, 2010 |
||||||||||||||||
| (In thousands) | ||||||||||||||||||||
| Net loss |
$ | (6,971 | ) | $ | (3,188 | ) | $ | (1,792 | ) | $ | (4,350 | ) | $ | (1,533 | ) | |||||
| Interest and other income (expense), net |
96 | 198 | 1,342 | (9 | ) | 258 | ||||||||||||||
| Provision for income taxes |
444 | 444 | 517 | 491 | 467 | |||||||||||||||
| Depreciation and amortization |
3,777 | 3,205 | 3,248 | 2,978 | 3,041 | |||||||||||||||
| Restructuring and asset impairments |
235 | 6,200 | 1,328 | 101 | 407 | |||||||||||||||
| Stock-based compensation |
532 | 556 | 580 | 511 | 505 | |||||||||||||||
| Adjusted EBITDA |
$ | (1,887 | ) | $ | 7,415 | $ | 5,223 | $ | (278 | ) | $ | 3,145 | ||||||||
Our operating results may fluctuate due to a variety of factors, many of which are outside of our control. As a result, comparing our operating results on a period-to-period basis may not be meaningful. You should not rely on our past results as an indication of our future performance.
Liquidity and Capital Resources
General
We have financed our operations primarily through issuances of redeemable preferred stock, borrowings under our revolving credit facility, and more recently, from cash provided by operating activities. We intend to use the net proceeds from this offering to fund investments in, and acquisitions of, competitive and complementary businesses, products or technologies. As of the date of this prospectus, we do not have any agreements or understandings in place with respect to any investments or acquisitions, although we are continually exploring potential opportunities.
Our principal sources of liquidity as of March 31, 2010 consisted of cash of $25.4 million and $8.1 million of availability under our $25.0 million revolving credit facility.
Our principal needs for liquidity have been to fund operating losses, working capital requirements, capital expenditures, acquisitions and for debt service. We expect that working capital requirements, capital expenditures and acquisitions will continue to be our principal needs for liquidity over the near term. Working capital requirements are expected to increase as a result of our growth, both organically and through future acquisitions. The main portion of our capital expenditures has been, and is expected to continue to be, for datacenter facilities and equipment and product development. We believe that our cash flow from operations, available cash and cash equivalents (including the net proceeds from this offering) and available borrowings under our revolving credit facility will be sufficient to meet our liquidity needs for at least the next 12 months, although such sources of liquidity may not be sufficient to fund any significant acquisitions we might decide to pursue. Our Series H preferred stock becomes redeemable on August 31, 2013. On or after such date, upon request of at least a majority of the then outstanding shares of Series H preferred stock, we must redeem the Series H preferred stock in immediately available funds or by the issuance of a promissory note which shall bear simple interest at the rate of 4% per annum and shall be payable in eight consecutive quarterly installments with the first such installment becoming due and payable on the first anniversary of the redemption payment date (determined once such written request is received); provided, however, that in lieu of receiving the redemption payment in the form of a
73
Table of Contents
promissory note, any holder of Series H preferred stock may instead elect to be redeemed quarterly and receive the redemption payment in eight consecutive quarterly installments. Consequently, we will need to have sufficient liquidity to permit us to redeem the outstanding Series H preferred stock on or after August 31, 2013 or satisfy our obligations under the promissory notes issued. Our existing revolving credit facility matures on April 13, 2011. We anticipate that to the extent we require additional liquidity, we will seek to increase borrowing availability under our existing credit facility, pursue a new, expanded bank borrowing facility, explore additional debt or equity financing options or pursue a combination of some or all of these alternatives.
The credit markets have experienced extreme volatility and disruption that reached unprecedented levels during late 2008 and through much of 2009. The market for new debt financing (including bank borrowing) was extremely limited, and in some cases debt financing was available only on very expensive terms or not at all. While market conditions have improved recently, the credit markets—and the capital markets generally, including the equity markets—remain volatile and capital availability remains relatively limited. Accordingly, if we require additional debt or equity financing, we may not be able to obtain it on terms we consider favorable to us or at all. In addition, our liquidity and our ability to meet our obligations and fund our capital requirements depends upon the future financial performance of our business, which is subject to general economic, financial and other factors that are beyond our control. While the severe recession that negatively affected the global economy beginning in 2008 may be coming to an end, general economic conditions and the prospects for renewed economic growth throughout the world remain uncertain. Accordingly, we cannot assure you that our business will generate sufficient cash flow from operations, that future borrowings will be available under our credit facility or otherwise, or that additional sources of liquidity will be available in amounts sufficient to meet our future liquidity needs.
Although we have no specific current plans to do so, if we decide to pursue one or more significant strategic acquisitions, we would likely need to incur additional debt or sell additional equity to finance such transactions.
Cash Flows
As of March 31, 2010 and December 31, 2009, 2008, and 2007, we had cash and cash equivalents of $25.4 million, $35.9 million, $14.3 million and $67.4 million, respectively.
Operating Activities
In fiscal 2007, operating activities used $41.5 million in cash as a result of a net loss of $77.9 million, less non-cash items including depreciation and amortization of $10.9 million, goodwill and long-lived asset impairment charges of $29.7 million and an abandoned transaction charge of $2.6 million. Working capital sources of cash were related to a $2.7 million decrease in prepaid expenses and other assets and an increase in deferred revenue of $0.8 million. These sources of cash were primarily offset by an $11.9 million increase in accounts receivable due to accounts receivable balances from the InfoSpace Mobile acquisition.
In fiscal 2008, operating activities used $28.7 million in cash as a result of a net loss of $78.0 million, less non-cash items including depreciation and amortization of $21.6 million, goodwill and long-lived asset impairment charges of $29.1 million and stock-based compensation expense of $2.3 million. Working capital sources of cash were primarily related to a $2.0 million decrease in accounts receivable and an increase of $7.1 million in deferred revenue, attributable to increased professional services billings. These sources of cash were offset primarily by a $16.8 million decrease in accounts payable due primarily to payments of liabilities assumed as part of the InfoSpace Mobile acquisition in December 2007.
In fiscal 2009, operating activities provided $33.1 million of cash despite a net loss of $16.3 million, primarily as a result of cash from working capital sources and due to the inclusion of non-cash
74
Table of Contents
items in our operating results. Working capital sources of cash were primarily related to a $20.7 million decrease in accounts receivable due to strong collection efforts and the timing of collections surrounding our professional service projects and a $2.5 million increase in deferred revenue attributable primarily to increased billing for our professional services. Our accounts receivable terms are typically 30 to 45 days, and, for certain types of customers, can be up to 60 days. Non-cash items included in our operating results include depreciation and amortization amounts of $13.2 million, goodwill and long-lived asset impairment charges of $5.8 million, stock-based compensation expense of $2.2 million, deferred tax liability of $2.0 million and changes in the fair value of redeemable preferred stock warrants of $1.5 million.
In the first three months of fiscal 2009, operating activities used $1.8 million in cash as a result of net loss of $7.0 million, less non-cash items, including depreciation and amortization of $3.8 million and stock-based compensation expense of $0.5 million. Working capital sources of cash were primarily related to a $7.9 million decrease in accounts receivable due to strong collection efforts and the timing of collections surrounding our professional service projects. This source of cash was offset primarily by a $5.0 million decrease in accounts payable due primarily to payments of liabilities.
In the first three months of fiscal 2010, operating activities used $8.0 million primarily as a result of payments reducing accounts payable and accrued expenses by $6.0 million, a $6.9 million reduction in deferred revenue and the net loss of $1.5 million. These uses of cash were partially offset by a $1.7 million reduction in current and long-term assets, and non-cash items included in our operating results, including $3.0 million of depreciation and amortization, $0.5 million of stock-based compensation expense, a $0.5 million increase in deferred tax liability and a $0.4 million loss on disposition of assets held for sale.
Investing Activities
Investing activities have involved primarily purchases of businesses and capital expenditures. For the years ended December 31, 2007 and 2008, we had acquisition costs of $137.0 million (incurred to acquire InfoSpace Mobile) and $1.1 million, respectively. We incurred no acquisition costs during 2009 or the first three months of 2010. In 2009 and the first three months of 2010, our cash capital expenditures totaled $4.9 million and $2.3 million, respectively. Our capital expenditures are typically for routine purchases of computer equipment to maintain and upgrade our technology infrastructure and for development of software to provide services to our customers. We anticipate future capital expenditures for maintenance, support and enhancements of existing technology and continued investments in new technologies. Our software development investments consist primarily of development, testing and deployment of new applications and new functionality to existing applications. We expect our capital expenditures over the next year to increase to approximately $18 million due primarily to increased capitalized software development activity, which is expected to represent approximately half of the capital expenditures. Although we have financed some of these purchases in the past, we anticipate funding future capital expenditures with cash flows from operations. Additionally, in the first three months of 2010, we realized $1.2 million of cash associated with the sale of assets held for sale.
Financing Activities
Until recently, financing activities provided us with funding for all of our liquidity needs, including operating losses, capital expenditures and acquisitions. In 2007, we financed the acquisition of InfoSpace Mobile and subsequent operating needs of the business with proceeds from the issuance of Series H and I redeemable preferred stock, net of issuance costs, totaling $221.7 million.
Due to recent improvements in the operating performance of our business and the absence of any additional acquisitions, we repaid our outstanding debt in April 2009 and have not needed to borrow additional amounts under our credit facility or obtain other financing to fund operations and
75
Table of Contents
capital expenditures. However, we have used the revolving credit facility in the past to fund a portion of our operating needs and may need to do so again in the future. Our cash flows from operations fluctuate from period to period due to various factors, both known and unforeseen. These factors may include changes in working capital from inconsistent timing of cash receipts and payments for items such as accounts payable, incentive compensation, changes in deferred revenue, interest payments and other various items. In addition, significant acquisitions and organic growth impact net cash flows from operations due to growth in revenue and associated working capital requirements.
Credit Facility
We are party to a credit facility with Silicon Valley Bank pursuant to which we can borrow up to $25 million in secured loans. The availability under the credit facility is subject to a borrowing base calculated based on qualifying accounts receivable. The interest rate on any borrowings is based on the lender’s prime rate plus a margin ranging between 50 to 150 basis points depending on our trailing EBITDA. The minimum interest rate is 5.50%. The credit facility restricts, among other things, our ability to incur indebtedness, create or permit liens on our assets, declare or pay dividends and certain other restricted payments, consolidate, merge or recapitalize, acquire or sell assets, make certain investments, loans or other advances, and enter into transactions with affiliates. The credit facility requires us to maintain a “tangible net worth” of $15 million. The credit facility terminates in April 2011. As of December 31, 2009 and March 31, 2010, there were no outstanding amounts under the credit facility. As of March 31, 2010, we had borrowing capability of approximately $8.1 million.
Contractual Obligations and Other Commitments
There have been no material changes outside of the normal course of business to our contractual obligations and other commitments since December 31, 2009. As of December 31, 2009, our contractual obligations and other commitments were as follows:
| Payments due by Period | |||||||||||||||
| Total | Less than 1 year |
1-3 years |
3-5 years | More than 5 years | |||||||||||
| (In thousands) | |||||||||||||||
| Operating lease obligations(1) |
$ | 12,512 | $ | 4,900 | $ | 4,908 | $ | 2,704 | $ | — | |||||
| Commitments to network service providers(2) |
6,274 | 4,135 | 2,139 | — | — | ||||||||||
| Additional contractual commitments(3) |
2,020 | 2,020 | — | — | — | ||||||||||
| Total |
$ | 20,806 | $ | 11,055 | $ | 7,047 | $ | 2,704 | $ | — | |||||
| (1) | Includes operating lease commitments for facilities and equipment that we have entered into with third parties. Also includes the payments associated with the lease of our former corporate headquarters in Durham, North Carolina that was assigned to a third party effective May 1, 2009. As a result of the assignment, we are required to pay 23 months of rent on behalf of the assignee and make a $0.3 million payment at the end of that period to subsidize future operating expenses. As of December 31, 2008, we had placed in escrow $0.95 million as security for our original lease, and that sum was returned to us upon assignment of the lease. As of December 31, 2009, we have placed in escrow $1.4 million as security for the last 10 payments to be made under the agreement to assign the lease. |
| (2) | We have entered into several agreements with third-party network service providers, who provide additional operational support for our various datacenters. |
| (3) | We have entered into a professional services agreement which expires on December 31, 2010. |
Off-Balance Sheet Arrangements
We have no off-balance sheet financing arrangements or other financing activities with special-purpose entities other than our operating leases.
76
Table of Contents
Qualitative and Quantitative Disclosures about Market Risk
Interest Rate Risk
At March 31, 2010, we had cash and cash equivalents of $25.4 million. These amounts are held primarily in cash and money market funds. We do not enter into investments for trading or speculative purposes. Due to the short-term nature of these investments, we believe that we do not have any material exposure to changes in the fair value of our investment portfolio as a result of changes in interest rates.
We are exposed to interest rate risk to the extent we incur borrowings under our credit facility. Any borrowings under our revolving credit facility will bear interest at floating rates based on the lender’s prime rate plus a margin ranging between 50 to 150 basis points depending on our trailing EBITDA, with a minimum interest rate of 5.50%. For variable rate debt, interest rate changes generally do not affect the fair value of the debt instrument, but do impact future earnings and cash flows, assuming other factors are held constant. We do not expect to incur significant borrowings under our credit facility in 2010, and therefore we do not believe that a 10% increase in interest rates would have a significant impact on our operating results, future earnings, or liquidity.
Effects of Inflation
Inflation generally affects us by increasing costs of labor, supplies and equipment. We do not believe that inflation has had any material effect on our business, financial condition or results of operations in the last three fiscal years. Although we do not expect that inflation or changing prices will materially affect our business in the foreseeable future, if our costs were to become subject to significant inflationary pressures, we might not be able to offset these higher costs fully through price increases. Our inability or failure to do so could harm our business, operating results and financial condition.
Recent Accounting Pronouncements
In September 2009, the Financial Accounting Standards Board, or FASB, Emerging Issues Task Force issued authoritative guidance addressing revenue recognition arrangements with multiple deliverables. The guidance requires revenue to be allocated to multiple elements using relative fair value based on vendor specific objective evidence, third-party evidence, or estimated selling price. The residual method also becomes obsolete under this guidance. The new guidance is effective for fiscal years beginning on or after June 15, 2010. We are currently evaluating the impact of the implementation of this guidance on our financial position, results of operations and cash flows.
In January 2010, the FASB issued updated guidance related to fair value measurements and disclosures, which requires a reporting entity to disclose separately the amounts of significant transfers in and out of Level 1 and Level 2 fair value measurements and to describe the reasons for the transfers. In addition, in the reconciliation for fair value measurements using significant unobservable inputs, or Level 3, a reporting entity should disclose separately information about purchases, sales, issuances and settlements (that is, on a gross basis rather than one net number). The updated guidance also requires that an entity should provide fair value measurement disclosures for each class of assets and liabilities and disclosures about the valuation techniques and inputs used to measure fair value for both recurring and non-recurring fair value measurements for Level 2 and Level 3 fair value measurements. The updated guidance is effective for interim or annual financial reporting periods beginning after December 15, 2009, except for the disclosures about purchases, sales, issuances and settlements in the roll forward activity in Level 3 fair value measurements, which are effective for fiscal years beginning after December 15, 2010 and for interim periods within those fiscal years. The adoption of this statement in the first quarter of fiscal 2010 did not have a material impact on our consolidated financial statements, as the principal impact from this update relates to our fair value measurements disclosure.
77
Table of Contents
Overview
We are a leading provider of mobile data solutions that enable wireless carriers to deliver high value mobile data services to their subscribers. We provide a comprehensive suite of hosted, managed service offerings, which includes services to access the Internet using a mobile device, services to market and distribute a wide range of mobile content and applications, messaging services and billing support and settlement services. These services enable wireless carriers to deliver customized, carrier-branded mobile data services.
Our mCore service delivery platform provides the tools for mobile subscribers to easily locate and access personally relevant and location-based content and services, engage in social networking and download content and applications. We also leverage our data-rich insights into subscriber behavior and our user interface expertise to provide a highly personalized mobile data experience and targeted mobile marketing solutions. By enabling wireless carriers to deliver a personalized subscriber experience, we enhance their ability to attract and retain mobile subscribers, increase the average revenue per user for mobile data services, or mobile data ARPU, and reduce network overhead and operating costs. We also facilitate effective monetization for mobile content and application providers by making it easier for them to reach millions of targeted subscribers with customized offerings.
Our operations are predominantly based in the U.S., with international operations in the United Kingdom, the Netherlands, Indonesia and Singapore. Our customers include 4 of the top 10 global wireless carriers based on total wireless data revenue: Verizon Wireless, AT&T, Sprint and T-Mobile USA. Since 2005, Motricity has generated over $2.5 billion in gross revenue for our carrier customers through the sale of content and applications and powered over 50 billion page views through access to the mobile Internet. For the year ended December 31, 2009, we generated revenue of $113.7 million and incurred a net loss of $16.3 million. For the twelve months ended March 31, 2010, we generated revenue of $119.5 million and incurred a net loss of $10.9 million.
Industry Background
The Market for Mobile Data Services
The number of mobile subscribers has grown rapidly over the past 10 years. The Yankee Group, an independent market research firm, estimates that the number of mobile subscribers in the U.S. will grow from 285 million in 2009 to 304 million in 2013, and worldwide will grow from 4.4 billion in 2009 to 5.3 billion in 2013. Emerging markets, such as those in Southeast Asia, India and Latin America, are experiencing the most rapid growth in mobile subscribers. Early mobile subscribers used mobile phones primarily for voice services, as mobile data services were not available on the initial wireless networks. The Yankee Group estimates that the proportion of U.S. subscribers owning smartphones increased to 12% in 2009 from 9% in 2008 and 6% in 2007. The share of smartphones as a percentage of the overall mobile device market is projected to continue growing. With the advent of the Internet and the evolution of wireless networks and mobile phones, mobile subscribers have increased their demand for mobile content, including information, images, music and video, and for mobile applications, including games and productivity tools.
The Yankee Group estimates that the mobile data services market in the U.S. will grow from $40 billion in 2009 to $48 billion in 2013, and worldwide will grow from $195 billion in 2009 to $253 billion in 2013. The mobile data services market predominantly includes data access, content and applications, commerce and messaging services. We believe the current market for our services is the mobile content delivery platform market, which includes portals and storefronts. Given the complexity of this market, wireless carriers often use third-party content delivery platforms to deliver mobile data services to their subscribers. The Yankee Group estimates that the North American market for mobile content delivery
78
Table of Contents
platforms will grow from $553 million in 2009 to $862 million in 2013, which represents a compound annual growth rate of 12%, and worldwide will grow from $2.9 billion in 2009 to $4.3 billion in 2013, which represents a compound annual growth rate of 11%. This market is projected to continue to grow as wireless carriers continue to improve the speed and quality, and lower the total cost, of mobile data services, and as mobile phone manufacturers continue to develop and deliver mobile phones with increasing levels of features and functions, addressing mobile subscriber demand. Additionally, as mobile subscribers become more aware of the ever-increasing amount of available mobile content and applications, their use of mobile data services is projected to grow for the foreseeable future.
Wireless Carrier Dynamics
Wireless carriers operate in a highly competitive market and face growing challenges to attract and retain subscribers and expand total ARPU. As the demand for mobile data services continues to grow, the following industry dynamics affect wireless carriers:
Mobile Voice ARPU Declining. As the market for mobile voice services has matured and become more commoditized, competition among wireless carriers to acquire and retain subscribers has intensified, placing greater downward pressure on voice services revenue. The Yankee Group estimates that monthly mobile voice ARPU in the U.S. will decline from $40.67 in 2009 to $36.34 in 2013, and worldwide will decline from $13.94 in 2009 to $11.89 in 2013.
Mobile Data ARPU Increasing. The rising capabilities of data-enabled mobile devices combined with the increasing capacity and speed of wireless networks has resulted in significant growth in the demand for mobile data services. Mobile data ARPU has been increasing, which we believe is due to wireless carriers aggressively marketing new mobile data services and pricing plans to attract and retain mobile subscribers. The Yankee Group estimates that the monthly mobile data ARPU in the U.S. will increase from $12.15 in 2009 to $13.16 in 2013, and worldwide will grow from $3.88 in 2009 to $4.06 in 2013. As wireless carriers continue to spend billions of dollars upgrading their wireless networks to handle the accelerated growth in data traffic, they are expected to continue to focus on growing mobile data revenue.
Smartphone Market Share Increasing. With the launch of the newest versions of the iPhone, Android and Blackberry, smartphones are becoming an increased percentage of phones serviced by the wireless carriers. The Yankee Group estimates that the proportion of U.S. subscribers owning smartphones increased to 12% in 2009 from 9% in 2008 and 6% in 2007. The share of smartphones as a percentage of the overall mobile device market is projected to continue growing. We believe that these smartphone users tend to use more data services and have more full featured web browsers. As the percentage of smartphones increases further, wireless carriers will need to understand how to extend their mobile data services to allow for application and content delivery to these new phones.
Premium Content and Applications Revenue Increasing. As the capabilities of mobile devices and mobile data networks continue to increase and as consumers come to expect more from their mobile experience, the market for premium content and applications will continue to expand. The Yankee Group estimates that consumer spending for premium mobile content and applications will grow from $9.5 billion in 2009 to $12.2 billion in 2013 in the U.S., and from $80.9 billion in 2009 to $114.9 billion in 2013 worldwide.
Competition Increasing. The growth dynamics of the mobile data services market and mobile devices and their operating systems have attracted non-carrier participants into the market, including Apple and Google. These relatively new entrants are offering access to mobile content and applications through their own solutions and are capturing a greater portion of value being created in the mobile data market. We believe that, as Apple, Google and other participants continue to focus on
79
Table of Contents
this market opportunity, and as open standards continue to proliferate, wireless carriers will experience stronger competitive pressure to design, develop and deploy leading-edge mobile data service solutions that will enable them to compete in an increasingly open marketplace.
Mobile Subscriber Loyalty Being Challenged. Retaining mobile subscribers has become more difficult given the wider adoption of number portability, in which subscribers are able to retain their phone numbers even if they change wireless carriers, and the accelerated adoption of prepaid mobile service plans, particularly in international markets. The difficulty in retaining subscribers grows as new competitive mobile devices and platforms are introduced into the market and as new entrants take more aggressive approaches toward acquiring new customers. Additional threats arise as Internet incumbents like Google and Yahoo! enter the mobile market and offer mobile subscribers alternative means to access and consume mobile data services.
Mobile Data Ecosystem Complexity Increasing. A complex mobile data ecosystem has developed as a result of the large and growing mobile data services market opportunity, and the diversification of industry participants involved, including wireless carriers, mobile device manufacturers, operating system developers, and mobile content and application providers. This ecosystem will continue to change rapidly as new mobile devices and operating systems are introduced into the market, new mobile content and applications are developed, and as mobile subscribers continue to make greater demands for an enhanced and personalized subscriber experience.
Challenges of Internally Developed Solutions Increasing. Historically, many wireless carriers provided mobile data services directly to their mobile subscribers through internally developed proprietary solutions. These solutions predominantly consisted of point solutions for specific needs. As the mobile data ecosystem becomes more complex, wireless carriers are challenged to manage the ever-changing dynamics in the mobile data services market. Wireless carriers have to spend significant time, capital and other resources to develop, implement, maintain and upgrade their internal solutions. As wireless carriers are increasingly required to focus their efforts on wireless network deployment and subscriber acquisition, they have faced greater challenges in delivering the type of high value subscriber experience required to compete and fully capitalize on opportunities within the mobile data services market.
Mobile Content and Application Provider Dynamics
Mobile content and application providers operate in a highly fragmented market and face increasing challenges to cost-effectively reach the broadest base of mobile subscribers and monetize their offerings. As the demand for mobile data services grow, the following industry dynamics affect mobile content and application providers:
Limited Reach and Distribution. The mobile content and application provider community consists of hundreds of thousands of participants, most of whom, we believe, do not have the experience, scale or resources necessary to effectively and affordably access mobile subscribers.
Limited Infrastructure. Most mobile content and application providers do not have the necessary infrastructure to effectively monetize their mobile offerings. They generally have limited capabilities with respect to delivery, quality assurance, purchase confirmation, billing and settlement. In addition, given the wide variety of mobile devices in the market, with different screen sizes and resolution, mobile content and applications must be adapted to each possible configuration in order to enhance the subscriber experience. Content and application providers continue to face challenges each year with non-delivered content and applications, poor customer service and mobile phone or wireless network compatibility issues.
80
Table of Contents
Mobile Subscriber Dynamics
As the mobile phone increasingly becomes an indispensable part of their everyday lives, mobile subscribers are demanding an enhanced, personalized subscriber experience, with easy access to content and applications on a real-time basis. As the demand for mobile data services grow, the following industry dynamics affect mobile subscribers:
Increasing Mobile Device Capabilities and Aggressive Pricing Plans. Mobile subscribers are rapidly upgrading their mobile devices, and often select devices with the latest features and capabilities. In addition, through increased competition in the mobile data market, mobile subscribers have access to attractively priced mobile service plans and promotions.
Growth of Wireless in Emerging International Markets. In many emerging international markets, mobile data services are expected to experience significant growth. In these markets, landline access is anticipated to be low as compared to mobile lines, with the result that mobile lines present the opportunity to be the primary means for consumers to access the Internet and mobile content and applications. As wireless networks continue to penetrate these emerging markets, mobile subscribers and the demand for mobile data services are expected to continue to expand.
Access to the Increasing Variety of Mobile Data Services. Currently, mobile subscribers often have difficulty locating, connecting to, downloading and using the ever-increasing variety of mobile data services available on their mobile devices, such as checking email, keeping up with social networks, and downloading the latest content and applications. In addition, poorly designed user interfaces and content and applications that are not optimized for mobile devices often inhibit the mobile subscriber experience.
Enhanced Personalization and Customization. Mobile subscribers are demanding a more personalized experience with mobile data services, including real-time access to personally relevant and location-based content and services and social networking. As the mobile phone becomes increasingly integrated into their everyday lives, mobile subscribers are demanding the ability to customize their mobile data experience to meet their preferences.
Demand for Content Delivery Platforms
Given the complexity of the mobile data ecosystem, with evolving technologies and a proliferation of mobile devices and operating systems, the current landscape in the mobile data services market has become increasingly challenging for wireless carriers to manage effectively on their own. We believe that, by partnering with a content platform provider, wireless carriers are able to more effectively leverage their brands to provide an enhanced subscriber experience with mobile data services, enabling them to attract and retain subscribers and increase mobile data ARPU. In addition, wireless carriers are seeking to utilize subscriber usage data to provide a more relevant, timely and personalized user experience that is secure, private, and customized for targeted offerings. By partnering with a content delivery platform provider, wireless carriers are able to optimize their mobile data services strategy, and to focus on their core competencies.
The Motricity Solution
We have designed and developed the mCore service delivery platform to deliver numerous benefits, including the following:
Wireless Carriers. We use customizable, modular solutions that enable wireless carriers to rapidly develop, deploy, and deliver mobile data services. Wireless carriers are able to deliver a high value, carrier-branded mobile data experience, which provides their mobile subscribers with easy
81
Table of Contents
access to desired content and applications. We believe that this enhanced subscriber experience enables wireless carriers to attract and retain mobile subscribers and increase mobile data ARPU. At the same time, our platform can reduce wireless carrier network overhead and operating costs and simplify the relationships between wireless carriers and content and application providers.
Mobile Content and Application Providers. We enable mobile content and application providers to reach millions of mobile subscribers across carriers, and thereby more effectively monetize their mobile offerings. We believe mCore also facilitates efficient billing and settlement, and provides quality assurance for delivery of mobile content and applications.
Mobile Subscribers. We enable wireless carriers to deliver a high value, highly personalized mobile data experience to their subscribers, with simple, real-time access to relevant and desired mobile content and applications. Our mCore platform provides the tools for mobile subscribers to easily locate and access personally relevant and location-based content and services, engage in social networking, and download, send and receive digital media. In addition, mCore allows mobile subscribers to manage the content and applications that they use most frequently.
Our Strengths
Strong Relationships with Wireless Carriers. We have well-established relationships with the top wireless carriers in the U.S. market, including Verizon Wireless, AT&T, Sprint and T-Mobile USA and a new relationship with XL Axiata in Indonesia. We believe that we have been an integral partner with our wireless carrier customers and have assisted them with all phases of their mobile data services strategies, including design, development, deployment, provisioning, management, billing and customer support.
Deep Integration within the Mobile Data Ecosystem. Our mCore service delivery platform is deeply integrated into our wireless carrier customers’ systems, with the result that we can more effectively deliver an enhanced mobile data experience to their subscribers. We connect directly into our wireless carrier customers’ wireless network infrastructure as well as their provisioning and billing systems and their customer care systems. We also provide various interfaces to enable our wireless carrier customers to directly manage the content and presentation of their mobile data service experience. In addition, as our platform becomes more deeply integrated with an increasing number of content and application providers, we provide carriers with greater access to content and application providers.
Highly Scalable Platform. Our mCore service delivery platform has been built using a flexible modular architecture that enables wireless carriers to deliver a highly scalable and highly reliable, carrier-branded experience.
Comprehensive Expertise in Managed Service Operations. Through the delivery of MaaS, Mobile as a Service™, solution, we develop, implement and operate a very large and complex managed service environment, serving approximately 35 million monthly active users across multiple carriers and geographies with a carrier-grade level of quality and reliability. We deliver these services to the world’s leading carriers, application and content providers ranging in complexity from roll-out and testing of minor customizations to major new strategic initiatives involving numerous third parties and onboarding of content and roll-out of a continually expanding set of devices. Our managed service environment consists of thousands of servers across multiple datacenters and is capable and contracted to deliver highly reliable service delivery reaching up to 99.999% availability.
Expansive Device Portfolio and Onboarding Process. We customize, test and maintain highly personalized mobile data experiences for an ever expanding population of mobile devices ranging from entry level feature phones to smartphones that utilize advanced operating systems such as Symbian,
82
Table of Contents
Blackberry, Android, Windows Mobile and webOS. Our onboarding process includes device profiling, testing and performance management across each carrier customers’ handset portfolio. We support mobile devices from over 12 manufacturers as well as a wide range of run time environments and network protocols.
Significant Insights into Subscriber Behavior and Effective User Experiences. Our mCore platform can capture a wide range of subscriber behavior and usage patterns across multiple carriers. We are also a recognized leader in the design and development of user interfaces intended to enhance the mobile subscriber experience. We leverage our data-rich insights into subscriber behavior and our user interface expertise to provide a highly personalized subscriber experience and targeted mobile marketing solutions. Our solutions currently enable the delivery of mobile data services to approximately 35 million mobile subscribers monthly, which gives us exposure to one of the largest mobile subscriber communities in the world.
Independence and Neutrality. We are content, network, operating system and mobile device type independent, with a sole focus on effectively and efficiently delivering the most relevant content and applications to mobile subscribers in real-time. Our independent position enables our interests to be closely aligned with our wireless carrier partners, thereby fostering cooperation among the constituencies that comprise the mobile ecosystem for the benefit of mobile subscribers and their mobile data experiences. We leverage our design, deployment, provisioning, management, and customer support strategies across all participants in the mobile data ecosystem, thereby optimizing our mobile data solutions and services for the benefit of our customers and their subscribers.
Our Growth Strategy
Expand Our Strong Relationships with Our Wireless Carrier Customers. We intend to continue to expand our relationships with industry-leading participants, particularly 4 of the top 10 global wireless carriers.
Expand International Presence. We intend to expand our business in developed and emerging international markets, such as those in Southeast Asia, India and Latin America. We recently entered into an agreement with XL Axiata, a wireless carrier in Indonesia. We intend to apply our expertise gained from the U.S. market and fully leverage the capabilities and scale of the mCore platform to enable the rapid deployment of advanced mobile data services in these new markets in a cost-effective and efficient manner.
Maintain and Extend Our Technological Leadership. We believe that we are a market leader in mobile data services and solutions in terms of technological capabilities, market share and range of service offerings, and we intend to expand on this position. We intend to continue to enhance the mCore platform, and introduce new solutions that increase the total value we provide to our carrier and enterprise customers.
Advance Into New Market Segments. We intend to leverage our core competencies, technologies, and existing market position to broaden our offerings and customer base and advance into new market segments. We intend to leverage our data-rich insights into subscriber behavior and our user interface expertise to expand our offerings of highly targeted mobile marketing solutions.
Enhance Smartphone Solutions. We intend to extend further our support for new versions of smartphones and extend our support for data-rich applications which have higher rates of data consumption on these mobile devices. In addition, we will continue to leverage our subscriber behavior insights and user interface expertise to offer more personalized and richer experiences to smartphones. We expect to fully capitalize on the extensive capabilities of smartphones and their significant market adoption.
83
Table of Contents
Gain Additional Scale and Technology Through Opportunistic Acquisitions. We have historically acquired various businesses and technologies to grow our revenue and service capabilities. We expect to continue targeting acquisition candidates in the mobile data services market that have revenue expansion opportunities or complementary technology and solutions. We also expect to evaluate acquisition candidates that will enable us to expand our business and to enter markets adjacent to our core business or into new geographic markets.
Our Solutions and Services
We design, develop, implement and support a comprehensive suite of hosted mobile data solutions, which we offer on a hosted, managed service basis. Our solutions include the following:
mCore Portal. mCore Portal is a carrier-branded mobile destination accessible through over 2,000 different mobile phone models, ranging from entry level feature phones to smartphones. mCore Portal provides an easy to reach entry point to the mobile Internet and gives wireless carriers an ongoing, high-value position in the evolving mobile data value chain.
mCore Connect. mCore Connect provides one-click mobile access to leading social networks and e-mail sites through a single, simple and user-friendly mobile interface. In addition to making it easier for consumers to reach their social networking and email content, mCore Connect also reduces the network overhead associated with these activities through providing a much more efficient means for users to access what they seek.
mCore Search. mCore Search, which we bundle with our other solutions, is a customizable search technology for the mobile Internet. A single search box enables mobile subscribers to search for any information, content or application on the Internet. Through deep integration with the wireless carrier’s advertising platform, mCore Search provides the ability for carriers to serve targeted, relevant and contextual ads.
mCore Managed Web. mCore Managed Web provides mobile subscribers with an optimized, powerful and easy-to-use mobile web browsing experience.
mCore Storefront. mCore Storefront enables secure mobile content and application merchandising and purchasing through carrier-branded digital storefronts. These digital storefronts can be accessible through web-based, wireless application protocol (WAP) and short message service (SMS) technologies. mCore Storefront serves as the primary conduit between our wireless carrier customers and their mobile subscribers for content and application discovery, purchase and delivery.
mCore Marketplace. mCore Marketplace provides a means to connect the large community of content, application and widget providers to carriers through an open, integrated exchange that can serve a wide array of mobile devices and other target devices. Additionally, carriers themselves are able to offer their own services through this exchange as well as hard and soft goods for purchase. This solution provides consumers with a highly personalized shopping experience through insights gained from business intelligence, user preferences and carrier information.
mCore Gateway. mCore Gateway provides companies that are seeking to leverage mobile capabilities for direct customer contact with real-time, push-based access to mobile subscribers with SMS or multimedia messaging service (MMS) alerts. mCore Gateway allows these enterprise customers to reach over 200 million mobile subscribers in the U.S. and Europe and provides functionality to distribute millions of messages with a high degree of reliability and speed. mCore Gateway also provides a means to charge for the delivery of digital products through wireless carrier billing facilities.
84
Table of Contents
Campaign Manager. Campaign Manager is a Web-based mobile marketing product that connects to the mCore Gateway and provides marketers with a simple means to create, implement and manage mobile marketing campaigns.
Our professional services include the following:
Solution Consulting. Our solution professionals actively engage with customers to define mobile trends, analyze effectiveness of existing solutions and recommend programs and solutions to enhance the mobile data subscriber experience. Our solution professionals have the experience and understanding of the mobile data ecosystem to enable our customers to optimize their mobile data strategies.
Mobile Design. Our mobile design professionals enable wireless carriers to create unique, integrated mobile experiences for their mobile subscribers. We employ functional and technical design techniques across a number of design elements including subscriber experience, wireless network and mobile device features, system integration and processes. We have a comprehensive library of proven designs and tools that help us leverage our skill set across the mobile data ecosystem.
Solution Implementation. Our implementation professionals provide expertise in every phase of the implementation process, including customization, configuration, integration, system launch and ongoing enhancement and maintenance.
Operational Management and Customer Support. Once mCore is deployed, we provide support services to wireless carriers to maintain and monitor their service deployment, including content and technology management, the introduction of new phones and system billing and settlement. We also provide customer support to wireless carriers and their ecosystem of partners to resolve issues directly relating to the performance of the mCore platform.
Sales and Marketing
We market and sell our mobile web portal, storefront, and other managed web solutions to wireless carriers through our sales organization. Additionally, we sell our messaging gateway and billing services to the top mobile aggregators and enterprise customers through our sales organization. As of March 31, 2010 our sales and marketing organization consisted of 32 employees located predominantly in the U.S., with additional staff located in the United Kingdom, the Netherlands, Indonesia and Singapore.
Sales. A senior vice president for global sales centrally manages our sales organization. Within this organization, we have teams focused on selling to wireless carriers, mobile aggregators and enterprise customers. Employees in our sales support and sales engineering group are engaged during the design and implementation process to offer insight into customer requirements, technical solutions and cost evaluation. Our sales organization has been predominantly focused on selling to the top wireless carriers in the U.S. We are now expanding our focus to Southeast Asia, India, Latin America, and other emerging markets.
Marketing and Product Management. Our marketing and product management organizations focus on defining our product requirements, educating wireless carriers, media and industry analysts on our managed services approach, building brand awareness and supporting the efforts of the sales organization. We market our solutions through industry events, public relations efforts, sales materials and our Internet site. Additionally, we work directly with wireless carriers to help them better target and promote our joint offerings. We leverage our data-rich insights into subscriber behavior and our user interface expertise to help drive subscriber adoption and usage. We believe the combination of these efforts creates awareness of our business, solutions and managed services approach, as well as helps drive our overall business growth.
85
Table of Contents
Platform and Architecture
The mCore service delivery platform enables wireless carriers to design, configure, customize, and implement mobile data services. mCore is designed to bring together the three primary participants in the mobile data services ecosystem: wireless carriers, mobile content and application providers and mobile subscribers. By bringing these participants together, mCore facilitates the distribution and use of mobile content and applications, electronic commerce, and other mobile data marketing services. The mCore platform and its position in the mobile data services ecosystem are demonstrated in the figure below.
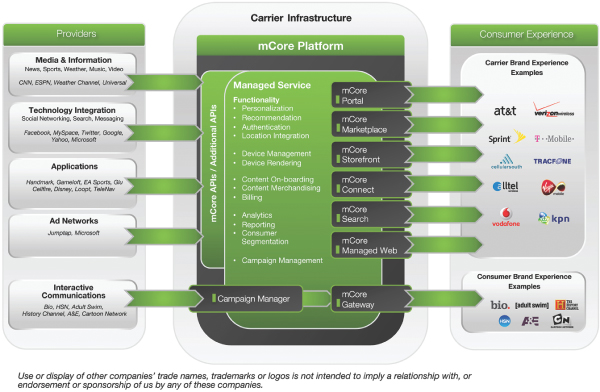
Key features and benefits of the mCore service delivery platform are as follows:
Tight integration with Carriers’ Systems. mCore is able to be integrated with our customers’ systems, including provisioning, billing and settlement, customer care and product analytics, and messaging. This integration provides a more customized and seamless user experience, enabling wireless carriers to offer one-click billing for digital products, as well as location-based services that can create a more compelling user experience.
Modular Architecture. mCore is comprised of several mobile technology components that are modular in nature and provide the flexibility to integrate with our customers’ systems, or third-party mobile content and application providers, on an as-needed basis. This modular architecture, commonly referred to in the industry as Service-Oriented Architecture, enables us to insert, replace, or remove functionalities in targeted areas without impacting our customers’ systems. Additional resources can be added with little to no interruption of service to our customers and their subscribers. In addition, this modular architecture allows mCore to be adopted from the smallest of deployments to the largest, with customizable features and functions depending on the carriers’ requirements and specifications.
86
Table of Contents
Cost-Efficiency. mCore is a centralized, hosted solution through which we can deliver a broad range of mobile data services, on a managed service basis, at a total cost that we believe is lower than most internally developed solutions. By leveraging our solutions across the mobile data ecosystem and its participants, we are able to derive economies of scale that enable us to share the cost savings with our constituencies.
Reliability. mCore is hosted at our carrier-grade hosting facilities in separate geo-redundant datacenters. Our datacenters are highly reliable, using resilient and redundant network devices, servers, storage, HVACs, and power equipment as well as best-of-class service monitoring and management to deliver our services.
Adaptability. mCore separates core functionalities from customer-specific customization and integration through the use of adapters. These adapters are developed for each deployment to enable us to integrate our platform into the wireless carrier’s system, including authentication, billing, ringback tones and message service center. This design feature enables us to develop and deploy our product roadmap in parallel with deployment activities, which helps us achieve our time-to-market goals.
Flexible and Scalable Architecture. mCore was designed to deliver the highest quality, carrier-grade service to some of the largest carriers in the world. Today, mCore supports approximately 35 million mobile subscribers monthly through its distributed architecture, hosts over 30 million unique pieces of mobile content or applications and provides the capability to reach over 200 million subscribers. mCore is designed to scale easily for mobile subscribers’ increased data consumption, expanding subscriber bases through the addition of individual service elements, such as servers and databases. mCore has also been designed with the flexibility and modularity to deliver a wide range of content, including text, graphics, audio and video to a wide range of mobile devices.
Design-Time and Run-Time Environment. mCore provides a design-time and run-time environment for the delivery of mobile data services. The design-time environment consists of management tools with workflow capabilities for service design and deployment, while the run-time environment is the live, in-production experience with which subscribers interact. The design-time environment enables our customers to design the layout of pages, provision new text and images and merchandise content that are subsequently published to the run-time environment. The design-time environment provides us and our customers with the ability to implement changes in the user experience without requiring a new code deployment, which decreases development time and breakage risk.
Mobile Device and Operating System Independent. mCore is mobile device and operating system independent and is able to deliver mobile data services to over 2,000 different mobile phone models, ranging from entry level feature phones to smartphones, and most mobile operating systems. As mobile device and operating system capabilities become increasingly more varied, we believe mCore’s independent approach will enable wireless carriers to deliver an enhanced user experience to their subscribers without having to specifically develop products for each device and operating system.
Data-Rich Insights into Subscriber Behavior. mCore can store a comprehensive record of mobile subscriber activities, transactions and interactions. We and our customers are able to directly access this data or obtain custom analysis and reporting regarding subscriber behavior.
Security Compliance. All security policies, processes and controls are aligned with the ISO 27001 Information Security Management standard as validated by an annual third party audit. Additionally, specific key operational processes—incident management, change management, release management, and service monitoring and control—were designed with support from third party subject matter experts to align with ITIL, the Industry standard framework for IT service management and
87
Table of Contents
support. A third-party audit has established that we are in compliance with the ISO 27001 Information Security Management standard. Through this compliance, we have a comprehensive Information Security Management System in place that consists of an enterprise-wide security steering committee, adherence to statutory, legislative, and contractual security requirements, and an information security risk management program.
Post-Deployment Capabilities. mCore provides monitoring, reporting and ongoing insights into the overall health of the system for our customers as well as the entities that interact with it, including mobile subscribers. Monitors provide both “warning” and “error” states, enabling our customers to react to anomalies prior to an actual error condition. mCore also includes customer care tools which enable a wireless carrier’s customer care representatives to view their mobile subscribers’ interactions with the system, and to troubleshoot and service subscriber inquiries in real-time.
Customers and Vendors
Customers
As of May 31, 2010, our customers included eight carriers and over 190 content and application providers worldwide. As discussed below, we have strong, established and strategic relationships with a number of industry-leading wireless carriers. In addition to those relationships, we have agreements to provide messaging services, such as standard text messaging programs and premium (paid) content delivery, to a wide array of entertainment, marketing and other customers.
Wireless carriers. We have customer agreements with 4 of the top 10 global wireless carriers and numerous other wireless carriers in the U.S. and internationally. We provide various services, including portal, storefront and/or messaging services for these carriers; some carriers use all of our services. In addition, we have agreements with most U.S. wireless carriers for connectivity to our enterprise gateway. Our agreements vary as to the services we provide to each carrier and in how we charge for those services. Some of our agreements contain per subscriber fees for portal services and revenue sharing arrangements for storefront services. Some of our agreements also contain service level agreements under which we commit to certain availability and performance metrics and are subject to financial penalties if we fail to perform at the agreed upon level.
AT&T Mobility. Our largest customer by revenue is AT&T Mobility, LLC. We have several agreements with AT&T including our Second Amended and Restated Wireless Services Agreement under which we host AT&T’s MediaNet and ATT.net portals, and our 2006 Master Services Agreement under which we host AT&T’s MediaMall storefront. Under the portal agreement, we receive a monthly fee based on the number of subscribers, with a volume discount, as well as certain fixed fees. The portal agreement contains service level agreements under which we commit to certain availability and performance metrics and are subject to financial penalties if we fail to perform at the agreed upon level. The portal agreement expires on April 22, 2011; however, it is terminable by AT&T without cause upon six months’ notice. As to the storefront agreement, we are currently operating under an extension to October 2010, which does not contain cancellation provisions. However, AT&T has the right to terminate on 90 days’ notice, which can be given after April 30, 2010.
Verizon Wireless. After AT&T, our next largest customer is Cellco Partnership (d.b.a. Verizon Wireless). We host Verizon’s portals under our 2004 WAP 2.0 Hosting Agreement. Under our Verizon portal agreement, we receive a monthly fee based on the number of subscribers, with a volume discount, as well as certain fixed fees. The portal agreement contains service level agreements under which we commit to certain availability and performance metrics and are subject to financial penalties if we fail to perform at the agreed upon level. Verizon may terminate for convenience. The agreement expires on July 31, 2010, but will automatically renew for six-month periods unless either party elects not to renew upon 60 days’ notice.
We are currently negotiating renewals of our storefront agreement with AT&T and portal agreement with Verizon Wireless.
88
Table of Contents
Vendors
We utilize strategic relationships with offshore and domestic vendors to increase technical resource capacity in the areas of technical development and quality assurance. We are in the process of expanding these relationships to assist in the expansion of our product development efforts. On an as needed basis, these vendors can also be utilized to assist in sales engineering and demo development. We have agreements in place with our vendors, particularly offshore vendors, that allow us to properly manage and oversee vendor activities across the organization.
We have a strategic relationship with GlobalLogic, Inc., a leading software research and development company with over 3,000 employees providing services worldwide. GlobalLogic has assisted our Solution and Services group, and we anticipate using the company to supplement our newly-expanded Product Development group. Our Master Services Agreement with GlobalLogic became effective on September 30, 2008, and expires on December 29, 2011, unless renewed. We may terminate this agreement upon breach or change in control, or without cause upon 90 days notice and payment of a termination fee, if the termination without cause occurs more than 12 months before December 29, 2011.
Competition
The mobile data communications market for products and services continues to be competitive and fragmented. The widespread and rising adoption of open industry standards, rapidly changing technology trends and burgeoning consumer demand has made it easier for new market entrants, existing competitors and non-traditional players to introduce new products and services that compete with our products. With the rapid growth and adoption of mobile data services, we expect competition to increase. As such, we believe there are a number of important factors to compete effectively in our market, including:
| Ÿ | strong mobile data expertise; |
| Ÿ | scalable and highly reliable products and services; |
| Ÿ | advanced user interface capabilities and subscriber insight; |
| Ÿ | knowledge and delivery capabilities across a wide array of content and applications; |
| Ÿ | service integration capabilities across a wide range of devices, networks and standards; |
| Ÿ | sufficient scale and operational efficiencies to be able to offer the most cost effective solutions; |
| Ÿ | high level of customer support; |
| Ÿ | ability to onboard a wide range of devices and content; and |
| Ÿ | adaptability to rapidly changing demand, technology and products external to our offerings. |
Our competitors include mobile device manufacturers, wired search engines, Internet portals and directories, and wireless service integrators. In our current offerings, we compete with, among others, Amdocs and Ericsson in the portal and storefront businesses, and with Sybase, OpenMarket, Ericsson, mBlox and other wireless messaging providers in our messaging aggregation business. Additionally, we face the risk that our customers may seek to develop in-house products as an alternative to those currently being provided by us. Due to the dynamic and fragmented data services market, we are also increasingly encountering competition from new market entrants like Microsoft, IBM, Apple, Yahoo!, Google and other providers of software applications and content delivery solutions.
Intellectual Property
Our intellectual property is an essential element of our business. We rely on a combination of trademark, copyright, trade secret, patent and other intellectual property laws of the U.S. and other
89
Table of Contents
countries, as well as confidentiality agreements and license agreements to protect our intellectual property. Our intellectual property includes trademarks, patents, copyrights, trade secrets, and we are involved in numerous licensing arrangements. Our employees and independent contractors are required to sign agreements acknowledging that all inventions, trade secrets, works of authorship, developments and other processes generated by them on our behalf are our property, and assigning to us any ownership that they may claim in those works.
Our core intellectual property is our software that we use to provide services to our customers. We generally host all of our software, although some customers have the right to self-host in some circumstances. We rely primarily on copyright and trade secrets to protect our software and other technology. We do not routinely register our copyrights in our software. Trade secrets are difficult to protect, but we seek to protect our proprietary technology and processes by, in part, confidentiality agreements with our employees, consultants, and other contractors.
We are the owner of 18 trademarks registered with the United States Patent and Trademark office, including MOTRICITY and MCORE, and 15 trademarks registered internationally. We also have one trademark application pending with the United States Patent and Trademark Office and we are filing applications in Singapore.
Facilities
Our corporate headquarters is located in Bellevue, Washington and comprises approximately 65,000 square feet of space leased through December 20, 2013. We also perform a range of business functions out of offices in Durham, North Carolina. We have sales and product development functions in the United Kingdom and regional sales offices in the Netherlands, Indonesia and Singapore. We also operate two leased datacenter facilities located in Washington State. In addition, we lease three third-party operated datacenters located in Georgia, Massachusetts and North Carolina to provide services to our customers. We believe that our existing properties are in good condition and sufficient and suitable for the conduct of our business. As our existing leases expire and as we continue to expand our operations, we believe that suitable space will be available to us on commercially reasonable terms.
Legal Proceedings
We are a party in five purported class action lawsuits brought against us by individuals on behalf of customers receiving premium content from our content providers. The cases allege that we and our content providers charged consumers for mobile phone content without proper authorization and/or engaged in misleading marketing for premium content. The cases seek unspecified damages. The cases are:
| Ÿ | Camellia Walker individually and on behalf of a class of similarly situated individuals v. Motricity, Inc., California Superior Court, Alameda County, filed July 3, 2008; |
| Ÿ | Susan Rynearson individually and on behalf of a class of similarly situated individuals v. Motricity, Inc., Washington Superior Court, King County, filed April 16, 2008; |
| Ÿ | Baker v. Sprint and New Motion, Inc. (Motricity is a third-party defendant), Eleventh Judicial Circuit Court, Miami-Dade County, claim against Motricity filed May 29, 2008; |
| Ÿ | Vicky Stewart individually and on behalf of a class of similarly situated individuals v. New Motion, Inc. and Motricity, Inc., Minnesota District Court, Hennepin County, claim against Motricity filed October 1, 2009; and |
| Ÿ | Scott Williams, et al, individually and on behalf of a class of similarly situated individuals v. Motricity, Inc., et al, Cook County Circuit Court, claim against Motricity filed March 17, 2010. |
90
Table of Contents
The class representatives in the above matters, except for the Williams matter, all purchased content from Atrinsic, Inc. d/b/a New Motion, Inc. Atrinsic content is also at issue in several similar lawsuits brought against carriers who have, in turn, sought indemnification from us. Atrinsic has entered into a settlement in a class action not involving us that is expected to release us from most of the claims asserted in the above actions, except for the Williams action, and carrier indemnity claims. Atrinsic received final court approval of its settlement on March 10, 2010. The Williams action involves non-Atrinsic content that the class representatives purchased from certain other content providers and we are currently evaluating the claims.
In addition, we are involved in an unrelated proceeding with Atrinsic, Inc. in which Atrinsic seeks an accounting of sums paid by us and unspecified damages for Atrinsic subscribers whose subscriptions failed to renew due to a technical issue. We have counterclaimed for unpaid minimum fees due under our existing agreement. The case is Atrinsic, Inc. v. Motricity, Inc., AAA arbitration, filed June 25, 2009.
Defending lawsuits requires significant management attention and financial resources and the outcome of any litigation, including the matters described above, is inherently uncertain. We do not, however, currently expect that the ultimate costs to resolve pending matters will have a material adverse effect on our consolidated financial position, results of operations or cash flows.
From time to time, we may be subject to additional legal proceedings and claims in the ordinary course.
Employees
As of March 31, 2010, we had 355 employees. None of our employees are represented by a labor union or is covered by a collective bargaining agreement. We have never experienced any employment-related work stoppages and consider relations with our employees to be good.
91
Table of Contents
Executive Officers and Directors
In connection with this offering we intend to amend and restate our certificate of incorporation and bylaws. The following summary of our executive officers and directors contains references to provisions of our amended and restated certificate of incorporation and bylaws, including as they relate to the composition of the board of directors and its committees.
The following table sets forth information regarding our executive officers and directors, including their ages and positions, as of May 31, 2010. All of our directors hold office for the remainder of the full term in which the new directorship was created or the vacancy occurred and until their successors are duly elected and qualified. Executive officers serve at the request of the board of directors. Other than as described below, there are no family relationships between our directors and executive officers.
| Name |
Age | Position | ||
| Ryan K. Wuerch |
42 | Chief Executive Officer, Chairman and Founder | ||
| Jim Smith |
43 | President and Chief Operating Officer | ||
| Allyn P. Hebner |
57 | Chief Financial Officer | ||
| Richard E. Leigh, Jr. |
50 | Senior Vice President, General Counsel and Corporate Secretary | ||
| James Ryan |
44 | Chief Strategy and Marketing Officer | ||
| Chris Dorr |
48 | Chief Human Resources Officer | ||
| Jeffrey A. Bowden |
64 | Director | ||
| Hunter C. Gary |
36 | Director | ||
| Brett C. Icahn |
30 | Director | ||
| Lady Barbara Judge |
62 | Director | ||
| Suzanne H. King |
46 | Director | ||
| Brian Turner |
50 | Director |
Upon the closing of our initial public offering, Ryan K. Wuerch will resign as Chairman of our board of directors and Lady Barbara Judge will become the Chairperson of our board of directors.
The composition of the committees of our board of directors as of the date of this prospectus is set forth below. An “X” indicates membership; a “C” indicates that the director serves as chairperson of the committee.
| Audit Committee |
Compensation Committee |
Governance and Nominating Committee | ||||
| Ryan K. Wuerch |
||||||
| Jeffrey A. Bowden |
||||||
| Hunter C. Gary |
X | C | ||||
| Brett C. Icahn |
X | |||||
| Lady Barbara Judge |
X | X | ||||
| Suzanne H. King |
X | C | ||||
| Brian Turner |
C | X | X |
Ryan K. Wuerch founded Motricity in 2001, and has served as chief executive officer since 2001, and chief executive officer and chairman since 2002. Previously, Mr. Wuerch was president of Learning 2000, Inc., an education software company, from 1998 to 2001. Prior to Learning 2000, Mr. Wuerch served as senior vice president of ShapeRite, a nutritional supplement manufacturer, from 1995 to 1998. Mr. Wuerch was named the 2005 Carolinas’ Ernst & Young Entrepreneur of the Year. He serves on the boards of the CTIA Wireless Foundation, the Miss America Organization, the Washington Roundtable, a
92
Table of Contents
nonprofit, public policy organization comprised of Washington State chief executive officers and as an ambassador for the Internet Innovation Alliance. Mr. Wuerch brings valuable experience to the board because he is the Company’s chief executive officer and has been with the Company since he founded it nearly 10 years ago.
Jim Smith has served as our president and chief operating officer since January 2009. Previously, from 2001 to 2008, Mr. Smith served as vice president and business unit general manager at Avaya, Inc. a communications systems company. Before Avaya, from 1999 to 2001, Mr. Smith was chief operating officer and co-founder of Vector Development, an e-commerce operating company. Earlier in his career, from 1989 to 1999, Mr. Smith held multiple positions with Accenture, most recently as an associate partner.
Allyn P. Hebner has served as our chief financial officer since March 2009. From August 2008 through February 2009, he served as a consultant to our company through Tatum, LLC, an executive services company, with whom he is still a non-participating partner. Previously, Mr. Hebner served as vice president, controller and chief accounting officer at T-Mobile USA, from April 2000 to April 2007. He has also held senior financial management positions at Puget Sound Energy, Washington Energy Company and Allwaste, Inc.
Richard E. Leigh, Jr. has served as our senior vice president, general counsel and corporate secretary since September 2008. Previously, from 2006 to 2008, Mr. Leigh served as a legal consultant and advisor to Paul Allen’s Vulcan Inc. and its affiliate, the Seattle Seahawks of the National Football League. From 2004 to 2005, Mr. Leigh served as executive vice president, general counsel and corporate secretary of Cell Therapeutics, Inc. From 1997 to 2004, Mr. Leigh served as vice president and general counsel to Vulcan Inc. and from 1997 to 2000, he served as vice president and general counsel to the Seattle Seahawks. Prior to that, he spent eight years as a corporate attorney with the Seattle law firm of Foster Pepper PLLC, where he was a partner. Mr. Leigh currently serves on the Board of Trustees of the Flying Heritage Collection, a museum housing Paul Allen’s private collection of world-class 20th century military aviation.
James Ryan has served as our chief strategy and marketing officer since May 2009. Previously, from January 2008 to November 2008, Mr. Ryan served as president and chief executive officer of CMWare, Inc., a mobile optimization technology company. Prior to CMWare, Inc., from June 2007 to December 2007, Mr. Ryan served as president and chief executive officer of Mobile Campus, a mobile marketing company. Prior to Mobile Campus, from November 2003 to May 2007 Mr. Ryan was vice president of consumer data services for AT&T Mobility. Mr. Ryan has also served as president and chief executive officer of Teltier Technologies, a wireless solutions company, as vice president of strategic business development for O2, chief technology officer for Genie Internet and vice president of data services for Sprint PCS.
Chris Dorr has served as our chief human resources officer since June 2009. Previously, Mr. Dorr was human resources director for Microsoft Corporation from 2003 to 2009. Prior to Microsoft, from 2001 to 2003, Mr. Dorr led the human resources function for two companies—i2 Technologies and Brown and Caldwell. Mr. Dorr also helped establish the human resources function at Scient Corporation from 1999 to 2001. Mr. Dorr’s first 12 years in human resources were spent with American Express and MCI Communications.
Jeffrey A. Bowden has served as one of our directors since April 2010. Since 2004, Mr. Bowden has been a partner and co-chair of the Boston Consulting Group’s Technology, Media and Telecommunications Practice in India, Indonesia, Malaysia, Singapore and Thailand, a practice that represents the interests of Asian and global clients as they develop and implement pan-Asian corporate and business development strategies. From 2001 to 2004, he served as executive vice
93
Table of Contents
president of strategy and merger integration with PCCW/Hong Kong Telecom and from 1994 to 1998, Mr. Bowden served as vice president of strategy and corporate assurance and vice president of merger integration with NYNEX/Bell Atlantic, both of which are telecommunications companies. Mr. Bowden previously served as a director of Z-Tel, Inc., of which he was cofounder, Softnet Systems, Inc., Pacific Century Cyberworks, Limited, all of which are telecommunications companies, and The Boston Consulting Group, Inc. Mr. Bowden has extensive experience in telecommunications development in Asia and mergers of telecommunications companies. His telecommunications experience and experience as a director enables him to advise the board on business and telecommunications matters.
Hunter C. Gary has served as one of our directors since 2007. Since 2003, Mr. Gary has served as the chief operating officer of Icahn Sourcing LLC, an entity owned by Mr. Carl Icahn, where he is responsible for monitoring and managing cost efficiency opportunities for businesses in which Mr. Carl Icahn has an interest. Since 2007, Mr. Gary has served as a director of WestPoint International, Inc., a company which is engaged in the home textiles business. Since 2008, Mr. Gary has served as a director of American Railcar Industries, Inc., a company that is primarily engaged in the business of manufacturing covered hopper and tank railcars. Since March 2010, Mr. Gary has served as a director of Tropicana Entertainment, a company that is primarily engaged in the business of owning and operating casinos and resorts. Mr. Gary is married to Mr. Carl Icahn’s wife’s daughter. Mr. Gary has extensive experience in dealing with operations matters for a variety of companies which, in addition to his service on other boards, enables him to advise our board on a range of matters including operations and oversight. Mr. Gary was appointed to our board of directors by holders of the Series H preferred stock that is expected to be outstanding after this offering.
Brett C. Icahn has served as one of our directors since January 2010. Since 2002, Mr. Icahn has served as an investment analyst for Icahn Partners LP, Icahn Partners Master Fund LP, Icahn Partners Master Fund II LP and Icahn Partners Master Fund III LP, investment funds managed by Mr. Carl C. Icahn. Mr. Icahn has served as a director of Take-Two Interactive Software, Inc., a developer, marketer, distributor and publisher of interactive entertainment software games, since January 2010. Mr. Icahn has served as a director of American Railcar Industries, Inc., a publicly traded railcar manufacturer that is controlled by Carl C. Icahn, since 2007. Mr. Icahn is the son of Mr. Carl C. Icahn. Mr. Icahn has experience with technology companies, both as a board member and a founder. His experience as an investment analyst also provides him with strong skills in dealing with financial matters. Mr. Icahn was appointed to our board of directors by holders of the Series H preferred stock that is expected to be outstanding after this offering.
Lady Barbara Judge has served as one of our directors since January 2010. Since 2002, Lady Judge has been chairman of the United Kingdom Atomic Energy Authority. From 2004 to 2007, Lady Judge was the deputy chairman of the United Kingdom Financial Reporting Council in London. From 2002 through 2004, she was a director of the Energy Group of the United Kingdom’s Department of Trade and Industry. Earlier in her career, Lady Judge served as a commissioner of the U.S. Securities and Exchange Commission, was a partner at Kaye, Scholer, Fierman, Hays & Handler, and was a regional director at Samuel Montagu & Co. Ltd. Lady Judge serves as a director of Magna International Inc. and ATP Oil & Gas Corporation. Lady Judge has 25 years of experience counseling boards and senior management regarding corporate governance, compliance, disclosure, international business conduct and other relevant issues. Her experience as a former commissioner of the Securities and Exchange Commission will enable her to advise our board on regulatory matters.
Suzanne H. King has served as one of our directors since 2004. Ms. King has been with New Enterprise Associates, Inc. since 1995, as a partner since 1999, where she focuses on information technology investments and manages the firm’s marketing and investor relations functions. Ms. King serves as a director of Approva Corporation, a financial information technology company, and Virginia’s Center for Innovative Technology. Ms. King has served as a director of Cyveillance, Inc., an
94
Table of Contents
information technology security company, Quantum Bridge Communications, a broadband communications company, and Guardent, a security service provider. Prior to joining New Enterprise Associates, Ms. King led the financial team at XcelleNet, Inc., a developer of system management software for remote access. Ms. King also worked as a senior auditor for Arthur Andersen & Co., specializing in emerging information technology companies. Ms. King was a charter member of the Kauffman Fellows program and is a certified public accountant. Ms. King has extensive experience advising privately-held companies in the information technology sector, and this experience is particularly relevant, given our technology-oriented business . In addition, Ms. King’s service on other boards of directors enables her to advise our board on governance, compensation and audit issues.
Brian Turner has served as one of our directors since December 2009. Mr. Turner was the chief financial officer of Coinstar, Inc., a provider of automated retail solutions, from 2003 until 2009. Prior to Coinstar, from 2001 to 2003, he was senior vice president for operations, chief financial officer and treasurer of Real Networks, Inc. Prior to Real Networks, from 1999 to 2001, Mr. Turner was employed by BSquare, a software company, where he initially served as senior vice president of operations and chief financial officer before being promoted to president and chief operating officer. From 1995 to 1999, Mr. Turner was chief financial officer of Radisys Corp., an embedded software and hardware company. Earlier in his career, Mr. Turner spent 13 years at PricewaterhouseCoopers LLP. Mr. Turner currently serves as a director of Microvision, Inc., MckinstryEssention, Rally Marketing Group and InfoArmor, Inc. Mr. Turner brings valuable management and financial expertise to our board. He has nearly 30 years of experience in financial and auditing matters, primarily for technology companies, and 15 years experience as a member of senior management teams for technology companies.
Composition of Board
Our board of directors is unclassified and currently consists of seven directors. Our board of directors has affirmatively determined that Messrs. Bowden and Turner, Ms. King and Lady Judge, representing four of our seven directors, are “independent directors” as defined under the corporate governance rules of the NASDAQ Stock Market, constituting a majority of independent directors on our board of directors as required by the NASDAQ Stock Market rules. Our amended and restated certificate of incorporation and amended and restated bylaws provide that our board of directors may consist of a number of directors as fixed by the board from time to time, provided that in no event will the number of directors exceed seven, except that upon the approval of at least all but one of the directors, the number may be increased to nine, so long as such increase is not done when we have received notice of a contested election of directors for an upcoming stockholder meeting. The board of directors and our stockholders have authority to fill any vacancy on the board of directors, whether such vacancy occurs as a result of an increase in the number of directors or otherwise. Our board of directors is not classified or staggered, and can only become classified or staggered through an amendment to the certificate of incorporation approved by our stockholders. In addition, there is no cumulative voting or majority voting with respect to the election of directors. As a result, all of our directors are up for re-election annually and are elected by a plurality vote.
In addition, pursuant to our amended and restated certificate of incorporation, the office of President and/or Chief Executive Officer, on the one hand, and the position of the chairperson of the board of directors, on the other hand, generally cannot be held by the same person. However, upon the death, resignation or termination of the chairperson, President and/or Chief Executive Officer, our board of directors has the ability to combine these positions for a limited period of time in order to allow our board of directors time to select a successor. For more information, see “Description of Capital Stock—Certain Provisions of the Certificate of Incorporation and Bylaws.”
The persons currently serving on our board of directors are designated pursuant to the terms of the amended and restated stockholders’ agreement entered into in October 2007 with several of our
95
Table of Contents
significant stockholders, including funds affiliated with Advanced Equities, Inc., New Enterprise Associates, Inc. and Technology Crossover Ventures and Koala Holding LP, an entity beneficially owned by Carl C. Icahn. Pursuant to the amended and restated stockholders’ agreement, (i) Ms. Suzanne H. King and Lady Barbara Judge, (ii) Mr. Brian Turner and Mr. Jeffrey A. Bowden, and (iii) Mr. Hunter C. Gary and Mr. Brett C. Icahn serve on our board as designees of investment funds affiliated with New Enterprise Associates, Inc. and Technology Crossover Ventures and Koala Holding LP, respectively. Koala Holding LP, which owns substantially all of our Series H preferred stock, will continue to have the right to appoint two of the seven members of our board of directors after the consummation of this offering. The amended and restated stockholders’ agreement will terminate upon completion of this offering. Please see “Certain Relationships and Related Party Transactions—Stockholders’ Agreement” for more information.
Committees of the Board of Directors
Our board of directors has established the following committees: an audit committee, a compensation committee and a nominating and corporate governance committee. The composition and responsibilities of each committee are described below. Members serve on these committees until their resignation or until otherwise determined by our board.
Audit Committee. The audit committee consists of three members: Mr. Gary, Ms. King and Mr. Turner, each of whom is a non-employee member of our board of directors. Mr. Turner is the chairperson of our audit committee. The committee will assist our board of directors in its oversight responsibilities relating to (i) the quality and integrity of our financial statements, (ii) our accounting and reporting policies and procedures, (iii) our risk management policies, (iv) our compliance with legal and regulatory requirements that may have a material impact on our financial statements, (v) our independent registered public accounting firm’s qualifications, independence and performance, (vi) our disclosure controls and procedures, and (vii) our internal control over financial reporting.
The SEC and the NASDAQ Stock Market rules require us to have at least one independent director on our audit committee upon the listing of our common stock on the NASDAQ Global Market and a majority of independent directors within 90 days of the date of such listing. We are required to have an audit committee that is composed entirely of independent directors within one year of the date of our listing on the NASDAQ Global Market. Our board of directors has affirmatively determined that Mr. Turner and Ms. King meet the definition of “independent directors” for purposes of serving on an audit committee under applicable SEC and the NASDAQ Stock Market rules, and we intend to comply with these independence requirements within the time periods specified. In addition, Mr. Turner qualifies as our “audit committee financial expert.”
Compensation Committee. The compensation committee consists of three members: Mr. Gary, Lady Judge and Mr. Turner, each of whom is a non-employee member of our board of directors and an outside director. Mr. Gary is the chairperson of our compensation committee. The committee will be responsible for designing, approving and evaluating executive compensation and benefits, as well as reviewing and approving such other compensation matters as the committee deems appropriate.
We will have at least two independent directors on our compensation committee upon the listing of our common stock on the NASDAQ Global Market and the compensation committee is currently comprised of at least a majority of independent directors. We are required to have a compensation committee that is composed entirely of independent directors within one year from the date of listing on the NASDAQ Global Market. Our board of directors has affirmatively determined that Mr. Turner and Lady Judge meet the definition of “independent directors” for purposes of serving on a compensation committee under applicable SEC and the NASDAQ Stock Market rules, and we intend to comply with the independence requirement within the time period specified.
96
Table of Contents
Governance and Nominating Committee. The governance and nominating committee consists of four members: Mr. Icahn, Lady Judge, Ms. King and Mr. Turner, each of whom is a non-employee member of our board of directors. Ms. King is the chairperson of our governance and nominating committee. The committee will be responsible for identifying individuals qualified to become directors and committee members, recommending director nominees to the board, developing and recommending approval of policies and guidelines relating to, and generally overseeing matters of, corporate governance, and leading the board’s annual review of its members and committee charters.
We will have three independent directors on our governance and nominating committee upon the listing of our common stock on the NASDAQ Global Market and the governance and nominating committee is currently comprised of a majority of independent directors. We are required to have a governance and nominating committee that is composed entirely of independent directors within one year from the date of listing on the NASDAQ Global Market. Our board of directors has affirmatively determined that Mr. Turner, Ms. King and Lady Judge meet the definition of independent directors for purposes of serving on a governance and nominating committee under applicable SEC and the NASDAQ Stock Market rules, and we intend to comply with the independence requirement within the time period specified.
Compensation Committee Interlocks and Insider Participation
Keith G. Daubenspeck, Hunter C. Gary, Suzanne H. King and David Limp served as members of our compensation committee in the last fiscal year. None of them is or has at any time been one of our officers or employees. None of our executive officers serves as a member of the compensation committee or board of directors of any other entity that has an executive officer serving as a member of our board of directors or compensation committee.
Mr. Gary is married to Mr. Carl C. Icahn’s wife’s daughter. We have engaged in certain agreements and transactions with entities controlled by Mr. Icahn. First, Koala Holding LP is party to our Registration Rights Agreement and Stockholders Agreement. Second, we participate in a buying group arrangement with Icahn Sourcing LLC. We do not pay any fees in connection with this arrangement. Third, in 2007, in connection with financing for an abandoned transaction, we issued warrants as a fee to Icahn Enterprises, L.P., formerly known as American Real Estate Partners L.P. Fourth, we received consulting services from Koala Holding LP in connection with our acquisition of InfoSpace Mobile, in exchange for cash and warrants. Koala Holding LP owns approximately 11.4% of our common stock as of the date of this prospectus and substantially all of our Series H preferred stock. See the section entitled “Certain Relationships and Related Party Transactions” for more information.
Code of Ethics
We will adopt a new code of ethical conduct applicable to our principal executive, financial and accounting officers and all persons performing similar functions in connection with this offering. A copy of our code of ethical conduct will be available upon completion of this offering on our corporate website at www.motricity.com. We expect that any amendments to the code, or any waivers of its requirements, will be disclosed on our website. In addition, we will adopt a code of business conduct and ethics that will apply to anyone conducting business on our behalf, including our directors, officers, employees, contractors and agents. The inclusion of our website address in this prospectus does not include or incorporate by reference the information on our website into this prospectus.
97
Table of Contents
Compensation Discussion and Analysis
The purpose of this compensation discussion and analysis section is to provide information about the material elements of compensation that are paid, awarded to, or earned by, our “named executive officers,” who consist of our principal executive officer, principal financial officer, and the three other most highly compensated executive officers. For fiscal year 2009, our named executive officers were:
| Ÿ | Ryan K. Wuerch, Chief Executive Officer; |
| Ÿ | Allyn P. Hebner, Chief Financial Officer; |
| Ÿ | Richard E. Leigh, Jr., Senior Vice President, General Counsel and Corporate Secretary; |
| Ÿ | Jim Smith, President and Chief Operating Officer; and |
| Ÿ | James Ryan, Chief Strategy and Marketing Officer. |
Historical Compensation Decisions
Our compensation approach is tied to our stage of development. Prior to this offering, we were a privately-held company. As a result, we have not been subject to any stock exchange listing or SEC rules requiring a majority of our board of directors to be independent or relating to the formation and functioning of our board committees, including audit, compensation, and nominating and governance committees. We informally considered the competitive market for corresponding positions within comparable geographic areas and companies of similar size and stage of development operating in the software and mobile data services industry. This consideration was based on the general knowledge possessed by members of our Compensation Committee and also included consultations with our Chief Executive Officer. The Compensation Committee utilized research and informal benchmarking based on their personal knowledge of the competitive market. In addition, to complement our review of executive compensation for executive officers other than our Chief Executive Officer, our Compensation Committee consulted publicly available compensation surveys prepared by Radford, a compensation consulting firm, to benchmark our compensation against companies with similar revenues, market capitalization, and other financial measures within our industry. Our Compensation Committee will formally benchmark executive compensation for all executive officers in the future against a set of peer companies described below.
Compensation Philosophy and Objectives
Upon completion of this offering and as they have done in the past, our Compensation Committee will review and approve the compensation of our named executive officers and oversee and administer our executive compensation programs and initiatives. As we gain experience as a public company, we expect that the specific direction, emphasis and components of our executive compensation program will continue to evolve. We will favor a more empirically-based approach that involves benchmarking as well as best practices with respect to compensation and benefits. Accordingly, the compensation paid to our named executive officers for fiscal year 2009 is not necessarily indicative of how we will compensate our named executive officers after this offering.
Historically, as well as in the future, our executive compensation program is intended to balance short-term and long-term goals with a combination of cash payments and equity awards that we believe to be appropriate for motivating our executive officers. Our executive compensation program is designed to:
| Ÿ | align the interests of our executive officers with stockholders by motivating executive officers to increase stockholder value and reward executive officers when stockholder value increases; |
98
Table of Contents
| Ÿ | attract and retain talented and experienced executives that strategically address our short-term and long-term needs; |
| Ÿ | reward executives whose knowledge, skills and performance are critical to our success; |
| Ÿ | ensure fairness among the executive management team by recognizing the contributions each executive makes to our success; |
| Ÿ | foster a shared commitment among executives by aligning their individual goals with the goals of the executive management team and our stockholders; and |
| Ÿ | compensate our executives in a manner that motivates them to manage our business to meet our long-term objectives and create stockholder value. |
To help achieve these objectives, the Compensation Committee expects to maintain our current compensation plans and implement new plans as needed in order to tie a substantial portion of the executives’ overall compensation to key strategic financial and operational goals, such as revenue, CIP Adjusted EBITDA (defined below) and CIP Working Capital (defined below).
Our executive compensation program rewards both team and individual accomplishments by emphasizing a combination of corporate results and individual accountability. A portion of total compensation is placed at risk through annual performance bonuses and long-term incentives. In the aggregate, the annual performance bonuses at target generally represent between 3% and 7% of the total target direct compensation (which consists of annual base salary and long-term and short-term incentives) for our named executive officers. Our historic practice with regard to issuing long-term incentives has been to grant restricted stock at the time of hire or promotion, although we occasionally, based upon individual circumstances, issue restricted stock or incentive stock options on an ad-hoc basis, in each case with approval from the Compensation Committee. Going forward, the Compensation Committee believes that grants of stock options are better suited to aligning the interests of our named executive officers with our stockholders. Long-term incentives, based on grant date fair value, generally represent between 79% and 93% of the total target direct compensation for our named executive officers. This combination of incentives is designed to balance annual operating objectives and our earnings performance with longer-term stockholder value creation. In 2009, annual target bonuses represented between 3% and 33% of the total target direct compensation and long-term incentives represented between 0% and 89% of the total target direct compensation for our named executive officers. The disparity largely results from our historic practice of granting long-term equity incentive awards upon an executive’s commencement of employment, where in 2009, all of our named executive officers, other than Mr. Wuerch and Mr. Leigh, received an equity award (Messrs. Hebner, Smith and Ryan each received restricted stock awards of 166,666 shares, 333,333 shares and 233,333 shares, respectively, as commencement equity grants). As a result, the total target direct compensation for Mr. Wuerch and Mr. Leigh in 2009 consisted solely of cash compensation.
We seek to provide competitive compensation that is commensurate with performance. We generally target compensation at the median for companies of a similar size in the software and mobile data services industry (based on revenues, market capitalization and other financial metrics) and calibrate both annual and long-term incentive opportunities to generate less-than-median awards when goals are not fully achieved and greater-than-median awards when performance goals are exceeded. The competitive market is comprised of companies in the software and mobile data services industry.
To ensure we maintain our position to market, it has been our historical practice to review compensation data as well as best practices with respect to compensation and benefits on an annual basis, based upon informal benchmarking against Radford and other publicly available compensation surveys, to ensure executive compensation remains within the relative range noted above. For fiscal 2009, based upon informal benchmarking, since we either achieved or exceeded our target
99
Table of Contents
performance for each of our CIP bonus metrics, total cash compensation for each of our named executive officers surpassed the targeted median cash compensation level of similarly situated executives of our competitive market. See the section captioned “—Short-Term Incentives” for a more detailed discussion of our annual bonus program. We expect to continue this practice going forward and the Compensation Committee intends to continue to engage an independent compensation consultant to maintain and modify our executive compensation peer group to benchmark against. See the section captioned “—Compensation Committee Procedures” for a more detailed discussion of the Compensation Committee’s use of compensation consultants.
We also seek to promote a long-term commitment to us by our executives. We believe that there is great value to us in having a team of long-tenured, seasoned managers. Our team-focused culture and management processes are designed to foster this commitment. In addition, the vesting schedule attached to equity awards is based upon continued employment for each calendar quarter over four years, and is intended to retain our executives and reinforce this long-term orientation. Moreover, the form of non-qualified stock option agreement for senior management under the 2010 LTIP (described below) sets forth stock ownership guidelines which require executives to own, within five years of the date of grant of an option, stock equal in value to at least one and one-half times the executive’s annual base salary (determined as of the last day of the fifth year following the grant date). For purposes of the share ownership guidelines, ownership includes all stock deemed “beneficially owned” (as defined in Rule 13d-3(d) of the Exchange Act without regard to vesting) by the executive or stock transferred for estate planning purposes or pursuant to a court order. Failure of an executive to achieve the ownership guidelines within the specified timelines will result, in the discretion of the Compensation Committee, in forfeiture of the option. When calculating the number of shares that an executive is required to hold, the executive’s base salary will be multiplied by 1.5 and then divided by the average closing price for the Company’s common stock over the 30 trading days prior to the date of calculation. The stock ownership guidelines, as set forth in the form option agreement, will cease to apply if an executive is no longer an active employee of the Company.
The Compensation Committee has also established stock ownership guidelines for the Chief Executive Officer which require the Chief Executive Officer to own, within five years of his option grant dated March 26, 2010, stock equal to four times his annual base salary (determined as of the last day of such five-year period). The number of shares required to be held by the Chief Executive Officer under his stock ownership guidelines will be calculated in a manner consistent with that for the other executive officers.
Compensation Committee Procedures
The Compensation Committee’s responsibilities and authorities are specified in the Compensation Committee’s Charter which was approved by the board of directors on April 4, 2010. The Compensation Committee Charter is filed as an exhibit to this registration statement. The Compensation Committee’s functions and authority include, but are not limited to, the review and approval of employment agreements, offer letters, severance and separation agreements, base salary, annual bonus and incentive, option and equity grants and other compensation and employment decisions for the following: employees with a base salary and bonus above a specified threshold, each executive officer of the Company including the named executive officers and such other senior officers as the Compensation Committee deems appropriate. In addition, the Compensation Committee is responsible for the evaluation of the performance of our Chief Executive Officer and other named executive officers, oversight and administration of our equity plans and approval of non-customary compensation, equity grants, severance or other plans that are outside of the terms and conditions contained in the applicable plan and have an aggregate dollar value exceeding a specified threshold. The Compensation Committee is also responsible for the review and approval of all our human resources plans such as the 401(k) plan, health and welfare plans, compensation of our board of directors and any other matters delegated to the Compensation Committee by our board of directors.
100
Table of Contents
On or about August 24, 2009, David Limp resigned as chairperson of the Compensation Committee and subsequently resigned from our board of directors and ceased to serve as a member of the Compensation Committee on November 16, 2009. On January 11, 2010, Keith Daubenspeck resigned from our board of directors and ceased to serve as a member of the Compensation Committee. Lady Barbara Judge was elected to our board of directors on January 11, 2010 and appointed to the Compensation Committee. Effective as of January 13, 2010, Hunter Gary was elected as chairperson by the Compensation Committee, in accordance with the Compensation Committee Charter. On February 12, 2010, Suzanne King resigned as a member of the Compensation Committee and Brian Turner was appointed to the Compensation Committee.
Compensation Committee meetings are expected to be held at least quarterly to review and consider decisions on topics including, but not limited to: review and approval of bonus awards for the prior performance period under our Corporate Incentive Plan (“CIP”) and our 2010 LTIP (described below). The chairperson of the Compensation Committee will regularly report on Compensation Committee actions and recommendations at full meetings of our board of directors. The Compensation Committee will meet outside the presence of all of our executive officers, including our named executive officers, to consider appropriate compensation for our Chief Executive Officer. For all other named executive officers, the Compensation Committee will meet outside the presence of all executive officers and will consult with our Chief Executive Officer. Going forward, our Chief Executive Officer will review annually each other named executive officer’s performance with the Compensation Committee and recommend appropriate base salary, cash performance awards and grants of long-term equity incentive awards for all other executive officers for the Compensation Committee to consider. Based upon the recommendations of our Chief Executive Officer and in consideration of the objectives described above and the elements described below, the Compensation Committee will approve the annual compensation packages of our executive officers. The Compensation Committee also will annually analyze and review our Chief Executive Officer’s performance and determine any cash performance awards under the CIP and grants of long-term equity incentive awards based on its assessment of his performance with input from any independent consultants engaged by the Compensation Committee.
In order to ensure that we continue to remunerate our executives appropriately and align our compensation programs with the interest of our stockholders, the Compensation Committee utilized Frederic W. Cook & Co. in the fall of 2009 and, in February 2010, officially retained Frederic W. Cook & Co., as its independent compensation consultant to review its policies and procedures with respect to executive compensation in connection with this offering. In addition, effective as of December 1, 2009, the Compensation Committee retained independent legal counsel, Brown Rudnick LLP, to provide advice and assistance with respect to the terms and conditions of the Company’s executive employment and compensation related agreements and plans. Frederic W. Cook & Co. has assisted the Compensation Committee by providing comparative market data on compensation practices and programs based on an analysis of peer companies and by providing guidance on industry best practices. The Compensation Committee retains the right to modify or terminate its relationship with Frederic W. Cook & Co., and to retain other outside advisors to assist the Compensation Committee in carrying out its responsibilities. The Compensation Committee intends to continue to retain independent legal counsel. In 2008, the Company engaged an independent employee benefits consulting firm, Edify, to assist the Compensation Committee in benchmarking the Company’s benefit plans that cover executive officers and all other eligible employees against market benefit practices and certain related matters. In January 2010, the Compensation Committee engaged Edify to assist it in similar evaluations for 2010 through 2012.
101
Table of Contents
Elements of Compensation
The Compensation Committee determines all components of executive compensation and has selected the following elements (discussed in detail below) to promote our pay-for-performance philosophy and compensation goals and objectives:
| Ÿ | base salary; |
| Ÿ | annual cash incentive awards linked to our overall performance; |
| Ÿ | periodic grants of long-term equity-based compensation, such as restricted stock or options; |
| Ÿ | termination and change of control provisions; and |
| Ÿ | benefits generally available to employees. |
We combine these elements in order to formulate compensation packages that provide competitive pay, reward the achievement of financial, operational and strategic objectives and align the interests of our executive officers and other senior personnel with those of our stockholders.
Pay Mix
We utilize the particular elements of compensation described above because we believe that it provides a well-proportioned mix of secure compensation, retention value and at-risk compensation which produces short-term and long-term performance incentives and rewards. By following this approach, we provide the executive with a measure of financial and job security, while motivating the executive to focus on business metrics that will produce a high level of short-term and long-term performance for the Company and long-term wealth creation for the executive, as well as reducing the risk of recruitment of top executive talent by competitors. The mix of metrics used for our annual performance bonus and long-term incentive program likewise provides an appropriate balance between short-term financial performance and long-term financial and stock performance.
For key executives, the mix of compensation is weighted more heavily toward at-risk pay (annual bonus incentives and long-term equity incentives). Total at-risk compensation for our named executive officers in 2009 represented between 33% and 93% of an executive’s total target direct compensation. Initial incentive packages for our key executives were negotiated at the time of the employment offer. Equity incentives were viewed to be a critical element of the total compensation package and have historically been issued at the time of hire or promotion; although additional grants have been issued based upon individual circumstances. All incentives are aligned with our stated compensation philosophy of providing compensation commensurate with performance, while targeting pay at approximately the 50th percentile of the competitive market. To ensure we maintain our position to market, it has been our historical practice to review benchmark data on an annual basis to ensure executive compensation remains within the relative ranges noted above by informally comparing total direct compensation with compensation surveys, such as the Radford survey. Based upon this informal analysis, total direct compensation surpassed the targeted median of the competitive market, which was primarily attributable to us either achieving or exceeding our target performance for each of our CIP bonus metrics.
102
Table of Contents
The Compensation Committee intends to evaluate this practice of setting compensation at the 50th percentile going forward. In December 2009, the Compensation Committee’s compensation consultant, Frederic W. Cook & Co., selected the following 19 companies to create an informal benchmark for assistance in determining competitive compensation packages in accordance with our stated philosophy:
| Aruba | Digital River | Limelight Networks | Riverbed | Synchronoss | ||||
| CommVault Systems | Emdeon | NetSuite | Solar Winds | Syniverse | ||||
| Concur Technologies | Epiq Systems | Neustar | Starent Networks | Taleo | ||||
| DigitalGlobe | Infinera | Omniture | SuccessFactors |
During 2010, the Compensation Committee reviewed the above list with Frederic W. Cook & Co. and determined to modify the peer group for benchmarking of compensation going forward. On March 26, 2010, the Compensation Committee approved an updated peer group consisting of the following companies:
| Aruba | DigitalGlobe | Infinera | Smith Micro | Syniverse | ||||
| CommVault Systems | Ebix | Netsuite | Solar Winds | Taleo | ||||
| Concur Technologies | Emdeon | Neustar | SuccessFactors | Vocus | ||||
| Digital River | Epiq Systems | Riverbed | Synchronoss |
Base Salary
The primary component of short-term compensation of our executive officers has historically been base salary. The base salary established for each of our executive officers is intended to reflect competitive wages for positions in companies of similar size and stage of development operating in the software and mobile data services industry, representing each individual’s job duties and responsibilities, experience, and other discretionary factors deemed relevant by our Chief Executive Officer and/or board of directors. Base salary is also designed to provide our executive officers with steady cash flow during the course of the fiscal year that is not contingent on short-term variations in our corporate performance. Our Chief Executive Officer makes recommendations for each executive’s base salary (including his own), based on our executives’ experience and with reference to the base salaries of similarly situated executives in the software and mobile data services industry, that are then reviewed and approved by the Compensation Committee.
Historic annual salary increases have been based on our Chief Executive Officer’s assessment of each named executive officer’s performance, the Company’s overall performance and the other factors described above, including our performance based on criteria such as defined revenue, CIP Adjusted EBITDA, and CIP Working Capital metrics.
With these principles in mind, base salaries are reviewed during the first half of the fiscal year by our Compensation Committee, and may be recommended for adjustment from time to time based on the results of this review. In past years, the Compensation Committee, with guidance from our Chief Executive Officer and/or board of directors, reviewed the performance of all executive officers, and based on this review and any relevant competitive market data (through salary survey information provided by our human resources department, informal discussions with recruiting firms and research), set the executive compensation package for each executive officer for the coming year.
Annual base salary increases have been based upon our pay-for-performance philosophy, whereby pre-determined quantitative and qualitative individual goals and objectives are established at
103
Table of Contents
the beginning of the performance period for named executive officers below the Chief Executive Officer, and measured and assessed at the end of the performance year. Based upon each individual’s performance rating and compensation range position, individuals are eligible for a merit increase based upon the established guidelines within budget for the performance year.
Based upon general economic conditions, like many other companies, we elected to forego merit increases for 2009; therefore, no named executive officers received base salary increases during 2009. In January, 2010, Mr. Wuerch entered into an amended and restated employment agreement with us which increased his base salary from $365,000 to $375,000 and provides that, effective upon this offering, his base salary will increase to $450,000, in each case, as a result of renegotiating his employment agreement and in contemplation of his additional responsibilities associated with the Company’s stock becoming publicly traded. Mr. Wuerch’s base salary increase is described in the section captioned “—Employment Agreements.” The base salaries paid to our named executive officers in fiscal year 2009 are set forth in the Summary Compensation Table below.
Short-Term Incentives
On an annual basis, or at the commencement of an executive officer’s employment with us, the Compensation Committee typically sets a target level of bonus compensation that is structured as a percentage of such executive officer’s annual base salary. Our executives participate in our annual CIP which ensures that short-term incentives are tied directly to our financial performance for the fiscal year. Depending upon corporate performance, an executive officer may receive from 0% up to 150% of his target bonus amount. These corporate performance objectives are designed to be challenging but achievable. The performance metrics and objectives are weighted in a specific manner as defined by the Compensation Committee in the CIP and approved by the board of directors. For all named executive officers, 20% is tied directly to achievement of our revenue objectives; 60% is tied to achievement of our CIP Adjusted EBITDA objectives; and 20% is tied to our CIP Working Capital objectives. Executive officers are not eligible for bonuses if certain minimum targets are not met.
“CIP Adjusted EBITDA” means the Company’s fiscal year 2009 consolidated net income before interest income and expense, provision for income taxes, depreciation and amortization, restructuring charges, stock compensation and other income/expense. For 2010, the CIP Adjusted EBITDA will mean the Company’s fiscal year 2010 consolidated net income before interest income and expense, provision for income taxes, depreciation and amortization, fair value adjustments for warrants and stock compensation. CIP Adjusted EBITDA for fiscal 2010 includes, without limitation, (i) restructuring costs; (ii) other income/expense, with the sole exception being income/expense for fair value adjustment for warrants; and (iii) expenses associated with payments under this 2010 CIP, and the sales incentive plan, as well as all other incentive plans.
“CIP Working Capital” means the Company’s monthly average of (i) accounts receivable minus (ii) account payable minus (iii) other accrued liabilities for the Company’s fiscal year expenses.
The following tables illustrate the metrics, thresholds and potential awards for our named executive officers under the CIP. In order for a named executive officer to receive any payment under the 2009 CIP, a copy of which is attached as an exhibit to this registration statement, the Company must meet the threshold performance targets for each of the revenue and CIP Adjusted EBITDA metrics, as established by the Compensation Committee on or about March 23, 2009.
104
Table of Contents
2009 CIP Metrics:
|
% of CIP Adjusted EBITDA Target Achieved: Weighting 60% |
CIP Adjusted EBITDA Payout % of Target | ||
| less than 87.9% | 0 | % | |
| greater than or equal to 87.9% | 70 | % | |
| 100.0% | 100 | % | |
| 160.5% | 125 | % | |
| 221% | 150 | % |
|
% of Revenue Target Achieved: Weighting 20% |
Revenue Payout % of Target | ||
| less than 98.9% | 0 | % | |
| greater than or equal to 98.9% | 70 | % | |
| 100.0% | 100 | % | |
| 104.4% | 125 | % | |
| 108.8% | 150 | % |
|
% of CIP Working Capital Target Achieved: Weighting 20% |
CIP Working Capital Payout % of Target | ||
| greater than 106.0% | 0 | % | |
| less than or equal to 106.0% | 70 | % | |
| 100.0% | 100 | % | |
| 77.3% | 125 | % | |
| 54.5% | 150 | % |
At this time, we are not disclosing the specific performance targets for the CIP Adjusted EBITDA, revenue and CIP Working Capital metrics set forth above because disclosure of the specific targets under the CIP would signal areas of strategic focus and give competitors harmful insight into the direction of our business. We are committed to the long-term success and growth of our enterprise and disclosing short-term objectives would run counter to both our compensation and business philosophy of focusing on long-term goals and, as a result, could result in confusion for investors. As we gain experience as a public company and expand, we will continue to assess whether the disclosure of specific performance metrics will cause us competitive harm. The 2009 targets above may not be changed from those previously established, except with the written consent of the Compensation Committee. Pursuant to the terms of the CIP, participation in the plan is at the Company’s discretion and the Compensation Committee retains the discretion to alter, modify or amend the plan. These bonuses are intended to annually reward executive officers who have a positive impact on corporate results.
In addition, the Compensation Committee may adjust performance measures, targets and payout ranges due to extraordinary or nonrecurring events, such as significant financings, equity offerings or acquisitions. We believe that establishing competitive cash bonus opportunities helps us attract and retain qualified and highly skilled executives, and allows our executives to fully focus on the business objectives without the burden of considering potential loss of wealth due to extenuating circumstances. In July 2009, the board approved a revised budget for fiscal 2009 to take into account expenses incurred due to the Company’s international expansion activities. In light of these expenses, which were unrelated to its core U.S. business operations and unanticipated at the time the Compensation Committee established the 2009 CIP performance targets, the Compensation Committee determined that the impact of the Company’s international expansion should be excluded from the determination of the achievement of the CIP Adjusted EBITDA performance goal for 2009. The reason for the adjustment was to take into account additional expenses incurred with the Company’s international expansion.
Our named executive officers’ threshold and maximum awards under the CIP are based upon pre-determined quantitative goals and objectives established at the beginning of the performance period, as noted above. Maximum achievement of the CIP was set at a level that significantly exceeded our business plan and had a low probability of payout. These metrics are measured and
105
Table of Contents
assessed at the end of the performance year. In April 2009, our Compensation Committee established the target percentage amounts for the cash bonuses for each of our named executive officers in accordance with their respective employment agreements and offer letters. For fiscal year 2009, Messrs. Wuerch, Leigh, Hebner, Ryan and Smith were eligible to receive on-target annual cash bonuses of 75%, 50%, 55%, 50% and 55%, respectively, of their fiscal year 2009 base salaries. For fiscal year 2009, at threshold achievement for each of the CIP Adjusted EBITDA, revenue and CIP Working Capital objectives, our named executive officers were entitled to receive 70% of their target CIP bonus. Under Mr. Wuerch’s amended and restated employment agreement, effective upon this offering, Mr. Wuerch’s on-target annual cash bonus will be increased to 100% of his base salary. Mr. Wuerch’s on-target annual bonus increase is described in the section captioned “—Employment Agreements.”
Based on actual operating results for fiscal year 2009, the Company achieved 100% of its revenue target, 145% of its CIP Adjusted EBITDA target (taking into account the adjustment for the international expansion activities), and 140% of its CIP Working Capital target. As a result, each of our named executive officers were eligible to receive an above target bonus for fiscal year 2009 determined by multiplying each named executive officer’s respective target bonus by actual achievement for each performance metric, taking into account the applicable weighting for each metric (i.e., 60% weighting for CIP Adjusted EBITDA, 20% weighting for revenue and 20% weighting for CIP Working Capital). Based upon the Company’s performance for fiscal year 2009, Messrs. Wuerch, Hebner, Leigh, Smith and Ryan are entitled to 2009 CIP bonuses equal to $369,563, $207,714, $195,750, $244,766, and $108,281, respectively. With respect to Mr. Hebner, prior to March 6, 2009, he served as the interim Chief Financial Officer and, as a result, was only eligible for a pro-rata CIP bonus based upon the period during which he served as our permanent Chief Financial Officer. However, as a result of his high level of performance during 2009, the Compensation Committee calculated the amount of his bonus based on his total earnings for the 2009 fiscal year (in his capacity as both the interim and permanent Chief Financial Officer).
On December 16, 2009, the Compensation Committee approved the CIP for fiscal year 2010 under which our structure and process for short-term incentives will be materially the same as stated for 2009. However, the 2010 CIP also provides that if the Compensation Committee determines that the calculations underlying the targets were incorrect (including but not limited to mistakes in the Company’s audited financial statements for the year), then the Compensation Committee may either adjust bonus awards (upward or downward) or, with respect to officers that are reporting persons pursuant to Section 16(a) of the Exchange Act, recover all (or a portion) of a bonus award. A copy of the 2010 CIP is attached as an exhibit to this registration statement. This includes stated thresholds for minimum payout for the CIP Adjusted EBITDA, revenue and CIP Working Capital financial targets of 90%, 95% and 105% respectively. The 2010 CIP similarly incorporates graduated thresholds for incremental payouts commensurate with the three weighted performance categories ranging from 0% to 150%.
106
Table of Contents
2010 CIP Metrics:
|
% of CIP Adjusted EBITDA Target Achieved: Weighting 60% |
CIP Adjusted EBITDA Payout % of Target | |
| less than 90% | 0% | |
| greater than or equal to 90% | 60% | |
| 100% | 100% | |
| 115% | 125% | |
| 130% | 150% | |
| % of Revenue Target Achieved: Weighting 20% |
Revenue Payout % of Target | |
| less than 95% | 0% | |
| greater than or equal to 95% | 60% | |
| 100% | 100% | |
| 105% | 125% | |
| 110% | 150% | |
|
% of CIP Working Capital Target Achieved: Weighting 20% |
CIP Working Capital Payout % of Target | |
| greater than 105% | 0% | |
| less than or equal to 105% | 60% | |
| 100% | 100% | |
| 75% | 125% | |
| 50% | 150% | |
Long-Term Equity-Based Compensation
The Compensation Committee believes that equity-based compensation is an important component of our executive compensation program and that providing a significant portion of our executive officers’ total compensation package in equity-based compensation aligns the incentives of our executives with the interests of our stockholders and with our long-term corporate success. Additionally, the Compensation Committee believes that equity-based compensation awards enable us to attract, motivate, retain and adequately compensate executive talent. To that end, we have historically awarded equity-based compensation in the form of restricted stock and stock options. The Compensation Committee believes equity awards provide executives with a significant long-term interest in our success by rewarding the creation of stockholder value over time. Going forward, the Compensation Committee intends to use stock appreciation awards, such as options to purchase the Company’s common stock, rather than full value awards such as restricted stock, as awards to our executive officers.
In the past, our executive officers, other than Mr. Wuerch, were provided with an equity grant in the form of restricted stock when they joined our company based upon the executive’s position with us and his or her relevant prior experience. These inducement grants have a double trigger vesting schedule. First, shares accrue on a calendar quarter basis over a four year term commencing at the end of the first calendar quarter completed following the grant date to encourage executive longevity and to compensate our executive officers for their contribution to our success over a period of time. Second, when a qualifying event, generally, a sale of the Company or “Change of Control” where 50% of the consideration received by stockholders is cash or marketable securities (“Sale”) or a qualified public offering of common stock with a value of at least $40 million (“Offering”) occurs (the second trigger), the accrued shares will immediately vest (in the case of an Offering vesting is delayed until the date all trading restrictions imposed in connection with an Offering are terminated). For purposes of the restricted stock grants, a “Change of Control” generally means (i) a merger, share exchange, consolidation, or reorganization where the Company’s stockholders prior to such event own less than 50% of the voting power and equity ownership after such event or (ii) a transaction in which a person becomes the beneficial owner of more than 50% of the Company’s common stock. Below is a table that will provide an overview of the various scenarios related to the potential accrual or vesting of
107
Table of Contents
shares with regard to our restricted stock awards (except that two of the restricted stock awards granted to our Chief Executive Officer had different vesting terms):
| Event |
Effect on Vesting(1) | |||
| Sale or Offering occurs during employment |
(i) No Change of Control prior to Trigger Date | (i) On Trigger Date, 1/16 of total restricted shares x # of calendar quarters | ||
|
(ii) Change of Control occurs on or before Trigger Date |
(ii) On Trigger Date, 1/2 of total restricted shares plus 1/32 of the total shares x # of calendar quarters | |||
|
(iii) After Trigger Date with no Change of Control |
(iii) 1/16 of total restricted shares continue to vest each calendar quarter | |||
|
(iv) After Trigger Date and after Change of Control |
(iv) 1/32 of total restricted shares continue to vest each calendar quarter | |||
|
(v) Change of Control after Trigger Date |
(v) 1/2 of remaining unvested restricted shares vest on Change of Control date | |||
|
(vi) Employee is terminated other than for cause or disability or employee terminates for good reason within 12 months after Change of Control |
(vi) All remaining unvested restricted shares vest on date of termination | |||
|
(vii) Employee is terminated other than for cause or disability more than 12 months after Change of Control |
(vii) 1/2 of remaining unvested restricted shares vest on date of termination | |||
| Sale or Offering occurs after termination of employment | (i) Employee is terminated other than for cause or disability or employee terminates for good reason within 12 months after Change of Control | (i) All restricted shares vest on the Trigger Date | ||
|
(ii) Employee is terminated other than for cause or disability more than 12 months after Change of Control |
(ii) 3/4 of the total restricted shares plus 1/64 of the total restricted shares x # of calendar quarters vest on the Trigger Date | |||
|
(iii) Employee is terminated without cause or disability on a date when no Change of Control has occurred |
(iii) 1/2 of the total restricted shares plus 1/32 of the total restricted shares x # of calendar quarters vest on the Trigger Date | |||
|
(iv) Employee leaves voluntarily or is terminated for cause or disability upon or after Change of Control |
(iv) 1/2 of the total restricted shares plus 1/32 of the total restricted shares x # of calendar quarters vest on the Trigger Date | |||
|
(v) Employee leaves voluntarily or is terminated for cause or disability when no Change of Control has occurred |
(v) 1/16 of the total restricted shares x # of calendar quarters vest on the Trigger Date | |||
| (1) | Mr. Wuerch received a grant of restricted stock on January 8, 2008 which generally vests on the same terms as set forth in the table above, except that his grant vests over 12 quarters (rather than 16) and the accelerated vesting provisions are based on the 12 quarter vesting schedule. In addition, Mr. Wuerch received a grant of restricted stock on September 29, 2004 on separate terms that vests in six pro-rata equal installments on each April 30 of 2005 through 2010, respectively. |
“Trigger Date” means the date a Sale is consummated or the date all trading restrictions imposed in connection with an Offering are terminated.
“# of calendar quarters” means the number of calendar quarters that have been completed since the date of the grant.
108
Table of Contents
In accordance with the foregoing table, in connection with the completion of this offering, the following shares of restricted stock will vest for each of our named executive officers:
| Name |
Grant Date | Total Shares of Restricted Stock Outstanding |
1/16 of the Total # of Shares |
1/12 of the Total # of Shares |
# of Calendar Quarters Vested upon the Trigger Date(1) |
# of Shares to Vest on the Trigger Date(2) | ||||||
| Ryan K. Wuerch(3) |
1/8/2008 | 275,518 | 17,220 | — | 11 | 189,419 | ||||||
| Ryan K. Wuerch |
1/8/2008 | 94,621 | — | 7,885 | 11 | 86,735 | ||||||
| Allyn P. Hebner |
5/7/2009 | 166,666 | 10,417 | — | 6 | 62,500 | ||||||
| Richard E. Leigh, Jr. |
11/13/2008 | 133,333 | 8,333 | — | 8 | 66,666 | ||||||
| Jim Smith(4) |
2/5/2009 | 333,333 | 20,833 | — | 7 | 145,833 | ||||||
| James Ryan |
8/6/2009 | 233,333 | 14,583 | — | 5 | 72,916 |
| (1) | Assumes this offering becomes effective during the second quarter of 2010 and each named executive officer is subject to a six month lock-up period (the Trigger Date is the date all trading restrictions lapse, which would occur in the fourth quarter of 2010). |
| (2) | Represents 1/16 or 1/12, as applicable, of the number of the restricted shares outstanding multiplied by the number of calendar quarters vested prior to the Trigger Date. |
| (3) | In addition to the restricted stock awards granted to Mr. Wuerch on January 8, 2008, Mr. Wuerch received a restricted share grant of 147,056 shares on September 29, 2004 which vests in six pro-rata equal installments on each April 30 of 2005 through 2010, respectively, and, accordingly, such shares fully vested on April 30, 2010. |
| (4) | In addition, Mr. Smith was granted 66,666 shares of restricted stock on February 9, 2010, of which 12,500 shares (three multiplied by 4,166 shares (1/16 of the restricted shares outstanding)) will vest as of the Trigger Date, assuming this offering becomes effective in the second quarter of 2010 and the lock-up period expires in the fourth quarter of 2010 (Mr. Smith will have accrued three quarters of vesting). |
In addition to restricted stock granted upon commencement of employment with us, our Compensation Committee may grant additional equity awards to retain our executives and to recognize the achievement of corporate and individual goals and/or strong individual performance. On February 9, 2010, in accordance with the terms of his offer letter, the Compensation Committee granted Mr. Smith 66,666 shares of restricted stock to vest in accordance with the terms of the restricted stock awards described above. Upon Mr. Smith’s commencement of his employment, he signed an offer letter which provides that if he is employed in good standing on January 5, 2010 then he would be entitled to a grant of 66,666 shares of restricted stock. See the section captioned “—Employment Agreements” for a further discussion of Mr. Smith’s offer letter. Additional forms of equity may be granted in the future, including stock options, as recommended by the Compensation Committee and approved by the board of directors.
In 2009, the following named executive officers were granted long-term equity-based grants: Jim Smith (333,333 shares), Allyn P. Hebner (166,666 shares), and James Ryan (233,333 shares). All of these grants were restricted share awards made at the time of Messrs. Smith’s, Hebner’s and Ryan’s commencement of employment with the Company and were made based on a number of considerations, including the competitive market for similarly situated technology executives and negotiations needed to secure qualified executives to backfill key vacancies on the leadership team. Restricted shares, with the vesting schedule as described above, were selected for these new hire grants to create a long-term ownership stake in our Company. Under the terms of Mr. Wuerch’s amended and restated employment agreement, the Compensation Committee approved the grant of 333,333 stock options to Mr. Wuerch under the terms of our 2010 LTIP (described below). Mr. Wuerch’s stock option grant is described in the section captioned “—Employment Agreements.”
109
Table of Contents
Equity Incentive Plans
2004 Stock Plan
The 2004 Amended and Restated Stock Incentive Plan of Motricity, Inc. (the “2004 Motricity, Inc. Stock Plan”) provides for grants of incentive stock options, non-qualified stock options, shares of stock and restricted stock to eligible participants, including executive officers, employees and directors. The purpose of the 2004 Motricity, Inc. Stock Plan is to provide equity incentives to selected participants, thereby creating a means to raise the level of stock ownership by eligible participants, to more closely align the interests of our executives, employees and directors with those of our stockholders. The following is a summary of the material terms of the 2004 Motricity, Inc. Stock Plan, but does not include all of the provisions of the plan.
Following the adoption of the 2010 Plan (described below), the Compensation Committee does not intend to make further grants under the 2004 Motricity, Inc. Stock Plan.
For further information about the 2004 Motricity, Inc. Stock Plan, we refer you to the complete copy of the 2004 Motricity, Inc. Stock Plan, which we have filed as an exhibit to this registration statement.
Administration. The 2004 Motricity, Inc. Stock Plan provides that the board, or a committee designated by the board, shall have the authority to administer the plan. In this regard, the board has delegated administration of the 2004 Motricity, Inc. Stock Plan to the Compensation Committee, which has the authority (i) to determine the persons to whom awards will be granted, the types of awards to be granted, the terms and conditions of each award, the number of shares to be covered by each award, (ii) to construe and resolve the 2004 Motricity, Inc. Stock Plan or any award agreement granted thereunder, and (iii) to adopt such rules and guidelines for administering the 2004 Motricity, Inc. Stock Plan as it deems necessary or proper. All actions, interpretations and determinations by the Compensation Committee are final and binding.
Available Shares. The aggregate number of shares which may be issued under the 2004 Motricity Inc., Stock Plan shall not exceed 5,113,003 shares (subject to possible adjustment to reflect certain transactions, such as mergers, consolidations, reorganizations or changes in our capital structure). If any shares subject to an award under the 2004 Motricity, Inc. Stock Plan are not delivered to a participant because the award expires, is forfeited, cancelled, settled in cash, used to satisfy applicable tax withholding obligations or used to pay the purchase price of an award, the number of shares underlying such awards will again be available for the purposes of awards under the 2004 Motricity, Inc. Stock Plan. To the extent required to comply with 162(m) of the Internal Revenue Code of 1986, as amended (the “Code”), during any 12-month period, no participant may be granted awards for more than 266,666 shares (or equivalent value based on the fair market value per share on the date of grant), subject to possible adjustment to reflect certain transactions.
Eligibility for Participation. Employees, members of our board of directors, and consultants to us or a related entity, who are selected by the Compensation Committee, are eligible to receive awards under the 2004 Motricity, Inc. Stock Plan.
Award Agreement. Awards granted under the 2004 Motricity, Inc. Stock Plan shall be evidenced by award agreements that provide additional terms, conditions, restrictions and/or limitations covering the grant of the award, as determined by the Compensation Committee.
Awards Under the 2004 Motricity, Inc. Stock Plan. The following types of awards are available under the 2004 Motricity, Inc. Stock Plan:
Stock Options. The Compensation Committee may grant nonqualified stock options and incentive stock options (only to eligible employees) to purchase shares of our common stock. The
110
Table of Contents
Compensation Committee will determine the number of shares subject to each option, the term of each option (which may not exceed 10 years in the case of an incentive stock option (or five years in the case of an incentive stock option granted to a 10% stockholder)), the exercise price, the vesting schedule (if any), and the other material terms of each option. The exercise price of an option is determined by the Compensation Committee at the time of grant, provided that no incentive stock option may have an exercise price less than the fair market value of a share of our common stock at the time of grant (or, in the case of an incentive stock option granted to a 10% stockholder, 110% of such share’s fair market value). Options will be exercisable at such time or times and subject to such terms and conditions as determined by the Compensation Committee at the time of grant.
Restricted Stock. The Compensation Committee may also grant shares of stock in the form of bonus stock or restricted stock (collectively, “Stock Awards”). Except as otherwise provided by the Compensation Committee upon the grant of a Stock Award, the recipient generally has the rights of a stockholder with respect to the shares, including the right to receive dividends, the right to vote the shares of restricted stock and, conditioned upon full vesting of shares of restricted stock, the right to tender such shares, subject to the conditions and restrictions generally applicable to the Stock Awards or specifically set forth in the recipient’s Stock Award Agreement, including a restricted Stock Award, which may include satisfaction of pre-established performance goals, and the criteria or date or dates on which such restrictions will lapse.
If the grant of a Stock Award or the lapse of the relevant restrictions is based on the attainment of performance goals, the Compensation Committee will establish for each recipient the applicable performance goals, formulae or standards and the applicable vesting percentages with reference to the attainment of such goals or satisfaction of such formulae or standards. These performance goals will be based on one or more of the following criteria selected by the Compensation Committee: (i) consolidated earnings before or after taxes (including earnings before interest, taxes, depreciation and amortization); (ii) net income; (iii) operating income; (iv) earnings per share; (v) book value per share; (vi) return on stockholders’ equity; (vii) return on investment; (viii) return on capital; (ix) improvements in capital structure; (x) expense management; (xi) profitability of an identifiable business unit or product; (xii) maintenance or improvement of profit margins; (xiii) stock price or total stockholder return; (xiv) market share; (xv) revenues or sales; (xvi) costs; (xvii) cash flow; (xviii) working capital; (xix) return on assets; (xx) economic wealth created; or (xxi) strategic business criteria. In addition, all performance goals may be based upon the attainment of specified levels of performance for a division or other operational unit or based upon individual performance factors.
Dividend Equivalents. The Compensation Committee may provide that awards granted under the 2004 Motricity, Inc. Stock Plan may earn dividends or dividend equivalents.
Amendment and Termination. The board may amend or terminate the 2004 Motricity, Inc. Stock Plan at any time; provided, however, that, unless otherwise required by law or specifically provided in the plan, the rights of a participant with respect to awards granted prior to such amendment, or termination may not be adversely affected without the consent of such participant. The Compensation Committee has the authority to make adjustments to the terms and conditions of awards in recognition of unusual or nonrecurring events or to make other adjustments as the Compensation Committee deems appropriate.
Transferability. Awards granted under the 2004 Motricity, Inc. Stock Plan are generally nontransferable (other than by will or the laws of descent and distribution), except that the Compensation Committee may provide for the transferability of nonqualified stock options at the time of grant or thereafter.
Effective Date. The effective date of the 2004 Motricity, Inc. Stock Plan was March 19, 2004.
111
Table of Contents
2010 Long-Term Incentive Plan
The Compensation Committee approved the terms of the Motricity, Inc. 2010 Long-Term Incentive Plan, or the “2010 LTIP” on March 26, 2010. The board of directors approved the 2010 LTIP on April 23, 2010. The 2010 LTIP provides for grants of stock options, stock appreciation rights, restricted stock, other stock-based awards and other cash-based awards. Directors, officers and other employees of us and our subsidiaries, as well as others performing consulting or advisory services for us, will be eligible for grants under the 2010 LTIP. The purpose of the 2010 LTIP is to provide incentives that will attract, retain and motivate highly competent officers, directors, employees and consultants by providing them with appropriate incentives and rewards either through a proprietary interest in our long-term success or compensation based on their performance in fulfilling their personal responsibilities. The following is a summary of the material terms of the 2010 LTIP, but does not include all of the provisions of the 2010 LTIP. For further information about the 2010 LTIP, we refer you to the complete copy of the 2010 LTIP, which we have filed as an exhibit to this registration statement.
Administration. The 2010 LTIP is administered by our Compensation Committee and all actions taken with respect to the 2010 LTIP will be made in accordance with the Compensation Committee’s Charter. For purposes of the 2010 LTIP, to the extent required by applicable law, it is intended that each member of the Compensation Committee qualify as (a) a “non-employee director” under Rule 16b-3, (b) an “outside director” under Section 162(m) of the Code, and (c) an “independent director” under the rules of the principal U.S. national securities exchange on which our shares are listed. The Compensation Committee has full authority to administer and interpret the 2010 LTIP. Among the Compensation Committee’s powers are to determine the form, amount and other terms and conditions of awards, clarify, construe or resolve any ambiguity in any provision of the 2010 LTIP or any award agreement, amend the terms of outstanding awards and adopt such rules, forms, instruments and guidelines for administering the 2010 LTIP as it deems necessary or proper. All actions, interpretations and determinations by the Compensation Committee or by our board of directors are final and binding.
Available Shares. The aggregate number of shares of common stock which may be issued or used for reference purposes under the 2010 LTIP or with respect to which awards may be granted may not exceed 2,765,621 shares, which may be either authorized and unissued shares of our common stock or shares of common stock held in or acquired for our treasury. In general, if awards under the 2010 LTIP are for any reason cancelled, or expire or terminate unexercised, or are settled in cash, the shares covered by such awards will again be available for the grant of awards under the 2010 LTIP.
Following the Section 162(m) “transition period,” the maximum number of shares subject to any award of stock options, or stock appreciation rights (which are referred to herein as “SARs”), or shares of restricted stock, or other stock-based awards subject to the attainment of specified performance goals which may be granted during any fiscal year to any participant will be 266,666 shares per type of award, provided that the maximum number of shares for all types of awards does not exceed 691,405 shares. There are no annual individual share limitations applicable to participants for restricted stock or other stock-based awards that are not subject to the attainment of specified performance goals. The maximum number of shares subject to any performance award during any fiscal year to any participant shall be 266,666 shares. The maximum value of a cash payment made under a performance award which may be granted with respect to any fiscal year to any participant shall be $5,440,000. The maximum value of cash payments made under performance awards granted with respect to any fiscal year to all participants shall be $14,104,670.
The foregoing share limitations imposed under the 2010 LTIP are subject to adjustment to the extent the Compensation Committee deems such adjustment appropriate and equitable to prevent dilution or enlargement of participants’ rights.
112
Table of Contents
Eligibility for Participation. Members of our board of directors, as well as employees of, and consultants to, us or any of our subsidiaries and affiliates are eligible to receive awards under the 2010 LTIP. The selection of participants is within the sole discretion of the Compensation Committee.
Award Agreement. Awards granted under the 2010 LTIP shall be evidenced by award agreements (which need not be identical) that provide additional terms, conditions, restrictions and/or limitations covering the grant of the award, including, without limitation, additional terms providing for the acceleration of, exercisability, or vesting of awards in the event of a Change in Control (as defined in the 2010 LTIP) or conditions regarding the participant’s employment, as determined by the Compensation Committee in its sole discretion.
Awards Under the 2010 LTIP. The following types of awards are available under the 2010 LTIP:
Stock Options. The Compensation Committee may grant nonqualified stock options and incentive stock options (only to eligible employees) to purchase shares of our common stock. The Compensation Committee will determine the number of shares of our common stock subject to each option, the term of each option (which may not exceed 10 years (or five years in the case of an incentive stock option granted to a 10% stockholder)), the exercise price, the vesting schedule (if any), and the other material terms of each option. No incentive stock option or nonqualified stock option may have an exercise price less than the fair market value of a share of our common stock at the time of grant (or, in the case of an incentive stock option granted to a 10% stockholder, 110% of such share’s fair market value). Options will be exercisable at such time or times and subject to such terms and conditions as determined by the Compensation Committee at grant and the exercisability of such options may be accelerated by the Compensation Committee in its sole discretion. The 2010 LTIP specifically provides that an outstanding option may not be modified to reduce the exercise price nor may a new option at a lower price be substituted for a surrendered option, unless such action is approved by the stockholders of the Company. The maximum number of shares of common stock with respect to which incentive stock options may be granted under the 2010 LTIP is 2,765,621 shares.
Stock Appreciation Rights. The Compensation Committee may grant SARs either with a stock option, which may be exercised only at such times and to the extent the related option is exercisable (which is referred to herein as a “Tandem SAR”), or independent of a stock option (which is referred to herein as a “Non-Tandem SAR”). A SAR is a right to receive a payment in shares of our common stock or cash (as determined by the Compensation Committee) equal in value to the excess of the fair market value of one share of our common stock on the date of exercise over the exercise price per share established in connection with the grant of the SAR. The term of each SAR may not exceed 10 years. The exercise price per share covered by a SAR will be the exercise price per share of the related option in the case of a Tandem SAR and will be the fair market value of our common stock on the date of grant in the case of a Non-Tandem SAR. The Compensation Committee may also grant “limited SARs,” either as Tandem SARs or Non-Tandem SARs, which may become exercisable only upon the occurrence of a Change in Control or such other event as the Compensation Committee may, in its sole discretion, designate at the time of grant or thereafter.
Restricted Stock. The Compensation Committee may award shares of restricted stock. Except as otherwise provided by the Compensation Committee upon the award of restricted stock, the recipient generally has the rights of a stockholder with respect to the shares, including the right to receive dividends, the right to vote the shares of restricted stock and, conditioned upon full vesting of shares of restricted stock, the right to tender such shares, subject to the conditions and restrictions generally applicable to restricted stock or specifically set forth in the recipient’s restricted stock agreement. The Compensation Committee may determine at the time of award that the payment of dividends, if any, will be deferred until the expiration of the applicable restriction period.
113
Table of Contents
Recipients of restricted stock are required to enter into a restricted stock agreement with us that states the restrictions to which the shares are subject, which may include satisfaction of pre-established performance goals, and the criteria or date or dates on which such restrictions will lapse.
If the grant of restricted stock or the lapse of the relevant restrictions is based on the attainment of performance goals, the Compensation Committee will establish for each recipient the applicable performance goals, formulae or standards and the applicable vesting percentages with reference to the attainment of such goals or satisfaction of such formulae or standards while the outcome of the performance goals are substantially uncertain. Such performance goals may incorporate provisions for disregarding (or adjusting for) changes in accounting methods, corporate transactions (including, without limitation, dispositions and acquisitions) and other similar events or circumstances. The performance goals for performance-based restricted stock will be based on one or more of the objective criteria set forth on Exhibit A to the 2010 LTIP and discussed in general below.
Other Stock-Based Awards. The Compensation Committee may, subject to limitations under applicable law, make a grant of such other stock-based awards (including, without limitation, stock equivalent units or restricted stock units) under the 2010 LTIP that are payable in cash or denominated or payable in or valued by shares of our common stock or factors that influence the value of such shares. The Compensation Committee shall determine the terms and conditions of any such other awards, which may include the achievement of certain minimum performance goals and/or a minimum vesting period. The performance goals for performance-based other stock-based awards will be based on one or more of the objective criteria set forth on Exhibit A to the 2010 LTIP and discussed in general below.
Other Cash-Based Awards. The Compensation Committee, in its discretion, may grant awards payable in cash. Cash-based awards shall be in such form, and dependent on such conditions, as the Compensation Committee shall determine, including, without limitation, being subject to the satisfaction of vesting conditions or awarded purely as a bonus and not subject to restrictions or conditions. If a cash-based award is subject to vesting conditions, the Compensation Committee may accelerate the vesting of such award in its discretion.
Performance Awards. The Compensation Committee may grant a performance award to a participant payable upon the attainment of specific performance goals. The Compensation Committee may grant performance awards that are intended to qualify as “performance-based compensation” under Section 162(m) of the Code, as well as performance awards that are not intended to qualify as “performance-based compensation” under Section 162(m) of the Code. If the performance award is payable in cash, it may be paid upon the attainment of the relevant performance goals either in cash or in shares of restricted stock (based on the then current fair market value of such shares), as determined by the Compensation Committee, in its sole discretion. Based on service, performance and/or such other factors or criteria, if any, as the Compensation Committee may determine, the Compensation Committee may, at or after grant, accelerate the vesting of all or any part of any performance award. The Compensation Committee has “negative discretion” to adjust bonus payments as permitted by Section 162(m) of the Code.
Performance Goals. The Compensation Committee may grant awards of restricted stock, performance awards, and other stock-based awards that are intended to qualify as “performance-based compensation” for purposes of Section 162(m) of the Code. These awards may be granted, vest and be paid based on attainment of specified performance goals established by the Compensation Committee. These performance goals will be based on the attainment of a certain target level of, or a specified increase or decrease in, one or more of the following criteria selected by the Compensation Committee: (i) earnings per share; (ii) operating income; (iii) gross income; (iv) net income (before or
114
Table of Contents
after taxes); (v) cash flow; (vi) gross profit; (vii) gross profit return on investment; (viii) gross margin return on investment; (ix) gross margin; (x) operating margin; (xi) working capital; (xii) earnings before interest and taxes; (xiii) earnings before interest, tax, depreciation and amortization; (xiv) return on equity; (xv) return on assets; (xvi) return on capital; (xvii) return on invested capital; (xviii) net revenues; (xix) gross revenues; (xx) revenue growth; (xxi) annual recurring revenues; (xxii) recurring revenues; (xxiii) license revenues; (xxiv) sales or market share; (xxv) total shareholder return; (xxvi) economic value added; (xxvii) specified objectives with regard to limiting the level of increase in all or a portion of the Company’s bank debt or other long-term or short-term public or private debt or other similar financial obligations of the Company, which may be calculated net of cash balances and/or other offsets and adjustments as may be established by the Compensation Committee in its sole discretion; (xxviii) the fair market value of the a share of common stock; (xxix) the growth in the value of an investment in the common stock assuming the reinvestment of dividends; or (xxx) reduction in operating expenses.
To the extent permitted by law, the Compensation Committee may also exclude the impact of an event or occurrence which the Compensation Committee determines should be appropriately excluded, including: (i) restructurings, discontinued operations, extraordinary items and other unusual or non-recurring charges; (ii) an event either not directly related to our operations or not within the reasonable control of management; or (iii) a change in accounting standards required by generally accepted accounting principles. Performance goals may also be based on an individual participant’s performance goals, as determined by the Compensation Committee, in its sole discretion.
In addition, all performance goals may be based upon the attainment of specified levels of our performance (or subsidiary, division or other operational unit) under one or more of the measures described above relative to the performance of other corporations. The Compensation Committee may designate additional business criteria on which the performance goals may be based or adjust, modify or amend those criteria.
Change in Control. In connection with a Change in Control, the Compensation Committee may accelerate vesting of outstanding awards under the 2010 LTIP. In addition, such awards will be, in the discretion of the Compensation Committee, (i) assumed and continued or substituted in accordance with applicable law or (ii) purchased by us for an amount equal to the excess of the price of a share of our common stock paid in a Change in Control over the exercise price of the award(s). Under the 2010 LTIP, a “Change in Control” generally means (i) a person becoming the owner of 50% or more of the voting power of the Company’s voting securities (other than by acquisitions (a) by the Company or any subsidiary, (b) by any employee benefit plan sponsored or maintained by the Company or any subsidiary, (c) by any underwriter temporarily holding securities pursuant to an offering, (d) pursuant to a “Non-Qualifying Transaction” (as defined in the 2010 LTIP) or (e) by any person that owned 30% or more of the Company’s voting securities immediately prior to such transaction); (ii) a change in the majority of the directors of the board during any 24 month period without the consent of a majority of the board, (iii) the consummation of a transaction that requires the approval of the Company’s stockholders (other than a Non-Qualifying Transaction); or (iv) the consummation of a sale of all or substantially all of the Company’s assets (other than to a person then owning 30% or more of the Company’s voting securities). Under the 2010 LTIP, a Change in Control specifically excludes (A) an acquisition of more than 30% of voting securities by the Company which reduces the number of voting securities outstanding, unless after such acquisition a person becomes the beneficial owner of additional voting securities that increases the percentage of outstanding voting securities owned by such person or (B) as the result of either the acquisition of more than 30% of the voting securities or of all or substantially all of the Company’s assets by any of the following or their affiliates: Advanced Equities, Inc., Carl C. Icahn, New Enterprise Associates, Inc. or Technology Crossover Ventures.
Acquisition Event. In the event of a merger or consolidation in which the Company is not the surviving entity, a transaction that results in the acquisition of substantially all of the Company’s
115
Table of Contents
outstanding common stock, or the sale or transfer of all or substantially all of the Company’s assets (collectively, an “Acquisition Event”), then the Compensation Committee may terminate all outstanding and unexercised options, SARs, or any other stock-based award that provides for a participant elected exercise by cashing out such awards upon the date of consummation of the Acquisition Event or by delivering notice of termination to each participant at least 20 days prior to the date of consummation of the Acquisition Event, in which case during the period from the date on which such notice of termination is delivered to the consummation of the Acquisition Event, each such participant shall have the right to exercise in full all of his or her outstanding awards contingent on the occurrence of the Acquisition Event.
Stockholder Rights. Except as otherwise provided in the applicable award agreement, and with respect to an award of restricted stock, a participant has no rights as a stockholder with respect to shares of our common stock covered by any award until the participant becomes the record holder of such shares.
Forfeiture and Clawback. Unless otherwise provided by the Compensation Committee in the governing award agreement, the 2010 LTIP provides that in the event that (a) the participant engages in “detrimental activity” (which only applies to non-executive employees) during the 12-month period commencing on the date of vesting, exercise, distribution, or settlement of an award, the Company shall recover from the participant within 12 months after such vesting, exercise, settlement, or distribution, an amount equal to any gain realized on such award, (b) the participant’s employment is terminated by the Company for “Cause” (which only applies to executive officers) during the 24-month period commencing on the date of vesting, exercise, distribution, or settlement of an award, the Company shall recover from the participant within 24 months after such vesting, exercise, settlement, or distribution, an amount equal to any gain realized on such award, and (c) the participant engages in “detrimental activity” or is terminated for “Cause” all outstanding awards terminate and expire.
Unless otherwise provided by the Compensation Committee in the governing award agreement, the 2010 LTIP also provides that in the event of a restatement of the Company’s financial statements that reduces the amount of any previously awarded performance award, where the performance goals would not otherwise have been met had the results been properly reported, the award will be cancelled and the participant will pay the Company an amount equal to any gain realized on such award within (a) 24 months preceding such financial restatement for any participant who has a position with the Company as a vice president, senior vice president, executive officer or named executive officer or (b) 12 months preceding such financial restatement for all other participants.
Amendment and Termination. Notwithstanding any other provision of the 2010 LTIP, our board of directors may at any time amend any or all of the provisions of the 2010 LTIP, or suspend or terminate it entirely, retroactively or otherwise; provided, however, that, unless otherwise required by law or specifically provided in the 2010 LTIP, the rights of a participant with respect to awards granted prior to such amendment, suspension or termination may not be adversely affected without the consent of such participant.
Transferability. Awards granted under the 2010 LTIP are generally nontransferable (other than by will or the laws of descent and distribution), except that the Compensation Committee may provide for the transferability of nonqualified stock options in an award agreement at the time of grant or thereafter to certain family members.
Other Executive Benefits
Our executives are eligible for the following benefits on the same basis as other eligible employees:
| Ÿ | health insurance; |
116
Table of Contents
| Ÿ | vacation, personal holidays and sick days; |
| Ÿ | life insurance and supplemental life insurance; |
| Ÿ | short-term and long-term disability; and |
| Ÿ | a 401(k) plan with matching contributions (matching contributions for fiscal year 2009 were, and for fiscal year 2010 will be, based upon the Company’s financial performance and subject to continued employment). |
Moreover, our named executive officers may be eligible for other benefits and perquisites based upon individual circumstances. In this regard, Mr. Wuerch received a cost of living adjustment, or “COLA,” in 2009, as he has received in previous years, as a result of his moving from North Carolina to our headquarters in the State of Washington. Mr. Wuerch was awarded the annual COLA adjustment as part of his negotiated relocation package at the time he moved to Washington in 2008, and will continue to receive the COLA adjustment as long as he resides in the vicinity of Bellevue, Washington. Mr. Wuerch’s COLA adjustment will cease on the earlier of July 25, 2010 or the initial public offering of our common stock. See the section captioned “—Employment Agreements” for a further description of Mr. Wuerch’s COLA. In addition, Mr. Smith received relocation assistance in connection with his move to the Bellevue, Washington area, whereby he was reimbursed on a grossed-up basis for the movement of his household goods and other relocation expenses. Mr. Smith’s relocation package was negotiated as part of his offer of employment. See the section captioned “—Employment Agreements” for a further description of Mr. Smith’s relocation package.
We believe these benefits are generally consistent with those offered by other companies and specifically with those companies with which we compete for employees. Our named executive officers will be eligible for those benefits typically available to all of our employees and shall be subject to the terms and conditions of the governing plans. Our Compensation Committee retains the right to amend or terminate such plans.
Employment Agreements and Severance and Change of Control Benefits
We believe that a strong, experienced management team is essential to the best interests of the Company and our stockholders. We recognize that the possibility of a change of control could arise and that such a possibility could result in the departure or distraction of members of the management team to the detriment of our Company and our stockholders. We have entered into employment agreements or offer letters with our named executive officers, which provide for the payment of a sale bonus based upon the price of the transaction to assist in maximizing the sale price and further minimizing employment security concerns arising in the course of negotiating and completing a significant transaction. By contrast to the other named executive officers, for our Chief Executive Officer, if he is terminated by the Company without cause or he resigns for good reason in connection with a change of control, he will be eligible to receive two times the sum of his base salary and the average of his annual bonuses for the three-year period preceding his termination and accelerated vesting of 50% of specified equity awards; these benefits are quantified in the section captioned “—Employment Agreements.”
The named executive officers are also entitled to between nine and 12 months of severance in the event their employment is terminated by the Company without cause or the named executive officer resigns for good reason not in connection with a change in control. The amount of a named executive officer’s severance is based on the executive’s role and responsibilities with the Company, where our Chief Executive Officer and General Counsel each receive 12 months of continued base salary payments and the other named executive officers each receive nine months of continued base salary payments. Mr. Wuerch is also entitled to accelerated vesting of 50% of specified equity awards and a prorated bonus as part of his severance.
117
Table of Contents
Tax and Accounting Considerations
Section 162(m) of the Code (as interpreted by IRS Notice 2007-49) denies a federal income tax deduction for certain compensation in excess of $1 million per year paid to the Chief Executive Officer and the three other most highly paid executive officers (other than a company’s Chief Executive Officer and the Chief Financial Officer) of a publicly-traded corporation. Certain types of compensation, including compensation based on performance criteria that are approved in advance by stockholders, are excluded from the deduction limit. In addition, “grandfather” provisions may apply to certain compensation arrangements that were entered into the corporation before it was publicly held. The Compensation Committee’s policy will be to qualify compensation paid to executive officers for deductibility for federal income tax purposes to the extent feasible. However, to retain highly skilled executives and remain competitive with other employers, the Compensation Committee will have the right to authorize compensation that would not otherwise be deductible under Section 162(m) or otherwise when it considers it in our best interests to do so.
The Compensation Committee considers the manner in which Section 409A of the Code affects deferred compensation opportunities that we offer to our employees. Section 409A requires, among other things, that “non-qualified deferred compensation” be structured in a way that limits employees’ ability to accelerate or further defer certain kinds of deferred compensation. We intend to operate our existing compensation arrangements that are covered by Section 409A in accordance with the applicable rules thereunder, and we will continue to review and amend our compensation arrangements to comply with Section 409A to the extent deemed necessary by the Compensation Committee.
The Compensation Committee does not believe that tax gross-ups, other than with respect to relocation expenses and other similar perquisites which necessitate a gross-up in order to make the executive whole from a tax perspective, paid by companies to their executive officers are in the best interests of stockholders. As a result, the Compensation Committee will not approve any employment agreement or compensation plan that provides our executive officers with a gross-up for federal and or state income taxes that may arise under either Section 409A of the Code or the golden parachute excise tax rules of Section 280G of the Code.
118
Table of Contents
2009 Summary Compensation Table
The following table provides summary information concerning compensation paid or accrued by us to or on behalf of our named executive officers for services provided to us during the year ended, December 31, 2009:
Summary Compensation Table
| Name & Principal Position |
Year | Salary ($) |
Bonus ($) |
Stock Awards ($)(2) |
Option Awards ($) |
Non-Equity Incentive Plan Compensation ($)(3) |
All Other Compensation ($)(4) |
Total ($) | |||||||||
| Ryan K. Wuerch |
2009 | 365,000 | — | — | — | 369,563 | 78,264 | 812,827 | |||||||||
| Chief Executive Officer |
|||||||||||||||||
| Allyn P. Hebner |
2009 | 279,750 | — | 2,025,000 | — | 207,714 | 7,258 | 2,519,722 | |||||||||
| Chief Financial Officer |
|||||||||||||||||
| Richard E. Leigh, Jr. |
2009 | 290,000 | — | — | — | 195,750 | 7,350 | 493,100 | |||||||||
| Senior Vice President, General Counsel & Corporate Secretary |
|||||||||||||||||
| Jim Smith |
2009 | 329,650 | (1) | — | 4,050,000 | — | 244,766 | 91,728 | 4,716,144 | ||||||||
| President & Chief Operating Officer |
|||||||||||||||||
| James Ryan |
2009 | 160,416 | (1) | — | 3,500,000 | — | 108,281 | — | 3,768,697 | ||||||||
| Chief Strategy & Marketing Officer |
|||||||||||||||||
| (1) | Messrs. Smith and Ryan were hired in 2009; their annualized base salaries are $332,000 and $275,000, respectively. |
| (2) | Represents FASB ASC 718 grant date fair value of restricted share awards. See “Management Discussion and Analysis of Financial Condition and Results of Operation—Stock-based Compensation” for a description of how we valued our stock while we were a private company. Restricted share awards are subject to double trigger vesting, where accrued vesting is quarterly over a four-year term, and where a second qualifying event has to trigger the actual vesting of shares. The qualifying event is either a Sale or an Offering, neither of which occurred in 2009. |
| (3) | Based upon our performance in 2009, which resulted in 100% achievement of our revenue target, 145% of our CIP Adjusted EBITDA target (taking into account the adjustment for the international expansion activities), and 140% of our CIP Working Capital target, the CIP bonus factor for each named executive officer equaled 1.35 (the sum of (x) 1.0 multiplied by 0.2 weighting for the revenue target, plus (y) 1.45 multiplied by 0.6 weighting for the CIP Adjusted EBITDA target, plus (z) 1.4 multiplied by 0.2 weighting for the CIP Working Capital target). As a result, the named executive officers’ CIP bonuses were calculated as follows: Mr. Wuerch: $369,563 ($273,750 target multiplied by the 1.35 CIP bonus factor); Mr. Hebner: $207,714 ($153,862 target multiplied by the 1.35 CIP bonus factor); Mr. Leigh: $195,750 ($145,000 target multiplied by the 1.35 CIP bonus factor); Mr. Smith: $244,766 ($181,308 target multiplied by the 1.35 CIP bonus factor); and Mr. Ryan: $108,281 ($80,208 target multiplied by the 1.35 CIP bonus factor). |
| (4) | All Other Compensation in 2009 for our named executive officers consisted of the following: |
| Name |
401(k) Match |
Cost of Living Adjustment ($) |
Relocation Assistance ($) |
|||||
| Ryan K. Wuerch |
5,264 | 73,000 | (a) | — | ||||
| Allyn P. Hebner |
7,258 | — | — | |||||
| Richard E. Leigh, Jr. |
7,350 | — | — | |||||
| Jim Smith |
5,400 | — | 86,328 | (b) | ||||
| James Ryan |
— | — | — |
| (a) | Represents annual COLA payments provided to Mr. Wuerch in connection with his moving from North Carolina to our new corporate headquarters in Bellevue, Washington. Mr. Wuerch will continue to receive COLA as long as he resides in the vicinity of Bellevue, Washington. The COLA will cease on the earlier of July 25, 2010 or the initial public offering of our common stock. |
| (b) | Represents Mr. Smith’s relocation assistance benefits of $41,329 (grossed-up in the amount of $44,999 for applicable taxes). See the section captioned “—Employment Agreements” for a further discussion of Mr. Smith’s relocation benefits. |
119
Table of Contents
2009 Grants of Plan-Based Awards
The following table sets forth certain information with respect to grants of plan-based awards for the year ended December 31, 2009 with respect to our named executive officers.
2009 Grants of Plan-Based Awards
| Name |
Grant Date |
Estimated Future Payouts Under Non-Equity Incentive Plan Awards(1) |
Estimated Future Payouts Under Equity Incentive Plan Awards |
All other Stock Awards |
All other Option Awards: Number of Securities Underlying Options (#) |
Exercise or Base Price of Option Awards (S/Sh) |
Grant Date Fair Value of Stock and Option Awards ($)(3) | ||||||||||||||||
| Threshold ($) |
Target ($) |
Maximum ($) |
Threshold ($) |
Target ($) |
Maximum ($) |
# of Shares of Stock or Units (#)(2) |
|||||||||||||||||
| Ryan K. Wuerch |
— | 191,625 | 273,750 | 410,625 | — | — | — | — | — | — | — | ||||||||||||
| Allyn P. Hebner |
5/7/2009 | 107,703 | 153,862 | (4) | 230,793 | — | — | — | 166,666 | — | — | 2,025,000 | |||||||||||
| Richard E. Leigh, Jr. |
— | 101,500 | 145,000 | 217,500 | — | — | — | — | — | — | — | ||||||||||||
| Jim Smith |
2/5/2009 | 126,916 | 181,308 | 271,962 | — | — | — | 333,333 | — | — | 4,050,000 | ||||||||||||
| James Ryan |
8/6/2009 | 56,146 | 80,208 | 120,312 | — | — | — | 233,333 | — | — | 3,500,000 | ||||||||||||
| (1) | Amounts shown reflect the threshold, target and maximum payout amounts under the CIP. The target payout is equal to a percentage of each named executive officer’s eligible earnings (which generally means wages actually paid during the fiscal year), which for 2009, ranged from 50% to 75% of base salary, depending on the executive’s role and level of responsibility. See the section captioned “—Short-Term Incentives” for a detailed description of the named executive officer’s target CIP bonus opportunities. At threshold performance under the CIP, the named executive officers will receive 70% of their target payout, at target performance under the CIP the named executive officers will receive 100% of their target payout and at maximum performance the named executive officers will receive 150% of their target payout. No amounts are payable with respect to each metric if performance is below threshold and in order for a named executive officer to receive a bonus under the 2009 CIP, the Company’s actual performance must meet the threshold targets for both the revenue and CIP Adjusted EBITDA metrics. |
| (2) | Restricted share awards are subject to double trigger vesting, where accrued vesting is quarterly over a four-year term, and where a second qualifying event has to trigger the actual vesting of shares. The qualifying event is either a Sale or an Offering, neither of which occurred in 2009. |
| (3) | Represents FASB ASC 718 grant date fair value. See “Management Discussion and Analysis of Financial Condition and Results of Operation—Stock-based compensation” for a description of how we valued our stock while we were a private company. |
| (4) | Represents Mr. Hebner’s eligible earnings as if he were eligible for all of 2009. |
120
Table of Contents
Outstanding Equity Awards at 2009 Fiscal Year End
The following table sets forth certain information with respect to outstanding equity awards of our named executive officers as of December 31, 2009 with respect to the named executive officer. The market value of the shares in the following table is the fair value of such shares at December 31, 2009.
Outstanding Equity Awards at 2009 Fiscal Year End
| Name |
Number of Securities Underlying Unexercised Options (#) Exercisable |
Number of Securities Underlying Unexercised Options (#) Unexercisable |
Equity Incentive Plan Awards: Number of Securities Underlying Unexercised Unearned Options (#) |
Option Exercise Price ($)(2) |
Option Expiration Date |
Number of shares or Units of Stock that Have Not Vested (#) |
Market Value of Shares or Units of Stock that Have not Vested ($)(6) |
Equity Incentive Plan Awards: Number of Unearned Shares, Units or Other Rights that have Not Vested |
Equity Incentive Plan Awards: Market or Payout Value of Unearned Shares or Other Rights that Have Not Vested ($) | |||||||||||
| Ryan K. Wuerch |
8,333 | 24,377 | (1) | — | 12.00 | 1/1/2018 | — | — | — | — | ||||||||||
| Ryan K. Wuerch |
169,025 | 168,403 | (1) | — | 12.00 | 1/1/2018 | — | — | — | — | ||||||||||
| Ryan K. Wuerch |
— | — | — | — | — | 275,518 | (3) | 5,413,939 | — | — | ||||||||||
| Ryan K. Wuerch |
— | — | — | — | — | 94,621 | (4) | 1,859,302 | — | — | ||||||||||
| Ryan K. Wuerch |
— | — | — | — | — | 24,509 | (5) | 481,611 | — | — | ||||||||||
| Allyn P. Hebner |
— | — | — | — | — | 166,666 | (3) | 3,275,000 | — | — | ||||||||||
| Richard E. Leigh, Jr. |
— | — | — | — | — | 133,333 | (3) | 2,620,000 | — | — | ||||||||||
| Jim Smith |
— | — | — | — | — | 333,333 | (3) | 6,550,000 | — | — | ||||||||||
| James Ryan |
— | — | — | — | — | 233,333 | (3) | 4,585,000 | — | — |
| (1) | The options vest over a four year period with 25% vesting on the first anniversary of the date of grant and the remaining portion of the option vesting in pro-rata equal monthly installments over the remaining three year period. |
| (2) | Represents grant date fair value per share. See “Management Discussion and Analysis of Financial Condition and Results of Operation—Stock-based compensation” for a description of how we valued our stock while we were a private company. |
| (3) | Restricted stock awards are subject to double trigger vesting, where accrued vesting is quarterly over a four-year term, and where a second qualifying event has to trigger the actual vesting of shares. The qualifying event is either a Sale or an Offering, neither of which occurred in 2009. |
| (4) | Mr. Wuerch’s 94,621 shares of restricted stock are subject to double trigger vesting, where the accrued vesting is quarterly over a three-year term, and where a second qualifying event has to trigger the actual vesting of shares. The qualifying event is either a Sale or an Offering, neither of which occurred in 2009. |
| (5) | The restricted stock granted to Mr. Wuerch on September 29, 2004 vests in six pro-rata equal installments on each April 30 of 2005 through 2010, respectively. |
| (6) | Represents the product of multiplying the number of unvested restricted shares by the value of our common stock of $19.65 as of December 31, 2009, the last day of our fiscal year. See “Management Discussion and Analysis of Financial Condition and Results of Operation—Stock-based compensation” for a description of how we valued our stock while we were a private company. |
121
Table of Contents
Options Exercised and Stock Vested
The following table sets forth certain information with respect to the vesting or exercise of stock options during the fiscal year ended December 31, 2009 with respect to our named executive officers.
| Option Awards | Stock Awards | |||||||||
| Name |
Number of Shares Acquired on Exercise (#) |
Value Realized on Exercise ($)(1) |
Number of Shares Acquired on Vesting (#) |
Value Realized on Vesting ($) |
||||||
| Ryan K. Wuerch |
45,588 | 540,225 | 24,509 | (2) | 297,790 | (3) | ||||
| Allyn P. Hebner |
— | — | — | — | ||||||
| Richard E. Leigh, Jr. |
— | — | — | — | ||||||
| Jim Smith |
— | — | — | — | ||||||
| James Ryan |
— | — | — | — | ||||||
| (1) | Represents the value of the Company’s common stock on the date of exercise ($12.15 per share) less the option exercise price ($0.30 per share) multiplied by the number of shares for which the option was exercised. See “Management Discussion and Analysis of Financial Condition and Results of Operation—Stock-based compensation” for a description of how we valued our stock while we were a private company. |
| (2) | Represents vesting of one-sixth of the restricted stock granted to Mr. Wuerch on September 29, 2004. |
| (3) | Represents the product of multiplying the number of shares of restricted stock that vested by the value of our common stock of $12.15 per share on the date of vesting (April 30, 2009). |
Pension Benefits & Nonqualified Deferred Compensation
We sponsor a 401(k) plan, which is a qualified retirement plan offered to all eligible employees, including our named executive officers, that permits eligible employees to elect to defer a portion of their compensation on a pre-tax basis. The Compensation Committee may in its sole discretion determine to approve a performance-based matching contribution, subject to the Company’s achievement of certain financial metrics. For fiscal year 2009, Messrs. Wuerch, Hebner, Leigh and Smith received matching contributions equal to $5,264, $7,258, $7,350 and $5,400, respectively. We do not provide and do not intend to provide any non-qualified deferred compensation or defined benefit pension plans to any of our named executive officers or other employees.
Employment Agreements
Mr. Wuerch has entered into an amended and restated employment agreement with the Company effective January 19, 2010 for an initial 24 month term, which will automatically renew for successive one year periods unless either the Company or Mr. Wuerch provides at least 90 days prior written notice of an intent to terminate the employment agreement earlier. Under the terms of the amended agreement, Mr. Wuerch is entitled to an annual base salary of $375,000; provided that on the effective date of our initial public offering (“initial public offering”), Mr. Wuerch’s annual base salary will increase to $450,000. Mr. Wuerch will also receive “Temporary Adjustment” payments (which represent a COLA adjustment agreed upon in 2008 in connection with his relocation from North Carolina to the state of Washington) equal to 20% of his base salary, payable on the 15th and the last day of each month until either (i) the effective date of an initial public offering or (ii) July 25, 2010, whichever occurs first. The Temporary Adjustment payments are not included in the definition of base salary for the purpose of any incentive, bonus, severance or change of control payments. Mr. Wuerch is a current participant in the 2009 CIP with a target earnings opportunity of 75% of his annual base salary. He will continue to be an eligible participant in the 2010 CIP, whereby his target earnings opportunity will continue to be 75% of his annual base salary until an initial public offering of the Company’s common stock. At that time, Mr. Wuerch’s incentive opportunity under the CIP will increase to 100% of his annual base salary, prorated based upon the date of the initial public offering. Additionally, in the event a “company sale” (as defined in his employment agreement) occurs prior to
122
Table of Contents
the earlier of an initial public offering and July 25, 2010, in which the “aggregate value” (as defined in the agreement) is (i) $300,000,000 or less, Mr. Wuerch will receive a lump sum payment equal to $2,000,000 (less the applicable percentage if less than 100% of the Company’s equity is sold), or (ii) greater than $300,000,000, Mr. Wuerch will receive a lump sum payment equal to 1% times the aggregate value of the company sale (less the applicable percentage if less than 100% of the Company’s equity is sold ), in any case such lump sum to be reduced by the aggregate “equity proceeds” (as defined in the agreement); provided, that Mr. Wuerch must remain employed by the Company at the time of the company sale or have been terminated without “cause” or have resigned for “good reason” (each as defined in the agreement) within four months prior to such company sale. In accordance with the terms of his employment agreement, on March 26, 2010, our Compensation Committee approved the grant to Mr. Wuerch under the terms of our 2010 LTIP of options to purchase 333,333 shares of our common stock at $20.40 per share to vest in pro-rata equal installments on each of the first four anniversaries of the effective date of the initial public offering, provided that the initial public offering occurs prior to July 31, 2010, Mr. Wuerch remains an employee in good standing on the applicable vesting dates and the employment agreement has not been previously terminated. With respect to such option, 50% of the outstanding unvested portion of the option will immediately vest and become exercisable in the event Mr. Wuerch is terminated by the Company without cause, other than due to death or disability, or Mr. Wuerch resigns for good reason, as such terms are defined in his employment agreement. Under the terms of his employment agreement, in the event Mr. Wuerch is terminated by the Company without cause or he resigns for good reason, as defined in his employment agreement, contingent upon his execution of a release and waiver of claims in favor of the Company, he will receive (i) 12 months of continued base salary payments, (ii) a pro-rated amount of his annual bonus based on actual performance for the year in which his employment terminated, payable in a lump sum at the time the Company pays such bonuses under the CIP and (iii) accelerated vesting of 50% of all outstanding and unvested options issued in connection with the employment agreement. In the event Mr. Wuerch is terminated by the Company without cause or he resigns for good reason in connection with a change of control (as defined in his employment agreement), contingent upon his execution of a release and waiver of claims in favor of the Company, Mr. Wuerch will receive (i) an amount equal to two times the sum of (x) his base salary and (y) the average actual annual bonuses received by him over the three-year period prior to the date of his termination, payable in installments over the 12-month period following his termination of employment and (ii) accelerated vesting of 50% of all outstanding and unvested options issued in connection with the employment agreement. The employment agreement specifies that during his employment with us and for 12 months thereafter, Mr. Wuerch will not engage in specified competitive activities and for two years following his termination, he agrees not to solicit our customers or interfere with our business. Mr. Wuerch’s agreement states that he is subject to the terms and conditions of our non-disclosure agreement.
Mr. Hebner served as interim Chief Financial Officer effective August 4, 2008 and was subsequently offered the position of permanent Chief Financial Officer. While serving as our interim Chief Financial Officer during fiscal year 2009, Mr. Hebner’s annualized compensation was equal to $294,000. Upon the commencement of his service as our permanent Chief Financial Officer on March 6, 2009, Mr. Hebner signed an offer letter which adjusted his annual salary to equal $275,000 to be payable in equal installments on the 15th and the last day of each month. Under the terms of the offer letter, Mr. Hebner is currently entitled to participate in our CIP with a prorated target earnings opportunity of 55% of his annual base salary for 2009. Mr. Hebner may be eligible to receive a bonus under the terms of the CIP for 2009, should he be an active employee on the date bonuses are paid in 2010. Mr. Hebner may also be eligible to participate in our equity incentive plans and is currently provided medical, health and dental insurance coverage for himself and his dependents. Upon commencement of employment, Mr. Hebner received a restricted stock award of 166,666 shares under the 2004 Motricity, Inc. Stock Plan. Mr. Hebner’s offer letter states he will be eligible for a “Sale Completion” bonus, should the Company be sold during the term of his employment. Additionally, Mr. Hebner’s agreement states that he is subject to the terms and conditions of our non-disclosure
123
Table of Contents
agreement, and that he will not serve as a member of another board without prior approval from the Chief Executive Officer. The offer letter specifies that Mr. Hebner’s employment is “at will” and can be terminated without cause or notice at anytime, but also provides that Mr. Hebner will be entitled to severance pay if, as defined in the offer letter, he is terminated without cause or resigns for good reason. Specifically, contingent upon his execution of a release and waiver of claims in favor of the Company, Mr. Hebner will receive his monthly base salary in effect at the time of termination for a period of nine months. The offer letter specifies that, during his employment with us and for nine months thereafter, Mr. Hebner will not engage in specified competitive activities and for two years following his termination solicit our customers or interfere with our business. Mr. Hebner’s offer letter was amended on May 19, 2010 in connection with the Company’s stock becoming publicly traded for purposes of Section 409A of the Code.
Mr. Leigh’s offer letter was signed and accepted on August 12, 2008. The offer letter states that Mr. Leigh is entitled to an annual salary of $290,000 payable in equal installments on the 15th and the last day of each month. Under the terms of the offer letter, Mr. Leigh is currently entitled to participate in our CIP with a target earnings opportunity of 50% of his annual base salary for 2009. Mr. Leigh may be eligible to receive a bonus under the terms of the CIP for 2009, should he be an active employee on the date bonuses are paid in 2010. Mr. Leigh may also be eligible to participate in our equity incentive plans and is currently provided medical, health and dental insurance coverage for himself and his dependents. Upon commencement of employment, Mr. Leigh received a restricted stock award of 133,333 shares under the 2004 Motricity, Inc. Stock Plan. Mr. Leigh’s agreement states he will be eligible for a “Sale Completion” bonus, should the Company be sold during the term of his employment. The offer letter specifies that Mr. Leigh’s employment is “at will” and can be terminated without cause or notice at any time, but also provides that Mr. Leigh will be entitled to severance pay and health insurance benefits if, as defined in the offer letter, he is terminated without cause or resigns for good reason. Specifically, contingent upon his execution of a release and waiver of claims in favor of the Company, Mr. Leigh will receive his monthly base salary in effect at the time of termination, along with continued health coverage, for a period of 12 months. Mr. Leigh’s offer letter states that he is subject to the terms and conditions of our non-disclosure agreement. Mr. Leigh’s offer letter was amended on May 19, 2010 in connection with the Company’s stock becoming publicly traded for purposes of Section 409A of the Code.
Mr. Smith’s offer letter was signed and accepted as of January 8, 2009. Per the terms of his offer letter, Mr. Smith was required to permanently relocate to the Bellevue area by August 31, 2009. In conjunction with his relocation and as provided in his offer letter, Mr. Smith participated in our relocation program, whereby he received compensation for movement of household goods from his then current domicile to the Bellevue area. The offer letter states that Mr. Smith is entitled to an annual salary of $332,000 payable in equal installments on the 15th and the last day of each month. Under the terms of the offer letter, Mr. Smith is currently entitled to participate in our CIP with a prorated target earnings opportunity of 55% of his annual base salary for 2009. Mr. Smith may be eligible to receive a bonus under the terms of the CIP for 2009, should he be an active employee on the date bonuses are paid in 2010. Mr. Smith may also be eligible to participate in our equity incentive plans and is currently provided medical, health and dental insurance coverage for himself and his dependents. Based upon satisfaction of the terms of his relocation commitment, Mr. Smith received a restricted stock award of 333,333 shares under the 2004 Motricity, Inc. Stock Plan. He also received a grant of an additional 66,666 shares on February 9, 2010, because he was an active employee in good standing on January 5, 2010, the one-year anniversary of his start date with the Company. Mr. Smith’s agreement states that he will be eligible for a “Sale Completion” bonus, should the Company be sold during the term of his employment. The offer letter specifies that Mr. Smith’s employment is “at will” and can be terminated without cause or notice at any time, but also provides that Mr. Smith will be entitled to severance pay and health insurance benefits if, as defined in the offer letter, he is terminated without cause or resigns for good reason. Specifically, contingent upon his execution of a release and waiver
124
Table of Contents
of claims in favor of the Company, Mr. Smith will receive his monthly base salary in effect at the time of termination, along with continued health coverage, for a period of nine months. The offer letter specifies that, during his employment with us and for nine months thereafter, Mr. Smith will not engage in specified competitive activities or solicit our customers or interfere with our business. Mr. Smith’s offer letter states that he is subject to the terms and conditions of our non-disclosure agreement and that he shall not serve as a member of another board without prior approval from the Chief Executive Officer. Mr. Smith’s offer letter was amended on May 19, 2010 in connection with the Company’s stock becoming publicly traded for purposes of Section 409A of the Code.
Mr. Ryan’s offer letter was signed and accepted on May 23, 2009. The offer letter states that Mr. Ryan is entitled to an annual salary of $275,000 payable in equal installments on the 15th and the last day of each month. Under the terms of the offer letter, Mr. Ryan is currently entitled to participate in our CIP with a prorated target earnings opportunity of 50% of his annualized base salary for 2009. Mr. Ryan may be eligible to receive a bonus under the terms of the CIP for 2009, should he be an active employee on the date bonuses are paid in 2010. Mr. Ryan may also be eligible to participate in our equity incentive plans and is currently provided medical, health and dental insurance coverage for himself and his dependents. Upon commencement of employment, Mr. Ryan received a restricted stock award of 233,333 shares under the 2004 Motricity, Inc. Stock Plan. Mr. Ryan’s offer letter also states that he will be eligible for a “Sale Completion” bonus, should the Company be sold during the term of his employment. The offer letter specifies that Mr. Ryan’s employment is “at will” and can be terminated without cause or notice at any time, but also provides Mr. Ryan will be entitled to severance pay if, as defined in the offer letter, he is terminated without cause or resigns for good reason. Specifically, contingent upon his execution of a release and waiver of claims in favor of the Company, Mr. Ryan will receive his monthly base salary in effect at the time of termination for a period of nine months. The offer letter specifies that, during his employment with us and for nine months thereafter, Mr. Ryan will not engage in specified competitive activities and for two years following his termination of employment he will not solicit our customers or interfere with our business. Mr. Ryan’s offer letter states that he is subject to the terms and conditions of our non-disclosure agreement. Mr. Ryan’s offer letter was amended on May 19, 2010 in connection with the Company’s stock becoming publicly traded for purposes of Section 409A of the Code.
Non-Disclosure Agreements
In addition to the restrictive covenants contained in their offer letters and employment agreements, each of the named executive officers have agreed to comply with our non-disclosure and non-competition agreement (the “Non-Disclosure Agreement”) on the following terms, respectively:
| Name |
Employment Document |
Non-Disclosure Agreement |
Non-Compete | Non-Solicitation Period Length |
Intellectual Property Protection | |||||
| Ryan K. Wuerch |
Employment Agreement |
Yes | 1 Year | 2 Years | 1 Year | |||||
| Allyn P. Hebner |
Offer Letter | Yes | 9 Months | 2 Years | 1 Year | |||||
| Richard E. Leigh, Jr. |
Offer Letter | Yes | N/A | N/A | N/A | |||||
| Jim Smith |
Offer Letter | Yes | 9 Months | 9 Months | 1 Year | |||||
| James Ryan |
Offer Letter | Yes | 9 Months | 2 Years | 1 Year |
Each of the named executive officers also agrees that the remedy of damages for any breach by him of the provisions of either the employment agreement, offer letter or the Non-Disclosure Agreement is inadequate and that we may be entitled to injunctive relief, without posting any bond, and each agrees not to oppose granting of such relief on the grounds that the damages would adequately compensate us.
125
Table of Contents
Potential Payments Upon Termination Without Cause or For Good Reason and without a Change of Control
The following table sets forth quantitative estimates of the benefits that would have accrued to each of our named executive officers if his employment had been terminated without cause or the employee terminates for good reason on December 31, 2009 and a change of control had not occurred on or prior to that date. Amounts below reflect potential payments pursuant to the amended employment agreements and offer letters for such named executive officers. For Mr. Wuerch, the table below assumes that his employment agreement, dated January 19, 2010, was in effect on December 31, 2009.
| Name of Executive Officer |
Cash Severance Benefits ($) |
Continued Health Benefits ($) |
Value of Accelerated Equity Awards ($)(3) |
Total ($) | ||||||
| Ryan K. Wuerch |
656,250 | (1) | n/a | 481,611 | (4) | 1,137,861 | ||||
| Allyn P. Hebner |
206,250 | (2) | n/a | — | 206,250 | |||||
| Richard E. Leigh, Jr. |
290,000 | (2) | 14,255 | — | 304,255 | |||||
| Jim Smith |
249,000 | (2) | 10,691 | — | 259,691 | |||||
| James Ryan |
206,250 | (2) | n/a | — | 206,250 |
| (1) | Represents one times base salary ($375,000) plus a pro rated bonus based upon target performance ($281,250). |
| (2) | Represents severance equal to 12 months of base salary for Mr. Leigh and severance equal to nine months of base salary for each of Messrs. Hebner, Smith and Ryan. See the section captioned “—Employment Agreements” for a description of the severance payable to the named executive officers. |
| (3) | See the section captioned “—Long-Term Equity-Based Compensation” for a description of the effect of a termination without cause or for good reason on the vesting of the restricted shares. No value will accrue on the restricted shares until the second trigger occurs. |
| (4) | Represents the value of the accelerated vesting of all of Mr. Wuerch’s unvested restricted shares granted on September 29, 2004 (24,509 unvested shares) multiplied by the value of our common stock of $19.65 as of December 31, 2009. See footnote 3 above for the vesting of Mr. Wuerch’s other grants of restricted shares in the absence of a change of control. |
Potential Payments Upon Termination Without Cause or for Good Reason in connection with a Change of Control
The following table sets forth quantitative estimates of the benefits that would have accrued to each of our named executive officers if his employment had been terminated without cause or for good reason upon a change of control on December 31, 2009. Amounts below reflect potential payments pursuant to the amended employment agreements and offer letters for such named executive officers. For Mr. Wuerch, the table below assumes that his employment agreement, dated January 19, 2010, was in effect on December 31, 2009.
| Name of Executive Officer |
Cash Severance Benefits ($) |
Continued Health Benefits ($) |
Value of Accelerated Equity Awards ($)(3) |
Total ($) | ||||||
| Ryan K. Wuerch |
2,969,216 | (1) | — | 9,229,629 | (4) | 12,198,845 | ||||
| Allyn P. Hebner |
206,250 | (2) | — | 3,275,000 | (5) | 3,481,250 | ||||
| Richard E. Leigh, Jr. |
290,000 | (2) | 14,255 | 2,620,000 | (5) | 2,924,255 | ||||
| Jim Smith |
249,000 | (2) | 10,691 | 6,550,000 | (5) | 6,809,691 | ||||
| James Ryan |
206,250 | (2) | — | 4,585,000 | (5) | 4,791,250 |
| (1) | Represents change of control termination benefits under Mr. Wuerch’s employment agreement equal to two times the sum of (x) his base salary ($375,000) and (y) the average of his annual |
126
Table of Contents
| bonuses for the three years preceding his termination ($109,608) plus a $2,000,000 company sale bonus described in the section captioned “—Employment Agreements” (assumes a $300 million company sale and company sale is 100% of the Company’s equity). |
| (2) | Represents severance equal to 12 months of base salary for Mr. Leigh and severance equal to nine months of base salary for each of Messrs. Hebner, Smith and Ryan. Assumptions on cash severance benefits include a “Sale Completion” bonus based upon the following tables, utilizing a sale price between $100 million and $300 million for each named executive officer, other than Mr. Wuerch. Since no Sale Completion bonus is payable if the value of a named executive officer’s accelerated vesting of equity and share ownership resulting from the sale is greater than the Sale Completion bonus otherwise payable, Messrs. Hebner, Leigh, Smith and Ryan would not receive a Sale Completion bonus. |
| For |
If Sale of Company is |
Sale Completion Bonus Value | ||
| Allyn P. Hebner Richard E. Leigh, Jr. James Ryan |
Less than $100 million Between $100 million and $300 million Greater than $300 million |
Zero Payout $500,000
0.25% of Sale Price | ||
| For |
If Sale of Company is |
Sale Completion Bonus Value | ||
| Jim Smith |
Less than $100 million Between $100 million and $300 million Greater than $300 million |
Zero Payout $750,000
0.65% of Sale Price | ||
| (3) | For purposes of this chart, a change of control shall be deemed to constitute a Sale under the restricted share agreements. |
| (4) | Represents the sum of (i) $1,474,777, the value of the accelerated vesting of all of Mr. Wuerch’s unvested stock options (192,781 unvested options) where the unvested options have an exercise price of $12.00 per share and the value of our common stock was $19.65 as of December 31, 2009, (ii) $481,611, the value of the accelerated vesting of all of Mr. Wuerch’s unvested restricted shares granted on September 29, 2004 (24,509 unvested shares) multiplied by the value of our common stock of $19.65 as of December 31, 2009 and (iii) $7,273,241, the value of the accelerated vesting of all other of Mr. Wuerch’s unvested restricted shares (370,139 unvested shares) multiplied by the value of our common stock of $19.65 as of December 31, 2009. |
| (5) | If the grantee’s employment with the Company is terminated within 12 months after a change of control transaction occurs (A) by the Company other than for cause or disability, or (B) by the grantee for good reason, all of the then unvested restricted shares shall vest as of the date of the grantee’s termination. See the section captioned “—Long-Term Equity-Based Compensation” above for a more detailed description of the accelerated vesting of restricted shares upon a change of control. Represents the value of the accelerated vesting of all unvested restricted shares outstanding for each of Mr. Hebner (166,666 unvested shares), Mr. Leigh (133,333 unvested shares), Mr. Smith (333,333 unvested shares), and Mr. Ryan (233,333 unvested shares) based upon the value of our common stock of $19.65 as of December 31, 2009. |
127
Table of Contents
Potential Payments Upon Termination for Disability at the time of a Change of Control
| Cash |
Continued |
Value of Accelerated |
Total ($) | |||||||
| Ryan K. Wuerch(1) |
2,000,000 | (2) | — | 6,091,484 | (5) | 8,091,484 | ||||
| Allyn P. Hebner |
— | (3) | — | 1,944,531 | (6) | 1,944,531 | ||||
| Richard E. Leigh, Jr. |
— | (3) | — | 1,719,375 | (6) | 1,719,375 | ||||
| Jim Smith |
— | (3) | — | 4,093,750 | (6) | 4,093,750 | ||||
| James Ryan |
— | (3) | — | 2,579,063 | (6) | 2,579,063 |
| (1) | Assumes that Mr. Wuerch’s employment agreement, dated January 19, 2010, was in effect on December 31, 2009. |
| (2) | Represents a $2,000,000 company sale bonus described in the section captioned “—Employment Agreements” (assumes a $300 million company sale and company sale is 100% of the Company’s equity). |
| (3) | Since no Sale Completion bonus is payable if the value of a named executive officer’s accelerated vesting of equity and share ownership resulting from the sale is greater than the Sale Completion bonus otherwise payable, Messrs. Hebner, Leigh, Smith and Ryan would not receive a Sale Completion bonus. |
| (4) | For purposes of this chart, a change of control shall be deemed to constitute a Sale under the restricted share agreements. |
| (5) | Represents the sum of (i) $4,060,454 (accelerated vesting of the four-year vesting restricted stock award granted on January 8, 2008 of 206,638 shares (or (x) 1/2 plus eight quarters of vesting/32 multiplied by (y) the total number of unvested restricted shares (275,518))), plus (ii) $1,549,419 (accelerated vesting of the three-year vesting restricted stock award granted on January 8, 2008 of 78,850 shares (or (x) 1/2 plus eight quarters of vesting/24 multiplied by (y) the total number of unvested restricted shares (94,621))), plus (iii) $481,611, the value of the accelerated vesting of Mr. Wuerch’s unvested restricted shares granted on September 29, 2004 (24,509 shares), in each case, based upon the value of our common stock of $19.65 as of December 31, 2009. |
| (6) | If the grantee’s employment with the Company is terminated for Disability upon a change of control transaction, 1/2 of the total restricted shares plus 1/32 of the total restricted shares times the number of calendar quarters vest. See the section captioned “—Long-Term Equity-Based Compensation” above for a more detailed description of the accelerated vesting of restricted shares upon a change of control. Represents the value of the accelerated vesting of the unvested restricted shares in accordance with the foregoing formula for each of Mr. Hebner (accelerated vesting of 98,958 unvested shares (or (x) 1/2 plus three quarters of vesting/32 multiplied by (y) the total number of unvested restricted shares (166,666))), Mr. Leigh (accelerated vesting of 87,500 unvested shares (or (x) 1/2 plus five quarters of vesting/32 multiplied by (y) the total number of unvested restricted shares (133,333))), Mr. Smith (accelerated vesting of 208,333 unvested restricted shares (or (x) 1/2 plus four quarters of vesting/32 multiplied by (y) the total number of unvested restricted shares (333,333))), and Mr. Ryan (accelerated vesting of 131,250 unvested restricted shares (or (x) 1/2 plus two quarters of vesting/32 multiplied by (y) the total number of unvested restricted shares (233,333))), in each case based upon the value of our common stock of $19.65 as of December 31, 2009. |
The named executive officers do not receive additional benefits upon a termination due to death (with or without a change of control) or upon a termination due to disability absent a change of control.
128
Table of Contents
Change of Control with Continued Employment
The following table sets forth the quantitative estimates of the benefits to be received by each named executive officer, if a change of control had occurred on December 31, 2009 and each named executive officer continued his employment with the Company. For Mr. Wuerch, the table below assumes that his employment agreement, dated January 19, 2010, was in effect on December 31, 2009.
| Name of Executive Officer |
Cash Benefit ($) Sale Bonus (1) |
Value of Accelerated |
Total ($) | ||||
| Ryan K. Wuerch |
2,000,000 | (2) | 6,091,484(5) | 8,091,484 | |||
| Allyn P. Hebner |
— | (3) | 1,944,431(6) | 1,944,431 | |||
| Richard E. Leigh, Jr. |
— | (3) | 1,719,375(6) | 1,719,375 | |||
| Jim Smith |
— | (3) | 4,093,750(6) | 4,093,750 | |||
| James Ryan |
— | (3) | 2,579,063(6) | 2,579,063 |
| (1) | Assumes that the Sale of the Company would be between $100 million and $300 million. |
| (2) | Represents the $2,000,000 company sale bonus described in the section captioned “—Employment Agreements” (assumes a $300 million company sale and company sale is 100% of the Company’s equity). |
| (3) | Since no Sale Completion bonus is payable if the value of a named executive officer’s accelerated vesting of equity and share ownership resulting from the sale is greater than the Sale Completion bonus otherwise payable, Messrs. Hebner, Leigh, Smith and Ryan would not receive a Sale Completion bonus. |
| (4) | For purposes of this chart, a change of control shall be deemed to constitute a Sale under the restricted share agreements. |
| (5) | Represents the sum of (i) $4,060,454 (accelerated vesting of the four-year vesting restricted stock award granted on January 8, 2008 of 206,638 shares (or (x) 1/2 plus eight quarters of vesting/32 multiplied by (y) the total number of unvested restricted shares (275,518))), plus (ii) $1,549,419 (accelerated vesting of the three-year vesting restricted stock award granted on January 8, 2008 of 78,850 shares (or (x) 1/2 plus eight quarters of vesting/24 multiplied by (y) the total number of unvested restricted shares (94,621))), plus (iii) $481,611, the value of the accelerated vesting of Mr. Wuerch’s unvested restricted shares granted on September 29, 2004 (24,509 shares), in each case, based upon the value of our common stock of $1.31 as of December 31, 2009. |
| (6) | If a change of control occurs and the grantee continues employment with the Company, 1/2 of the total restricted shares plus 1/32 of the total restricted shares multiplied by the number of calendar quarters vest. See the section captioned “—Long-Term Equity-Based Compensation” above for a more detailed description of the accelerated vesting of restricted shares upon a change of control. Represents the value of the accelerated vesting of the unvested restricted shares in accordance with the foregoing formula for each of Mr. Hebner (accelerated vesting of 98,958 unvested shares (or (x) 1/2 plus three quarters of vesting/32 multiplied by (y) the total number of unvested restricted shares (166,666)), Mr. Leigh (accelerated vesting of 87,500 unvested shares (or (x) 1/2 plus five quarters of vesting/32 multiplied by (y) the total number of unvested restricted shares (133,333))), Mr. Smith (accelerated vesting of 208,333 unvested restricted shares (or (x) 1/2 plus four quarters of vesting/32 multiplied by (y) the total number of unvested restricted shares (333,333))), and Mr. Ryan (accelerated vesting of 131,250 unvested restricted shares (or (x) 1/2 plus two quarters of vesting/32 multiplied by (y) the total number of unvested restricted shares (233,333))), in each case based upon the value of our common stock of $19.65 as of December 31, 2009. |
129
Table of Contents
Director Compensation
To date, we have provided cash compensation to non-employee directors (other than directors receiving compensation from and appointed by our principal stockholders, including entities beneficially owned by Carl C. Icahn and funds affiliated with New Enterprises Associates, Inc. and Technology Crossover Ventures) for their services as directors or members of committees of the board of directors. We have reimbursed and will continue to reimburse such non-employee directors for their reasonable expenses incurred in attending meetings of our board of directors and committees of the board of directors.
In accordance with our Compensation Committee Charter, our Compensation Committee has adopted a compensation program for such non-employee directors, or the “Non-Employee Director Compensation Policy.” Pursuant to the Non-Employee Director Compensation Policy for fiscal year 2009 and earlier, each member of our board of directors who was not our employee and had not received compensation from, and had not been appointed by, one of our principal stockholders, generally received the following cash compensation for board services, as applicable:
| Ÿ | $30,000 per year for service as a Board member, paid in equal quarterly installments; |
| Ÿ | $1,000 meeting fee for formal board meetings; |
| Ÿ | $12,500 per year for service as chairperson of the Audit Committee and $7,500 per year for service as chairperson of the Compensation Committee or the Nominating & Corporate Governance Committee; and |
| Ÿ | a one time grant of 166,666 stock options upon joining the board to vest 25% on the first anniversary of the date of grant with the remaining portion vesting in pro-rata equal monthly installments over the following three-year period. |
As of December 22, 2009, the Compensation Committee had approved and recommended to the board of directors, which subsequently approved, board compensation effective for 2010 which provided, among other things, for a grant of 8,000 shares of restricted stock, to vest in three equal installments, upon a director’s initial election to the board of directors. Upon commencement of their service to the board of directors, each of Mr. Turner and Ms. Judge received a grant of 8,000 shares of restricted stock, to vest in equal installments over three years.
On April 4, 2010, the Compensation Committee approved changes and recommended to the board of directors, which subsequently approved, in board compensation effective for 2010 that are deemed to be competitive with the market for non-employee director’s compensation. Such non-employee board members shall receive the following cash compensation: $30,000 annually; the chairperson of the board will receive an additional fee earned of $20,000; the chairperson of each of the Audit Committee and Compensation Committee will receive an additional $15,000 and the chairperson of the Nominating & Corporate Governance Committee will receive an additional $10,000. Members of any committee, excluding the chair position, will receive an additional $5,000. In addition, the Compensation Committee approved and recommended to the board of directors, which subsequently approved, the granting of restricted stock equal in value to $140,000 to each non-employee director as part of their annual compensation. The Compensation Committee approved and recommended to the board of directors, which subsequently approved, the increase of the restricted stock award from $120,000 to $140,000 in value to compensate the non-employee directors for the additional responsibilities associated with the Company’s stock becoming publicly traded. The non-employee director compensation policy also provides that non-employee directors must own shares of the Company equal to four times their cash retainer within five years of joining our board of directors. Subsequent annual grants of equity to such non-employee members of the board, if any, will be made on May 1 of each year in conjunction with the annual meeting of the Company’s stockholders. In accordance with our non-employee director compensation policy, on May 18, 2010, the Compensation
130
Table of Contents
Committee recommended that the board of directors approve a restricted stock grant equal in value to $140,000 to Mr. Bowden in consideration of his election to the board of directors, and a restricted stock grant equal in value to $140,000 to each of Mr. Turner and Lady Judge, respectively, in consideration of their service to the Company, with the number of shares to be granted based on the initial public offering price per share of our common stock or, in the event that the offering does not occur on or prior to July 1, 2010, the fair market value of our common stock on July 1, 2010. Such restricted stock awards will vest on the first anniversary of their grant date, subject to accelerated vesting in the event of a “change in control” (as such term is defined in the 2010 LTIP).
Below is a summary table of what our 2009 non-employee board members (other than directors receiving compensation from and appointed by our principal stockholders) have received through December 31, 2009.
| Name(1) |
Fees Earned or Paid in Cash ($) |
Stock Awards ($) |
Option Awards ($)(2) |
Non-Equity Incentive Plan Compensation ($) |
All Other Compensation ($) |
Total ($) | |||||||
| Raymond L. Lawless |
43,973 | — | 102,650 | (3) | — | — | 146,623 | ||||||
| David Limp |
34,692 | — | — | — | — | 34,692 | |||||||
| Rick White |
30,212 | — | — | — | — | 30,212 | |||||||
| Jonathan Miller |
32,429 | — | — | — | — | 32,429 | |||||||
| Sohail Qadri |
4,505 | — | — | — | — | 4,505 | |||||||
| Brian Turner |
3,310 | — | — | — | — | 3,310 |
| (1) | Individuals who served as directors during 2009 but who did not receive compensation for their service on the board include: Suzanne King, Hunter Gary, Keith Daubenspeck, Carl Icahn and Ryan Wuerch. |
| (2) | Represents FASB ASC 718 grant date fair value. |
| (3) | Mr. Lawless’s option awards granted in 2009 began vesting on August 7, 2008 and vest over a four-year period with 25% vesting on the first anniversary of August 7, 2008 and the remaining portion of the option vesting in pro-rata equal monthly installments over the remaining three-year period. Mr. Lawless’s options were granted with a vesting commencement date of August 7, 2008 because the Compensation Committee originally approved the option grant in August 2008, but did not formally grant the options to Mr. Lawless until February 5, 2009. As a result of the delayed timing of the grant, the Compensation Committee determined that it was appropriate for the grant to commence vesting from the time when it was initially approved. |
Following the completion of this offering, all of our directors will be eligible to participate in our 2010 LTIP and their compensatory equity grants will be granted under, and subject to the terms of, the 2010 LTIP.
Limitation of Liability and Indemnification Matters
We have entered into separate indemnification agreements with our directors and executive officers, in addition to indemnification provided for in our certificate of incorporation and bylaws. These agreements, among other things, provide for indemnification of our directors and executive officers for expenses, judgments, fines and settlement amounts incurred by this person in any action or proceeding arising out of this person’s services as a director or executive officer or at our request. We believe that these provisions and agreements are necessary to attract and retain qualified persons as directors and executive officers. See the section captioned “Description of Capital Stock—Limitation of Liability and Indemnification” for more information.
131
Table of Contents
PRINCIPAL AND SELLING STOCKHOLDERS
The following table sets forth, as of May 31, 2010, information concerning the beneficial ownership of our common stock prior to the offering and after giving effect to this offering by:
| Ÿ | each stockholder, or group of affiliated stockholders, of more than 5% of our common stock; |
| Ÿ | each of our executive officers; |
| Ÿ | each of our directors; |
| Ÿ | all of our directors and executive officers as a group; and |
| Ÿ | each selling stockholder. |
Beneficial ownership is determined in accordance with the rules of the SEC and thus represents voting or investment power with respect to our securities. Unless otherwise indicated below, to our knowledge, the persons and entities named in the table have sole voting and sole investment power with respect to all shares beneficially owned, subject to applicable community property laws. Shares of our common stock subject to options or warrants that are currently exercisable or exercisable within 60 days of May 31, 2010 are deemed to be outstanding and to be beneficially owned by the person holding the options or warrants for the purpose of computing the percentage ownership of that person but are not treated as outstanding for the purpose of computing the percentage ownership of any other person.
Beneficial ownership prior to the offering is based upon 31,823,177 shares of common stock outstanding as of May 31, 2010 and assumes the conversion of all of our outstanding redeemable preferred stock and preferred stock, other than Series H, into 24,111,368 shares of common stock effective upon the completion of this offering, as if the conversion occurred on May 31, 2010. At the completion of this offering, 21,084,337 shares of Series H preferred stock will remain outstanding, substantially all of which are held by entities affiliated with Carl C. Icahn. Approximately 2,188,748 shares of common stock are issuable upon the conversion of our Series H preferred stock as of May 31, 2010. Beneficial ownership after this offering is based on 38,573,177 shares of common stock that will be outstanding at the completion of this offering. We have granted the underwriters an option to purchase up to an additional 1,012,500 shares from the selling stockholders in this offering. Unless otherwise noted, the address of each stockholder is c/o of Motricity, Inc., 601 108th Avenue Northeast, Suite 800, Bellevue, Washington 98004.
| Shares Beneficially Owned Prior to This Offering(1) |
Percent | Shares Beneficially Owned After This Offering |
|||||||||||||
| Name of Beneficial Owner |
Assuming Underwriters’ Option is Not Exercised |
Percent | Assuming Underwriters’ Option is Exercised in Full |
Percent | |||||||||||
| 5% Stockholders: |
|||||||||||||||
| Funds affiliated with Advanced Equities, Inc.(2) |
9,439,226 | 28.6 | % | 9,439,226 | 23.7 | % | 9,439,226 | 23.7 | % | ||||||
| Entities affiliated with Carl C. Icahn(3) |
4,529,888 | 13.8 | % | 4,529,888 | 11.4 | % | 4,016,310 | 10.1 | % | ||||||
| Funds affiliated with Technology Crossover Ventures(4) |
3,222,114 | 10.1 | % | 3,222,114 | 8.4 | % | 3,047,796 | 7.9 | % | ||||||
| Funds affiliated with New Enterprise Associates Inc.(5) |
3,143,939 | 9.8 | % | 3,143,939 | 8.1 | % | 3,143,939 | 8.1 | % | ||||||
| Executive Officers and Directors: |
|||||||||||||||
| Ryan K. Wuerch(6) |
1,543,191 | 4.8 | % | 1,543,191 | 4.0 | % | 1,434,852 | 3.7 | % | ||||||
| Jim Smith(7) |
400,000 | 1.3 | % | 400,000 | 1.0 | % | 400,000 | 1.0 | % | ||||||
| Chris Dorr(8) |
10,000 | * | 10,000 | * | 10,000 | * | |||||||||
| Allyn P. Hebner(9) |
166,666 | * | 166,666 | * | 166,666 | * | |||||||||
| Richard E. Leigh, Jr.(10) |
133,333 | * | 133,333 | * | 133,333 | * | |||||||||
| James Ryan(11) |
233,333 | * | 233,333 | * | 233,333 | * | |||||||||
| Jeffrey A. Bowden |
— | — | — | — | — | — | |||||||||
132
Table of Contents
| Shares Beneficially Owned Prior to This Offering(1) |
Percent | Shares Beneficially Owned After This Offering |
|||||||||||||
| Name of Beneficial Owner |
Assuming Underwriters’ Option is Not Exercised |
Percent | Assuming Underwriters’ Option is Exercised in Full |
Percent | |||||||||||
| Hunter C. Gary |
— | — | — | — | — | — | |||||||||
| Brett C. Icahn(12) |
206 | * | 206 | * | 206 | * | |||||||||
| Lady Barbara Judge(13) |
8,000 | * | 8,000 | * | 8,000 | * | |||||||||
| Suzanne H. King |
— | — | — | — | — | — | |||||||||
| Brian Turner(14) |
8,000 | * | 8,000 | * | 8,000 | * | |||||||||
| All directors and executive officers as a group (12 persons)(15) |
2,502,729 | 7.8 | % | 2,502,729 | 6.4 | % | 2,394,390 | 6.2 | % | ||||||
| Other Selling Stockholders: |
|||||||||||||||
| Massey Burch Venture Funds, L.P.(16) |
822,126 | 2.6 | % | 822,126 | 2.1 | % | 804,498 | 2.1 | % | ||||||
| Entities affiliated with Noro-Moseley Partners (17) |
579,355 | 1.8 | % | 579,355 | 1.5 | % | 533,994 | 1.4 | % | ||||||
| Tri-State Investment Group III and IV(18) |
406,134 | 1.3 | % | 406,134 | 1.1 | % | 373,953 | * | |||||||
| Solidus Company, L.P.(19) |
253,459 | * | 253,459 | * | 242,894 | * | |||||||||
| Judson Bowman(20) |
262,228 | * | 262,228 | * | 241,450 | * | |||||||||
| Capital Ventures International(21) |
291,832 | * | 291,832 | * | 268,708 | * | |||||||||
| Blade Ventures, LP(22) |
166,761 | * | 166,761 | * | 153,548 | * | |||||||||
| Prova Properties, LLC(23) |
153,253 | * | 153,253 | * | 141,787 | * | |||||||||
| Entities associated with Jeffrey Peierls(24) |
134,155 | * | 134,155 | * | 125,296 | * | |||||||||
| The Atlantis Group, LLC(25) |
75,309 | * | 75,309 | * | 69,956 | * | |||||||||
| Sienna Limited Partnership III, L.P.(26) |
106,713 | * | 106,713 | * | 98,258 | * | |||||||||
| Thomas P. Ziegler Trust(27) |
82,525 | * | 82,525 | * | 79,884 | * | |||||||||
| Maritch Services, Inc.(28) |
75,911 | * | 75,911 | * | 73,534 | * | |||||||||
| All other selling stockholders as a group(29) |
227,910 | * | 227,910 | * | 213,646 | * | |||||||||
| * | Less than 1%. |
| (1) | The number and percentage of shares beneficially owned is determined in accordance with Rule 13d-3 of the Exchange Act, and the information is not necessarily indicative of beneficial ownership for any other purpose. Under such rule, beneficial ownership includes any shares as to which the individual has sole or shared voting power or investment power and also any shares which the individual has the right to acquire within 60 days of May 31, 2010 through the exercise of any stock option, warrant, or other right. Unless otherwise indicated below, each person has sole voting power or investment power, or both, with respect to the shares shown as beneficially owned. Amounts include common stock, redeemable preferred stock and preferred stock, other than Series H, expressed on an as-converted to common stock basis, assuming an initial public offering price of $15.00 per share, the midpoint of the price range shown on the front cover of this prospectus. All warrants referenced below are immediately exercisable. |
| (2) | Includes (a) 439,377 shares issuable upon exercise of warrants held by Advanced Equities, Inc.; 18,514 shares issuable upon exercise of warrants and 482,381 shares held by Advanced Equities Investments XXV, LLC; (b) 9,685 shares issuable upon exercise of a warrant and 155,123 shares held by Advanced Equities Investments XXVI, LLC; (c) 4,501 shares issuable upon exercise of a warrant and 105,889 shares held by Advanced Equities Investments XXXV, LLC; (d) 4,917 shares issuable upon exercise of a warrant and 145,606 shares held by AEI Eastern Investments I, LLC; (e) 48,285 shares issuable upon exercise of a warrant and 1,159,342 shares held by AEI Eastern Investments II, LLC; (f) 6,203 shares issuable upon exercise of a warrant and 146,311 shares held by AEI Eastern Investments III, LLC; (g) 12,292 shares issuable upon exercise of a warrant and 258,034 shares held by AEI Eastern Investments IV, LLC; (h) 3,387 shares issuable upon exercise of a warrant and 58,628 shares held by AEI Trilogy Fund I, LLC; (i) 8,820 shares issuable upon exercise of warrants and 205,135 shares held by AEI 2006 Venture Investments I, LLC; (j) 18,168 shares issuable upon exercise of warrants and 393,868 shares held by AEI 2006 Venture Investments II, LLC; (k) 3,290 shares issuable upon exercise of a warrant and 50,846 shares held by AEI 2006 Venture Investments III, LLC; (l) 2,139 shares issuable upon exercise of a warrant and 38,839 shares held by AEI 2006 Venture Investments IV, LLC; (m) 112,282 shares issuable upon exercise of a warrant and 561,412 shares held by Advanced Equities Triangle Acquisitions I, LLC; (n) 292,233 shares issuable upon exercise of warrants and 1,461,167 shares held by Advanced Equities Triangle Acquisitions II, LLC; (o) 29,966 shares issuable upon exercise of warrants and 149,831 shares held by AEI 2007 Venture Investments III, LLC; (p) 38,800 shares issuable upon exercise of warrants and 194,001 shares held by AEI 2007 Venture Investments IV, LLC; (q) 137,542 shares issuable upon exercise of a warrant and 995,849 shares held by AEI Silicon Valley Fund II, LLC; |
133
Table of Contents
| (r) 25,362 shares held by Advanced Equities Motricity Common Investments, I, LLC; (s) 435,239 shares held by Advanced Equities Motricity Common Investments II, LLC; (t) 12,514 shares issuable upon exercise of warrants and 62,570 shares held by Advanced Equities Motricity Series I Investment I, LLC; (u) 347,636 shares held by AEI Wireless, LLC; (v) 663,364 shares held by AEI Wireless II, LLC; and (w) 139,878 shares held by AEI Wireless III, LLC. Keith Daubenspeck and Dwight Badger both possess shared voting and dispositive power over the shares held by the funds affiliated with Advanced Equities, Inc., and disclaim beneficial ownership of these shares except to the extent of their actual, respective pecuniary interest therein, if any. |
| (3) | Includes (a) 962,764 shares issuable upon exercise of warrants and 3,438,553 shares held by Koala Holding LP; and (b) 128,571 shares issuable upon exercise of a warrant held by Icahn Enterprises, L.P. (formerly known as American Real Estate Partners, L.P.). Koala Holding LP and Icahn Enterprises, L.P. are entities controlled by Carl C. Icahn. As such, Mr. Icahn has indirect voting and investment power over these shares and therefore is deemed to beneficially own these shares. |
| (4) | Includes (a) 3,162,246 shares held by TCV V, L.P. and (b) 59,868 shares held by TCV V Member Fund, L.P. (collectively, the “TCV Funds”). The sole General Partner of TCV V, L.P. and a General Partner of TCV Member Fund, L.P. is Technology Crossover Management V, L.L.C. (“TCM V”). The investment activities of TCM V are managed by Jay C. Hoag, Richard H. Kimball, John L. Drew, William J.G. Griffith, IV, and Jon Q. Reynolds Jr. (collectively, the “TCM Members”), each of whom possess shared voting and dispositive power over the shares beneficially owned by the TCV Funds. TCM V and the TCM Members disclaim beneficial ownership of any shares held by the TCV Funds except to the extent of their respective pecuniary interests therein. |
| (5) | Includes (a) 309,439 shares issuable upon exercise of warrants and 2,827,948 shares held by New Enterprise Associates 10, Limited Partnership (“NEA 10”), and (b) 6,552 shares held by NEA Ventures 2002, L.P. (“Ven 2002”). The shares and warrants directly held by NEA 10 are indirectly held by NEA Partners 10, Limited Partnership (“NEA Partners 10”), the sole general partner of NEA 10, and each of the individual general partners of NEA Partners 10. The individual general partners (collectively, the “Individual NEA 10 GPs”) of NEA Partners 10 are M. James Barrett, Peter J. Barris, C. Richard Kramlich, Charles W. Newhall III, Mark W. Perry and Scott D. Sandell. The shares directly held by Ven 2002 are indirectly held by Pamela J. Clark, the general partner of Ven 2002, who has sole voting and dispositive power over such shares. NEA 10, NEA Partners 10, and the Individual NEA 10 GPs share voting and dispositive power with regard to the shares directly held by NEA 10. All indirect holders of the above-referenced shares disclaim beneficial ownership of all applicable shares except to the extent of their actual pecuniary interest therein. The principal business address of New Enterprise Associates, Inc. is 1954 Greenspring Drive, Suite 600, Timonium, MD 21093. |
| (6) | Includes 231,337 shares issuable upon exercise of options, 370,139 shares of restricted stock (see the section captioned “Executive Compensation—Long-Term Equity-Based Compensation” and footnotes 3, 4 and 5 to the “Outstanding Equity Awards at 2009 Fiscal Year End” table for a description of the vesting of Mr. Wuerch’s restricted stock), and 186,318 shares held by Ryan K. Wuerch; 555,397 shares held by his wife, Shawntel Wuerch; 100,000 shares held in trust for the benefit of Mr. Wuerch, for which Mr. Wuerch serves as trustee; and 100,000 shares held in trust for the benefit of Mrs. Wuerch, for which Mrs. Wuerch serves as trustee. |
| (7) | All 400,000 shares are restricted stock. See the section captioned “Executive Compensation—Long-Term Equity-Based Compensation” for a description of the vesting of the restricted stock. |
| (8) | All 10,000 shares are restricted stock. Mr. Dorr’s restricted stock vests in the same manner as the named executive officers. See the section captioned “Executive Compensation—Long-Term Equity-Based Compensation” for a description of the vesting of the restricted stock. |
| (9) | All 166,666 shares are restricted stock. See the section captioned “Executive Compensation—Long-Term Equity-Based Compensation” for a description of the vesting of the restricted stock. |
| (10) | All 133,333 shares are restricted stock. See the section captioned “Executive Compensation—Long-Term Equity-Based Compensation” for a description of the vesting of the restricted stock. |
| (11) | All 233,333 shares are restricted stock. See the section captioned “Executive Compensation—Long-Term Equity-Based Compensation” for a description of the vesting of the restricted stock. |
| (12) | Consists of 206 shares of common stock issuable upon exercise of a warrant. |
| (13) | All 8,000 shares are restricted stock. See the section captioned “Executive Compensation—Director Compensation” for a description of the vesting of the restricted stock. |
| (14) | All 8,000 shares are restricted stock. See the section captioned “Executive Compensation—Director Compensation” for a description of the vesting of the restricted stock. |
| (15) | 1,329,471 of these shares are restricted stock subject to time vesting and 231,337 are shares issuable upon the exercise of options. |
| (16) | Includes 6,877 shares issuable upon exercise of a warrant and 815,249 shares held by Massey Burch Venture Funds, L.P. William Fletcher Earthman III and Donald M. Johnston, general partners of MB Partners II, L.P., which is the general partner of Massey Burch Venture Funds, L.P., have shared voting and dispositive power over the shares held by Massey Burch Venture Funds, L.P. |
134
Table of Contents
| (17) | Includes (a) 5,501 shares issuable upon exercise of warrants and 496,653 shares held by Noro-Moseley Partners IV, L.P. and (b) 1,375 shares issuable upon exercise of warrants and 75,826 shares held by Noro-Moseley Partners IV-B, L.P. MKFJ-IV, LLC is the general partner of both Noro-Moseley Partners IV, L.P. and Noro-Moseley Partners IV-B, L.P. Charles D. Moseley, Jack R. Kelly, Charles A. Johnson, Russell R. French, Allen S. Moseley and Alan J. Taetle, members of MKFJ-IV, LLC, have shared voting and dispositive power over the shares held by Noro-Moseley Partners IV, L.P. and Noro-Moseley Partners IV-B, L.P. |
| (18) | Includes 4,899 shares issuable upon exercise of a warrant and 401,235 shares held by Tri-State Investment Group III and IV. Tri-State Investment Group III and IV are managed by their members, voting by majority according to their respective ownership. There are over 80 member managers. No member manager has the ability to control the voting or disposition of shares held by Tri-State Investment Group III or IV. |
| (19) | Includes 13,754 shares issuable upon exercise of a warrant and 239,705 shares held by Solidus Company, L.P. E. Townes Duncan and Victor E. Gatto, managing members of Solidus General Partner, LLC, which is the general partner of Solidus Company, L.P., have shared voting and dispositive power over the shares held by Solidus Company, L.P. |
| (20) | Includes 234,455 shares issuable upon exercise of options, 5,677 shares of restricted stock and 22,096 shares of common stock. Mr. Bowman is our former Chief Technology Officer and also served as a director on our board. |
| (21) | Martin Kobinger, president of Heights Capital Management, Inc., the investment manager of Capital Ventures International, has sole voting and dispositive power over the shares held by Capital Ventures International. |
| (22) | Craig Gunther, the managing director of Blade Partners, LLC, which is the general partner of Blade Ventures L.P., has sole voting and dispositive power over the shares held by Blade Ventures, L.P. |
| (23) | Includes 6,877 shares issuable upon exercise of a warrant and 146,376 shares held by Prova Properties, LLC. Christopher W. Cox, manager of Prova Properties, LLC, has sole voting and dispositive power over the shares held by Prova Properties, LLC. |
| (24) | Includes (a) 2,066 shares issuable upon the exercise of a warrant and 10,333 shares held by Jeffrey Peierls, (b) 17,333 shares issuable upon the exercise of a warrant and 86,666 shares held by The Peierls Foundation, Inc., (c) 1,573 shares issuable upon the exercise of a warrant and 7,866 shares held by U.D. Ethel F. Peierls Charitable Lead Trust, (d) 693 shares issuable upon the exercise of a warrant and 3,466 shares held by U.D. J.N. Peierls for B.E. Peierls and (e) 693 shares issuable upon the exercise of a warrant and 3,466 shares held by U.D. J.N. Peierls for E.J. Peierls. E. Jeffrey Peierls, president of the Peierls Foundation, Inc., has sole voting and dispositive power over the shares held by the Peierls Foundation, Inc. E. Jeffrey Peierls, trustee of UD JN Peierls for BE Peierls, UD JN Peierls for EJ Peierls and UD Ethel F. Peierls Charitable Lead Trust, has sole voting and dispositive power over the shares held by each of those entities. |
| (25) | Includes 687 shares issuable upon exercise of a warrant and 74,622 shares held by the Atlantis Group, LLC. Roberta B. Hardy, W. Christopher Matton, Bruce Oberhardt and Michael Cain, executive committee officers of The Atlantis Group, LLC have shared voting and dispositive power over the shares held by The Atlantis Group, LLC. |
| (26) | Includes (a) 25,582 shares held by Sienna Limited Partnership II, L.P. and (b) 106,713 shares held by Sienna Limited Partnership III, L.P. Sienna Ventures, Inc. is the general partner of Sienna Associates, L.P., which is the general partner of Sienna Limited Partnership III, L.P. Daniel L. Skaff, sole shareholder of Sienna Ventures, Inc. has sole voting and dispositive power over the shares held by Sienna Limited Partnership III, L.P. |
| (27) | Includes 13,754 shares issuable upon exercise of a warrant and 68,771 shares held by the Thomas P. Ziegler Trust. Thomas P. Ziegler, trustee of the Thomas P. Ziegler Trust, has sole voting and dispositive power over the shares held by the Thomas P. Ziegler Trust. |
| (28) | Jane Pritchard Mathis, Kathryn Pritchard Shelley and Robert T. Pritchard, shareholders of Maritch Services, Inc., have shared voting and dispositive power over the shares held by Maritch Services, Inc. |
| (29) | Includes all other selling stockholders, who in the aggregate beneficially own less than 1% of our common stock. |
135
Table of Contents
CERTAIN RELATIONSHIPS AND RELATED PARTY TRANSACTIONS
Since January 1, 2007, there has not been, nor is there currently proposed, any transaction or series of similar transactions to which we were or are a party in which the amount involved exceeded or exceeds $120,000 and in which any of our directors, executive officers, holders of more than 5% of any class of our voting securities, or any member of the immediate family of any of the foregoing persons, had or will have a direct or indirect material interest, other than as set forth below and the compensation arrangements with directors and executive officers, which are described where required under the “Executive Compensation” section of this prospectus.
Registration Rights Agreement
In October 2007, in connection with our Series I financing, we entered into an amended and restated registration rights agreement with certain of our significant stockholders including funds affiliated with Advanced Equities, Inc., Technology Crossover Ventures and New Enterprise Associates, Inc., and Koala Holding LP, an entity beneficially owned by Carl C. Icahn. The then-existing registration rights agreement had been amended to include registration rights for investors in our preferred stock financings prior to 2007.
At any time, the holders of a majority of the registrable securities then outstanding may demand that we register all or a portion of their registrable securities under the Securities Act. “Registrable securities” means shares of common stock acquired directly by an investor, shares of common stock issued upon conversion or redemption of shares of our preferred stock, and shares of common stock issued as a dividend or distribution on our common or preferred stock. Upon a demand for registration, we are obligated to provide notice to certain stockholders of the demand for registration and, upon notice to us, such stockholder may participate in the registration. These holders are entitled to two demand registrations under the terms of the registrations rights agreement, provided that the aggregate value of the registrable shares is at least $10 million. Beginning 180 days after the date of this offering, holders of approximately 27 million shares of our common stock (including 2,188,748 shares of common stock issuable upon the conversion of our Series H preferred stock as of March 31, 2010) will be able to require us to conduct a registered public offering of their shares.
The registration rights agreement also provides holders of registrable securities with the right to participate in any registration of securities that we initiate for our own account with certain limited exceptions. If we propose to file a registration in connection with a public offering of securities we must provide notice to the holders of registrable securities and use our best efforts to include such number of securities as the holders of registrable securities request in writing within 20 days of such notice. If the registration is an underwritten offering, the underwriters may, if they determine it necessary for certain specified reasons, exclude some or all such registrable securities from such registration.
After we become eligible to use Form S-3, the holders of registrable securities shall have the right to request registration on Form S-3 provided that the aggregate value of the registrable shares to be filed on such Form S-3 is at least $10 million. Upon such a demand for registration, we will be obligated to provide notice to certain stockholders of the demand for registration on Form S-3 and, upon notice to us, such stockholder may participate in the registration. These holders are entitled to two demand registrations on Form S-3 under the terms of the registrations rights agreement.
In connection with any registration affected pursuant to the terms of the registration rights agreement, we will be required to pay all of the fees and expenses incurred in connection with such registration. However, the underwriting discounts and selling commissions (if any) payable in respect of registrable securities included in any registration will be paid by the persons who include such registrable securities in any such registration. The registration rights agreement also contains customary cross-indemnification provisions.
136
Table of Contents
The registration rights under the registration rights agreement shall expire on the earlier of (a) seven years following the closing of this offering and (b) such time as the holder of registrable securities may sell all of its securities pursuant to Rule 144.
We believe that the foregoing is a materially complete summary of the amended and restated registration rights agreement. Please see the amended and restated registration rights agreement, which is filed as an exhibit to the registration statement of which this prospectus is a part, for the complete terms of the agreement.
Stockholders Agreement
In October 2007, in connection with our Series I financing, we entered into an amended and restated stockholders’ agreement with several of our significant stockholders, including affiliates of Advanced Equities, Inc., Technology Crossover Ventures and New Enterprise Associates, Inc., and Koala Holding LP, an entity beneficially owned by Carl C. Icahn. As of March 31, 2010, approximately 27 million shares of our common stock (assuming conversion of our outstanding redeemable preferred stock and preferred stock, including 2,188,748 shares of common stock issuable upon the conversion of our Series H preferred stock) were subject to this agreement. The then-existing stockholders’ agreement had been amended in connection with our preferred stock financings prior to 2007. The amended and restated stockholders agreement, among other things:
| Ÿ | limits the ability of stockholders to transfer our securities, except for certain permitted transfers described therein; |
| Ÿ | grants a right of first offer with respect to transfers of our securities by employees and other parties to the stockholders’ agreement; |
| Ÿ | provides for certain co-sale rights and tag-along rights; and |
| Ÿ | provides for voting of shares with respect to the constituency of the board of directors. |
In addition, the stockholders’ agreement provides that if we receive, after February 23, 2009, a bona fide offer from a third-party to acquire all of our outstanding stock or all or substantially all of our assets we must, subject to certain restrictions described therein, give notice to Koala Holding LP, an entity beneficially owned by Carl C. Icahn, and provide Koala Holding LP with an opportunity to acquire all of our outstanding stock or all or substantially all of our assets on the same terms as such bona fide third-party offeror. This matching right expires 180 days after we provide such notice. If Koala Holding LP does not match the third-party’s terms as of the end of this 180-day period, we can accept the third-party offer. This matching right will not apply if such bona fide offer will provide Koala Holding LP with a 50% return on the equity purchased by it in the Series H round.
The amended and restated stockholders’ agreement will terminate upon completion of this offering. We believe that the foregoing is a materially complete summary of the amended and restated stockholders agreement. Please see the amended and restated stockholders’ agreement, which is filed as an exhibit to the registration statement of which this prospectus is a part, for the complete terms of the agreement.
Relocation Arrangements
In connection with the relocation of our corporate headquarters to Bellevue, Washington, in 2008, we arranged for the purchase of Ryan K. Wuerch’s Raleigh, North Carolina residence by a third-party relocation service company at an appraised market value of approximately $2.0 million. In July 2009, in connection with the relocation of our President and Chief Operating Officer, Jim Smith, to Bellevue, we arranged for the purchase of Mr. Smith’s Arlington, Virginia residence by a third-party relocation service company at an appraised market value of $1.2 million. Under these arrangements, we were
137
Table of Contents
responsible for the mortgage and all costs associated with the homes, including taxes, insurance, utilities, maintenance, repairs and improvements, until such time as they were sold. Additionally, we were responsible for any loss realized by the third-party relocation firm on the ultimate resale of the homes. In November 2009, Mr. Smith’s former residence was sold for net proceeds of $0.9 million. In March 2010, Mr. Wuerch’s former residence was sold for net proceeds of $1.2 million.
Transactions with Chief Executive Officer
In 2004, we extended personal loans to Ryan K. Wuerch, our chief executive officer in connection with his relocation to Raleigh, North Carolina, as evidenced by the promissory notes dated May 6, 2004 and June 10, 2004, in the aggregate principal amount of $250,000 and $31,500, respectively, bearing interest at the prime rate published in the Wall Street Journal on January 1 of each year. As of November 30, 2009, the aggregate amount of indebtedness outstanding under these loans, including accrued interest, was $354,860. In addition, Mr. Wuerch has borrowed $80,069 from us to cover certain legal fees and non-reimbursable expenses.
On December 18, 2009, the outstanding principal amount of the loan, including all outstanding legal fees and other non-reimbursable expenses was $362,569, which was the largest aggregate amount of principal outstanding during the last three years. The total accrued interest was $72,360. The balance of $434,929, including principal and interest, was satisfied by the surrender of 22,134 shares of vested common stock held by Mr. Wuerch. Our board of directors approved this repayment of the loan based on a September 30, 2009 valuation of our common stock at $19.65 per share. These loans are no longer outstanding.
Arrangement with Icahn Sourcing LLC
Icahn Sourcing LLC (“Icahn Sourcing”) is an entity formed and controlled by Carl C. Icahn in order to leverage the potential buying power of a group of entities which Mr. Icahn either owns or with which he otherwise has a relationship in negotiating with a wide range of suppliers of goods, services, and tangible and intangible property. We are a member of this buying group and, as such, are afforded the opportunity to purchase goods, services and property from vendors with whom Icahn Sourcing has negotiated rates and terms. In return, Icahn Sourcing may disclose certain information to the vendors regarding our historic usage and future needs with respect to particular goods and services. Icahn Sourcing does not guarantee that we will purchase any goods, services or property from any such vendors and we are under no legal obligation to do so. Our agreement with Icahn Sourcing specifies no fees will be paid by either party to the other with respect to the buying group arrangement and that we may terminate our participation in the arrangement at any time. We have purchased a variety of goods and services as a member of the buying group at prices and on terms that we believe are more favorable than those which would be achieved on a stand-alone basis.
Direct to Consumer Business
In 2008, we adopted a plan to exit our direct to consumer business through a disposition of assets. After negotiations with an unaffiliated potential purchaser fell through, we initiated a formal bid process. We received five bids, the highest of which was a $2.5 million bid by Pinmot, Inc. Although we reached out to the lower bidders to encourage them to increase their offers, and also contacted the unaffiliated potential purchaser to inquire if it had any renewed interest, we did not receive any offers higher than the bid by Pinmot, Inc. In June 2008, we sold our direct to consumer business to Pinmot, Inc. for $2.5 million. Judson S. Bowman, who was one of our executive officers and board members at the time the transaction was being negotiated, was president and chief executive officer of Pinmot, Inc. Once Pinmot, Inc. submitted a bid for the business, Mr. Bowman did not participate in any further board discussions regarding the transaction. Mr. Bowman resigned as a director and executive officer on June 3, 2008. Mr. Bowman owned 60.61% of Pinmot, Inc. at the time of the transaction.
138
Table of Contents
Abandoned Transaction Fee
In late April 2007, we learned of an opportunity to acquire a business complementary to our business, and that the deadline for letters of interest was to pass very shortly thereafter. In order to submit a bid, the target required that the Company obtain a financing letter indicating that the Company had the capital necessary to consummate the transaction. In light of the timing, and taking into account advice from its advisors, our board of directors concluded that our existing investors would be the most likely source of financing for the transaction. Based on that conclusion, we reached out to several of our investors to gauge their interest in providing financing for the transaction. The only entity willing to consider offering financing for the transaction was Icahn Enterprises, L.P. (“Icahn Enterprises”), successor in interest to American Real Estate Partners, LP., an entity affiliated with Koala Holding LP. Both entities are controlled by Carl C. Icahn.
After negotiations, Icahn Enterprises agreed to provide a financing letter in connection with the proposed transaction. As consideration for such letter, in May 2007, we agreed to pay Icahn Enterprises, a fee in the form of a warrant to purchase 128,571 shares of common stock at an exercise price of $32.25 per share. The number of shares underlying the warrant issued to Icahn Enterprises was determined through negotiations between the parties. The Company does not believe it can make a determination of whether the fee paid to Icahn Enterprises was consistent with the terms of financing commitment letters provided by non-related parties because we do not believe that a non-related party could have, within the applicable time constraints, evaluated our financial position and issued a similar financing commitment letter.
Transactions Related to Negotiation of the InfoSpace Mobile Acquisition
In September 2007, funds affiliated with New Enterprise Associates Inc. (“NEA”) and Advanced Equities, Inc. (“AEI”) and several of its investors deposited $36.5 million and $20 million, respectively, in escrow accounts on our behalf to facilitate our ability to negotiate the acquisition. NEA and AEI are among our principal stockholders. See the section entitled “Principal and Selling Stockholders” for more information. In addition, NEA and AEI earned stand-by deposit fees equal to the difference between the amount actually earned by them on their deposits and the amount they would have earned at a rate of 12% per annum during the period beginning on September 14, 2007 and ending on the date the deposits were returned to them. In consideration of these deposits, we agreed to issue to NEA and AEI warrants to purchase 1,667 shares of common stock per day for every $10 million in escrow, up to 16,667 shares of common stock subject to such warrants for AEI and 85,167 shares of common stock subject to such warrants for NEA. In connection with this transaction, we issued the maximum amount of shares subject to warrants, with an exercise price of $14.54 per share, to NEA and AEI. Due to timing constraints and other circumstances of the Series I financing round, we did not believe that we could obtain similar deposits from non-related parties because they would be unable to adequately evaluate our financial position in time to complete the transaction. As a result, we are unable to determine whether these deposit fees were similar to the fees that would have been charged by non-related parties.
Additionally, in connection with the acquisition, we received consulting services from Koala Holding LP, an entity beneficially owned by Carl C. Icahn, in exchange for cash in the amount of $3 million and warrants to purchase 2,578,915 shares of Series I redeemable preferred stock at an exercise price of $0.9694 per share. The number of shares subject to warrants issued to Koala Holding LP in connection with this transaction was equal to 5% of the 51.6 million shares of Series I redeemable preferred stock previously issued to Koala Holding LP. We believe that the consulting services we received from Koala Holding LP, which included Mr. Icahn’s assistance in negotiations with InfoSpace, were unique. As a result, we are unable to determine whether the compensation paid to Koala Holding LP for such consulting services is consistent with fees that would have been charged by a non-related party.
139
Table of Contents
With respect to both transactions, the exercise price of $0.9694 per share was consistent with the price per share of the Series I financing round, which had been determined by negotiations between members of our management team and our investors. The amount of stock underlying the warrants was determined through negotiations between the respective entities and members of our management team, and ultimately approved by our board of directors. The directors who had been designated by NEA, AEI and Koala Holding LP did not participate in the votes approving the grants to their respective entities.
Series F, G, H, and I Financing Rounds
AEI acted as a placement agent in each of our Series F, G, H, and I financing rounds. We entered into placement agent and advisory agreements with AEI for each of those financing rounds (the “AEI Advisory Agreements”). As compensation for those services, we provided AEI with cash in the amount of $16.8 million and warrants to purchase 64,916 shares of common stock at an exercise price of $35.55 per share, warrants to purchase 29,093 shares of common stock at an exercise price of $37.35 per share, and a warrant to purchase 6,340,676 shares of Series I preferred stock at an exercise price of $0.9694 per share. In connection with Series I, AEI surrendered warrants to purchase 93,045 and 29,093 shares of common stock at $35.55 and $37.35 per share, respectively, in exchange for certain fees and warrants included in the amounts above.
In January 2010, we and AEI entered into an Omnibus Amendment Agreement that amended the AEI Advisory Agreements. The Omnibus Amendment Agreement, among other things, eliminates our obligation to cause (or attempt to cause) AEI to be included as a member of the underwriting syndicate for this offering and obligates AEI and its affiliates to enter into (and use its commercially reasonable efforts to cause individuals or entities who acquired equity securities of Motricity from AEI to enter into) a lock-up agreement in connection with this offering on terms consistent with those described under the heading “Underwriting.” In connection with our initial public offering AEI has provided and is providing advisory services to us. In exchange for such advisory services, we agreed to pay AEI an advisory fee of up to $2 million, $1 million payable prior to the consummation of the offering and up to $1 million, $400,000 payable upon the launch of the “road show” in connection with offering and $600,000 payable upon consummation of this offering out of the proceeds of this offering. If the offering is not consummated, the initial $1 million shall be credited against future advisory services, if any.
Series H Preferred Stock
Our Series H preferred stock will become automatically convertible into shares of our common stock in connection with this offering only if the initial public offering price is above $20.35. The terms of our Series H preferred stock had provided that any shares of the Series H preferred stock that remained outstanding as of August of 2011 would then be subject to redemption at the holders’ election. Under those terms, depending on the number of shares, if any, of Series H preferred stock remaining outstanding at August 2011, we may have needed to provide up to approximately $52 million to the holders electing redemption at that time. In order to enhance our financial flexibility, our board of directors determined that it was in the best interests of the company and our stockholders to negotiate an extension of the date holders may require such a redemption of their Series H preferred stock. Our chief executive officer, Ryan Wuerch, and Carl C. Icahn, owner of a majority of the Series H preferred stock, negotiated the revised terms, which were approved by a majority of the disinterested directors of our board. Under the revised terms, the Series H preferred stock generally will not be subject to redemption at the election of the holder prior to August 2013. In addition, a forced conversion feature was added that provides that the Series H preferred stock will convert at our option into shares of our common stock if the average closing price over a 90-day period of our common stock is $23.21 per share or higher. In consideration of these revisions a 8% pay-in-kind (non-cash)
140
Table of Contents
dividend was also provided, which our board of directors concluded was a reasonable given the enhanced financial flexibility provided by the revised terms. For more information, see “Description of Capital Stock—Preferred Stock—Series H Preferred Stock.”
Corporate Opportunities Waiver
In order to address potential conflicts of interest between us and the funds affiliated with New Enterprise Associates, Inc. and Technology Crossover Ventures, and Koala Holding LP, and any person or entity affiliated with these investors (each, an “Exempted Investor”), our amended and restated certificate of incorporation will contain provisions regulating and defining the conduct of our affairs after the completion of this offering as they may involve each Exempted Investor and its officers, directors or employees, and our powers, rights, duties and liabilities and those of our officers, directors and stockholders in connection with our relationship with each such investor.
Our amended and restated certificate of incorporation will provide that no Exempted Investor is under any duty to present any corporate opportunity to us which may be a corporate opportunity for such Exempted Investor or any officer, director or employee thereof and us and each Exempted Investor or any officer, director or employee thereof will not be liable to us or our stockholders for breach of any fiduciary duty as our stockholder or director by reason of the fact that such Exempted Investor pursues or acquires that corporate opportunity for itself, directs that corporate opportunity to another person or does not present that corporate opportunity to us. For purposes of our certificate of incorporation, “corporate opportunities” include business opportunities that we are financially able to undertake, that are, from their nature, in our line of business, are of practical advantage to us and are ones in which we have an interest or a reasonable expectancy, and in which, by embracing the opportunities, the self-interest of each Exempted Investor or its officers or directors will be brought into conflict with our self-interest. Any person purchasing or otherwise acquiring any interest in any shares of our capital stock will be deemed to have consented to these provisions of our amended and restated certificate of incorporation. see “Description of Capital Stock—Certificate of Incorporation Provisions Relating to Corporate Opportunities and Interested Directors.”
Waiver of Rights to Purchase Shares in this Offering
In connection with our Series E preferred stock financing in October 2004, we entered into an agreement with TCV V, L.P. and TCV Member Fund, L.P. (collectively, the “TCV Funds”, which together beneficially own more that 5% of our common stock before this offering) and certain other purchasers of our Series E preferred stock, that provided these investors a right to purchase shares of our common stock in our initial public offering through a directed share program. These investors have a right to purchase up to an aggregate number of shares of our common stock equal to the quotient obtained by dividing (i) $5 million by (ii) $15.00, the midpoint of the estimated offering range on the front cover page of this prospectus. The TCV Funds and the other Series E investors have agreed to waive their rights under this agreement in connection with this offering.
141
Table of Contents
Policies and Procedures for Related Party Transactions
Our Audit Committee Charter requires the Audit Committee to review and approve in advance any proposed related party transactions. We require our directors and executive officers to report any potential related party transactions. As required under SEC rules, transactions that are determined to be directly or indirectly material to the company or a related person will be disclosed in our periodic filings as appropriate.
142
Table of Contents
Prior to the completion of this offering our certificate of incorporation and bylaws will be amended. Copies of the forms of our amended certificate of incorporation and bylaws have been filed as exhibits to the registration statement of which this prospectus is a part. The provisions of our amended and restated certificate of incorporation and bylaws that will be in effect upon consummation of this offering and relevant sections of the General Corporation Law of the State of Delaware, which we refer to as the “DGCL,” are summarized below.
Authorized Capital Stock
Our authorized capital stock will consist of 975,000,000 shares, comprising: (i) 625,000,000 shares of common stock, par value $0.001 per share and (ii) 350,000,000 shares of preferred stock, $0.001 par value per share. As of March 31, 2010, we had outstanding 31,842,617 shares of common stock, held of record by 363 stockholders, and 21,084,337 shares of Series H preferred stock, held of record by three stockholders assuming the conversion of all other outstanding shares of our redeemable preferred stock and preferred stock into common stock upon the closing of this offering.
Common Stock
Holders of our common stock are entitled to one vote per share on all matters submitted to a vote of stockholders. Subject to preferences that may be applicable to any outstanding shares of preferred stock, holders of common stock are entitled to receive ratably such dividends as may be declared by the board out of funds legally available therefor. Upon the liquidation, dissolution or winding up of our company, the holders of our common stock are entitled to receive their ratable share of the net assets of our company available after payment of all debts and other liabilities, subject to the prior rights of any outstanding preferred stock. Holders of our common stock have no preemptive, subscription or redemption rights. There are no redemption or sinking fund provisions applicable to the common stock.
Preferred Stock
Series H Preferred Stock
Upon consummation of this offering, 21,084,377 shares of our Series H preferred stock will remain outstanding. Our Series H preferred stock is convertible at the option of the holders thereof into common stock at a rate of approximately 0.104 shares of common stock for each share of Series H preferred stock (which shall be subject to adjustments including for stock splits, stock dividends and certain dilutive issuances). If (i) the public offering price of this offering is more than $20.35 per share; or (ii) the average closing price over a 90-day period is $23.21 per share or higher, Series H preferred stock will convert at our option into shares of our common stock.
So long as 10% of the Series H preferred stock remains outstanding, without the consent of at least a majority of the then outstanding shares of Series H preferred stock, we may not, among other things, (i) amend or waive any provision of our certificate of incorporation or bylaws so as to affect the Series H preferred stock adversely; or (ii) incur indebtedness other than with respect to (x) vendors, service providers, trade creditors, employees, independent contractors and equipment lessors, in each case, in the ordinary course of business, (y) intercompany indebtedness, and (z) indebtedness not to exceed $42 million outstanding under credit facilities. In addition, holders of our Series H preferred stock will have the right to designate two members of our board of directors.
The Series H preferred stock has a liquidation preference of $2.49 per share. On or after August 31, 2013, upon request of at least a majority of the then outstanding shares of Series H
143
Table of Contents
preferred stock, we must redeem the Series H preferred stock in immediately available funds or by the issuance of a promissory note which shall bear simple interest at the rate of 4% per annum and shall be payable in eight consecutive quarterly installments with the first such installment becoming due and payable on the first anniversary of the redemption payment date (determined once such written request is received); provided, however, that in lieu of receiving the redemption payment in the form of a promissory note, any holder of Series H preferred stock may instead elect to be redeemed quarterly and receive the redemption payment in eight consecutive quarterly installments.
The Series H preferred stock provides for cumulative dividends quarterly from the date of the consummation of this offering at the rate of 8% per annum, accruing daily whether or not earned or declared, which shall be paid in additional shares of Series H preferred stock, paid quarterly.
The holders of Series H preferred stock will have one vote for each share of common stock into which such holders’ shares could then be converted at the time, and with respect to such vote, will have full voting rights and powers equal to the voting rights and powers of the holders of our common stock.
Warrants
As of March 31, 2010, warrants to purchase 2,973,911 shares of our common stock at a weighted average exercise price of $16.23 per share were outstanding. These warrants expire on the earlier of (i) the stated expiration date, which ranges from June 2010 to December 2014; (ii) the date of Motricity’s liquidation, dissolution, or sale of substantially all of its assets and (iii) the date of Motricity’s merger or consolidation with another company in a transaction resulting in less than 50% ownership of the surviving entity by our stockholders. The warrants provide for customary adjustments for stock splits, stock dividends and reorganizations or consolidations and specified anti-dilution protection for sales of securities by us at a price below the fair market value of such securities if offered to all of our stockholders.
In addition, warrants to purchase a combined 292,198 shares of Series A and B redeemable preferred stock (convertible into 13,676 shares of common stock) and 19,478 shares of common stock, respectively, that upon consummation of this offering will represent warrants to purchase shares of common stock at a combined weighted average exercise price of $3.26 per share. The common stock issuable upon conversion of the Series A and B redeemable preferred stock has been determined using an assumed initial public offering price of $15.00 per share, the midpoint of the price range shown on the front cover page of this prospectus. These warrants expire on the earlier of (i) the stated expiration date which ranges from April 2011 to July 2012; (ii) the date of Motricity’s liquidation, dissolution, or sale of substantially all of its assets; and (iii) the date of Motricity’s merger or consolidation with another company in a transaction resulting in less than 50% ownership of the surviving entity by our stockholders. The warrants provide for (i) customary adjustments for stock splits, stock dividends and reorganizations or consolidations; (ii) specified anti-dilution protection for sales of securities by us at a price below the fair market value of such securities if offered to all of our stockholders; and (iii) an option to redeem for common stock if we were to redeem or convert all of our preferred stock.
We also had outstanding warrants to purchase 8,919,591 shares of Series I redeemable preferred stock at an exercise price of $0.97 per share that upon consummation of this offering will represent warrants to purchase 594,639 shares of common stock at an exercise price of $14.54 per share. These warrants expire on the earlier of (i) the stated expiration date of December 2014; (ii) the date of Motricity’s liquidation, dissolution, or sale of substantially all of its assets; and (iii) the date of Motricity’s merger or consolidation with another company in a transaction resulting in less than 50% ownership of the surviving entity by our stockholders. The warrants provide for (i) customary
144
Table of Contents
adjustments for stock splits, stock dividends and reorganizations or consolidations; (ii) specified anti- dilution protection for sales of securities by us at a price below the fair market value of such securities if offered to all of our stockholders; and (iii) an option to redeem for common stock if we were to redeem or convert all of our preferred stock.
Other Preferred Stock
The board of directors has the authority, without any further vote or action by the stockholders, to issue other preferred stock, from time to time, in one or more series and to fix the preferences, limitations and rights of the shares of each series, including:
| Ÿ | dividend rates; |
| Ÿ | conversion rights; |
| Ÿ | voting rights; |
| Ÿ | terms of redemption and liquidation preferences; and |
| Ÿ | the number of shares constituting each series. |
Satisfaction of any dividend preferences of outstanding shares of preferred stock would reduce the amount of funds available for the payment of dividends on shares of common stock. Holders of shares of preferred stock may be entitled to receive a preference payment in the event of our liquidation, dissolution or winding-up before any payment is made to the holders of shares of common stock. However, our board of directors may not, other than through an amendment to the certificate of incorporation approved by our stockholders, adopt or approve any “rights plan,” “poison pill” or other similar plan, agreement or device designed to prevent or make more difficult a hostile takeover of our company by increasing the cost to a potential acquirer of such a takeover either through the issuance of new rights, shares of common stock or preferred stock or any other security or device that may be issued to our stockholders other than all stockholders that carry severe redemption provisions, favorable purchase provisions or otherwise. This prohibition means that our board will be prohibited from issuing preferred stock as a defensive mechanism to render more difficult or tend to discourage a merger, tender offer or proxy contest, the assumption of control by a holder of a large block of our securities or the removal of incumbent management.
Except as set forth above under the description of the Series H preferred stock, there are no current agreements or understandings with respect to the issuance of additional preferred stock and our board has no present intentions to issue any other shares of preferred stock.
Certain Provisions of the Certificate of Incorporation and Bylaws
Board of Directors
Our board of directors will consist of a number of directors as fixed by the board from time to time, provided that in no event will the number of directors exceed seven, except that upon the approval of at least all but one of the directors, the number may be increased to nine so long as such increase is not done when we have received notice of a contested election of directors for an upcoming stockholder meeting. The board of directors and our stockholders have authority to fill any vacancy on the board of directors, whether such vacancy occurs as a result of an increase in the number of directors or otherwise. Holders of our Series H preferred stock will have the right to designate two members to our board of directors.
Our board of directors is not classified or staggered, and can only become classified or staggered through an amendment to the certificate of incorporation approved by our stockholders. In addition, there is no cumulative voting or majority voting with respect to the election of directors. As a result, all of our directors are up for re-election annually and are elected by a plurality vote.
145
Table of Contents
Stockholder Action By Written Consent
Pursuant to Section 228 of the DGCL, any action required to be taken at any annual or special meeting of the stockholders may be taken without a meeting, without prior notice and without a vote if a consent or consents in writing, setting forth the action so taken, is signed by the holders of outstanding stock having not less than the minimum number of votes that would be necessary to authorize or take such action at a meeting at which all shares of our stock entitled to vote thereon were present and voted, unless the company’s amended and restated certificate of incorporation provides otherwise. Our amended and restated certificate of incorporation will provide that any action required or permitted to be taken by our stockholders may be effected at a duly called annual or special meeting of our stockholders and may also be effected by consent in writing by such stockholders.
Requirements for Advance Notification of Stockholder Meeting, Nominations and Proposals
Our amended and restated bylaws will provide that special meetings of the stockholders must be called upon the request of holders of not less than 20% of the combined voting power of the voting stock, and may be called upon the request of the board of directors, or the chairman of the board, the vice chairman of the board (if any) or the chief executive officer.
Our amended and restated bylaws will establish an advance notice procedure for stockholder proposals to be brought before an annual or special meeting of our stockholders, including proposed nominations of persons for election to the board of directors. Stockholders at an annual or special meeting will only be able to consider proposals or nominations specified in the notice of meeting or brought before the meeting by or at the direction of the board of directors or by a stockholder who was a stockholder of record on the record date for the meeting, who is entitled to vote at the meeting and who has given our secretary timely written notice, in proper form, of the stockholder’s intention to bring that business before the meeting. Although the bylaws will not give the board of directors the power to approve or disapprove stockholder nominations of candidates or proposals regarding other business to be conducted at a special or annual meeting, the bylaws may have the effect of precluding the conduct of certain business at a meeting if the proper procedures are not followed or may discourage or defer a potential acquiror from conducting a solicitation of proxies to elect its own slate of directors or otherwise attempting to obtain control of the company.
Our amended and restated bylaws will allow the presiding officer at a meeting of the stockholders to adopt rules and regulations for the conduct of meetings which may have the effect of precluding the conduct of certain business at a meeting if the rules and regulations are not followed. These provisions may also defer, delay or discourage a potential acquiror from conducting a solicitation of proxies to elect the acquiror’s own slate of directors or otherwise attempting to obtain control of our company.
Requirements for Amendment of Certificate and Bylaws
Our amended and restated bylaws provide that our stockholders may amend our bylaws only by a vote of more than 50% of all of the outstanding shares of our capital stock then entitled to vote. In addition, subject to the foregoing, our amended and restated bylaws grant our board of directors the authority to amend and repeal our bylaws without a stockholder vote; provided that the board does not have the power to rescind, alter, amend or repeal any bylaw adopted, enacted, altered or amended by the stockholders or to enact any bylaw that was previously rescinded or repealed by the stockholders.
Our amended and restated certificate of incorporation provides that the provisions in the amended and restated certificate of incorporation and our amended and restated bylaws relating to indemnification and exclusion of directors from personal liability may be amended only by a vote of 66 2/3% or more of all of the outstanding shares of our capital stock then entitled to vote.
146
Table of Contents
Separation of Chairman and President and/or Chief Executive Officer
Under our amended and restated certificate of incorporation, the office of President and/or Chief Executive Officer, on the one hand, and the position of the Chairman of the Board of Directors, on the other hand, generally cannot be held by the same person. However, upon the death, resignation or termination of the Chairman, President and/or Chief Executive Officer our board of directors has the ability to combine these positions for a limited period of time in order to allow our board of directors time to select a successor.
Delaware Law
As a Delaware corporation, by an express provision in our certificate of incorporation, we have elected to “opt out” of the restrictions under Section 203 of the DGCL regulating corporate takeovers. In general, Section 203 prohibits a publicly-held Delaware corporation from engaging, under certain circumstances, in a business combination with an interested stockholder for a period of three years following the date the person became an interested stockholder, unless:
| Ÿ | prior to the date of the transaction, the board of directors of the corporation approved either the business combination or the transaction which resulted in the stockholder becoming an interested stockholder; |
| Ÿ | upon completion of the transaction that resulted in the stockholder becoming an interested stockholder, the interested stockholder owned at least 85% of the voting stock of the corporation outstanding at the time such transaction commenced, excluding, for purposes of determining the number of shares outstanding, (1) shares owned by persons who are directors and also officers of the corporation, and (2) shares owned by employee stock plans in which employee participants do not have the right to determine confidentially whether shares held subject to the plan will be tendered in a tender or exchange offer; or |
| Ÿ | on or subsequent to the date of the transaction, the business combination is approved by the board of directors of the corporation and authorized at an annual or special meeting of stockholders by the affirmative vote of at least 66 2/3% of the outstanding voting stock, excluding shares owned by the interested stockholder. |
In this context, a business combination includes a merger, asset or stock sale, or other transaction resulting in a financial benefit to the interested stockholder. An interested stockholder is a person who, together with affiliates and associates, owns or owned, within three years prior to the determination of interested stockholder status, 15% or more of a corporation’s outstanding voting securities.
A Delaware corporation may “opt out” of Section 203 with an express provision in its original certificate of incorporation or an express provision in its certificate of incorporation or bylaws resulting from amendments approved by holders of at least a majority of the corporation’s outstanding voting shares. We elected to “opt out” of Section 203 by an express provision in our certificate of incorporation.
Certificate of Incorporation Provisions Relating to Corporate Opportunities and Interested Directors
In order to address potential conflicts of interest between us and the funds affiliated with New Enterprise Associates, Inc. and Technology Crossover Ventures and Koala Holding LP, an entity beneficially owned by Carl C. Icahn, and any person or entity affiliated with these investors (each, an “Exempted Investor”), our amended and restated certificate of incorporation will contain provisions regulating and defining the conduct of our affairs after the completion of this offering as they may
147
Table of Contents
involve each Exempted Investor and its officers, directors or employees, and our powers, rights, duties and liabilities and those of our officers, directors and stockholders in connection with our relationship with each such investor. In general, these provisions recognize that we and each Exempted Investor may engage in the same or similar business activities and lines of business, have an interest in the same areas of corporate opportunities and that we and each Exempted Investor will continue to have contractual and business relations with each other, including service of officers and directors of each Exempted Investor serving as our directors.
Our certificate of incorporation will provide that, subject to any contractual provision to the contrary, each Exempted Investor will have no duty to refrain from:
| Ÿ | engaging in the same or similar business activities or lines of business as us; |
| Ÿ | any decision or action by each such Exempted Investor to assert or enforce its rights under any agreement or contract with us; |
| Ÿ | doing business with any of our clients or customers; or |
| Ÿ | employing or otherwise engaging any of our officers or employees. |
Our amended and restated certificate of incorporation will provide that no Exempted Investor is under any duty to present any corporate opportunity to us which may be a corporate opportunity for such Exempted Investor or any officer, director or employee thereof and us and each Exempted Investor or any officer, director or employee thereof will not be liable to us or our stockholders for breach of any fiduciary duty as our stockholder or director by reason of the fact that such Exempted Investor pursues or acquires that corporate opportunity for itself, directs that corporate opportunity to another person or does not present that corporate opportunity to us. For purposes of our certificate of incorporation, “corporate opportunities” include business opportunities that we are financially able to undertake, that are, from their nature, in our line of business, are of practical advantage to us and are ones in which we have an interest or a reasonable expectancy, and in which, by embracing the opportunities, the self-interest of each Exempted Investor or its officers or directors will be brought into conflict with our self-interest. Any person purchasing or otherwise acquiring any interest in any shares of our capital stock will be deemed to have consented to these provisions of our amended and restated certificate of incorporation.
Washington Business Corporation Act
The laws of Washington, where our principal executive offices are located, impose restrictions on certain transactions between certain foreign corporations and significant stockholders. In particular, the Washington Business Corporation Act, or WBCA, prohibits a “target corporation,” with certain exceptions, from engaging in certain “significant business transactions” with a person or group of persons which beneficially owns 10% or more of the voting securities of the target corporation, an “acquiring person,” for a period of five years after such acquisition, unless the transaction or acquisition of shares is approved by a majority of the members of the target corporation’s board of directors prior to the time of acquisition. Such prohibited transactions include, among other things, a merger or consolidation with, disposition of assets to, or issuance or redemption of stock to or from, the acquiring person, termination of 5% or more of the employees of the target corporation as a result of the acquiring person’s acquisition of 10% or more of the shares or allowing the acquiring person to receive any disproportionate benefit as a stockholder. After the five-year period, a significant business transaction may take place as long as it complies with certain fair price provisions of the statute or is approved at an annual or special meeting of stockholders.
We will be considered a “target corporation” so long as our principal executive office is located in Washington, and (1) a majority of our employees are residents of the state of Washington or we
148
Table of Contents
employ more than one thousand residents of the state of Washington; (2) a majority of our tangible assets, measured by market value, are located in the state of Washington or we have more than fifty million dollars’ worth of tangible assets located in the state of Washington; and (3) any one of the following: (a) more than 10% of our stockholders of record are resident in the state of Washington; (b) more than 10% of our shares are owned of record by state residents; or (c) 1,000 or more of our stockholders of record are resident in the state.
If we meet the definition of a target corporation, the WBCA may have the effect of delaying, deferring or preventing a change of control.
Limitation of Liability and Indemnification
Our amended and restated certificate of incorporation and bylaws provide indemnification for our directors and officers to the fullest extent permitted by the DGCL. In addition, as permitted by the DGCL, our amended and restated certificate of incorporation includes provisions that eliminate the personal liability of our directors for monetary damages resulting from breaches of certain fiduciary duties as a director. These provisions can not be amended without the affirmative vote of 66 2/3% of the outstanding shares. The effect of this provision is to restrict our rights and the rights of our stockholders in derivative suits to recover monetary damages against a director for breach of fiduciary duties as a director, except that a director will be personally liable for:
| Ÿ | any breach of his duty of loyalty to us or our stockholders; |
| Ÿ | acts or omissions not in good faith or which involve intentional misconduct or a knowing violation of law; |
| Ÿ | any transaction from which the director derived an improper personal benefit; and |
| Ÿ | improper distributions to stockholders. |
We also intend to maintain director and officer liability insurance, if available on reasonable terms.
We have also entered into indemnification agreements with our officers and directors, substantially in the form of the indemnification agreement filed by us as an exhibit to the registration statement of which this prospectus is a part. These indemnification agreements provide contractual indemnification to our officers and directors in addition to the indemnification provided in our amended and restated certificate of incorporation and bylaws.
The limitation of liability and indemnification provisions in the amended and restated certificate of incorporation and bylaws may discourage stockholders from bringing a lawsuit against directors for breach of their fiduciary duties. They may also reduce the likelihood of derivative litigation against directors and officers, even though an action, if successful, might benefit us and our stockholders. A stockholder’s investment may be harmed to the extent we pay the costs of settlement and damage awards against directors and officers pursuant to these indemnification provisions. Insofar as indemnification for liabilities arising under the Securities Act may be permitted to our directors, officers and controlling persons pursuant to the foregoing provisions, or otherwise, we have been advised that, in the opinion of the SEC, such indemnification is against public policy as expressed in the Securities Act, and is, therefore, unenforceable.
As of the date of this prospectus, we are not aware of any pending litigation or proceeding involving any director, officer, employee or agent of our company where indemnification will be required or permitted, nor are we aware of any threatened litigation or proceeding that might result in a claim for indemnification.
149
Table of Contents
Listing
We have applied to list our common stock on the NASDAQ Global Market, under the symbol “MOTR”.
Transfer Agent and Registrar
The transfer agent and registrar for our common stock will be American Stock Transfer & Trust Company, LLC. The transfer agent’s address is 6201 15th Avenue, Brooklyn, New York 11219, and its telephone number is (800) 937-5449.
150
Table of Contents
SHARES ELIGIBLE FOR FUTURE SALE
Prior to this offering, there has been no public market for our common stock, and we cannot predict what effect, if any, market sales of shares of common stock or the availability of shares of common stock for sale will have on the market price of our common stock. Future sales of substantial amounts of our common stock in the public market, or the perception that substantial sales may occur, could materially and adversely affect the prevailing market price of our common stock and could impair our future ability to raise capital through the sale of our equity at a time and price we deem appropriate. Furthermore, because only a limited number of shares will be available for sale shortly after this offering due to existing contractual and legal restrictions on resale as described below, there may be sales of substantial amounts of our common stock in the public market after the restrictions lapse. This also may adversely affect the prevailing market price and our ability to raise equity capital in the future.
Sales of Restricted Shares
Upon completion of this offering, we will have 38,592,617 shares of common stock outstanding and 21,084,337 shares of Series H preferred stock outstanding. Of these shares of common stock, the 6,750,000 shares of common stock being sold in this offering, plus any shares sold upon exercise of the underwriters’ option to purchase additional shares from the selling stockholders, will be freely tradable without restriction under the Securities Act, except for any such shares which may be held or acquired by an “affiliate” of ours, as that term is defined in Rule 144 promulgated under the Securities Act, which shares will be subject to the volume limitations and other restrictions of Rule 144 described below. The remaining 31,842,617 shares of common stock and all shares of the Series H preferred stock held by our existing stockholders upon completion of this offering will be “restricted securities,” as that phrase is defined in Rule 144, and may be resold only after registration under the Securities Act or pursuant to an exemption from such registration, including, among others, the exemptions provided by Rule 144 and Rule 701 of the Securities Act, which are summarized below. Taking into account the lock-up agreements described below, other contractual restrictions that prohibit transfers for at least 180 days after the date of this prospectus and the provisions of Rule 144 and 701, additional shares of our common stock will be available for sale in the public market as follows:
| Ÿ | no shares of restricted securities will be available for immediate sale on the date of this prospectus; and |
| Ÿ | 31,842,617 shares of our common stock will be available for sale after the expiration date of the lock-up agreements (180 days after the date of this prospectus unless earlier waived by J.P. Morgan Securities Inc. and Goldman, Sachs & Co. or unless later extended in the circumstances described under “Underwriters”) and other contractual restrictions, pursuant to Rule 144. |
Rule 144
The availability of Rule 144 will vary depending on whether shares of our common stock are restricted and whether they are held by an affiliate or a non-affiliate. For purposes of Rule 144, a non-affiliate is any person or entity that is not our affiliate at the time of sale and has not been our affiliate during the preceding three months.
In general, under Rule 144, once we have been a reporting company subject to the reporting requirements of Section 13 or Section 15(d) of the Exchange Act for at least 90 days, an affiliate who has beneficially owned shares of our restricted common stock for at least six months would be entitled to sell within any three-month period any number of such shares that does not exceed the greater of:
| Ÿ | 1% of the number of shares of our common stock then outstanding, which will equal approximately 385,926 shares immediately after consummation of this offering; or |
| Ÿ | the average weekly trading volume of our common stock on the open market during the four calendar weeks preceding the filing of a notice on Form 144 with respect to that sale. |
151
Table of Contents
In addition, any sales by our affiliates under Rule 144 are also subject to manner of sale provisions and notice requirements and to the availability of current public information about us. Our affiliates must comply with all the provisions of Rule 144 (other than the six-month holding period requirement) in order to sell shares of our common stock that are not restricted securities, such as shares acquired by our affiliates either in this offering or through purchases in the open market following this offering. An “affiliate” is a person that directly, or indirectly through one or more intermediaries, controls, is controlled by, or is under common control with, an issuer.
Similarly, once we have been a reporting company for at least 90 days, a non-affiliate who has beneficially owned shares of our restricted common stock for at least six months would be entitled to sell those shares without complying with the volume limitation, manner of sale and notice provisions of Rule 144, provided that certain public information is available. Furthermore, a non-affiliate who has beneficially owned our shares of restricted common stock for at least one year will not be subject to any restrictions under Rule 144 with respect to such shares, regardless of how long we have been a reporting company.
We are unable to estimate the number of shares that will be sold under Rule 144 since this will depend on the market price for our common stock, the personal circumstances of the stockholder and other factors.
Rule 701
Following this offering, we intend to file a registration statement on Form S-8 to register shares of our common stock reserved for issuance under our option plans and arrangements. This registration statement will become effective immediately upon filing, and shares covered by this registration statement will thereupon be eligible for sale in the public market, subject to Rule 144 limitations applicable to affiliates, any lock-up agreements and other contractual restrictions.
Rule 701 permits resales of shares in reliance upon Rule 144 without compliance with some restrictions of Rule 144, including the holding period requirement. Any of our employees, officers, directors or consultants who purchase shares under a written compensatory plan or contract may be entitled to rely on the resale provision of Rule 701. Affiliates are permitted to sell their Rule 701 shares under Rule 144 without complying with the holding period requirements of Rule 144. Non-affiliates may sell their Rule 701 shares under Rule 144 without complying with the holding period, public information, volume limitation or notice provisions of Rule 144. However, holders of Rule 701 shares are required to wait until 90 days after the date of this prospectus before selling their shares.
Warrants
As of March 31, 2010, there were warrants outstanding to purchase (a) 2,973,911 shares of our common stock at a weighted average exercise price of $16.23 per share, (b) 182,198 shares of our Series A preferred stock and an equivalent number of shares of common stock (prior to adjustment for a 15-for-1 reverse stock split of our common stock) at an exercise price of $0.30 per share, (c) 110,000 shares of our Series B preferred stock and an equivalent number of shares of common stock (prior to adjustment for a 15-for-1 reverse stock split of our common stock) at an exercise price of $0.49 per share and (d) 8,919,591 shares of our Series I preferred stock an exercise price of $0.97 per share. Upon the consummation of this offering, the warrants to purchase shares of (a) combined Series A preferred stock and common stock will become exercisable for 21,362 shares of common stock at an exercise price of $2.53 per share, (b) combined Series B preferred stock and common stock will become exercisable for 11,792 shares of common stock at an exercise price of $4.59 per share and (c) Series I preferred stock will become exercisable for 594,639 shares of common stock at an exercise price of $14.54 per share.
152
Table of Contents
Lock-up Agreements
We and our officers, directors, and holders of substantially all of our common stock, including the selling stockholders, have agreed with the underwriters not to offer, sell, dispose of or hedge any shares of our common stock or securities convertible into or exchangeable for shares of our common stock, subject to specified limited exceptions and extensions described elsewhere in this prospectus, during the period continuing through the date that is 180 days (subject to extension) after the date of this prospectus, except with the prior written consent of J.P. Morgan Securities Inc. and Goldman, Sachs & Co. on behalf of the underwriters. See “Underwriting.” J.P. Morgan Securities Inc, and Goldman, Sachs & Co. in their discretion on behalf of the underwriters, may release any of the securities subject to these lock-up agreements at any time without notice.
Registration Rights
Beginning 180 days after the date of this offering, holders of approximately 27 million shares of our common stock (including 2,188,748 shares of common stock issuable upon the conversion of our Series H preferred stock as of March 31, 2010) will be able to require us to conduct a registered public offering of their shares. In addition, such holders will be entitled to have their shares included for sale in subsequent registered offerings of our common stock. See “Certain Relationships and Related Party Transactions—Registration Rights Agreement.” Registration of such shares under the Securities Act would, except for shares held by affiliates, result in such shares becoming freely tradable without restriction under the Securities Act immediately upon the effectiveness of such registration.
153
Table of Contents
MATERIAL UNITED STATES FEDERAL INCOME TAX CONSIDERATIONS TO NON-UNITED STATES HOLDERS
The following is a summary of material United States federal income tax consequences of the purchase, ownership and disposition of our common stock to a non-United States holder that purchases shares of our common stock in this offering. For purposes of this summary, a “non-United States holder” means a beneficial owner of our common stock that is, for United States federal income tax purposes:
| Ÿ | a nonresident alien individual; |
| Ÿ | a foreign corporation (or an entity treated as a foreign corporation for United States federal income tax purposes); or |
| Ÿ | a foreign estate or foreign trust. |
In the case of a holder that is classified as a partnership for United States federal income tax purposes, the tax treatment of a partner in such partnership generally will depend upon the status of the partner and the activities of the partner and the partnership. If you are a partner in a partnership holding our common stock, then you should consult your own tax advisor.
This summary is based upon the provisions of the United States Internal Revenue Code of 1986, as amended, which we refer to as the Code, the Treasury regulations promulgated thereunder and administrative and judicial interpretations thereof, all as of the date hereof. Those authorities may change, perhaps retroactively, so as to result in United States federal income tax consequences different from those summarized below. We cannot assure you that a change in law will not alter significantly the tax considerations that we describe in this summary. We have not sought and do not plan to seek any ruling from the United States Internal Revenue Service, which we refer to as the IRS, with respect to statements made and the conclusions reached in the following summary, and there can be no assurance that the IRS or a court will agree with our statements and conclusions.
This summary does not address all aspects of United States federal income taxes that may be relevant to non-United States holders in light of their personal circumstances, and does not deal with federal taxes other than the United States federal income tax or with state, local or non-United States tax considerations. Special rules, not discussed here, may apply to certain non-United States holders, including:
| Ÿ | United States expatriates; |
| Ÿ | controlled foreign corporations; |
| Ÿ | passive foreign investment companies; |
| Ÿ | corporations that accumulate earnings to avoid United States federal income tax; and |
| Ÿ | investors in pass-through entities that are subject to special treatment under the Code. |
Such non-United States holders should consult their own tax advisors to determine the United States federal, state, local and other tax consequences that may be relevant to them.
This summary applies only to a non-United States holder that holds our common stock as a capital asset (within the meaning of Section 1221 of the Code), and assumes that no item of income or gain in respect of the common stock at any time will be effectively connected with a United States trade or business conducted by the non-United States holder.
If you are considering the purchase of our common stock, then you should consult your own tax advisor concerning the particular United States federal income tax consequences to you of the
154
Table of Contents
purchase, ownership and disposition of our common stock, as well as the consequences to you arising under United States tax laws other than the federal income tax law or under the laws of any other taxing jurisdiction.
Dividends
As discussed under the section entitled “Dividend Policy” above, we do not currently anticipate paying dividends. In the event that we do make a distribution of cash or property with respect to our common stock, any such distribution will be treated as a dividend for United States federal income tax purposes to the extent paid from our current or accumulated earnings and profits (as determined under United States federal income tax principles). Dividends paid to you generally will be subject to withholding of United States federal income tax at a 30% rate or such lower rate as may be specified by an applicable income tax treaty.
If the amount of a distribution paid on our common stock exceeds our current and accumulated earnings and profits, such excess will be allocated ratably among each share of common stock with respect to which the distribution is paid and treated first as a tax-free return of capital to the extent of your adjusted tax basis in each such share, and thereafter as capital gain from a sale or other disposition of such share of common stock that is taxed to you as described below under the heading “—Gain on Disposition of Common Stock”.
If you wish to claim the benefit of an applicable treaty rate to avoid or reduce withholding of United States federal income tax for dividends, then you must (a) provide the withholding agent with a properly completed IRS Form W-8BEN (or other applicable form) and certify under penalties of perjury that you are not a United States person and are eligible for treaty benefits, or (b) if our common stock is held through certain foreign intermediaries, satisfy the relevant certification requirements of applicable United States Treasury regulations. Special certification and other requirements apply to certain non-United States holders that act as intermediaries (including partnerships).
If you are eligible for a reduced rate of United States federal income tax pursuant to an income tax treaty, then you may obtain a refund of any excess amounts withheld by timely filing an appropriate claim for refund with the IRS.
Gain on Disposition of Common Stock
You generally will not be subject to United States federal income tax with respect to gain realized on the sale or other taxable disposition of our common stock, unless:
| Ÿ | if you are an individual, you are present in the United States for 183 days or more in the taxable year of the sale or other taxable disposition, and you have a “tax home” (as defined in the Code) in the United States; or |
| Ÿ | we are or have been during a specified testing period a “United States real property holding corporation” for United States federal income tax purposes, and certain other conditions are met. |
We believe that we have not been and are not, and we do not anticipate becoming, a “United States real property holding corporation” for United States federal income tax purposes.
Information Reporting and Backup Withholding Tax
We must report annually to the IRS and to you the amount of dividends paid to you and the amount of tax, if any, withheld with respect to such dividends. The IRS may make this information available to the tax authorities in the country in which you are resident.
155
Table of Contents
In addition, you may be subject to information reporting requirements and backup withholding tax (currently at a rate of 28%) with respect to dividends paid on, and the proceeds of disposition of, shares of our common stock, unless, generally, you certify under penalties of perjury (usually on IRS Form W-8BEN) that you are not a United States person or you otherwise establish an exemption. Additional rules relating to information reporting requirements and backup withholding tax with respect to payments of the proceeds from the disposition of shares of our common stock are as follows:
| Ÿ | If the proceeds are paid to or through the United States office of a broker, the proceeds generally will be subject to backup withholding tax and information reporting, unless you certify under penalties of perjury (usually on IRS Form W-8BEN) that you are not a United States person or you otherwise establish an exemption. |
| Ÿ | If the proceeds are paid to or through a non-United States office of a broker that is not a United States person and is not a foreign person with certain specified United States connections (a “United States-related person”), information reporting and backup withholding tax generally will not apply. |
| Ÿ | If the proceeds are paid to or through a non-United States office of a broker that is a United States person or a United States-related person, the proceeds generally will be subject to information reporting (but not to backup withholding tax), unless you certify under penalties of perjury (usually on IRS Form W-8BEN) that you are not a United States person or you otherwise establish an exemption. |
Any amounts withheld under the backup withholding tax rules may be allowed as a refund or a credit against your United States federal income tax liability, provided the required information is timely furnished by you to the IRS.
New Legislation Affecting Taxation of Common Stock Held By or Through Foreign Entities
Recently enacted legislation generally will impose a withholding tax of 30% on dividend income from our common stock and the gross proceeds of a disposition of our common stock paid to a foreign financial institution, unless such institution enters into an agreement with the United States government to collect and provide to the United States tax authorities substantial information regarding United States account holders of such institution (which would include certain equity and debt holders of such institution, as well as certain account holders that are foreign entities with United States owners). Absent any applicable exception, this legislation also generally will impose a withholding tax of 30% on dividend income from our common stock and the gross proceeds of a disposition of our common stock paid to a foreign entity that is not a foreign financial institution unless such entity provides the withholding agent with a certification identifying the substantial United States owners of the entity, which generally includes any United States person who directly or indirectly owns more than 10% of the entity. Under certain circumstances, a non-United States holder of our common stock might be eligible for refunds or credits of such taxes, and a non-United States holder might be required to file a United States federal income tax return to claim such refunds or credits. This legislation generally is effective for payments made after December 31, 2012. Investors are encouraged to consult with their own tax advisors regarding the implications of this legislation on their investment in our common stock.
THE SUMMARY OF MATERIAL UNITED STATES FEDERAL INCOME TAX CONSEQUENCES ABOVE IS INCLUDED FOR GENERAL INFORMATION PURPOSES ONLY. POTENTIAL PURCHASERS OF OUR COMMON STOCK ARE URGED TO CONSULT THEIR OWN TAX ADVISORS TO DETERMINE THE UNITED STATES FEDERAL, STATE, LOCAL AND NON-UNITED STATES TAX CONSIDERATIONS OF PURCHASING, OWNING AND DISPOSING OF OUR COMMON STOCK.
156
Table of Contents
We, the selling stockholders and the underwriters named below have entered into an underwriting agreement with respect to the shares being offered. Subject to certain conditions, each underwriter has severally agreed to purchase the number of shares indicated in the following table. J.P. Morgan Securities Inc. and Goldman, Sachs & Co. are the representatives of the underwriters.
| Underwriters |
Number of Shares | |
| J.P. Morgan Securities Inc. |
||
| Goldman, Sachs & Co. |
||
| Deutsche Bank Securities Inc. |
||
| RBC Capital Markets Corporation |
||
| Robert W. Baird & Co. Incorporated |
||
| Needham & Company, LLC |
||
| Pacific Crest Securities LLC |
||
| Total |
6,750,000 | |
The underwriters are committed to take and pay for all of the shares being offered, if any are taken, other than the shares covered by the option described below unless and until this option is exercised.
If the underwriters sell more shares than the total number set forth in the table above, the underwriters have an option to buy up to an additional 1,012,500 shares from the selling stockholders. They may exercise that option for 30 days. If any shares are purchased pursuant to this option, the underwriters will severally purchase shares in approximately the same proportion as set forth in the table above.
The following tables show the per share and total underwriting discounts and commissions to be paid to the underwriters by us and the selling stockholders. Such amounts are shown assuming both no exercise and full exercise of the underwriters’ option to purchase 1,012,500 additional shares from the selling stockholders.
Paid by Motricity
| No Exercise | Full Exercise | |||||
| Per Share |
$ | $ | — | |||
| Total |
$ | $ | — | |||
Paid by the Selling Stockholders
| No Exercise | Full Exercise | |||||
| Per Share |
$ | — | $ | |||
| Total |
$ | — | $ | |||
Shares sold by the underwriters to the public will initially be offered at the initial public offering price set forth on the cover of this prospectus. Any shares sold by the underwriters to securities dealers may be sold at a discount of up to $ per share from the initial public offering price. If all the shares are not sold at the initial public offering price, the representatives may change the offering price and the other selling terms. The offering of the shares by the underwriters is subject to receipt and acceptance and subject to the underwriters’ right to reject any order in whole or in part.
157
Table of Contents
We and our officers, directors, and holders of substantially all of our common stock, including the selling stockholders, have agreed with the underwriters, subject to certain exceptions, not to dispose of or hedge any of our or their common stock or securities convertible into or exchangeable for shares of common stock during the period from the date of this prospectus continuing through the date that is 180 days after the date of this prospectus, except with the prior written consent of J.P. Morgan Securities Inc. and Goldman, Sachs & Co. See “Shares Eligible for Future Sale” for a discussion of certain transfer restrictions.
This restriction shall not apply to (i) transfers of shares of our common stock as a bona fide gift or gifts, provided that the donee or donees thereof agree to be bound in writing by such restrictions, (ii) transfers of shares of our common stock to any affiliate or a trust for the direct or indirect benefit of the transferor or the immediate family of the transferor, provided that the affiliate or such trustee of the trust, as the case may be, agrees to be bound in writing by such restrictions, and provided further, that any such transfer shall not involve a disposition for value, and that the transferor provides at least two business days’ prior written notice to each of J.P. Morgan Securities Inc. and Goldman, Sachs & Co. if the transferor or the transferee is required to file a report under Section 16 of the Exchange Act reporting a reduction in beneficial ownership of our common stock during the restricted period described herein, (iii) our issuance of shares, or options to purchase shares, of common stock under our equity incentive plans as currently in effect, and (iv) our issuance of shares, options or warrants to purchase shares or any securities that are convertible into or exchangeable for shares of common stock in an amount not to exceed 5% of the sum of our fully-diluted common stock outstanding as of the date of the prospectus and the shares of common stock offered hereby, as consideration in connection with acquisitions by us, provided that the recipient of any such securities agrees to be bound in writing by such restrictions.
The 180-day restricted period described above will be automatically extended if: (1) during the last 17 days of the 180-day restricted period we issue an earnings release or announce material news or a material event; or (2) prior to the expiration of the 180-day restricted period, we announce that we will release earnings results during the 15-day period following the last day of the 180-day period, in which case the restrictions described above will continue to apply until the expiration of the 18-day period beginning on the issuance of the earnings release or the announcement of the material news or material event.
Prior to the offering, there has been no public market for the shares. The initial public offering price will be negotiated among us, the selling stockholders and the representatives. Among the factors to be considered in determining the initial public offering price of the shares, in addition to prevailing market conditions, will be our historical performance, estimates of our business potential and earnings prospects, an assessment of our management and the consideration of the above factors in relation to market valuation of companies in related businesses.
We have applied to list our common stock on the NASDAQ Global Market under the symbol “MOTR”.
In connection with the offering, the underwriters may purchase and sell shares of common stock in the open market. These transactions may include short sales, stabilizing transactions and purchases to cover positions created by short sales. Shorts sales involve the sale by the underwriters of a greater number of shares than they are required to purchase in the offering. “Covered” short sales are sales made in an amount not greater than the underwriters’ option to purchase additional shares from the selling stockholders in the offering. The underwriters may close out any covered short position either by exercising their option to purchase additional shares or purchasing shares in the open market. In determining the source of shares to close out the covered short position, the underwriters will consider, among other things, the price of shares available for purchase in the open market as compared to the price at which they may purchase additional shares pursuant to the option granted to them. “Naked”
158
Table of Contents
short sales are any sales in excess of such option. The underwriters must close out any naked short position by purchasing shares in the open market. A naked short position is more likely to be created if the underwriters are concerned that there may be downward pressure on the price of the common stock in the open market after pricing that could adversely affect investors who purchase in the offering. Stabilizing transactions consist of various bids for or purchases of common stock made by the underwriters in the open market prior to the completion of the offering.
The underwriters may also impose a penalty bid. This occurs when a particular underwriter repays to the underwriters a portion of the underwriting discount received by it because the representatives have repurchased shares sold by or for the account of such underwriter in stabilizing or short covering transactions.
Purchases to cover a short position and stabilizing transactions, as well as other purchases by the underwriters for their own accounts, may have the effect of preventing or retarding a decline in the market price of our common stock, and together with the imposition of the penalty bid, may stabilize, maintain or otherwise affect the market price of the common stock. As a result, the price of the common stock may be higher than the price that otherwise might exist in the open market. If these activities are commenced, they may be discontinued at any time. These transactions may be effected on the NASDAQ Global Market, in the over-the-counter market or otherwise.
The underwriters do not expect sales to discretionary accounts to exceed 5% of the total number of shares offered.
We estimate that our share of the total expenses of the offering, excluding underwriting discounts and commissions, will be approximately $7.9 million. The selling stockholders will bear the cost of all underwriting discounts, selling commissions and stock transfer taxes applicable to the sale of common stock by them.
We and the selling stockholders have agreed to indemnify the several underwriters against certain liabilities, including liabilities under the Securities Act.
Conflicts of Interest
Affiliates of Advanced Equities, Inc. (“AEI”) beneficially own more than 10% of our company. Because of this beneficial ownership and because we agreed to pay AEI an advisory fee of up to $2 million in connection with this offering, AEI may be deemed a statutory underwriter. Since AEI’s affiliates beneficially own more than 10% of our company, the underwriters are deemed to have a “conflict of interest” under Rule 2720 of the Conduct Rules of the National Association of Securities Dealers, Inc., which are overseen by the Financial Industry Regulatory Authority, Inc. Accordingly, this offering is being conducted in compliance with the applicable provisions of Rule 2720. Pursuant to that rule, the appointment of a “qualified independent underwriter” (as such term is defined in Rule 2720) is not necessary in connection with this offering as the members primarily responsible for managing the public offering do not have a conflict of interest, are not affiliates of any member that has a conflict of interest, and meet the requirements of paragraph (f)(12)(E) of Rule 2720.
Certain of the underwriters and their respective affiliates have, from time to time, performed, and may in the future perform, various financial advisory and investment banking services for us, for which they received or will receive customary fees and expenses.
Selling Restrictions
In relation to each Member State of the European Economic Area which has implemented the Prospectus Directive (each, a “Relevant Member State”), each underwriter has represented and agreed that with, effect from and including the date on which the Prospectus Directive is implemented
159
Table of Contents
in that Relevant Member State (the “Relevant Implementation Date”), it has not made and will not make an offer of shares to the public in that Relevant Member State prior to the publication of a prospectus in relation to the shares which has been approved by the competent authority in that Relevant Member State or, where appropriate, approved in another Relevant Member State and notified to the competent authority in that Relevant Member State, all in accordance with the Prospectus Directive, except that it may, with effect from and including the Relevant Implementation Date, make an offer of shares to the public in that Relevant Member State at any time:
| Ÿ | to legal entities which are authorized or regulated to operate in the financial markets or, if not so authorized or regulated, whose corporate purpose is solely to invest in securities; |
| Ÿ | to any legal entity which has two or more of (1) an average of at least 250 employees during the last financial year; (2) a total balance sheet of more than €43,000,000 and (3) an annual net turnover of more than €50,000,000, as shown in its last annual or consolidated accounts; |
| Ÿ | to fewer than 100 natural or legal persons (other than qualified investors as defined in the Prospectus Directive), subject to obtaining the prior consent of the representatives for any such offer; or |
| Ÿ | in any other circumstances which do not require the publication by the Issuer of a prospectus pursuant to Article 3 of the Prospectus Directive. |
For the purposes of this provision, the expression an “offer of shares to the public” in relation to any shares in any Relevant Member State means the communication in any form and by any means of sufficient information on the terms of the offer and the shares to be offered so as to enable an investor to decide to purchase or subscribe the shares, as the same may be varied in that Relevant Member State by any measure implementing the Prospectus Directive in that Relevant Member State and the expression Prospectus Directive means Directive 2003/71/EC and includes any relevant implementing measure in each Relevant Member State.
Each underwriter has represented and agreed that:
| Ÿ | it has only communicated or caused to be communicated and will only communicate or cause to be communicated, an invitation or inducement to engage in investment activity (within the meaning of Section 21 of the Financial Services and Markets Act 2000 (the “FSMA”)) received by it in connection with the issue or sale of the shares in circumstances in which Section 21(1) of the FSMA does not apply to the Issuer; and |
| Ÿ | it has complied and will comply with all applicable provisions of the FSMA with respect to anything done by it in relation to the shares in, from or otherwise involving the United Kingdom. |
The shares may not be offered or sold by means of any document other than (i) in circumstances which do not constitute an offer to the public within the meaning of the Companies Ordinance (Cap.32, Laws of Hong Kong), or (ii) to “professional investors” within the meaning of the Securities and Futures Ordinance (Cap.571, Laws of Hong Kong) and any rules made thereunder, or (iii) in other circumstances which do not result in the document being a “prospectus” within the meaning of the Companies Ordinance (Cap.32, Laws of Hong Kong), and no advertisement, invitation or document relating to the shares may be issued or may be in the possession of any person for the purpose of issue (in each case whether in Hong Kong or elsewhere), which is directed at, or the contents of which are likely to be accessed or read by, the public in Hong Kong (except if permitted to do so under the laws of Hong Kong) other than with respect to shares which are or are intended to be disposed of only to persons outside Hong Kong or only to “professional investors” within the meaning of the Securities and Futures Ordinance (Cap.571, Laws of Hong Kong) and any rules made thereunder.
This prospectus has not been registered as a prospectus with the Monetary Authority of Singapore. Accordingly, this prospectus and any other document or material in connection with the
160
Table of Contents
offer or sale, or invitation for subscription or purchase, of the shares may not be circulated or distributed, nor may the shares be offered or sold, or be made the subject of an invitation for subscription or purchase, whether directly or indirectly, to persons in Singapore other than (i) to an institutional investor under Section 274 of the Securities and Futures Act, Chapter 289 of Singapore (the “SFA”), (ii) to a relevant person, or any person pursuant to Section 275(1A), and in accordance with the conditions, specified in Section 275 of the SFA, or (iii) otherwise pursuant to, and in accordance with the conditions of, any other applicable provision of the SFA.
Where the shares are subscribed or purchased under Section 275 by a relevant person which is: (a) a corporation (which is not an accredited investor) the sole business of which is to hold investments and the entire share capital of which is owned by one or more individuals, each of whom is an accredited investor; or (b) a trust (where the trustee is not an accredited investor) whose sole purpose is to hold investments and each beneficiary is an accredited investor, shares, debentures and units of shares and debentures of that corporation or the beneficiaries’ rights and interest in that trust shall not be transferable for six months after that corporation or that trust has acquired the shares under Section 275 except: (1) to an institutional investor under Section 274 of the SFA or to a relevant person, or any person pursuant to Section 275(1A), and in accordance with the conditions, specified in Section 275 of the SFA; (2) where no consideration is given for the transfer; or (3) by operation of law.
The shares have not been and will not be registered under the Financial Instruments and Exchange Law of Japan (the “Financial Instruments and Exchange Law”) and each underwriter has agreed that it will not offer or sell any securities, directly or indirectly, in Japan or to, or for the benefit of, any resident of Japan (which term as used herein means any person resident in Japan, including any corporation or other entity organized under the laws of Japan), or to others for re-offering or resale, directly or indirectly, in Japan or to a resident of Japan, except pursuant to an exemption from the registration requirements of, and otherwise in compliance with, the Financial Instruments and Exchange Law and any other applicable laws, regulations and ministerial guidelines of Japan.
161
Table of Contents
The validity of the shares of common stock offered hereby will be passed upon for us by Kirkland & Ellis LLP, New York, New York. Certain current and former partners of Kirkland & Ellis LLP collectively hold less than 1% of our common stock. Certain legal matters in connection with this offering will be passed upon for the underwriters by Simpson Thacher & Bartlett LLP, Palo Alto, California.
The consolidated financial statements of Motricity, Inc. as of December 31, 2008 and 2009 and for each of the three years in the period ended December 31, 2009 included in this prospectus have been so included in reliance on the report of PricewaterhouseCoopers LLP, an independent registered public accounting firm, given on the authority of said firm as experts in auditing and accounting.
162
Table of Contents
WHERE YOU CAN FIND MORE INFORMATION
We have filed a registration statement, of which this prospectus is a part, on Form S-1 with the SEC relating to this offering. This prospectus does not contain all of the information in the registration statement and the exhibits and financial statements included with the registration statement. References in this prospectus to any of our contracts, agreements or other documents are not necessarily complete, and you should refer to the exhibits attached to the registration statement for copies of the actual contracts, agreements or documents.
You may read and copy the registration statement, the related exhibits and other material we file with the SEC at the SEC’s Public Reference Room in Washington, D.C. at 100 F Street, N.E., Washington, D.C. 20549. You can also request copies of those documents, upon payment of a duplicating fee, by writing to the SEC. Please call the SEC at 1-800-SEC-0330 for further information on the operation of the Public Reference Room. The SEC also maintains an Internet site that contains reports, proxy and information statements and other information regarding issuers that file with the SEC. The web site address is http://www.sec.gov. You may also request a copy of these filings, at no cost, by writing to us at 601 108th Avenue Northeast, Suite 800, Bellevue, WA 98004 or telephoning us at (425) 957-6200.
Upon the effectiveness of the registration statement, we will be subject to the informational requirements of the Exchange Act and, in accordance with the Exchange Act, will file periodic reports, proxy and information statements and other information with the SEC. Such annual, quarterly and current reports, proxy and information statements and other information can be inspected and copied at the locations set forth above. We will report our financial statements on a year ended December 31. We intend to furnish our stockholders with annual reports containing consolidated financial statements audited by our independent certified public accountants and with quarterly reports containing unaudited consolidated financial statements for each of the first three quarters of each fiscal year.
163
Table of Contents
INDEX TO CONSOLIDATED FINANCIAL STATEMENTS
Motricity, Inc.
| Page | ||
| F-2 | ||
| Consolidated Balance Sheets as of December 31, 2008 and 2009 and March 31, 2010 (unaudited) |
F-3 | |
| F-4 | ||
| F-5 | ||
| F-7 | ||
| F-8 | ||
| Financial Statement Schedule: |
||
| F-46 | ||
F-1
Table of Contents
Report of Independent Registered Public Accounting Firm
To the Board of Directors and Stockholders of Motricity, Inc.
The reverse stock split and amendment and restatement to the certificate of incorporation described in Note 17 to the financial statements have not been consummated as of June 6, 2010. When they have been consummated, we will be in a position to furnish the following report:
“In our opinion, the accompanying consolidated balance sheets and the related consolidated statements of operations, of changes in stockholders’ deficit and of cash flows present fairly, in all material respects, the consolidated financial position of Motricity, Inc. and its subsidiaries at December 31, 2009 and 2008, and the results of their operations and their cash flows for each of the three years in the period ended December 31, 2009 in conformity with accounting principles generally accepted in the United States of America. In addition, in our opinion, the financial statement schedule appearing on page F-46 presents fairly, in all material respects, the information set forth therein when read in conjunction with the related consolidated financial statements. These financial statements and financial statement schedule are the responsibility of the Company’s management. Our responsibility is to express an opinion on these financial statements and financial statement schedule based on our audits. We conducted our audits of these statements in accordance with the standards of the Public Company Accounting Oversight Board (United States). Those standards require that we plan and perform the audit to obtain reasonable assurance about whether the financial statements are free of material misstatement. An audit includes examining, on a test basis, evidence supporting the amounts and disclosures in the financial statements, assessing the accounting principles used and significant estimates made by management, and evaluating the overall financial statement presentation. We believe that our audits provide a reasonable basis for our opinion.”
/s/ PricewaterhouseCoopers LLP
Seattle, Washington
March 5, 2010, except for Note 17, as to which the date is April 25, 2010
F-2
Table of Contents
Consolidated Balance Sheets
(in thousands, except share data)
| December 31, | March 31, 2010 |
Pro Forma | ||||||||||||||
| 2008 | 2009 | March 31, 2010 |
||||||||||||||
| Assets | (Unaudited) |
|||||||||||||||
| Current assets |
||||||||||||||||
| Cash and cash equivalents |
$ | 14,299 | $ | 35,945 | $ | 25,408 | ||||||||||
| Restricted short-term investments |
950 | 1,375 | 1,375 | |||||||||||||
| Marketable securities |
5,446 | — | — | |||||||||||||
| Accounts receivable, net of allowance for doubtful accounts of $997, $272 and $300 (unaudited) at December 31, 2008 and 2009 and March 31, 2010, respectively |
38,576 | 17,306 | 16,951 | |||||||||||||
| Assets held for sale |
1,700 | 1,606 | — | |||||||||||||
| Prepaid expenses and other current assets |
6,485 | 3,542 | 3,274 | |||||||||||||
| Total current assets |
67,456 | 59,774 | 47,008 | |||||||||||||
| Property and equipment, net |
37,147 | 26,717 | 25,832 | |||||||||||||
| Goodwill |
74,658 | 74,658 | 74,658 | |||||||||||||
| Intangible assets, net |
14,082 | 10,692 | 11,458 | |||||||||||||
| Other assets |
2,104 | 2,335 | 2,562 | |||||||||||||
| Total assets |
$ | 195,447 | $ | 174,176 | $ | 161,518 | ||||||||||
| Liabilities, redeemable preferred stock and stockholders’ equity (deficit) |
||||||||||||||||
| Current liabilities |
||||||||||||||||
| Accounts payable |
$ | 10,706 | $ | 9,585 | $ | 7,686 | $ | 7,686 | ||||||||
| Accrued compensation |
5,420 | 9,282 | 6,254 | 6,254 | ||||||||||||
| Accrued expenses |
3,542 | 2,648 | 2,754 | 2,754 | ||||||||||||
| Bank borrowings, current portion |
8,208 | — | — | — | ||||||||||||
| Deferred revenue, current portion |
7,501 | 7,771 | 4,561 | 4,561 | ||||||||||||
| Capital lease obligations, current portion |
169 | — | — | — | ||||||||||||
| Other current liabilities |
1,212 | 2,185 | 2,294 | 2,294 | ||||||||||||
| Total current liabilities |
36,758 | 31,471 | 23,549 | 23,549 | ||||||||||||
| Bank borrowings, net of current portion |
1,556 | — | — | — | ||||||||||||
| Deferred revenue, net of current portion |
1,824 | 4,013 | 351 | 351 | ||||||||||||
| Capital lease obligations, net of current portion |
1,678 | — | — | — | ||||||||||||
| Redeemable preferred stock warrants |
3,517 | 5,012 | 5,273 | — | ||||||||||||
| Deferred tax liability |
1,776 | 3,760 | 4,228 | 4,228 | ||||||||||||
| Other noncurrent liabilities |
4,070 | 1,345 | 655 | 655 | ||||||||||||
| Total liabilities |
51,179 | 45,601 | 34,056 | 28,783 | ||||||||||||
| Commitments and contingencies (Note 7) |
||||||||||||||||
| Redeemable preferred stock |
394,135 | 417,396 | 423,624 | 51,028 | ||||||||||||
| Stockholders’ equity (deficit) |
||||||||||||||||
| Preferred stock, $0.001 par value; 350,000,000 total preferred and redeemable preferred shares authorized; 7,338,769 preferred shares issued and outstanding |
17,393 | 17,393 | 17,393 | — | ||||||||||||
| Common stock, $0.001 par value; 625,000,000 shares authorized; 6,915,021, 7,633,786 and 7,741,412 (unaudited) shares issued and outstanding at December 31, 2008 and 2009 and March 31, 2010, respectively |
104 | 115 | 116 | 140 | ||||||||||||
| Additional paid-in-capital |
— | — | — | 411,523 | ||||||||||||
| Accumulated deficit |
(267,381 | ) | (306,443 | ) | (313,698 | ) | (329,983 | ) | ||||||||
| Accumulated other comprehensive income |
17 | 114 | 27 | 27 | ||||||||||||
| Total stockholders’ equity (deficit) |
(249,867 | ) | (288,821 | ) | (296,162 | ) | 81,707 | |||||||||
| Total liabilities, redeemable preferred stock and stockholders’ equity (deficit) |
$ | 195,447 | $ | 174,176 | $ | 161,518 | $ | 161,518 | ||||||||
The accompanying notes are an integral part of these consolidated financial statements.
F-3
Table of Contents
Consolidated Statements of Operations
(in thousands, except share data and per share amounts)
| Year Ended December 31, | Three Months Ended March 31, |
|||||||||||||||||||
| 2007 | 2008 | 2009 | 2009 | 2010 | ||||||||||||||||
| (Unaudited) | ||||||||||||||||||||
| Revenue |
||||||||||||||||||||
| Managed services |
$ | 31,772 | $ | 85,677 | $ | 81,403 | $ | 20,222 | $ | 20,881 | ||||||||||
| Professional services |
3,399 | 17,474 | 32,292 | 3,054 | 8,199 | |||||||||||||||
| Total revenues |
35,171 | 103,151 | 113,695 | 23,276 | 29,080 | |||||||||||||||
| Operating expenses |
||||||||||||||||||||
| Direct third-party expenses |
3,709 | 5,451 | 9,485 | 1,171 | 1,305 | |||||||||||||||
| Datacenter and network operations, excluding depreciation |
9,468 | 33,000 | 31,786 | 8,683 | 8,034 | |||||||||||||||
| Product development and sustainment, excluding depreciation |
16,229 | 52,261 | 31,389 | 7,677 | 8,182 | |||||||||||||||
| Sales and marketing, excluding depreciation |
7,119 | 10,228 | 11,900 | 2,989 | 3,655 | |||||||||||||||
| General and administrative, excluding depreciation |
10,334 | 26,052 | 20,841 | 5,175 | 5,264 | |||||||||||||||
| Depreciation and amortization |
10,322 | 21,559 | 13,208 | 3,777 | 3,041 | |||||||||||||||
| Restructuring |
1,283 | 3,236 | 2,058 | 235 | 407 | |||||||||||||||
| Goodwill and long-lived asset impairment charges |
26,867 | 29,130 | 5,806 | — | — | |||||||||||||||
| Abandoned transaction charge |
2,600 | — | — | — | — | |||||||||||||||
| Total operating expenses |
87,931 | 180,917 | 126,473 | 29,707 | 29,888 | |||||||||||||||
| Operating loss |
(52,760 | ) | (77,766 | ) | (12,778 | ) | (6,431 | ) | (808 | ) | ||||||||||
| Other income (expense), net |
||||||||||||||||||||
| Other income (expense) |
79 | 1,892 | (1,657 | ) | (82 | ) | (258 | ) | ||||||||||||
| Interest and investment income, net |
2,157 | 1,315 | 250 | 80 | — | |||||||||||||||
| Interest expense |
(1,081 | ) | (493 | ) | (220 | ) | (94 | ) | — | |||||||||||
| Other income (expense), net |
1,155 | 2,714 | (1,627 | ) | (96 | ) | (258 | ) | ||||||||||||
| Loss from continuing operations, before income tax |
(51,605 | ) | (75,052 | ) | (14,405 | ) | (6,527 | ) | (1,066 | ) | ||||||||||
| Provision for income taxes |
— | 1,776 | 1,896 | 444 | 467 | |||||||||||||||
| Loss from continuing operations |
(51,605 | ) | (76,828 | ) | (16,301 | ) | (6,971 | ) | (1,533 | ) | ||||||||||
| Loss from discontinued operations |
(24,928 | ) | (1,072 | ) | — | — | — | |||||||||||||
| Loss from sale of discontinued operations |
(1,360 | ) | (127 | ) | — | — | — | |||||||||||||
| Net loss |
(77,893 | ) | (78,027 | ) | (16,301 | ) | (6,971 | ) | (1,533 | ) | ||||||||||
| Accretion of redeemable preferred stock |
(7,399 | ) | (21,729 | ) | (23,261 | ) | (5,815 | ) | (6,228 | ) | ||||||||||
| Series D1 preferred dividends |
(696 | ) | (698 | ) | (695 | ) | (172 | ) | (172 | ) | ||||||||||
| Net loss attributable to common stockholders |
$ | (85,988 | ) | $ | (100,454 | ) | $ | (40,257 | ) | $ | (12,958 | ) | $ | (7,933 | ) | |||||
| Net loss per share attributable to common stockholders – basic and diluted |
||||||||||||||||||||
| Continuing operations |
$ | (10.30 | ) | $ | (16.99 | ) | $ | (6.85 | ) | $ | (2.20 | ) | $ | (1.38 | ) | |||||
| Discontinued operations |
(4.54 | ) | (0.20 | ) | — | — | — | |||||||||||||
| Total net loss per share attributable to common stockholders |
$ | (14.84 | ) | $ | (17.19 | ) | $ | (6.85 | ) | $ | (2.20 | ) | $ | (1.38 | ) | |||||
| Weighted-average common shares outstanding – basic and diluted |
5,795,940 | 5,843,489 | 5,878,368 | 5,886,763 | 5,753,047 | |||||||||||||||
| Pro forma net loss per share attributable to common stockholders – basic and diluted (unaudited) |
||||||||||||||||||||
| Continuing operations |
$ | (0.84 | ) | $ | (0.48 | ) | ||||||||||||||
| Discontinued operations |
— | — | ||||||||||||||||||
| Total pro forma net loss per share attributable to common stockholders |
$ | (0.84 | ) | $ | (0.48 | ) | ||||||||||||||
| Pro forma weighted-average common shares outstanding – basic and diluted (unaudited) |
37,106,340 | 37,468,098 | ||||||||||||||||||
| Depreciation and amortization by function |
||||||||||||||||||||
| Datacenter and network operations |
$ | 7,310 | $ | 16,824 | $ | 8,890 | $ | 2,497 | $ | 1,992 | ||||||||||
| Product development and sustainment |
1,548 | 2,237 | 1,962 | 586 | 428 | |||||||||||||||
| Sales and marketing |
307 | 2,075 | 1,960 | 572 | 524 | |||||||||||||||
| General and administrative |
1,157 | 423 | 396 | 122 | 97 | |||||||||||||||
| Total depreciation and amortization |
$ | 10,322 | $ | 21,559 | $ | 13,208 | $ | 3,777 | $ | 3,041 | ||||||||||
The accompanying notes are an integral part of these consolidated financial statements.
F-4
Table of Contents
Consolidated Statements of Changes in Stockholders’ Deficit
(in thousands, except share data and per share amounts)
| Preferred Stock | Common Stock | Additional Paid-in Capital |
Accumulated Deficit |
Accumulated Other Comprehensive Income (Loss) |
Total | |||||||||||||||||||||
| Shares | Amount | Shares | Amount | |||||||||||||||||||||||
| Balance as of December 31, 2006 |
7,338,769 | $ | 17,393 | 6,290,204 | $ | 94 | $ | 283 | $ | (105,832 | ) | $ | (80 | ) | $ | (88,142 | ) | |||||||||
| Other comprehensive loss: |
||||||||||||||||||||||||||
| Net loss |
— | — | — | — | — | (77,893 | ) | — | (77,893 | ) | ||||||||||||||||
| Foreign currency translation adjustment |
— | — | — | — | — | — | 69 | 69 | ||||||||||||||||||
| Other comprehensive loss |
(77,824 | ) | ||||||||||||||||||||||||
| Restricted stock activity |
— | — | 269,599 | 4 | 6 | — | — | 10 | ||||||||||||||||||
| Exercise of common stock options |
— | — | 74,553 | 2 | 104 | — | — | 106 | ||||||||||||||||||
| Stock-based compensation expense |
— | — | — | — | 688 | — | — | 688 | ||||||||||||||||||
| Issuance of common stock warrant for debt facility |
— | — | — | — | 408 | — | — | 408 | ||||||||||||||||||
| Proceeds from warrants issued in Series H financing, net of issuance costs |
— | — | — | — | 1,710 | — | — | 1,710 | ||||||||||||||||||
| Accretion of redeemable preferred stock |
— | — | — | — | (5,813 | ) | (1,586 | ) | — | (7,399 | ) | |||||||||||||||
| Proceeds from warrants issued in Series I financing, net of issuance costs |
— | — | — | — | 15,428 | — | — | 15,428 | ||||||||||||||||||
| Surrender of common stock warrants from placement agent |
— | — | — | — | (209 | ) | — | — | (209 | ) | ||||||||||||||||
| Issuance of common stock warrant to placement agent |
— | — | — | — | 115 | — | — | 115 | ||||||||||||||||||
| Issuance of common stock warrant to stockholder |
— | — | — | — | 2,599 | — | — | 2,599 | ||||||||||||||||||
| Balance as of December 31, 2007 |
7,338,769 | 17,393 | 6,634,356 | 100 | 15,319 | (185,311 | ) | (11 | ) | (152,510 | ) | |||||||||||||||
| Other comprehensive loss: |
||||||||||||||||||||||||||
| Net loss |
— | — | — | — | — | (78,027 | ) | — | (78,027 | ) | ||||||||||||||||
| Foreign currency translation adjustment |
— | — | — | — | — | — | 28 | 28 | ||||||||||||||||||
| Other comprehensive loss |
(77,999 | ) | ||||||||||||||||||||||||
| Restricted stock activity |
— | — | 177,833 | 2 | 2 | — | — | 4 | ||||||||||||||||||
| Exercise of common stock options |
— | — | 102,832 | 2 | 21 | — | — | 23 | ||||||||||||||||||
| Stock-based compensation expense |
— | — | — | — | 2,344 | — | — | 2,344 | ||||||||||||||||||
| Accretion of redeemable preferred stock |
— | — | — | — | (17,686 | ) | (4,043 | ) | — | (21,729 | ) | |||||||||||||||
| Balance as of December 31, 2008 |
7,338,769 | 17,393 | 6,915,021 | 104 | — | (267,381 | ) | 17 | (249,867 | ) | ||||||||||||||||
F-5
Table of Contents
Motricity, Inc.
Consolidated Statements of Changes in Stockholders’ Deficit (continued)
(in thousands, except share data and per share amounts)
| Preferred Stock | Common Stock | Additional Paid-in Capital |
Accumulated Deficit |
Accumulated Other Comprehensive Income (Loss) |
Total | |||||||||||||||||||||||
| Shares | Amount | Shares | Amount | |||||||||||||||||||||||||
| Balance as of December 31, 2008 |
7,338,769 | $ | 17,393 | 6,915,021 | $ | 104 | $ | — | $ | (267,381 | ) | $ | 17 | $ | (249,867 | ) | ||||||||||||
| Other comprehensive loss: |
||||||||||||||||||||||||||||
| Net loss |
— | — | — | — | — | (16,301 | ) | — | (16,301 | ) | ||||||||||||||||||
| Foreign currency translation adjustment |
— | — | — | — | — | — | 97 | 97 | ||||||||||||||||||||
| Other comprehensive loss |
(16,204 | ) | ||||||||||||||||||||||||||
| Restricted stock activity |
— | — | 855,770 | 13 | (13 | ) | — | — | — | |||||||||||||||||||
| Exercise of common stock options |
— | — | 51,796 | 1 | 16 | — | — | 17 | ||||||||||||||||||||
| Repurchase of outstanding common stock |
— | — | (166,667 | ) | (3 | ) | (1,247 | ) | — | — | (1,250 | ) | ||||||||||||||||
| Settlement of shareholder note receivable |
— | — | (22,134 | ) | — | (435 | ) | — | — | (435 | ) | |||||||||||||||||
| Stock-based compensation expense |
— | — | — | — | 2,179 | — | — | 2,179 | ||||||||||||||||||||
| Accretion of redeemable preferred stock |
— | — | — | — | (500 | ) | (22,761 | ) | — | (23,261 | ) | |||||||||||||||||
| Balance as of December 31, 2009 |
7,338,769 | 17,393 | 7,633,786 | 115 | — | (306,443 | ) | 114 | (288,821 | ) | ||||||||||||||||||
| Other comprehensive loss: |
||||||||||||||||||||||||||||
| Net loss (unaudited) |
— | — | — | — | — | (1,533 | ) | (1,533 | ) | |||||||||||||||||||
| Foreign currency translation adjustment (unaudited) |
— | — | — | — | — | — | (87 | ) | (87 | ) | ||||||||||||||||||
| Other comprehensive loss (unaudited) |
(1,620 | ) | ||||||||||||||||||||||||||
| Restricted stock activity (unaudited) |
— | — | 100,459 | 1 | (1 | ) | — | — | — | |||||||||||||||||||
| Exercise of common stock options (unaudited) |
— | — | 7,167 | — | 2 | — | — | 2 | ||||||||||||||||||||
| Stock-based compensation expense (unaudited) |
— | — | — | — | 505 | — | — | 505 | ||||||||||||||||||||
| Accretion of redeemable preferred stock (unaudited) |
— | — | — | — | (506 | ) | (5,722 | ) | — | (6,228 | ) | |||||||||||||||||
| Balance as of March 31, 2010 (unaudited) |
7,338,769 | $ | 17,393 | 7,741,412 | $ | 116 | $ | 0 | $ | (313,698 | ) | $ | 27 | $ | (296,162 | ) | ||||||||||||
The accompanying notes are an integral part of these consolidated financial statements.
F-6
Table of Contents
Consolidated Statements of Cash Flows
(in thousands)
| Year Ended December 31, | Three Months Ended March 31, |
|||||||||||||||||||
| 2007 | 2008 | 2009 | 2009 | 2010 | ||||||||||||||||
| (Unaudited) | ||||||||||||||||||||
| Cash flows from operating activities |
||||||||||||||||||||
| Net loss |
$ | (77,893 | ) | $ | (78,027 | ) | $ | (16,301 | ) | $ | (6,971 | ) | $ | (1,533 | ) | |||||
| Adjustments to reconcile net loss to net cash provided by (used in) operating activities: |
||||||||||||||||||||
| Loss from sale of discontinued operations |
1,360 | 127 | — | — | — | |||||||||||||||
| Depreciation and amortization |
10,864 | 21,559 | 13,208 | 3,777 | 3,041 | |||||||||||||||
| Change in fair value of redeemable preferred stock warrants |
(310 | ) | (283 | ) | 1,495 | (46 | ) | 260 | ||||||||||||
| Loss on disposition of assets held for sale |
— | — | — | — | 407 | |||||||||||||||
| Goodwill and long-lived asset impairment charges |
29,718 | 29,130 | 5,806 | — | — | |||||||||||||||
| Stock-based compensation expense |
688 | 2,344 | 2,179 | 532 | 505 | |||||||||||||||
| Deferred tax liability |
— | 1,776 | 1,984 | 444 | 467 | |||||||||||||||
| Amortization of discount on investments, net |
(19 | ) | (11 | ) | 21 | 8 | — | |||||||||||||
| Abandoned transaction charge |
2,600 | — | — | — | — | |||||||||||||||
| Amortization of channel acquisition expense |
315 | — | — | — | — | |||||||||||||||
| Other non-cash adjustments |
(83 | ) | 901 | (107 | ) | 56 | 12 | |||||||||||||
| Changes in operating assets and liabilities |
||||||||||||||||||||
| Accounts receivable |
(11,883 | ) | 2,035 | 20,738 | 7,941 | 355 | ||||||||||||||
| Prepaid expenses and other assets |
2,677 | 1,232 | 3,568 | (1,987 | ) | 269 | ||||||||||||||
| Other long-term assets |
53 | 136 | (1,905 | ) | 110 | 1,107 | ||||||||||||||
| Accounts payable and accrued expenses |
(399 | ) | (16,772 | ) | (44 | ) | (5,020 | ) | (6,046 | ) | ||||||||||
| Deferred revenue |
813 | 7,108 | 2,459 | (638 | ) | (6,872 | ) | |||||||||||||
| Net cash provided by (used in) operating activities |
(41,499 | ) | (28,745 | ) | 33,101 | (1,794 | ) | (8,028 | ) | |||||||||||
| Cash flows from investing activities |
||||||||||||||||||||
| Purchase of property and equipment |
(4,594 | ) | (8,389 | ) | (4,890 | ) | (2,243 | ) | (1,186 | ) | ||||||||||
| Capitalization of software development costs |
— | — | — | — | (1,162 | ) | ||||||||||||||
| Acquisition of businesses, net of cash acquired |
(136,985 | ) | (1,118 | ) | — | — | — | |||||||||||||
| Proceeds of assets held for sale |
— | — | 874 | — | 1,199 | |||||||||||||||
| Acquisition of assets held for sale |
— | (2,042 | ) | (1,301 | ) | — | — | |||||||||||||
| Proceeds from sale of discontinued operations |
— | 2,250 | 300 | — | — | |||||||||||||||
| Cash included as assets held for sale |
(109 | ) | — | — | — | — | ||||||||||||||
| Sale of investments |
62,079 | — | — | — | — | |||||||||||||||
| Purchase of investments |
(53,898 | ) | — | — | — | — | ||||||||||||||
| Maturity of held-to-maturity investments |
— | 6,200 | 5,425 | 2,335 | — | |||||||||||||||
| Purchase of held-to-maturity investments |
— | (11,636 | ) | — | — | — | ||||||||||||||
| Net cash provided by (used in) investing activities |
(133,507 | ) | (14,735 | ) | 408 | 92 | (1,149 | ) | ||||||||||||
| Cash flows from financing activities |
||||||||||||||||||||
| Borrowings from bank |
29,825 | 4,756 | — | — | — | |||||||||||||||
| Repayment of bank borrowings |
(15,602 | ) | (14,427 | ) | (9,875 | ) | (833 | ) | — | |||||||||||
| Proceeds from exercise of common stock options |
105 | 22 | 17 | — | 2 | |||||||||||||||
| Proceeds from restricted stock |
10 | 5 | — | — | — | |||||||||||||||
| Proceeds from issuance of preferred stock, net of issuance costs |
221,687 | — | — | — | — | |||||||||||||||
| Prepaid offering costs |
— | — | |
(423 |
) |
— | (1,334 | ) | ||||||||||||
| Restricted short-term investments |
250 | — | (425 | ) | — | — | ||||||||||||||
| Repurchase of outstanding common stock |
— | — | (1,250 | ) | — | — | ||||||||||||||
| Net cash provided by (used in) financing activities |
236,275 | (9,644 | ) | (11,956 | ) | (833 | ) | (1,332 | ) | |||||||||||
| Effect of foreign currency |
7 | 5 | 93 | (34 | ) | (28 | ) | |||||||||||||
| Net increase (decrease) in cash and cash equivalents |
61,276 | (53,119 | ) | 21,646 | (2,569 | ) | (10,537 | ) | ||||||||||||
| Cash and cash equivalents at beginning of period |
6,142 | 67,418 | 14,299 | 14,299 | 35,945 | |||||||||||||||
| Cash and cash equivalents at end of period |
$ | 67,418 | $ | 14,299 | $ | 35,945 | $ | 11,730 | $ | 25,408 | ||||||||||
| Supplemental disclosure of cash flow information |
||||||||||||||||||||
| Cash paid for interest |
$ | 1,211 | $ | 562 | $ | 110 | $ | 88 | $ | — | ||||||||||
| Supplemental noncash information |
||||||||||||||||||||
| Sale of eReader for note receivable |
$ | 2,500 | — | — | — | — | ||||||||||||||
The accompanying notes are an integral part of these consolidated financial statements.
F-7
Table of Contents
Notes to Consolidated Financial Statements
(amounts in thousands, except share data and per share amounts)
| 1. | Organization |
Motricity, Inc. (the “Company”) is a leading provider of mobile data solutions and services that enable wireless carriers to deliver high value mobile data services to their subscribers. We provide a comprehensive suite of hosted, managed service offerings, including mobile web portal, storefront, messaging, and billing support and settlement, which enable wireless carriers to deliver customized, carrier-branded mobile data services to their wireless subscribers.
Motricity, Inc., a Delaware corporation, was incorporated on March 17, 2004 under the name Power By Hand, Inc. (“PBH, Inc.”). PBH, Inc. was formed as a new entity to be the surviving corporation in the merger of Pinpoint Networks, Inc. (the acquiring corporation for accounting purposes) and Power By Hand Holdings, LLC (“PBH Holdings”), which occurred on April 30, 2004. On October 29, 2004, we changed our name from Power By Hand, Inc. to Motricity, Inc.
In 2006, we acquired all of the outstanding equity of GoldPocket Wireless, Inc. (“GPW”), a Delaware corporation, which was a provider of premium messaging services, primarily for media and entertainment companies.
On December 28, 2007, we acquired the assets of the mobile division of InfoSpace, Inc. (“InfoSpace Mobile”). Located in Bellevue, Washington, InfoSpace Mobile was a provider of mobile content solutions and services for the wireless industry.
| 2. | Summary of Significant Accounting Policies |
Basis of Presentation
The consolidated financial statements include the accounts of the Company and our wholly-owned subsidiaries. Intercompany balances and transactions have been eliminated upon consolidation.
In connection with a business strategy reassessment initiated in 2007, we exited two lines of business in 2007 and 2008, the results of which are reflected as discontinued operations in our operating results. The discontinued lines of business were direct to consumer (“D2C”), which was sold in two transactions in 2007 and in 2008, and media and entertainment (“M&E”), which was discontinued in 2008. We have reclassified all of the revenues and associated operating expenses which would no longer be incurred upon disposition of the business to discontinued operations for all periods presented. Any gains and losses from the sale of the businesses are also reported in discontinued operations.
Unaudited Interim Financial Information
The accompanying interim balance sheet as of March 31, 2010, the consolidated statements of operations and the statements of cash flows for the three months ended March 31, 2009 and 2010, and the consolidated statement of changes in stockholders’ deficit for the three months ended March 31, 2010 are unaudited. These unaudited interim consolidated financial statements have been prepared in accordance with accounting principles generally accepted in the United States. In the opinion of management, the unaudited interim consolidated financial statements have been prepared on the same basis as the audited consolidated financial statements and include all adjustments consisting
F-8
Table of Contents
Motricity, Inc.
Notes to Consolidated Financial Statements
(amounts in thousands, except share data and per share amounts)
only of normal recurring adjustments, necessary for the fair presentation of our financial position as of March 31, 2010, the results of operations and cash flows for the three months ended March 31, 2009 and 2010 and stockholders’ deficit for the three months ended March 31, 2010. The results of operations for the three months ended March 31, 2010 are not necessarily indicative of the results to be expected for the full year or for any other period.
Unaudited Pro Forma Information
The unaudited pro forma balance sheet data as of March 31, 2010 assumes the conversion of all outstanding shares of the Company’s Series A, B, C, D, E, F, G and I redeemable preferred stock and Series D1 preferred stock, since we have received the necessary consents for such conversion, into an aggregate of 24,101,205 shares of common stock upon completion of the Company’s initial public offering assuming a $15 per share offering price. In addition, the unaudited pro forma balance sheet assumes the reclassification of the preferred stock warrant liabilities to additional paid-in capital, because upon closing of the initial public offering the preferred stock underlying warrants, along with all such series of outstanding preferred stock, will be converted to common stock.
The unaudited pro forma balance sheet does not reflect any proceeds from the proposed initial public offering.
Pro forma net loss per share attributable to common stockholders is computed using the weighted-average number of common shares outstanding, including the pro forma effects of the items in the foregoing paragraph and the issuance of shares to be sold in this offering, effective upon the closing of the Company’s proposed initial public offering as if they had occurred at the beginning of the period, or the original issuance date, if later.
The unaudited pro forma balance sheet and the pro forma net loss per share attributable to common stockholders also reflect stock-based compensation expense due to the vesting of restricted stock triggered by the closing of the proposed public offering.
Use of Estimates
The preparation of consolidated financial statements in conformity with the generally accepted accounting principles in the United States (“U.S. GAAP”) requires management to make estimates and assumptions in certain circumstances that affect the reported amounts of assets and liabilities and disclosures of contingent assets and liabilities at the date of the consolidated financial statements and the reported amounts of revenues and expenses during the reporting period. The more significant estimates include the recognition of revenues, valuation of deferred tax assets, tangible and intangible assets, goodwill and long-lived asset impairment charges, litigation and settlement costs and other loss contingencies and the allowance for doubtful accounts receivable. Actual results could differ from those estimates.
Revenue Recognition
We derive our revenues from contracts which include individual or varying combinations of our managed services and often include professional service fees to customize and implement the specific software platform solutions required by the customer. We recognize revenue when all of the following conditions are satisfied: (i) there is persuasive evidence of an arrangement; (ii) delivery has occurred; (iii) the fee is fixed or determinable; and (iv) collectability of the fee is reasonably assured. The timing of revenue recognition in each case depends upon a variety of factors, including the specific terms of each arrangement and the nature of our deliverables and obligations.
F-9
Table of Contents
Motricity, Inc.
Notes to Consolidated Financial Statements
(amounts in thousands, except share data and per share amounts)
Our customer contracts may consist of professional service fees, a fixed monthly managed service fee to host the software platform solution, and a variable monthly subscription fee based on one of three measures: the number of wireless subscribers using our software solutions each month; the aggregate dollar volume or number of transactions processed; or specified rates for individual transactions processed. Certain arrangements also include minimum monthly fee provisions, monthly fees for providing additional managed services required by the customer and/or service level requirements related to the hosted solutions which often entail financial penalties for non-compliance. Professional service fees typically include both the initial fees to customize and implement the specific software solution and fees to enhance the functionality of the software solution, which may occur anytime during the contractual term of the arrangement.
Under contractual arrangements where the customer does not have the right to take possession of the software, we determine the pattern of revenue recognition of the combined deliverables as a single unit of accounting. The professional service fees associated with the arrangement are not considered to be a separate earnings process because the services do not have stand-alone value to the customer. Such customers do not have the ability to benefit, resell or realize value from such services without the associated hosting services. Consequently, the professional services revenue is deferred and recognized monthly on a ratable basis together with the hosting services over the longer of the contractual term of the arrangement or the estimated period the customer is expected to benefit from the software solution or enhancement representing the period over which the hosting services are expected to be utilized. In determining the expected benefit period, we assess factors such as historical data trends, data used to establish pricing in the arrangement, discussions with customers in negotiating the arrangement and the period over which the customer could be expected to recover and earn a reasonable return on the professional service fee. At December 31, 2009 and at March 31, 2010, our balance sheets reflected deferred revenue of $11,784 and $4,912, respectively, which consists primarily of such professional service fees. We consider the variable activity-based fees to be contingent fees and recognize revenue monthly as the contingency is resolved, the fees are earned and the amount of the subscription fee can be reliably measured. For purposes of classifying the arrangement consideration as managed services or professional services revenue on our statement of operations, we allocate the arrangement consideration based on the contractually stated amounts for each component. The pricing of our professional services is based on the expected level of effort necessary to complete a software solution. We believe this best approximates the fair value of the professional service fees if they were a separate unit of accounting.
Under certain arrangements, the customer has the right to take possession of the software, and it is feasible for the customer to either self-host the software on its own hardware or contract with another entity for the hosting service without significant penalty. Such multiple element arrangements are analyzed under software revenue guidance to assess the elements for separation and recognition. The fixed monthly hosting fee to host the software solution is not considered essential to the functionality of other elements, is described in the contract such that the total price of the arrangement would be expected to vary as the result of the inclusion or exclusion of the services and we have established vendor-specific objective evidence of fair value through substantive renewal rates included in the contract. Accordingly we account for the hosting fee element of the arrangement separately and recognize the hosting fee as managed services revenue on a monthly basis as earned. The variable monthly subscription fee is considered a contingent fee and is recognized as managed services revenue monthly when the contingency is resolved and the related fee is earned. We then use the
F-10
Table of Contents
Motricity, Inc.
Notes to Consolidated Financial Statements
(amounts in thousands, except share data and per share amounts)
residual method to allocate the arrangement consideration to the professional services element for revenue recognition purposes. We recognize the professional service revenues using the cost-to-cost percentage of completion method of accounting. We recognize the revenue based on the ratio of costs incurred to the estimated total costs at completion. Should the customer elect to self-host the software, the hosting fee is eliminated and the variable subscription fee becomes the licensing fee. No customer has elected to self-host as of March 31, 2010. If a contract which previously did not have a right to self-host without significant penalty is amended to include such a right, we reassess the contract under the above software revenue guidance.
We provide premium messaging services to subscribers of wireless carriers on behalf of third-party vendors and earn a fixed percentage of the related revenue. We bill the carriers for transactions conducted by their subscribers and provide settlement services for the third-party vendors based on payments received from the carriers. We determined it is appropriate to record our net share of the billings to carriers as service revenue rather than the gross billing amount. The primary considerations for this determination are:
| Ÿ | the third-party vendor sells its content or service directly to the wireless carriers’ subscribers and is considered the primary obligor; |
| Ÿ | the carriers have a contractual relationship with their subscribers and are directly responsible for billing and collecting premium messaging fees from their subscribers and resolving billing disputes; |
| Ÿ | the carriers establish gross pricing for the transactions; |
| Ÿ | the wireless carriers generally pay us a fixed percentage of premium messaging revenues actually collected from their subscribers; and |
| Ÿ | we have limited risks, including no inventory risk and limited credit risk, because the carriers generally bear the risk of collecting fees from their subscribers and we are obligated to remit to the third-party vendor only their share of the funds we actually receive from the carrier. |
Cash and Cash Equivalents
We consider all highly liquid investments with remaining maturities of three months or less at the date of purchase to be cash and cash equivalents. Cash and cash equivalents consist primarily of money market instruments, certificates of deposits, and other short-term investments with original maturities of not more than three months stated at cost, which approximates market value.
Restricted Short-Term Investments
At December 31, 2008 and 2009 and March 31, 2010, restricted short-term investments included one certificate of deposit for $950, which is legally restricted as to withdrawal under an agreement with a financial institution related to an office lease. During 2009, an additional $425 of cash was added to the restricted short-term investments balance in order to comply with a lease amendment.
Marketable Securities
At December 31, 2008, marketable securities have been categorized as held-to-maturity and are measured at amortized cost. As of December 31, 2008, the Company’s held-to-maturity securities
F-11
Table of Contents
Motricity, Inc.
Notes to Consolidated Financial Statements
(amounts in thousands, except share data and per share amounts)
included corporate bonds, commercial paper and certificates of deposit. We had the intent and ability to hold these investments to maturity. For purpose of determining gross realized gains and losses, the cost of securities sold is based upon specific identification. As of December 31, 2009 and March 31, 2010, we did not have any marketable securities.
Accounts Receivable and Allowance for Doubtful Accounts
Accounts receivable are presented at their face amount, less an allowance for doubtful accounts, on the consolidated balance sheets. Accounts receivable consist of amounts billed and currently due from customers and revenues earned but not yet billed. We evaluate the collectability of accounts receivable based on a combination of factors. In circumstances where we are aware of a specific customer’s inability to meet its financial obligations, a specific reserve for bad debts against amounts due is recorded to reduce the related accounts receivable to an amount we reasonably believe is collectable. In addition, we recognize reserves for bad debts based on estimates developed using standard quantitative measures, which incorporate historical write-offs and current economic conditions.
Long-Lived Assets
Long-lived assets include assets such as property and equipment and intangible assets other than those with indefinite lives. We assess the carrying value of our long-lived asset groups when indicators of impairment exist and recognize an impairment loss when the carrying amount of a long-lived asset is not recoverable from the undiscounted cash flows expected to result from the use and eventual disposition of the asset. Indicators of impairment include significant underperformance relative to historical or projected future operating results, significant changes in our use of the assets or in our business strategy, loss of or changes in customer relationships and significant negative industry or economic trends. When indications of impairment arise for a particular asset or group of assets, we assess the future recoverability of the carrying value of the asset (or asset group) based on an undiscounted cash flow analysis. If carrying value exceeds projected, net, undiscounted cash flows, an additional analysis is performed to determine the fair value of the asset (or asset group), typically a discounted cash flow analysis, and an impairment charge is recorded for the excess of carrying value over fair value. The following table outlines our impairments related to long-lived assets:
| Year Ended December 31, | Three Months Ended March 31, | ||||||||||||||
| 2007 | 2008 | 2009 | 2009 | 2010 | |||||||||||
| (unaudited) | |||||||||||||||
| Property and equipment |
$ | — | $ | 21,132 | $ | 3,587 | $ | — | $ | — | |||||
| Definite-lived intangible assets |
— | 1,219 | 1,902 | — | — | ||||||||||
| Assets held for sale |
— | — | 317 | — | — | ||||||||||
| Total asset impairment charges |
$ | — | $ | 22,351 | $ | 5,806 | $ | — | $ | — | |||||
See Note 4, “Property and Equipment, Net” and Note 5, “Goodwill and Intangible Assets.”
Property and equipment are recorded at historical cost less accumulated depreciation, unless impaired. Depreciation is charged to operations over the estimated useful lives of the assets using the straight-line method or a variable method reflecting the pattern in which the economic benefits are
F-12
Table of Contents
Motricity, Inc.
Notes to Consolidated Financial Statements
(amounts in thousands, except share data and per share amounts)
anticipated to be utilized. Upon retirement or sale, the historical cost of assets disposed of and the related accumulated depreciation are removed from the accounts and any resulting gain or loss is recognized. Expenditures for repairs and maintenance are charged to expense as incurred.
All costs related to the development of internal-use software other than those incurred during the application development stage are expensed, including costs for minor upgrades and enhancements when there is no reasonable cost-effective way to separate these costs from maintenance activities. Costs incurred during the application development stage are capitalized and amortized over the estimated useful life of the software (generally three years).
Identifiable intangible assets include capitalized costs related to the development of certain software products. Capitalization of costs begins when technological feasibility has been established and ends when the product is available for general release to customers. Amortization is computed on an individual product basis for those products available for market and is recognized based on the product’s estimated economic life. At each balance sheet date, the unamortized costs for all intangible assets are reviewed by management and reduced to net realizable value when necessary. Other identifiable intangible assets are recorded at cost or, when acquired as part of a business acquisition, estimated fair value. The recorded amount is amortized to expense over the estimated useful life of the asset using the straight-line method or a variable method reflecting the pattern in which the economic benefits are anticipated to be realized.
Goodwill
Goodwill represents the excess of the purchase price of an acquired enterprise or assets over the fair value of the identifiable net assets acquired. We test goodwill for impairment in the fourth quarter of each year, and whenever events or changes in circumstances arise during the year that indicate the carrying amount of goodwill may not be recoverable. In evaluating whether an impairment of goodwill exists, we first compare the estimated fair value of a reporting unit against its carrying value. If the estimated fair value is lower than the carrying value, then a more detailed assessment is performed comparing the fair value of the reporting unit to the fair value of the assets and liabilities plus the goodwill carrying value of the reporting unit. If the fair value of the reporting unit is less than the fair value of its assets and liabilities plus goodwill, then an impairment charge is recognized to reduce the carrying value of goodwill by the difference.
During the year ended December 31, 2007, a goodwill impairment charge of $29,718 was recorded, $2,851 of which was classified as loss from discontinued operations. During the year ended December 31, 2008, a goodwill impairment charge of $6,779 related to the GPW reporting unit was recorded within goodwill and long-lived asset impairment charge on the consolidated statements of operations. See Note 5, “Goodwill and Intangible Assets.”
Business Acquisitions
Business acquisitions are accounted for under the purchase method of accounting. Under that method, assets and liabilities of the business acquired are recorded at their estimated fair values as of the date of the acquisition, with any excess of the cost of the acquisition over the estimated fair value of the net tangible and intangible assets acquired recorded as goodwill. We make significant judgments and assumptions in determining the fair value of acquired assets and assumed liabilities, especially
F-13
Table of Contents
Motricity, Inc.
Notes to Consolidated Financial Statements
(amounts in thousands, except share data and per share amounts)
with respect to acquired intangibles. Using different assumptions in determining fair value could materially impact the purchase price allocation and our financial position and results of operations. Results of operations for acquired businesses are included in the consolidated financial statements from the date of acquisition.
Freestanding Preferred Stock Warrants
Freestanding warrants that are related to the Company’s redeemable preferred stock are classified as liabilities on the consolidated balance sheets. The liability as of December 31, 2008, December 31, 2009 and March 31, 2010 was $3,517, $5,012 and $5,273, respectively. The warrants are subject to remeasurement at each balance sheet date and any change in fair value is recognized within other income (expense) on the Company’s consolidated statements of operations. We will continue to adjust the warrant liability for any changes in fair value until the earlier of the exercise of the warrant, the expiration of the warrant, or the automatic conversion of the warrant, assuming the underlying series of preferred stock converts upon an initial public offering, at which time the warrant liability will be reclassified as additional paid-in capital. The change in fair value amounted to a decrease of $283 for the year ended December 31, 2008, an increase of $1,495 for the year ended December 31, 2009 and an increase of $260 for the three months ended March 31, 2010.
At each reporting period, the fair values of the warrants are determined using the Black-Scholes option pricing model. We calculate expected volatility using historical volatility for a peer group of 10 companies, as we believe the expected volatility will approximate historical volatility of the peer group. The expected term is equal to the remaining life of the warrant, and the risk-free interest rate is based on the U.S. Treasury constant maturities for the same period as the remaining life of each warrant.
Accumulated Other Comprehensive Loss
Comprehensive loss includes net loss as currently reported under U.S. GAAP and other comprehensive loss. Other comprehensive loss considers the effects of additional economic events, such as foreign currency translation adjustments, that are not required to be recorded in determining net loss, but rather are reported as a separate component of stockholders’ deficit.
Product Development Costs
Product development expenses consist primarily of salaries and fees paid to outside vendors. Costs incurred in connection with research activities are charged to operating expenses as incurred and are included within product development and sustainment in the consolidated statements of operations. Research and development expenses for the years ended December 31, 2007, 2008 and 2009 were $10,685, $3,045 and $5,792, respectively. For the three months ended March 31, 2009 and 2010, research and development expenses were $652 and $2,114, respectively.
We capitalize certain software development costs, including the costs to develop new software products or significant enhancements to existing software products, which are developed or obtained for internal use. We capitalize software development costs when application development begins, it is probable that the project will be completed, and the software will be used as intended. Such capitalized costs are amortized on a straight-line basis over the estimated useful life of the related asset, which is generally three years. Costs associated with preliminary project stage activities, training, maintenance and all post implementation stage activities are expensed as incurred.
F-14
Table of Contents
Motricity, Inc.
Notes to Consolidated Financial Statements
(amounts in thousands, except share data and per share amounts)
Software development costs related to software products to be sold, leased or otherwise marketed, however, are capitalized when technological feasibility has been established. In 2010, we have focused on developing software products that can be leveraged across various customers. As such, we have capitalized costs, including direct labor and related overhead. Amortization of capitalized software development costs will begin as each product is available for general release to customers. Amortization will be computed on an individual product basis for those products available for market and will be recognized based on the product’s estimated economic life. Unamortized capitalized software development costs determined to be in excess of net realizable value of the product are expensed immediately. In the quarter ended March 31, 2010, we capitalized $1,162 of software development costs. We did not capitalize any costs in 2007, 2008 and 2009.
Advertising Expenses
The costs of advertising are either expensed as incurred or fully expensed the first time the advertising takes place. Advertising costs amounted to $157, $492 and $102 for the years ended December 31, 2007, 2008 and 2009, respectively, and $18 and $6 for the three months ended March 31, 2009 and 2010, respectively.
Stock-Based Compensation
We measure and recognize stock-based compensation expense using a fair value-based method for all share-based awards made to employees and nonemployee directors, including grants of stock options and other stock-based plans. The application of this standard requires significant judgment and the use of estimates, particularly with regard to Black-Scholes assumptions such as stock price volatility and expected option lives to value equity-based compensation. We recognize stock compensation expense using a straight line method over the requisite service period of the individual grants, which generally equals the vesting period.
Litigation and Other Contingencies
Amounts associated with litigation and other contingencies are recorded as charges to earnings when we, after taking into consideration the facts and circumstances associated with each matter, including settlement offers, have determined that it is probable that a liability has been incurred and the amount of the liability can reasonably be estimated.
Income Taxes
We account for income taxes using an asset and liability approach to record deferred taxes. Our deferred income tax assets represent temporary differences between the financial statement carrying amount and the tax basis of existing assets and liabilities that will result in tax deductions in future years, including net operating loss and tax credit carry forwards. Valuation allowances are provided if, based upon the weight of available evidence, it is more likely than not that some or all of the net deferred tax assets will not be realized. We recorded full valuation allowances against our deferred tax assets for all periods presented.
As of January 1, 2007, we adopted the authoritative accounting guidance prescribing a threshold and measurement attribute for the financial recognition and measurement of a tax position taken or
F-15
Table of Contents
Motricity, Inc.
Notes to Consolidated Financial Statements
(amounts in thousands, except share data and per share amounts)
expected to be taken in a tax return. The guidance defines the level of assurance that a tax position must meet in order to be recognized in the financial statements and also provides for de-recognition of tax benefits, classification on the balance sheet, interest and penalties, accounting in interim periods, disclosure and transition. The guidance utilizes a two-step approach for evaluating uncertain tax positions. Step one, recognition, requires a company to determine if the weight of available evidence indicates that a tax position is more likely than not to be sustained upon audit, including resolution of related appeals or litigation processes, if any. If a tax position is not considered “more likely than not” to be sustained, no benefits of the position are recognized. Step two, measurement, is based on the largest amount of benefit which is more likely than not to be realized on effective settlement.
Net Loss Per Share Attributable to Common Stockholders
Basic and diluted net loss per share attributable to common stockholders is computed by dividing net loss attributable to common stockholders by the weighted-average number of common shares outstanding during the period. Our net loss attributable to common stockholders was not allocated to redeemable preferred stock or preferred stock using the two-class method, as the redeemable preferred stock and preferred stock do not have a contractual obligation to share in the net loss attributable to common stockholders.
Our potentially dilutive shares, which include outstanding common stock options, unvested common shares subject to repurchase, preferred stock and redeemable preferred stock, common stock warrants and redeemable preferred stock warrants, have not been included in the computation of diluted net loss per share attributable to common stockholders for all periods presented, as the results would be anti-dilutive. Such potentially dilutive shares are excluded when the effect would be to reduce net loss per share. See Note 13, “Net Loss Per Share Attributable to Common Stockholders.”
Operating Segment
The authoritative guidance for disclosures about segments of an enterprise establishes standards for reporting information about operating segments. It defines operating segments as components of an enterprise about which separate financial information is available that is evaluated regularly by the chief operating decision-maker (“CODM”) in deciding how to allocate resources and in assessing performance. We currently operate and manage our business as a single segment. Our CODM allocates resources and assesses performance of the business at the consolidated level. Our CODM reviews revenue by customer and by type of service to understand and evaluate revenue trends. We have one business activity, and there are no segment managers who are held accountable for operations, operating results or components below the consolidated unit level. Accordingly, we consider ourselves to be in a single operating and reporting segment structure.
We have operated as a single segment with one reporting unit since the third quarter of 2008. Prior to the third quarter of 2008, we operated with three reporting units: mobile network operator, GPW, and D2C. In June 2008, we completed our divesture of D2C. In the third quarter of 2008, we impaired the goodwill balance related to GPW and integrated our GPW reporting unit into our mobile network operator unit.
We generated approximately 98%, 92% and 95% of our total revenue in the U.S. during the years ended December 31, 2007, 2008 and 2009, respectively. For the three months ended March 31, 2009
F-16
Table of Contents
Motricity, Inc.
Notes to Consolidated Financial Statements
(amounts in thousands, except share data and per share amounts)
and 2010 approximately 94% and 96%, respectively, of our total revenue was generated in the U.S. For all periods presented, revenue from locations outside the U.S. was less than 10%. As of December 31, 2007, 2008 and 2009, all of our long-lived assets were located in the U.S.
Fair Value of Financial Instruments
As of December 31, 2008 and 2009, we had $14,299 and $35,945 of cash and cash equivalents, respectively, and $950 and $1,375 of restricted short-term investments, respectively, that were evaluated using quoted market prices (Level 1) to determine their fair value. As of March 31, 2010, we had $25,408 of cash and cash equivalents and $1,375 of restricted short-term investments that were evaluated using quoted prices (Level 1) to determine their fair value. As of December 31, 2009 and March 31, 2010, cash equivalents were comprised of money market funds totaling $3,966. As of December 31, 2008, the fair market value of held-to-maturity securities using quoted market prices (Level 1) was $5,446. In addition, the carrying amount of certain financial instruments, including accounts receivable, accounts payable and accrued expenses approximates fair value due to their short maturities. Based on borrowing rates currently available to us for loans with similar terms, the carrying value of long-term debt obligations as of December 31, 2008 approximated fair value.
For freestanding warrants related to our redeemable preferred stock which are classified as liabilities, due to the lack of availability of observable market quotes for these securities, the fair value was estimated based on a Black-Scholes valuation model which utilized inputs based on management estimates. Significant inputs to the valuation are unobservable in the active markets and are classified as Level 3. The increase/(decrease) in the Level 3 securities of $(283) for the year ended December 31, 2008, $1,495 for the year ended December 31, 2009 and $260 for the three months ended March 31, 2010 was due primarily to changes in the estimated fair value of the Company’s stock. There were no changes in the composition of the Level 3 securities during these periods. There were no transfers between levels in the fair value hierarchy for the three months ended March 31, 2010.
Concentration of Credit Risk
Financial instruments that potentially subject us to concentrations of credit risk consist primarily of cash and cash equivalents, to the extent balances exceed limits that are insured by the Federal Deposit Insurance Corporation, and accounts receivable.
At December 31, 2008, two customers comprised 42% and 11%, respectively, of accounts receivable. At December 31, 2009, two customers comprised 41% and 13%, respectively, of accounts receivable. At March 31, 2010, two customers comprised 40% and 19%, respectively, of accounts receivable.
The following table outlines our revenue concentration by customer:
| AT&T | Verizon Wireless |
Alltel | |||||||
| Year ended December 31, 2007 |
41 | % | 0 | % | 19 | % | |||
| Year ended December 31, 2008 |
42 | % | 12 | % | 10 | % | |||
| Year ended December 31, 2009(1) |
53 | % | 20 | % | — | ||||
| Three months ended March 31, 2010 (unaudited) |
40 | % | 39 | % | — |
| (1) | Verizon Wireless acquired Alltel in January 2009. |
F-17
Table of Contents
Motricity, Inc.
Notes to Consolidated Financial Statements
(amounts in thousands, except share data and per share amounts)
Foreign Currencies
For international subsidiaries, local currencies have been determined to be the functional currencies. The financial statements of international subsidiaries are translated to their U.S. dollar equivalents at end-of-period exchange rates for assets and liabilities and at average currency exchange rates for revenues and expenses. Translation adjustments resulting from this process are included in other comprehensive loss and are reflected as a separate component of stockholders’ deficit. Realized and unrealized transaction gains and losses are included in other income in the period in which they occur, except on intercompany balances considered to be long-term, and have not been significant for any periods presented. Transaction gains and losses on intercompany balances considered to be long-term are recorded in other comprehensive loss.
Subsequent Events
We have evaluated subsequent events through March 5, 2010 which is the date the annual financial statements were issued. For the reissuance of the annual financial statements and for the issuance of the financial statements for the three months ended March 31, 2010, the unaudited interim period presented herein, such evaluation was performed through June 6, 2010.
Recent Accounting Pronouncements
In September 2009, the Financial Accounting Standards Board, or FASB, Emerging Issues Task Force issued authoritative guidance addressing revenue recognition arrangements with multiple deliverables. The guidance requires revenue to be allocated to multiple elements using relative fair value based on vendor specific objective evidence, third-party evidence, or estimated selling price. The residual method also becomes obsolete under this guidance. The new guidance is effective for fiscal years beginning on or after June 15, 2010. We are currently evaluating the impact of the implementation of this guidance on our financial position, results of operations and cash flows.
In January 2010, the FASB issued updated guidance related to fair value measurements and disclosures, which requires a reporting entity to disclose separately the amounts of significant transfers in and out of Level 1 and Level 2 fair value measurements and to describe the reasons for the transfers. In addition, in the reconciliation for fair value measurements using significant unobservable inputs, or Level 3, a reporting entity should disclose separately information about purchases, sales, issuances and settlements (that is, on a gross basis rather than one net number). The updated guidance also requires that an entity should provide fair value measurement disclosures for each class of assets and liabilities and disclosures about the valuation techniques and inputs used to measure fair value for both recurring and non-recurring fair value measurements for Level 2 and Level 3 fair value measurements. The updated guidance is effective for interim or annual financial reporting periods beginning after December 15, 2009, except for the disclosures about purchases, sales, issuances and settlements in the roll forward activity in Level 3 fair value measurements, which are effective for fiscal years beginning after December 15, 2010 and for interim periods within those fiscal years. The adoption of this statement in the first quarter of fiscal 2010 did not have a material impact on our consolidated financial statements, as the principal impact from this update relates to our fair value measurements disclosure.
F-18
Table of Contents
Motricity, Inc.
Notes to Consolidated Financial Statements
(amounts in thousands, except share data and per share amounts)
| 3. | Business Combinations |
On December 28, 2007, we acquired the assets of InfoSpace Mobile. InfoSpace Mobile was a competing provider of mobile content solutions and services for the wireless industry that had strong relationships with several large wireless carriers. This acquisition was a key element in the broad strategic realignment of our business, which included the acquisition of the mCore platform, leased datacenter facilities and a large employee base. The following table summarizes the final purchase price allocation of this transaction:
| Cost of acquisition |
|||
| Cash paid |
$ | 135,000 | |
| Liabilities assumed |
14,983 | ||
| Direct transaction costs |
2,172 | ||
| Total cost of acquisition |
$ | 152,155 | |
| Allocation of purchase price: |
|||
| Assets |
|||
| Cash |
$ | 188 | |
| Accounts receivable |
16,402 | ||
| Prepaid expenses |
2,403 | ||
| Other current assets |
127 | ||
| Total current assets |
19,120 | ||
| Property and equipment |
45,177 | ||
| Intangible assets |
13,200 | ||
| Goodwill |
74,658 | ||
| Total assets |
$ | 152,155 | |
| Liabilities |
|||
| Accounts payable and accrued liabilities |
14,983 | ||
| Total liabilities |
$ | 14,983 | |
| Net assets acquired |
$ | 137,172 | |
Amortizable Acquired Assets
Purchased Technology: Included within property and equipment is $25,300 of aggregated proprietary technology and software acquired. This represents six platforms that enable us to provide various types of mobile services to the wireless industry. We valued the technology and software using a cost approach, which provides an estimate of fair value based on the cost of reproducing or replacing the assets. We are amortizing the technology assets using a variable method over their estimated useful lives of six years. During 2008, $8,430 of this capitalized software was determined to be impaired based on information received indicating it was likely that two significant customers would no longer be utilizing our search and storefront solutions. See Note 4, “Property and Equipment, Net.”
Customer Relationships: Intangible assets of $13,200 represent customer relationships which relate to the ability to sell existing and future managed and professional services to existing customers. The fair value of customer relationships has been estimated using the income method utilizing a discounted cash flow model. We are amortizing this intangible asset using a variable method over its estimated useful life of approximately eight years.
F-19
Table of Contents
Motricity, Inc.
Notes to Consolidated Financial Statements
(amounts in thousands, except share data and per share amounts)
Goodwill
Goodwill represents the excess of the purchase price over the fair value of the net tangible and intangible assets acquired. The acquisition was expected to enhance our presence in the marketplace by significantly increasing our market share, enhancing the geographical distribution of our operations, and enabling us to increase our productivity. These factors contributed to establishing the purchase price, which resulted in the recognition of a significant amount of goodwill. All of the goodwill is expected to be deductible for income tax purposes.
Goodwill resulting from business combinations is not amortized but instead is tested for impairment at least annually (more frequently if certain indicators are present). In the event that management determines that the value of goodwill has become impaired, we will incur an accounting charge for the amount of impairment during the period in which the determination is made. See Note 5, “Goodwill and Intangible Assets.”
| 4. | Property and Equipment, Net |
Information related to the major categories of our property and equipment, net is as follows:
| Useful Life (in years) |
As of December 31, | As of March 31, 2010 |
||||||||||||
| 2008 | 2009 | |||||||||||||
| (unaudited) | ||||||||||||||
| Capitalized software |
3 | $ | 45,497 | $ | 47,601 | $ | 47,563 | |||||||
| Computer software and equipment |
3-5 | 31,825 | 28,633 | 29,493 | ||||||||||
| Leasehold improvements |
4-10 | 12,238 | 6,755 | 6,745 | ||||||||||
| Equipment, furniture and fixtures |
7 | 3,818 | 2,392 | 3,323 | ||||||||||
| Equipment, furniture and fixtures under capital lease |
Lease term | 2,063 | 113 | 113 | ||||||||||
| Total property and equipment |
95,441 | 85,494 | 87,237 | |||||||||||
| Less: Accumulated depreciation and amortization |
(35,101 | ) | (33,945 | ) | (36,573 | ) | ||||||||
| Less: Accumulated depreciation and amortization under capital lease |
(2,061 | ) | (113 | ) | (113 | ) | ||||||||
| Less: Accumulated impairments |
(21,132 | ) | (24,719 | ) | (24,719 | ) | ||||||||
| Property and equipment, net |
$ | 37,147 | $ | 26,717 | $ | 25,832 | ||||||||
Capitalized software, net of amortization, consists of:
| As of December 31, | As of March 31, 2010 |
|||||||||||
| 2008 | 2009 | |||||||||||
| (unaudited) | ||||||||||||
| Beginning balance |
$ | 37,122 | $ | 23,228 | $ | 17,284 | ||||||
| Capitalization |
4,796 | 2,143 | — | |||||||||
| Amortization |
(5,771 | ) | (4,500 | ) | (1,283 | ) | ||||||
| Impairment of assets acquired via acquisition |
(8,430 | ) | (3,268 | ) | — | |||||||
| Impairment of internally developed software |
(4,489 | ) | (319 | ) | — | |||||||
| Ending balance |
$ | 23,228 | $ | 17,284 | $ | 16,001 | ||||||
F-20
Table of Contents
Motricity, Inc.
Notes to Consolidated Financial Statements
(amounts in thousands, except share data and per share amounts)
In 2008, we determined that $21,132 of long-lived assets were impaired. We recorded an impairment charge of $8,430 for certain capitalized software assets acquired as part of the Infospace Mobile acquisition based on information indicating it was likely that two significant customers would no longer be utilizing our mobile search and storefront solutions and our reassessment of the projected future cash flows associated with these assets. In addition, we recorded an impairment charge of $4,489 related to the planned shutdown of the Fuel software platform. We are migrating existing customers from Fuel to an upgraded version of the mCore platform acquired as part of the Infospace Mobile acquisition. Based on the planned consolidation and shutdown of certain datacenter facilities and our former headquarters in Durham, North Carolina, we recorded a total impairment charge of $8,213 related to computer software, furniture and fixtures and leasehold improvements.
In 2009, as a result of the loss of a customer who comprised a significant portion of our messaging business, we determined the $3,268 of capitalized software acquired as part of the GPW acquisition was impaired. Our projected future cash flows, when compared to the carrying value of the capitalized software, indicated the asset was fully impaired. In addition, we recorded an impairment charge of $319 related to capitalized software that was no longer in use. During 2009, we also retired a significant amount of assets that were no longer in use due to our datacenter consolidations.
Capitalized interest for the years ended December 31, 2007, 2008 and 2009 was $259, $113 and $27, respectively.
| 5. | Goodwill and Intangible Assets |
Changes in the carrying amounts of goodwill are as follows:
| Balance at December 31, 2007 |
$ | 79,283 | ||
| Additions: |
||||
| Adjustments to the original purchase allocation of InfoSpace Mobile assets |
2,154 | |||
| Deductions: |
||||
| Impairment (GPW) |
(6,779 | ) | ||
| Balance at December 31, 2008 |
$ | 74,658 | ||
| Balance at December 31, 2009 |
$ | 74,658 | ||
| Balance at March 31, 2010 (unaudited) |
$ | 74,658 | ||
The gross amount of goodwill at December 31, 2008 and 2009 and March 31, 2010 was $111,155 with accumulated impairments of $36,497.
In 2007, total goodwill impairment charges of $29,718 related to the mobile network operator, GPW and D2C reporting units were recorded. The annual impairment test performed on the mobile network operator reporting unit indicated that changes in consumer purchasing habits produced lower revenues and margins than originally forecasted. We calculated the impairment charge as the difference between the fair value of the reporting unit’s assets and liabilities, including the carrying value of its goodwill, to the reporting unit’s fair value, and recorded an impairment charge of $12,074. The reporting unit’s fair value was measured by a combination of an income and cost approach utilizing projected discounted cash flows. In addition, the annual impairment test performed on the
F-21
Table of Contents
Motricity, Inc.
Notes to Consolidated Financial Statements
(amounts in thousands, except share data and per share amounts)
GPW reporting unit indicated that unanticipated competitive dynamics in the marketplace generated lower revenues than were originally projected, resulting in the goodwill impairment of $14,793. We calculated the goodwill impairment charge as the difference between the fair value of the reporting unit’s assets and liabilities, including the carrying value of its goodwill, and the reporting unit’s fair value, measured by a combination of an income and cost approach utilizing projected discounted cash flow. Finally, we evaluated the carrying value of the D2C reporting unit as compared to the fair market value of the assets and recorded an impairment charge of $2,851. This charge is classified within the net loss from discontinued operations on the consolidated statements of operations.
In 2008, our goodwill impairment test indicated that future revenues from GPW would not support the carrying value of the associated goodwill. The technology acquired from GPW supports premium messaging. As premium messaging has not experienced the expected rate of growth in usage, revenues will be lower than originally anticipated. Therefore, a $6,779 impairment charge related to GPW was recorded for the year ended December 31, 2008. The goodwill impairment charge was calculated as the difference between the fair value of the assets and liabilities of the reporting unit, including the carrying value of its goodwill, to the reporting unit’s fair value, measured by an income approach utilizing projected discounted cash flows. Also during 2008, we completed the purchase allocation of the Infospace Mobile acquisition, which included a $2,154 adjustment to the fair value of acquired property and equipment and assumed liabilities.
Information regarding our definite-lived intangibles is as follows:
| As of December 31, 2008 | As of December 31, 2009 | As of March 31, 2010 | ||||||||||||||||
| Gross Carrying Amount |
Accumulated Amortization |
Gross Carrying Amount |
Accumulated Amortization |
Gross Carrying Amount |
Accumulated Amortization | |||||||||||||
| (Unaudited) | ||||||||||||||||||
| Customer relationships |
$ | 19,088 | $ | 5,006 | $ | 19,088 | $ | 8,396 | $ | 19,088 | $ | 8,792 | ||||||
| Trademarks |
1,000 | 1,000 | 1,000 | 1,000 | 1,000 | 1,000 | ||||||||||||
| Capitalized software development costs |
— | — | — | — | 1,162 | — | ||||||||||||
| Other |
143 | 143 | 143 | 143 | 143 | 143 | ||||||||||||
| Total |
$ | 20,231 | $ | 6,149 | $ | 20,231 | $ | 9,539 | $ | 21,393 | $ | 9,935 | ||||||
The customer relationships are being amortized over an estimated useful life of eight years. Software development costs capitalized during the first three months of 2010 were $1.2 million. The products for which costs are capitalized are not yet available for release to customers, and as such, no amounts have been amortized and charged to expense. Amortization of capitalized software development costs will be computed on an individual product basis for those products available for market and will be recognized based on the product’s estimated economic life.
Total amortization expense for definite-lived intangible assets was $1,105, $1,885 and $1,488 for the years ended December 31, 2007, 2008 and 2009, respectively. Total amortization expense for definite-lived intangible assets was $431 and $396 for the three months ended March 31, 2009 and 2010, respectively. In 2008, the customer list related to the acquisition of M7 Networks, Inc. (“M7”) was impaired, resulting in an additional $1,219 of impairments included within goodwill and long-lived asset impairment charges on the consolidated statements of operations for the year ended December 31,
F-22
Table of Contents
Motricity, Inc.
Notes to Consolidated Financial Statements
(amounts in thousands, except share data and per share amounts)
2008. M7 was a community management solutions provider that we acquired in 2005. We no longer have customers utilizing this technology. In 2009, we determined the customer list acquired from the GPW acquisition was impaired. Our projected cash flow analysis did not support the carrying value of the intangible asset. Therefore, we recorded a $1,902 charge to fully impair the customer list during 2009.
As of December 31, 2009, estimated annual amortization expenses for customer relationships for each of the five succeeding years are as follows:
| 2010 |
$ | 1,584 | |
| 2011 |
1,716 | ||
| 2012 |
1,716 | ||
| 2013 |
1,848 | ||
| 2014 |
1,848 |
| 6. | Debt Facilities |
Our outstanding debt balances are composed of the following:
| As of December 31, 2008 |
As of December 31, 2009 |
As of March 31, 2010 | ||||||||
| (unaudited) | ||||||||||
| 2004 Line of Credit |
$ | 4,875 | $ | — | $ | — | ||||
| 2007 Equipment Loan |
5,000 | — | — | |||||||
| Total |
9,875 | — | — | |||||||
| Less: Current portion |
(8,208 | ) | — | — | ||||||
| Less: Unamortized debt discount |
(111 | ) | — | — | ||||||
| Long-term portion |
$ | 1,556 | $ | — | $ | — | ||||
In 2004, a $5,250 line of credit was established. Interest accrued on the outstanding principal balance at the prime rate, and payments of interest only were due monthly. The line of credit was secured by guarantees of various stockholders. All principal and outstanding interest amounts were paid in full at the April 8, 2009 maturity date.
In 2007, we entered into a loan and security agreement with a bank to obtain a $10,000 equipment loan (“2007 Equipment Loan”) and a $25,000 revolving line of credit (“2007 Revolving Line of Credit”), secured by our assets, excluding permitted liens. The interest rate for the 2007 Equipment Loan is the prime rate plus 1.25% with a repayment period of 36 months. The interest rate for the 2007 Revolving Line of Credit is the prime rate plus 0.75% with accrued interest due monthly and all obligations due at the maturity date of April 15, 2009. In conjunction with the 2007 Equipment Loan and 2007 Revolving Line of Credit, we issued a warrant to the lender to purchase 20,000 shares of our common stock at an exercise price of $32.25 per share, expiring in June 2014. The $408 fair value of the warrant was recorded as a contra liability within the line titled “bank borrowings, net of current portion” on the consolidated balance sheets and as an increase to additional paid-in capital. The fair value of the warrant was amortized over the term of the financing arrangement as additional interest expense.
F-23
Table of Contents
Motricity, Inc.
Notes to Consolidated Financial Statements
(amounts in thousands, except share data and per share amounts)
In April 2009, we amended and extended our 2007 Revolving Line of Credit through April 2011 (“Line of Credit”). The 2007 Equipment Loan was terminated and the balance repaid as of the amendment date. The Line of Credit is primarily available to fund working capital requirements. The availability under the Line of Credit is subject to a borrowing base calculated based on qualifying accounts receivable. The interest rate on any borrowings is based on the lender’s prime rate plus a margin ranging between 50 to 150 basis points depending on our trailing EBITDA. The minimum interest rate is 5.50%. The Line of Credit restricts, among other things, our ability to incur indebtedness, create or permit liens on our assets, declare or pay dividends and certain other restricted payments, consolidate, merge or recapitalize, acquire or sell assets, make certain investments, loans or other advances, and enter into transactions with affiliates. The Line of Credit requires us to maintain a “tangible net worth” of $15,000. As of March 31, 2010, we had borrowing capability of approximately $8,102.
We had also entered into various loan agreements to purchase equipment. These advances bore interest at rates ranging from 11.157% to 11.288% and were collateralized by the specific property and equipment acquired. These loan agreements either matured or were repaid during 2008.
As of December 31, 2008, the weighted average interest rate on our outstanding debt was 4.26%.
As of December 31, 2009 and March 31, 2010, no amounts were outstanding on any of the debt facilities.
| 7. | Commitments and Contingencies |
Operating Leases
We lease office space and equipment under various non-cancellable operating lease agreements. Rent expense for non-cancellable operating leases with scheduled rent increases and landlord incentives is recognized on a straight-line basis over the lease term, beginning with the effective lease commencement date. Certain of our leasing agreements have varying renewal options.
Significant terms of operating lease agreements are as follows:
| Ÿ | In 2005, we entered into an operating lease for approximately 61,000 square feet of office space for our headquarters in Durham, North Carolina which commenced in fiscal 2006 and expires in fiscal 2016. The lease required an irrevocable standby letter of credit for security at an initial value of $950 with provisions to reduce the amount based on future financial milestones. The $950 had been placed in an investment account as security for the letter of credit. This account was classified as a restricted short-term investment at December 31, 2008. In conjunction with the relocation of our headquarters to Bellevue, Washington, we entered into an agreement to assign this lease to a third party effective May 1, 2009. As a result of this assignment, we are required to pay 23 months of rent on behalf of the assignee and make a $300 payment at the end of the 23-month period to subsidize future operating expenses. As of December 31, 2009, we have placed $1.4 million in escrow to be used to make the last 10 payments to be made under the assignment of the lease. The costs associated with assignment of the lease were accrued as a restructuring charge as of the assignment date. |
| Ÿ | In December 2007, in connection with the InfoSpace Mobile acquisition, we entered into an assignment agreement for approximately 7,938 square feet in Bellevue, Washington. The lease expires on August 31, 2011. |
F-24
Table of Contents
Motricity, Inc.
Notes to Consolidated Financial Statements
(amounts in thousands, except share data and per share amounts)
| Ÿ | In December 2007, in connection with the InfoSpace Mobile acquisition, we entered into an operating lease for approximately 65,436 square feet of office space in Bellevue, Washington. The lease expires on December 20, 2013. |
| Ÿ | In May 2008, we entered into an operating lease for office space and parking facilities in Woking, United Kingdom. The lease expired on February 28, 2010. |
Estimated future minimum net rentals payable under these agreements at December 31, 2009 are as follows:
| 2010 |
$ | 4,900 | |
| 2011 |
2,924 | ||
| 2012 |
1,984 | ||
| 2013 |
2,461 | ||
| 2014 |
243 | ||
| Thereafter |
— | ||
| Total |
$ | 12,512 | |
In the preceding table, future minimum annual net rentals payable under non-cancellable operating leases denominated in foreign currencies have been calculated based upon December 31, 2009 foreign currency exchange rates. The table was prepared assuming the maximum commitments currently outstanding, but such commitments could decrease based on termination negotiations. Minimum net rentals payable under non-cancellable operating lease agreements are presented net of tenant allowances, if any.
Rental expense under operating lease agreements during the years ended December 31, 2007, 2008 and 2009 was $1,480, $5,103 and $2,978, respectively. Rental expense under operating lease agreements during the three months ended March 31, 2009 and 2010 was $1,087 and $661, respectively.
Other Contractual Arrangements
We have entered into several agreements with third-party network service providers, who provide additional operational support to our various datacenters. In addition, we have entered into a professional services agreement that expires on December 31, 2010. Under these arrangements, we are obligated to make payments totaling $6,155 in 2010 and $2,139 in 2011.
Capital Leases
In 2006, we entered into a sale-leaseback transaction. Based on the terms, we sold certain new assets for $2,148 to the landlord of our former corporate headquarters located in Durham, North Carolina. The assets were leased back from the purchaser over a period of 10 years and no gain or loss was recognized on the transaction. A corresponding note receivable from the lessor was created for the sales proceeds subject to the same repayment terms as the capital lease obligation. During 2009, the capital lease obligation and note receivable relating to our former corporate headquarters were assigned to a third-party, resulting in the elimination of the capital lease obligation and note receivable with no gain or loss recognized.
F-25
Table of Contents
Motricity, Inc.
Notes to Consolidated Financial Statements
(amounts in thousands, except share data and per share amounts)
Litigation
From time to time, we are subject to claims in legal proceedings arising in the normal course of business. We do not believe that we are currently party to any pending legal action that could reasonably be expected to have a material adverse effect on our business, financial condition, results of operations or cash flows.
| 8. | Restructuring |
In February and March 2007, we closed our San Diego and Los Angeles, California offices, and relocated employees to our headquarters in Durham, North Carolina. During 2007, restructuring charges of $990 and $293 were incurred for office relocation and lease termination obligations, respectively.
In conjunction with the InfoSpace Mobile acquisition in December 2007 and the subsequent integration activities, we elected to move our corporate headquarters from Durham, North Carolina to Bellevue, Washington and eliminate redundant functions and positions. During 2008, we incurred $3,236 of expenses to relocate the headquarters functions and certain employees to the Bellevue location. This amount includes severance expenses related to the elimination of redundant positions and is classified as restructuring charges in the 2008 consolidated financial statements. See Note 7, “Commitments and Contingencies,” for additional information regarding assignment of the lease for the Durham facility in April 2009.
During 2009, we incurred restructuring charges of $2,058 related to the relocation of our corporate headquarters and the closure of our office in the United Kingdom.
In March 2010, we incurred a $407 loss on the sale of the Chief Executive Officer’s home that we acquired in 2008 in connection with the relocation of our headquarters to Bellevue, Washington. This loss was recorded as a restructuring charge in the three months ended March 31, 2010. See Note 16, “Related Party Transactions” for additional information regarding the purchase of the home in 2008.
Restructuring charges are included in restructuring on the consolidated statements of operations.
F-26
Table of Contents
Motricity, Inc.
Notes to Consolidated Financial Statements
(amounts in thousands, except share data and per share amounts)
The following table summarizes the liabilities related to restructuring costs which are included in accrued expenses on the consolidated balance sheets:
| Involuntary Termination Benefits |
Office Relocation Costs |
Other Costs, Primary Lease Obligations |
Total | |||||||||||||
| Balance as of December 31, 2006 |
$ | 680 | $ | — | $ | — | $ | 680 | ||||||||
| Restructuring charges |
— | 990 | 293 | 1,283 | ||||||||||||
| Utilization |
(662 | ) | (990 | ) | (293 | ) | (1,945 | ) | ||||||||
| Balance as of December 31, 2007 |
18 | — | — | 18 | ||||||||||||
| Restructuring charges |
2,584 | 311 | 341 | 3,236 | ||||||||||||
| Utilization |
(2,372 | ) | (311 | ) | (341 | ) | (3,024 | ) | ||||||||
| Balance as of December 31, 2008 |
230 | — | — | 230 | ||||||||||||
| Restructuring charges |
744 | 43 | 1,271 | 2,058 | ||||||||||||
| Utilization |
(805 | ) | (43 | ) | (871 | ) | (1,719 | ) | ||||||||
| Balance as of December 31, 2009 |
169 | — | 400 | 569 | ||||||||||||
| Restructuring charges (unaudited) |
— | 407 | — | 407 | ||||||||||||
| Utilization (unaudited) |
— | (407 | ) | (180 | ) | (587 | ) | |||||||||
| Balance as of March 31, 2010 (unaudited) |
$ | 169 | $ | — | $ | 220 | $ | 389 | ||||||||
| 9. | Capital Structure |
At March 31, 2010 and at December 31, 2010, we had authorized 975,000,000 shares of capital stock, of which 625,000,000 shares are designated as common stock and 350,000,000 are designated as preferred stock.
Terms of the preferred stock and redeemable preferred stock are presented in Note 10, “Preferred Stock and Redeemable Preferred Stock.” Information regarding stock options and warrants outstanding is included in Note 11, “Stock Options and Warrants.” The terms of our common stock are as follows:
Common Stock
Dividend
The holders of common stock shall be entitled to receive, when, as and if declared by our board of directors, any dividends, subject to the rights of holders of other classes of stock outstanding having prior rights as to dividends.
Voting
The holder of each share of common stock shall have the right to one vote for each share, and shall be entitled to notice of any stockholders’ meeting in accordance with the our bylaws, and shall be entitled to vote upon such matters and in such manner as may be provided by law.
Liquidation
In the event of liquidation, holders of common stock shall receive all remaining proceeds from the liquidation of the Company following the satisfaction of the preferences of the holders of preferred
F-27
Table of Contents
Motricity, Inc.
Notes to Consolidated Financial Statements
(amounts in thousands, except share data and per share amounts)
stock. These proceeds shall be distributed among the holders of Series E preferred stock and common stock pro rata based on the number of shares of common stock held by each (assuming full conversion of all such Series E preferred stock).
Restricted Stock
Restricted stock has been granted to certain employees and one non-employee. Vesting of all restricted shares granted on or after October 25, 2006 is subject to a double trigger vesting requirement under the terms of the restricted stock agreement. The double trigger consists of time-based vesting and occurrence of a liquidation event, defined as a qualified public offering or a qualified sale of the Company. If no liquidation event occurs within 10 years, the stock is forfeited. The restricted stock agreement also includes provisions to accelerate vesting of the shares based upon liquidation event vesting conditions, and does not require the employee to be employed at the date of the liquidation event to receive the shares that have vested based on the service period. We consider the restricted stock outstanding upon grant and include them in common stock outstanding. These shares have voting and dividend rights upon grant. These rights are forfeited should the stock not vest. Under these terms vesting of the shares is not probable until a liquidation event is probable. Therefore, no compensation expense has been recognized related to the grant of these shares of restricted stock. Had a qualified event occurred on March 31, 2010, the related compensation expense would have been $16,285 and additional compensation expense of approximately $13,197 would be recognized over a weighted-average period of 2.9 years.
| Restricted Stock | Shares | ||
| December 31, 2006 |
712,055 | ||
| Granted |
594,963 | ||
| Lapse of restriction |
(40,849 | ) | |
| Forfeited |
(325,364 | ) | |
| December 31, 2007 |
940,805 | ||
| Granted |
781,385 | ||
| Lapse of restriction |
(40,849 | ) | |
| Forfeited |
(603,552 | ) | |
| December 31, 2008 |
1,077,789 | ||
| Granted |
950,000 | ||
| Lapse of restriction |
(24,510 | ) | |
| Forfeited |
(94,230 | ) | |
| December 31, 2009 |
1,909,049 | ||
| Granted (unaudited) |
132,667 | ||
| Forfeited (unaudited) |
(32,208 | ) | |
| March 31, 2010 (unaudited) |
2,009,508 | ||
As of December 31, 2008 and 2009 and March 31, 2010, restricted stock included 49,019, 24,509 and 24,509 shares, respectively, of restricted stock that were not subject to the double trigger vesting requirement. The restriction on these shares lapses as the shares vest based on service conditions. At the time the restriction lapses, we reclassify the shares from restricted stock to common stock.
F-28
Table of Contents
Motricity, Inc.
Notes to Consolidated Financial Statements
(amounts in thousands, except share data and per share amounts)
| 10. | Preferred Stock and Redeemable Preferred Stock |
The following is a summary of our $0.001 par value Series D1 preferred stock and $0.001 par value Series A, B, C, D, E, F, G, H, and I redeemable preferred stock:
| As of December 31, 2008 | As of December 31, 2009 | As of March 31, 2010 (Unaudited) | ||||||||||||||||||||||
| Security |
Carrying Value |
Liquida- tion Value |
Issued & Outstanding Shares |
Carrying Value |
Liquida- tion Value |
Issued & Outstanding Shares |
Carrying Value |
Liquida- tion Value |
Issued & Outstanding Shares | |||||||||||||||
| Preferred stock |
||||||||||||||||||||||||
| Series D1 |
$ | 17,393 | $ | 19,777 | 7,338,769 | $ | 17,393 | $ | 20,472 | 7,338,769 | $ | 17,393 | $ | 20,645 | 7,338,769 | |||||||||
| Redeemable preferred stock |
||||||||||||||||||||||||
| Series A |
$ | 6,323 | $ | 6,365 | 8,740,368 | $ | 6,547 | $ | 6,579 | 8,740,368 | 6,604 | 6,632 | 8,740,368 | |||||||||||
| Series B |
13,531 | 13,617 | 23,323,936 | 14,006 | 14,076 | 23,323,936 | 14,129 | 14,189 | 23,323,936 | |||||||||||||||
| Series C |
2,665 | 2,682 | 2,259,121 | 2,758 | 2,772 | 2,259,121 | 2,782 | 2,794 | 2,259,121 | |||||||||||||||
| Series D |
442 | 445 | 375,000 | 458 | 460 | 375,000 | 462 | 464 | 375,000 | |||||||||||||||
| Series E |
31,170 | 31,530 | 29,404,456 | 32,349 | 32,610 | 29,404,456 | 32,655 | 32,876 | 29,404,456 | |||||||||||||||
| Series F |
93,621 | 97,273 | 36,684,050 | 98,242 | 100,751 | 36,684,050 | 99,454 | 101,609 | 36,684,050 | |||||||||||||||
| Series G |
29,423 | 30,499 | 12,248,642 | 29,821 | 30,499 | 12,248,642 | 29,923 | 30,499 | 12,248,642 | |||||||||||||||
| Series H |
49,761 | 81,713 | 21,084,337 | 50,770 | 52,500 | 21,084,337 | 51,028 | 52,500 | 21,084,337 | |||||||||||||||
| Series I |
167,199 | 192,481 | 190,839,694 | 182,445 | 199,881 | 190,839,694 | 186,587 | 201,706 | 190,839,694 | |||||||||||||||
| Total |
$ | 394,135 | $ | 456,605 | 324,959,604 | $ | 417,396 | $ | 440,128 | 324,959,604 | $ | 423,624 | $ | 443,269 | 324,959,604 | |||||||||
Preferred Stock
The Series D1 preferred stock is not redeemable and, therefore, cumulative unpaid dividends in arrears are not recorded on our consolidated balance sheets. However, such cumulative unpaid dividends are included in net loss attributable to common stockholders for all periods presented.
Redeemable Preferred Stock
In February 2007, we issued 21,084,337 shares of Series H preferred stock to new investors. We received proceeds of $49,511, net of issuance costs of $2,989. In connection with this financing round, we issued three warrants to the investors to purchase 108,500 shares of our common stock. The warrants are immediately exercisable with a five-year term. The fair value of the warrants at the grant date was determined to be $1,807 using the Black-Scholes option pricing model.
In December 2007, we issued 190,839,694 shares of Series I preferred stock and received proceeds of $172,291, net of cash issuance costs of $12,824.
We utilized the consulting services of an investor in connection with the InfoSpace Mobile acquisition. As consideration for such services, the investor received a cash payment of $3,000 (included within the total cash issuance costs of $12,824) and a warrant to purchase 2,578,915 shares of Series I preferred stock at an exercise price of $0.9694 per share. The preferred stock warrant is immediately exercisable with a seven-year term. The fair value of the warrant at the grant date was determined to be $1,062 using the Black-Scholes option pricing model and has been recorded within redeemable preferred stock warrants on the consolidated balance sheets.
We also utilized a placement agent in completing the Series I preferred stock financing round. As consideration for placement services, the placement agent received a cash payment of $9,230
F-29
Table of Contents
Motricity, Inc.
Notes to Consolidated Financial Statements
(amounts in thousands, except share data and per share amounts)
(included within the total cash issuance costs of $12,824), a warrant to purchase 6,340,676 shares of Series I preferred stock at an exercise price of $0.9694 per share, and a warrant to purchase 16,667 shares of common stock at an exercise price of $14.54 per share. The preferred stock warrant and common stock warrant are immediately exercisable with seven-year terms. The fair value of the preferred stock warrant at the grant date was determined to be $2,610 using the Black-Scholes option pricing model and has been recorded within redeemable preferred stock warrants on the consolidated balance sheets using a residual value approach. The fair value of the common stock warrant at the grant date was determined to be $115 using the Black-Scholes option pricing model and has been allocated to additional paid-in capital using a residual value approach. We subsequently modified the terms of the placement agent’s existing services agreement, and as consideration for this modification, the placement agent agreed to surrender warrants to purchase 122,138 shares of common stock issued in conjunction with the Series F and G preferred stock financing rounds. These warrants held exercise prices of $35.55 and $37.35 per share. The fair value of the surrendered common stock warrants received was determined to be $209 using the Black-Scholes option pricing model and has been charged against additional paid-in capital using a residual value approach.
We issued additional warrants to purchase 2,689,951 shares of common stock in connection with the Series I financing round. Under the terms of the Series I preferred stock, investors received warrants to purchase 0.0133 shares of common stock for each share of preferred stock purchased in the transaction. Under this provision, we issued warrants to purchase 2,544,527 shares of common stock at an exercise price of $14.54 per share. These warrants are exercisable through December 28, 2014. In order to secure participation from four investors in the Series I financing round, we issued warrants to purchase 106,833 shares of common stock at an exercise price of $14.54 per share on September 30, 2007. In addition, we issued warrants to purchase 38,590 shares of common stock to one investor at an exercise price of $14.54 per share on December 28, 2007 in order to secure its approval of the Series I financing round. The warrants were immediately exercisable with a seven-year term. We valued these warrants to purchase 2,689,951 shares of common stock using the Black-Scholes option pricing model and allocated net proceeds of $15,248 to additional paid-in capital using a relative fair-value approach.
Dividends
We have never declared or paid any dividends on our common or preferred stock. Shares of our redeemable preferred stock and preferred stock accrue dividends per annum at the rates set forth in the following table (listed in order of preference):
| Series I | $0.039 | |
| Series H | — | |
| Series G | — | |
| Series F (E & F have equal preference) | $0.095 | |
| Series E (E & F have equal preference) | $0.037 | |
| Series D1 | $0.095 per share upon a liquidating event | |
| Series D (A, B, C & D have equal preference) | $0.040 | |
| Series C (A, B, C & D have equal preference) | $0.040 | |
| Series B (A, B, C & D have equal preference) | $0.020 | |
| Series A (A, B, C & D have equal preference) | $0.025 |
Series A, B, C, D, E, F, H and I holders receive cumulative dividends when and if declared by the board of directors. Series G preferred stockholders receive noncumulative dividends when and if
F-30
Table of Contents
Motricity, Inc.
Notes to Consolidated Financial Statements
(amounts in thousands, except share data and per share amounts)
declared by the board of directors. After payment of such dividends, any additional dividends shall be distributed among the holders of common stock and Series E preferred stock in proportion to the number of shares of common stock that would be held by each holder if all shares of Series E preferred stock were converted to common stock at the then effective conversion rate. Holders of Series D1 preferred stock are entitled to receive annual dividends equal to $0.095 per share upon a liquidating event, or cumulative dividends when and if declared by the board of directors. Cumulative unpaid dividends due to Series D1 preferred stockholders upon a liquidation event at December 31, 2007, 2008 and 2009 and March 31, 2010 were $1,687, $2,384, $3,080 and $3,252, respectively.
Liquidation Preference
The liquidation value of our redeemable preferred stock and preferred stock is as set forth in the following table (listed in order of preference):
| Series I |
$ | 0.97 | |
| Series H |
$ | 2.49 | |
| Series G |
$ | 2.49 | |
| Series F |
$ | 2.37 | |
| Series E |
$ | 0.92 | |
| Series D1 |
$ | 2.37 | |
| Series D |
$ | 1.00 | |
| Series C |
$ | 1.00 | |
| Series B |
$ | 0.49 | |
| Series A |
$ | 0.61 |
Following the payment of the Series I liquidation preference, but before the payment of any Series I unpaid dividends, whether declared or undeclared, holders of Series H preferred stock shall be entitled to receive their liquidation preference plus (1) all declared but unpaid dividends and (2) all unpaid and undeclared cumulative dividends. Following the Series H payment, holders of Series I preferred stock shall be entitled to receive their declared but unpaid dividends.
Following the Series I and H payments, holders of Series G preferred stock shall be entitled to receive their liquidation value, excluding any declared but unpaid dividends. Following the payment of the Series G liquidation preference, Series F and E preferred stockholders shall be entitled to receive their liquidation value plus all declared but unpaid dividends in order of preference.
Following the Series F and E payments, holders of Series G preferred stock shall receive an amount equal to all declared but unpaid dividends. Following the payment of the Series G dividends, holders of Series I preferred stock shall be entitled to receive their undeclared and unpaid cumulative dividends.
Upon the completion of these distributions, holders of Series F and E preferred stock shall be entitled to receive an amount equal to all unpaid and undeclared cumulative dividends, whether or not earned. Then, Series D1 holders shall be entitled to receive their liquidation value, all declared but unpaid dividends and all unpaid and undeclared cumulative dividends, if any, whether or not earned.
Following the payment of the Series D1 liquidation preference, Series D, C, B and A holders shall have the right to their liquidation preference, all declared but unpaid dividends and all unpaid and undeclared cumulative dividends, if any, whether or not earned.
F-31
Table of Contents
Motricity, Inc.
Notes to Consolidated Financial Statements
(amounts in thousands, except share data and per share amounts)
All of the remaining proceeds shall be distributed among the holders of Series E preferred stock and common stock pro rata based on the number of shares of common stock held by each, assuming full conversion of all such Series E preferred stock and excluding the additional Series E IPO shares to be issued in the event of conversion of the Series E preferred stock into shares of common stock, as discussed in the conversion section.
Voting Rights
The holder of each share of Series D1, E, F, G, H, and I preferred stock shall have the right to one vote for each share of common stock into which such shares of Series D1, E, F, G, H, and I preferred stock could then be converted, and shall have full voting rights and powers equal to the voting rights and powers of the holders of common stock. Holders of Series A, B, C, and D preferred stock shall not be entitled to vote on any matter.
Conversion
Each share of Series I, H, G, F, E, and D1 preferred stock shall be convertible, at the option of the holder thereof, into such number of fully paid and nonassessable shares of common stock as is determined by dividing the original issue price by the conversion price. The conversion price reflects the 15-to-1 split of our common stock. The table below outlines the original issue price and the conversion price:
| Original Issue Price |
Conversion Price | |||||
| Series I preferred stock |
$ | 0.9694 | $ | 14.54 | ||
| Series H preferred stock |
2.4900 | 35.55 | ||||
| Series G preferred stock |
2.4900 | 35.55 | ||||
| Series F preferred stock |
2.3700 | 35.55 | ||||
| Series E preferred stock |
0.9182 | 13.77 | ||||
| Series D1 preferred stock |
2.3700 | 35.55 | ||||
Due to certain antidilution protection provisions in our certificate of incorporation, holders of Series D1, F, G, and H will receive additional shares of common stock upon conversion as a result of the issuance of the Series I preferred stock, and the total number of additional shares of common stock that will be issued if all shares of Series D1, F, G, and H are converted is 2,540,438.
Each share of Series I, H and G preferred stock shall automatically be converted into shares of common stock at their respective conversion rates upon the earlier of (A) a firm-commitment underwritten public offering at a price which shall not be less than $14.54 per share for Series I and $25.20 per share for Series H and G, the proceeds of which are a minimum of $40,000 in the aggregate or (B) the date specified by written consent or agreement of the holders of a majority of the then outstanding shares of the respective series of preferred stock.
Each share of Series D1, E, and F preferred stock shall automatically be converted into shares of common stock at their respective conversion rates, upon the earlier of (A) a firm-commitment underwritten public offering, at a price which shall not be less than $35.55 per share and the proceeds of which are a minimum of $40,000 in the aggregate or (B) (1) with respect solely to the Series D1 and F preferred stock, the date specified by written consent or agreement of the holders of Series D1 and F preferred stockholders voting together as a single class and not as a separate series, and on an
F-32
Table of Contents
Motricity, Inc.
Notes to Consolidated Financial Statements
(amounts in thousands, except share data and per share amounts)
as-converted basis and (2) with respect solely to the Series E preferred stock, the date specified by written consent or agreement of the holders of Series E preferred stockholders. In the event of conversion of the Series E preferred stock into shares of common stock, we shall issue to each stockholder that number of fully paid and nonassessable shares of common stock equal to the quotient of the aggregate Series E liquidation preference and all unpaid and undeclared cumulative dividends, divided by the price per share to the public as printed on the final prospectus filed with the Securities and Exchange Commission in connection with the initial public offering.
Each share of Series A, B, C and D preferred stock shall automatically be converted into shares of common stock immediately upon a firm-commitment underwritten public offering. In the event of such a public offering, we shall issue to each stockholder that number of shares of common stock equal to the quotient of the respective Series A, B, C or D liquidation preferences of such shares calculated as of the closing of the public offering, divided by the price per share to the public as printed on the final prospectus filed with the Securities and Exchange Commission in connection with such public offering.
Redemption
At any time on or after August 31, 2011, the holders of Series I, H and G preferred stock, voting independently as single classes, may elect by simple majority vote to have all outstanding shares of their respective preferred stock redeemed by payment of a sum per share equal to their respective liquidation preferences and all undeclared and unpaid dividends. On the redemption date, we shall pay the cash payment in immediately available funds or by the issuance of a promissory note which shall bear simple interest at the rate of 4% per annum and shall be payable in eight consecutive quarterly installments with the first such installment becoming due and payable on the first anniversary of the redemption date; provided, however, that in lieu of receiving the cash payment in the form of a promissory note, any holder of Series I, H or G preferred stock may instead elect to be redeemed quarterly and receive the cash payment in eight consecutive quarterly installments.
At any time on or after August 31, 2011, the holders of Series E and F preferred stock, voting together as a single class, may elect by simple majority vote to have all outstanding shares of Series E and F preferred stock redeemed by payment of (A) Series F preferred stock by paying in cash a sum per share equal to the Series F liquidation preference and all unpaid and undeclared cumulative dividends and (B) Series E preferred stock by paying in cash a sum per share equal to the Series E liquidation preference and all unpaid and undeclared cumulative dividends. We shall also issue at the redemption of each share of Series E preferred stock that number of fully paid and nonassessable shares of common stock that would be issuable if such share of Series E preferred stock were converted to common stock at the then effective Series E conversion rate as of the redemption date. On the redemption date, we shall pay the Series F and E redemption payments, in immediately available funds or by the issuance of a promissory note which shall bear simple interest at the rate of 4% per annum and shall be payable in eight consecutive quarterly installments with the first such installment becoming due and payable on the first anniversary of the redemption date; provided, however, that in lieu of receiving the redemption payment in the form of a promissory note, any holder of Series E or F preferred stock may instead elect to be redeemed quarterly and receive the redemption price in eight consecutive quarterly installments.
Following payment in full of the Series E, F, G, H and I redemption payments, we shall notify each stockholder of Series D preferred stock of the redemption of the Series E, F, G, H and I preferred
F-33
Table of Contents
Motricity, Inc.
Notes to Consolidated Financial Statements
(amounts in thousands, except share data and per share amounts)
stock. Thereafter, the holders of two-thirds (2/3) of the total number of Series D preferred stock may elect to have all shares of the Series D preferred stock redeemed by us. We shall redeem from holders all shares of Series D preferred stock on the thirtieth day next following the date of the Series D redemption notice. On the redemption date, the Company shall pay the Series D redemption payment, in immediately available funds or by the issuance of a promissory note which shall bear simple interest at the rate of 4% per annum and shall be payable in eight consecutive quarterly installments with the first such installment becoming due and payable on the first anniversary of the redemption date.
Following payment in full of the Series D, E, F, G, H and I redemption payments, we shall notify each holder of Series A, B, and C preferred stock of the redemption of the Series D, E, F, G, H and I preferred stock. Thereafter, the holders of two-thirds (2/3) of the total number of shares of Series A, B, and C preferred stock may elect to have all shares of the Series A, B and C preferred stock redeemed by us. We shall redeem all shares of Series A, B and C preferred stock on the thirtieth day next following the date of the redemption notice. On the redemption date, the Company shall pay the Series A, B and C redemption payments, in immediately available funds or by the issuance of a promissory note which shall bear simple interest at the rate of 4% per annum and shall be payable in eight consecutive quarterly installments with the first such installment becoming due and payable on the first anniversary of the respective redemption date.
Carrying Value
The Series A, B, C, D, E, F, G, H and I preferred stock were initially recorded at the total net proceeds received at issuance. The difference between the total net proceeds received and the redemption prices of each series is being accreted using the effective interest method over the period from issuance until the redemption date, August 31, 2011. For the years ended December 31, 2007, 2008 and 2009, accretion totaled $7,399, $21,729 and $23,261, respectively. Accretion totaled $5,815 and $6,228 for the three months ended March 31, 2009 and 2010, respectively.
| 11. | Stock Options and Warrants |
Stock Options
On March 19, 2004, we established the 2004 Stock Incentive Plan (the “2004 Plan”). As amended on October 9, 2007, we may grant options of up to 5,113,004 shares under the 2004 Plan. Options granted under the 2004 Plan may be incentive stock options or nonqualified stock options and are to have an exercise period not to exceed 10 years. The exercise price of incentive stock options cannot be less than 100% of the estimated fair market value per share of our common stock on the grant date. Options granted under the 2004 Plan vest over various periods ranging from one to four years. The 2004 Plan also permits us to issue restricted stock and bonus stock grants. Upon the exercise of stock options, we issue the resulting shares from shares reserved for issuance under the 2004 Plan. The 2004 Plan limits the number of shares that may be granted during any 12-month period to a single participant to 266,667.
F-34
Table of Contents
Motricity, Inc.
Notes to Consolidated Financial Statements
(amounts in thousands, except share data and per share amounts)
The following table summarizes all stock option activity for the years ended December 31, 2008 and 2009 and the three months ended March 31, 2010 (unaudited):
| Shares | Weighted- Average Exercise Price Per Share |
Remaining Average Contractual Term (Years) |
Aggregate Intrinsic Value | ||||||||
| Outstanding, December 31, 2007 |
1,424,684 | $ | 12.00 | 3.81 | $ | 5,568 | |||||
| Granted |
480,511 | 12.00 | |||||||||
| Exercised |
(102,832 | ) | 1.20 | ||||||||
| Forfeited |
(360,516 | ) | 16.20 | ||||||||
| Expired |
(222,302 | ) | 19.35 | ||||||||
| Outstanding, December 31, 2008 |
1,219,545 | 10.35 | 6.54 | $ | 3,675 | ||||||
| Granted |
196,817 | 14.10 | |||||||||
| Exercised |
(52,922 | ) | 0.30 | ||||||||
| Forfeited |
(98,989 | ) | 13.20 | ||||||||
| Expired |
(38,990 | ) | 18.60 | ||||||||
| Outstanding, December 31, 2009 |
1,225,461 | 10.80 | 6.43 | $ | 11,498 | ||||||
| Granted |
28,453 | 19.82 | |||||||||
| Exercised |
(7,167 | ) | 19.65 | ||||||||
| Forfeited |
(68,041 | ) | 17.85 | ||||||||
| Expired |
— | ||||||||||
| Outstanding, March 31, 2010 |
1,178,706 | $ | 10.67 | 6.58 | $ | 11,473 | |||||
| Exercisable at March 31, 2010 |
706,973 | $ | 8.87 | 5.21 | $ | 8,470 | |||||
| Vested and expected to vest at March 31, 2010 |
1,113,852 | $ | 10.34 | 6.14 | $ | 11,572 | |||||
The total intrinsic value of options exercised during the years ended December 31, 2007, 2008 and 2009 and the three months ended March 31, 2010 was $2,292, $618, $663 and $139 respectively.
In determining the compensation cost of the stock options granted, the fair value of each option grant has been estimated on the date of grant using the Black-Scholes option pricing model. The assumptions used in these calculations are summarized as follows:
| Year Ended December 31, 2008 |
Year Ended December 31, 2009 |
Three Months Ended March 31, 2010 | ||||||
| Expected term of options granted |
5 years | 5 years | 5 years | |||||
| Expected volatility range |
58 | % | 50% - 58 | % | 50% | |||
| Range of risk-free interest rates |
2.8% - 3.3 | % | 1.7% - 2.3 | % | 2.3% | |||
| Expected dividend yield |
0 | % | 0 | % | 0% |
We calculate expected volatility for stock options using historical volatility for a peer group of 10 companies, as we believe the expected volatility will approximate historical volatility of the peer group. The risk-free interest rate for the expected terms of the stock options is based on the U.S. Treasury constant maturities in effect at the time of grant.
F-35
Table of Contents
Motricity, Inc.
Notes to Consolidated Financial Statements
(amounts in thousands, except share data and per share amounts)
The weighted-average grant date fair value of options granted during the years ended December 31, 2007, 2008 and 2009 and the three months ended March 31, 2010 were $8.10, $6.30, $7.05 and $9.04 respectively.
Stock-based compensation expense for the years ended December 31, 2007, 2008 and 2009 was $688, $2,344 and $2,179, respectively and $532 and $505 for the three months ended March 31, 2009 and 2010, respectively, and was included in datacenter and network operations, product development and sustainment, sales and marketing and general and administrative expenses.
At December 31, 2009 and March 31, 2010, there was $2,975 and $2,488, respectively, of total unrecognized compensation costs, net of estimated forfeitures, related to unvested options that are expected to be recognized over a weighted-average period of 2.3 and 2.2 years, respectively.
Warrants
On May 16, 2007, we issued to an affiliate of an existing investor a warrant to purchase 128,571 shares of common stock at an exercise price of $32.25 per share as consideration for a financing commitment in connection with a proposed transaction that was not completed. The warrant is exercisable immediately with a seven-year term. The fair value of the common stock warrant at the grant date was determined to be $2,600 using the Black-Scholes option pricing model and has been recorded as abandoned acquisition expense within the consolidated statements of operations.
All warrants were outstanding and exercisable for the entire period from January 1, 2008 through March 31, 2010. Warrants were primarily issued in conjunction with financing rounds to investors or other parties and none are held by employees. The following table summarizes the outstanding warrants to purchase common and redeemable preferred stock as of December 31, 2009 and March 31, 2010:
| Number of Warrants |
Warrant to Purchase |
Exercise Price Per Share |
Expiration Date | ||||
| 1,666 | Common stock |
$ | 3.75 | June 22, 2010 | |||
| 108,500 | Common stock |
35.55 | February 23, 2012 | ||||
| 8,130 | Common stock |
30.75 | December 30, 2012 | ||||
| 427 | Common stock |
30.75 | February 22, 2013 | ||||
| 128,571 | Common stock |
32.25 | May 16, 2014 | ||||
| 20,000 | Common stock |
32.25 | June 29, 2014 | ||||
| 123,500 | Common stock |
14.54 | September 30, 2014 | ||||
| 2,583,117 | Common stock |
14.54 | December 28, 2014 | ||||
| 182,198 | Series A redeemable preferred stock and common stock (prior to adjustment for a 15-for-1 reverse stock split of our common stock) |
0.30 | April 7, 2011 | ||||
| 70,000 | Series B redeemable preferred stock and common stock (prior to adjustment for a 15-for-1 reverse stock split of our common stock) |
0.49 | April 8, 2012 | ||||
| 40,000 | Series B redeemable preferred stock and common stock (prior to adjustment for a 15-for-1 reverse stock split of our common stock) |
0.49 | July 25, 2012 | ||||
| 8,919,591 | Series I redeemable preferred stock |
0.97 | December 28, 2014 | ||||
F-36
Table of Contents
Motricity, Inc.
Notes to Consolidated Financial Statements
(amounts in thousands, except share data and per share amounts)
The Series A and Series B redeemable preferred stock and common stock warrants are each exercisable for one share of redeemable preferred stock and one share of common stock.
The redeemable preferred stock warrants are adjusted to reflect the current fair value as determined using the Black-Scholes model. The change in the fair value of the redeemable preferred stock warrants was a $310 decrease in 2007, a $283 decrease in 2008 and a $1,495 increase in 2009. The change in the fair value of the redeemable preferred stock warrants was a $46 decrease and a $261 increase in the three months ended March 31, 2009 and 2010, respectively. The weighted-average assumptions used in these calculations are summarized as follows:
| Year Ended December 31, 2008 |
Year Ended December 31, 2009 |
Three Months Ended March 31, 2010 |
|||||||
| Expected term |
6 years | 5 years | 5 years | ||||||
| Expected volatility |
58.0 | % | 50.0 | % | 50.5 | % | |||
| Risk-free interest rate |
1.8 | % | 2.6 | % | 2.5 | % | |||
| Expected dividend yield |
3.9 | % | 3.9 | % | 3.9 | % |
The expected term is the remaining contractual life for each warrant and the risk-free interest rate is based on the U.S. Treasury constant maturities in effect at the end of the reporting period.
Expected volatility is calculated using a historical volatility for a peer group of ten companies, as we believe the expected volatility will approximate historical volatility of the peer group.
| 12. | Income Taxes |
The following table presents the domestic and foreign components of the pre-tax loss from continuing operations and the income tax provision for the years ended December 31:
| 2007 | 2008 | 2009 | ||||||||||
| Income from continuing operations before tax: |
||||||||||||
| U.S. |
$ | (51,183 | ) | $ | (75,395 | ) | $ | (13,087 | ) | |||
| Foreign |
(422 | ) | 343 | (1,318 | ) | |||||||
| Total |
$ | (51,605 | ) | $ | (75,052 | ) | $ | (14,405 | ) | |||
| The income tax provision consisted of the following amounts: |
||||||||||||
| Current: |
||||||||||||
| U.S. |
$ | — | $ | — | $ | (88 | ) | |||||
| Foreign |
— | — | — | |||||||||
| — | — | (88 | ) | |||||||||
| Deferred: |
||||||||||||
| U.S. |
— | 1,776 | 1,984 | |||||||||
| Foreign |
— | — | — | |||||||||
| — | 1,776 | 1,984 | ||||||||||
| Total |
$ | — | $ | 1,776 | $ | 1,896 | ||||||
F-37
Table of Contents
Motricity, Inc.
Notes to Consolidated Financial Statements
(amounts in thousands, except share data and per share amounts)
Significant components of our deferred tax assets and liabilities consist of the following as of December 31:
| 2007 | 2008 | 2009 | ||||||||||
| Domestic net operating loss carry forwards |
$ | 57,652 | $ | 75,043 | $ | 80,251 | ||||||
| Fixed assets |
(96 | ) | 7,822 | 3,132 | ||||||||
| Research and development credits |
3,068 | 4,125 | 5,037 | |||||||||
| Foreign net operating loss carry forwards |
300 | 79 | 399 | |||||||||
| Domestic net operating loss carry forwards |
— | — | 108 | |||||||||
| Compensation accruals |
1,019 | 1,701 | 3,568 | |||||||||
| Deferred revenue |
— | — | 1,988 | |||||||||
| Amortization of intangible assets |
(4,781 | ) | (3,433 | ) | (1,458 | ) | ||||||
| Allowance for bad debts |
131 | 345 | 94 | |||||||||
| Severance and restructuring |
8 | 57 | 63 | |||||||||
| Other accruals |
255 | 175 | (570 | ) | ||||||||
| Total deferred tax assets |
57,556 | 85,914 | 92,612 | |||||||||
| Valuation allowance for deferred assets |
(57,556 | ) | (85,914 | ) | (92,612 | ) | ||||||
| Deferred tax assets |
$ | — | $ | — | $ | — | ||||||
| Amortization of goodwill |
(1,776 | ) | (3,760 | ) | ||||||||
| Net deferred tax liability |
$ | (1,776 | ) | $ | (3,760 | ) | ||||||
As of December 31, 2009, we provided a full valuation allowance against the net deferred tax assets since realization of these benefits was not more likely than not. The $6,698 increase in the valuation allowance for the period December 31, 2008 to December 31, 2009 was related to additional deferred tax assets generated, consisting primarily of net operating losses. The deferred tax asset includes net assets that were acquired in business combinations.
We had research and development tax credit carryforwards of $5,037 at December 31, 2009 that will begin to expire in 2014. During 2009, our research and development credit carryforward increased due to credits generated in 2009, but was partially offset by a $45 refundable research and development credit. For 2009 we have recorded an anticipated refund of $43. The 2008 and 2009 refundable research and development credits resulted in $88 of current tax benefit.
As of December 31, 2009, we had domestic net operating loss carryforwards of $222,019 for federal purposes and $89,002 for state purposes. These net operating loss carryforwards begin to expire in varying amounts starting in 2019 for U.S. federal income tax purposes and in the current year for state income tax purposes. The ultimate availability of the federal and state net operating loss carryforwards to offset future income may be subject to limitation under the rules regarding changes in stock ownership as determined by the Internal Revenue Code.
F-38
Table of Contents
Motricity, Inc.
Notes to Consolidated Financial Statements
(amounts in thousands, except share data and per share amounts)
Taxes computed at the statutory federal income tax rate of 34% are reconciled to the income tax provision as follows:
| 2007 | 2008 | 2009 | |||||||
| United States federal tax at statutory rate |
34.0 | % | 34.0 | % | 34.0 | % | |||
| Change in valuation allowance |
(21.9 | ) | (38.0 | ) | (46.5 | ) | |||
| State taxes (net of federal benefit) |
2.3 | 3.0 | 2.5 | ||||||
| Tax credits earned |
1.5 | 1.5 | 6.9 | ||||||
| Foreign rate differential |
0.0 | (0.5 | ) | (0.9 | ) | ||||
| Effect of rate change |
(3.3 | ) | 0.0 | (1.0 | ) | ||||
| Provision to return |
1.1 | 1.8 | (2.4 | ) | |||||
| Non-deductible expenses and other |
(13.7 | ) | (4.2 | ) | (5.8 | ) | |||
| Effective rate |
0.0 | % | (2.4 | )% | (13.2 | )% | |||
As of January 1, 2007, we adopted the authoritative accounting guidance prescribing a threshold and measurement attribute for the financial recognition and measurement of a tax position taken or expected to be taken in a tax return. The guidance defines the confidence level that a tax position must meet in order to be recognized in the financial statements and also provides for de-recognition of tax benefits, classification on the balance sheet, interest and penalties, accounting in interim periods, disclosure and transition. Upon adoption there was no cumulative effect adjustment to accumulated deficit. The adoption of this guidance and current year activity did not have an impact on our consolidated financial statements.
F-39
Table of Contents
Motricity, Inc.
Notes to Consolidated Financial Statements
(amounts in thousands, except share data and per share amounts)
| 13. | Net Loss Per Share Attributable to Common Stockholders |
Basic and diluted net loss per share attributable to common stockholders have been computed based on net loss and the weighted-average number of common shares outstanding during the applicable period. We calculate potentially dilutive incremental shares issuable using the treasury stock method and the if-converted method, as applicable. The treasury stock method assumes that the proceeds received from the exercise of stock options and warrants, as well as stock option and restricted stock expense yet to be recorded for unvested shares would be used to repurchase common shares in the market at the average stock price during the period. We have excluded options to purchase common stock, restricted stock, preferred stock and warrants to purchase common and redeemable preferred stock, as the potentially issuable shares covered by these securities are antidilutive. In addition, redeemable preferred stock has also been excluded because its conversion into common stock, and therefore its impact upon dilution, cannot be determined without an initial public offering price or liquidation factor. The following table presents the antidilutive securities not included in net loss attributable to common stockholders:
| Year Ended December 31, | Three Months Ended March 31, | |||||||||
| 2007 | 2008 | 2009 | 2009 | 2010 | ||||||
| (unaudited) | ||||||||||
| Options to purchase common stock |
1,424,683 | 1,219,544 | 1,225,460 | 1,307,351 | 1,178,706 | |||||
| Restricted stock |
818,257 | 1,028,769 | 1,884,539 | 1,371,206 | 1,984,998 | |||||
| Preferred stock |
10,876,759 | 10,876,759 | 10,876,759 | 10,876,759 | 10,876,759 | |||||
| Warrants to purchase common stock |
2,973,911 | 2,973,911 | 2,973,911 | 2,973,911 | 2,973,911 | |||||
| Warrants to purchase redeemable preferred stock and common stock |
292,198 |
292,198 | 292,198 | 292,198 | 292,198 | |||||
| Warrants to purchase redeemable preferred stock |
8,919,591 | 8,919,591 | 8,919,591 | 8,919,591 | 8,919,591 | |||||
| Total securities excluded from net loss per share attributable to common stockholders |
25,305,399 | 25,310,772 | 26,172,458 | 25,741,016 | 26,226,163 | |||||
The pro forma basic and diluted net loss per share calculations for the year ended December 31, 2009 and the three months ended March 31, 2010 assume the conversion of all outstanding redeemable preferred stock and preferred stock, other than Series H, into shares of common stock using the as-if-converted method, as of January 1, 2009 or the date of issuance, if later.
F-40
Table of Contents
Motricity, Inc.
Notes to Consolidated Financial Statements
(amounts in thousands, except share data and per share amounts)
The following table sets forth the computation of basic and diluted net loss per share attributable to common stockholders for the period indicated:
| Year Ended December 31, | Three Months Ended March 31, |
|||||||||||||||||||
| 2007 | 2008 | 2009 | 2009 | 2010 | ||||||||||||||||
| (Unaudited) | ||||||||||||||||||||
| Net loss attributable to common stockholders |
$ | (85,988 | ) | $ | (100,454 | ) | $ | (40,257 | ) | $ | (12,958 | ) | $ | (7,933 | ) | |||||
| Weighted-average common shares outstanding |
5,795,940 | 5,843,489 | 5,878,368 | 5,886,763 | 5,753,047 | |||||||||||||||
| Net loss per share attributable to common stockholders – basic and diluted |
$ | (14.84 | ) | $ | (17.19 | ) | $ | (6.85 | ) | $ | (2.20 | ) | $ | (1.38 | ) | |||||
| (Unaudited) | ||||||||||||||||||||
| Pro forma adjustment to reverse mark-to-market adjustments of the redeemable convertible preferred stock warrants |
1,495 | 261 | ||||||||||||||||||
| Pro forma adjustment to reverse accretion of redeemable preferred stock to redemption value and Series D1 preferred dividends |
22,947 | 6,142 | ||||||||||||||||||
| Pro forma adjustment to reflect stock-based compensation due to the vesting of restricted stock triggered by the closing of the public offering |
(15,430 | ) | (16,285 | ) | ||||||||||||||||
| Net loss used to compute pro forma net loss per share attributable to common stockholders |
$ | (31,245 | ) | $ | (17,815 | ) | ||||||||||||||
| Shares used above |
5,878,368 | 5,753,047 | ||||||||||||||||||
| Pro forma adjustment to reflect assumed conversion of redeemable preferred stock and preferred stock to common stock shares, issuance of shares to be sold in this offering and restricted stock which will be fully vested as a result of this offering, used to compute pro forma basic and diluted net loss per share |
31,227,972 | 31,715,051 | ||||||||||||||||||
| Weighted-average common shares outstanding for pro forma basic and diluted net loss per share |
37,106,340 | 37,468,098 | ||||||||||||||||||
| Pro forma net loss per share attributable to common stockholders – basic and diluted |
$ | (0.84 | ) | $ | (0.48 | ) | ||||||||||||||
F-41
Table of Contents
Motricity, Inc.
Notes to Consolidated Financial Statements
(amounts in thousands, except share data and per share amounts)
| 14. | Defined Contribution Plan |
We maintain a defined contribution plan (the “401(k) Savings Plan”) for eligible employees. The 401(k) Savings Plan assets are held in trust and invested as directed by the plan participants, and shares of our common stock are not an eligible investment election. We provide a match on a specified portion of eligible employees’ contributions as approved by our board of directors. Historically, we have made matching contributions equal to 50% of the portion of contributions that do not exceed 6% of eligible pay. Our matching contributions, included in general and administrative, totaled $419 and $630 in 2008 and 2009, respectively.
| 15. | Discontinued Operations |
In 2007, we enacted a plan to exit our D2C business through sale of assets as we began to focus our strategy on providing mobile content solutions and services for the wireless industry. In connection with the strategy change, eReader, one of the D2C divisions, was sold for $2,500 during 2007, resulting in a loss on sale of $1,360, representing the excess of the carrying value over the proceeds. We received $2,200 during 2008 and $300 was collected in 2009. In June 2008, the remaining portions of the D2C business were sold for $2,500 to a related party investor and board member, resulting in a loss of $127. The board member resigned on June 3, 2008.
The significant components of loss from discontinued operations for 2007, net of income taxes, are as follows:
| M&E | D2C | eReader | Year Ended December 31, 2007 |
||||||||||||
| Revenue for discontinued operations |
$ | 1,841 | $ | 11,171 | $ | 3,573 | $ | 16,585 | |||||||
| Net operating income (expenses) from discontinued operations |
$ | (21,981 | ) | $ | (1,243 | ) | $ | 1,147 | $ | (22,077 | ) | ||||
| Impairment of goodwill |
— | (2,851 | ) | — | (2,851 | ) | |||||||||
| Net income (loss) from discontinued operations |
$ | (21,981 | ) | $ | (4,094 | ) | $ | 1,147 | $ | (24,928 | ) | ||||
During 2008, as part of a business strategy reassessment initiated in 2007, we decided to exit M&E through a wind-down of its operations which was completed in September 2008. Operations of M&E have been classified as discontinued operations and reflected in loss from discontinued operations in the consolidated statements of operations.
The significant components of loss from discontinued operations for 2008, net of income taxes, are as follows:
| M&E | D2C | Year Ended December 31, 2008 |
||||||||||
| Revenue for discontinued operations |
$ | 1,194 | $ | 2,334 | $ | 3,528 | ||||||
| Net loss from discontinued operations |
$ | (571 | ) | $ | (501 | ) | $ | (1,072 | ) | |||
F-42
Table of Contents
Motricity, Inc.
Notes to Consolidated Financial Statements
(amounts in thousands, except share data and per share amounts)
| 16. | Related Party Transactions |
Under the terms of the 2004 merger transaction between Pinpoint Networks, Inc. and PBH Holdings, the existing investors of PBH Holdings agreed to continue their guarantees of the outstanding debt that was transferred to PBH, Inc. Details of this debt are included in Note 6, “Debt Facilities.” The amount outstanding under the 2004 Line of Credit, $4,875 at December 31, 2008, was guaranteed by such investors.
In 2007, we sold D2C for $2,500 to a related party investor and board member. The board member resigned on June 3, 2008. See Note 15, “Discontinued Operations.”
In consideration of an agreement by a related party investor to provide a financing commitment letter in connection with a proposed transaction that was not completed in 2007, we issued a warrant for 128,571 shares of common stock at an exercise price of $32.25 per share.
In September 2007, two related party investors deposited $36,500 and $20,000, respectively, in escrow accounts on our behalf to facilitate our ability to negotiate the acquisition of InfoSpace Mobile. In consideration of these deposits, we issued warrants to purchase 81,833 shares and 16,667 shares of common stock, respectively, at an exercise price of $14.54 per share. Additionally, in connection with the InfoSpace Mobile acquisition, we received consulting services from another related party investor in exchange for cash in the amount of $3,000 and warrants to purchase 2,578,915 shares of Series I preferred stock at an exercise price of $0.9694 per share.
A related party investor acted as a placement agent in each of our Series F, G, H and I financing rounds. As compensation for those services, we paid cash in the amount of $16,837, warrants to purchase 64,916 shares of common stock at an exercise price of $35.55 per share, warrants to purchase 29,093 shares of common stock at an exercise price of $37.35 per share, and a warrant to purchase 6,340,676 shares of preferred stock at an exercise price of $0.9694 per share.
Under the terms of the employment agreement with our Chief Executive Officer, we issued loans of $250 and $32 in 2004 for the costs of relocating to our headquarters in Durham, North Carolina. The loans carry an annual interest rate equal to the prime rate, with the applicable interest rate for the year set on January 1 of each year. Interest is payable annually, and the loans are repayable to the Company upon a liquidation event, including the sale or disposition of substantially all of our assets, the sale of more than 50% of the then outstanding common stock in a single transaction, or an initial public offering of our common stock. The outstanding loan balances, including accrued interest, was $326 and $345 at December 31, 2007 and 2008, respectively, and were included in other assets on the consolidated balance sheets. On December 18, 2009, all amounts outstanding between us and the Chief Executive Officer, including the principal and accrued interest on the loans, were settled by the Chief Executive Officer through a transfer of 22,134 shares of common stock.
During 2008, in connection with the relocation of our headquarters to Bellevue, Washington, we paid a relocation services company to purchase, on our behalf, the Chief Executive Officer’s home in North Carolina for $1,983, plus administrative fees. As a result of market conditions, in the fourth quarter of 2008, we recorded a restructuring charge of $342 related to the home and an additional restructuring charge of $203 during 2009. The asset is recorded within assets held for sale on the consolidated balance sheets for $1,700 and $1,606 as of December 31, 2008 and 2009, respectively. In March 2010, the home was sold for net proceeds of $1,199, and a loss on the sale of $407 was recorded as restructuring expense.
F-43
Table of Contents
Motricity, Inc.
Notes to Consolidated Financial Statements
(amounts in thousands, except share data and per share amounts)
During 2009, we purchased the home of our new Chief Operating Officer in order to facilitate his relocation to Bellevue, Washington. We purchased the home for $1,195, and as a result of market conditions we recorded an impairment charge of $317. In November 2009, the home was sold for net proceeds of $874.
| 17. | Subsequent Events |
On April 23, 2010, our Board of Directors approved an amendment to our Amended and Restated Certificate of Incorporation to effect a 15-to-1 split of our common stock. The Amended and Restated Certificate of Incorporation is expected to be approved by our stockholders, and will be filed prior to effectiveness of the registration statement relating to the initial public offering of which this prospectus is a part. All information related to common stock, options and warrants to purchase common stock and earnings per share included in the accompanying consolidated financial statements has been retroactively adjusted to give effect to the reverse stock split.
On April 25, 2010, our Board of Directors approved an amendment to our Amended and Restated Certificate of Incorporation, which will be in effect upon consummation of the initial public offering of which this prospectus is a part. The amendment will reflect that our authorized capital stock will consist of 975,000,000 shares, comprising: (i) 625,000,000 shares of common stock, par value $0.001 per share and (ii) 350,000,000 shares of preferred stock, par value $0.001 per share. All share information included in these consolidated financial statements has been adjusted to reflect this reincorporation.
| 18. | Subsequent Events (unaudited) |
On April 6, 2010, under the terms of our 2010 Long Term Incentive Plan (“LTIP”), our Board of Directors granted options to purchase 333,333 shares of our common stock at $20.40 per share to our Chief Executive Officer, which vest in pro-rata equal installments on each of the first four anniversaries of the effective date of an initial public offering, and the Chief Executive Officer remains an employee in good standing on the applicable vesting dates. If no initial public offering occurs on or prior to July 31, 2010, the options will be forfeited.
On April 19, 2010, under the terms of our LTIP, our Board of Directors approved options to employees to purchase 446,000 shares of our common stock at an initial public offering per share price, provided that the initial public offering occurs prior to July 31, 2010. These options will be granted upon completion of the initial public offering and vest in pro-rata equal installments on each of the first four anniversaries of the effective date of the initial public offering.
Our Board of Directors approved the 2010 Long-Term Incentive Plan (“2010 LTIP”) on April 23, 2010. We may grant options of up to 2,765,622 shares under the 2010 LTIP. Awards granted under the 2010 LTIP may include incentive stock options or nonqualified stock options, stock appreciation rights, restricted stock and other stock-based or cash-based awards. Option terms may not exceed 10 years and the exercise price cannot be less than 100% of the estimated fair market value per share of our common stock on the grant date. As of March 31, 2010, no awards have been granted under the 2010 LTIP. Any shares awarded or issued pursuant to the exercise of stock options may be (i) authorized and unissued shares of our common stock or (ii) shares of common stock held in or acquired for our treasury. The maximum number of shares subject to any performance award to any participant during any fiscal year shall be 266,667 shares. The maximum cash payment made under a performance award granted to any participant with respect to any fiscal year shall be $5,440.
F-44
Table of Contents
Motricity, Inc.
Notes to Consolidated Financial Statements
(amounts in thousands, except share data and per share amounts)
In May 2010, we agreed with Koala Holding LP to extend the redemption date of the Series H preferred stock from August 31, 2011 to August 31, 2013 and to provide for cumulative dividends from the date of the consummation of this offering at the rate of 8% per annum, accruing daily whether or not earned or declared, which shall be paid in additional shares of Series H preferred stock, paid quarterly. Our Series H preferred stock is convertible at the option of the holders thereof into common stock at a rate of approximately 0.104 shares of common stock for each share of Series H preferred stock (which shall be subject to adjustments including for stock splits, stock dividends and certain dilutive issuances). In addition, Koala Holding LP has agreed that the Series H preferred stock will convert at our option into shares of common stock if (i) the public offering price of this offering is more than $20.35 per share; or (ii) the average closing price over a 90-day period is $23.21 per share or higher. In such event, each share of Series H preferred stock will convert into approximately 0.104 shares of common stock, subject to adjustment.
The Series H preferred stock has a liquidation preference of $2.49 per share. On or after August 31, 2013, upon request of at least a majority of the then outstanding shares of Series H preferred stock, we must redeem the Series H preferred stock in immediately available funds or by the issuance of a promissory note which shall bear simple interest at the rate of 4% per annum and shall be payable in eight consecutive quarterly installments with the first such installment becoming due and payable on the first anniversary of the redemption payment date (determined once such written request is received); provided, however, that in lieu of receiving the redemption payment in the form of a promissory note, any holder of Series H preferred stock may instead elect to be redeemed quarterly and receive the redemption payment in eight consecutive quarterly installments.
In connection with our initial public offering AEI has provided and is providing advisory services to us. In exchange for such advisory services, we agreed to pay AEI an advisory fee of up to $2 million, $1 million payable prior to the consummation of the offering and up to $1 million, $400,000 payable upon the launch of the “road show” in connection with the offering and $600,000 payable upon consummation of this offering out of the proceeds of this offering. If the offering is not consummated, the initial $1 million shall be credited against future advisory services, if any.
F-45
Table of Contents
SCHEDULE II—VALUATION AND QUALIFYING ACCOUNTS
| Years Ended December 31, |
||||||||
| 2008 | 2009 | |||||||
| (In thousands) | ||||||||
| Tax Valuation Allowance: |
||||||||
| Beginning balance |
$ | 57,556 | $ | 85,914 | ||||
| Charged to net loss |
28,358 | 6,698 | ||||||
| Charges utilized/write-offs |
— | — | ||||||
| Ending balance |
$ | 85,914 | $ | 92,612 | ||||
| Allowance for Doubtful Accounts: |
||||||||
| Beginning balance |
$ | 794 | $ | 997 | ||||
| Charged to costs and expenses |
309 | — | ||||||
| Charges utilized/write-offs |
(106 | ) | (725 | ) | ||||
| Acquired in acquisition |
— | — | ||||||
| $ | 997 | $ | 272 | |||||
F-46
Table of Contents

Table of Contents
6,750,000 Shares
Motricity, Inc.
Common Stock
J.P. Morgan
Goldman, Sachs & Co.
Deutsche Bank Securities
RBC Capital Markets
Baird
Needham & Company, LLC
Pacific Crest Securities
Table of Contents
PART II
INFORMATION NOT REQUIRED IN PROSPECTUS
| Item 13. | Other Expenses of Issuance and Distribution. |
The following table sets forth the costs and expenses, other than the underwriting discounts and commissions, we expect to incur in connection with the sale of the common stock being registered. All amounts are estimated except the SEC registration fee and the Financial Industry Regulatory Authority (“FINRA”) filing fees.
| Amount To Be Paid | |||
| SEC registration fee |
$ | 17,825 | |
| FINRA filing fee |
25,500 | ||
| Blue Sky fees and expenses |
10,000 | ||
| NASDAQ listing fee |
175,000 | ||
| Printing and engraving expenses |
175,000 | ||
| Legal fees and expenses |
1,400,000 | ||
| Accountants’ fees and expenses |
1,300,000 | ||
| Transfer agent and custodian fees |
18,500 | ||
| Miscellaneous |
4,800,000 | ||
| Total |
$ | 7,921,825 | |
| Item 14. | Indemnification of Directors and Officers. |
We are incorporated under the laws of the State of Delaware. Section 145 of the General Corporation Law of the State of Delaware, or DGCL, provides that a Delaware corporation may indemnify any persons who were, are, or are threatened to be made, parties to any threatened, pending or completed action, suit or proceeding, whether civil, criminal, administrative or investigative (other than an action by or in the right of such corporation), by reason of the fact that such person is or was an officer, director, employee or agent of such corporation, or is or was serving at the request of such corporation as a director, officer, employee or agent of another corporation, partnership, joint venture, trust or other enterprise. The indemnity may include expenses (including attorneys’ fees), judgments, fines and amounts paid in settlement actually and reasonably incurred by such person in connection with such action, suit or proceeding, provided that such person acted in good faith and in a manner he or she reasonably believed to be in or not opposed to the corporation’s best interests and, for any criminal action or proceeding, had no reasonable cause to believe his or her conduct was unlawful.
A Delaware corporation may indemnify officers and directors against expenses (including attorneys’ fees) in connection with the defense or settlement of an action by or in the right of the corporation under the same conditions, except that no indemnification is permitted without judicial approval if the officer or director is adjudged to be liable to the corporation. Where an officer or director is successful on the merits or otherwise in the defense of any action referred to above, the corporation must indemnify him or her against the expenses which such officer or director actually and reasonably incurred.
In accordance with Section 102 of the DGCL, our amended and restated certificate of incorporation contains a provision to limit the personal liability of our director’s violations of their fiduciary duty. This provision eliminates each director’s liability to us and our stockholders for monetary damages except (i) for any breach of the director’s duty of loyalty to us or to our stockholders, (ii) for acts or omissions not in good faith or which involve intentional misconduct or a knowing violation of
II-1
Table of Contents
law, (iii) under Section 174 of the DGCL providing for liability of directors for unlawful payment of dividends or unlawful stock purchases or redemptions, or (iv) for any transaction from which a director derived an improper personal benefit.
We have also entered into indemnification agreements with our officers and directors, substantially in the form of the indemnification agreement filed by us as an exhibit to this registration statement on Form S-1. These indemnification agreements provide contractual indemnification to our officers and directors in addition to the indemnification provided in our amended and restated certificate of incorporation and bylaws.
We currently have directors’ and officers’ liability insurance policies to insure our directors and officers against liability for actions or omissions occurring in their capacity as a director or officer, subject to certain exclusions and limitations.
Reference is made to the form of underwriting agreement filed as Exhibit 1.1 hereto for provisions providing that the underwriters are obligated, under certain circumstances, to indemnify our directors, officers and controlling persons against certain liabilities under the Securities Act of 1933, as amended (the “Securities Act”).
| Item 15. | Recent Sales of Unregistered Securities. |
In the past three years, we have issued unregistered securities to a limited number of persons, as described below. None of these transactions involved any underwriters, underwriting discounts or commissions, or any public offering, and we believe each transaction was exempt from the registration requirements of the Securities Act by virtue of Section 4(2) thereof or Rule 701 pursuant to compensatory benefit plans and contracts related to compensation.
1. In February 2007, we sold an aggregate of 21,084,337 shares of Series H Preferred Stock at $2.49 per share for an aggregate purchase price of approximately $52.5 million to three accredited investors. In connection with this financing round, we issued three warrants to the investors to purchase 108,500 shares of our common stock at an exercise price of $35.55 per share.
2. In May 2007, we issued to an affiliate of an existing investor, as consideration for a financing commitment in connection with a proposed transaction that was not completed, a warrant to purchase 128,571 shares of common stock at an exercise price of $32.25 per share.
3. In June 2007, in connection with our credit facility, we issued warrants to purchase 20,000 shares of common stock to Silicon Valley Bank at an exercise price of $32.25 per share.
4. In September 2007, we issued warrants to purchase an aggregate of 123,500 shares of common stock at an exercise price of $14.54 per share to four investors in conjunction with the Series I Preferred Stock financing round.
5. In December 2007, we sold an aggregate of 190,839,694 shares of Series I Preferred Stock at $0.9694 per share for an aggregate purchase price of approximately $185 million to both existing and new investors. In connection with our acquisition of InfoSpace Mobile, we issued a warrant for consulting services of an investor to purchase 2,578,915 shares of Series I Preferred Stock at an exercise price of $0.9694 per share. We utilized a placement agent in completing the Series I Preferred Stock financing round, and as part of the consideration for placement services, the placement agent received a warrant to purchase 6,340,676 shares of Series I preferred stock at an exercise price of $0.9694 per share. In addition, the placement agent surrendered warrants to purchase 122,138 shares of common stock issued in conjunction with the Series F and G Preferred Stock financing rounds with exercise prices between $35.55 and $37.35 per share. We issued warrants to purchase an aggregate of 2,706,618 shares of common stock at an exercise price of $14.54 per share to the Series I investors.
II-2
Table of Contents
We have also issued stock options and made restricted stock grants under our Amended and Restated 2004 Stock Incentive Plan, a written compensatory benefit plan under which we have issued options and restricted stock grants to employees, consultants and directors. Since March 31, 2007, we have issued to certain officers, employees, consultants and directors 2,406,765 shares of restricted stock and options to purchase 1,398,020 shares of common stock at exercise prices ranging from $12.00 to $32.25 per share, with an aggregate exercise price of $19.6 million. As of March 31, 2010, options to purchase 1,178,706 shares of common stock with an aggregate exercise price of $12.6 million remain outstanding. Since March 31, 2007, we have sold and issued to our officers, employees, consultants and directors 172,773 shares of our common stock pursuant to option exercises at prices ranging from $0.30 to $32.25 per share for an aggregate purchase price of $168,981. All of our option grants in the past three years were to purchase shares of our common stock and were made under our 2004 Stock Incentive Plan.
In addition, under our 2010 Long-Term Incentive Plan, our Compensation Committee has approved a grant to certain employees of options to purchase 446,000 shares of common stock with an exercise price equal to the initial public offering price per share. If the public offering does not occur on or before July 31, 2010, these grants shall be null and void. In connection with the renegotiation of his employment agreement, our Compensation Committee has also approved a grant to our Chief Executive Officer to purchase 333,333 shares of common stock at an exercise price of $20.40 with an aggregate exercise price of $6.8 million. If the public offering does not occur on or before July 31, 2010, this grant will be forfeited.
| Item 16. | Exhibits. |
(a) See the Exhibit Index on the pages immediately preceding the exhibits for a list of exhibits filed as part of this registration statement on Form S-1, which Exhibit Index is incorporated herein by reference.
(b) Financial Statement Schedules
Schedules have been omitted because the information required to be set forth therein is not applicable or is shown in the consolidated financial statements or notes thereto.
| Item 17. | Undertakings. |
Insofar as indemnification for liabilities arising under the Securities Act may be permitted to our directors, officers and controlling persons pursuant to the provisions described in Item 14 above, or otherwise, we have been advised that in the opinion of the Securities and Exchange Commission such indemnification is against public policy as expressed in the Securities Act and is, therefore, unenforceable. In the event that a claim for indemnification against such liabilities (other than the payment by us of expenses incurred or paid by a director, officer or controlling person of us in the successful defense of any action, suit or proceeding) is asserted by such director, officer or controlling person in connection with the securities being registered, we will, unless in the opinion of our counsel the matter has been settled by controlling precedent, submit to a court of appropriate jurisdiction the question whether such indemnification by us is against public policy as expressed in the Securities Act and will be governed by the final adjudication of such issue.
The undersigned registrant hereby undertakes to provide to the underwriters at the closing specified in the underwriting agreement, certificates in such denominations and registered in such names as required by the underwriters to permit prompt delivery to each purchaser.
We hereby undertake that:
(i) for purposes of determining any liability under the Securities Act, the information omitted from the form of prospectus filed as part of this registration statement in reliance upon Rule 430A
II-3
Table of Contents
and contained in a form of prospectus filed by the Registrant pursuant to Rule 424(b)(1) or (4) or 497(h) under the Securities Act shall be deemed to be part of this registration statement as of the time it was declared effective; and
(ii) for purposes of determining any liability under the Securities Act, each post-effective amendment that contains a form of prospectus shall be deemed to be a new registration statement relating to the securities offered therein, and the offering of such securities at that time shall be deemed to be the initial bona fide offering thereof.
II-4
Table of Contents
SIGNATURES
Pursuant to the requirements of the Securities Act of 1933, as amended, the registrant has duly caused this Registration Statement on Form S-1 to be signed on its behalf by the undersigned, thereunto duly authorized, in Bellevue, Washington, on June 7, 2010.
| MOTRICITY, INC. | ||
| By: | /s/ RYAN K. WUERCH | |
| Ryan K. Wuerch | ||
| Chief Executive Officer | ||
Pursuant to the requirements of the Securities Act of 1933, this Registration Statement has been signed by the following persons in the capacities indicated on June 7, 2010.
| Signature |
Title | |
| /s/ RYAN K. WUERCH Ryan K. Wuerch |
Chairman and Chief Executive Officer (Principal Executive Officer) | |
| /s/ ALLYN P. HEBNER Allyn P. Hebner |
Chief Financial Officer (Principal Financial Officer and Principal Accounting Officer) | |
| * Jeffrey A. Bowden |
Director | |
|
Hunter C. Gary |
Director | |
|
Brett Icahn |
Director | |
| * Lady Barbara Judge |
Director | |
| * Suzanne H. King |
Director | |
| * Brian Turner |
Director | |
| *By: | /s/ ALLYN P. HEBNER | |
| Attorney-in-fact |
II-5
Table of Contents
EXHIBIT INDEX
| EXHIBIT NO. |
DESCRIPTION | |
| 1.1 | Form of Underwriting Agreement§ | |
| 3.1 | Restated Certificate of Incorporation* | |
| 3.2 | Amended and Restated Bylaws* | |
| 4.1 | Amended and Restated Stockholders’ Agreement, dated as of October 15, 2007, among Motricity, Inc., certain subsidiaries, and the other parties thereto§ | |
| 4.2 | Amended and Restated Registration Rights Agreement, dated as of October 15, 2007, among Motricity, Inc., certain subsidiaries, and the other parties thereto§ | |
| 4.3 | Amendment No. 1 and Waiver to the Amended and Restated Registration Rights Agreement, dated as of April 13, 2010, among Motricity, Inc., certain subsidiaries, and the other parties thereto§ | |
| 4.4 | Form of Registrant’s Common Stock Certificate§ | |
| 4.5 | Form of Common Stock Warrant§ | |
| 4.6 | Form of Preferred Stock Warrant§ | |
| 4.7 | Form of Warrant Issued to Eastward Capital Partners IV, L.P.§ | |
| 4.8 | Warrant Issued to Silicon Valley Bank by Pinpoint.com, dated June 23, 2000§ | |
| 4.9 | Warrant Issued to Silicon Valley Bank by Pinpoint Networks, Inc., dated April 2002§ | |
| 4.10 | Warrant Issued to Silicon Valley Bank by Pinpoint Networks, Inc., dated April 2002§ | |
| 4.11 | Warrant Issued to Silicon Valley Bank by Motricity, Inc., dated June 29, 2007§ | |
| 5.1 | Opinion of Kirkland & Ellis LLP§ | |
| 10.1 | Loan and Security Agreement, dated as of June 27, 2007, between Silicon Valley Bank and Motricity, Inc., as amended§ | |
| 10.2 | Master Services Agreement, dated as of December 30, 2008, between GlobalLogic, Inc. and Motricity, Inc.†§ | |
| 10.3 | Second Amended and Restated Wireless Services Agreement #00014249, dated as of July 22, 2005, between InfoSpace Mobile, Inc. and Cingular Wireless LLC, as amended†§ | |
| 10.4 | Master Services Agreement Number TJR031606, dated as of September 14, 2006, between Motricity, Inc. and Cingular Wireless LLC, as amended†§ | |
| 10.5 | WAP 2.0 Hosting Agreement, dated as of June 24, 2004, between Premium Wireless Services USA, Inc. d/b/a InfoSpace Mobile and Cellco Partnership d/b/a Verizon Wireless, as amended†§ | |
| 10.6 | Office Lease, dated as of December 21, 2007, between WA—Three Bellevue Center, LLC and Motricity, Inc.†§ | |
| 10.7 | Employment Offer Letter, dated as of May 20, 2009, between Motricity, Inc. and Chris Dorr#§ | |
| 10.8 | Employment Offer Letter, dated as of May 22, 2009, between Motricity, Inc. and Jim Ryan#§ | |
| 10.9 | Employment Offer Letter, dated as of January 7, 2009, between Motricity, Inc. and Jim Smith#§ | |
| 10.10 | Employment Offer Letter, dated as of March 6, 2009, between Motricity, Inc. and Allyn P. Hebner#§ | |
| 10.11 | Employment Offer Letter, dated as of August 8, 2008, between Motricity, Inc. and Richard E. Leigh, Jr.#§ | |
Table of Contents
| EXHIBIT NO. |
DESCRIPTION | |
| 10.12 | Second Amended and Restated Employment Agreement, as amended, dated as of January 1, 2008, between Motricity, Inc. and Ryan K. Wuerch#§ | |
| 10.13 | Amended and Restated Executive Employment Agreement, dated as of January 19, 2010, between Motricity, Inc. and Ryan K. Wuerch#§ | |
| 10.14 | Option Agreement, dated as of March 26, 2010, between Motricity, Inc. and Ryan K. Wuerch#§ | |
| 10.15 | Form of First Amendment to Employment Offer Letter Agreement of Executive Officers#§ | |
| 10.16 | Amended and Restated 2004 Stock Incentive Plan of Motricity, Inc., as amended through August 4, 2005#§ | |
| 10.17 | Motricity, Inc. 2009 Corporate Incentive Plan#†§ | |
| 10.18 | Motricity, Inc. 2010 Amended and Restated Corporate Incentive Plan#†§ | |
| 10.19 | Motricity, Inc. 2010 Long-Term Incentive Plan#§ | |
| 10.20 | Form of Stock Option Agreement under 2004 Plan#§ | |
| 10.21 | Form of Restricted Stock Grant Agreement under 2004 Plan#§ | |
| 10.22 | Form of Motricity, Inc. Indemnification Agreement#§ | |
| 10.23 | Form of Stock Option Agreement under the 2010 LTIP#§ | |
| 10.24 | Omnibus Amendment Agreement, dated as of January 20, 2010, between Advanced Equities, Inc. and Motricity, Inc.§ | |
| 10.25 | Advisory Agreement, dated as of May 5, 2010, between Advanced Equities, Inc. and Motricity, Inc. | |
| 10.26 | Certificate of Amendment to the 2004 Stock Incentive Plan of Motricity, Inc.#§ | |
| 21.1 | List of Subsidiaries§ | |
| 23.1 | Consent of PricewaterhouseCoopers LLP | |
| 23.2 | Consent of Kirkland & Ellis LLP (included in Exhibit 5.1) | |
| 23.3 | Consent of Yankee Group Research, Inc.§ | |
| 24.1 | Power of Attorney§ | |
| 99.1 | Compensation Committee Charter§ | |
| * | To be filed by amendment. |
| # | Indicates a management contract or compensatory plan or arrangement. |
| † | Confidential treatment has been requested for certain provisions of this Exhibit pursuant to Rule 406 promulgated under the Securities Act of 1933. These provisions have been omitted from the filing and submitted separately to the Securities and Exchange Commission. |
| § | Previously filed. |