Attached files
| file | filename |
|---|---|
| 8-K - CURRENT REPORT - CHART INDUSTRIES INC | d8k.htm |
 Chart Industries, Inc.
Investment Highlights
June 8, 2010
Exhibit 99.1 |
 Disclosure
1
Forward-Looking Statements: This presentation includes “forward-looking
statements” within the meaning of the Private Securities Litigation Reform Act of
1995. The use of words such as “may”, “might”, “should”, “will”, “expect”, “plan”, “anticipate”, “believe”,
“estimate”, “project”, “forecast”, “outlook”,
“intend”, “future”, “potential” or “continue”, and other similar expressions are intended to
identify forward-looking statements. All of these forward-looking statements are based
on estimates and assumptions by our management as of the date of this presentation that,
although we believe to be reasonable, are inherently uncertain. Forward- looking statements
involve risks and uncertainties that could cause the Company’s actual results or circumstances to differ
materially from those expressed or implied by forward-looking statements. These risks and
uncertainties include, among others, the following: the cyclicality of the markets that the
Company serves and the vulnerability of those markets to economic downturns; the negative
impacts of the recent global economic and financial crisis; a delay, significant reduction in or loss of purchases by
large customers; fluctuations in energy prices; competition; our reliance on key suppliers and
potential supplier failures or defects; the modification or cancellation of orders in our
backlog; the impact of the financial distress of third parties; changes in government
healthcare regulations and reimbursement policies; general economic, political, business and market
risks associated with the Company's global operations; fluctuations in foreign currency
exchange and interest rates; potential future charges to income associated with potential
impairment of the Company’s significant goodwill and other intangibles; the Company's ability to
successfully manage its costs, core business resources and growth, including its ability to
successfully acquire and integrate new product lines or businesses and manage operational
expansions; the loss of key employees and deterioration of labor and employee relations; the
pricing and availability of raw materials; the Company's ability to manage its fixed-price contract exposure;
the regulation of our products by the U.S. Food & Drug Administration and other governmental
authorities; additional liabilities related to taxes; the costs of compliance with
environmental, health and safety laws, and potential liabilities under these laws; the impact
of hurricanes and other severe weather; litigation and disputes involving the Company, including product liability, contract,
warranty, pension, intellectual property and employment claims; volatility and fluctuation in the
price of the Company’s stock; and risks associated with our indebtedness. For a discussion
of these and additional risks that could cause actual results to differ from those described in
the forward-looking statements, see disclosure under Item 1A. “Risk Factors” in the Company’s most recent
Annual Report on Form 10-K and other recent filings with the Securities and Exchange Commission,
which should be reviewed carefully. Please consider the Company’s
forward-looking statements in light of these risks. Any forward-looking statement
speaks only as of its date. We undertake no obligation to publicly update or revise any
forward-looking statement, whether as a result of new information, future events or
otherwise, except as required by law. This presentation includes certain non-GAAP financial measures as defined in the Securities and
Exchange Commission’s Regulation G. More information on these non-GAAP financial
measures including EBITDA, and the required reconciliations under Regulation G are set forth in
the Appendix to this presentation. EBITDA, as shown in this presentation and the Appendix,
represents earnings before interest, taxes, depreciation and amortization.
|
 SECTION 1
Company Overview |
 3
Energy industry is the largest end-user of the Company’s products
#1 or #2 in all primary markets served
Global operations with 12 manufacturing facilities and about 2,500 employees
$592
million
of
sales, $123
million
of
EBITDA
in
2009
Company Overview
Chart Industries is a leading provider of highly engineered cryogenic
equipment for the hydrocarbon, industrial gas, and biomedical markets.
Asia
23%
U.S.
41%
Americas
(Non-US)
6%
RoW
12%
Europe
18%
2009 Sales by Segment
Energy
63%
BioMedical
15%
General
Industrial
22%
2009 Sales by Region
2009 Sales by End-User
Energy &
Chemicals
43%
Distribution
& Storage
42%
BioMedical
15% |
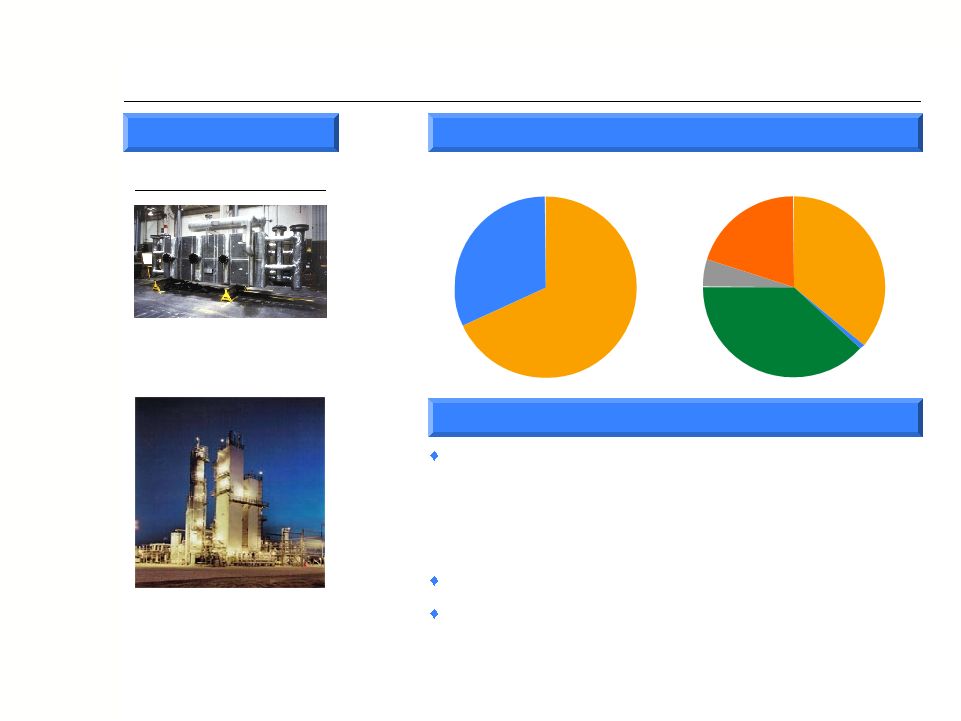 E&C Segment Overview
4
Heat Exchanger
Cold Box
Production
Heat
Exchangers
68%
Cold Boxes and
LNG VIP
32%
2009 Sales by Product/Region
Highlights
Leading provider of heat exchangers and cold boxes critical
to LNG, Olefin petrochemicals and natural gas processing
markets
–
Separation, liquefaction and purification of hydrocarbon and
industrial gases
Leading market positions domestically and internationally
One of three global suppliers of mission-critical LNG and
LNG liquefaction equipment
Selected Products
Americas
(Non-US)
5%
RoW
20%
Asia
38%
U.S.
36%
Europe
1% |
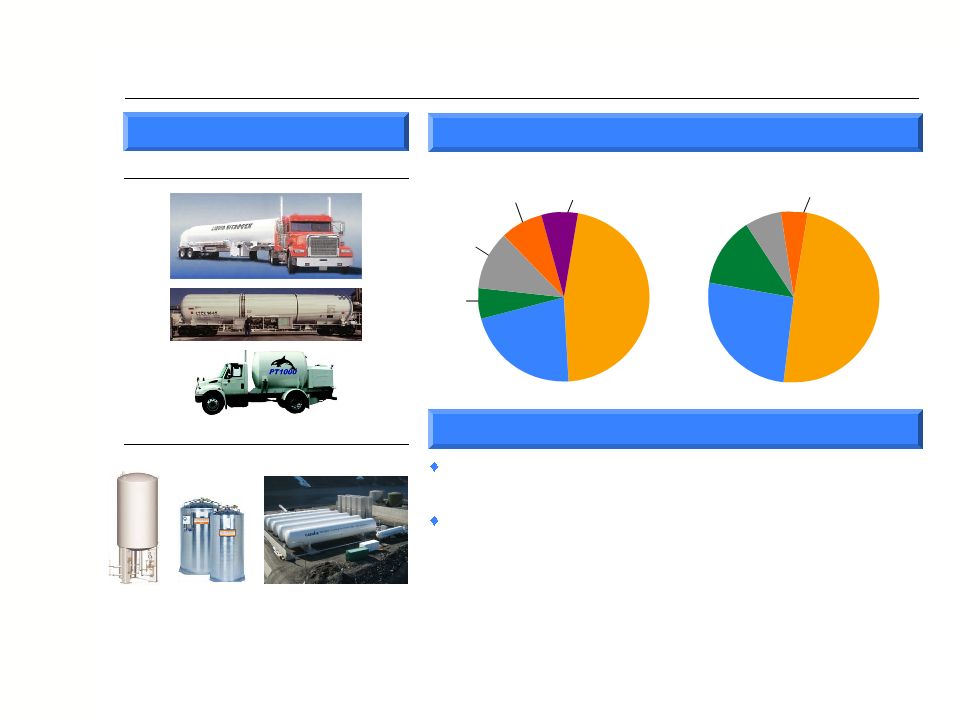 D&S Segment Overview
5
2009 Sales by Product/Region
Highlights
46% of 2009 segment sales derived from products used in
energy applications
Manufacturing strategically located near growing end
markets and lower-cost countries
–
Positioned to capitalize on strong expected growth in Asia and
Eastern Europe
–
Continued investment in key global manufacturing facilities
Bulk
MicroBulk
Distribution
Storage
Selected Products
Satellite
LNG
Storage
Bulk Storage
Systems
46%
Packaged Gas
Systems
22%
VIP, Systems
and Components
6%
Parts, Repair and On-
Site Service
11%
Beverage Liquid
CO
²
Systems
8%
LNG Terminals
and Vehicle Fuel
Systems 7%
Americas
(Non-US)
7%
RoW
5%
Asia
13%
U.S.
49%
Europe
26% |
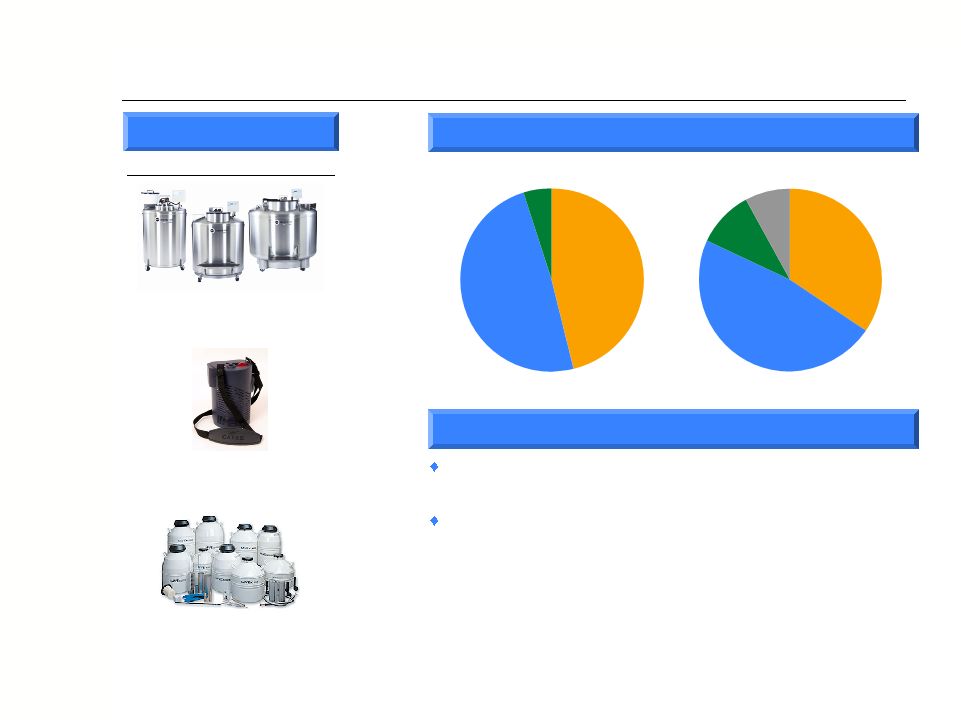 BioMedical
Segment Overview
6
2009 Sales by Product/Region
Highlights
Strong expected growth in oxygen respiratory therapy and
biomedical research, led by international markets
End markets include:
–
Home healthcare and nursing home
–
Hospitals and long-term care
–
Biomedical and pharmaceutical research
–
Animal breeding
Portable Oxygen
Lab Storage
Stainless Steel Freezer
End-Use Consumption
Respiratory
Therapy
Systems
46%
Other
5%
Biological
Storage
Systems
49%
Selected Products
Americas
(Non-US)
9%
U.S.
34%
Europe
47%
Asia
10% |
 SECTION 2
Chart Investment Highlights |
 Summary of Investment Highlights
8
* Source: International Energy Agency - World Energy Outlook 2009, Reference
relating to energy; differences would arise should governments change energy
policies
Scenario. Based on assumption that governments do not change their
policies End markets are positioned to recover with strong energy demand
–
Energy demand recently forecasted to expand 40% between now and 2030*
–
Global investment of $26 trillion, over $1 trillion/year, is needed to keep up with demand*
A market leader
–
Leading market position in all segments
–
Significant sustainable competitive advantages
–
Strong balance sheet with significant liquidity
Aggressive response to the economic downturn
–
Cost management made a priority along with operations excellence
–
Flexible cost structure provides the ability to quickly
downsize SG&A and plant overhead costs
–
Work force levels down 27% from 2008 levels excluding recent acquisitions
–
Have emerged more strongly positioned
Continued growth initiatives
–
Five acquisitions completed since 2006
–
Expect continued acquisition activity due to strong balance sheet and liquidity
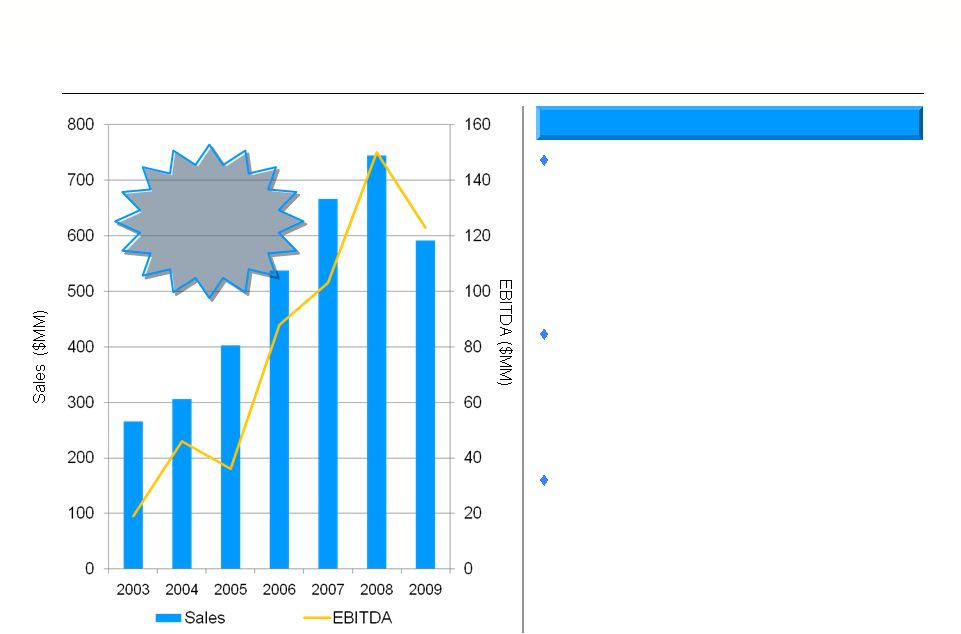
Strong track record of maximizing operating efficiencies and growth
–
14% sales compound annual growth rate (“CAGR”) 2003 through 2009
–
23% EBITDA CAGR 2003 through 2009 |
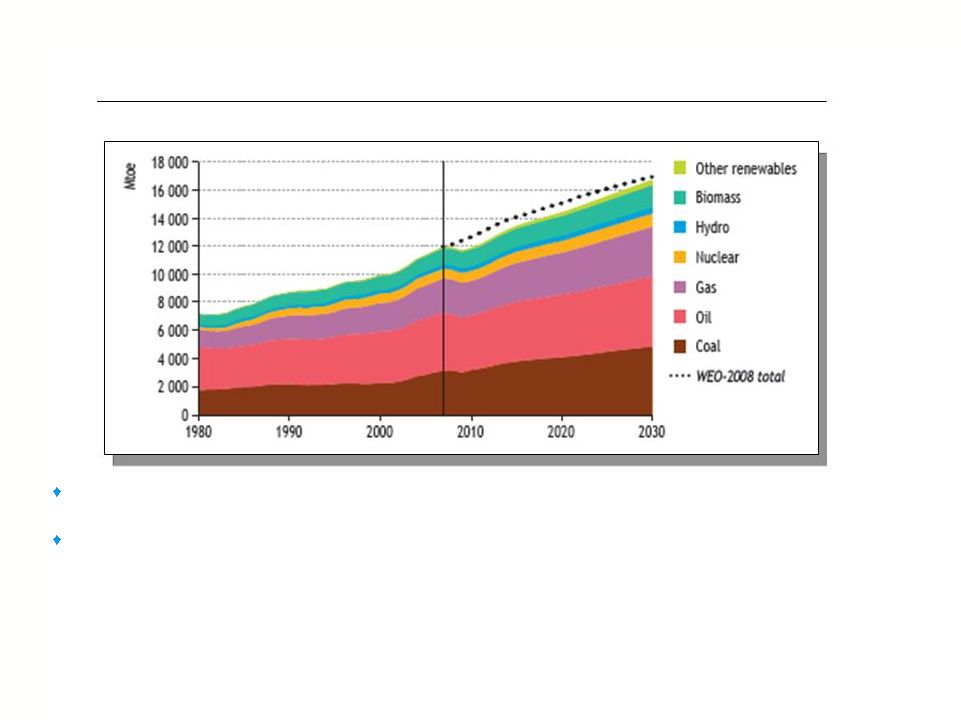 9
World primary demand for natural gas expands on average by 1.5% per
year. The biggest increases occur in the
Middle
East,
China
and
India.
New
power
generation
stations
absorb
45%
of
the
increase. *
Cumulative energy investment needs amount to $26 trillion in
2008-2030. The power transmission, distribution
and generation sectors require 53% of total investment, and gas supply
infrastructure requires 20%.* Energy Trends
World Primary Energy Demand by Fuel*
* Source: International Energy Agency – World Energy Outlook
2009, Reference Scenario
Reference Scenario based on assumption that governments do
not change their policies relating to energy; differences would
arise should governments change energy policies |
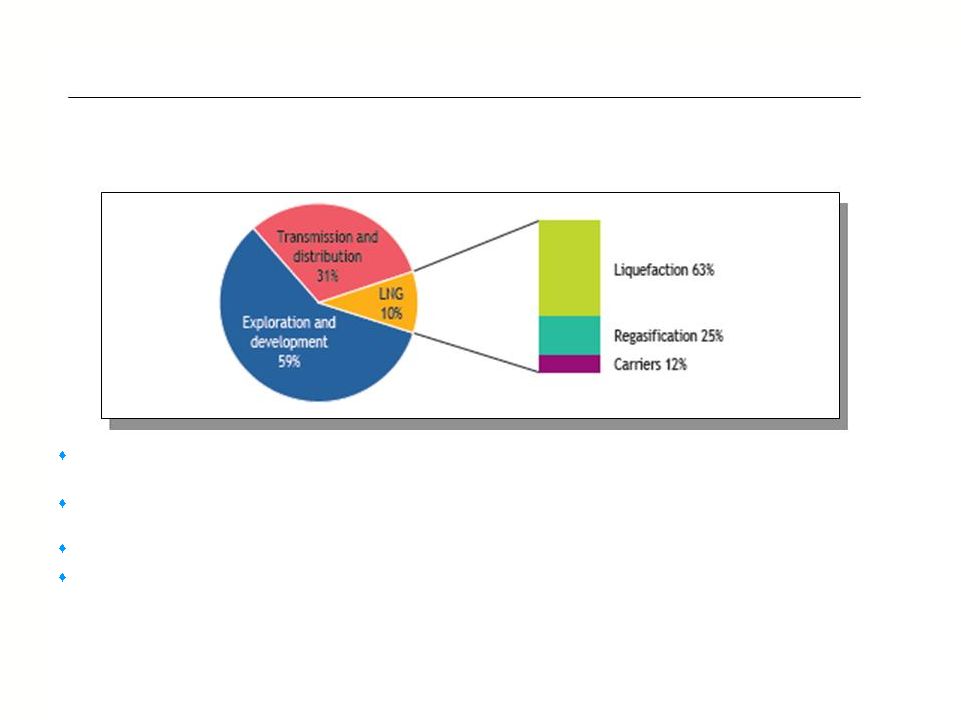 10
Energy Trends
Cumulative Investment in Gas-Supply Infrastructure by Activity,
2008-2030* Total Investment over Period: $5.1 trillion
“Overall global Capex on LNG facilities for the 2010-2014 period is forecast to total over
$108 billion – a growth of 10% relative to the 2005-2009 period.”
Source: Douglas-Westwood World LNG Market Report 2010-2014
- (12/3/2009)
“Global gas demand is likely to rise by 25%, while the use of LNG is set to surge by 40% by
2020.” Source: ExxonMobil
quoted at CWC World LNG Summit, Barcelona - (12/2/2009)
$220 billion annual investment into the entire gas-supply infrastructure is needed through 2030 *
More than half of the global gas investment is needed in non-OECD countries (primarily in Eastern
Europe/Eurasia, Asia and the Middle East) *
* Source: International Energy Agency – World Energy Outlook
2009, Reference Scenario
Reference Scenario based on assumption that governments do
not change their policies relating to energy; differences would
arise should governments change energy policies |
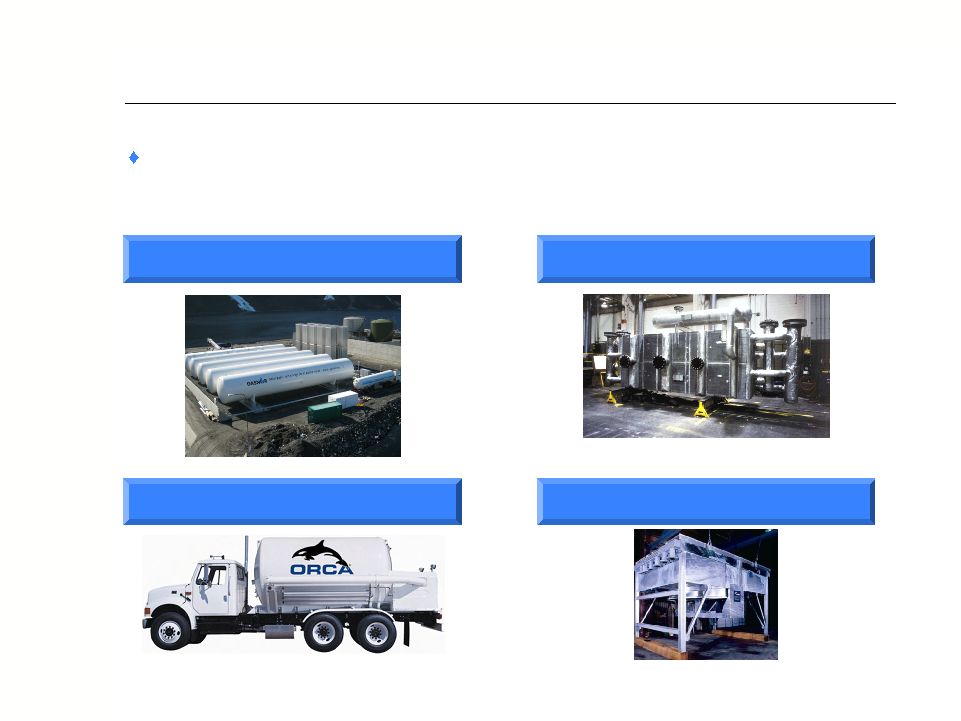
 11
Natural gas is increasing its penetration as a viable transportation fuel due to
its high energy density, lower costs, and low emissions
Chart
provides
products
/
solutions
for
the
full
LNG
value
chain
from
LNG
terminal equipment / liquefiers to on-board fuel tanks
Technical and proprietary innovation with numerous patents granted in our
LNG products
Energy Trends |
 Leading Proprietary Technology and Designs
12
Take advantage of leading proprietary technology and designs through new
product development
Satellite LNG Storage
Brazed Aluminum Heat
Exchangers
MicroBulk
Air Cooled Heat Exchangers |
 Growth Initiatives
13
Current economic environment continues to provide acquisition opportunities for
Companies with strong balance sheets and more than adequate liquidity, such
as Chart
Chart’s acquisition criteria
–
Global niche engineered equipment, systems or aftermarket business
–
Fit with Chart value proposition including product/technology synergies
–
#1 or potential to become #1 within existing or adjacent growth markets
–
Geographic expansion or cost savings synergies
Completed five acquisitions since 2006
–
Cooler Service – air cooled heat exchangers – 2006
–
Flow Instruments – flow meter systems – 2008
–
Tri-Thermal – heat exchanger aftermarket parts – 2009
–
Golden Phoenix – biological storage containers – 2009
–
Covidien – liquid oxygen therapy systems -
2009 |
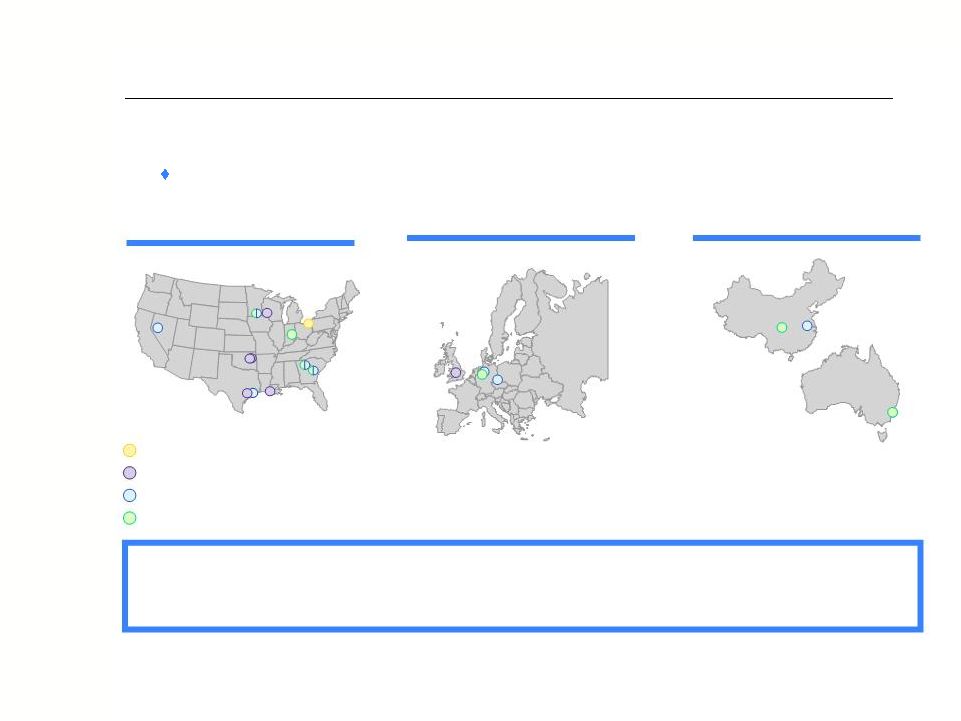 Global Manufacturing and Distribution Platform
14
Operating
leverage
provides
the
flexibility
to
expand
and
reduce
capacity
as needed with minimal capital expenditures
Manufacturing facilities are strategically located in lower-cost countries and
near centers of demand
Corporate
Energy & Chemicals
Distribution & Storage
BioMedical
Total:
Manufacturing:
Europe
Asia-Pacific
12
8
4
2
3
2
North America |
 SECTION 3
Financial Overview |
 Strong Track Record of Successful Execution
16
Drivers of Growth
Distribution & Storage
–
Expanding aftermarket business
–
Global relationships with major industrial gas
companies
–
Well positioned in areas of expected growth
–
Alternative fuel opportunities with LNG
Energy & Chemicals
–
Significant exposure to expected global
energy demand growth
–
Environmental legislation and alternative
energy opportunities
BioMedical
–
Liquid oxygen growth in emerging markets
–
Increasing biological research expenditures
–
Aging demographic
CAGR
(2003-2009)
Sales 14%
EBITDA 23%
(1)
(2)
(1)
EBITDA includes non-recurring costs of $24 million for the acquisition of Chart Industries by
First Reserve.
(2)
EBITDA includes non-recurring costs of $7 million for stock compensation expense due to
secondary stock offering.
|
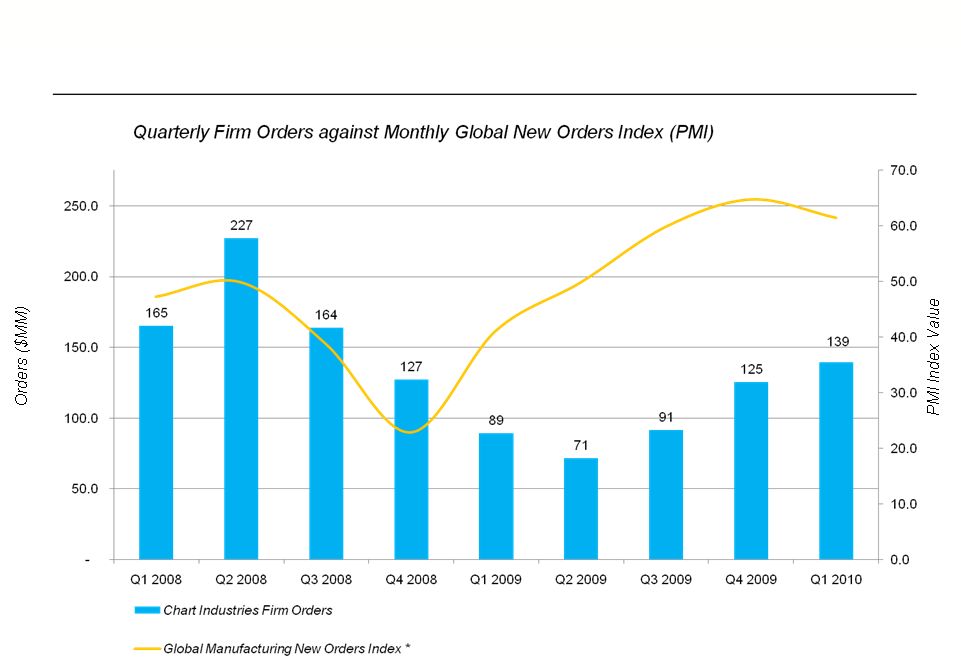 2010 Outlook -
Improving Order Trends
17
* Source: JP Morgan Global Manufacturing PMI |
 2010 Outlook -
Senior Credit Facility Refinancing
Chart has refinanced its current senior secured capital structure, putting in
place a new $200 million senior secured credit facility
-
$135 million Senior Secured Revolver
-
$65 million Senior Secured Term Loan, 10% amortizing annually
-
Five year term, with a scheduled maturity date of May 2015
The refinancing achieved the following for Chart:
-
Extends
maturity
profile,
as
prior
revolving
facility
was
due
to
expire
in
October
2010
-
Improves liquidity
-
Maintains modest total and net leverage
-
Expected to reduce future interest expense with new lower amortizing term loan
18 |
 19
2010 Outlook -
Summary
We continue to see an improving global market in all of our business segments as
evidenced by the continued order improvement.
Continue to pursue strategic accretive acquisitions to expand product and service
offerings. First quarter results were in line with our
expectations. 2010 will be a transition year as we rebuild backlog as
markets continue to recover. -
Margins are lower in our E&C business due to excess industry capacity and the
drawn out return of large capital projects.
Based on first quarter performance, current backlog and order expectations, we
reaffirm our previously announced guidance for 2010 with a sales forecast
of $530 to $560 million and earnings of $0.40 to $0.60 per diluted
share. -
Benefits from recent acquisitions are expected to provide over $60 million in
revenues during 2010. -
This guidance includes approximately $0.20 per diluted share related to expected
restructuring and acquisition costs associated with recently completed
acquisitions, as well as the write-off of deferred financing costs
associated with the Senior Credit Facility refinancing. -
Excluding
these
charges,
earnings
would
be
expected
to
fall
in
a
range
of
$0.60
to
$0.80
per
diluted
share. |
 SECTION 4
Conclusion |
 Positioned on Strong and Stable Platform for Growth
Flexible Manufacturing Platform
–
Ability to ramp up or scale back production as demand fluctuates
–
Necessary capacity expansion/contraction is easily attainable
–
Proven ability to implement cost-savings measures during periods of sharp
decline Very strong balance sheet
–
Significant improvement in net debt position
–
Substantial free cash flow growth
–
Continued ability to invest in and take advantage of growth opportunities
Stable business model
–
Attractive industry with long-term customer relationships
–
Solid platform with worldwide presence and leading market positions in all
segments –
Significant sustainable competitive advantages
Positioned for continued significant growth as markets recover
–
Strong track record of maximizing operating efficiencies and growth
21
Chart represents a unique investment opportunity to capitalize on the return
of strong growth in the markets it serves, particularly natural gas processing
|
 APPENDIX
Reconciliation of Net Income to EBITDA |
 Reconciliation of Net Income to EBITDA
23
($ In Millions)
2003
2004
2005
2006
2007
2008
2009
Net Income (Loss)
$ (7)
$ 23
$ 8
$ 27
$ 44
$ 79
$ 61
Interest expense, net
12
5
10
25
22
18
16
Income tax expense
3
10
7
13
17
30
23
Depreciation and amortization
11
8
11
23
20
23
23
EBITDA
$ 19
$ 46
$ 36
$ 88
$ 103
$ 150
$ 123
Years Ended December 31,
EBITDA represents earnings before interest, taxes, depreciation and
amortization. EBITDA is not intended to represent cash flow from
operations as defined by U.S. GAAP and should not be used as an alternative
to net income or as an indicator of operating performance. |
 |