Attached files
| file | filename |
|---|---|
| 8-K - 8-K - ARQULE INC | a10-11471_28k.htm |
Exhibit 99.1
|
|
Results from ARQ 197-209: A Global Randomized Placebo-Controlled Phase 2 Clinical Trial Comparing Erlotinib Plus ARQ 197 to Erlotinib Plus Placebo in Previously Treated EGFR-Inhibitor Naïve Patients with Locally Advanced or Metastatic Non-Small Cell Lung Cancer J. H. Schiller, W. L. Akerley, W. Brugger, D. Ferrari, E. G. Garmey, D. E. Gerber, S. V. Orlov, R. Ramlau, J. Von Pawel, L. V. Sequist For the ARQ 197-209 Clinical Trial Group |
|
|
Disclosures: JHS research funding support from Celgene; Genentech; Geron; Novartis; Pfizer; Synta JHS advisory boards and advisory/consulting roles: ArQule; Agennix; Astra Zeneca; Bayer; Biodesix; Daiichi Sankyo; Genentech; GSK; Merck; Novartis; Onyx; Pfizer; Syndax This clinical trial sponsored by ArQule, Inc. and Daiichi Sankyo Co., Ltd. 2 |
|
|
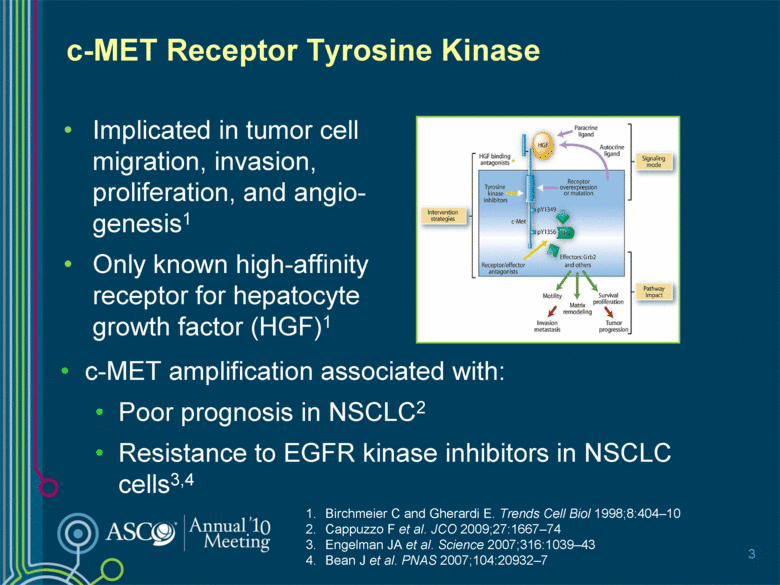
c-MET Receptor Tyrosine Kinase Implicated in tumor cell migration, invasion, proliferation, and angio-genesis1 Only known high-affinity receptor for hepatocyte growth factor (HGF)1 Birchmeier C and Gherardi E. Trends Cell Biol 1998;8:404–10 Cappuzzo F et al. JCO 2009;27:1667–74 Engelman JA et al. Science 2007;316:1039–43 Bean J et al. PNAS 2007;104:20932–7 3 c-MET amplification associated with: Poor prognosis in NSCLC2 Resistance to EGFR kinase inhibitors in NSCLC cells3,4 |
|
|
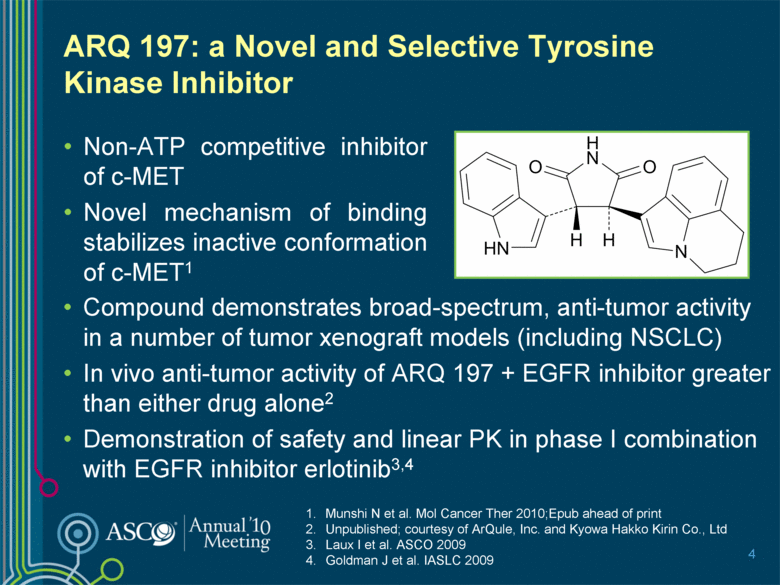
ARQ 197: a Novel and Selective Tyrosine Kinase Inhibitor Non-ATP competitive inhibitor of c-MET Novel mechanism of binding stabilizes inactive conformation of c-MET1 4 Compound demonstrates broad-spectrum, anti-tumor activity in a number of tumor xenograft models (including NSCLC) In vivo anti-tumor activity of ARQ 197 + EGFR inhibitor greater than either drug alone2 Demonstration of safety and linear PK in phase I combination with EGFR inhibitor erlotinib3,4 Munshi N et al. Mol Cancer Ther 2010;Epub ahead of print Unpublished; courtesy of ArQule, Inc. and Kyowa Hakko Kirin Co., Ltd Laux I et al. ASCO 2009 Goldman J et al. IASLC 2009 H N H H O O H N N |
|
|
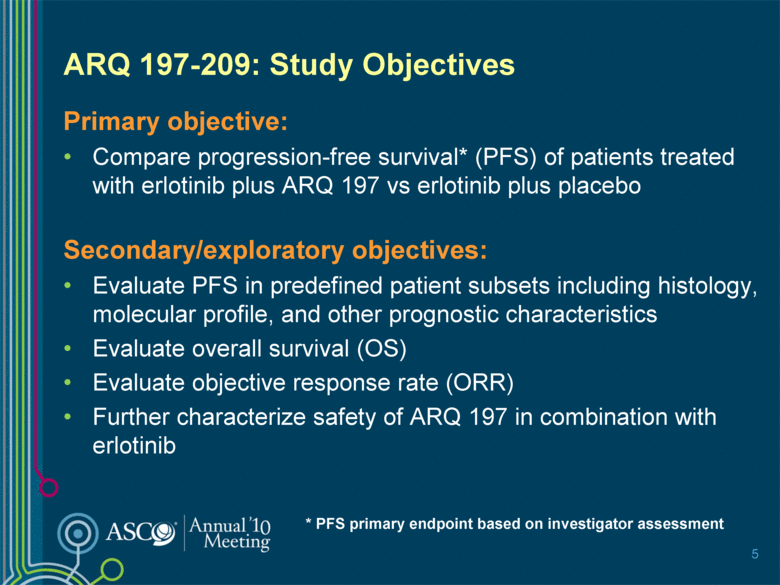
ARQ 197-209: Study Objectives Primary objective: Compare progression-free survival* (PFS) of patients treated with erlotinib plus ARQ 197 vs erlotinib plus placebo Secondary/exploratory objectives: Evaluate PFS in predefined patient subsets including histology, molecular profile, and other prognostic characteristics Evaluate overall survival (OS) Evaluate objective response rate (ORR) Further characterize safety of ARQ 197 in combination with erlotinib 5 * PFS primary endpoint based on investigator assessment |
|
|
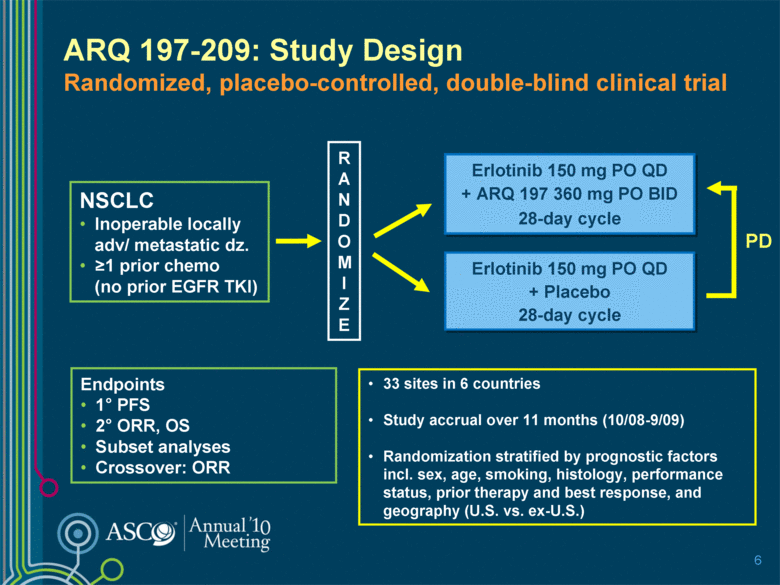
ARQ 197-209: Study Design Randomized, placebo-controlled, double-blind clinical trial R A N D O M I Z E Erlotinib 150 mg PO QD + Placebo 28-day cycle Erlotinib 150 mg PO QD + ARQ 197 360 mg PO BID 28-day cycle Endpoints 1° PFS 2° ORR, OS Subset analyses Crossover: ORR NSCLC Inoperable locally adv/ metastatic dz. >1 prior chemo (no prior EGFR TKI) 33 sites in 6 countries Study accrual over 11 months (10/08-9/09) Randomization stratified by prognostic factors incl. sex, age, smoking, histology, performance status, prior therapy and best response, and geography (U.S. vs. ex-U.S.) 6 PD |
|
|
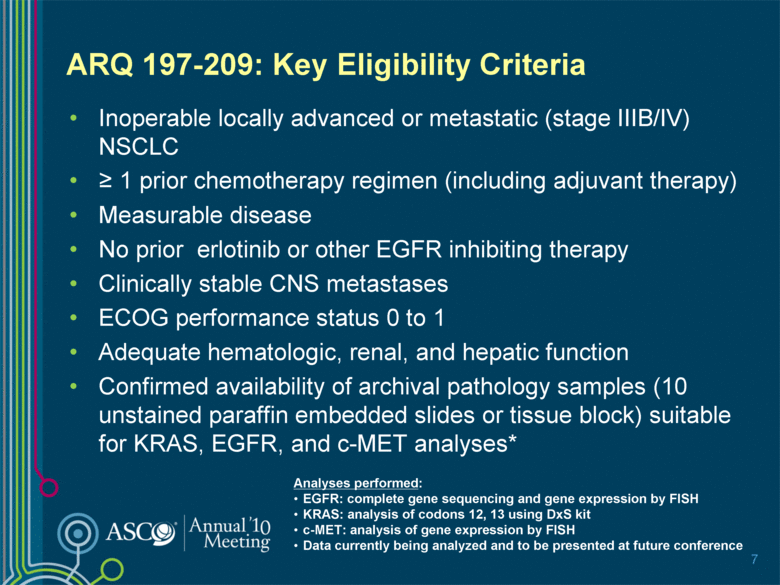
ARQ 197-209: Key Eligibility Criteria Inoperable locally advanced or metastatic (stage IIIB/IV) NSCLC > 1 prior chemotherapy regimen (including adjuvant therapy) Measurable disease No prior erlotinib or other EGFR inhibiting therapy Clinically stable CNS metastases ECOG performance status 0 to 1 Adequate hematologic, renal, and hepatic function Confirmed availability of archival pathology samples (10 unstained paraffin embedded slides or tissue block) suitable for KRAS, EGFR, and c-MET analyses* 7 Analyses performed: EGFR: complete gene sequencing and gene expression by FISH KRAS: analysis of codons 12, 13 using DxS kit c-MET: analysis of gene expression by FISH Data currently being analyzed and to be presented at future conference |
|
|
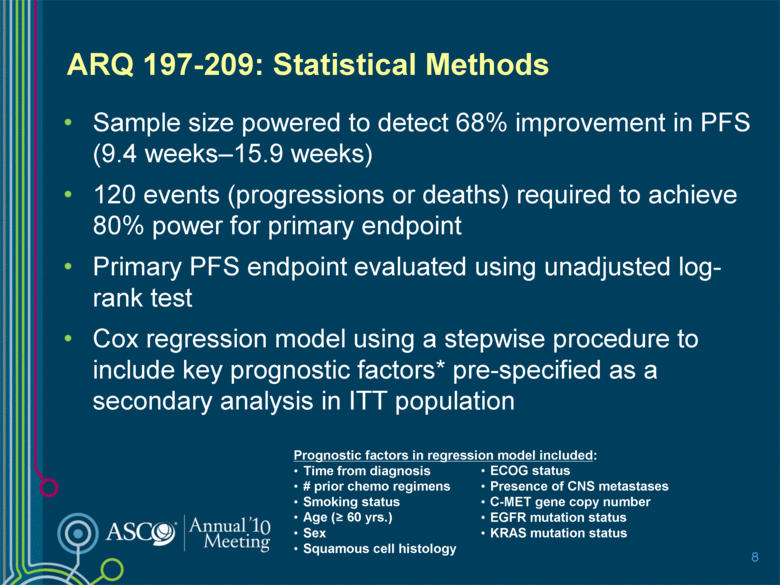
ARQ 197-209: Statistical Methods Sample size powered to detect 68% improvement in PFS (9.4 weeks–15.9 weeks) 120 events (progressions or deaths) required to achieve 80% power for primary endpoint Primary PFS endpoint evaluated using unadjusted log-rank test Cox regression model using a stepwise procedure to include key prognostic factors* pre-specified as a secondary analysis in ITT population 8 Prognostic factors in regression model included: Time from diagnosis # prior chemo regimens Smoking status Age (> 60 yrs.) Sex Squamous cell histology ECOG status Presence of CNS metastases C-MET gene copy number EGFR mutation status KRAS mutation status |
|
|
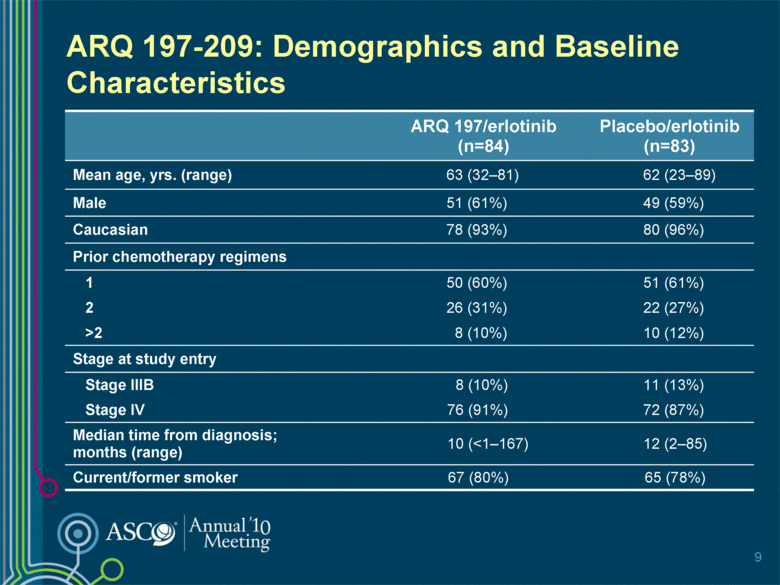
9 ARQ 197/erlotinib (n=84) Placebo/erlotinib (n=83) Mean age, yrs. (range) 63 (32–81) 62 (23–89) Male 51 (61%) 49 (59%) Caucasian 78 (93%) 80 (96%) Prior chemotherapy regimens 1 50 (60%) 51 (61%) 2 26 (31%) 22 (27%) >2 8 (10%) 10 (12%) Stage at study entry Stage IIIB 8 (10%) 11 (13%) Stage IV 76 (91%) 72 (87%) Median time from diagnosis; months (range) 10 (<1–167) 12 (2–85) Current/former smoker 67 (80%) 65 (78%) ARQ 197-209: Demographics and Baseline Characteristics |
|
|
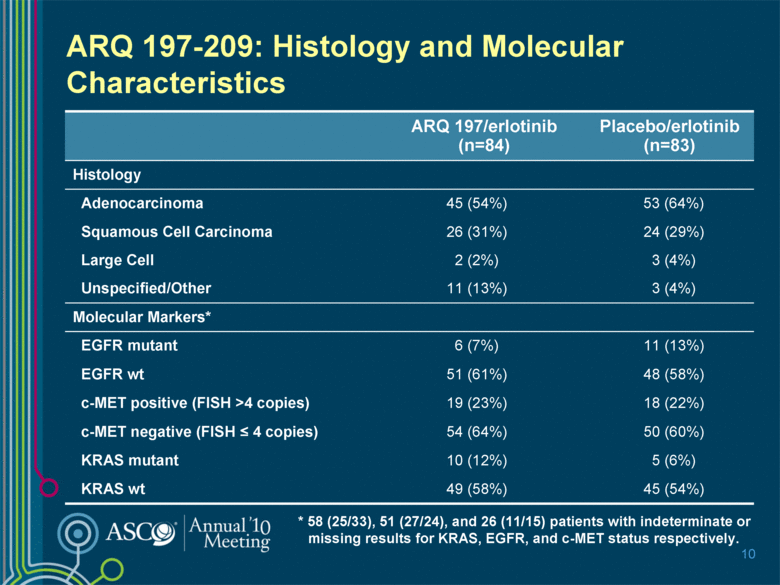
ARQ 197-209: Histology and Molecular Characteristics 10 ARQ 197/erlotinib (n=84) Placebo/erlotinib (n=83) Histology Adenocarcinoma 45 (54%) 53 (64%) Squamous Cell Carcinoma 26 (31%) 24 (29%) Large Cell 2 (2%) 3 (4%) Unspecified/Other 11 (13%) 3 (4%) Molecular Markers* EGFR mutant 6 (7%) 11 (13%) EGFR wt 51 (61%) 48 (58%) c-MET positive (FISH >4 copies) 19 (23%) 18 (22%) c-MET negative (FISH < 4 copies) 54 (64%) 50 (60%) KRAS mutant 10 (12%) 5 (6%) KRAS wt 49 (58%) 45 (54%) * 58 (25/33), 51 (27/24), and 26 (11/15) patients with indeterminate or missing results for KRAS, EGFR, and c-MET status respectively. |
|
|
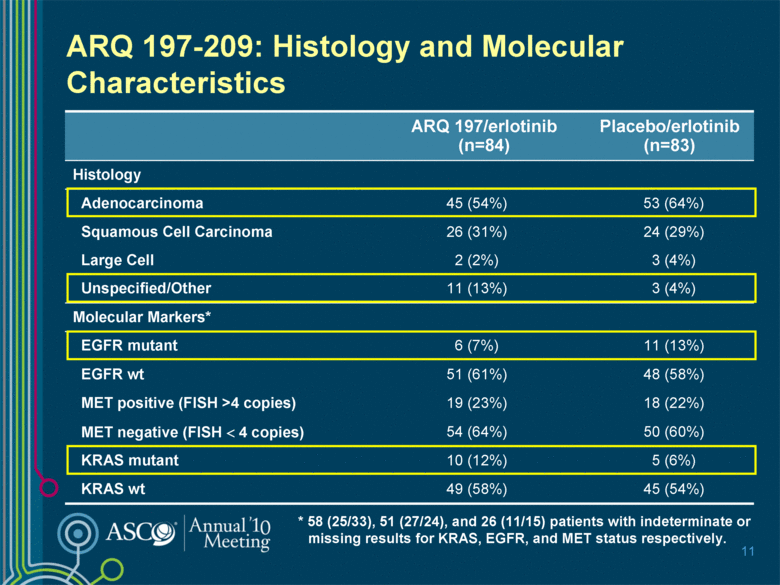
ARQ 197-209: Histology and Molecular Characteristics 11 ARQ 197/erlotinib (n=84) Placebo/erlotinib (n=83) Histology Adenocarcinoma 45 (54%) 53 (64%) Squamous Cell Carcinoma 26 (31%) 24 (29%) Large Cell 2 (2%) 3 (4%) Unspecified/Other 11 (13%) 3 (4%) Molecular Markers* EGFR mutant 6 (7%) 11 (13%) EGFR wt 51 (61%) 48 (58%) MET positive (FISH >4 copies) 19 (23%) 18 (22%) MET negative (FISH < 4 copies) 54 (64%) 50 (60%) KRAS mutant 10 (12%) 5 (6%) KRAS wt 49 (58%) 45 (54%) * 58 (25/33), 51 (27/24), and 26 (11/15) patients with indeterminate or missing results for KRAS, EGFR, and MET status respectively. |
|
|
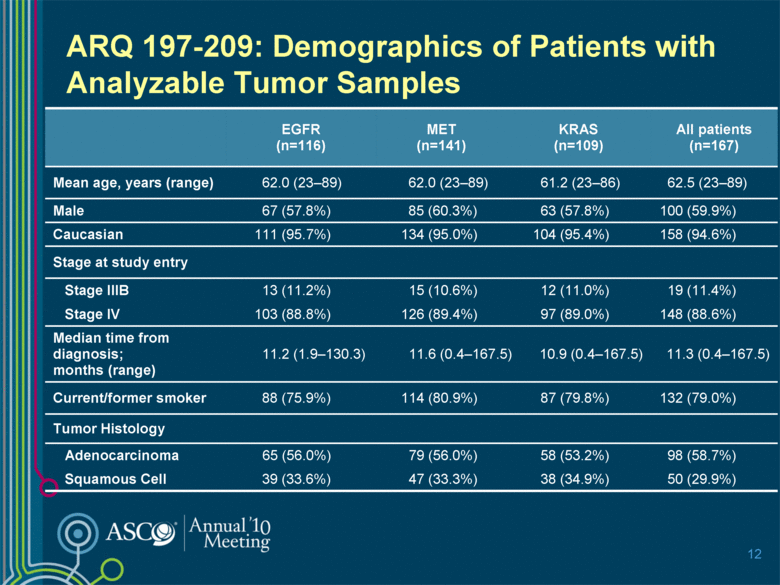
ARQ 197-209: Demographics of Patients with Analyzable Tumor Samples 12 EGFR (n=116) MET (n=141) KRAS (n=109) All patients (n=167) Mean age, years (range) 62.0 (23–89) 62.0 (23–89) 61.2 (23–86) 62.5 (23–89) Male 67 (57.8%) 85 (60.3%) 63 (57.8%) 100 (59.9%) Caucasian 111 (95.7%) 134 (95.0%) 104 (95.4%) 158 (94.6%) Stage at study entry Stage IIIB 13 (11.2%) 15 (10.6%) 12 (11.0%) 19 (11.4%) Stage IV 103 (88.8%) 126 (89.4%) 97 (89.0%) 148 (88.6%) Median time from diagnosis; months (range) 11.2 (1.9–130.3) 11.6 (0.4–167.5) 10.9 (0.4–167.5) 11.3 (0.4–167.5) Current/former smoker 88 (75.9%) 114 (80.9%) 87 (79.8%) 132 (79.0%) Tumor Histology Adenocarcinoma 65 (56.0%) 79 (56.0%) 58 (53.2%) 98 (58.7%) Squamous Cell 39 (33.6%) 47 (33.3%) 38 (34.9%) 50 (29.9%) |
|
|
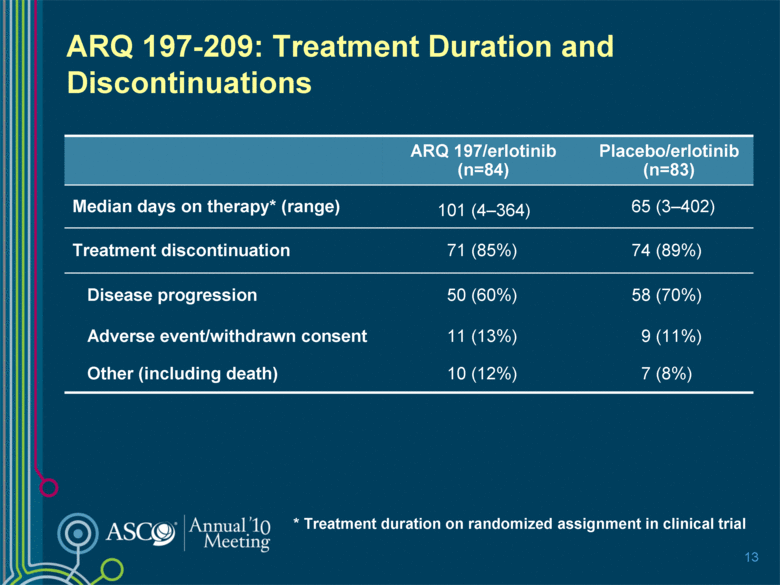
13 ARQ 197-209: Treatment Duration and Discontinuations ARQ 197/erlotinib (n=84) Placebo/erlotinib (n=83) Median days on therapy* (range) 101 (4–364) 65 (3–402) Treatment discontinuation 71 (85%) 74 (89%) Disease progression 50 (60%) 58 (70%) Adverse event/withdrawn consent 11 (13%) 9 (11%) Other (including death) 10 (12%) 7 (8%) * Treatment duration on randomized assignment in clinical trial |
|
|
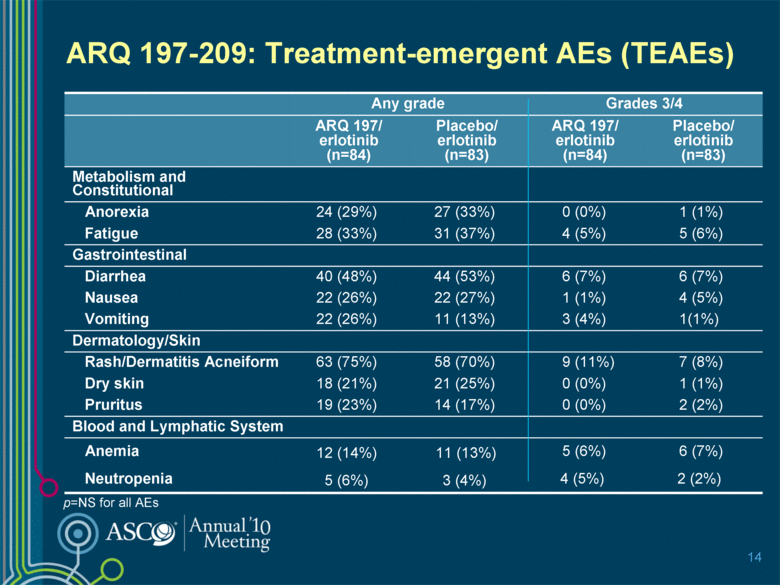
ARQ 197-209: Treatment-emergent AEs (TEAEs) 14 p=NS for all AEs Any grade Grades 3/4 ARQ 197/ erlotinib (n=84) Placebo/ erlotinib (n=83) ARQ 197/ erlotinib (n=84) Placebo/ erlotinib (n=83) Metabolism and Constitutional Anorexia 24 (29%) 27 (33%) 0 (0%) 1 (1%) Fatigue 28 (33%) 31 (37%) 4 (5%) 5 (6%) Gastrointestinal Diarrhea 40 (48%) 44 (53%) 6 (7%) 6 (7%) Nausea 22 (26%) 22 (27%) 1 (1%) 4 (5%) Vomiting 22 (26%) 11 (13%) 3 (4%) 1(1%) Dermatology/Skin Rash/Dermatitis Acneiform 63 (75%) 58 (70%) 9 (11%) 7 (8%) Dry skin 18 (21%) 21 (25%) 0 (0%) 1 (1%) Pruritus 19 (23%) 14 (17%) 0 (0%) 2 (2%) Blood and Lymphatic System Anemia 12 (14%) 11 (13%) 5 (6%) 6 (7%) Neutropenia 5 (6%) 3 (4%) 4 (5%) 2 (2%) |
|
|
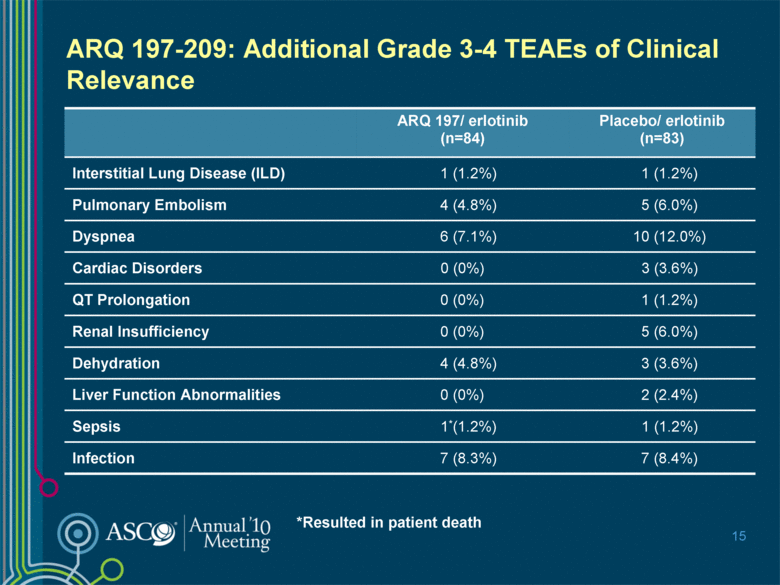
15 ARQ 197-209: Additional Grade 3-4 TEAEs of Clinical Relevance *Resulted in patient death ARQ 197/ erlotinib (n=84) Placebo/ erlotinib (n=83) Interstitial Lung Disease (ILD) 1 (1.2%) 1 (1.2%) Pulmonary Embolism 4 (4.8%) 5 (6.0%) Dyspnea 6 (7.1%) 10 (12.0%) Cardiac Disorders 0 (0%) 3 (3.6%) QT Prolongation 0 (0%) 1 (1.2%) Renal Insufficiency 0 (0%) 5 (6.0%) Dehydration 4 (4.8%) 3 (3.6%) Liver Function Abnormalities 0 (0%) 2 (2.4%) Sepsis 1*(1.2%) 1 (1.2%) Infection 7 (8.3%) 7 (8.4%) |
|
|
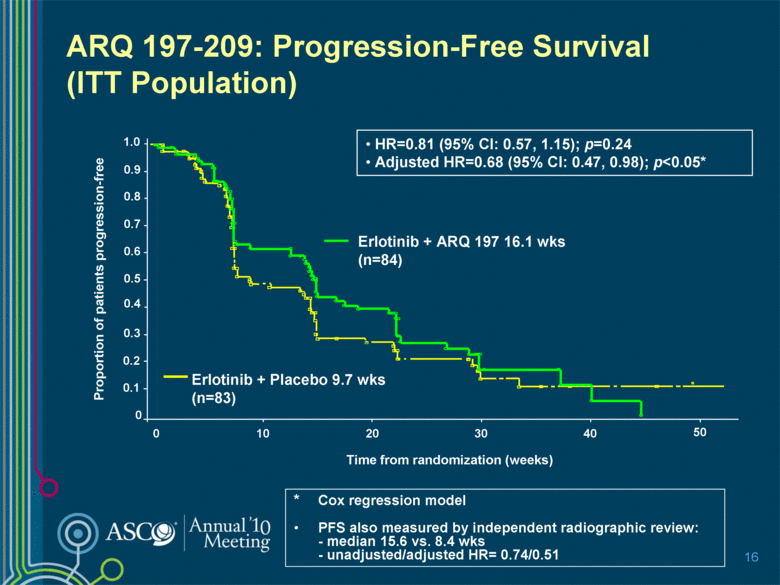
ARQ 197-209: Progression-Free Survival (ITT Population) 16 * Cox regression model PFS also measured by independent radiographic review: - median 15.6 vs. 8.4 wks - unadjusted/adjusted HR= 0.74/0.51 50 20 30 0 10 40 1.0 0.9 0.8 0.7 0.6 0.5 0.4 0.3 0.2 0.1 0 Proportion of patients progression-free Time from randomization (weeks) Erlotinib + ARQ 197 16.1 wks (n=84) Erlotinib + Placebo 9.7 wks (n=83) HR=0.81 (95% CI: 0.57, 1.15); p=0.24 Adjusted HR=0.68 (95% CI: 0.47, 0.98); p<0.05* |
|
|
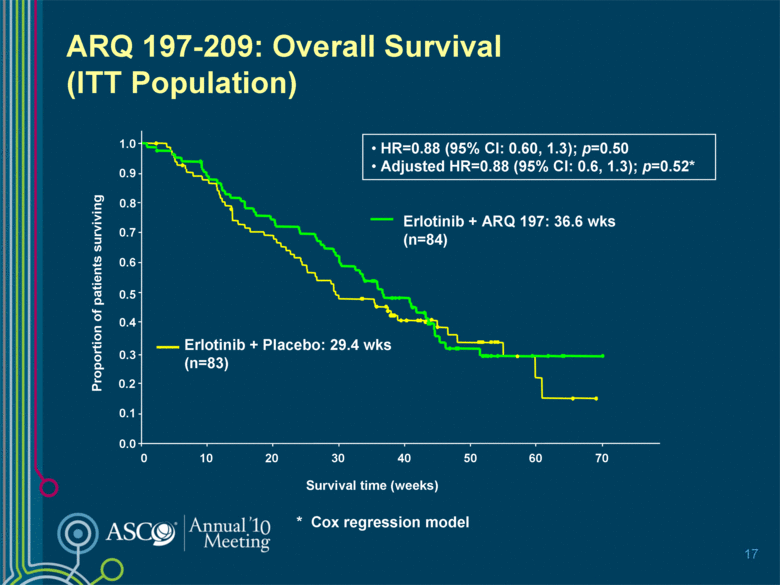
ARQ 197-209: Overall Survival (ITT Population) 17 HR=0.88 (95% CI: 0.60, 1.3); p=0.50 Adjusted HR=0.88 (95% CI: 0.6, 1.3); p=0.52* Erlotinib + ARQ 197: 36.6 wks (n=84) Erlotinib + Placebo: 29.4 wks (n=83) 0 10 20 30 50 70 40 60 Survival time (weeks) 0.0 0.2 0.4 0.6 0.8 1.0 Proportion of patients surviving 0.1 0.3 0.5 0.7 0.9 * Cox regression model |
|
|
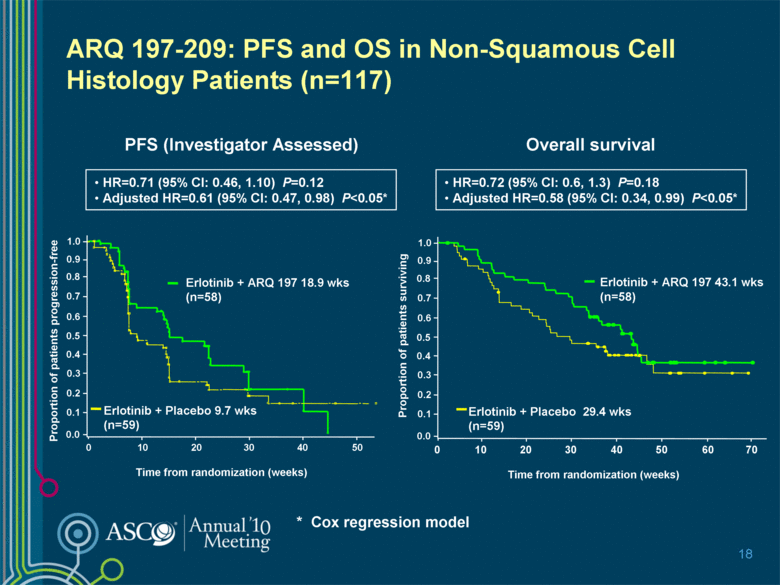
ARQ 197-209: PFS and OS in Non-Squamous Cell Histology Patients (n=117) 18 PFS (Investigator Assessed) Overall survival HR=0.72 (95% CI: 0.6, 1.3) P=0.18 Adjusted HR=0.58 (95% CI: 0.34, 0.99) P<0.05* HR=0.71 (95% CI: 0.46, 1.10) P=0.12 Adjusted HR=0.61 (95% CI: 0.47, 0.98) P<0.05* 0 0.0 1.0 0.9 0.8 0.7 0.6 0.5 0.4 0.3 0.2 0.1 20 30 10 40 Proportion of patients progression-free Time from randomization (weeks) Erlotinib + ARQ 197 18.9 wks (n=58) Erlotinib + Placebo 9.7 wks (n=59) 50 0 10 20 30 50 70 40 60 Proportion of patients surviving Time from randomization (weeks) Erlotinib + ARQ 197 43.1 wks (n=58) Erlotinib + Placebo 29.4 wks (n=59) 0.0 1.0 0.9 0.8 0.7 0.6 0.5 0.4 0.3 0.2 0.1 * Cox regression model |
|
|
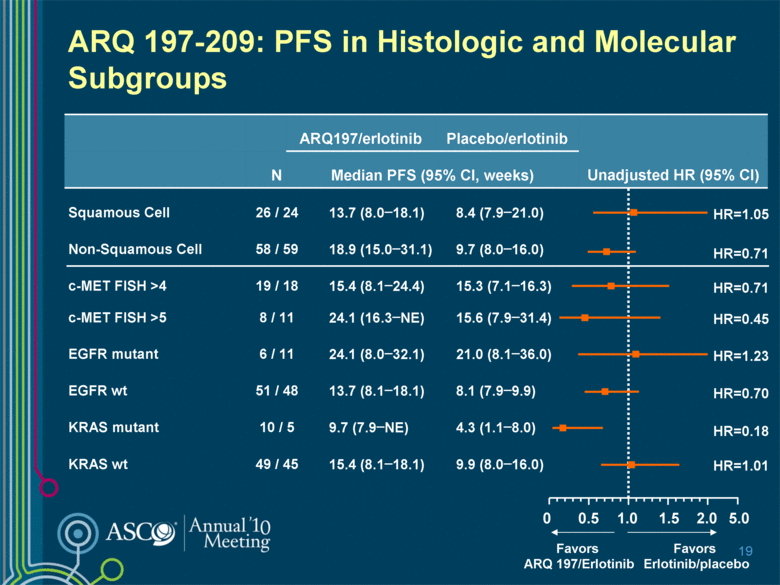
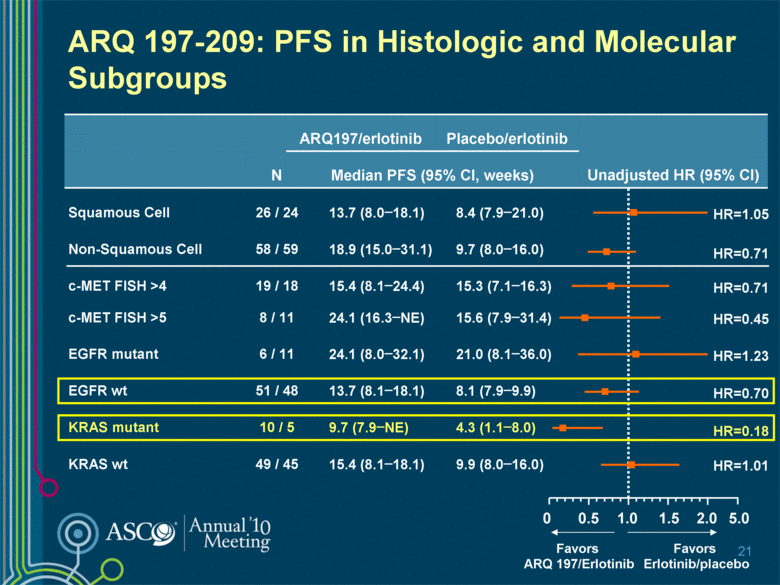
5.0 2.0 ARQ 197-209: PFS in Histologic and Molecular Subgroups 19 ARQ197/erlotinib Placebo/erlotinib Unadjusted HR (95% CI) N Median PFS (95% CI, weeks) Squamous Cell 26 / 24 13.7 (8.0–18.1) 8.4 (7.9–21.0) Non-Squamous Cell 58 / 59 18.9 (15.0–31.1) 9.7 (8.0–16.0) c-MET FISH >4 19 / 18 15.4 (8.1–24.4) 15.3 (7.1–16.3) c-MET FISH >5 8 / 11 24.1 (16.3–NE) 15.6 (7.9–31.4) EGFR mutant 6 / 11 24.1 (8.0–32.1) 21.0 (8.1–36.0) EGFR wt 51 / 48 13.7 (8.1–18.1) 8.1 (7.9–9.9) KRAS mutant 10 / 5 9.7 (7.9–NE) 4.3 (1.1–8.0) KRAS wt 49 / 45 15.4 (8.1–18.1) 9.9 (8.0–16.0) 1.0 0 Favors ARQ 197/Erlotinib Favors Erlotinib/placebo HR=0.70 HR=0.18 0.5 1.5 HR=1.01 HR=1.23 HR=0.45 HR=0.71 HR=1.05 HR=0.71 |
|
|
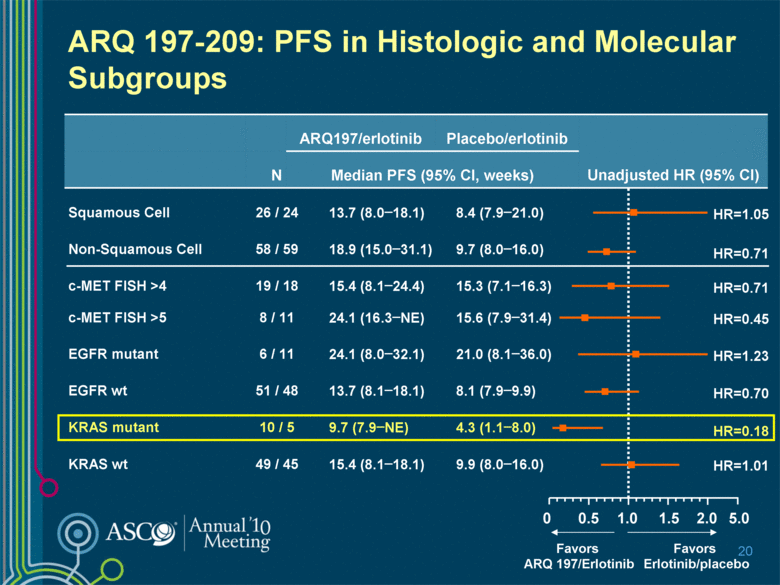
5.0 2.0 ARQ 197-209: PFS in Histologic and Molecular Subgroups 20 ARQ197/erlotinib Placebo/erlotinib Unadjusted HR (95% CI) N Median PFS (95% CI, weeks) Squamous Cell 26 / 24 13.7 (8.0–18.1) 8.4 (7.9–21.0) Non-Squamous Cell 58 / 59 18.9 (15.0–31.1) 9.7 (8.0–16.0) c-MET FISH >4 19 / 18 15.4 (8.1–24.4) 15.3 (7.1–16.3) c-MET FISH >5 8 / 11 24.1 (16.3–NE) 15.6 (7.9–31.4) EGFR mutant 6 / 11 24.1 (8.0–32.1) 21.0 (8.1–36.0) EGFR wt 51 / 48 13.7 (8.1–18.1) 8.1 (7.9–9.9) KRAS mutant 10 / 5 9.7 (7.9–NE) 4.3 (1.1–8.0) KRAS wt 49 / 45 15.4 (8.1–18.1) 9.9 (8.0–16.0) 1.0 0 Favors ARQ 197/Erlotinib Favors Erlotinib/placebo HR=0.70 HR=0.18 0.5 1.5 HR=1.01 HR=1.23 HR=0.45 HR=0.71 HR=1.05 HR=0.71 |
|
|
5.0 2.0 ARQ 197-209: PFS in Histologic and Molecular Subgroups 21 ARQ197/erlotinib Placebo/erlotinib Unadjusted HR (95% CI) N Median PFS (95% CI, weeks) Squamous Cell 26 / 24 13.7 (8.0–18.1) 8.4 (7.9–21.0) Non-Squamous Cell 58 / 59 18.9 (15.0–31.1) 9.7 (8.0–16.0) c-MET FISH >4 19 / 18 15.4 (8.1–24.4) 15.3 (7.1–16.3) c-MET FISH >5 8 / 11 24.1 (16.3–NE) 15.6 (7.9–31.4) EGFR mutant 6 / 11 24.1 (8.0–32.1) 21.0 (8.1–36.0) EGFR wt 51 / 48 13.7 (8.1–18.1) 8.1 (7.9–9.9) KRAS mutant 10 / 5 9.7 (7.9–NE) 4.3 (1.1–8.0) KRAS wt 49 / 45 15.4 (8.1–18.1) 9.9 (8.0–16.0) 1.0 0 Favors ARQ 197/Erlotinib Favors Erlotinib/placebo HR=0.70 HR=0.18 0.5 1.5 HR=1.01 HR=1.23 HR=0.45 HR=0.71 HR=1.05 HR=0.71 |
|
|
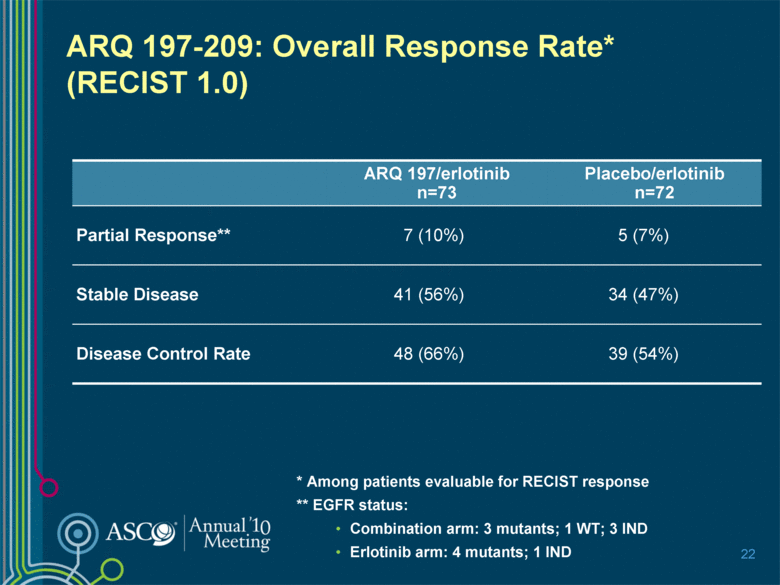
ARQ 197-209: Overall Response Rate* (RECIST 1.0) ARQ 197/erlotinib n=73 Placebo/erlotinib n=72 Partial Response** 7 (10%) 5 (7%) Stable Disease 41 (56%) 34 (47%) Disease Control Rate 48 (66%) 39 (54%) 22 * Among patients evaluable for RECIST response ** EGFR status: Combination arm: 3 mutants; 1 WT; 3 IND Erlotinib arm: 4 mutants; 1 IND |
|
|
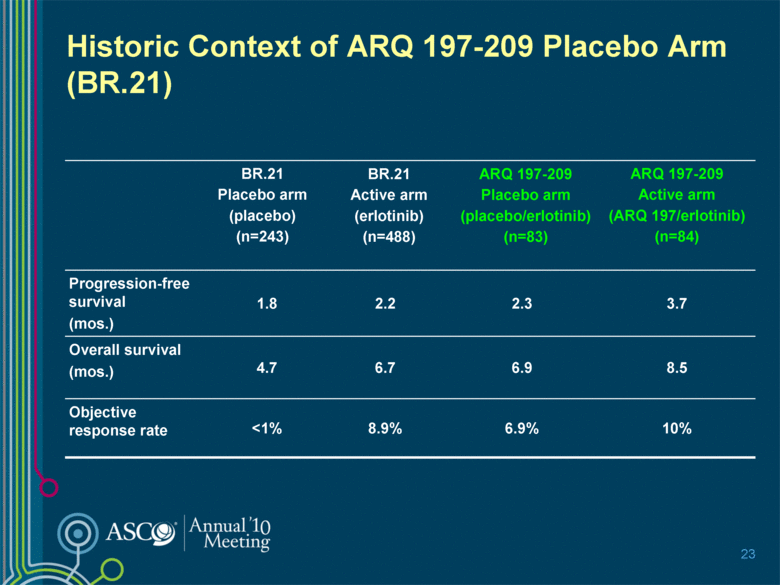
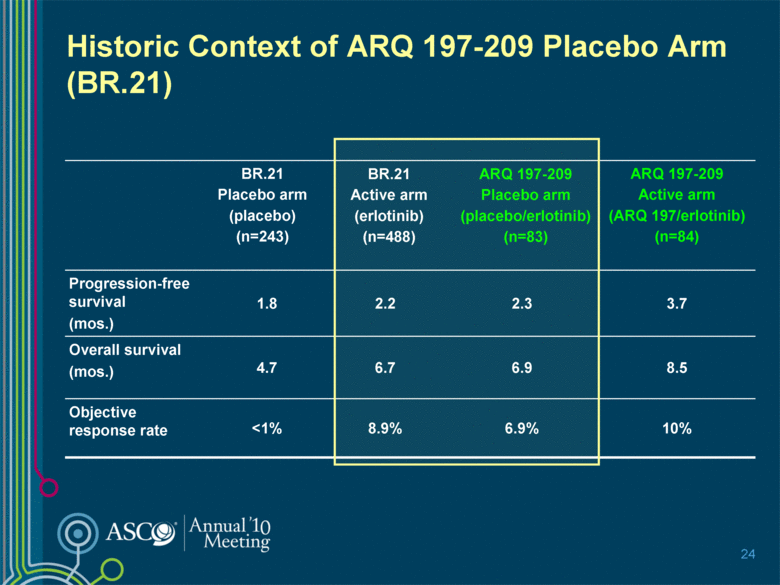
Historic Context of ARQ 197-209 Placebo Arm (BR.21) BR.21 Placebo arm (placebo) (n=243) BR.21 Active arm (erlotinib) (n=488) ARQ 197-209 Placebo arm (placebo/erlotinib) (n=83) ARQ 197-209 Active arm (ARQ 197/erlotinib) (n=84) Progression-free survival (mos.) 1.8 2.2 2.3 3.7 Overall survival (mos.) 4.7 6.7 6.9 8.5 Objective response rate <1% 8.9% 6.9% 10% 23 |
|
|
Historic Context of ARQ 197-209 Placebo Arm (BR.21) BR.21 Placebo arm (placebo) (n=243) BR.21 Active arm (erlotinib) (n=488) ARQ 197-209 Placebo arm (placebo/erlotinib) (n=83) ARQ 197-209 Active arm (ARQ 197/erlotinib) (n=84) Progression-free survival (mos.) 1.8 2.2 2.3 3.7 Overall survival (mos.) 4.7 6.7 6.9 8.5 Objective response rate <1% 8.9% 6.9% 10% 24 |
|
|
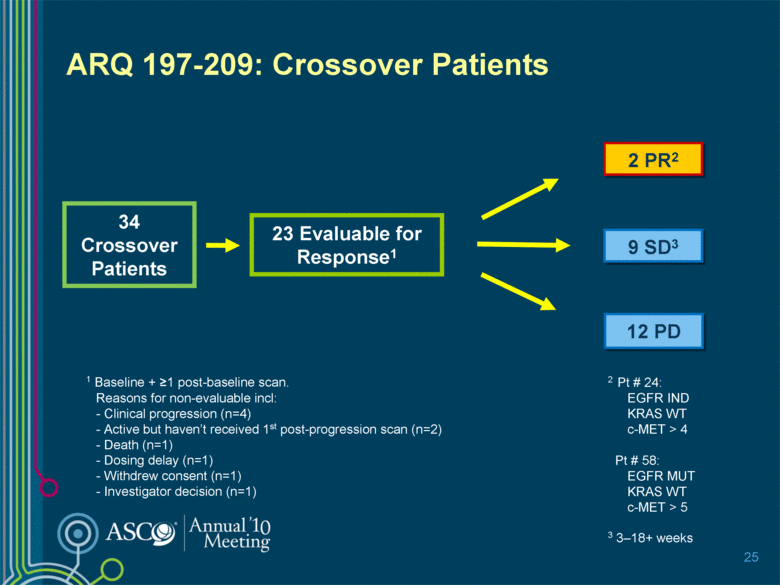
ARQ 197-209: Crossover Patients 2 PR2 34 Crossover Patients 23 Evaluable for Response1 1 Baseline + >1 post-baseline scan. Reasons for non-evaluable incl: - Clinical progression (n=4) - Active but haven’t received 1st post-progression scan (n=2) - Death (n=1) - Dosing delay (n=1) - Withdrew consent (n=1) - Investigator decision (n=1) 9 SD3 12 PD 25 2 Pt # 24: EGFR IND KRAS WT c-MET > 4 Pt # 58: EGFR MUT KRAS WT c-MET > 5 3 3–18+ weeks |
|
|
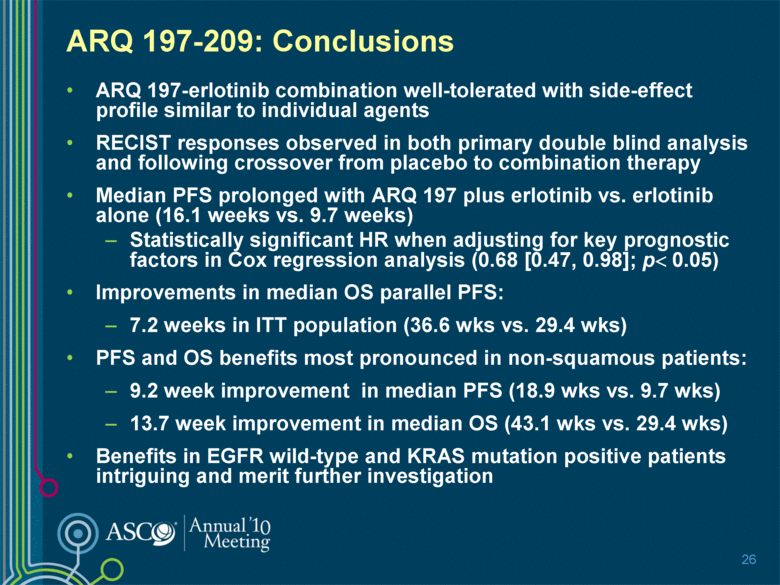
ARQ 197-209: Conclusions ARQ 197-erlotinib combination well-tolerated with side-effect profile similar to individual agents RECIST responses observed in both primary double blind analysis and following crossover from placebo to combination therapy Median PFS prolonged with ARQ 197 plus erlotinib vs. erlotinib alone (16.1 weeks vs. 9.7 weeks) Statistically significant HR when adjusting for key prognostic factors in Cox regression analysis (0.68 [0.47, 0.98]; p< 0.05) Improvements in median OS parallel PFS: 7.2 weeks in ITT population (36.6 wks vs. 29.4 wks) PFS and OS benefits most pronounced in non-squamous patients: 9.2 week improvement in median PFS (18.9 wks vs. 9.7 wks) 13.7 week improvement in median OS (43.1 wks vs. 29.4 wks) Benefits in EGFR wild-type and KRAS mutation positive patients intriguing and merit further investigation 26 |
|
|
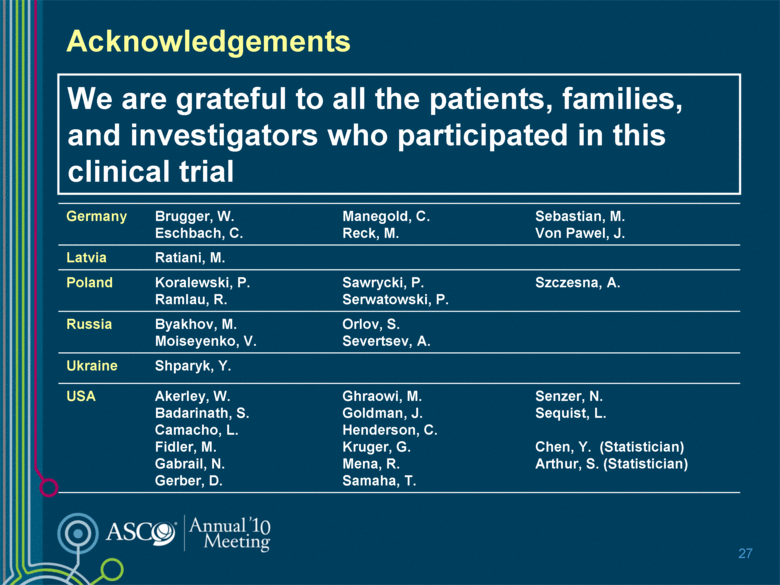
Acknowledgements Germany Brugger, W. Eschbach, C. Manegold, C. Reck, M. Sebastian, M. Von Pawel, J. Latvia Ratiani, M. Poland Koralewski, P. Ramlau, R. Sawrycki, P. Serwatowski, P. Szczesna, A. Russia Byakhov, M. Moiseyenko, V. Orlov, S. Severtsev, A. Ukraine Shparyk, Y. USA Akerley, W. Badarinath, S. Camacho, L. Fidler, M. Gabrail, N. Gerber, D. Ghraowi, M. Goldman, J. Henderson, C. Kruger, G. Mena, R. Samaha, T. Senzer, N. Sequist, L. Chen, Y. (Statistician) Arthur, S. (Statistician) 27 We are grateful to all the patients, families, and investigators who participated in this clinical trial |

