Attached files
| file | filename |
|---|---|
| 8-K - FORM 8-K - ALLEGHENY ENERGY, INC | d8k.htm |
 Citigroup
Conference
June 7-8, 2010
Exhibit 99.1 |
 2
Table of Contents
Page
Page
I.
COMPANY OVERVIEW
V.
OUTLOOK
Primary businesses
6
Merchant generation formulas
38
Service area
7
Outlook: Consolidated
39
Overview
8
Outlook: Merchant generation
40-45
Quality and costs
9-11
Outlook: Utility operations
46
Business units
12
Outlook: Transmission expansion
47
Outlook: Depreciation
48
II.
MERCHANT GENERATION
Capital expenditures
49
Overview
13
Outlook: Interest, other
50
Current market conditions
14-19
Risks and challenges
51
Generation hedged
20
VI.
Pennsylvania rates
21-22
MERGER
Power procurement schedule (PA/MD)
23
Overview
52
Coal
24-26
Fuel Mix
53
Environmental controls
27
Scale and Scope
54
Plant availability
28
Timeline
55
VII.
III.
TRANSMISSION EXPANSION
SUPPLEMENTAL MATERIAL
Overview
29
EPS and EBITDA
57-58
Capital expenditures
30
Cash flow
59
Growing rate base
31
Credit ratings
60
TrAIL
construction update
32
IV.
UTILITY OPERATIONS
Overview
33
Revenue mix
34
Capital structures and ROE's
35
Growing rate base
36
Competitive rates
37 |
 3
Forward-Looking Statements
INFORMATION CONCERNING FORWARD-LOOKING STATEMENTS
In addition to historical information, this presentation contains a number of
"forward-looking statements" as defined in the Private Securities Litigation
Reform Act of 1995. Forward-looking statements involve estimates,
expectations, and projections and, as a result, are subject to risks and uncertainties.
Forward-looking statements often may be identified by the use of words such as
anticipate, expect, project, intend, plan, believe and words and terms of
similar substance used in connection with any discussion of future plans, actions or
events. However, the absence of these or similar words does not mean
that any particular statement is not forward-looking. Forward-looking
statements in this presentation may relate to, among other matters: regulatory issues,
including but not limited to environmental regulation, and the status of retail
generation service supply competition in states served by Allegheny’s delivery
business,
Allegheny
Power;
financing
plans;
market
demand
for
energy,
the
cost
and
availability
of
raw
materials,
including
coal
and
natural
gas,
and
Allegheny’s ability to enter into, modify and enforce long-term fuel
purchase agreements; provider-of-last resort and power supply contracts; results of
litigation; results of operations; internal controls and procedures; capital
expenditures; status and condition of plants and equipment; changes in
technology and their effects on the competitiveness of Allegheny’s generation
facilities; work stoppages by Allegheny’s unionize employees; capacity
purchase
commitments;
statements
about
the
benefits
of
the
proposed
merger
involving
Allegheny
and
FirstEnergy,
including
future
financial
and
operating results; Allegheny’s and FirstEnergy’s plans, objectives,
expectations and intentions; the expected timing of completion of the transaction; and
other statements relating to the merger that are not historical facts. There
can be no assurance that actual results will not materially differ from
expectations. Actual results have varied materially and unpredictably from past
expectations. Factors that could cause actual results to differ materially
include, among others, the following: the results of regulatory proceedings,
including proceedings related to rates; plant performance and unplanned
outages; volatility and changes in the price and demand for energy and capacity and
changes in the value of financial transmission rights; volatility and changes
in the price of coal, natural gas and other energy-related commodities; Allegheny’s ability to enter into, modify and enforce supplier performance
under long-term fuel purchase agreements; the ability and willingness of
counterparties to satisfy their financial and performance obligations; changes in
the weather and other natural phenomena; changes in Allegheny’s requirements
for, and the availability and price of, emission allowances; changes in
industry
capacity,
development
and
other
activities
by
Allegheny’s
competitors;
changes
in
market
rules,
including
changes
to
the
participant
rules
and
tariffs for PJM Interconnection, LLC and defaults by other market participants; the
loss of any significant customers or suppliers; changes in both customer usage
and customer switching behavior and their resulting effects on existing and future load requirements; dependence on other electric transmission and
gas transportation systems and their constraints on availability; environmental
regulation; changes in other laws and regulations applicable to Allegheny, its
markets or its activities; changes in the underlying inputs and assumptions, including market conditions used to estimate the fair values of commodity
contracts; complications or other factors that make it difficult
or impossible to obtain necessary lender consents or regulatory
authorizations on a timely
basis; recent and any future disruptions in the financial markets and changes in
access to capital markets; the availability of credit; actions of rating
agencies; inflationary and deflationary trends and interest rate
trends; the effect of accounting pronouncements issued periodically by accounting
standard-setting bodies; entry into, any failure to consummate, or any
delay in the consummation of, contemplated asset sales or other strategic
transactions;
the
likelihood
and
timing
of
the
completion
of
the
proposed
merger
with
FirstEnergy,
the
terms
and
conditions
of
any
required
regulatory
approvals of the proposed merger, the impact of the proposed merger on
Allegheny’s employees and the potential diversion of management’s time and
attention
from
ongoing
business
during
this
time
period;
general
economic
conditions;
and
other
risks,
including
the
continuing
effects
of
global
instability, terrorism and war. Additional risks and uncertainties are identified and
discussed in Allegheny's reports and registration statements filed with the
Securities and Exchange Commission. Risks and uncertainties associated with the merger are more fully discussed in the preliminary joint proxy
statement/prospectus that is included in the Registration Statement on Form S-4
(Registration No. 333-165640) that was filed by FirstEnergy with the SEC in
connection with the merger. Additional risks and uncertainties associated with the
merger are identified and discussed in Allegheny’s and FirstEnergy’s
reports filed with the SEC and available at the SEC’s
website at www.sec.gov. Readers are cautioned not to place undue reliance on these
forward-looking statements, which speak only as of the date of this
document. Allegheny disclaims any obligation to update its forward-looking statements to reflect events
or circumstances after the date of this presentation, except as may be required by
law. |
 4
Forward-Looking Statements
Certain information in this presentation is based upon an internal model that
incorporates assumptions regarding future market conditions, including power
and commodity prices, demand conditions, and the operating performance and
dispatch characteristics of our generating facilities, among other
factors. Many of these assumptions are based upon highly variable market
factors outside of our control and ultimately may differ significantly from the
assumptions currently included in our model. As a result, our model and the
related forward-looking information included in this presentation are
subject to change. The information in this presentation that is derived from our
internal model is based in part on market conditions, forward prices and our hedged
position as of March 31, 2010. We intend to update this information on a
quarterly basis. ADDITIONAL INFORMATION AND WHERE TO FIND IT
In connection with the proposed merger, FirstEnergy filed a Registration Statement on
Form S-4 (Registration No.
333-165640) with the SEC that includes a preliminary joint proxy statement of
Allegheny and FirstEnergy and that also constitutes a preliminary prospectus
of FirstEnergy. Allegheny and FirstEnergy will mail the definitive joint proxy
statement/prospectus to their respective shareholders. Allegheny and
FirstEnergy urge investors and shareholders to read the definitive joint proxy
statement/prospectus regarding the proposed merger when it becomes available, as
well as other documents filed with the SEC, because they will contain important
information. You may obtain copies of all documents filed with the SEC
regarding this proposed transaction, free of charge, at the SEC’s website
(www.sec.gov). You may also obtain these documents, free of charge, from
Allegheny’s website (www.alleghenyenergy.com) under the tab
“Investors” and then under the heading “SEC
Filings.” You may also
obtain these documents, free of charge, from FirstEnergy’s website
(www.firstenergycorp.com) under the tab “Investors”
and then under the heading “Financial Information”
and then under the item “SEC Filings.”
PARTICIPANTS IN THE MERGER SOLICITATION
FirstEnergy, Allegheny and their respective directors, executive
officers and certain other members of management
and employees may be soliciting proxies from Allegheny and FirstEnergy shareholders
in favor of the merger and related matters. Information regarding the persons
who may, under the rules of the SEC, be deemed participants in the
solicitation of Allegheny and FirstEnergy shareholders in connection with the proposed merger is set forth in the
preliminary joint proxy statement/prospectus contained in the above-referenced
Registration Statement on Form S-4. You can find information about
Allegheny’s executive officers and directors in its definitive proxy statement filed with
the SEC on March
19, 2010 and Annual Report on Form 10-K filed with the SEC on March
1, 2010. You can find
information about FirstEnergy’s executive officers and directors in its
definitive proxy statement filed with the SEC on April
1, 2010 and Annual Report on Form 10-K filed with the SEC on February
19, 2010. Additional information about
Allegheny’s executive officers and directors and FirstEnergy’s executive
officers and directors can be found in the above-referenced Registration
Statement on Form S-4. You can obtain free copies of these documents from Allegheny
and FirstEnergy using the website information above. |
 5
Non-GAAP Financial Measures
This presentation includes non-GAAP financial measures as defined in the
Securities and Exchange Commission’s Regulation G. Where noted,
the
presentation
shows
certain
financial
information
on
an
“as
adjusted”
basis,
to
exclude
the
effect
of
certain
items
as
described
herein.
By
presenting “as adjusted”
results, management intends to provide investors with a better understanding of
the core results and underlying trends from which to consider past
performance and prospects for the future. Users
of
this
financial
information
should
consider
the
types
of
events
and
transactions
for
which
adjustments
have
been
made.
“As
adjusted”
information
should
not
be
considered
in
isolation
or
viewed
as
a
substitute
for,
or
superior
to,
net
income
or
other
data
prepared
in
accordance
with
GAAP
as
measures
of
our
operating
performance
or
liquidity.
In
addition,
the
“as
adjusted”
information
is
not
necessarily
comparable
to
similarly titled measures provided by other companies.
Pursuant
to
the
requirements
of
Regulation
G,
reconciliations
of
non-GAAP
financial
measures
in
this
presentation
to
the
most
directly
comparable GAAP measures are contained herein or within our earnings release and
the tables attached thereto, which, together with this presentation,
are
available
on
our
Investors
page
at
We have not included reconciliations of the forward-looking non-GAAP
financial measures included in this presentation to the most directly
comparable GAAP financial measures, because it is not possible to predict in the
manner necessary for a quantitative reconciliation the amount of the items
that we would remove from GAAP earnings, such as unrealized gains or losses on our economic hedges. The probable significance
of providing these forward-looking non-GAAP financial measures without the
directly comparable GAAP financial measures is that the non-GAAP
financial measures may be materially different from the corresponding, actual GAAP
financial measures. .
www.alleghenyenergy.com |
 6
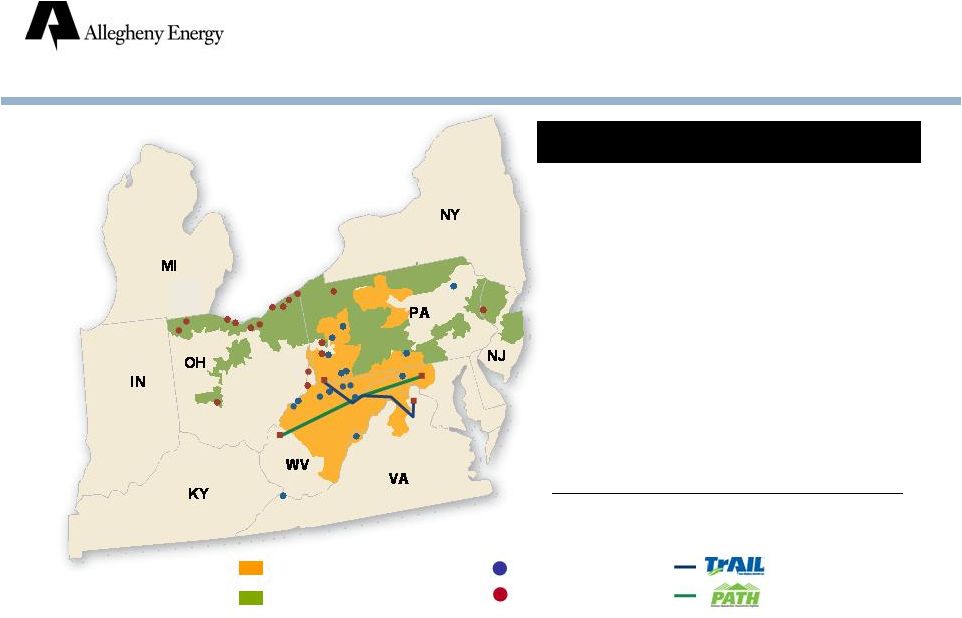
Primary Businesses
Output for 12 months ended December 31, 2009. Customers include
about 102,000 customers in VA.
Sale of VA distribution operations was completed on June 1, 2010.
Allegheny
Energy
Merchant
Generation
Coal-fired, PJM
26.0 million MWH
Transmission
Expansion
TrAIL, PATH,
other projects
Utility
Operations
1.6 million customers,
regulated generation |
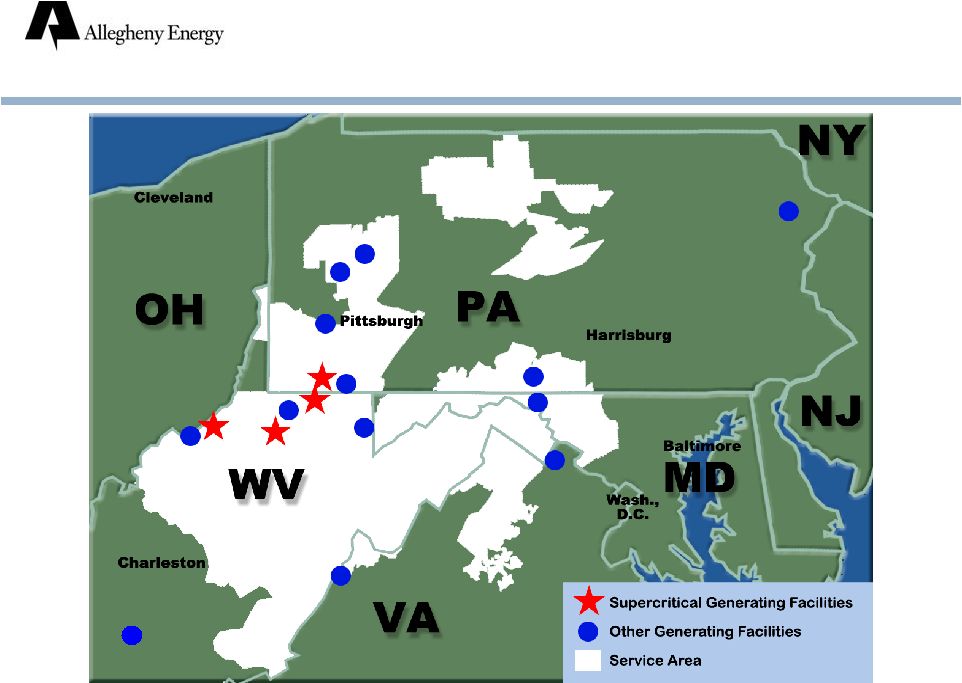 7
Service Area and
Generation Facilities |
 8
Focused on quality and costs
Merchant generation well-positioned for a recovering
economy
Growing rate base in transmission and utility
businesses
Merger with FirstEnergy scheduled for completion in
first half 2011
Overview |
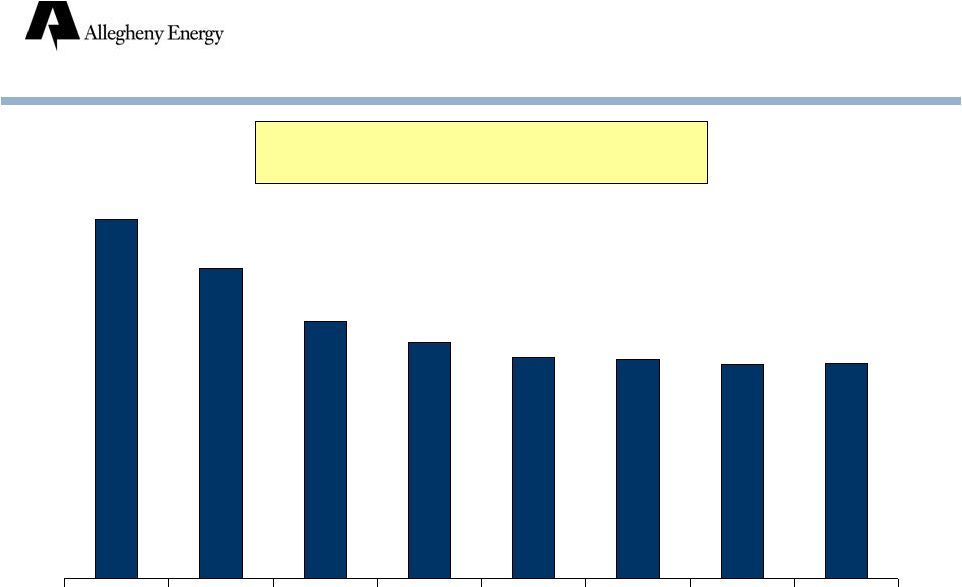
  9
OSHA Recordable Incident Rate
Allegheny Power
Focused on Quality
and Costs
4.76
4.91
3.64
2.81
1.96
1.56
1.40
2003
2004
2005
2006
2007
2008
2009
Safety has improved from 3rd quartile in 2001
to top quartile. |
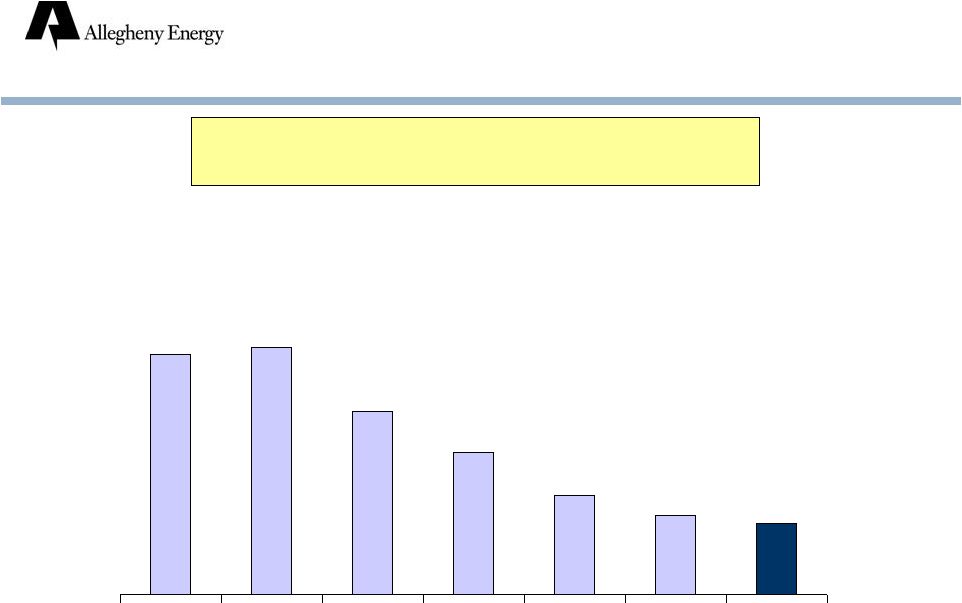
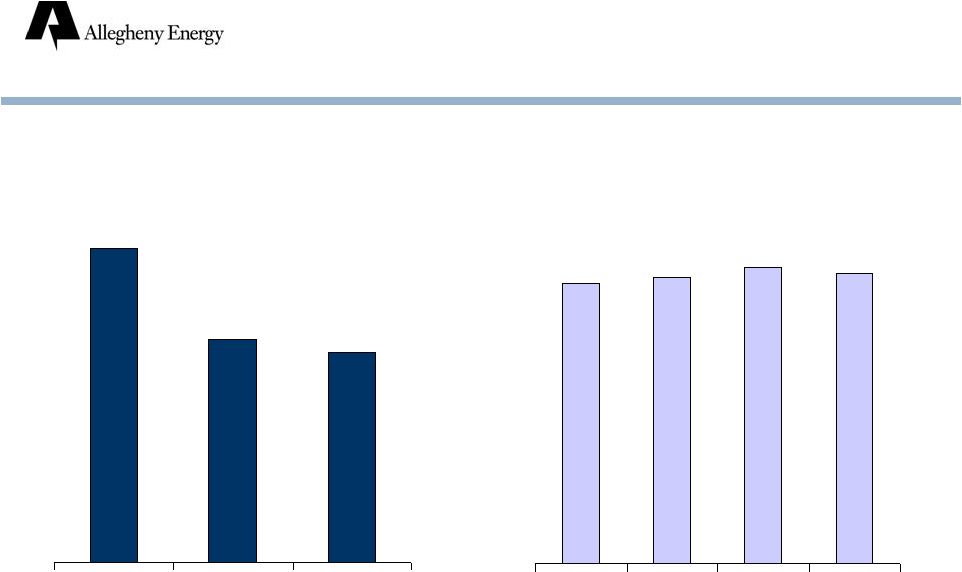
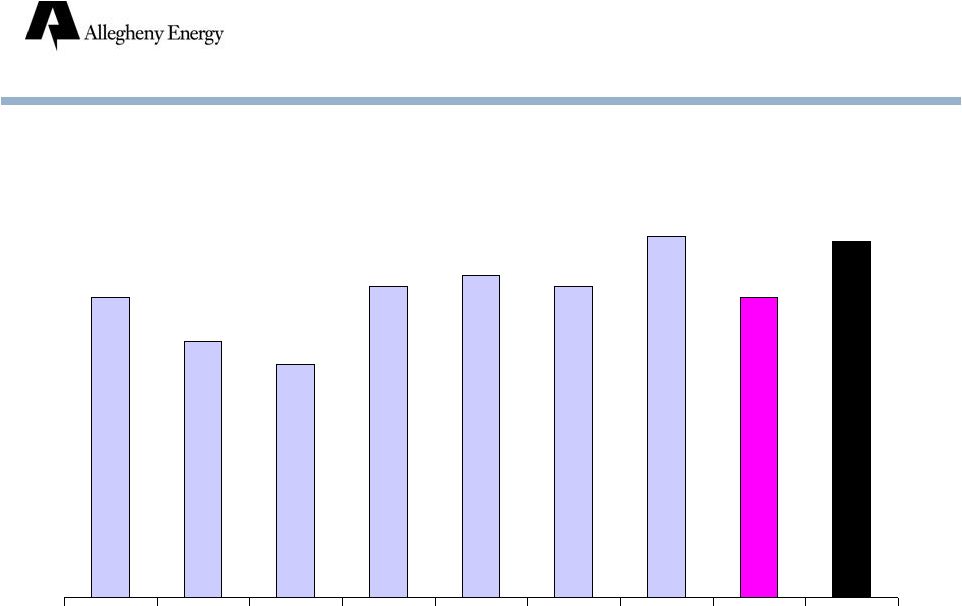
  10
Focused on Quality
and Costs
$1,166
$799
$735
$686
$682*
$665*
$668*
$965
Operations and Maintenance Expense
($ millions)
*
2007-2009
exclude
amounts
formulaically
recovered
(2007
-
$5;
2008
-
$10,
2009
-
$19)
2002
2003
2004
2005
2006
2007
2008
2009
Costs have been held virtually
unchanged for four years. |
  11
Customer Satisfaction
Commercial/industrial: ranked first in northeastern
US for five consecutive years (TQS Research)
Residential: ranked top quartile (American
Customer Service Institute)
Focused on Quality
and Costs
“Allegheny Energy improved in every area that was measured, and
was in the top 10 nationally in six of the seven ranking criteria.”
TQS Research, October 2009
|
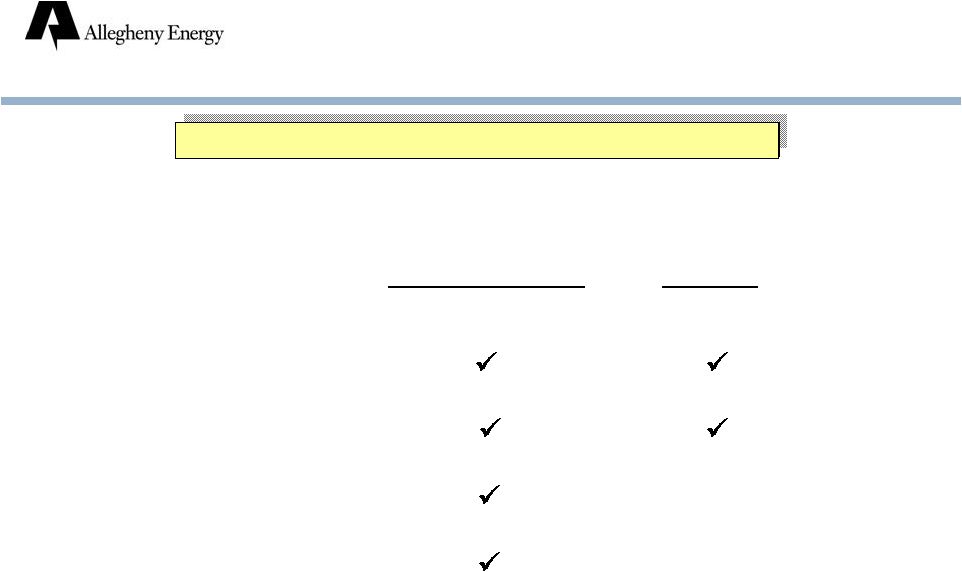
 12
Merchant generation
Unregulated generation (primarily Allegheny Energy
Supply, LLC)
Transmission expansion
TrAIL
PATH
PJM transmission reliability projects
Utility operations
Monongahela Power (WV) -
transmission, distribution,
generation
Potomac Edison (WV, MD, VA) -
transmission,
distribution
West Penn (PA) -
transmission, distribution
Business Units |
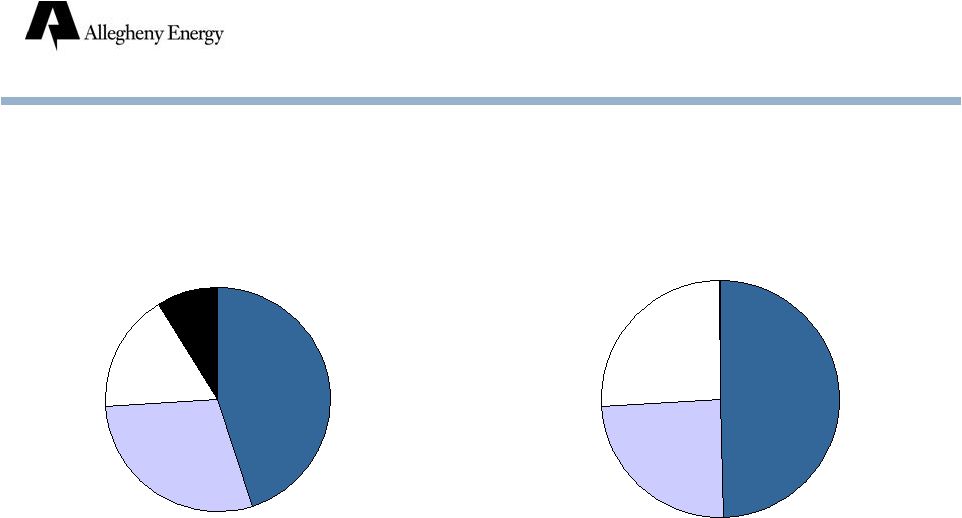
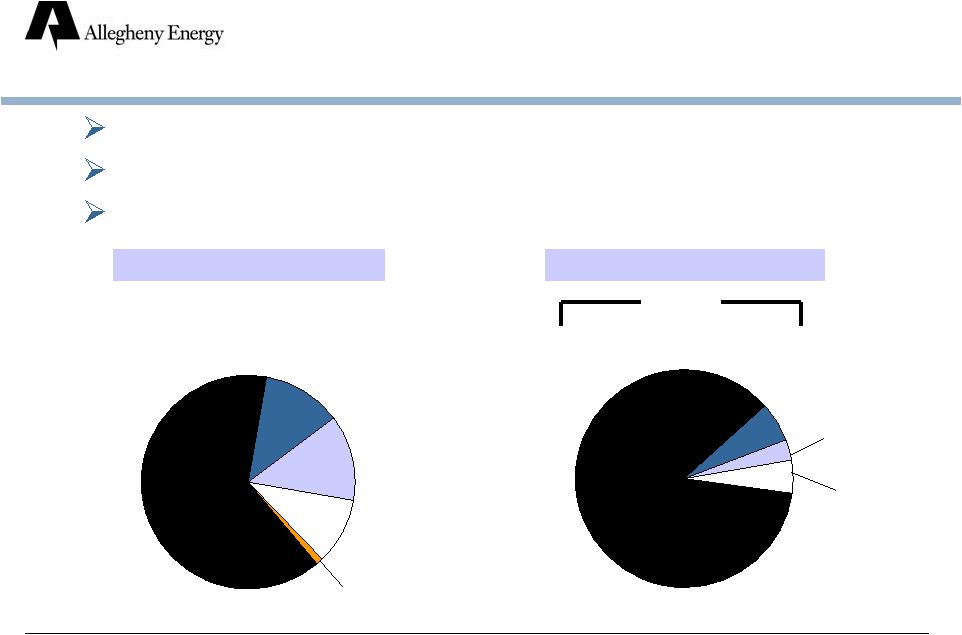 13
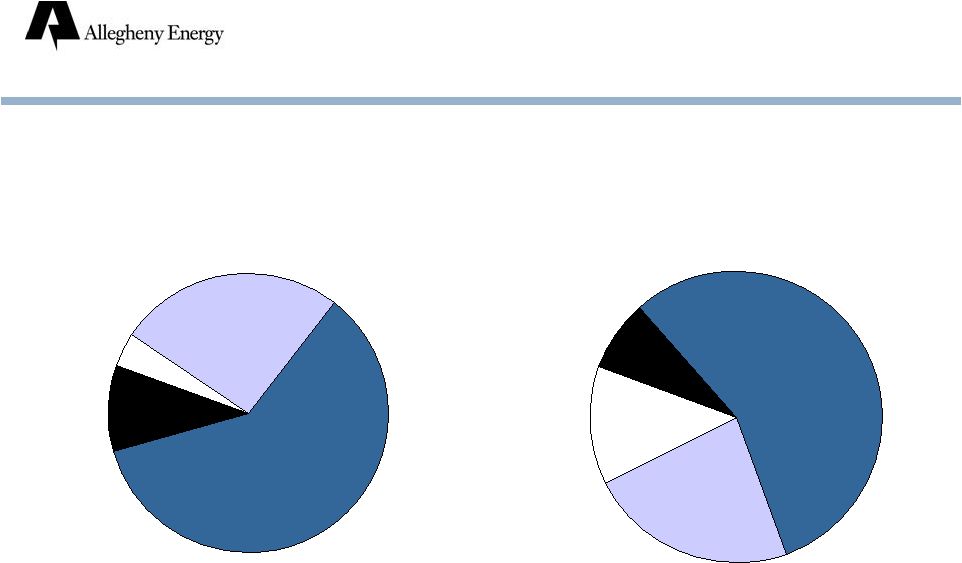
Merchant Generation:
Overview
Capacity (MW)*
* Capacity as of December 31, 2009. Output for 12 months ended December 31,
2009. Capacity: over 7,000 MW*
Primarily base load coal-fired plants
Located in PJM (13 states)
Output (MWH)*
Hydro
10%
Gas
13%
Supercritical
Coal
64%
Other Coal
12%
Oil
1%
Supercritical
Coal
86%
Gas
3%
Hydro and
Other
5%
Other Coal
6%
Coal
92% |
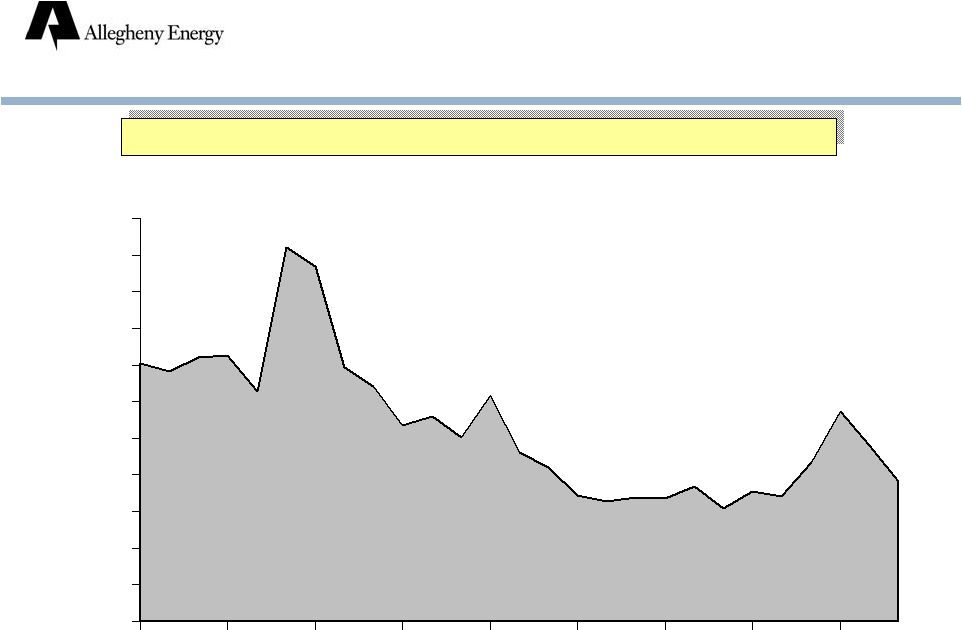 14
Merchant Generation:
Spot Power Prices
PJM Western Hub
($/MWH round-the-clock)
Jan.
08
June
08
Dec.
08
June
09
Dec.
09
Mar.
10
$0
$10
$20
$30
$40
$50
$60
$70
$80
$90
$100
$110
Spot prices have decreased sharply since June 2008. |
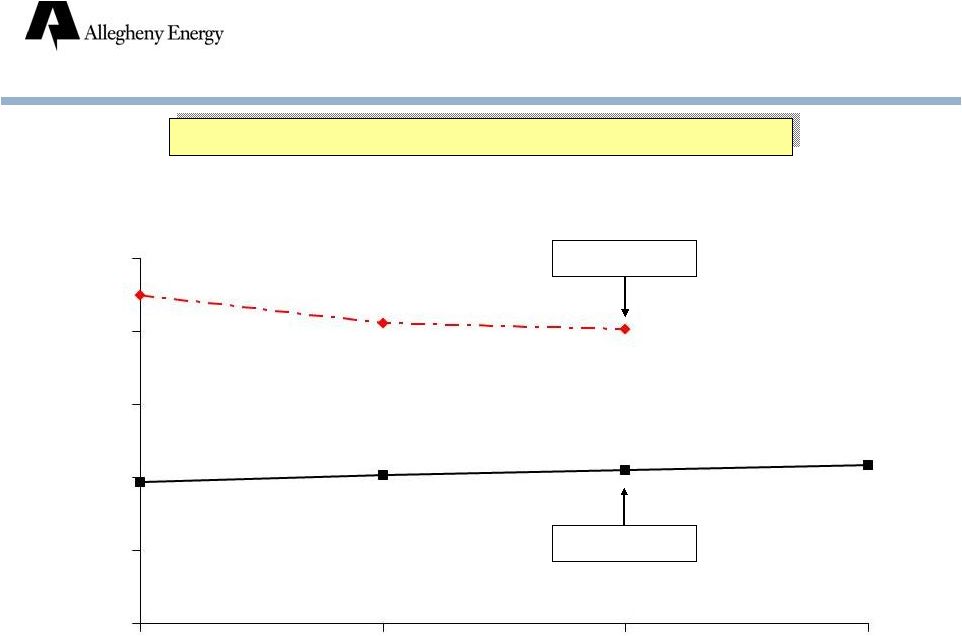 15
Merchant Generation:
Forward Power Prices
PJM Western Hub
($/MWH round-the-clock)
June 2008
March 2010
$0
$20
$40
$60
$80
$100
2009
2010
2011
2012
2011 forward prices have decreased by nearly 50%. |
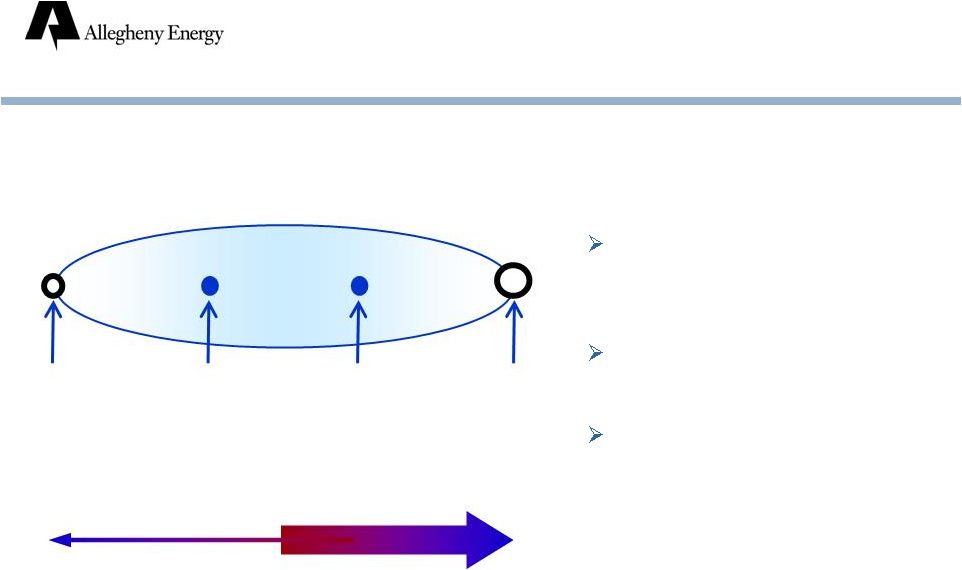 16
AEP
Dayton
Hub
APS
Zone
PJM
W. Hub
AYE
Generator
Nodes
Transmission
Less Congestion
More Congestion
Each plant sells all its output
at its generator node price in
PJM energy market
APS Zone: legacy retail
customer base
Due to transmission
congestion, plants’
realized
energy prices tend to be
closer to AEP-Dayton Hub
today than to PJM W. Hub
PJM Western Hub, AYE Plants
and AEP-Dayton Hub |
  17
Key drivers:
Amount and location of supply and demand
Capability of transmission system
Marginal cost of unit(s) that respond to meet demand and resolve
transmission constraints
Basis Differential
Gas strongly influences
prices, especially on
peak
Located in a coal-dominated
region of PJM
Prices typically below W. Hub
Located in a coal-dominated
region of PJM
Prices typically below W. Hub
Less liquid than W. Hub
PJM WESTERN HUB
AYE SUPERCRITICAL
PLANTS
AEP-DAYTON HUB
Basis differential is the difference between PJM energy
prices at two locations. |
 18
2011
2012
2013
2010
As of March 31, 2010
$ per MWH, round-the-clock
Forward Prices and
Basis Differentials
($5.45)
($5.89)
($4.89)
($4.97)
AEP-Dayton
Hub
PJM W. Hub
Basis
Differential
-$10
$0
$10
$20
$30
$40
$50 |
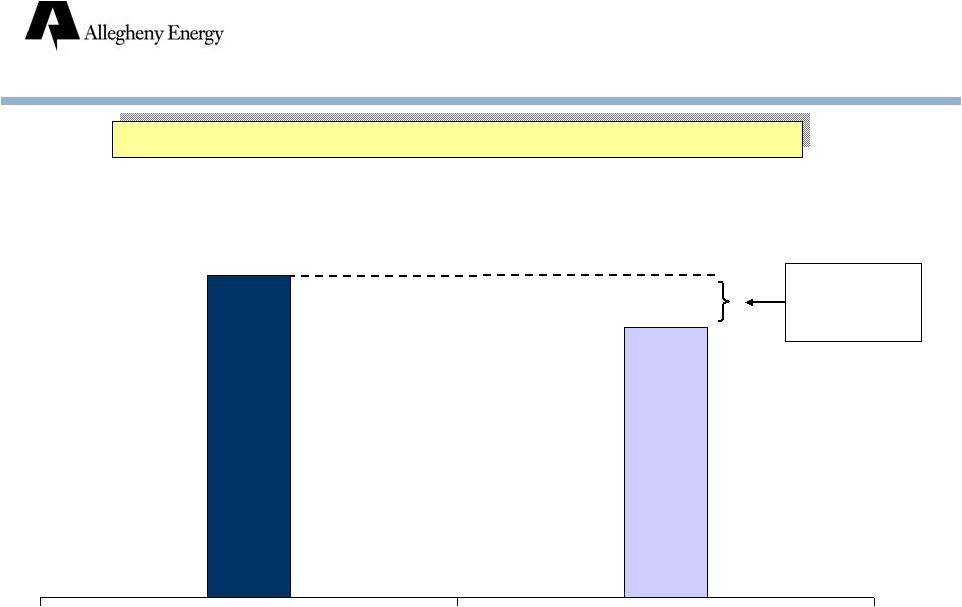 19
Merchant Generation:
Power Hedge Margin
2010 Power Hedge Margin
($/MWH; estimates as of March 31, 2010)
Margin:
$4/MWH
$110 million*
* Based on 2010 power hedge volume of 27.8 million MWH
$55
$51
Average Contract Price
Estimated Market Value
Power hedges substantially protect 2010 financial results.
|
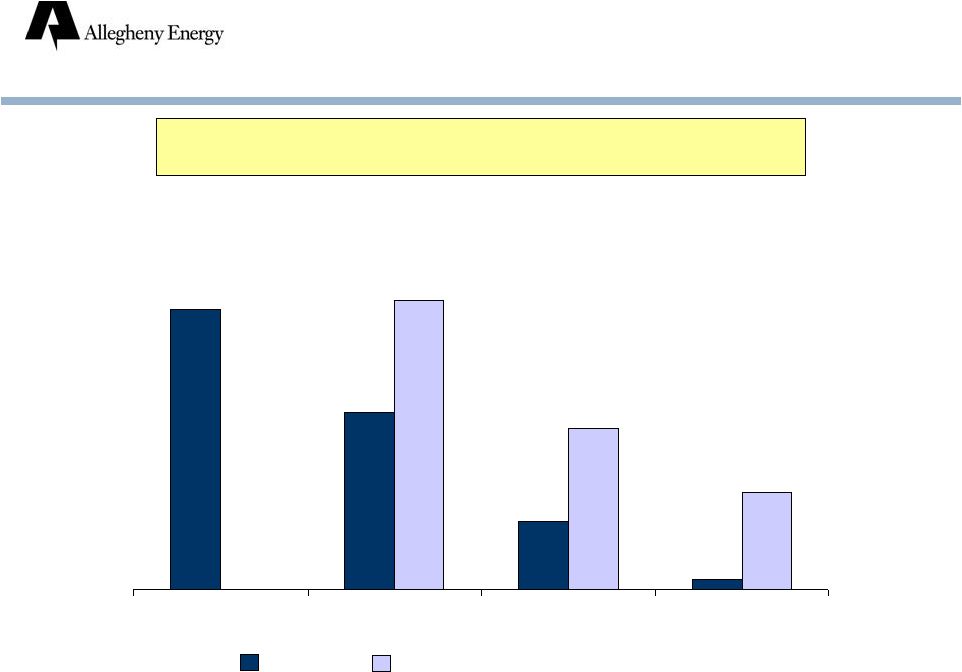  20
55%
30-50%
21%
0-30%
80-90%
87%
Actual Target by Year-End
2010 3%
Merchant Generation: Well-Positioned
For a Recovering Economy
% of Projected Coal-Fired Output
as of June 1, 2010
2010
2011
2012
2013
Allegheny is positioned to benefit from higher power
prices which should accompany economic recovery. |
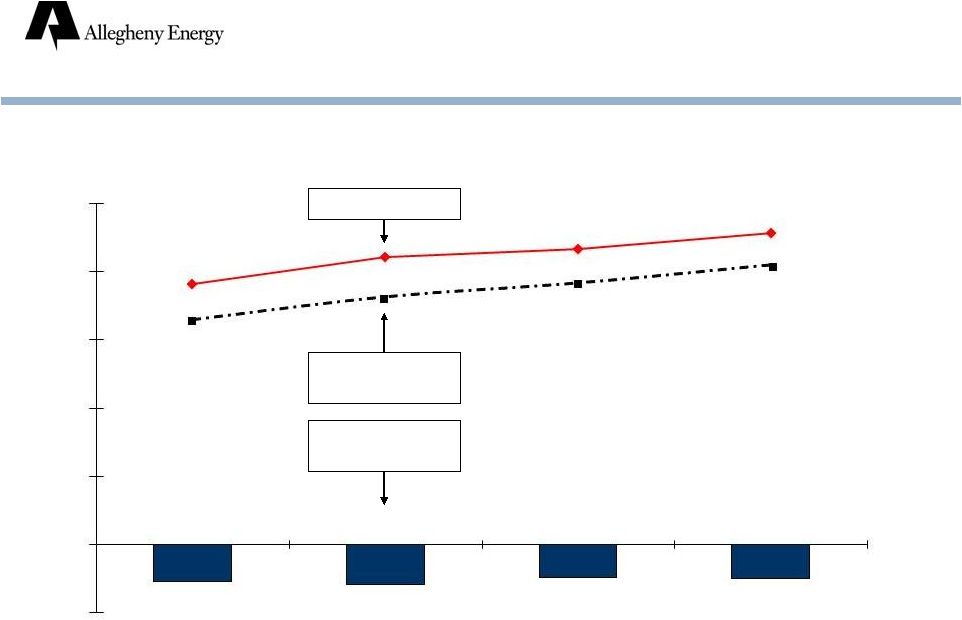
 21
Pennsylvania POLR Rate
$ per MWH
Cumulative Increase in
Pre-Tax Operating Income
$ millions; estimates
Increasing Pennsylvania
Generation Rates
$0
$50
$100
$150
$200
$250
$300
2009
2010
$20
$25
$30
$35
$40
$45
$50
$55
2008
2009
2010 |
 22
Transitioning to Market:
Pennsylvania
West Penn Power
Pennsylvania Power Procurement
APRIL 2009
JUNE 2009
OCT. 2009
JAN. 2010
MAY 2010
Average weighted retail generation price ($/MWH):
Residential
$72.80
$71.64
$65.29
$62.27
$59.39
Non-residential
$75.40
$67.24
$65.26
$63.38
Projected increase in 2011 residential bill
8.5%
10.6%
9.6%
8.5%
4.1%
PJM Western Hub forward price ($/MWH)
1
$55
$57
$53
$51
$47
1
Round-the-clock,
energy-only
price
at
time
bids
were
submitted.
For
17
months
beginning
January
1,
2011.
AUCTIONS |
 23
Power Procurement Schedule:
Pennsylvania and Maryland
MWH thousands
AUCTION DATE
2010
2011
2012
2013
TOTAL
June
11,
2010
-
MD
165
250
320
100
835
October
22,
2010
-
PA
-
7,285
765
180
8,230
October
29,
2010
-
MD
60
115
-
-
175
January
14,
2011
-
MD
-
150
-
-
150
January
20,
2012
-
PA
-
-
2,000
1,400
3,400
April
20,
2012
-
PA
-
-
1,900
1,300
3,200
Spot
Purchases
-
PA
-
1,850
8,100
3,350
13,300 |
 24
Merchant Generation:
Coal Contracts
Contracted & Priced*
Contract Price*
($/ton)
*
As
of
March
31,
2010.
Contract
price
includes
delivery
costs
averaging
$8-10/ton.
$55
$56
$58
$57
2009
2010
2011
2012
99%
70%
66%
2010
2011
2012 |
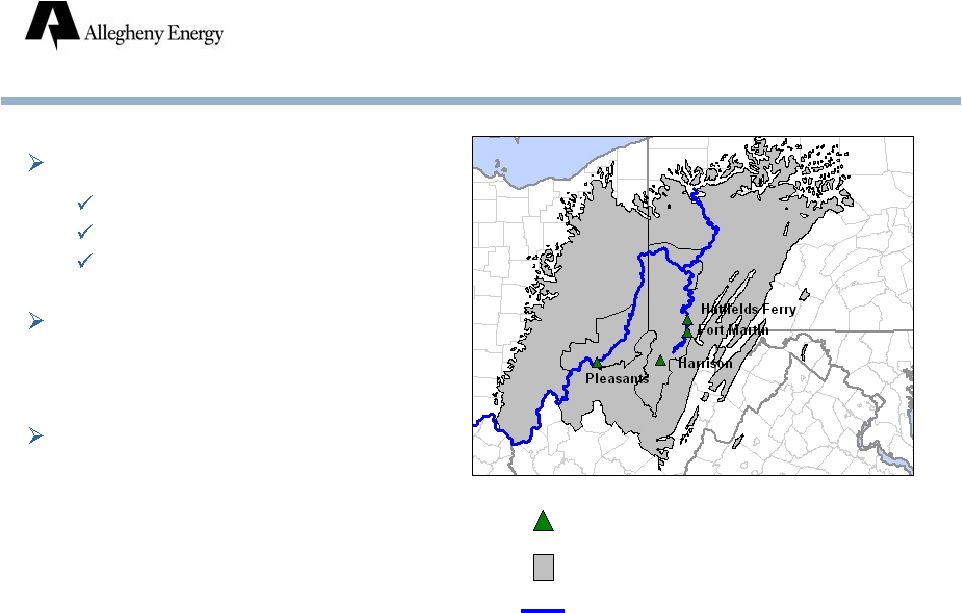 25
Adjacent to reserves, rivers
Low transportation costs
Flexible procurement
Competing suppliers
A natural partner for
independent mines in need of an
“anchor”
purchaser
Contract costs in line with
operating costs of leading
producers
Location: Favorable for
Coal Procurement
Supercritical coal generation facilities
Northern Appalachian coal basin
Rivers |
 26
Coal Type and
Delivery Methods
2010
(merchant; estimates)
Northern App.
Scrubber
60%
Northern App.
26%
PRB
4%
Illinois
10%
Rail
8%
Truck
13%
Conveyor
23%
Barge
56% |
 27
SCRUBBERS
SCRs
(SO
2
)
(NO
X
)
Harrison
Pleasants
Hatfield
Ft. Martin
Environmental Controls
All supercritical coal units have scrubbers. |
 28
Supercritical Coal Plants
(merchant and regulated)
Plant Availability
Top
Quartile
82%
78%
76%
83%
84%
83%
87.5%
82%
87%
2002
2003
2004
2005
2006
2007
2008
2009 |
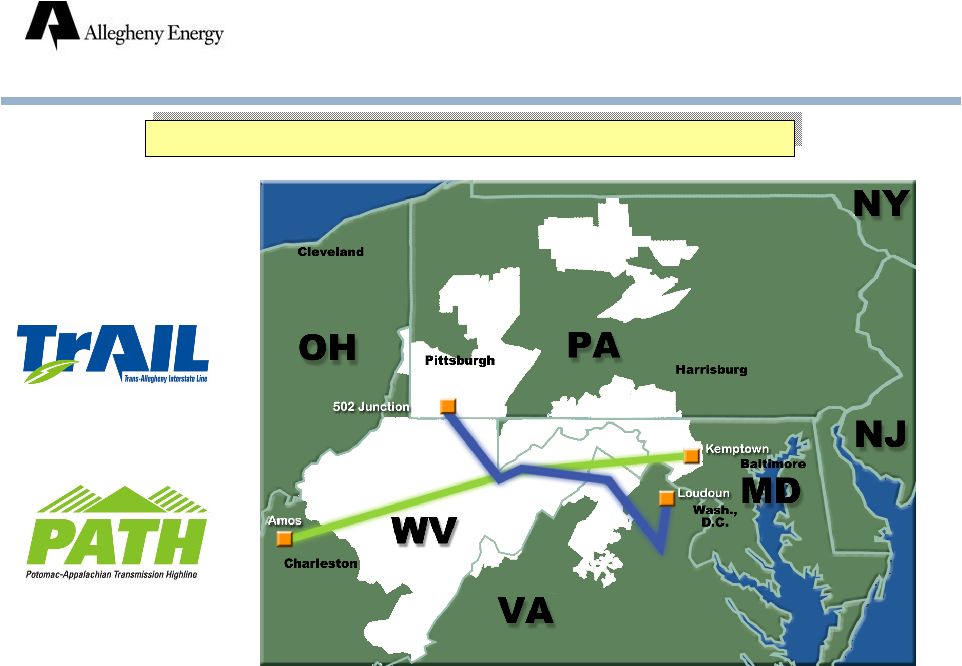 29
Transmission Expansion:
Overview
Allegheny is investing $2.6 billion in these projects.
|
 30
($ millions; cash basis)
*
Totals exclude AFUDC and capitalized interest. PATH represents
Allegheny’s portion of project costs.
FERC-approved equity ratio = 50%
Transmission Expansion
APPROVED
ROE
PROJECT
TOTAL
2008
2009
2010
2011
TrAIL
12.7%
$ 925*
$67
$384
$357
$80
Other projects
11.7-12.7%
425*
37
72
102
63
PATH
14.3%
1,200*
8
44
21
59
CAPITAL EXPENDITURES
Incentive returns have been approved by FERC. |
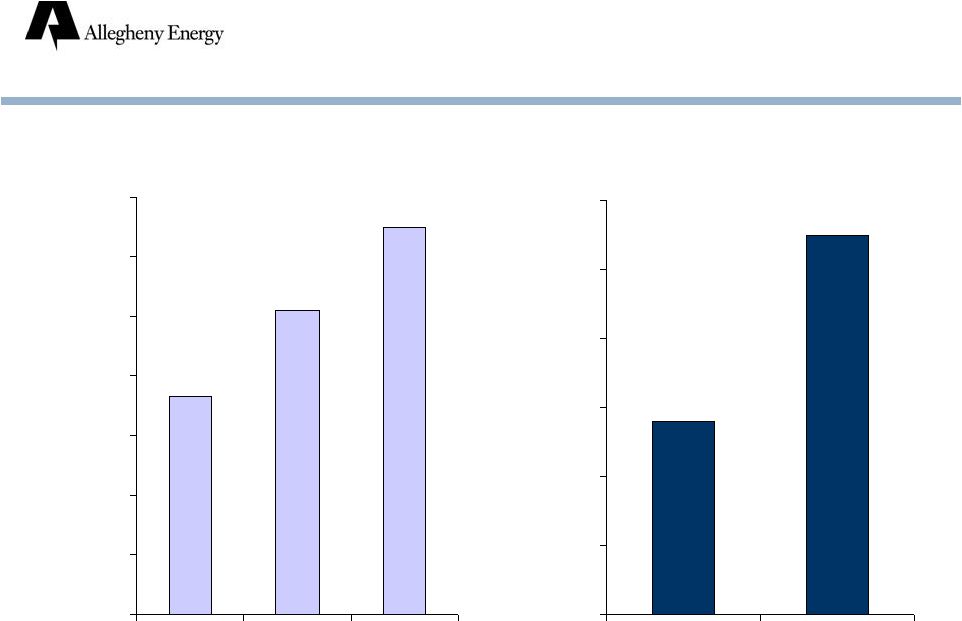
 31
Growing Rate Base:
Transmission Expansion
Rate Base
Year-End; $ billions
$0.2
$0.8
$1.2
$1.3
$2.0
//
TrAIL
Other PJM
PATH
(Allegheny portion)
Note: Assumes weighted average ROE based on rates for TrAIL (12.7%), Other
(11.7-12.7%), and PATH (14.3%). 2008
2009
2010
2011
2014
Rate base is projected to nearly triple from 2009 to 2014.
|
 32
% Complete
Rights of way
96%
Substation construction
95-100%
Towers constructed
67%
Line installed
23%
As of May 2010
Transmission Expansion:
TrAIL Construction Update |
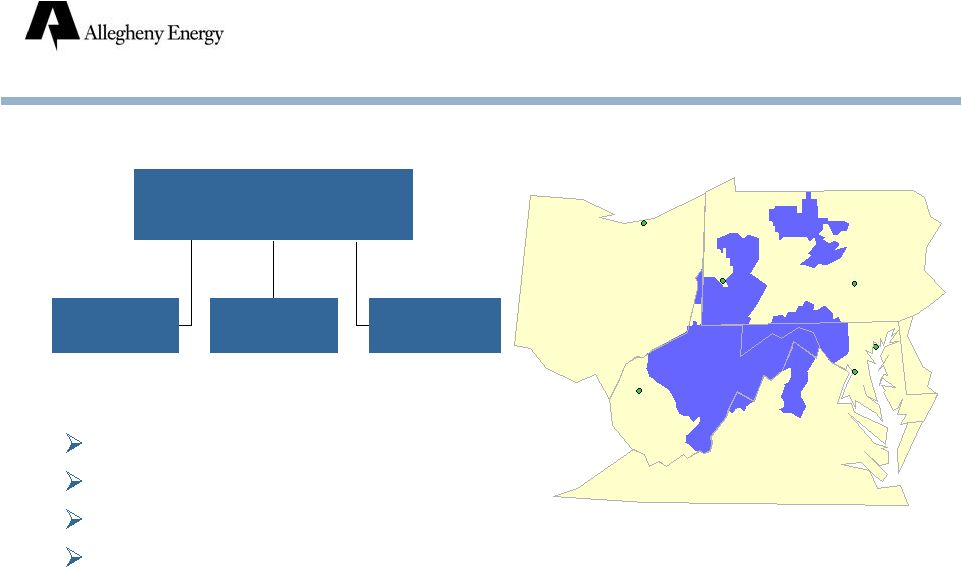 33
Utility Operations:
Overview
In 4 states (PA, WV, MD, VA)
1.6 million electric customers
Retail sales: 42.0 million MWH
Regulated generation: over 2,700 MW (84% coal)
Allegheny Power
West Penn
Power
Monongahela
Power
Potomac
Edison
VIRGINIA
CHARLESTON
OHIO
HARRISBURG
MARYLAND
KENTUCKY
PENNSYLVANIA
CLEVELAND
BALTIMORE
PITTSBURGH
WASHINGTON, DC
WEST
VIRGINIA
Sales for 12 months ended December 31, 2009. Capacity as of December 31,
2009. Customers and sales include VA. Sale of VA distribution
operations was completed on June 1, 2010. |
 34
Utility Operations:
Retail Revenue Mix, 2009
By State
By Customer Class
Residential
51%
Industrial
25%
Commercial
24%
* Sale of VA distribution operations was completed on June 1, 2010.
PA
45%
WV
29%
MD
17%
VA*
9% |
 35
Authorized Capital Structures
and ROE’s
*
Includes $154 of VA distribution assets. Sale of VA distribution operations was
completed on June 1, 2010.
STATE
RATE BASE
($ millions;
12/31/09)
APPROVED
EQUITY RATIO
APPROVED
ROE
RATIO/ROE
APPROVED ON
WV
$1,426
46%
10.5%
May 2007
PA
1,028
46
11.5
Dec. 1994
MD
446
44
11.9
Feb. 1993
VA
192*
46
11.5
March 1995
TOTAL
$3,092 |
 36
Potomac Edison*
West Penn
Mon Power
//
$2.9
$2.9
$3.9
$3.2
$3.5
Growing Rate Base:
Utility Operations
Year-end; $ billions
*
Excludes VA distribution assets for all periods
Note:
Includes capital expenditures for PA Act 129 plan as originally proposed ($174
million in 2010, $102 million in 2011, $44 million in 2012, $23 million in
2013 and $16 million in 2014). 2008
2009
2010
2011
2014 |
 37
Utility Operations:
Competitive Rates
National
Average =
11.65 ¢/kWh
Residential Rates
¢/kWh as of January 1, 2010
*
Sale of VA distribution operations was completed on June 1, 2010.
9.29
9.18
10.37
9.58
12.90
8.61
10.19
13.91
Pennsylvania
West Virginia
Maryland
Virginia*
Allegheny Power
State Average |
 38
Unhedged
energy margin:
Unhedged
energy revenues
-
hedged
coal
expense
-
unhedged
coal
expense
-
other
fuel
related
Unhedged
net revenue:
Unhedged
energy margin + capacity +
ancillaries + other net revenues
Unhedged
EBITDA:
Unhedged
net revenues -
operating expenses
Power hedge margin:
(Average contract price -
estimated market value) x
power hedge volume
Adjusted EBITDA:
Unhedged
EBITDA + power hedge margin
Merchant Generation Outlook:
Formulas |
 39
($ millions adjusted pre-tax; estimates as of 03/31/10)
2010 Outlook
Change from
2009
12/31
Actual
Better (Worse)
Adjusted EBITDA:
Merchant generation
578
$
(55)
$
(46)
$
Utility operations
540
4
(54)
Transmission expansion
65
71
2
Other
(2)
(1)
-
Depreciation
(282)
(46)
1
Interest
(258)
(49)
(1)
2010 Earnings
Increase (Decrease) |
 40
Merchant Generation:
2010 Outlook
($ millions adjusted pre-tax; estimates as of 03/31/10)
2009
Actual
Adjusted EBITDA:
Merchant generation
578
$
(55)
$
(46)
$
Key drivers:
Unhedged
energy
margin
3
$
(220)
$
Capacity
56
7
Other
(4)
(5)
Operating expenses
(10)
(5)
Power hedge margin
(99)
178
Change from
2010 Earnings
Increase (Decrease)
12/31
Better (Worse) |
 41
1
Excludes volumes from Buchanan and volumes consumed by pumping at Bath County.
2
The expected realized price received from PJM at the generator.
3
Includes emissions, lime, urea, natural gas, other fuels, OVEC purchased power, and
Bath County pumping costs. 4
Includes ancillaries, Kern River, and other miscellaneous income.
5
Includes O&M, taxes other than income, and other income.
Note: numbers may not add due to rounding
Merchant Generation:
Key Drivers of EBITDA
Estimates as of 03/31/10 -
$ millions unless stated
2009
Actual
2010
Change vs
2009
Total
generation
volume
(TWh)
1
26
33
7 TWh
PJM Western Hub RTC price ($/MWh)
39
$
40
$
Basis and shaping ($/MWh)
(3)
(5)
Realized
energy
price
($/MWh)
2
36
$
35
$
$ (1) / MWh
Unhedged
energy revenues
937
$
1,173
$
Coal expense
(552)
(754)
Other
fuel
related
3
(162)
(193)
Unhedged
energy margin
223
$
226
$
3
$
Capacity
356
412
56
Other
net
revenues
4
83
79
(4)
Unhedged
net revenues
662
$
716
$
Operating
expenses
and
other
5
(293)
(303)
(10)
Unhedged
EBITDA
369
$
413
$
44
$
|
 42
1
Includes POLR obligations, marketing contracts, and financial hedges.
2
Volume weighted contract price, including energy, capacity, ancillaries, congestion,
and shaping. 3
Volume weighted market price as of 3/31/10 including energy, capacity, ancillaries,
congestion, and shaping. 4
Difference between average contract price and contract market value multiplied by
power hedge volume. Note: numbers may not add due to rounding
Merchant Generation:
Key Drivers of EBITDA
Estimates as of 03/31/10 -
$ millions unless stated
2009
Actual
2010
Change
vs
2009
Unhedged
EBITDA
369
$
413
$
44
$
Power hedge volume (TWh)
1
27
28
Average contract price ($/MWh)
2
55
$
55
$
Estimated market value ($/MWh)
3
47
51
Power hedge margin ($/MWh)
8
$
4
$
Power hedge margin
4
209
$
110
$
(99)
Adjusted EBITDA
578
$
523
$
(55)
$ |
 43
Note: For period 2010-2012 power volumes, % power hedged, and % coal priced are
based upon 3/31/10 production forecasts which are subject to change; coal
contract prices include delivery costs Merchant Generation:
Key Drivers of EBITDA
1
Includes supplemental auctions
Estimates as of 03/31/10 -
$ millions unless stated
2009
Actual
2010
2011
2012
POWER VOLUMES
Coal-fired generation (TWh)
24.4
32.1
33.1
32.4
Total generation (TWh)
26.0
33.5
34.5
33.8
POWER HEDGES
% of coal-fired generation hedged
N/A
87%
41%
11%
Volumes (TWh)
26.7
27.8
13.7
3.7
Average contract price ($/MWh)
55
$
55
$
58
$
55
$
Estimated market value ($/MWh)
47
51
50
51
Power hedge margin ($ millions)
209
$
110
$
112
$
14
$
COAL CONTRACTS
% of coal burn priced
N/A
99%
70%
66%
Volumes priced (tons)
10.1
13.0
9.5
8.6
Contract price ($/ton)
55
$
56
$
58
$
57
$
CAPACITY REVENUES
1
Capacity (MW)
6,335
6,293
6,218
6,228
Price ($/MW-day)
154
$
179
$
138
$
56
$
Revenues ($ millions)
356
$
412
$
313
$
127
$ |
 44
Merchant Generation:
Forward Market Data
Note: broker estimates
1
SO2
allowance
to
ton
of
emission
ratio
–
2009
=
1:1
and
2010-2012
=
2:1
Actual
Balance
As of 03/31/10
2009
2010
2011
2012
POWER
($/MWh)
PJM West Hub RTC
38.75
$
38.08
$
42.04
$
43.32
$
AEP Dayton Hub RTC
32.98
32.63
36.15
38.43
NATURAL GAS
($/MMBtu)
Henry Hub NYMEX
3.92
$
4.27
$
5.34
$
5.79
$
COAL
($/ton)
-
excludes transportation
NAPP mid SO2
N/A
$63
$68
$72
NAPP high SO2
N/A
$48
$52
$55
EMISSIONS
($/allowance)
SO2
1
82
$
29
$
28
$
26
$
NOx
-
ozone season
302
45
33
N/A
NOx
-
annual
1,382
450
343
138 |
 45
1
Change
in
pre-tax
income
=
(Total
generation
volume
–
power
hedge
volume
–
Bath
pumping
annual volume of approximately 1.5 TWh) x realized energy price sensitivity
($/MWh) 2
Cost of each emission allowance adjusted by same percentage
Note: does not reflect potential dispatch changes, load changes, changes in basis,
or correlations between variables; all sensitivities reflect hedge positions
and production forecasts as of 03/31/10
Merchant Generation:
Sensitivities
Change in adjusted pre-tax income ($ millions)
2010
2011
2012
REALIZED
ENERGY
PRICE
1
+ $10/MWh
35
$
193
$
286
$
COAL PRICE
+ $10/ton
(2)
(41)
(45)
SO2
/
NOX
ALLOWANCE
PRICES
2
+ 100%
2
(4)
(1) |
 46
Utility Operations:
2010 Outlook
($ millions adjusted pre-tax; estimates as of 03/31/10)
1
Subject to change pending outcome of review of lower cost compliance
alternative 2
Excludes gain from sale of VA Distribution
2009
Actual
Adjusted EBITDA:
Utility operations
540
$
4
$
(54)
$
Key drivers:
WV base rate settlement
20
$
(33)
$
Winter storms -
1st quarter
(20)
(29)
WV storm recovery
5
5
Recovery of securitized interest & depreciation
17
-
PA Act 129
1
-
(10)
Load growth
5
5
PE VA operations
2
(24)
5
Non-formulaic O&M
(2)
1
Other
3
2
Change from
2010 Earnings
Increase (Decrease)
Better (Worse)
12/31 |
 47
Transmission Expansion:
2010 Outlook
($ millions adjusted pre-tax; estimates as of 03/31/10)
Change from
2009
12/31
Actual
Better (Worse)
Adjusted EBITDA:
Transmission expansion
65
$
71
$
2
$
2010 Earnings
Increase (Decrease) |
 48
Depreciation:
2010 Outlook
($ millions adjusted pre-tax; estimates as of 03/31/10)
Change from
2009
12/31
Actual
Better (Worse)
Depreciation
(282)
$
(46)
$
1
$
Key drivers:
Scrubber (Ft. Martin)
(21)
$
-
$
Scrubber (Hatfield)
(19)
-
Other
(6)
1
2010 Earnings
Increase (Decrease) |
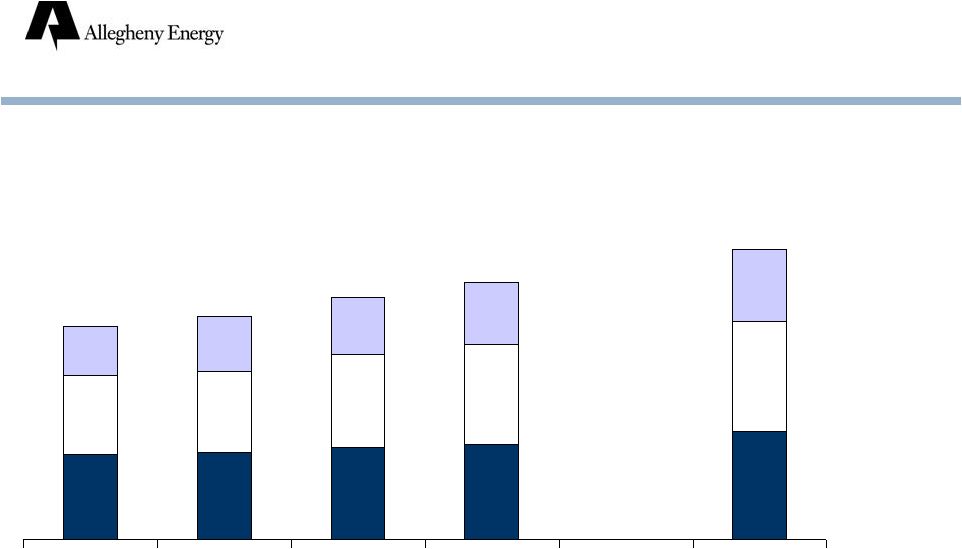
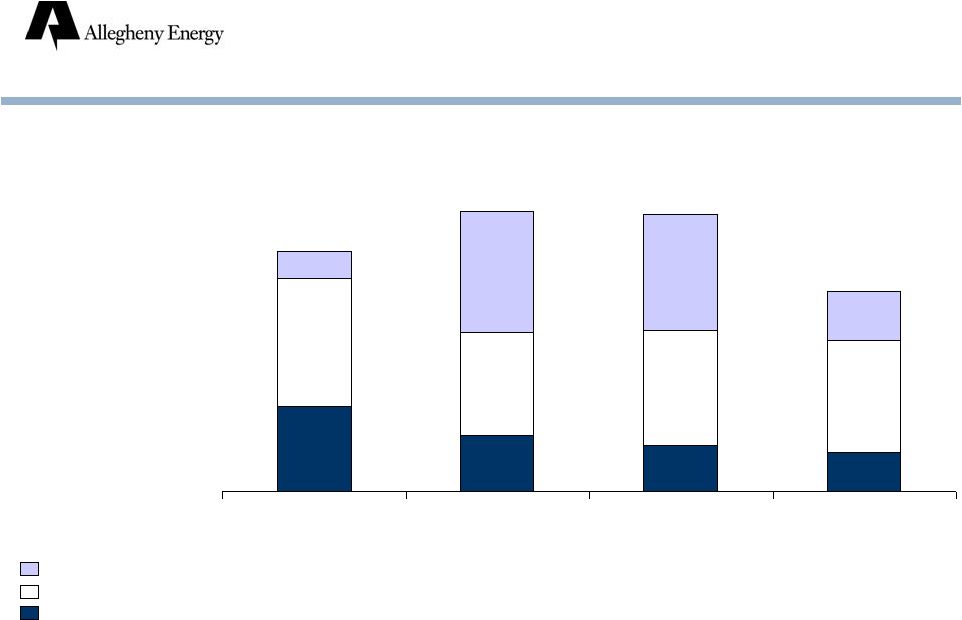 49
Transmission expansion
$112
$499
$480
$202
Utility Operations
532
420
477
460
Merchant generation
347
233
187
161
$ millions; cash basis
Capital Expenditures
$991
$1,152
$823
$1,144
NOTE:
includes securitized scrubber capital expenditures, Allegheny’s portion
of PATH, and expenditures for PA Act 129 plan (as originally proposed) which
were $174 million in 2010 and $102 million in 2011. 2008
2009
2010
2011 |
 50
Interest:
2010 Outlook
($ millions adjusted pre-tax; estimates as of 03/31/10)
* Subject to formulaic recovery
Change from
2009
12/31
Actual
Better (Worse)
Interest
(258)
$
(49)
$
(1)
$
Key drivers:
Securitized interest
5
$
*
2
$
Capitalized interest
(21)
(1)
Transmission
(20)
*
5
Other
(13)
(7)
2010 Earnings
Increase (Decrease) |
 51
Strength of economic recovery
Gas prices
Environmental regulations
Climate change legislation
PATH approvals
Merger approvals
Risks and Challenges |
 52
Significant benefits to shareholders
Premium
Dividend increase
Diversifies fuel mix by adding nuclear capacity
Provides greater scale and scope
Strong business portfolio, excellent growth
opportunities
FirstEnergy Merger |
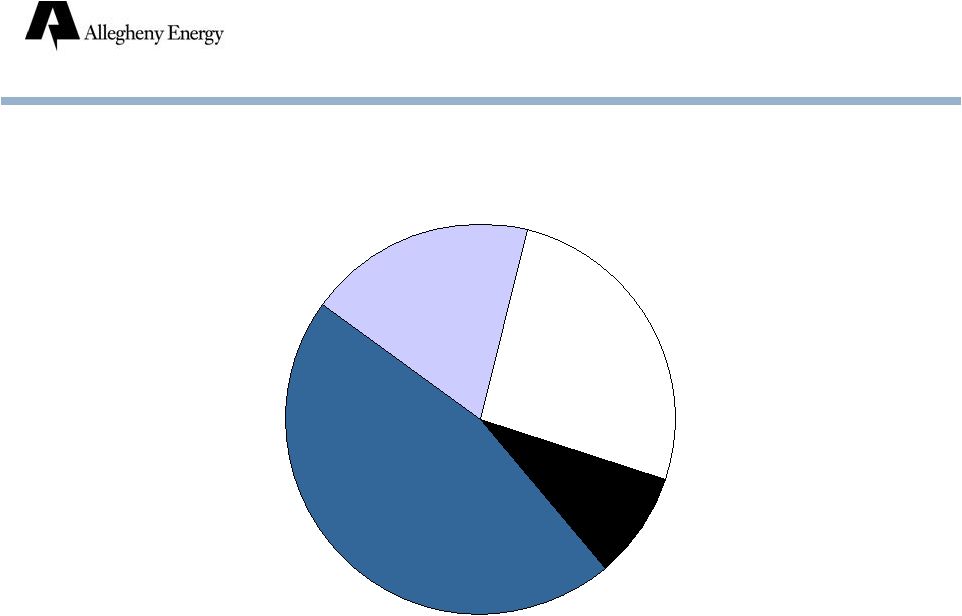 53
FirstEnergy Merger:
Diversifies Fuel Mix
Coal: Unscrubbed
19%
Coal: Scrubbed
46%
Natural Gas
9%
Non-Emitting
26%
Combined Generation Capacity
December 31, 2009
1
Includes nuclear, wind and hydro
1 |
 54
FirstEnergy Merger:
Greater Scale and Scope
Revenue
$16.4 billion
Electric Customers
6.1 million
Rate Base
$10.8 billion
Total Generation
24 GW
Competitive Generation
21 GW
Service Territory
67,000 sq miles
Employees
~17,750
FirstEnergy Service Territory
Allegheny Service Territory
FirstEnergy Plants
Allegheny Plants
Combined Statistics |
 55
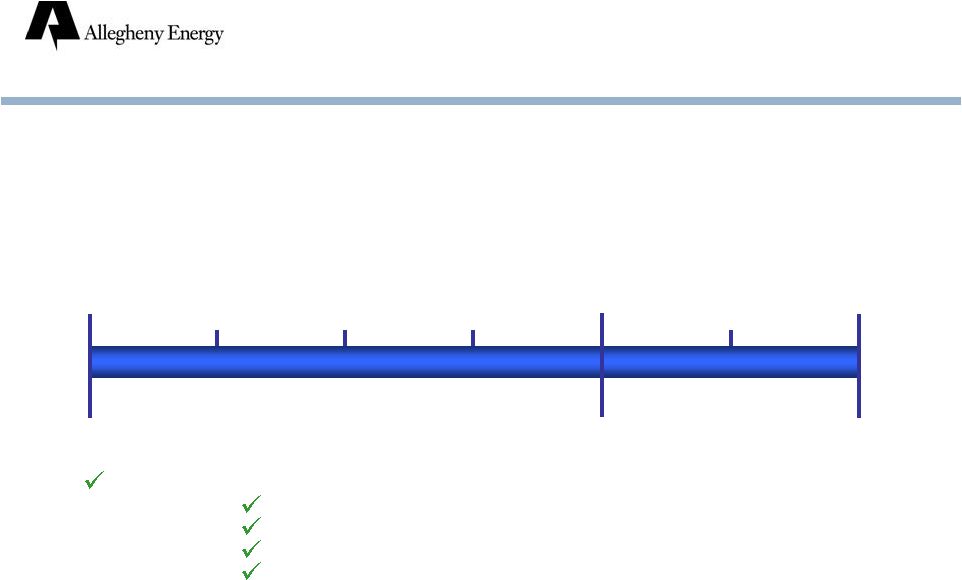
FirstEnergy Merger:
Timeline
Announced
merger,
filed S-4
Filed with:
FERC
PA
WV
MD
VA
Shareholder
meetings
Complete merger
2010
2011
Q1
Q4
Q2
Q3
Q1
Q2 |
 Supplemental Information |
 57
Earnings (Loss) Per Share
As Reported
As Adjusted
As Reported
As Adjusted
2003:
Q1
$
(0.46)
$
(0.32)
2007:
Q1
$
0.65
$
0.65
Q2
(1.82)
(0.23)
Q2
0.45
0.45
Q3
(0.40)
0.11
Q3
0.67
0.67
Q4
(0.11)
(0.14)
Q4
0.65
0.46
Year
(2.80)
(0.37)
Year
2.43
2.26
2004:
Q1
$
0.25
$
(0.03)
2008:
Q1
$
0.80
$
0.80
Q2
(0.31)
(0.21)
Q2
0.91
0.45
Q3
(2.40)
0.37
Q3
0.52
0.54
Q4
0.48
0.22
Q4
0.10
0.51
Year
(1.83)
0.47
Year
2.33
2.30
2005:
Q1
$
0.29
$
0.39
2009:
Q1
$
0.79
$
0.67
Q2
(0.12)
0.08
Q2
0.43
0.41
Q3
0.21
0.45
Q3
0.45
0.59
Q4
0.02
0.02
Q4
0.64
0.66
Year
0.40
0.94
Year
2.31
2.33
2006:
Q1
$
0.67
$
0.68
2010:
Q1
$
0.52
$
0.61
Q2
0.18
0.22
Q3
0.65
0.56
Q4
0.38
0.37
Year
1.89
1.83 |
 58
EBITDA
As Reported
As Adjusted
As Reported
As Adjusted
2003:
Q1
$
77.6
$
92.9
2007:
Q1
$
312.6
$
312.6
Q2
(203.5)
150.1
Q2
263.8
263.8
Q3
117.3
225.3
Q3
308.6
308.6
Q4
197.4
185.6
Q4
242.9
243.6
Year
156.8
634.9
Year
1,128.0
1,131.1
2004:
Q1
$
247.8
$
175.5
2008:
Q1
$
323.1
$
323.1
Q2
110.3
122.0
Q2
371.4
244.1
Q3
243.2
243.2
Q3
258.6
262.6
Q4
312.7
221.8
Q4
152.0
268.3
Year
914.0
762.5
Year
1,105.3
1,098.3
2005:
Q1
$
261.3
$
261.3
2009:
Q1
$
360.6
$
328.2
Q2
210.6
192.7
Q2
247.8
243.2
Q3
254.7
274.2
Q3
278.7
297.0
Q4
162.1
162.1
Q4
320.3
312.4
Year
888.6
890.2
Year
1,207.6
1,181.0
2006:
Q1
$
322.1
$
322.1
2010:
Q1
$
300.8
$
324.9
Q2
193.7
193.7
Q3
286.3
286.3
Q4
234.7
234.7
Year
1,036.8
1,036.8
$ millions |
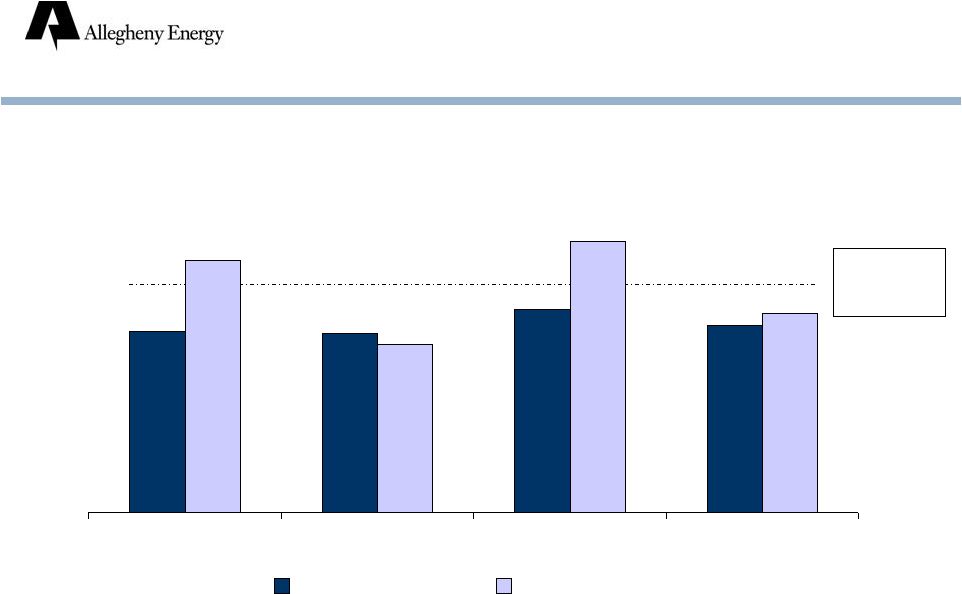
 59
($1,200)
($700)
($200)
$300
$800
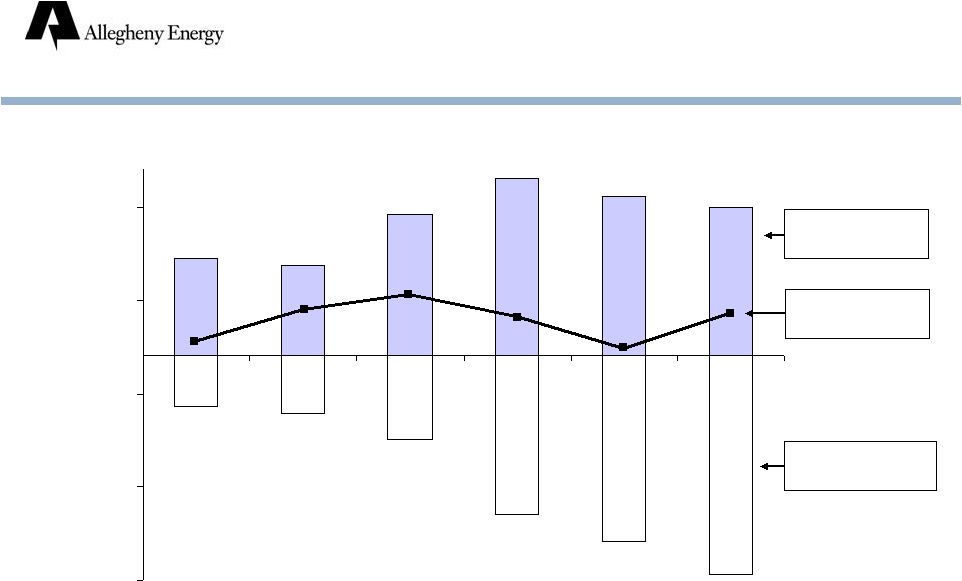
Cash Flow
$ millions
*
Adjusted cash from operations net of capital expenditures excluding securitization
and project financings.
2004
2007
2006
2005
2008
2009
Cash From
Operations
Capital
Expenditures
Free Cash
Flow* |
 60
Credit Ratings
Baa3
Ba3
B3
Moody’s
BBB-
BB-
CCC+
S&P
Senior Unsecured Debt
Baa2
Baa3
B1
Moody’s
BBB
BBB-
B
S&P
Senior Secured Debt
AE Supply
Ba1
Ba2
B2
Moody’s
BB+
BB-
CCC+
S&P
Senior Unsecured Debt
BBB-
BB+
B
S&P
Corporate Family Rating
AYE, Inc.
April
2010
2006
2003 |