Attached files
| file | filename |
|---|---|
| EX-32 - EXHIBIT 32 - THQ INC | a2198997zex-32.htm |
| EX-21 - EXHIBIT 21 - THQ INC | a2198997zex-21.htm |
| EX-31.1 - EXHIBIT 31.1 - THQ INC | a2198997zex-31_1.htm |
| EX-23.1 - EXHIBIT 23.1 - THQ INC | a2198997zex-23_1.htm |
| EX-10.37 - EXHIBIT 10.37 - THQ INC | a2198997zex-10_37.htm |
| EX-10.47 - EXHIBIT 10.47 - THQ INC | a2198997zex-10_47.htm |
| EX-10.38 - EXHIBIT 10.38 - THQ INC | a2198997zex-10_38.htm |
| EX-10.18 - EXHIBIT 10.18 - THQ INC | a2198997zex-10_18.htm |
| EX-31.2 - EXHIBIT 31.2 - THQ INC | a2198997zex-31_2.htm |
UNITED STATES
SECURITIES AND EXCHANGE COMMISSION
WASHINGTON, D.C. 20549
FORM 10-K
(Mark One)
ý ANNUAL REPORT PURSUANT TO SECTION 13 OR 15(d)
OF THE SECURITIES EXCHANGE ACT OF 1934
For the fiscal year ended March 31, 2010
OR
o TRANSITION REPORT PURSUANT TO SECTION 13 OR 15(d)
OF THE SECURITIES EXCHANGE ACT OF 1934
For the transition period from to
Commission file number 0-18813

THQ INC.
(Exact Name of Registrant as Specified in Its Charter)
| Delaware | 13-3541686 | |
| (State or Other Jurisdiction of Incorporation or Organization) |
(I.R.S. Employer Identification No.) |
|
29903 Agoura Road |
||
| Agoura Hills, CA | 91301 | |
| (Address of principal executive offices) | (Zip Code) |
Registrant's telephone number, including area code: (818) 871-5000
Securities registered pursuant to Section 12(b) of the Act:
| Title of each class: | Name of each exchange on which registered: | |
| Common Stock, $.01 par value | The NASDAQ Stock Market LLC | |
| Preferred Stock Purchase Rights | The NASDAQ Stock Market LLC |
Securities registered pursuant to Section 12(g) of the Act: None
Indicate by check mark if the registrant is a well-known seasoned issuer, as defined in Rule 405 of the Securities Act. Yes o No þ
Indicate by check mark if the registrant is not required to file reports pursuant to Section 13 or Section 15(d) of the Act. Yes o No þ
Indicate by check mark whether the registrant (1) has filed all reports required to be filed by Section 13 or 15(d) of the Securities Exchange Act of 1934 during the preceding 12 months (or for such shorter period that the registrant was required to file such reports), and (2) has been subject to such filing requirements for the past 90 days. Yes þ No o
Indicate by check mark whether the registrant has submitted electronically and posted on its corporate Web site, if any, every Interactive Data File required to be submitted and posted pursuant to Rule 405 of Regulation S-T (§ 229.405 of this chapter) during the preceding 12 months (or for such shorter period that the registrant was required to submit and post such files). Yes o No o
Indicate by check mark if disclosure of delinquent filers pursuant to Item 405 of Regulation S-K is not contained herein, and will not be contained, to the best of the registrant's knowledge, in definitive proxy or information statements incorporated by reference in Part III of this Form 10-K or any amendment to this Form 10-K. o
Indicate by check mark whether the registrant is a large accelerated filer, an accelerated filer, a non-accelerated filer, or a smaller reporting company. See definitions of "large accelerated filer", "accelerated filer" and "smaller reporting company" in Rule 12b-2 of the Exchange Act.
| Large accelerated filer o | Accelerated filer þ | Non-accelerated filer o (Do not check if a smaller reporting company) |
Smaller reporting company o |
Indicate by check mark whether the registrant is a shell company (as defined in Rule 12b-2 of the Act). Yes o No þ
The aggregate market value of the voting and non-voting common equity held by non-affiliates, computed by reference to the price at which the common equity was last sold, as of the last business day of the registrant's most recently completed second fiscal quarter, September 26, 2009 was approximately $478.0 million.
The number of shares outstanding of the registrant's common stock as of May 28, 2010 was approximately 67,746,675.
DOCUMENTS INCORPORATED BY REFERENCE
The registrant's 2010 Proxy Statement is incorporated by reference into Part III herein.
THQ INC.
INDEX TO ANNUAL REPORT ON FORM 10-K
FILED WITH THE SECURITIES AND EXCHANGE COMMISSION
FOR THE FISCAL YEAR ENDED MARCH 31, 2010
ITEMS IN FORM 10-K
The statements contained in this Annual Report on Form 10-K that are not historical facts may be "forward-looking statements" within the meaning of the Private Securities Litigation Reform Act of 1995. Such statements include, but are not limited to statements regarding industry prospects and future results of operations or financial position. We generally use words such as "anticipate," "believe," "could," "estimate," "expect," "forecast," "future" "intend," "may," "plan," "positioned," "potential," "project," "scheduled," "set to," "subject to," "upcoming" and other similar expressions to help identify forward-looking statements. These forward-looking statements are based on current expectations, estimates and projections about the business of THQ Inc. and its subsidiaries and are based upon management's current beliefs and certain assumptions made by management. Such forward-looking statements are subject to risks and uncertainties that could cause actual results to differ materially from those expressed or implied by such forward-looking statements, including, but not limited to, business, competitive, economic, legal, political and technological factors affecting our industry, operations, markets, products or pricing. The forward-looking statements contained herein speak only as of the date on which they were made, and we disclaim any obligation to update any forward-looking statements to reflect events or circumstances after the date of this Annual Report. Risks and uncertainties that may affect our future results include, but are not limited to, those discussed under the heading "Risk Factors," included in Item 1A herein.
All references to "we," "us," "our," "THQ," or the "Company" in the following discussion and analysis mean THQ Inc. and its subsidiaries. Most of the properties and titles referred to in this Annual Report are subject to trademark protection.
Introduction
We are a leading worldwide developer and publisher of interactive entertainment software for all popular game systems, including:
- •
- home video game consoles such as the Microsoft Xbox 360 ("Xbox 360"), Nintendo Wii ("Wii"), Sony PlayStation
3 ("PS3") and Sony PlayStation 2 ("PS2");
- •
- handheld platforms such as the Nintendo DS and DSi (collectively referred to as "DS"), and Sony PlayStation Portable
("PSP");
- •
- wireless devices, including the iPhone, iTouch and iPad; and
- •
- personal computers ("PCs"), including games played online.
We also develop and publish titles for digital distribution via Sony's PlayStation Network ("PSN") and Microsoft's Xbox LIVE Marketplace ("Xbox LIVE") and Xbox LIVE Arcade ("XBLA"), as well as digitally offer our PC titles through online download stores and services such as Steam. We believe that digital delivery of games and game content is becoming an increasingly important part of our business.
Our titles span a wide range of categories, including action, adventure, fighting, racing, role-playing, simulation, sports and strategy. We have created, licensed and acquired a group of highly recognizable brands, which we market to a variety of consumer demographics ranging from products targeted at core gamers to products targeted to children and the mass market. Our portfolio of Core Games includes games based on popular fighting brands such as the Ultimate Fighting Championship ("UFC") and World Wrestling Entertainment ("WWE"); racing games based on our MX vs. ATV brand; and action, shooter and strategy games based on our owned intellectual properties such as Company of Heroes, Darksiders, Red Faction, and Saints Row, as well as games based on Games Workshop's Warhammer 40,000 universe. Our Kids, Family and Casual portfolio includes games based on popular brands such as DreamWorks
1
Animation, Disney•Pixar, Marvel Entertainment, NBC's The Biggest Loser, Nickelodeon, and Sony Picture Consumer Product's JEOPARDY! and Wheel of Fortune, as well as games based on our owned intellectual properties, including de Blob and Drawn to Life.
We develop our products using both internal and external development resources. The internal resources consist of producers, game designers, software engineers, artists, animators and game testers located within our internal development studios and corporate headquarters. The external development resources consist of third-party software developers and other independent resources such as artists, voice-over actors and composers. We refer to this group of development resources as our Studio System.
Our global sales network includes offices throughout North America, Europe and Asia Pacific. In the U.S. and Canada, we market and distribute games directly to mass merchandisers, consumer electronic stores, discount warehouses and other national retail chain stores. Internationally, we market and distribute games on a direct-to-retail basis in the territories where we have a direct sales force and to a lesser extent, in the territories where we do not have a direct sales force, third parties distribute our games. We also globally market and distribute games digitally via the Internet and through high-end wireless devices, such as the iPhone, iTouch and iPad.
We were originally incorporated in New York in 1989 as Trinity Acquisition Corporation, which changed its name in 1991 to T.HQ, Inc. following a merger with THQ, Inc., a California corporation. We were reincorporated in Delaware as THQ Inc. in 1997. Our principal executive offices are located at 29903 Agoura Road, Agoura Hills, California 91301, and our telephone number is (818) 871-5000. Our Internet address is http://www.thq.com.
Fiscal Periods
Our fiscal year ends on the Saturday nearest March 31st. For simplicity, all fiscal periods are presented or referenced as ending on a calendar month end. The fiscal year ending March 31, 2011 and the fiscal years ended March 31, 2010, 2009 and 2008 contain the following number of weeks:
Fiscal Period
|
Number of Weeks | Fiscal Period End Date | ||
|---|---|---|---|---|
| Year ending March 31, 2011 ("fiscal 2011") | 52 weeks | April 2, 2011 | ||
| Year ended March 31, 2010 ("fiscal 2010") | 53 weeks | April 3, 2010 | ||
| Year ended March 31, 2009 ("fiscal 2009") | 52 weeks | March 28, 2009 | ||
| Year ended March 31, 2008 ("fiscal 2008") | 52 weeks | March 29, 2008 |
Changes to our Operating Structure and Strategy in Fiscal 2010
During the last two fiscal years, we have restructured our organization in order to support our more focused product strategy. This strategy consists of the following operating goals:
- 1.
- develop
a select number of high quality owned intellectual properties targeted at the core gamer each year;
- 2.
- extend
our leadership in fighting games;
- 3.
- reinvigorate
our kids portfolio and improve profitability in our kids business;
- 4.
- build
our portfolio of casual games that appeal to a broad gamer demographic; and
- 5.
- embrace digital integration and extend our brands to online gaming markets.
During fiscal 2010, we restructured our organization into three business units—Core Games; Kids, Family and Casual Games; and Online Games. Each business unit operates globally with dedicated game development and marketing teams. We also created our Global Publishing unit, which operates in three
2
regions—North America, Europe and Asia Pacific—and is responsible for global distribution and sales of our products.
Core Games
Our Core Games group oversees the production and marketing of action, fighting, racing, shooter and strategy games primarily targeted to avid or "core" gamers. The THQ Core Games franchise portfolio includes games based on popular fighting brands such as UFC and WWE; racing games based on our MX vs. ATV brand; and action, shooter and strategy games based on our established franchises such as Darksiders, Red Faction, Saints Row and Warhammer 40,000. THQ's Core Games are developed primarily at the following THQ studios: Kaos Studios, Relic Entertainment, THQ Digital Studio Phoenix, THQ Digital Studio UK, THQ San Diego, Vigil Games and Volition, Inc. THQ Core Games may also be developed externally. For example, our UFC Undisputed and WWE SmackDown vs. Raw fighting games are currently being developed by external studio Yuke's Co. Ltd., of which we own approximately 15%.
Kids, Family and Casual Games
Our Kids, Family and Casual Games group oversees production and marketing of games targeted to the mass market and families. Our Kids, Family and Casual Games portfolio includes original games such as de Blob, Drawn to Life: The Next Chapter and World of Zoo, and games based on leading entertainment brands such as DreamWorks Animation's MegaMind, Marvel Super Hero Squad, Disney•Pixar's Up, NBC's The Biggest Loser, and Sony Pictures Consumer Products' popular game shows JEOPARDY! and Wheel of Fortune. THQ's Kids, Family and Casual Games are developed at THQ's Blue Tongue studio and Studio Australia, as well as by external game developers.
Online Games
THQ's Online Games group oversees production and marketing of dedicated online games. Our online strategy is to leverage our established brands such as Company of Heroes, Warhammer 40,000 and WWE into the dedicated online space. We are currently partnering with companies in China and Korea to deliver Company of Heroes and WWE online in those markets. We also plan to launch Company of Heroes Online in North America. In addition, we are internally developing a Massively Multiplayer Online ("MMO") game based on the Warhammer 40,000 universe.
Our Industry
The interactive entertainment software industry includes the economic sector involved with the development, marketing and sale of video, PC and online games. It encompasses dozens of job disciplines and employs thousands of people worldwide. Video games have increasingly become a mainstream entertainment choice for both children and adults. According to the Entertainment Software Association, more than two-thirds of American households play games, and the average gamer is aged 35 and has been playing for 12 years. In addition, 40% of all players are women.
According to the International Development Group, Inc. ("IDG"), an independent consulting and advisory services company that analyzes the consumer electronics and interactive entertainment industries, sales of console, handheld and PC games (excluding wireless and online) surpassed $21.0 billion in North America and Europe combined in calendar 2009.
The first modern video game platform was introduced by Nintendo in 1985. Since then, advances in technology have resulted in continuous increases in the processing power of the chips that power both the consoles and PC. Today's video game consoles—the PS3, Xbox 360 and Wii—are not simply gaming platforms, but also function as multimedia hubs that can deliver high-quality digital movies and television programs. Video games are also played on PCs that contain powerful graphics cards, and on advanced
3
handheld devices such as the PSP and DS. Additionally, both online gaming and wireless gaming have become popular platforms for video game players over the last several years.
Our Products
We develop, market and sell video games and other interactive software and content for play on console platforms, handheld platforms, mobile devices, PCs and online. The following games generated 10% or more of our net sales during the respective fiscal years:
- •
- in fiscal 2010, UFC 2009 Undisputed and WWE
SmackDown vs. Raw 2010;
- •
- in fiscal 2009, WWE SmackDown vs. Raw 2009, Saints
Row 2, and Wall-E; and
- •
- in fiscal 2008, WWE SmackDown vs. Raw 2008 and Ratatouille.
Our games are based on intellectual property that is either wholly-owned by us or licensed from third parties. We develop our games using both internal development resources and external development resources working for us pursuant to contractual agreements. Whether a game is developed internally or externally, upon completion of development we extensively play-test each game, and if required, send the game to the platform manufacturer (Microsoft, Nintendo or Sony) for its review and approval. Other than games we release for PCs, for online play or for wireless devices, the platform manufacturers or their authorized vendors manufacture our products for us. We then market and distribute our games for sale throughout the world.
Creating and Acquiring Our Intellectual Property
Our business process begins with an idea. Inspiration for our interactive entertainment software comes from many sources—from our internal studios, from our external studio partners, and from existing intellectual properties that we either license or acquire. Historically, most of our titles have been based upon licensed properties that have attained a high level of consumer recognition or acceptance. We have relationships with many well-known licensors and create games based on certain properties they own or control. Licensors generally do not grant exclusive output agreements for all of their properties with any one publisher and thus our licenses are limited to certain of a licensor's properties. Our current key licenses allow us to publish games based on the following properties:
Licensor
|
Properties | |
|---|---|---|
| Disney•Pixar | "Ratatouille," "WALL•E," "Up," and a future, yet to be announced title | |
DreamWorks Animation |
"MegaMind," "Kung Fu Panda: The Kaboom of Doom," "Puss In Boots," and "The Penguins of Madagascar" |
|
Games Workshop |
Warhammer 40,000 universe |
|
Marvel Entertainment |
"Super Hero Squad" |
|
NBC |
"The Biggest Loser" |
|
Nickelodeon |
Kids 6-14 animated properties and related live action movies, including "SpongeBob SquarePants" and "The Last Airbender" |
|
Sony Pictures Consumer Products |
"JEOPARDY!" and "Wheel of Fortune" |
|
World Wrestling Entertainment |
World Wrestling Entertainment content |
|
Zuffa, LLC |
Ultimate Fighting Championship content |
4
These intellectual property licenses generally grant us the exclusive use of the property for specified titles, on specified platforms and for a specified license term. The licenses are of varying duration, and we pay royalties to our property licensors generally based on our net sales of the title that includes the licensor's intellectual property. We typically advance payments against minimum guaranteed royalties over the license term. Royalty rates are generally higher for properties with proven popularity and less perceived risk of commercial failure.
In addition to licensed properties, we continue to create or acquire new intellectual properties that we own. We refer to these properties as our "owned intellectual property[ies]". Our owned intellectual property is generally created by one of our development studios or by a third-party developer with whom we contract. We have also acquired intellectual properties from other publishers or developers. The titles we create based on our owned intellectual properties may contain certain licensed content, such as music or rights to use of a name or object (such as a brand-name vehicle). In this case, we enter into a license agreement with the content owner and pay either a fixed fee or royalty for the use of such content.
Developing Our Products
We develop our products using both internal and external development resources. The internal resources consist of producers, game designers, software engineers, artists, animators and game testers located within our internal studios located throughout North America, in the United Kingdom and in Australia, and in our corporate headquarters. The external development resources consist of third-party software developers and other independent resources such as artists, voice-over actors and composers. We refer to this collective group of development resources as our Studio System.
We make the decision as to which development resources to use based upon the creative and technical challenges of the product, including whether the intellectual property being developed into a game is licensed, an original concept that we created, or an original concept created by a third-party developer. Once we determine where a product will be developed, our product development team oversees the internal or external resources in its design, technical assessment and construction of each game.
The development cycle for a new game depends on the platform and the complexity and scope of the game. Additionally, when developing an intellectual property into a game that is simultaneously being made into a motion picture, our development schedule is designed to ensure that our games are commercially available by the motion picture's theatrical release. Our development cycles generally range as follows:
- •
- 18-36 months for our console and PC games;
- •
- 9-18 months for our handheld games;
- •
- 6-18 months for our casual/social online games; and
- •
- 1-5 years for our Core Online Games (with the longer end of that range for our large scale MMO games).
These development cycles require that we assess whether there will be adequate retailer and consumer demand for a game and its platform well in advance of its release.
The investments in our product development, prior to when a game reaches technological feasibility, and other non-capitalizable costs, are recorded as product development expenses in our consolidated statement of operations. In fiscal 2010, 2009, and 2008, we had product development expenses of $87.2 million, $109.2 million, and $128.9 million, respectively.
Upon completion of development, each game is extensively play-tested by us to ensure compatibility with the appropriate hardware systems and configurations, and to minimize the number of bugs and other defects found in the products. If required, we also send the game to the manufacturer for its review and
5
approval. To support our products after release, we provide online access to our customers on a 24 hour basis as well as operator help lines during regular business hours. The customer support group tracks customer inquiries, and we use this data to help improve the development and production processes.
Manufacturing Our Products
Other than games we release for sale on PCs, digital download, or wireless devices, our video games are manufactured for us by the platform manufacturers or their authorized vendors. We contract with various DVD replicators for the manufacturing of our PC products.
The platform game manufacturing process begins with our placing a purchase order with a manufacturer. We then send the approved software code to the manufacturer (together with related artwork, user instructions, warranty information, brochures and packaging designs) for manufacturing. We order a sufficient amount of product units to meet the requirements of our customers, based upon our sales forecasts for a game. Because we do not manufacture our products ourselves, we do not carry significant amounts of inventory to meet rapid delivery requirements of customers or to assure ourselves of a continuous allotment of goods from manufacturers. At the time our product unit orders are filled by the manufacturer, we become responsible for the costs of manufacturing and the applicable per unit royalty on such units, even if the units do not ultimately sell.
We are required by our platform licenses to provide a standard defective product warranty on all of the products sold. Generally, we are responsible for resolving, at our own expense, any warranty or repair claims. We have not experienced any material warranty claims, but there is no guarantee that we will not experience such claims in the future.
Marketing Our Products
The manner in which we drive consumer demand for our brands across the globe has evolved significantly in recent years as we have expanded our franchise portfolio. At the global brand management level, we take a disciplined approach to defining and refining positioning for our key game releases. We implement extensive consumer research including concept and play testing that is conducted in conjunction with our development studios and third party developers. This research, conducted prior to the commencement of a product and continued through a project's development, allows us to create game experiences that are optimally targeted to the appropriate demographic via content and play patterns that provide maximum marketability to consumers.
Our marketing plans vary by target demographic but generally consist of a three-pronged media plan encompassing TV, print and online advertising. Certain of our campaigns also include billboard advertising, event sponsorship, in-theater advertising and radio placements. We also perform extensive consumer testing of game packaging and TV creative prior to launch in order to determine the efficacy of the creative in communicating the game's positioning, tone, and attributes as well as measuring to what extent the creative drives purchase interest. Retail or Channel Marketing efforts for our games include pre-sell give-aways, displays and/or demonstrations at retailer-specific trade shows, and cooperative retail advertising campaigns.
We are taking a more aggressive approach in what we term the "connected marketing" space. This includes how we build our brand in the online space via editorial opportunities; screen shot, trailer and other game content releases online; advertising; official game websites; and community outreach and management. Social media sites have grown in both their popularity and influence within our diverse target demographic. This new consumer immersion in social media has allowed us to create new ways to drive brand awareness and purchase intent via a medium that is both relevant and authentic to our target demographics' acquisition of information. Game trial has been a key driver of consumer demand for several of our Core Games, through consumer demos released at retail or online, or game demos available at kiosks stationed at sports or other entertainment events.
6
Publicity is another key driver of awareness for our game portfolio, as well as for THQ, as a publicly-held company. We maintain strong relationships with a broad group of business, consumer, entertainment and games enthusiast reporters across the globe, working closely to secure positive editorial coverage across broadcast, print and online editorial outlets.
Distributing and Selling Our Products
In North America, our products are primarily sold directly to mass merchandisers, consumer electronics stores, discount warehouses and national retail chain stores. Our products are also sold to smaller, regional retailers, as well as distributors who, in turn, sell our products to retailers that we do not service directly, such as grocery and drug stores. Our North American sales activities are conducted by THQ sales representatives throughout the United States, as well as by our representatives in Canada and Mexico.
Our international publishing activities are conducted via our offices throughout Europe and Asia Pacific. The international offices market and distribute to direct-to-retail customers and through distributors in both their home territories and, collectively, to approximately 60 additional territories.
We utilize electronic data interchange with most of our major customers in order to (i) efficiently receive, process, and ship customer product orders, and (ii) accurately track and forecast sell-through of products to consumers in order to determine whether to order additional products from the manufacturers. We believe that the direct relationship model we use allows us to better manage inventory, merchandise and communications. We ship all of our products to our North American customers from warehouses located in Michigan and Minnesota, and we ship most of our products to our international customers from warehouses located throughout Europe and Asia Pacific.
As discussed in Part II—Item 7, "Management's Discussion and Analysis of Financial Condition and Results of Operations," we typically only allow returns for our PC products; however, we may decide to provide price protection or allow returns for our video games after we analyze: (i) inventory remaining in the retail channel, (ii) the rate of inventory sell-through in the retail channel, and (iii) our remaining inventory on hand. We maintain a policy of giving credits for price protection and returns, but we do not give cash refunds.
We also globally market and distribute games and content digitally via the Internet and through high-end wireless devices, such as the iPhone, iTouch, and iPad. The industry is delivering a growing amount of games, downloadable content and product add-ons by direct digital download through the Internet and gaming consoles. We believe that much of the growth in the industry will come via online distribution such as massively multi-player games (both subscription and free-to-play), casual micro-transaction based games, paid downloadable content and digital downloads of games. Accordingly, we plan to continue integrating a digital strategy into all of our key franchises.
Platform License Agreements
Before we can develop, market, or sell video games on a console or handheld platform, we must enter into a license agreement with the manufacturer of such platform. The current "platform manufacturers" are Microsoft, Nintendo and Sony. Each of these platform license agreements allows us a non-exclusive right to use, for a fixed term and in a designated territory, technology that is owned by the platform manufacturer in order to publish our games on such platform. We are currently licensed to publish, in most countries throughout the world, titles on Xbox 360; PS3, PS2, and PSP; and the Wii and DS. Additionally, we are authorized to develop and publish online content compatible with each console that utilizes online content. As each platform license expires, if we intend to continue publishing games on such platform, we must enter into a new agreement or an amendment with the platform manufacturer to extend the term of the agreement. Certain agreements, such as the licenses with Sony for the PS3 and PS2 and with Microsoft for the Xbox 360, automatically renew each year unless either party gives notice by the applicable date that it intends to terminate the agreement.
7
Our platform licenses require that each title be approved by the applicable platform manufacturer. The platform manufacturers have the right to review, evaluate and approve a prototype of each title and the title's packaging and marketing materials. Once a title is developed and has been approved by the platform manufacturer, except for online content, the title is manufactured solely by such platform manufacturer or its designated vendor. The licenses establish the payment terms for the manufacture of each cartridge or disc made, which generally provide for a charge for every cartridge or disc manufactured, and also establish a royalty rate for delivery of online content compatible with such manufacturer's platform. The amounts charged by the platform manufacturers for both console discs and handheld cartridges include a manufacturing, printing and packaging fee as well as a royalty for the use of the platform manufacturer's name, proprietary information and technology, and are subject to adjustment by the platform manufacturers at their discretion.
The platform license agreements also require us to indemnify the platform manufacturers with respect to all loss, liability and expense resulting from any claim against the platform manufacturer involving the development, marketing, sale, or use of our games, including any claims for copyright or trademark infringement brought against the platform manufacturer. Each platform license may be terminated by the platform manufacturer if a breach or default by us is not cured after we receive written notice from the platform manufacturer, or if we become insolvent. Upon termination of a platform license for any reason other than our breach or default, we have a limited period of time to sell any existing product inventory remaining as of the date of termination. The length of this sell-off period varies between 90 and 180 days, depending upon the platform agreement. We must destroy any such inventory remaining after the end of the sell-off period. Upon termination as a result of our breach or default, we must destroy any remaining inventory within a minimum number of days as specified by the platform manufacturer.
Seasonality and Deferral of Revenue
The interactive entertainment software industry is highly seasonal, with sales typically significantly higher during the third quarter of our fiscal year, due primarily to the increased demand for interactive games during the year-end holiday buying season.
Net sales are impacted by the deferral and/or recognition of revenue from the sale of titles for which the online service is more-than-inconsequential to the overall functionality of the game and as such represents a deliverable. Such deferrals are recognized ratably over the estimated service period of six months beginning the month after initial sale.
Major Customers
Our largest customers worldwide include Best Buy, GameStop, Target and Wal-Mart. We also sell our products to other national and regional retailers, discount store chains, specialty retailers and distributors. GameStop and Wal-Mart each accounted for more than 10% of our gross sales in fiscal 2010. We have two "Vendor" agreements with Wal-Mart (one for our console products and one for our PC products) that we entered into in 2001 and 2002, respectively, that address certain standard terms and conditions, such as payment terms, between us and Wal-Mart; however, the agreements do not contain any commitment for Wal-Mart to purchase, or for us to sell, any minimum level of products. We do not have any agreements with GameStop. With respect to both Wal-Mart and GameStop, as well as our other customers, the customer submits a purchase order for each purchase request, and that purchase order contains basic pricing and delivery terms for such purchase. None of the purchase orders individually, with any customer, accounted for more than 10% of the Company's consolidated net sales for fiscal 2010. A substantial reduction in purchases, termination of purchases, or business failure by any of our largest customers could have a material adverse effect on us.
8
Competition
As a publisher of interactive entertainment software, we consider ourselves to be part of the entertainment industry. At the most fundamental level, our products compete with other forms of entertainment, such as motion pictures, television, music, Internet and online services for the leisure time and discretionary spending of consumers. Our primary competition for sales of video games comes from Microsoft, Nintendo and Sony, each of which is a large developer and publisher of software for its own platforms, as well as other publishers and developers of interactive entertainment software, such as Activision/Blizzard, Atari, Electronic Arts, LucasArts, Namco, Sega, Take-Two Interactive Software, and Ubisoft. Additionally, certain large intellectual property owners, such as Disney, Viacom, and Warner Bros. have established video game units to develop and publish games based upon certain of the properties they own. In recent years, our competition has expanded to include online publishers of interactive entertainment, such as Zynga and Shanda Interactive Entertainment.
In addition to competing for video game sales, we compete with our competitors over licenses and brand-name recognition, access to distribution channels, and effectiveness of marketing and price. We also face intense competition from our competitors for the services of talented video game producers, artists, engineers and other employees.
Employees
As of March 31, 2010, we employed approximately 1,680 people, of whom over 640 were outside the United States. We believe that our ability to attract and retain qualified employees is a critical factor in the successful development and exploitation of our products and that our future success will depend, in large measure, on our ability to continue to attract and retain qualified employees. None of our employees are represented by a labor union or covered by a collective bargaining agreement and we consider our relations with employees to be favorable.
Financial Information About Geographic Areas
See Part II—Item 7, "Management Discussion and Analysis of Financial Condition and Results of Operations" and "Note 22—Segment and Geographic Information" in the notes to the consolidated financial statements included in Part II—Item 8.
Available Information
We file annual, quarterly and current reports, proxy statements and other information with the Securities and Exchange Commission ("SEC"). Our SEC filings, including our annual report on Form 10-K, quarterly reports on Form 10-Q, current reports on Form 8-K, and any amendments to those reports filed or furnished pursuant to Section 13(a) of the Exchange Act are available to the public free of charge over the Internet at our website at http://www.thq.com or at the SEC's web site at http://www.sec.gov. Our SEC filings will be available on our website as soon as reasonably practicable after we have electronically filed or furnished them to the SEC. Information contained on our website is not incorporated by reference into this annual report on Form 10-K. You may also read and copy any materials we file with the SEC at the SEC's Public Reference Room at 100 F Street, NE, Washington D.C. 20549. You may obtain information on the operation of the Public Reference Room by calling the SEC at 1-800-SEC-0330. You can view our Code of Business Conduct and Ethics, our Code of Ethics for Executive Officers and Other Senior Financial Officers and the charters for each of our committees of the Board of Directors free of charge on the corporate governance section of our website.
9
Our business is subject to many risks and uncertainties that may impact our future financial performance. Some of those important risks and uncertainties that may cause our operating results to vary or may materially and adversely impact our operating results are as follows:
We must continue to develop and sell new titles in order to generate net sales and remain profitable.
We derive almost all of our net sales from sales of interactive software games. Even the most successful video games remain popular for only limited periods of time, often less than six months, and thus the success of our business is dependent upon our ability to continually develop and sell successful new games. Because net sales associated with an initial product launch generally constitutes a high percentage of the total net sales associated with the life of a product, the inability of our products to achieve significant market acceptance, delays in product releases or disruptions following the commercial release of our products may have a material adverse impact our net sales and profitability.
Our business is "hit" driven. If we do not deliver "hit" games, our net sales and profitability can suffer.
While many new products are regularly introduced, only a relatively small number of "hit" titles account for a significant portion of video game sales. If we fail to develop "hit" titles, or if "hit" products published by our competitors take a larger share of consumer spending than we anticipate, our product sales could fall below our expectations, which could negatively impact both our net sales and profitability.
Ongoing uncertainty regarding the duration and extent of the recent economic downturn could result in a reduction in discretionary spending by consumers that could reduce demand for our products.
Our products involve discretionary spending on the part of consumers. Consumers are generally more willing to make discretionary purchases, including purchases of products like ours, during periods in which favorable economic conditions prevail. As a result, our products may be sensitive to general economic conditions and economic cycles. A continuation or worsening of current, adverse worldwide economic conditions, including declining consumer confidence, inflation, recession and rising unemployment may lead consumers to delay or reduce purchases of our products. Reduced consumer spending may also require us to incur increased selling and promotional expenses. A reduction or shift in domestic or international consumer spending could negatively impact our business, results of operations and financial condition.
We may not be able to adequately adjust our cost structure in a timely fashion in response to a sudden decrease in demand.
A significant portion of our selling and marketing and our general and administrative expense is attributable to expenses for personnel and facilities. In the event of a significant decline in net sales, we may not be able to dispose of facilities, reduce personnel or make other changes to our cost structure without disruption to our operations or without significant termination and exit costs. Management may not be able to implement such actions in a timely manner, if at all, to offset an immediate shortfall in net sales and profit. Moreover, reducing costs may impair our ability to produce and develop software titles at sufficient levels in the future.
We have significant net operating loss and tax credit carryforwards ("NOLs"). If we are unable to use our NOLs, our future profitability may be significantly impacted.
As of March 31, 2010, we had federal net operating loss carryforwards of $353.8 million and federal R&D tax credit carryforwards of $24.5 million. Under applicable tax rules, we may "carry forward" these NOLs in certain circumstances to offset any current and future taxable income and thus reduce our income tax liability, subject to certain requirements and restrictions. Therefore, we believe that these NOLs could be a
10
substantial asset. However, if we experience an "ownership change," as defined in Section 382 of the Internal Revenue Code, our ability to use the NOLs could be substantially limited, which could significantly increase our future income tax liability. An "ownership change" generally is deemed to occur if our "5-percent shareholders" increase their aggregate percentage ownership of our stock by more than 50 percentage points over the lowest percentage of our stock owned by these 5-percent shareholders at any time during the three-year period prior to any such increase in ownership. While the rules for identifying 5-percent shareholders and their ownership are quite complex, 5-percent shareholders generally include persons that own, at any time during the three-year testing period, 5% or more of our stock directly, as well as by attribution from other persons, and certain groups of stockholders, each of whom owns less than 5% of our stock. On May 12, 2010, we entered into a Section 382 Rights Agreement with Computershare Trust Company, N.A., as rights agent, in an effort to prevent an "ownership change" from occurring and thereby protect the value of the NOLs. There can be no assurance, however, that the Section 382 Rights Plan will prevent an ownership change from occurring, or that entering into the Section 382 Rights Plan will, in fact, protect the value of the NOLs.
We believe our financial condition is sufficient to meet our operating requirements for at least the next twelve months. However, in the event our net sales differ significantly from our expectations, we may need to defer and/or curtail currently-planned expenditures, and/or pursue additional funding to meet our cash needs.
In fiscal 2010, we generated positive operating cash flow and raised $100.0 million through the issuance of convertible senior notes, bringing our cash, cash equivalents and short-term investments to $271.3 million as of March 31, 2010, from $140.7 million as of March 31, 2009. However, we operate in a capital intensive business and intend to invest in product development and licenses in fiscal 2011 and thus do not expect to generate positive cash flow from operations in fiscal 2011. Although we believe that our financial condition is sufficient to meet our operating requirements for at least the next twelve months, in the event our net sales and/or required expenditures differ significantly from our expectations, we may need to defer and/or curtail currently-planned expenditures, and/or pursue additional funding to meet our cash needs.
Since a significant portion of our net sales are based upon licensed properties, failure to renew such licenses, or renewals of such licenses on less advantageous terms, could cause our net sales and/or our profitability to decline.
Games we develop based upon licensed brands make up a substantial portion of our sales each year. Sales of our games based upon our two top-selling licensed brands, UFC and WWE, comprised approximately 35% of our net sales in fiscal 2010. In fiscal 2009, sales of our games based upon our three top-selling licensed brands, Disney•Pixar, Nickelodeon, and WWE, comprised 47% of our net sales. A limited number of licensed brands may continue to produce a disproportionately large amount of our sales. Due to the importance to us of a limited number of brands and the intense competition from other video game publishers to publish games based upon these licensed brands, we may not be able to renew our current licenses or may have to renew a brand license on less advantageous terms, which could significantly lower our net sales and/or our profitability. On January 1, 2010, we entered into an eight year license with WWE. Our license with UFC expires on December 31, 2011; however, we have the right to extend the term of the license to December 31, 2015 if we pay a certain amount of royalties to the licensor based upon units sold, which we believe will be achieved in fiscal 2011. There can be no assurance that we will be able to extend such licenses and if we are not able to extend them, our net sales may decline significantly.
A decrease in the popularity of our licensed brands could materially impact our net sales and financial position.
As previously mentioned, a significant portion of our net sales are derived from products based on popular licensed properties. A decrease in the popularity of the underlying property of our licenses could negatively impact our ability to sell games based on such licenses and could lead to lower net sales, profitability, and/or an impairment of our licenses.
11
Our inability to acquire or create new intellectual property that has a high level of consumer recognition or acceptance could negatively impact our net sales and profitability.
We generate a portion of our net sales from wholly-owned intellectual property. The success of our internal brands depends upon our ability to create original ideas that appeal to the core gamer. Titles based on wholly-owned intellectual property can be expensive to develop and market since they do not have a built-in consumer base or licensor support. Our inability to create new products that find consumer acceptance could negatively impact our net sales and profitability.
Increasing development costs for games which may not perform as anticipated and failure of platforms to achieve significant market penetration could decrease our profitability and result in potential impairments of capitalized software development costs.
Over the last few years, video games have become increasingly expensive to develop. Because the current generation console platforms and PCs have greater complexity and capabilities than the earlier platforms and PCs, costs to develop games for the current generation platforms and PCs are higher. In the last two fiscal years, these greater costs have led to lower operating margins, negatively impacting our profitability. If these increased costs are not offset by higher net sales and other cost efficiencies in the future, our margins and profitability will continue to be impacted, and could result in impairment of capitalized software development costs. If these platforms, or games we develop for these platforms, do not achieve significant market penetration, we may not be able to recover our development costs, which could result in the impairment of capitalized software costs, which would negatively impact our profitability.
We rely on a small number of customers that account for a significant amount of our sales. If these customers reduce their purchases of our products or become unable to pay for them, our business could be harmed.
Our largest customers, Best Buy, GameStop, Target and Wal-Mart, accounted for approximately 43% of our gross sales in fiscal 2010. A substantial reduction, termination of purchases, or business failure by any of our largest customers could have a material adverse impact on us.
A significant portion of our net sales are derived from our international operations, which may subject us to economic, currency, political, regulatory and other risks.
In fiscal 2010, we derived 38% of our net sales from outside of North America. Our international operations subject us to many risks, including: different consumer preferences; challenges in doing business with foreign entities caused by distance, language and cultural differences; unexpected changes in regulatory requirements, tariffs and other barriers; difficulties in staffing and managing foreign operations; and possible difficulties collecting foreign accounts receivable. These factors or others could have an adverse impact on our future foreign sales or the profits generated from those sales.
There are additional risks inherent in doing business in certain international markets, such as China. For example, foreign exchange controls may prevent us from expatriating cash earned in China, and standard business practices in China may increase our risk of violating U.S. laws such as the Foreign Corrupt Practices Act.
Additionally, sales generated by our international offices will generally be denominated in the currency of the country in which the sales are made, and may not correlate to the currency in which inventory is purchased, or software is developed. To the extent our foreign sales are not denominated in U.S. dollars, our sales and profits could be materially and adversely impacted by foreign currency fluctuations. Year-over-year changes in foreign currency translation rates had the mathematical effect of increasing our reported net loss by approximately $0.2 million in fiscal 2010.
12
Fluctuations in our quarterly operating results due to seasonality in the interactive entertainment software industry and other factors related to our business operations could result in substantial losses to investors.
We have experienced, and may continue to experience, significant quarterly fluctuations in sales and operating results. The interactive entertainment software industry is highly seasonal, with sales typically significantly higher during the year-end holiday buying season. Other factors that cause fluctuations in our sales and operating results include:
- •
- the timing of our release of new titles as well as the release of our competitors' products;
- •
- the popularity of both new titles and titles released in prior periods;
- •
- the profit margins for titles we sell;
- •
- the competition in the industry for retail shelf space;
- •
- fluctuations in the size and rate of growth of consumer demand for titles for different platforms;
- •
- the timing of the introduction of new platforms and the accuracy of retailers' forecasts of consumer demand; and
- •
- the deferral or subsequent recognition of net sales and costs related to certain of our products which contain online functionality.
We believe that quarter-to-quarter comparisons of our operating results are not a good indication of our future performance. We may not be able to maintain consistent profitability on a quarterly or annual basis. It is likely that in some future quarter, our operating results may be below the expectations of public market analysts and investors as a result of the factors described above and others described throughout this "Risk Factors" section, which may in turn cause the price of our common stock to fall or significantly fluctuate.
Our stock price has been volatile and may continue to fluctuate significantly.
The market price of our common stock historically has been, and we expect will continue to be, subject to significant fluctuations. These fluctuations may be due to factors specific to us (including those discussed in this "Risk Factors" section, as well as others not currently known to us or that we currently do not believe are material), to changes in securities analysts' earnings estimates or ratings, to our results or future financial guidance falling below our expectations and analysts' and investors' expectations, to factors impacting the entertainment, computer, software, Internet, media or electronics industries, to our ability to successfully integrate any acquisitions we may make, or to national or international economic conditions. In particular, economic downturns may contribute to the public stock markets' experiencing extreme price and trading volume volatility. These broad market fluctuations have and could continue to adversely impact the market price of our common stock.
Video game product development schedules are difficult to predict and can be subject to delays. Postponements in shipments can substantially impact our sales and profitability in any given quarter.
Our ability to meet product development schedules is impacted by a number of factors, including the creative processes involved, the coordination of large and sometimes geographically-dispersed development teams required by the complexity of our products, the need to localize certain products for distribution outside of the U.S., the need to refine our products prior to their release, and the time required to manufacture a game once it is submitted to the platform manufacturer. In the past, we have experienced development and manufacturing delays for several of our products. Failure to meet anticipated production schedules may cause a shortfall in our expected sales and profitability and cause our operating results in any given quarter to be materially different from expectations. Delays that prevent
13
release of our products during peak selling seasons or in conjunction with specific events, such as the release of a related movie, could significantly impact the sales of such products and thus our profitability.
Our business is dependent upon the success and availability of the video game platforms on which consumers play our games.
We derive most of our net sales from the sale of products for play on video game platforms manufactured by third parties, such as PS3 and PSP, Xbox 360, and the Wii and DS. The following factors related to such platforms can adversely impact sales of our video games and our profitability:
Popularity of platforms. In the previous console platform cycle, the PS2 was the best-selling platform and games for that platform dominated software sales. In the current platform cycle, the Wii is the best-selling console platform to date, and in calendar 2009, the Wii surpassed the Xbox 360 as the most popular console in terms of software game sales, according to IDG. However, recent trends indicate that the PS3 and Xbox 360 may be gaining popularity over the twelve months ended March 31, 2011. Since the typical development cycle for a console, handheld, or PC game is from 9 to 36 months, we must make decisions about which games to develop on which platforms based on current expectations of what the consumer preference for the platforms will be when the game is finished. Launching a game on a platform that has declined in popularity, or failure to launch a game on a platform that has grown in popularity, could negatively impact our net sales and profitability.
Platform pricing. Prices for the current generation of console platforms are higher than for their respective predecessor platforms. The Xbox 360 can cost as much as $299.99, the Wii is priced at $199.99 and the PS3 costs $299.99. The cost of the hardware could adversely impact the sales of these platforms, which could in turn negatively impact sales of our products for these platforms since consumers need a platform in order to play our games.
Platform shortages. In the past few years, many of the platforms on which our games are played have experienced shortages. Platform shortages generally negatively impact the sales of video games since consumers do not have consoles on which to play the games.
Our inability to enter into agreements with the manufacturers to develop, publish and distribute titles on their platforms could seriously impact our operations.
We are dependent on the platform manufacturers (Microsoft, Nintendo and Sony) and our non-exclusive licenses with them, both for the right to publish titles for their platforms and for the manufacture of our products for their platforms. Our existing platform licenses require that we obtain approval for the publication of new games on a title-by-title basis. As a result, the number of titles we are able to publish for these platforms, and our sales from titles for these platforms, may be limited. Should any manufacturer choose not to renew or extend our license agreement at the end of its current term, or if any license were terminated, we would be unable to publish additional titles for that manufacturer's platform, which could negatively impact our operating results.
Additionally, since each of the manufacturers publishes games for its own platform, and also manufactures products for all of its other licensees, a manufacturer may give priority to its own products or those of other publishers in the event of insufficient manufacturing capacity. Unanticipated delays in the delivery of products due to delayed manufacturing could also negatively impact our operating results.
14
Software pricing and sales allowances may impact our net sales and profitability.
Software prices for games sold for play on the PS3 and Xbox 360 are generally higher than prices for games for the Wii, handheld platforms or PC games. Our product mix in any given fiscal quarter or fiscal year may cause our net sales to significantly fluctuate depending on which platforms we release games on in that quarter or year. Additionally, reductions in software pricing on any platform may result in lower net sales, which could materially impact our profitability.
In addition, we establish sales allowances based on estimates of future price protection and returns with respect to current period product net sales. While we believe that we can reliably estimate future returns and price protection, if product sell-through does not perform in line with our current expectations, return rates and price protection could exceed our reserves, and our net sales could be negatively impacted in future periods.
Increased sales of used video game products could reduce demand for new copies of our games.
Large retailers, including one of our largest customers, GameStop, have increased their focus on selling used video games, which provides higher margins for the retailers than sales of new games. This focus reduces demand for new copies of our games. We believe customer retention through compelling online play and downloadable content offers may reduce consumers' propensity to trade in games; however, continued sales of used games, rather than new games, may negatively impact our ability to sell new games and thus lower our net sales in any given quarter.
We may face difficulty obtaining access to retail shelf space necessary to market and sell our products effectively.
Retailers typically have a limited amount of shelf space and promotional resources, and there is intense competition among consumer interactive entertainment software products for high quality retail shelf space and promotional support from retailers. To the extent that the number of products and platforms increases, competition for shelf space may intensify and may require us to increase our marketing expenditures. Retailers with limited shelf space typically devote the most and highest quality shelf space to those products expected to be best sellers. We cannot be certain that our new products will consistently achieve such "best seller" status. Due to increased competition for limited shelf space, retailers and distributors are in an increasingly better position to negotiate favorable terms of sale, including price discounts, price protection, marketing and display fees, and product return policies. Our products constitute a relatively small percentage of most retailers' sales volume. We cannot be certain that retailers will continue to purchase our products or to provide those products with adequate levels of shelf space and promotional support on acceptable terms. A prolonged failure in this regard may significantly harm our business and financial results.
Competitive launches may negatively impact the sales of our games.
We compete for consumer dollars with several other video game publishers, and consumers must make choices among available games. If we make our games available for sale at the same time as our competitors' games become available, consumers may choose to spend their money on products published by our competitors rather than our products and retailers may choose to give more shelf space to our competitors' products, leaving less space to sell our products. Since the life cycle of a game is short, strong sales of our competitors' games could negatively impact the sales of our games.
Failure to appropriately adapt to rapid technological changes or emerging distribution channels may negatively impact our market share and our operating results.
Rapid technology changes in our industry require us to anticipate, sometimes years in advance, which technologies we must implement and take advantage of in order to make our products and services competitive. Currently, our industry is experiencing an increasing shift to online content and digital
15
downloads. We believe that much of the growth in the industry will come via online markets or digital distribution such as massively multi-player games (both subscription and free-to-play), casual micro-transaction based games, paid downloadable content and digital downloads of games. Accordingly, we plan to continue integrating a digital strategy into all of our key franchises. However, if we fail to anticipate and adapt to these and other technological changes, our market share and our operating results may suffer. Our future success in providing online games, wireless games and other content will depend upon our ability to adapt to rapidly-changing technologies, develop applications to accommodate evolving industry standards, and improve the performance and reliability of our applications.
Our platform licensors control the fee structures for online distribution of our games on their platforms.
Certain platform licensors have retained the right to change the fee structures for online distribution of both paid content and free content (including patches and corrections) on their platforms. Each licensor's ability to set royalty rates makes it difficult for us to forecast our costs. Increased costs could negatively impact our operating margins. We may be unable to distribute our content in a cost-effective or profitable manner through this distribution channel, which could adversely impact our results of operations.
Development of software by platform manufacturers may lead to reduced sales of our products.
The platform manufacturers, Microsoft, Nintendo and Sony, each develop software for their own hardware platforms. As a result of their commanding positions in the industry, the platform manufacturers may have better bargaining positions with respect to retail pricing, shelf space and retailer accommodations than do any of their licensees, including us. Additionally, the platform manufacturers can bundle their software with their hardware, creating less demand for individual sales of our products. In the twelve month period ended March 31, 2010, Nintendo's market share across North America and top European territories was nearly 49% on its Wii platform and more than 37% on its DS platforms. Continued or increased dominance of software sales by the platform manufacturers may lead to reduced sales of our products and thus lower net sales.
Increased development of software and online games by intellectual property owners may lead to reduced net sales.
As discussed above, a significant portion of our net sales are due to sales of games based upon licensed properties. In recent years, some of our key licensors, including Disney and Viacom (Nickelodeon), have increased their development of video games, which could lead to such licensors not renewing our licenses to publish games based upon their properties that we currently publish, or not granting future licenses to us to develop games based on their other properties. For example, in fiscal 2009, Disney decided to internally develop video games based upon its upcoming movie Toy Story 3 rather than granting the license to develop and publish the game to an external publisher such as us. This may impact our net sales in fiscal 2011, as we are not releasing a new Disney•Pixar title this year. If intellectual property owners continue expanding internal efforts to develop video games based upon properties that they own rather than renewing our licenses or granting us additional licenses, our net sales could be significantly impacted.
Competition for licenses may negatively impact our profitability.
Some of our competitors have greater name recognition among consumers and licensors of properties, a broader product line, or greater financial, marketing and other resources than we do. Accordingly, these competitors may be able to market their products more effectively or make larger offers or guarantees in connection with the acquisition of licensed properties. As competition for popular properties increases, our cost of acquiring licenses for such properties may increase, which could result in reduced margins and thus negatively impact our profitability.
16
Competition with emerging forms of home-based entertainment may reduce sales of our products.
We also compete with other forms of entertainment and leisure activities. For example, we believe the overall growth in the use of the Internet and online services, including social networking, by consumers may pose a competitive threat if customers and potential customers spend less of their available time using interactive entertainment software and more of their time using the Internet and online services.
Competition for qualified personnel is intense in the interactive entertainment software industry and failure to hire and retain qualified personnel could seriously harm our business.
To a substantial extent, we rely on the management, marketing, sales, technical and software development skills of a limited number of employees to formulate and implement our business plan. To a significant extent, our success depends upon our ability to attract and retain key personnel. Competition for employees can be intense and the process of locating key personnel with the right combination of skills is often lengthy. The loss of key personnel could have a material adverse impact on our business.
We rely on external developers for the development of some of our titles.
A large percentage of our net sales are derived from games developed by third-party developers. While we own approximately 15% of Yuke's, the developer of our UFC Undisputed and WWE SmackDown vs. Raw games, we do not have direct control over the business, finances and operational practices of these external developers, including Yuke's. A delay or failure to complete the work performed by external developers has and may in the future result in delays in, or cancellations of, product releases. Additionally, the future success of externally-developed titles will depend on our continued ability to maintain relationships and secure agreements on favorable terms with skilled external developers. Our competitors may acquire the businesses of key developers or sign them to exclusive development arrangements. In either case, we would not be able to continue to engage such developers' services for our products, except for those that they are contractually obligated to complete for us. We cannot guarantee that we will be able to establish or maintain such relationships with external developers, and failure to do so could result in a material adverse impact on our business and financial results.
Defects in our game software could harm our reputation or decrease the market acceptance of our products.
Our game software may contain defects. In addition, because we do not manufacture our games for console platforms, we may not discover defects until after our products are in use by retail customers. Any defects in our software could damage our reputation, cause our customers to terminate relationships with us or to initiate product liability suits against us, divert our engineering resources, delay market acceptance of our products, increase our costs or cause our net sales to decline.
We may not be able to protect our intellectual property rights against piracy, infringement by third parties, or declining legal protection for intellectual property.
We defend our intellectual property rights and combat unlicensed copying and use of software and intellectual property rights through a variety of techniques. Preventing unauthorized use or infringement of our rights is difficult. Unauthorized production occurs in the computer software industry generally, and if a significant amount of unauthorized production of our products were to occur, it could materially and adversely impact our results of operations. We hold copyrights on the products, manuals, advertising and other materials owned by us and we maintain certain trademark rights. We regard our titles, including the underlying software, as proprietary and rely on a combination of trademark, copyright and trade secret laws as well as employee and third-party nondisclosure and confidentiality agreements, among other methods, to protect our rights. We include with our products a "shrink-wrap" or "click-wrap" license agreement which imposes limitations on use of the software. It is uncertain to what extent these agreements and limitations are enforceable, especially in foreign countries. Policing unauthorized use of
17
our products is difficult, and software piracy is a persistent problem, especially in some international markets. Further, the laws of some countries where our products are or may be distributed, either do not protect our products and intellectual property rights to the same extent as the laws of the U.S., or are poorly enforced. Legal protection of our rights may be ineffective in such countries. We cannot be certain that existing intellectual property laws will provide adequate protection for our products.
Software piracy may negatively impact our business.
Software piracy is increasing rapidly in the video game industry. Piracy related to customers obtaining products through peer-to-peer networks and other Internet channels has increased substantially. Modified chips for the Xbox 360 and Wii systems have allowed increased piracy of games for those systems, and the R4 chip has dramatically increased illegal downloads of DS games. While we are taking various steps to protect our intellectual property and prevent illegal downloading of our video games, we may not be successful in preventing or controlling such piracy, which may negatively impact our business.
Third parties may claim we infringe their intellectual property rights.
Although we believe that we make reasonable efforts to ensure our products do not violate the intellectual property rights of others, from time to time, we receive notices from others claiming we have infringed their intellectual property rights. The number of these claims may grow. Responding to these claims may require us to enter into royalty and licensing agreements on unfavorable terms, require us to stop selling or to redesign impacted products, or pay damages or satisfy indemnification commitments including contractual provisions under various license arrangements. If we are required to enter into such agreements or take such actions, our operating margins may decline as a result.
We cannot be certain of the future effectiveness of our internal control over financial reporting or the impact of the same on our operations and the market price for our common stock.
Pursuant to Section 404 of the Sarbanes-Oxley Act of 2002, we are required to include in our Annual Report on Form 10-K our assessment of the effectiveness of our internal control over financial reporting. Furthermore, our independent registered public accounting firm is required to report on whether it believes we maintain, in all material respects, effective internal control over financial reporting. Although we believe that we currently have adequate internal control procedures in place, we cannot be certain that our internal control over financial reporting will be effective in the future. If we cannot adequately maintain the effectiveness of our internal control over financial reporting, we might be subject to sanctions or investigation by regulatory authorities, such as the SEC. Any such action could adversely impact our financial results and the market price of our common stock.
Rating systems and future legislation may make it difficult to successfully market and sell our products.
Currently, the interactive entertainment software industry is self-regulated and products are rated by the Entertainment Software Rating Board ("ESRB"). Our retail customers take the ESRB rating into consideration when deciding which of our products they will purchase. If the ESRB or a manufacturer determines that a product should have a rating directed to an older or more mature consumer, we may be less successful in our marketing and sales of a particular product.
From time to time, legislation has been introduced for the establishment of a government mandated rating and governing system in the U.S. and in foreign countries for our industry. In April 2010, the U.S. Supreme Court granted the state of California's certiorari petition in connection with the constitutionality of California's proposed legislation to regulate the sale of violent video games to minors. Various foreign countries already allow government censorship of interactive entertainment products. We believe that if our industry were to become subject to a government rating system or other regulation (such as the law at
18
issue in the California case), our ability to successfully market and sell our products could be adversely impacted.
Item 1B. Unresolved Staff Comments
None.
Our principal corporate and administrative office is located in approximately 100,000 square feet of leased space in a building located at 29903 Agoura Road, Agoura Hills, California. Including this office, the following is a summary of the square footage of the principal leased offices we maintained as of March 31, 2010:
Purpose
|
North America | Europe | Asia Pacific | Total | ||||||||||
|---|---|---|---|---|---|---|---|---|---|---|---|---|---|---|
Sales and administrative |
123,900 | 62,400 | 18,400 | 204,700 | ||||||||||
Product development |
424,700 | 6,100 | 27,500 | 458,300 | ||||||||||
Total leased square footage |
548,600 | 68,500 | 45,900 | 663,000 | ||||||||||
We also own 10,820 square feet of space in Phoenix, Arizona, which serves as our data center.
From time to time we are involved in ordinary routine litigation incidental to our business. In the opinion of our management, none of such pending litigation is expected to have a material adverse effect on our consolidated financial condition or results of operations.
Item 4. (Removed and Reserved)
19
Item 5. Market for Registrant's Common Equity, Related Stockholder Matters and Issuer Purchases of Equity Securities
THQ's common stock is quoted on the NASDAQ Global Select Market under the symbol "THQI." The following table sets forth, for the periods indicated, the high and low intraday sales prices of our common stock as reported by the NASDAQ Global Select Market:
| |
Sales Prices | |||||||
|---|---|---|---|---|---|---|---|---|
| |
High | Low | ||||||
Fiscal Year Ended March 31, 2010 |
||||||||
Fourth Quarter ended March 31, 2010 |
$ | 7.30 | $ | 4.88 | ||||
Third Quarter ended December 31, 2009 |
7.45 | 4.12 | ||||||
Second Quarter ended September 30, 2009 |
8.82 | 5.29 | ||||||
First Quarter ended June 30, 2009 |
9.03 | 2.95 | ||||||
Fiscal Year Ended March 31, 2009 |
||||||||
Fourth Quarter ended March 31, 2009 |
$ | 5.40 | $ | 2.23 | ||||
Third Quarter ended December 31, 2008 |
12.25 | 3.29 | ||||||
Second Quarter ended September 30, 2008 |
20.79 | 11.74 | ||||||
First Quarter ended June 30, 2008 |
23.40 | 17.99 | ||||||
The last reported price of our common stock on May 28, 2010, as reported by NASDAQ Global Select Market, was $6.00 per share.
Holders
As of May 28, 2010 there were approximately 293 holders of record of our common stock.
Dividend Policy
We have never paid cash dividends on our common stock. We currently intend to retain future earnings, if any, to finance the growth and development of our business and, therefore, we do not anticipate paying any cash dividends in the foreseeable future. Additionally, our Loan and Security Agreement with Bank of America, N.A. restricts us from paying cash dividends (see "Note 12—Credit Facility" in the notes to the consolidated financial statements included in Item 8).
Stock Price Performance Graph
The following stock price performance information shall not be deemed to be "filed" with the Securities and Exchange Commission nor shall this information be incorporated by reference into any future filing under the Securities Act of 1933, as amended, or the Securities Exchange Act of 1934, as amended, except to the extent that we specifically incorporate it by reference into a filing.
The following graph shows a five-year comparison of cumulative total stockholder returns for the period from March 31, 2005 through March 31, 2010, for the Company's common stock, NASDAQ Global Select Market Composite Index and the RDG Technology Index. The comparison assumes an initial investment of $100 in each on March 31, 2005. We have not paid any cash dividends and, therefore, the cumulative total return calculation is based solely upon stock price appreciation and not upon reinvestment of cash dividends.
The comparisons in the graph below are based on historical data and are not intended to forecast the possible future performance of THQ's common stock.
20
COMPARISON OF 5 YEAR CUMULATIVE TOTAL RETURN*
Among THQ Inc., The NASDAQ Composite Index
And The RDG Technology Composite Index
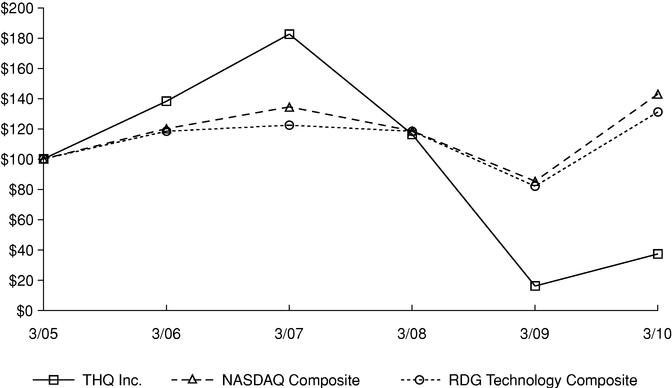
- *
- $100 invested on 3/31/05 in stock or index, including reinvestment of dividends. Fiscal year ending March 31.
| |
3/31/2005 | 3/31/2006 | 3/31/2007 | 3/31/2008 | 3/31/2009 | 3/31/2010 | |||||||||||||
|---|---|---|---|---|---|---|---|---|---|---|---|---|---|---|---|---|---|---|---|
THQ Inc. |
$ | 100.00 | $ | 138.01 | $ | 182.25 | $ | 116.20 | $ | 16.20 | $ | 37.37 | |||||||
NASDAQ Composite |
$ | 100.00 | $ | 119.97 | $ | 134.27 | $ | 118.46 | $ | 85.30 | $ | 142.80 | |||||||
RDG Technology Composite |
$ | 100.00 | $ | 118.23 | $ | 122.24 | $ | 118.17 | $ | 82.00 | $ | 130.94 | |||||||
Purchases of Equity Securities by the Issuer and Affiliated Purchases
On July 31, 2007 and October 30, 2007, our board authorized the repurchase of up to $25.0 million of our common stock from time to time on the open market or in private transactions, for an aggregate of $50.0 million. As of March 31, 2010 and 2009 we had $28.6 million, authorized and available for common stock repurchases. During fiscal 2010 we did not repurchase any shares of our common stock. There is no expiration date for the authorized repurchases.
Item 6. Selected Consolidated Financial Data
The following table summarizes certain selected consolidated financial data, which should be read in conjunction with our consolidated financial statements and notes thereto and with Management's Discussion and Analysis of Financial Condition and Results of Operations included elsewhere herein. The selected consolidated financial data presented below as of and for each of the fiscal years in the five-year period ended March 31, 2010 are derived from our audited consolidated financial statements. The consolidated balance sheets as of March 31, 2010 and 2009, and the consolidated statements of operations for fiscal 2010, 2009 and 2008, and the report thereon are included elsewhere in this Form 10-K.
21
STATEMENT OF OPERATIONS DATA
(In thousands, except per share data)
| |
Fiscal Year Ended March 31, | |||||||||||||||||
|---|---|---|---|---|---|---|---|---|---|---|---|---|---|---|---|---|---|---|
| |
2010 | 2009 | 2008 | 2007(a) | 2006 | |||||||||||||
Net sales |
$ | 899,137 | $ | 829,963 | $ | 1,030,467 | $ | 1,026,856 | $ | 806,560 | ||||||||
Cost of sales: |
||||||||||||||||||
Product costs |
318,590 | 338,882 | 389,097 | 351,449 | 287,946 | |||||||||||||
Software amortization and royalties |
196,956 | 296,688 | 231,800 | 165,462 | 116,371 | |||||||||||||
License amortization and royalties |
95,972 | 83,066 | 99,524 | 99,533 | 80,508 | |||||||||||||
Venture partner expense |
14,531 | 19,707 | 24,056 | 16,730 | 12,572 | |||||||||||||
Total cost of sales |
626,049 | 738,343 | 744,477 | 633,174 | 497,397 | |||||||||||||
Gross Profit |
273,088 | 91,620 | 285,990 | 393,682 | 309,163 | |||||||||||||
Operating expenses: |
||||||||||||||||||
Product development |
87,233 | 109,201 | 128,869 | 97,105 | 94,575 | |||||||||||||
Selling and marketing |
131,954 | 162,183 | 175,288 | 139,958 | 124,809 | |||||||||||||
General and administrative |
57,879 | 76,884 | 69,901 | 78,413 | 57,944 | |||||||||||||
Goodwill impairment |
— | 118,799 | — | — | — | |||||||||||||
Restructuring |
5,671 | 12,266 | — | — | — | |||||||||||||
Total operating expenses |
282,737 | 479,333 | 374,058 | 315,476 | 277,328 | |||||||||||||
Operating income (loss) |
(9,649 | ) | (387,713 | ) | (88,068 | ) | 78,206 | 31,835 | ||||||||||
Interest and other income (expense), net |
(2,056 | ) | 483 | 15,433 | 12,822 | 7,955 | ||||||||||||
Income (loss) from continuing operations before income taxes |
(11,705 | ) | (387,230 | ) | (72,635 | ) | 91,028 | 39,790 | ||||||||||
Income taxes |
247 | 46,226 | (35,785 | ) | 26,206 | 7,621 | ||||||||||||
Income (loss) from continuing operations |
(11,952 | ) | (433,456 | ) | (36,850 | ) | 64,822 | 32,169 | ||||||||||
Gain on sale of discontinued operations, net of tax |
— | 2,042 | 1,513 | 3,080 | — | |||||||||||||
Net income (loss) prior to allocation of noncontrolling interest |
(11,952 | ) | (431,414 | ) | (35,337 | ) | 67,902 | 32,169 | ||||||||||
Loss (gain) attributable to noncontrolling interest |
2,935 | 302 | — | 136 | (63 | ) | ||||||||||||
Net income (loss) attributable to THQ Inc |
$ | (9,017 | ) | $ | (431,112 | ) | $ | (35,337 | ) | $ | 68,038 | $ | 32,106 | |||||
Earnings (loss) per share attributable to THQ Inc.—basic: |
||||||||||||||||||
Continuing operations(b) |
$ | (0.13 | ) | $ | (6.48 | ) | $ | (0.55 | ) | $ | 1.00 | $ | 0.51 | |||||
Discontinued operations |
— | 0.03 | 0.02 | 0.05 | — | |||||||||||||
Earnings (loss) per share—basic |
$ | (0.13 | ) | $ | (6.45 | ) | $ | (0.53 | ) | $ | 1.05 | $ | 0.51 | |||||
Earnings (loss) per share attributable to THQ Inc.—diluted: |
||||||||||||||||||
Continuing operations(b) |
$ | (0.13 | ) | $ | (6.48 | ) | $ | (0.55 | ) | $ | 0.96 | $ | 0.49 | |||||
Discontinued operations |
— | 0.03 | 0.02 | 0.05 | — | |||||||||||||
Earnings (loss) per share—diluted |
$ | (0.13 | ) | $ | (6.45 | ) | $ | (0.53 | ) | $ | 1.01 | $ | 0.49 | |||||
Shares used in per share calculation—basic |
67,522 |
66,861 |
66,475 |
65,039 |
62,615 |
|||||||||||||
Shares used in per share calculation—diluted |
67,522 | 66,861 | 66,475 | 67,593 | 65,520 | |||||||||||||
BALANCE SHEET DATA
(In thousands)
| |
As of March 31, | |||||||||||||||
|---|---|---|---|---|---|---|---|---|---|---|---|---|---|---|---|---|
| |
2010 | 2009 | 2008 | 2007 | 2006 | |||||||||||
Working capital |
$ | 371,641 | $ | 189,604 | $ | 396,505 | $ | 562,316 | $ | 459,558 | ||||||
Total assets |
$ | 714,329 | $ | 598,329 | $ | 1,084,320 | $ | 1,013,541 | $ | 848,468 | ||||||
Total THQ Inc. stockholders' equity(b) |
$ | 324,355 | $ | 307,040 | $ | 740,569 | $ | 768,957 | $ | 627,751 | ||||||
- (a)
- Beginning
in our first quarter of fiscal 2007, we began expensing stock-based compensation.
- (b)
- Based on amounts attributable to THQ Inc. (i.e., subsequent to the allocation of noncontrolling interest).
22
Item 7. Management's Discussion and Analysis of Financial Condition and Results of Operations
Our business is subject to many risks and uncertainties which may affect our future financial performance. For a discussion of our risk factors, see "Part I—Item 1A. Risk Factors."
Overview
The following overview is a top level discussion of our financial results, as well as trends that have, or that we reasonably believe will, impact our operations. Management believes that an understanding of these trends and drivers is important in order to understand our results for fiscal 2010, as well as our future prospects. This summary is not intended to be exhaustive, nor is it intended to be a substitute for the detailed discussion and analysis provided elsewhere in this Annual Report on Form 10-K and in other documents we have filed with the SEC.
Overview of Financial Results for Fiscal 2010
The video games industry in North America and Europe reported retail software sales of $19.0 billion in the twelve months ended March 31, 2010, down 12% from the prior-year period, according to The NPD Group, Chart Track and GfK. Despite these challenging conditions and a weak macroeconomic environment, we achieved the following in fiscal 2010: 1) we generated higher net sales in fiscal 2010 than in fiscal 2009, 2) we reduced our loss per share by 98%, to $0.13 in fiscal 2010 down from $6.45 in fiscal 2009, and 3) we generated significant operating cash flow. Additionally, in the twelve months ended March 31, 2010, we gained market share both in the U.S. and globally according to The NPD Group, Chart Track and GfK; we were the number four independent publisher in the U.S. with a 4.9% share, up from 3.6% a year ago; and we were the number four independent publisher globally with a 4.4% share, up from 3.7% a year ago.
Our net loss attributable to THQ Inc. ("net loss") for fiscal 2010 was $9.0 million, or $0.13 per diluted share, compared to a net loss of $431.1 million, or $6.45 per diluted share (inclusive of a gain on sale of discontinued operations, net of tax, of $2.1 million) for fiscal 2009.
Our profitability is dependent upon revenue from the sales of our video games. Net sales increased 8% in fiscal 2010, to $899.1 million from $830.0 million in fiscal 2009. The increase in net sales was primarily due to net sales of UFC 2009 Undisputed at a higher average selling price compared to games sold in the same period last year.
Our profitability is also affected by the costs and expenses associated with developing and publishing our games. These costs and expenses include both cost of sales and operating expenses. Our gross profit as a percent of net sales, increased 19 points in fiscal 2010, to 30% from 11% in fiscal 2009. The increase in our gross profit as a percent of net sales was primarily due to decreases in software amortization and royalties expense because of non-cash charges of $63.3 million in fiscal 2009 related to the write-off of capitalized software for games that were cancelled as part of our fiscal 2009 business realignment, and additional amortization expense in fiscal 2009 as a result of lower projected gross sales on various titles. Additionally, the decrease in cost of sales as a percent of net sales in fiscal 2010 was due to sales of games at higher average selling prices as compared to fiscal 2009, led by the fiscal 2010 first quarter release of UFC 2009 Undisputed.
Our profitability is also affected by our operating expenses, which decreased by $196.6 million in fiscal 2010, to $282.7 million from $479.3 million in fiscal 2009. The decrease was primarily due to a non-cash goodwill impairment charge of $118.8 million in fiscal 2009 and lower costs in fiscal 2010 due to our fiscal 2009 business realignment.
Our principal source of cash is from sales of interactive software games designed for play on video game consoles, handheld devices and PCs, including via the Internet. Our principal uses of cash are for product purchases of discs and cartridges along with associated manufacturer's royalties, payments to external developers and licensors, the costs of internal software development, and selling and marketing expenses.
23
Our cash, cash equivalents and short-term investments balance at March 31, 2010 was $271.3 million, as compared to $140.7 million as of March 31, 2009. Cash provided by operations was $33.4 million in fiscal 2010, as compared to cash used in operations of $194.2 million in fiscal 2009. The increase in cash provided was primarily the result of our lower fiscal 2010 net loss as compared to fiscal 2009, adjusted for non-cash goodwill impairment and higher amortization of licenses and software development in fiscal 2009. Additionally, in fiscal 2010 we had lower investments in software development and licenses as compared to fiscal 2009.
Executing on Our Strategy in Fiscal 2010
In addition to achieving the financial targets we set for fiscal 2010, we also made significant progress towards our strategic operating goals.
Core Games
The goals of our Core Games business unit are to develop a select number of high quality titles each year that are targeted at the core gamer, to build franchises through sequels and to extend our leadership in the fighting category. In fiscal 2010, Core Games released Red Faction: Guerrilla with an 85 Metacritic rating and Darksiders with an 83 Metacritic rating. We also extended our leadership in the fighting games category. In May 2009, we successfully launched our first games based on the UFC franchise, UFC Undisputed 2009, with an 84 Metacritic rating and shipments of almost 4 million units in fiscal 2010. In December 2009, we signed a direct eight-year license agreement with WWE and we plan to continue to publish games annually based on this leading sports entertainment brand. During fiscal 2010, we shipped nearly 4 million units of WWE SmackDown vs. Raw 2010, which achieved a Metacritic rating of 81.
In February 2010, we announced a realignment of two of our development studios to focus solely on the creation of digital content and technology. We renamed them THQ Digital Studios UK and THQ Digital Studios Phoenix. The three main objectives for our digital studios will be the creation of online-only games based on our Core Games brands, the development of new original digital intellectual properties and the delivery of supporting technology to connect consumers to all of our Core Games using proprietary technology.
Kids, Family and Casual Games
The goals of our Kids, Family and Casual Games business unit are to reinvigorate our kids product portfolio and improve profitability in our kids' business and to build strong mass appeal/family game franchises. During fiscal 2010, we signed multi-property, multi-year license agreements with DreamWorks Animation to publish games based on Kung Fu Panda: The Kaboom of Doom, Puss in Boots and The Penguins of Madagascar. In fiscal 2010, we shipped over one million units of our first games based on Marvel Super Hero Squad under our multi-year agreement. In addition, we have been taking aggressive actions to reduce the cost structure for our kids games by reducing our development spending and signing new license agreements at more attractive rates.
With respect to mass appeal/family game franchises, we successfully launched The Biggest Loser in fiscal 2010. The Biggest Loser was the #1 fitness game from an independent publisher in the U.S. during the December quarter and ranked in the top five fitness games in the U.S. for calendar 2009, according to The NPD Group. We continued to build our Drawn to Life brand, with our fiscal 2010 title shipping more than one million units and total lifetime franchise shipments in excess of 3 million units. We also established a new original game, World of Zoo, at nearly 800,000 units shipped. In fiscal 2010, we signed a new multi-year, multi-property license agreement with Sony Pictures Consumer Products to publish games based on the popular game shows Wheel of Fortune and JEOPARDY!.
24
Online Games
The goal of our Online Games business unit is to embrace digital migration and extend our brands into online markets. During fiscal 2010, we developed games to bring online in fiscal 2011, including Company of Heroes Online for Korean and North American markets and a WWE online game for release initially in Asian markets. In addition, we are developing a massively multiplayer online game based on Warhammer 40,000.
Trends Affecting Our Business
The following significant trends currently affect our business:
Retail Video Game Sales
The video games industry in North America and Europe reported retail software sales of $19.0 billion in the twelve months ended March 31, 2010, down 12% from the prior-year period, according to The NPD Group, Chart Track and GfK. The decrease in retail software sales was due primarily to a difficult consumer spending environment and declines in sales of games in the music category, and for the handheld and PS2 gaming platforms. Despite these challenging market conditions and a weak macroeconomic environment, THQ gained worldwide market share in the twelve months ended March 31, 2010.
The installed base of gaming hardware in North America and Europe was approximately 300 million units as of December 31, 2009, up 26% year over year, according to IDG. We expect North America and Europe retail software sales to be roughly flat in calendar 2010 versus 2009. We expect growth in our business during fiscal 2010 from sales of video games on the growing installed base of the PS3 and Xbox 360 platforms, which generally have higher average selling prices than games sold on other platforms; however, we also expect continued declines in sales of games for the handheld and PS2 gaming platforms.
Sales of Used Video Games
Large retailers, such as GameStop, have increased their focus on selling used video games, which provides higher margins for the retailers than sales of new games. This focus reduces demand for new copies of our games. We believe customer retention through compelling online play and downloadable content offers may reduce consumers' propensity to trade in games.
Increasing Shift to Online Content and Digital Downloads
The interactive entertainment software industry is delivering a growing amount of games, downloadable content and product add-ons by direct digital download through the Internet and gaming consoles. We believe that much of the growth in the industry will come via online distribution such as massively multi-player games (both subscription and free-to-play), casual micro-transaction based games, paid downloadable content and digital downloads of games. Accordingly, we plan to continue integrating a digital strategy into all of our key franchises.
Sales Concentration of Top Titles
During the last fiscal year, the majority of money spent by consumers on video game software was spent on select top titles. We expect this trend to continue into fiscal 2011. Additionally, the cost to develop video games, especially Core Games, has increased significantly over the last few years. Current generation consoles have functionality that allows us to deliver exciting gaming experiences at high quality levels, but this increased functionality also increases the overall cost to develop games. Accordingly, our software development costs have increased as we developed more games for these consoles. Because of the demand for select "hit" titles and the increased Core Game development investment, we believe that it is important to focus our Core Game development efforts on bringing a smaller number of high-quality, competitive products to market. This focus may lower our net sales and profitability in any given quarter, as we
25
generally aim to ship games only when we believe the quality is high and the competitive window is most advantageous.
Foreign Currency Exchange Rates Impact on Results of Operations
Approximately 38% of our net sales for fiscal 2010 was produced by sales outside of North America. We are exposed to significant risks of foreign currency fluctuation, primarily from receivables denominated in foreign currency, and are subject to transaction gains and losses, which are recorded as a component in determining net income. The income statements of our non-U.S. operations are translated into U.S. dollars at the month-to-date average exchange rates for each applicable month in a period. To the extent the U.S. dollar strengthens against foreign currencies, as it did during fiscal 2010, the translation of these foreign currency denominated transactions results in decreased net sales, operating expenses and income from our non-U.S. operations. Similarly, our net sales, operating expenses and income from our non-U.S. operations will increase if the U.S. dollar weakens against foreign currencies.
Seasonality
The interactive entertainment software industry is highly seasonal. Sales are typically significantly higher during the third quarter of our fiscal year, due primarily to the increased demand for interactive games during the holiday buying season.
Results of Operations
Comparison of Fiscal 2010 to Fiscal 2009
Net Sales
Our net sales are principally derived from sales of interactive software games designed for play on video game consoles, handheld devices and PCs, including digitally via the Internet.
Fiscal 2010 net sales were primarily driven by sales of our first game based on the UFC franchise, UFC 2009 Undisputed, as well as WWE SmackDown vs. Raw 2010 and catalog titles. Net sales increased by $69.1 million in fiscal 2010 to $899.1 million, from $830.0 million in fiscal 2009.
Net Sales by New Releases and Catalog Titles
The following table details our net sales by new releases (titles initially released in the respective fiscal year) and catalog titles (titles released in fiscal years previous to the respective fiscal year) for fiscal 2010 and fiscal 2009 (in thousands):
| |
Fiscal Year Ended March 31, | |
|
||||||||||||||||
|---|---|---|---|---|---|---|---|---|---|---|---|---|---|---|---|---|---|---|---|
| |
Increase/ (Decrease) |
|
|||||||||||||||||
| |
2010 | 2009 | % Change | ||||||||||||||||
New releases |
$ | 670,306 | 74.5 | % | $ | 556,384 | 67.0 | % | $ | 113,922 | 20.5 | % | |||||||
Catalog |
228,831 | 25.5 | 273,579 | 33.0 | (44,748 | ) | (16.4 | )% | |||||||||||
Consolidated net sales |
$ | 899,137 | 100.0 | % | $ | 829,963 | 100.0 | % | $ | 69,174 | 8.3 | % | |||||||
Net sales of our new releases increased by $113.9 million in fiscal 2010 as compared to fiscal 2009 primarily due to sales of UFC 2009 Undisputed, which was initially released in the three months ended June 30, 2009 on Xbox 360 and PS3, at a premium price (e.g. MSRP of $59.99 in the United States). This title was the primary driver of our net sales in fiscal 2010 and had a higher average selling price compared to sales of our titles released in fiscal 2009. The increase in net sales of new releases due to sales of UFC 2009 Undisputed was partially offset by i) a decrease in net sales of games based on the WWE brand, which was primarily due to the release of WWE Legends of Wrestlemania in fiscal 2009 with no comparable title in fiscal 2010 and ii) fewer units shipped of games based on our license with Nickelodeon.
26
Net sales of our catalog titles decreased by $44.7 million in fiscal 2010 due to fewer units sold as compared to fiscal 2009. Additionally, with respect to sales of our catalog, we had a decrease in the recognition of deferred revenue in fiscal 2010 as compared to fiscal 2009.
Net Sales by Territory
The following table details our net sales by territory for fiscal 2010 and fiscal 2009 (in thousands):
| |
Fiscal Year Ended March 31, | |
|
||||||||||||||||
|---|---|---|---|---|---|---|---|---|---|---|---|---|---|---|---|---|---|---|---|
| |
Increase/ (Decrease) |
|
|||||||||||||||||
| |
2010 | 2009 | % Change | ||||||||||||||||
North America |
$ | 558,673 | 62.1 | % | $ | 457,819 | 55.2 | % | $ | 100,854 | 22.0 | % | |||||||
Europe |
277,647 | 30.9 | % | 314,063 | 37.8 | % | (36,416 | ) | (11.6 | )% | |||||||||
Asia Pacific |
62,817 | 7.0 | % | 58,081 | 7.0 | % | 4,736 | 8.2 | % | ||||||||||
International |
340,464 | 37.9 | % | 372,144 | 44.8 | % | (31,680 | ) | (8.5 | )% | |||||||||
Consolidated net sales |
$ | 899,137 | 100.0 | % | $ | 829,963 | 100.0 | % | $ | 69,174 | 8.3 | % | |||||||
Net sales in North America increased by $100.9 million in fiscal 2010 as compared to fiscal 2009. The increase was due to an increase in units shipped of our new releases with higher average selling prices, which was primarily due to sales of UFC 2009 Undisputed.
Net sales in Europe decreased by $36.4 million in fiscal 2010 as compared to fiscal 2009. The decrease was primarily due to a decrease in units shipped. We shipped fewer games from our kids business due primarily to fewer units sold of Up in fiscal 2010 as compared to Wall-E in fiscal 2009 and we shipped fewer games based on our WWE license, which was primarily due to the release of WWE Legends of Wrestlemania in fiscal 2009 with no comparable title in fiscal 2010. The decrease in units shipped was partially offset by an increase in average selling prices in fiscal 2010 as compared to fiscal 2009, driven by sales of UFC 2009 Undisputed. We estimate that changes in foreign currency translation rates during fiscal 2010 decreased reported net sales in Europe by $3.9 million.
Net sales in Asia Pacific increased by $4.7 million in fiscal 2010 as compared to fiscal 2009. We estimate that changes in foreign currency translation rates during fiscal 2010 increased reported net sales in this territory by $6.1 million. Excluding the increase due to changes in foreign currency translation rates, net sales in Asia Pacific decreased slightly in fiscal 2010 as compared to fiscal 2009.
Cost of Sales, Operating Expenses, Interest and Other Income (Expense), net, Income Taxes, Noncontrolling Interest and Discontinued Operations
Cost of Sales
Cost of sales decreased by $112.3 million, or 15%, in fiscal 2010 as compared to fiscal 2009. As a result, our gross profit increased by 19.4 points in fiscal 2010. The decrease in cost of sales was primarily due to a decrease in software amortization and royalties expense because of non-cash charges of $63.3 million in fiscal 2009 related to the write-off of capitalized software for games that were cancelled as part of our fiscal 2009 business realignment and additional amortization expense in fiscal 2009 as a result of lower projected gross sales on various titles. Additionally, the decrease in cost of sales as a percent of net sales in fiscal 2010 was due to sales of games at higher average selling prices as compared to fiscal 2009, led by the release of UFC 2009 Undisputed.
Cost of Sales—Product Costs (in thousands)
| Year Ended March 31, 2010 |
% of net sales | Year Ended March 31, 2009 |
% of net sales | % change | ||||
|---|---|---|---|---|---|---|---|---|
| $318,590 | 35.4% | $338,882 | 40.8% | (6.0)% | ||||
27
Product costs primarily consist of direct manufacturing costs, including platform manufacturer license fees, net of manufacturer volume rebates and discounts. In fiscal 2010, product costs as a percentage of net sales decreased by 5.4 points as compared to fiscal 2009.
The decrease as a percent of net sales in fiscal 2010 was primarily due to sales of UFC 2009 Undisputed on Xbox 360 and PS3, at a premium price (e.g. MSRP of $59.99 in the United States). This title was the primary driver of our net sales in fiscal 2010 and had a higher average selling price compared to titles released in fiscal 2009.
Cost of Sales—Software Amortization and Royalties (in thousands)
| Year Ended March 31, 2010 |
% of net sales | Year Ended March 31, 2009 |
% of net sales | % change | ||||
|---|---|---|---|---|---|---|---|---|
| $196,956 | 21.9% | $296,688 | 35.7% | (33.6)% | ||||
Software amortization and royalties expense consists of amortization of capitalized payments made to third-party software developers and amortization of capitalized internal studio development costs. Commencing upon product release, capitalized software development costs are amortized to software amortization and royalties based on the ratio of current gross sales to total projected gross sales. In fiscal 2010, software amortization and royalties as a percentage of net sales decreased by 13.8 points as compared to fiscal 2009. The decrease was primarily due to higher amortization in fiscal 2009 due to non-cash charges of $63.3 million related to the write-off of capitalized software for games that were cancelled as part of our fiscal 2009 business realignment and additional amortization expense in fiscal 2009 as a result of lower projected gross sales on various titles. Also contributing to the decrease was lower development costs on UFC 2009 Undisputed in relation to its total projected gross sales as compared to most titles recognized in fiscal 2009.
Cost of Sales—License Amortization and Royalties (in thousands)
| Year Ended March 31, 2010 |
% of net sales | Year Ended March 31, 2009 |
% of net sales | % change | ||||
|---|---|---|---|---|---|---|---|---|
| $95,972 | 10.7% | $83,066 | 10.0% | 15.5% | ||||
License amortization and royalties expense consists of royalty payments due to licensors, which are expensed at the higher of (1) the contractual royalty rate based on actual net product sales for such license, or (2) an effective rate based upon total projected net sales for such license.
Net sales of games based on licensed properties represented 69% and 66% of our total net sales in fiscal 2010 and fiscal 2009, respectively. In fiscal 2010, license amortization and royalties as a percentage of net sales increased slightly, primarily due to the higher mix of sales from titles based on licensed properties.
Cost of Sales—Venture Partner Expense (in thousands)
| Year Ended March 31, 2010 |
% of net sales | Year Ended March 31, 2009 |
% of net sales | % change | ||||
|---|---|---|---|---|---|---|---|---|
| $14,531 | 1.6% | $19,707 | 2.4% | (26.3)% | ||||
Venture partner expense is related to the license agreement that the THQ / JAKKS Pacific LLC ("LLC") joint venture, comprised of THQ and JAKKS Pacific, Inc. ("Jakks"), had with WWE. In August 2009, we settled our preferred return dispute with Jakks at a 40% lower payment rate, which resulted in a benefit of $24.2 million. In December 2009, as the result of various settlement agreements entered into between THQ, Jakks and WWE, we recorded expense of $29.5 million. In addition, on December 31, 2009, the LLC was dissolved, the WWE license held by the LLC was terminated, and a new eight-year license was entered into directly between THQ and WWE. Accordingly, the final expenses related to the joint venture were recorded as of December 31, 2009.
28
Excluding these items, venture partner expense in fiscal 2010 would have been $9.2 million, which reflects the 40% lower payment rate, as compared to fiscal 2009. For further information related to the settlements, see "Note 6—Balance Sheet Details" and "Note 17—Settlement Agreements" in the notes to the consolidated financial statements included in Item 8.
Operating Expenses
Our operating expenses decreased by $196.6 million, or 41%, in fiscal 2010 as compared to fiscal 2009. This decrease was primarily due to goodwill impairment charges of $118.8 million recognized in fiscal 2009, as well as lower product development, selling and marketing, and general and administrative costs in fiscal 2010 due to the actions taken as part of our fiscal 2009 business realignment.
Product Development (in thousands)
| Year Ended March 31, 2010 |
% of net sales | Year Ended March 31, 2009 |
% of net sales | % change | ||||
|---|---|---|---|---|---|---|---|---|
| $87,233 | 9.7% | $109,201 | 13.2% | (20.1)% | ||||
Product development expense primarily consists of expenses incurred by internal development studios and payments made to external development studios prior to products reaching technological feasibility. Product development expense decreased by $22.0 million in fiscal 2010 as compared to fiscal 2009. The decrease was primarily due to decreases in internal development spending primarily resulting from actions taken as part of our fiscal 2009 business realignment, including our more focused product strategy and the closure of several of our studios.
Selling and Marketing (in thousands)
Year Ended March 31, 2010 |
% of net sales | Year Ended March 31, 2009 |
% of net sales | % change | ||||
|---|---|---|---|---|---|---|---|---|
| $131,954 | 14.7% | $162,183 | 19.5% | (18.6)% | ||||
Selling and marketing expenses consist of advertising, promotional expenses, and personnel-related costs. Selling and marketing expenses decreased by $30.2 million and by 4.8 points as a percent of net sales in fiscal 2010 as compared to fiscal 2009. These decreases were primarily due to i) more focused selling and marketing spend on our key titles in fiscal 2010 as compared to fiscal 2009 and ii) reductions in sales and marketing personnel-related costs resulting from actions taken as part of our fiscal 2009 business realignment, including lower stock-based compensation expense. Additionally, the decrease as a percent of net sales in fiscal 2010 was due to high net sales from our first game based on the UFC franchise, UFC 2009 Undisputed, relative to its marketing spend.
General and Administrative (in thousands)
Year Ended March 31, 2010 |
% of net sales | Year Ended March 31, 2009 |
% of net sales | % change | ||||
|---|---|---|---|---|---|---|---|---|
| $57,879 | 6.4% | $76,884 | 9.3% | (24.7)% | ||||
General and administrative expenses consist of personnel and related expenses of executive and administrative staff and fees for professional services such as legal and accounting. General and administrative expenses decreased in fiscal 2010 by $19.0 million, as compared to fiscal 2009. The decrease was primarily due to bad debt expense recognized in fiscal 2009 due to the bankruptcy of certain customers as well as recoveries of certain of those bad debts in fiscal 2010. Additionally, general and administrative expenses decreased due to reductions in personnel-related costs resulting from actions taken as part of our fiscal 2009 business realignment, including lower stock-based compensation expense, partially offset by the lack of bonus expense in fiscal 2009.
29
Goodwill Impairment
In connection with the preparation of the fiscal 2009 third quarter financial statements, we performed an interim impairment test of goodwill at December 31, 2008 and recorded goodwill impairment charges of $118.8 million during fiscal 2009, representing the entire amount of our previously recorded goodwill. We did not have goodwill impairment charges in fiscal 2010.
Restructuring
Restructuring charges include the costs associated with lease abandonments less estimates of sublease income, write-offs of related long-lived assets due to the studio closures, as well as costs of other non-cancellable contracts. During fiscal 2009, we updated our strategic plan in an effort to increase our profitability and cash flow generation. We significantly realigned our business to focus on fewer, higher quality games, and have established an operating structure that supports our more focused product strategy. The realignment included the cancellation of several titles in development, the closure or spin-off of several of our development studios, and the streamlining of our corporate organization in order to support the new product strategy, including reductions in worldwide personnel. As a result of these initiatives, we recorded restructuring charges of $5.7 million in fiscal 2010, and $12.3 million in fiscal 2009. We do not expect any future charges under the fiscal 2009 realignment, other than additional facility related charges in the event actual and estimated sublease income changes. For further information related to our restructuring charges, see "Note 9—Restructuring" in the notes to the consolidated financial statements included in Item 8.
Interest and Other Income (Expense), net
Interest and other income (expense), net consists of interest earned on our investments, gains and losses resulting from exchange rate changes for transactions denominated in currencies other than the functional currency, and interest expense and amortization of debt issuance costs on our $100.0 million 5.00% convertible senior notes ("Notes"). For further discussion of the Notes, see "Note 11—Convertible Senior Notes" in the notes to the consolidated financial statements included in Item 8. Interest and other income (expense), net decreased by $2.5 million in fiscal 2010, as compared to fiscal 2009. Excluding the recognition of a $6.3 million other-than-temporary impairment loss on our investments in fiscal 2009, interest and other income (expense), net, decreased $8.8 million due to:
- •
- lower average yields and investment balances, as compared to fiscal 2009;
- •
- interest expense on our Notes in fiscal 2010; and
- •
- foreign currency transaction losses.
There were no other-than-temporary impairment losses in fiscal 2010.
Income Taxes
Income tax expense for fiscal 2010 was $0.2 million, which primarily represents foreign and U.S. state taxes offset by a $3.6 million valuation allowance release related to the recognition of a net operating loss benefit claimed pursuant to a change in tax law, compared to income tax expense of $46.2 million in fiscal 2009. The change in income taxes is primarily attributable to the recording of a valuation allowance for deferred tax assets in fiscal 2009 and income taxes incurred in foreign jurisdictions, which are not reduced by losses in the United States. The effective tax rate differs significantly from the federal statutory rate primarily due to losses in the United States that are fully offset by a valuation allowance to the extent that such losses were not subject to the new five year loss carry-back provisions.
30
Noncontrolling Interest
The noncontrolling interest of $2.9 million in fiscal 2010 reflects the loss allocable to equity interests in THQ*ICE LLC (a joint venture with ICE Entertainment). The loss allocable to equity interests in THQ*ICE LLC was $0.3 million in fiscal 2009. This noncontrolling interest reflects the loss allocable to equity interests that are not owned by THQ. We sold our interest in THQ*ICE LLC on April 30, 2010 and thus after this date, we will not have income or loss attributable to noncontrolling interest.
Discontinued Operations
In December 2006, we sold our 50% interest in Minick Holding AG ("Minick"). As of December 31, 2008 we received $20.6 million in cash from the sale of Minick, and we recognized a gain of $2.1 million in the nine months ended December 31, 2008. The gain is presented as "Gain on sale of discontinued operations, net of tax" in our fiscal 2009 consolidated statement of operations. Pursuant to the Minick sale agreement, no additional consideration was outstanding as of June 30, 2008.
Comparison of Fiscal 2009 to Fiscal 2008
Our net loss from continuing operations for fiscal 2009 was $433.5 million, or $6.48 per diluted share, compared to a net loss from continuing operations of $36.9 million, or $0.55 per diluted share, for fiscal 2008. Our net loss for fiscal 2009 was $431.1 million, or $6.45 per diluted share, and included a $2.1 million gain on sale of discontinued operations.
Net Sales
In fiscal 2009 and 2008, net sales were $830.0 million and $1,030.5 million, respectively.
Net sales for fiscal 2009 were impacted by the deferral or recognition of revenue from the sale of titles with significant online functionality. The balance of deferred revenue related to these titles is included within accrued and other current liabilities in our consolidated balance sheets. We also defer certain costs related to these titles; these costs are included within software development, and prepaid expenses and other current assets in our consolidated balance sheets.
Net sales decreased by $200.5 million in fiscal 2009 as compared to fiscal 2008, from $1,030.5 million to $830.0 million. Worldwide net sales in fiscal 2009 were primarily driven by sales of WWE SmackDown vs. Raw 2009, Saints Row 2, and WALL•E. As more fully described below, the main factors that contributed to the decrease in our net sales were, i) an overall softening in our kids business, ii) decline in sales of our games based on the WWE license, and iii) unfavorable changes in foreign currency translation rates.
Net Sales by New Releases and Catalog Titles
The following table details our net sales by new releases (titles initially released in the respective fiscal year) and catalog titles (titles released in fiscal years previous to the respective fiscal year) for fiscal 2009 and 2008 (in thousands):
| |
Fiscal Year Ended March 31, | |
|
||||||||||||||||
|---|---|---|---|---|---|---|---|---|---|---|---|---|---|---|---|---|---|---|---|
| |
Increase/ (Decrease) |
|
|||||||||||||||||
| |
2009 | 2008 | % Change | ||||||||||||||||
New releases |
$ | 556,384 | 67.0 | % | $ | 755,126 | 73.3 | % | $ | (198,742 | ) | (26.3 | )% | ||||||
Catalog |
273,579 | 33.0 | 275,341 | 26.7 | (1,762 | ) | (0.6 | )% | |||||||||||
Consolidated net sales |
$ | 829,963 | 100.0 | % | $ | 1,030,467 | 100.0 | % | $ | (200,504 | ) | (19.5 | )% | ||||||
Net sales of our new releases decreased by $198.7 million in fiscal 2009 as compared to fiscal 2008 primarily due to a decrease in the number of units sold. The decrease in units sold was primarily the result of releasing 25 fewer SKUs in fiscal 2009 as compared to fiscal 2008, which was primarily due to a decrease
31
in titles from our kids business. A SKU is a version of a title designed for play on a particular platform. The decrease in units sold was also the result of fewer units sold of WWE Smackdown vs. Raw 2009 and Wall-E in fiscal 2009 compared to sales of WWE Smackdown vs. Raw 2008 and Ratatouille in fiscal 2008.
Additionally, there was a decrease in the average selling price on our new releases in fiscal 2009 as compared to fiscal 2008. The decrease in the average selling price of our new releases was primarily due to:
- •
- a shift in title mix on the Wii platform toward lower priced titles such as Big Beach
Sports and All Star Cheer; and
- •
- a decrease in the average selling price on Smackdown vs. Raw 2009 in fiscal 2009 as compared to Smackdown vs. Raw 2008 in fiscal 2008, as well as a decrease in average selling price on Wall-E in fiscal 2009 as compared to Ratatouille in fiscal 2008. The decrease in average selling price on these titles was due to a decrease in the gross selling price as well as a higher percentage of fiscal 2009 estimates for price protection as compared to fiscal 2008.
These decreases were partially offset by the net deferred revenue activity on our new releases.
Net sales of our catalog titles remained relatively flat; however, we had a decline in the number of catalog units shipped in fiscal 2009 as compared to fiscal 2008. The decline in units shipped was partially offset by the fiscal 2009 recognition of the fiscal 2008 deferred revenue. Additionally, our catalog titles sold at slightly higher average selling prices in fiscal 2009 as compared to fiscal 2008.
Net Sales by Territory
The following table details our net sales by territory for fiscal 2009 and fiscal 2008 (in thousands):
| |
Fiscal Year Ended March 31, | |
|
||||||||||||||||
|---|---|---|---|---|---|---|---|---|---|---|---|---|---|---|---|---|---|---|---|
| |
Increase/ (Decrease) |
|
|||||||||||||||||
| |
2009 | 2008 | % Change | ||||||||||||||||
North America |
$ | 457,819 | 55.2 | % | $ | 503,134 | 48.8 | % | $ | (45,315 | ) | (9.0 | )% | ||||||
Europe |
314,063 | 37.8 | % | 454,880 | 44.2 | % | (140,817 | ) | (31.0 | )% | |||||||||
Asia Pacific |
58,081 | 7.0 | % | 72,453 | 7.0 | % | (14,372 | ) | (19.8 | )% | |||||||||
International |
372,144 | 44.8 | % | 527,333 | 51.2 | % | (155,189 | ) | (29.4 | )% | |||||||||
Consolidated net sales |
$ | 829,963 | 100.0 | % | $ | 1,030,467 | 100.0 | % | $ | (200,504 | ) | (19.5 | )% | ||||||
Net sales in North America and in our international territories decreased in fiscal 2009 as compared to fiscal 2008 by $45.3 million and $155.2 million, respectively. The decrease in net sales in both North America and in our international territories was primarily due to the decrease in sales from our new releases. Additionally, we estimate that unfavorable changes in foreign currency translation rates during fiscal 2009 resulted in a decrease of reported net sales from our international territories of $41.0 million as compared to fiscal 2008.
Cost of Sales, Operating Expenses, Interest and Other Income (Expense), net, Income Taxes, Noncontrolling Interest and Discontinued Operations
Excluding the impact of goodwill impairment charges of $118.8 million, cost of sales and operating expenses decreased by $19.6 million, or 1.8%, in fiscal 2009 as compared to fiscal 2008, to $1,098.9 million, from $1,118.5 million. The decrease was primarily due to decreases in product costs, license amortization and royalties, product development, and selling and marketing expense in fiscal 2009 as compared to fiscal 2008, which were primarily the result of lower sales and cost reductions in product development stemming from our business realignment. These decreases were partially offset by an increase in software development expense in fiscal 2009 as compared to fiscal 2008, primarily due to games cancelled in connection with our realignment as well as other realignment charges incurred in fiscal 2009.
32
Cost of Sales—Product Costs (in thousands)
| Year Ended March 31, 2009 |
% of net sales | Year Ended March 31, 2008 |
% of net sales | % change | ||||
|---|---|---|---|---|---|---|---|---|
| $338,882 | 40.8% | $389,097 | 37.8% | 12.9% | ||||
Product costs primarily consist of direct manufacturing costs (including platform manufacturer license fees), net of manufacturer volume rebates and discounts. Product costs as a percentage of net sales increased by 3.0 points in fiscal 2009 as compared to fiscal 2008. This increase was primarily due to:
- •
- a shift in title mix on the Wii platform toward lower priced titles such as Big Beach
Sports and All Star Cheer; and
- •
- a decrease in the average selling price on Smackdown vs. Raw 2009 in fiscal 2009 as compared to Smackdown vs. Raw 2008 in fiscal 2008, as well as a decrease in average selling price on Wall-E in fiscal 2009 as compared to Ratatouille in fiscal 2008. The decrease in average selling price on these titles was due to a decrease in the gross selling price as well as a higher percentage of fiscal 2009 estimates for price protection as compared to fiscal 2008.
Cost of Sales—Software Amortization and Royalties (in thousands)
| Year Ended March 31, 2009 |
% of net sales | Year Ended March 31, 2008 |
% of net sales | % change | ||||
|---|---|---|---|---|---|---|---|---|
| $296,688 | 35.7% | $231,800 | 22.5% | 28.0% | ||||
Software amortization and royalties consists of amortization of capitalized payments made to third-party software developers and amortization of capitalized internal studio development costs. Commencing upon product release, capitalized software development costs are amortized to software amortization and royalties based on the ratio of current revenues to total projected revenues. In fiscal 2009 software amortization and royalties increased by 13.2 points as a percentage of net sales as compared to fiscal 2008. The increase was primarily due to non-cash charges of $63.3 million incurred in fiscal 2009 related to games that were cancelled as part of our business realignment, compared to $23.9 million incurred in fiscal 2008. The increase was also due to lower net sales on fiscal 2009 new releases as compared to fiscal 2008.
Cost of Sales—License Amortization and Royalties (in thousands)
| Year Ended March 31, 2009 |
% of net sales | Year Ended March 31, 2008 |
% of net sales | % change | ||||
|---|---|---|---|---|---|---|---|---|
| $83,066 | 10.0% | $99,524 | 9.7% | 16.5% | ||||
License amortization and royalties expense consists of royalty payments due to licensors, which are expensed at the higher of (1) the contractual royalty rate based on actual net product sales for such license, or (2) an effective rate based upon total projected revenue for such license. License amortization and royalties decreased on a dollar basis due to lower net sales from our portfolio of licensed products in fiscal 2009 as compared to fiscal 2008. Also, net sales of our licensed properties made up a smaller portion of our net sales mix in fiscal 2009 with approximately 66% of our net sales compared to fiscal 2008 with approximately 76% of our net sales. Although net sales of our licensed properties made up a smaller portion of our net sales mix, license amortization and royalties as a percentage of net sales increased slightly in fiscal 2009 as compared to fiscal 2008. This slight increase is primarily the result of overall higher license rates due to the performance of our licensed properties and contractual minimum license requirements, which results in a higher effective rate.
33
Cost of Sales—Venture Partner Expense (in thousands)
| Year Ended March 31, 2009 |
% of net sales | Year Ended March 31, 2008 |
% of net sales | % change | ||||
|---|---|---|---|---|---|---|---|---|
| $19,707 | 2.4% | $24,056 | 2.3% | 18.1% | ||||
Venture partner expense is related to the license agreement that the LLC joint venture, comprised of THQ and Jakks, had with WWE (see "Note 17—Settlement Agreements" in the notes to the consolidated financial statements included in Item 8). Venture partner expense decreased by $4.3 million in fiscal 2009 as compared to fiscal 2008. This decrease is due to an overall decrease in net sales of games based on the WWE license.
Product Development (in thousands)
| Year Ended March 31, 2009 |
% of net sales | Year Ended March 31, 2008 |
% of net sales | % change | ||||
|---|---|---|---|---|---|---|---|---|
| $109,201 | 13.2% | $128,869 | 12.5% | 15.3% | ||||
Product development expense primarily consists of expenses incurred by internal development studios and payments made to external development studios prior to products reaching technological feasibility. Product development expense decreased by $19.7 million in fiscal 2009 as compared to fiscal 2008. This decrease is primarily due to decreases in internal development spending resulting from the closure of several of our studios as part of our business realignment as well as an increase in spend on products that have reached technological feasibility. These decreases were partially offset by an increase in expense due to severance payments made to product development employees as part of our business realignment.
Selling and Marketing (in thousands)
| Year Ended March 31, 2009 |
% of net sales | Year Ended March 31, 2008 |
% of net sales | % change | ||||
|---|---|---|---|---|---|---|---|---|
| $162,183 | 19.5% | $175,288 | 17.0% | 7.5% | ||||
Selling and marketing expenses consist of advertising, promotional expenses, and sales and marketing personnel-related costs. In fiscal 2009, selling and marketing expenses decreased on a dollar basis by $13.1 million as compared to fiscal 2008. This decrease was primarily due to lower marketing spend on Smackdown vs. Raw 2009 in fiscal 2009 as compared to Smackdown vs. Raw 2008 in fiscal 2008 and high marketing spend in the fourth quarter of fiscal 2008 due to the launch of our owned intellectual property Frontlines: Fuel of War.
In fiscal 2009, selling and marketing expenses increased by 2.5 points as a percentage of net sales as compared to fiscal 2008. This increase is primarily due to a decrease in net sales primarily due to lower average selling prices in fiscal 2009 as compared to fiscal 2008 as well as fewer units shipped of our fiscal 2009 new releases as compared to fiscal 2008.
General and Administrative (in thousands)
| Year Ended March 31, 2009 |
% of net sales | Year Ended March 31, 2008 |
% of net sales | % change | ||||
|---|---|---|---|---|---|---|---|---|
| $76,884 | 9.3% | $69,901 | 6.8% | 10.0% | ||||
General and administrative expenses consist of personnel and related expenses of executive and administrative staff, as well as fees for professional services, such as legal and accounting services. General and administrative expenses increased by $7.0 million in fiscal 2009 as compared to fiscal 2008. The
34
increase was primarily due to $10.1 million additional bad debt expense in fiscal 2009 as compared to fiscal 2008 resulting from the bankruptcy of certain customers, partially offset by a decrease in employee related expenses.
Goodwill Impairment
In connection with the preparation of the fiscal 2009 third quarter financial statements, we performed an interim impairment test of goodwill at December 31, 2008 and recorded goodwill impairment charges of $118.8 million during fiscal 2009, representing the entire amount of our previously recorded goodwill.
Restructuring
Restructuring charges consist primarily of lease and other contact termination costs and asset impairments related to facility closures. Restructuring charges were $12.3 million in fiscal 2009. We had no restructuring charges in fiscal 2008.
Interest and Other Income (Expense), net
Interest and other income (expense), net, consists of interest earned on our investments as well as gains and losses resulting from exchange rate changes for transactions denominated in currencies other than the functional currency. Interest and other income (expense), net, decreased by $14.9 million in fiscal 2009 as compared to fiscal 2008. The decrease in fiscal 2009 was primarily due to the recognition of a $6.3 million other-than-temporary impairment loss on our investments, as well as lower average yields on a lower average investment balance in fiscal 2009 as compared to fiscal 2008.
Income Taxes
We recorded an income tax expense of $46.2 million for fiscal 2009 as compared to income tax benefit of $35.8 million for fiscal 2008. The income tax expense in fiscal 2009 reflects an effective tax rate of (12%), which is different than our statutory rate of 35%. The significant items that generated the variance between our effective tax rate and the statutory tax rate for fiscal 2009 were (i) recording of a valuation allowance against deferred tax assets, (ii) goodwill impairment, the majority of which is not tax deductible, (iii) fiscal 2009 research and development tax credits, and (iv) tax free interest income.
The income tax benefit for fiscal 2008 reflects an effective income tax rate of 49%, which is higher than our statutory rate of 35%. The significant items that generated the variance between our effective tax rate and the statutory tax rate for fiscal 2008 were (i) the partial release of the reserve on previous years' research and development tax credits, (ii) fiscal 2008 research and development tax credits, and (iii) tax free interest income.
Noncontrolling Interest
The noncontrolling interest of $0.3 million in fiscal 2009 reflects the loss allocable to equity interests in THQ*ICE LLC (a joint venture with ICE Entertainment formed in fiscal 2009). This noncontrolling interest reflects the loss allocable to equity interests that are not owned by THQ.
Discontinued Operations
In December 2006, we sold our 50% interest in Minick. As of December 31, 2008 we received $20.6 million in cash from the sale of Minick, and we recognized a gain of $2.1 million in the nine months ended December 31, 2008. The gain is presented as "Gain on sale of discontinued operations, net of tax" in our consolidated statement of operations. Pursuant to the Minick sale agreement, no additional consideration was outstanding as of June 30, 2008.
35
Liquidity and Capital Resources
(In thousands)
|
March 31, 2010 | March 31, 2009 | Change | ||||||||
|---|---|---|---|---|---|---|---|---|---|---|---|
Cash and cash equivalents |
$ | 188,378 | $ | 131,858 | $ | 56,520 | |||||
Short-term investments |
82,941 | 8,804 | 74,137 | ||||||||
Cash, cash equivalents and short-term investments |
$ | 271,319 | $ | 140,662 | $ | 130,657 | |||||
Percentage of total assets |
38 | % | 24 | % | |||||||
| |
Year Ended March 31, | |
|||||||||
|---|---|---|---|---|---|---|---|---|---|---|---|
(In thousands)
|
2010 | 2009 | Change | ||||||||
Cash provided by (used in) operating activities |
$ | 33,385 | $ | (194,174 | ) | $ | 227,559 | ||||
Cash provided by (used in) investing activities |
(69,784 | ) | 59,533 | (129,317 | ) | ||||||
Cash provided by financing activities |
86,418 | 33,954 | 52,464 | ||||||||
Effect of exchange rate changes on cash |
6,501 | (15,275 | ) | 21,776 | |||||||
Net increase (decrease) in cash and cash equivalents |
$ | 56,520 | $ | (115,962 | ) | $ | 172,482 | ||||
Our primary sources of liquidity are cash, cash equivalents, and short-term investments. Our principal source of cash is from sales of interactive software games designed for play on video game consoles, handheld devices and PCs, including via the Internet. Our principal uses of cash are for product purchases of discs and cartridges along with associated manufacturer's royalties, payments to external developers and licensors, the costs of internal software development, and selling and marketing expenses.
In fiscal 2010, our cash, cash equivalents and short-term investments increased by $130.7 million, from $140.7 million at March 31, 2009 to $271.3 million at March 31, 2010. The primary reasons for the increase were i) proceeds received from the August 4, 2009 issuance of the Notes (for further discussion of the Notes, see "Note 11—Convertible Senior Notes" in the notes to the consolidated financial statements included in Item 8), and ii) cash provided by our fiscal 2010 operating activities. The increase was partially offset by a payment of $32.8 million to Jakks, which was a settlement payment related to the preferred return rate arbitration and a payment of $13.2 million to WWE related to the settlement of our litigation with WWE. For further discussion of the settlement payment related to the preferred return rate arbitration, see "Note 6—Balance Sheet Details," and for further discussion of the settlement of our litigation with WWE, see "Note 17—Settlement Agreements," both in the notes to the consolidated financial statements included in Item 8.
In order to position the company for long-term growth, during fiscal 2011 we intend to use $75.0 to $100.0 million of our cash, cash equivalents and short-term investments, principally to fund additional product development and invest in additional licenses. Consistent with prior years, we expect to use cash in the first half of fiscal 2011 and to generate cash in the second half of fiscal 2011.
Cash Flow from Operating Activities. Cash provided by operating activities increased by $227.6 million in fiscal 2010, as compared to fiscal 2009. The increase in cash provided was primarily the result of our lower fiscal 2010 net loss as compared to fiscal 2009, adjusted for non-cash goodwill impairment and higher amortization of licenses and software development in fiscal 2009. Additionally, in fiscal 2010 we had lower investments in software development and licenses.
Cash Flow from Investing Activities. Cash used in investing activities increased by $129.3 million in fiscal 2010, as compared to fiscal 2009. The increase in cash used was primarily due to the investment of the proceeds from the issuance of the Notes in short-term securities and fewer sales and maturities of short-term securities.
Cash Flow from Financing Activities. Cash provided by financing activities increased by $52.5 million in fiscal 2010, as compared to fiscal 2009. The increase in cash provided was due to proceeds from the
36
issuance of the Notes on August 4, 2009, partially offset by net repayments under our secured credit lines in fiscal 2010, as compared to net borrowings in fiscal 2009. Borrowings under our secured credit lines relate to our auction rate securities ("ARS"); see "Note 3—Investment Securities" for further information related to our ARS and "Note 10—Secured Credit Lines" for further information on our secured credit lines, both in the notes to the consolidated financial statements included in Item 8.
Effect of exchange rate changes on cash. Changes in foreign currency translation rates increased our reported cash balance by $6.5 million.
Key Balance Sheet Accounts
Total current assets at March 31, 2010 were $562.5 million, up from $444.2 million at March 31, 2009. In addition to cash, cash equivalents and short-term investments, our current assets consist primarily of:
Accounts Receivable. Accounts receivable decreased by $19.1 million, from $60.4 million at March 31, 2009 to $41.3 million at March 31, 2010. Net accounts receivable was lower at the end of fiscal 2010, as compared to fiscal 2009, primarily due to the timing of our releases; Darksiders was released in the first week of our fiscal 2010 fourth quarter and thus a large percentage of accounts receivable for this title had been paid by March 31, 2010. Accounts receivable allowances were $77.5 million as of March 31, 2010, a $23.5 million decrease from March 31, 2009. Allowances for price protection and returns as a percentage of trailing nine month net sales were 10% and 11% as of March 31, 2010 and 2009, respectively. We believe our current reserves are adequate based on historical experience, inventory remaining in the retail channel and the rate of inventory sell-through in the retail channel.
Inventory. Inventory decreased by $11.8 million, from $25.8 million at March 31, 2009 to $14.0 million at March 31, 2010. The decrease in inventory was primarily due to the timing of product purchases and an effort to manage towards lower levels of inventory on hand. Inventory turns on a rolling twelve month basis were 12 and 8 at March 31, 2010 and 2009, respectively.
Licenses. Our investment in licenses, including the long-term portion, increased by $47.4 million, from $92.9 million at March 31, 2009 to $140.3 million at March 31, 2010. The increase was primarily due to the eight-year license agreement we entered into with WWE on December 22, 2009 and multi-property agreements with DreamWorks Animation and Sony Pictures Consumer Products. This increase is also reflected within accrued and other current liabilities as well as other long-term liabilities in the consolidated balance sheet at March 31, 2010.
Software Development. Capitalized software development, including the long-term portion, decreased by $3.5 million, from $162.5 million at March 31, 2009 to $159.0 million at March 31, 2010. Approximately 82% of the software development asset balance at March 31, 2010 is for games that have expected release dates in fiscal 2011 and beyond.
Total current liabilities at March 31, 2010, were $190.9 million, down from $254.6 million at March 31, 2009. Current liabilities consist primarily of:
Accounts Payable. Accounts payable increased by $0.2 million, from $40.1 million at March 31, 2009 to $40.3 million at March 31, 2010.
Accrued and Other Current Liabilities. Accrued and other current liabilities decreased by $52.8 million, from $190.1 million at March 31, 2009 to $137.3 million at March 31, 2010. The decrease was primarily due to the settlement agreement we entered into with Jakks, which established the preferred payment rate to Jakks for WWE video games sold under a license granted by WWE for the period beginning July 1, 2006 and ending December 31, 2009, at a rate 40% lower than the previous contract rate. As a result of establishing the preferred payment rate for the period under dispute, we revised our previous estimate, which resulted in a one-time reduction in accrued venture partner expense of $24.2 million. In addition,
37
during the three months ended September 30, 2009, we paid Jakks $33.5 million, which we had previously not paid, pending the settlement of the preferred return rate matter (for additional information see "Note 6—Balance Sheet Details" in the notes to the consolidated financial statements included in Item 8).
Secured Credit Lines. Secured credit lines decreased by $11.2 million, from $24.4 million at March 31, 2009 to $13.2 million at March 31, 2010 due to net repayments of borrowings under our margin account with Wells Fargo and our line of credit with UBS. Borrowings under our secured credit lines relate to our ARS; see "Note 3—Investment Securities" for further information related to our ARS and "Note 10—Secured Credit Lines" for further information on our secured credit lines, both in the notes to the consolidated financial statements included in Item 8.
Our liabilities at March 31, 2010 also consisted of:
Other long-term liabilities. Other long-term liabilities increased by $65.3 million, from $33.5 million at March 31, 2009 to $98.8 million at March 31, 2010. The increase was primarily due to the eight-year license agreement we entered into with WWE on December 22, 2009 and multi-property agreements with DreamWorks Animation and Sony Pictures Consumer Products. Also contributing to the increase is a portion of the consideration payable to Jakks related to the agreement that terminated the LLC operating agreement (see "Note 17—Settlement Agreements" in the notes to the consolidated financial statements included in Item 8).
Convertible Senior Notes. We issued the Notes on August 4, 2009 (see "Note 11—Convertible Senior Notes" in the notes to the consolidated financial statements included in Item 8).
Inflation
Our management currently believes that inflation has not had, and does not currently have, a material impact on continuing operations.
Financial Condition
At March 31, 2010, we held cash, cash equivalents, short-term investments, and short term investments—pledged, net of borrowings on secured credit lines, of $280.8 million. We believe that this amount will be sufficient to meet our operating requirements for at least the next twelve months, including working capital requirements and contractual obligations, capital expenditures, and potential future acquisitions or strategic investments.
In June 2009, we entered into a Loan and Security Agreement (the "Credit Facility") with Bank of America, N.A. ("B of A"), as agent, and the lenders party thereto from time to time. The Credit Facility provides for a $35.0 million revolving credit facility, which can be increased to $50.0 million, subject to lender consent, pursuant to a $15.0 million accordion feature, and includes a $15.0 million letter of credit subfacility. See "Note 12—Credit Facility" in the notes to the consolidated financial statements included in Item 8 for additional information regarding the Credit Facility. We may use the Credit Facility to provide us with working capital and cash for other corporate purposes; however, our ability to borrow, and the lenders' obligation to lend, under the Credit Facility is subject to our compliance with certain terms and conditions, including a requirement that we meet a minimum fixed charge coverage ratio. The borrowing capacity under the Credit Facility fluctuates based upon our levels of U.S. accounts receivable, subject to standard deductions and reserves. As of March 31, 2010 we had no borrowings under the Credit Facility and $35.0 million of available borrowing capacity.
On August 4, 2009 we issued the Notes (see "Note 11—Convertible Senior Notes" in the notes to the consolidated financial statements included in Item 8). After offering costs, the net proceeds to us were $96.8 million. The Notes are due August 15, 2014, unless earlier converted, redeemed or repurchased. The Notes pay interest semiannually, in arrears on February 15 and August 15 of each year, beginning
38
February 15, 2010, through maturity and are convertible at each holder's option at any time prior to the close of business on the trading day immediately preceding the maturity date. In fiscal 2010 we paid $2.7 million in interest on the Notes and absent any conversions, we expect to pay $5.0 million in each of the fiscal years 2011 through 2014 and $2.5 million in fiscal 2015, for an aggregate of $25.2 million in interest payments over the term of the Notes. The Notes are our unsecured and unsubordinated obligations. The Notes will be redeemable, in whole or in part, at our option, at any time after August 20, 2012 for cash, at a redemption price of 100% of the principal amount of the Notes, plus accrued but unpaid interest, if the price of a share of our common stock has been at least 150% of the conversion price then in effect for specified periods. In the case of certain events such as acquisition or liquidation of THQ, or delisting of our common stock from a U.S. national securities exchange, holders may require us to repurchase all or a portion of the Notes for cash at a purchase price of 100% of the principal amount of the Notes, plus accrued and unpaid interest.
At March 31, 2010, we had $82.9 million of short-term available-for-sale investments and $1.9 million of long-term available-for-sale investments. We classified certain of these investments as long-term to reflect the lack of liquidity of these securities. In addition, we had $21.0 million of short-term, pledged trading securities.
Our ability to maintain sufficient liquidity could be affected by various risks and uncertainties described in "Part II—Item 1A. Risk Factors." We may choose at any time to raise or borrow additional capital to strengthen our cash position, facilitate expansion, pursue strategic investments or to take advantage of business opportunities as they arise.
Contractual Obligations
Guarantees and Commitments
A summary of annual minimum contractual obligations and commercial commitments as of March 31, 2010 is as follows (in thousands):
| |
Contractual Obligations and Commercial Commitments(6) | ||||||||||||||||||
|---|---|---|---|---|---|---|---|---|---|---|---|---|---|---|---|---|---|---|---|
Fiscal Years Ending March 31, |
License / Software Development Commitments(1) |
Advertising(2) | Leases(3) | Debt(4) | Other(5) | Total | |||||||||||||
2011 |
$ | 112,478 | $ | 5,798 | $ | 14,905 | $ | 13,249 | $ | 6,653 | $ | 153,083 | |||||||
2012 |
59,963 | 14,207 | 14,209 | — | 6,582 | 94,961 | |||||||||||||
2013 |
16,600 | 2,676 | 11,217 | — | 4,000 | 34,493 | |||||||||||||
2014 |
12,000 | 1,325 | 10,043 | — | 4,000 | 27,368 | |||||||||||||
2015 |
10,000 | 577 | 8,850 | 100,000 | — | 119,427 | |||||||||||||
Thereafter |
22,500 | 1,000 | 11,560 | — | — | 35,060 | |||||||||||||
|
$ | 233,541 | $ | 25,583 | $ | 70,784 | $ | 113,249 | $ | 21,235 | $ | 464,392 | |||||||
- (1)
- Licenses and Software Development. We enter into contractual arrangements with third parties for the rights to exploit intellectual property and for the development of products. Under these agreements, we commit to provide specified payments to an intellectual property holder or developer. Assuming all contractual provisions are met, the total future minimum contract commitments for such agreements in place as of March 31, 2010 are $233.5 million. License/software development commitments in the table above include $111.2 million of commitments to licensors/developers that are included in our consolidated balance sheet as of March 31, 2010 because the licensors do not have any significant performance obligations to us. These commitments were included in both current and long-term licenses and accrued royalties/current and long-term software development and accrued liabilities.
39
- (2)
- Advertising. We have certain minimum advertising commitments under most of our major license
agreements. These minimum commitments generally range from 2% to 12% of net sales related to the respective license.
- (3)
- Leases. We are committed under operating leases with lease termination dates through 2020. Most
of our leases contain rent escalations. Of these obligations, $1.6 million and $0.8 million are accrued and classified as accrued and other current liabilities and other
long-term liabilities, respectively, in the March 31, 2010 consolidated balance sheet due to abandonment of certain lease obligations in connection with our fiscal 2009 business
realignment. We expect to receive $0.8 million, $0.4 million, $0.2 million in sublease rental income in fiscal 2011, fiscal 2012, and fiscal 2013, respectively, under
non-cancelable sublease agreements. Rent expense was $13.9 million, $15.9 million, and $16.1 million for fiscal years 2010, 2009, and 2008, respectively.
- (4)
- Secured Credit Lines. In fiscal 2009, we obtained a credit line with UBS related to our
portfolio of ARS held by UBS. We had $13.2 million in borrowings outstanding on the UBS credit line at March 31, 2010 (see "Note 10—Secured Credit Lines").
Convertible Senior Notes. On August 4, 2009 we issued the Notes. The Notes pay interest semiannually, in arrears on February 15 and August 15 of each year, beginning February 15, 2010, through maturity and are convertible at each holder's option at any time prior to the close of business on the trading day immediately preceding the maturity date. In fiscal 2010 we paid $2.7 million in interest on the Notes and absent any conversions, we expect to pay $5.0 million in each of the fiscal years 2011 through 2014 and $2.5 million in fiscal 2015, for an aggregate of $25.2 million in interest payments over the term of the Notes (see "Note 11—Convertible Senior Notes" in the notes to the consolidated financial statements in Item 8).
- (5)
- Other. As discussed more fully in "Note 17—Settlement Agreements" in the
notes to the consolidated financial statements included in Item 8, the amounts payable to Jakks totaling $20.0 million are reflected in the table above. The present value of these
amounts is included in other current liabilities and other long-term liabilities in our consolidated balance sheet at March 31, 2010. The remaining other commitments included in the
table above are also included as current or long-term liabilities in our March 31, 2010 consolidated balance sheet.
- (6)
- We have omitted unrecognized tax benefits from this table due to the inherent uncertainty regarding the timing and amount of certain payments related to these unrecognized tax benefits. The underlying positions have not been fully developed under audit to quantify at this time. At March 31, 2010, we had $6.0 million of unrecognized tax benefits. See "Note 19—Income Taxes" in the notes to the consolidated financial statements included in Item 8 for further information regarding the unrecognized tax benefits.
Manufacturer Indemnification. We must indemnify the platform manufacturers (Microsoft, Nintendo, Sony) of our games with respect to all loss, liability and expenses resulting from any claim against such manufacturer involving the development, marketing, sale or use of our games, including any claims for copyright or trademark infringement brought against such manufacturer. As a result, we bear a risk that the properties upon which the titles of our games are based, or that the information and technology licensed from others and incorporated into the products, may infringe the rights of third parties. Our agreements with our third-party software developers and property licensors typically provide indemnification rights for us with respect to certain matters. However, if a manufacturer brings a claim against us for indemnification, the developers or licensors may not have sufficient resources to, in turn, indemnify us.
Indemnity Agreements. We have entered into indemnification agreements with the members of our Board of Directors, our Chief Executive Officer and our Chief Financial Officer, to provide a contractual right of indemnification to such persons to the extent permitted by law against any and all liabilities, costs,
40
expenses, amounts paid in settlement and damages incurred by any such person as a result of any lawsuit, or any judicial, administrative or investigative proceeding in which such person is sued as a result of service as a member of our Board of Directors, as Chief Executive Officer or as Chief Financial Officer. The indemnification agreements provide specific procedures and time frames with respect to requests for indemnification and clarify the benefits and remedies available to the indemnitees in the event of an indemnification request.
Critical Accounting Estimates
The Management's Discussion and Analysis of Financial Condition and Results of Operations discusses our consolidated financial statements, which have been prepared in accordance with accounting principles generally accepted in the United States of America. The preparation of these consolidated financial statements requires management to make estimates and assumptions that affect the reported amounts of assets and liabilities and the disclosure of contingent assets and liabilities at the date of the consolidated financial statements and the reported amounts of net sales and expenses during the reporting period. The estimates discussed below are considered by management to be critical because they are both important to the portrayal of our financial condition and results of operations and because their application places the most significant demands on management's judgment, with financial reporting results relying on estimates about the effect of matters that are inherently uncertain. Specific risks for these critical accounting estimates are described in the following paragraphs. For all of these estimates, we caution that actual results may differ materially from these estimates under different assumptions or conditions.
Accounts receivable allowances. We derive revenue from sales of packaged software for video game systems and PCs and sales of content and services over the Internet and for wireless devices. Product sales are recognized net of allowances for price protection and returns and various customer discounts. We typically only allow returns for our PC products; however, we may decide to provide price protection or allow returns for our video games after we analyze: (i) inventory remaining in the retail channel, (ii) the rate of inventory sell-through in the retail channel, and (iii) our remaining inventory on hand. We maintain a policy of giving credits for price protection and returns, but do not give cash refunds. We use significant judgment and make estimates in connection with establishing allowances for price protection, returns, and doubtful accounts in any accounting period. Included in our accounts receivable allowances is our allowance for co-operative advertising that we engage in with our retail channel partners. Our co-operative advertising allowance is based upon specific contractual commitments and does not involve estimates made by management.
We establish sales allowances based on estimates of future price protection and returns with respect to current period product sales. We analyze historical price protection granted, historical returns, current sell-through of retailer and distributor inventory of our products, current trends in the video game industry and the overall economy, changes in customer demand and acceptance of our products, and other related factors when evaluating the adequacy of the price protection and returns allowance. In addition, we monitor the volume of our sales to retailers and distributors and their inventories, because slow-moving inventory in the distribution channel can result in the requirement for price protection or returns in subsequent periods. Actual price protection and returns in any future period are uncertain. While we believe we can make reliable estimates for these matters, if we changed our assumptions and estimates, our price protection and returns reserves would change, which would impact the net sales we report. In addition, if actual price protection and returns were significantly greater than the reserves we have established, the actual results of our reported net sales would decrease. Conversely, if actual price protection and returns were significantly less than our reserves, our reported net sales would increase. In circumstances when we do not have a reliable basis to estimate returns and price protection or are unable to determine that collection of a receivable is probable, we defer the sale until such time as we can reliably estimate any related returns and allowances and determine that collection of the receivable is probable.
41
Similarly, we must use significant judgment and make estimates in connection with establishing allowances for doubtful accounts in any accounting period. We analyze customer concentrations, customer credit-worthiness and current economic trends when evaluating the adequacy of the allowance for doubtful accounts. Material differences may result in the amount and timing of our bad debt expense for any period if we made different judgments or utilized different estimates. If our customers experience financial difficulties and are not able to meet their ongoing financial obligations to us, our results of operations may be adversely impacted.
Licenses. Minimum guaranteed royalty payments for intellectual property licenses are initially recorded on our balance sheet as an asset (licenses) and as a liability (accrued royalties) at the contractual amount upon execution of the contract if no significant performance obligation remains with the licensor. When a significant performance obligation remains with the licensor, we record royalty payments as an asset (licenses) and as a liability (accrued royalties) when payable rather than upon execution of the contract. Royalty payments for intellectual property licenses are classified as current assets and current liabilities to the extent such royalty payments relate to anticipated product sales during the subsequent year and long-term assets and long-term liabilities if such royalty payments relate to anticipated product sales after one year.
We evaluate the future recoverability of our capitalized licenses on a quarterly basis. The recoverability of capitalized license costs is evaluated based on the expected performance of the specific products in which the licensed trademark or copyright is to be used. As many of our licenses extend for multiple products over multiple years, we also assess the recoverability of capitalized license costs based on certain qualitative factors such as the success of other products and/or entertainment vehicles utilizing the intellectual property, whether there are any future planned theatrical releases or television series based on the intellectual property and the rights holder's continued promotion and exploitation of the intellectual property. Prior to the related product's release, we expense, as part of cost of sales—license amortization and royalties, capitalized license costs when we estimate such amounts are not recoverable.
Licenses are expensed to cost of sales—license amortization and royalties at the higher of (i) the contractual royalty rate based on actual net product sales related to such license, or (ii) an effective rate based upon total projected net sales related to such license. When, in management's estimate, future cash flows will not be sufficient to recover previously capitalized costs, we expense these capitalized costs to cost of sales—license amortization and royalties. If actual net sales or revised forecasted net sales fall below the initial forecasted net sales for a particular license, the charge to cost of sales—license amortization and royalties expense may be larger than anticipated in any given quarter. At March 31, 2010, the net carrying value of our licenses was $140.3 million and is reflected as "Licenses" and "Licenses, net of current portion" in the consolidated financial statements included in Item 8. Additionally, as of March 31, 2010 we had commitments of $122.3 million that are not reflected in our consolidated financial statements due to remaining performance obligations of the licensor. If we were required to impair these licenses, due to changes in market conditions or product acceptance, our results of operations could be materially adversely affected.
Software Development. We utilize both internal development teams and third-party software developers to develop our software. We capitalize software development costs once technological feasibility is established and we determine that such costs are recoverable against future net sales. We evaluate technological feasibility on a product-by-product basis. For products where proven game engine technology exists, the establishment of technological feasibility may occur early in the development cycle. We capitalize the milestone payments made to third-party software developers and the direct payroll and overhead costs for our internal development teams. Amounts related to software development for which technological feasibility is not yet met are charged as incurred to product development expense in our consolidated statements of operations.
42
On a quarterly basis, we compare our unamortized software development costs to net realizable value, on a product-by-product basis. The amount by which any unamortized software development costs exceed their net realizable value is charged to cost of sales—software amortization and royalties. The net realizable value is the estimated future net sales from the product, reduced by the estimated future direct costs associated with the product such as completion costs, cost of sales and advertising.
Commencing upon product release, capitalized software development costs are amortized to cost of sales—software amortization and royalties based on the ratio of current gross sales to total projected gross sales. In fiscal 2010, we recorded $10.8 million of additional amortization expense related to the cancellation of certain games. As of March 31, 2010, the net carrying value of our software development was $159.0 million.
The milestone payments made to our third-party developers during their development of our games are typically considered non-refundable advances against the total compensation they can earn based upon the sales performance of the products. Any additional compensation earned beyond the milestone payments is expensed to cost of sales—software amortization and royalties as earned. Additionally, we have a studio bonus plan that allows for our internal product development staff to participate in the success of the games they develop. As certain performance targets are reached, any additional compensation earned under the studio bonus plan is expensed to cost of sales—software amortization and royalties.
Revenue Recognition. We recognize net sales for packaged software when title and risk of loss transfers to the customer, provided that we have no significant remaining support obligations and that collection of the resulting receivable is deemed probable by management. Certain products are sold to customers with a street date (the earliest date these products may be sold by retailers). For these products we recognize net sales on the later of the street date or the sale date.
Some of our packaged software products are developed with the ability to be connected to, and played via, the Internet. In order for consumers to participate in online communities and play against one another via the Internet, we (either directly or through outsourced arrangements with third parties) maintain servers that support an online service we provide to consumers for activities such as matchmaking, roster updates, tournaments and player rankings. Generally, we do not consider the online service to be a deliverable as it is incidental to the overall product offering. Accordingly, we do not defer any net sales related to products containing the limited online service.
In instances where the online service is considered a deliverable and where we have significant continuing involvement in addition to the software product, we account for the sale as a "bundled" sale, or multiple element arrangement, in which we sell both the packaged software product and the online service for one combined price. Vendor specific objective evidence for the fair value of the online service does not exist as we have not separately offered or charged for the online service. Therefore, when the online service is determined to be a deliverable, we recognize the revenue from sales of such software products ratably over the estimated online service period of six months, beginning the month after shipment of the software product. Costs of sales related to such products are also deferred and recognized with the related net sales and include product costs, software amortization and royalties, and license amortization and royalties. At March 31, 2010 the deferred revenue related to these games was $1.4 million and is included within accrued and other current liabilities in our consolidated balance sheet.
Determining whether the online service for a particular game constitutes a deliverable is subjective and requires management's judgment. Determining the estimated service period over which to recognize the related net sales and costs of sales is also subjective and involves management's judgment.
Although we generally sell our products on a no-return basis, in certain circumstances we may allow price protection, returns or other allowances on a negotiated basis. We estimate such price protection, returns or other allowances based upon management's evaluation of our historical experience, retailer inventories, the nature of the titles and other factors. Such estimates are deducted from gross sales. See "Note 5—
43
Accounts Receivable Allowances" in the notes to the consolidated financial statements included in Item 8. Software is sold under a limited 90-day warranty against defects in material and workmanship. To date, we have not experienced material warranty claims.
Stock-based compensation. We estimate the fair value of stock options and our employee stock purchase plan on date of grant using the Black-Scholes option pricing model which requires the input of subjective assumptions, including the expected volatility of our common stock and an option's expected life. The fair value of our restricted stock and restricted stock units is determined based on the closing trading price of our common stock on the grant date. The amount of expense recognized represents the expense associated with the stock-based awards we expect to ultimately vest based upon an estimated rate of forfeitures. Our estimate of forfeitures is based on historical forfeiture behavior as well as any expected trends in future forfeiture behavior; this rate of forfeitures is updated as necessary and any adjustments needed to recognize the fair value of options that actually vest or are forfeited are recorded. The fair value for awards that are expected to vest is then amortized on a straight-line basis over the requisite service period of the award, which is generally the option vesting term. As a result, the financial statements include amounts that are based upon our best estimates and judgments relating to the expenses recognized for stock-based compensation.
Income taxes. The provision for income taxes is computed using the asset and liability method, under which deferred income tax assets and liabilities are measured using the currently enacted tax rates that apply to taxable income in effect for the years in which those tax assets are expected to be realized or settled. To the extent recovery of deferred tax assets is not likely based on our estimates of future taxable income in each jurisdiction, a valuation allowance is established. As part of the process of preparing our consolidated financial statements, we are required to estimate our income taxes in each of the jurisdictions in which we operate. This process involves: (i) estimating our current tax exposure in each jurisdiction including the impact, if any, of changes or interpretations to applicable tax laws and regulations, (ii) estimating additional taxes resulting from tax examinations and (iii) making judgments regarding the recoverability of deferred tax assets.
The calculation of our tax liabilities involves dealing with uncertainties in the application of complex tax regulations. We recognize liabilities for anticipated tax audit issues in the U.S. and other tax jurisdictions based on our estimate of whether, and the extent to which, additional taxes will be due. Our estimate for the potential outcome for any uncertain tax issue, including our claims for research and development income tax credits, requires judgment. We believe we have adequately provided for any reasonably foreseeable outcome related to these matters. However, our future results may include favorable or unfavorable adjustments to our estimated tax liabilities in the period in which they are resolved or when statutes of limitation on potential assessments expire. We recognize the financial statement benefit of a tax position only after determining that the relevant tax authority would more likely than not sustain the position following an audit. For tax positions meeting the "more likely than not" threshold, the amount recognized in the financial statements is the largest benefit that has a greater than 50% likelihood of being realized upon ultimate settlement with the relevant tax authority.
Recently Issued Accounting Pronouncements
In December 2007, the Financial Accounting Standards Board ("FASB") issued Statement of Financial Accounting Standards ("SFAS") No. 160 (Accounting Standards Codification ("ASC") Topic 810), "Noncontrolling Interests in Consolidated Financial Statements" ("FAS 160"). This Statement amends Accounting Research Bulletin ("ARB") No. 51, "Consolidated Financial Statements" to establish accounting and reporting standards for the noncontrolling interest in a subsidiary and for the deconsolidation of a subsidiary. It clarifies that a noncontrolling interest in a subsidiary is an ownership interest in the consolidated entity that should be reported as equity in the consolidated financial statements. FAS 160 is effective for fiscal years and interim periods within those fiscal years, beginning on or after December 15, 2008. We adopted this statement on April 1, 2009. The presentation and disclosure
44
requirements of FAS 160 were applied retrospectively. Other than the change in presentation of noncontrolling interests, the adoption of FAS 160 had no impact on our results of operations, financial position or cash flows.
In June 2009, the FASB issued SFAS No. 166 (ASC Topic 860), "Accounting for Transfers of Financial Assets—an amendment to FASB Statement No. 140," ("FAS 166"). The purpose of FAS 166 is to improve the relevance, representational faithfulness, and comparability of the information that a reporting entity provides in its financial statements about a transfer of financial assets; the effects of a transfer on its financial position, financial performance, and cash flows; and a transferor's continuing involvement, if any, in transferred financial assets. FAS 166 is effective at the start of a company's first fiscal year beginning after November 15, 2009, which will be our fiscal year 2011. The adoption did not have a material impact on our results of operations, financial position or cash flows.
In June 2009, the FASB issued SFAS No. 167 (ASC Topic 810), "Amendments to FASB Interpretation No. 46(R)," ("FAS 167"). The purpose of FAS 167 is to improve financial reporting by enterprises involved with variable interest entities. FAS 167 is effective at the start of a company's first fiscal year beginning after November 15, 2009, or January 1, 2010 for companies reporting earnings on a calendar-year basis, which will be our fiscal year 2011. Our adoption of this pronouncement on April 1, 2010 did not have a material impact on our results of operations, financial position or cash flows. In December 2009, the FASB issued ASU 2009-17, "Consolidations (Topic 810)—Improvements to Financial Reporting by Enterprises Involved with Variable Interest Entities," which codified FAS 167.
In October 2009, the FASB issued ASU 2009-13, "Revenue Recognition (Topic 605): Multiple-Deliverable Revenue Arrangements—a consensus of the FASB Emerging Issues Task Force" ("ASU 2009-13"). ASU 2009-13 provides criteria for separating consideration in multiple-deliverable arrangements. It establishes a selling price hierarchy for determining the price of a deliverable and expands the disclosures related to a vendor's multiple-deliverable revenue arrangements. ASU 2009-13 is effective prospectively for arrangements entered into or materially modified in years beginning after June 15, 2010, which will be our fiscal 2012. We are still evaluating the impact that the adoption of ASU 2009-13 will have on our results of operations, financial position or cash flows.
In January 2010, the FASB issued ASU 2010-02, "Consolidation (Topic 810): Accounting and Reporting for Decreases in Ownership of a Subsidiary" ("ASU 2010-02"). This amendment to Topic 810 clarifies, but does not change, the scope of current US GAAP. It clarifies the decrease in ownership provisions of Subtopic 810-10 and removes the potential conflict between guidance in that Subtopic and asset derecognition and gain or loss recognition guidance that may exist in other US GAAP. An entity will be required to follow the amended guidance beginning in the period that it first adopts FAS 160 (now included in Subtopic 810-10). For those entities that have already adopted FAS 160, the amendments are effective at the beginning of the first interim or annual reporting period ending on or after December 15, 2009, which will be our quarter ending March 31, 2010. The amendments should be applied retrospectively to the first period that an entity adopted FAS 160. Our adoption of this pronouncement did not have a material impact on our results of operations, financial position or cash flows.
In January 2010, the FASB issued ASU 2010-06, "Fair Value Measurements and Disclosures (Topic 820): Improving Disclosures about Fair Value Measurements" ("ASU 2010-06"). ASU 2010-06 amends ASC 820 and clarifies and provides additional disclosure requirements related to recurring and non-recurring fair value measurements and employers' disclosures about postretirement benefit plan assets. ASU 2010-06 is effective for interim and annual reporting periods beginning after December 15, 2009, which was our quarter ending March 31, 2010. Our adoption of this pronouncement did not have a material impact on our results of operations, financial position or cash flows. Disclosures about purchases, sales, issuances, and settlements in the roll forward activity in Level 3 fair value measurements are effective for fiscal years beginning after December 15, 2010, and for interim periods within those fiscal years, which will be our
45
quarter ending June 30, 2011. The adoption is not expected to have a material impact on our results of operations, financial position or cash flows.
Item 7A. Quantitative and Qualitative Disclosures About Market Risk
Market Risk
We are exposed to certain market risks arising from transactions in the normal course of business, principally risks associated with interest rate and foreign currency fluctuations. Market risk is the potential loss arising from changes in market rates and market prices. We employ established policies and practices to manage these risks. We use foreign exchange option and forward contracts to hedge anticipated exposures or mitigate some existing exposures subject to foreign currency exchange rate risk as discussed below. We do not enter into derivatives or other financial instruments for trading or speculative purposes.
Interest Rate Risk
We have interest rate risk primarily related to our investment portfolio. At March 31, 2010, our $188.4 million of cash and cash equivalents were comprised of cash and time deposits, money market funds, negotiable certificates of deposit, corporate securities, and municipal securities; $51.2 million of our cash equivalents are classified as trading securities (specifically the negotiable certificates of deposit, corporate securities, and municipal securities). At March 31, 2010, our $82.9 million of short-term investments included $17.2 million of municipal securities, $64.4 million of corporate securities, and $1.3 million of negotiable certificates of deposit; our long-term investments of $1.9 million consisted entirely of municipal securities. Our March 31, 2010 short-term and long-term investments were classified as available-for-sale. Additionally, we had $21.0 million in trading auction rate securities classified as short-term investments, pledged, at March 31, 2010. We manage our interest rate risk by maintaining an investment portfolio generally consisting of debt instruments of high credit quality and relatively short maturities. However, because short-term investments mature relatively quickly and are generally reinvested at the then current market rates, interest income on a portfolio consisting of cash equivalents and short-term investments is more subject to market fluctuations than a portfolio of longer term investments. The value of these investments may fluctuate with changes in interest rates, however, the contractual terms of the investments do not permit the issuer to call, prepay or otherwise settle the investments at prices less than the stated par value.
We had no outstanding letters of credit at March 31, 2010.
Foreign Currency Exchange Rate Risk
We transact business in many different foreign currencies and are exposed to financial market risk resulting from fluctuations in foreign currency exchange rates, particularly the GBP and the Euro, which may result in a gain or loss of earnings to us. Our international business is subject to risks typical of an international business, including, but not limited to, foreign currency exchange rate volatility. Accordingly, our future results could be materially and adversely affected by changes in foreign currency exchange rates. Throughout the year, we frequently monitor the volatility of the GBP and the Euro (and all other applicable currencies).
Cash Flow Hedging Activities. From time to time, we hedge a portion of our foreign currency risk related to forecasted foreign currency denominated sales and expense transactions by entering into foreign exchange forward contracts that generally have maturities less than 90 days. Our hedging programs reduce, but do not entirely eliminate, the impact of currency exchange rate movements in net sales and operating expenses. During fiscal 2010, we entered into foreign exchange forward contracts, related to cash flow hedging activities, in the notional amount of $29.2 million. These contracts were settled during fiscal 2010 and resulted in a loss of $0.7 million, which is included in interest and other income (expense), net in our consolidated statements of operations.
46
Balance Sheet Hedging Activities. We utilize foreign exchange forward contracts to mitigate foreign currency risk associated with foreign currency-denominated assets and liabilities, primarily certain inter-company receivables and payables. Our foreign exchange forward contracts are not designated as hedging instruments and are accounted for as derivatives whereby the fair value of the contracts are reported as other current assets or other current liabilities in our consolidated balance sheets, and the associated gains and losses from changes in fair value are reported in interest and other income (expense), net in the consolidated statements of operations. The forward contracts generally have a contractual term of one month or less and are transacted near month-end. Therefore, the fair value of the forward contracts generally is not significant at each month-end.
At March 31, 2010, we had foreign exchange forward contracts related to balance sheet hedging activities in the notional amount of $90.1 million with a fair value that approximates zero. All of the contracts had maturities of one month and consisted primarily of Euro, GBP, CAD, and AUD. The net gain recognized from these contracts during fiscal 2010 was $4.8 million and is included in interest and other income (expense), net in our consolidated statement of operations.
Foreign exchange forward contracts are designed to offset gains and losses on the underlying foreign currency denominated assets and liabilities. Any movement in foreign currency exchange rates resulting in a gain or loss on our foreign exchange forward contracts are offset by an opposing gain or loss in the underlying foreign currency denominated assets and liabilities that were hedged and would not have a material impact on our financial position.
The counterparties to these forward contracts are creditworthy multinational commercial or investment banks. The risks of counterparty non-performance associated with these contracts are not considered to be material. Notwithstanding our efforts to manage foreign exchange risks, there can be no assurances that our mitigating or hedging activities will adequately protect us against the risks associated with foreign currency fluctuations.
We do not hedge foreign currency translation risk. A hypothetical 10% adverse change in foreign currency translation rates would result in a reduction of reported net sales of approximately $34.0 million and an increase in reported loss from continuing operations before income taxes of approximately $1.6 million for fiscal 2010. A hypothetical 10% adverse change in foreign currency translation rates would result in a reduction of reported total assets of approximately $13.3 million. These estimates assume an adverse shift in all foreign currency exchange rates, which do not always move in the same direction; actual results may differ materially.
Item 8. Consolidated Financial Statements and Supplementary Data
The report of Independent Registered Public Accounting Firm, consolidated financial statements and notes to consolidated financial statements follow below.
47
REPORT OF INDEPENDENT REGISTERED PUBLIC ACCOUNTING FIRM
To
the Board of Directors and Stockholders of THQ Inc.,
Agoura Hills, California
We have audited the accompanying consolidated balance sheets of THQ Inc. and subsidiaries (the "Company") as of April 3, 2010 and March 28, 2009, and the related consolidated statements of operations, total equity and cash flows for each of the years in the three-year period ended April 3, 2010. These financial statements are the responsibility of the Company's management. Our responsibility is to express an opinion on these financial statements based on our audits.
We conducted our audits in accordance with the standards of the Public Company Accounting Oversight Board (United States). Those standards require that we plan and perform the audit to obtain reasonable assurance about whether the financial statements are free of material misstatement. An audit includes examining, on a test basis, evidence supporting the amounts and disclosures in the financial statements. An audit also includes assessing the accounting principles used and significant estimates made by management, as well as evaluating the overall financial statement presentation. We believe that our audits provide a reasonable basis for our opinion.
In our opinion, such consolidated financial statements present fairly, in all material respects, the financial position of THQ Inc. and subsidiaries as of April 3, 2010 and March 28, 2009, and the results of their operations and their cash flows for each of the years in the three-year period ended April 3, 2010, in conformity with accounting principles generally accepted in the United States of America.
We have also audited, in accordance with the standards of the Public Company Accounting Oversight Board (United States), the Company's internal control over financial reporting as of April 3, 2010, based on the criteria established in Internal Control—Integrated Framework issued by the Committee of Sponsoring Organizations of the Treadway Commission and our report dated June 4, 2010 expressed an unqualified opinion on the Company's internal control over financial reporting.
/s/ DELOITTE & TOUCHE LLP
Los Angeles, California
June 4, 2010
48
THQ INC. AND SUBSIDIARIES
CONSOLIDATED BALANCE SHEETS
(In thousands, except share data)
| |
March 31, 2010 |
March 31, 2009 |
|||||||
|---|---|---|---|---|---|---|---|---|---|
ASSETS |
|||||||||
Current assets: |
|||||||||
Cash and cash equivalents |
$ | 188,378 | $ | 131,858 | |||||
Short-term investments |
82,941 | 8,804 | |||||||
Cash, cash equivalents and short-term investments |
271,319 | 140,662 | |||||||
Short-term investments, pledged |
22,774 | — | |||||||
Accounts receivable, net of allowances |
41,318 | 60,444 | |||||||
Inventory |
13,970 | 25,785 | |||||||
Licenses |
56,555 | 45,025 | |||||||
Software development |
132,223 | 137,820 | |||||||
Deferred income taxes |
5,590 | 6,112 | |||||||
Income taxes receivable |
4,914 | 903 | |||||||
Prepaid expenses and other current assets |
13,864 | 27,441 | |||||||
Total current assets |
562,527 | 444,192 | |||||||
Property and equipment, net |
28,374 | 33,511 | |||||||
Licenses, net of current portion |
83,752 | 47,875 | |||||||
Software development, net of current portion |
26,792 | 24,647 | |||||||
Deferred income taxes |
433 | 1,982 | |||||||
Long-term investments |
1,851 | 5,025 | |||||||
Long-term investments, pledged |
— | 30,618 | |||||||
Other long-term assets, net |
10,600 | 10,479 | |||||||
TOTAL ASSETS |
$ | 714,329 | $ | 598,329 | |||||
LIABILITIES AND EQUITY |
|||||||||
Current liabilities: |
|||||||||
Accounts payable |
$ | 40,305 | $ | 40,088 | |||||
Accrued and other current liabilities |
137,332 | 190,140 | |||||||
Secured credit lines |
13,249 | 24,360 | |||||||
Total current liabilities |
190,886 | 254,588 | |||||||
Other long-term liabilities |
98,825 | 33,503 | |||||||
Convertible senior notes |
100,000 | — | |||||||
Commitments and contingencies (see Note 21) |
|||||||||
THQ Inc. stockholders' equity: |
|||||||||
Preferred stock, par value $0.01, 1,000,000 shares authorized |
— | — | |||||||
Common stock, par value $0.01, 225,000,000 shares authorized as of March 31, 2010; 67,729,952 and 67,471,659 shares issued and outstanding as of March 31, 2010 and March 31, 2009, respectively |
677 | 675 | |||||||
Additional paid-in capital |
511,922 | 495,851 | |||||||
Accumulated other comprehensive income (loss) |
7,867 | (2,392 | ) | ||||||
Accumulated deficit |
(196,111 | ) | (187,094 | ) | |||||
Total THQ Inc. stockholders' equity |
324,355 | 307,040 | |||||||
Noncontrolling interest |
263 | 3,198 | |||||||
Total equity |
324,618 | 310,238 | |||||||
TOTAL LIABILITIES AND EQUITY |
$ | 714,329 | $ | 598,329 | |||||
See notes to consolidated financial statements.
49
THQ INC. AND SUBSIDIARIES
CONSOLIDATED STATEMENTS OF OPERATIONS
(In thousands, except per share data)
| |
Fiscal Year Ended March 31, | |||||||||||
|---|---|---|---|---|---|---|---|---|---|---|---|---|
| |
2010 | 2009 | 2008 | |||||||||
Net sales |
$ | 899,137 | $ | 829,963 | $ | 1,030,467 | ||||||
Cost of sales: |
||||||||||||
Product costs |
318,590 | 338,882 | 389,097 | |||||||||
Software amortization and royalties |
196,956 | 296,688 | 231,800 | |||||||||
License amortization and royalties |
95,972 | 83,066 | 99,524 | |||||||||
Venture partner expense |
14,531 | 19,707 | 24,056 | |||||||||
Total cost of sales |
626,049 | 738,343 | 744,477 | |||||||||
Gross profit |
273,088 |
91,620 |
285,990 |
|||||||||
Operating expenses: |
||||||||||||
Product development |
87,233 | 109,201 | 128,869 | |||||||||
Selling and marketing |
131,954 | 162,183 | 175,288 | |||||||||
General and administrative |
57,879 | 76,884 | 69,901 | |||||||||
Goodwill impairment |
— | 118,799 | — | |||||||||
Restructuring |
5,671 | 12,266 | — | |||||||||
Total operating expenses |
282,737 | 479,333 | 374,058 | |||||||||
Operating loss |
(9,649 |
) |
(387,713 |
) |
(88,068 |
) |
||||||
Interest and other income (expense), net |
(2,056 | ) | 483 | 15,433 | ||||||||
Loss from continuing operations before income taxes |
(11,705 | ) | (387,230 | ) | (72,635 | ) | ||||||
Income taxes |
247 | 46,226 | (35,785 | ) | ||||||||
Loss from continuing operations |
(11,952 | ) | (433,456 | ) | (36,850 | ) | ||||||
Gain on sale of discontinued operations, net of tax |
— | 2,042 | 1,513 | |||||||||
Net loss prior to allocation of noncontrolling interest |
(11,952 | ) | (431,414 | ) | (35,337 | ) | ||||||
Loss attributable to noncontrolling interest |
2,935 | 302 | — | |||||||||
Net loss attributable to THQ Inc. |
$ | (9,017 | ) | $ | (431,112 | ) | $ | (35,337 | ) | |||
Earnings (loss) per share attributable to THQ Inc.—basic: |
||||||||||||
Continuing operations(1) |
$ | (0.13 | ) | $ | (6.48 | ) | $ | (0.55 | ) | |||
Discontinued operations |
— | 0.03 | 0.02 | |||||||||
Loss per share—basic |
$ | (0.13 | ) | $ | (6.45 | ) | $ | (0.53 | ) | |||
Earnings (loss) per share attributable to THQ Inc.—diluted: |
||||||||||||
Continuing operations(1) |
$ | (0.13 | ) | $ | (6.48 | ) | $ | (0.55 | ) | |||
Discontinued operations |
— | 0.03 | 0.02 | |||||||||
Loss per share—diluted |
$ | (0.13 | ) | $ | (6.45 | ) | $ | (0.53 | ) | |||
Shares used in per share calculation—basic |
67,522 |
66,861 |
66,475 |
|||||||||
Shares used in per share calculation—diluted |
67,522 | 66,861 | 66,475 | |||||||||
- (1)
- Based on amounts attributable to THQ Inc. (i.e., subsequent to the allocation of noncontrolling interest).
See notes to consolidated financial statements.
50
THQ INC. AND SUBSIDIARIES
CONSOLIDATED STATEMENTS OF TOTAL EQUITY
(In thousands, except share data)
Fiscal Years Ended March 31, 2008, 2009 and 2010
| |
Common Stock | |
Accumulated Other Comprehensive Income (Loss) |
Retained Earnings (Accumulated Deficit) |
|
|
||||||||||||||||||
|---|---|---|---|---|---|---|---|---|---|---|---|---|---|---|---|---|---|---|---|---|---|---|---|---|
| |
Additional Paid-In Capital |
Non- Controlling Interest |
Total Equity |
|||||||||||||||||||||
| |
Shares | Amount | ||||||||||||||||||||||
Balance at March 31, 2007 |
66,677,721 | $ | 667 | $ | 471,332 | $ | 17,603 | $ | 279,355 | — | $ | 768,957 | ||||||||||||
Exercise of options |
1,421,907 | 14 | 21,122 | — | — | — | 21,136 | |||||||||||||||||
Issuance of restricted stock, net |
194,600 | 2 | (559 | ) | — | — | — | (557 | ) | |||||||||||||||
Issuance of ESPP shares |
304,881 | 3 | 5,945 | — | — | — | 5,948 | |||||||||||||||||
Conversion of stock unit awards |
8,100 | — | — | — | — | — | — | |||||||||||||||||
Cancellation of restricted stock |
(60,815 | ) | — | — | — | — | — | — | ||||||||||||||||
Repurchase of common stock |
(2,193,400 | ) | (22 | ) | (54,888 | ) | — | — | — | (54,910 | ) | |||||||||||||
Stock-based compensation |
— | — | 21,820 | — | — | — | 21,820 | |||||||||||||||||
Tax benefit related to the exercise of employee stock options |
— | — | 3,921 | — | — | — | 3,921 | |||||||||||||||||
Comprehensive income (loss): |
||||||||||||||||||||||||
Net loss |
— | — | — | — | (35,337 | ) | — | (35,337 | ) | |||||||||||||||
Other comprehensive income |
||||||||||||||||||||||||
Foreign currency translation gain |
— | — | — | 9,372 | — | — | 9,372 | |||||||||||||||||
Unrealized gain on investments, net of $0.1 million tax expense |
— | — | — | 219 | — | — | 219 | |||||||||||||||||
Comprehensive income (loss) |
9,591 | (35,337 | ) | — | (25,746 | ) | ||||||||||||||||||
Balance at March 31, 2008 |
66,352,994 | $ | 664 | $ | 468,693 | $ | 27,194 | $ | 244,018 | — | $ | 740,569 | ||||||||||||
Exercise of options |
437,754 | 4 | 5,995 | — | — | — | 5,999 | |||||||||||||||||
Issuance of ESPP shares |
693,711 | 7 | 3,588 | — | — | — | 3,595 | |||||||||||||||||
Conversion of stock unit awards |
8,100 | — | — | — | — | — | — | |||||||||||||||||
Cancellation of restricted stock |
(20,900 | ) | — | — | — | — | — | — | ||||||||||||||||
Stock-based compensation |
— | — | 18,326 | — | — | — | 18,326 | |||||||||||||||||
Taxes related to the exercise and cancellation of employee stock options |
— | — | (751 | ) | — | — | — | (751 | ) | |||||||||||||||
Noncontrolling interest investment |
— | — | — | — | — | 3,500 | 3,500 | |||||||||||||||||
Comprehensive loss: |
||||||||||||||||||||||||
Net loss |
— | — | — | — | (431,112 | ) | (302 | ) | (431,414 | ) | ||||||||||||||
Other comprehensive income (loss) |
||||||||||||||||||||||||
Foreign currency translation loss |
— | — | — | (28,019 | ) | — | — | (28,019 | ) | |||||||||||||||
Unrealized loss on investments, net of $4.5 million tax benefit |
— | — | — | (7,428 | ) | — | — | (7,428 | ) | |||||||||||||||
Less: Reclassification of loss on investments included in net loss, net of $3.5 million tax benefit |
— | — | — | 5,861 | — | — | 5,861 | |||||||||||||||||
Comprehensive loss |
(29,586 | ) | (431,112 | ) | (302 | ) | (460,698 | ) | ||||||||||||||||
Balance at March 31, 2009 |
67,471,659 | $ | 675 | $ | 495,851 | $ | (2,392 | ) | $ | (187,094 | ) | $ | 3,198 | $ | 310,238 | |||||||||
Exercise of options |
121,714 | 1 | 554 | — | — | — | 555 | |||||||||||||||||
Issuance of restricted stock, net |
(16,836 | ) | — | (157 | ) | — | — | — | (157 | ) | ||||||||||||||
Issuance of ESPP shares |
134,928 | 1 | 616 | — | — | — | 617 | |||||||||||||||||
Conversion of stock unit awards |
43,328 | — | (133 | ) | — | — | — | (133 | ) | |||||||||||||||
Cancellation of restricted stock |
(24,841 | ) | — | — | — | — | — | — | ||||||||||||||||
Stock-based compensation |
— | — | 11,150 | — | — | — | 11,150 | |||||||||||||||||
Taxes related to stock options |
— | — | 4,041 | — | — | — | 4,041 | |||||||||||||||||
Comprehensive income (loss): |
||||||||||||||||||||||||
Net loss |
— | — | — | — | (9,017 | ) | (2,935 | ) | (11,952 | ) | ||||||||||||||
Other comprehensive income (loss): |
||||||||||||||||||||||||
Foreign currency translation gain |
— | — | — | 8,978 | — | — | 8,978 | |||||||||||||||||
Unrealized gain on investments, net of $1.0 million tax expense |
— | — | — | 1,681 | — | — | 1,681 | |||||||||||||||||
Reclassification of loss on investments included in net loss, net of $0.2 million tax benefit |
— | — | — | (400 | ) | — | — | (400 | ) | |||||||||||||||
Comprehensive income (loss) |
10,259 | (9,017 | ) | (2,935 | ) | (1,693 | ) | |||||||||||||||||
Balance at March 31, 2010 |
67,729,952 | $ | 677 | $ | 511,922 | $ | 7,867 | $ | (196,111 | ) | $ | 263 | $ | 324,618 | ||||||||||
See notes to consolidated financial statements.
51
THQ INC. AND SUBSIDIARIES
CONSOLIDATED STATEMENTS OF CASH FLOWS
(In thousands)
| |
Fiscal Year Ended March 31, | ||||||||||
|---|---|---|---|---|---|---|---|---|---|---|---|
| |
2010 | 2009 | 2008 | ||||||||
OPERATING ACTIVITIES: |
|||||||||||
Net loss prior to allocation of noncontrolling interest |
$ | (11,952 | ) | $ | (431,414 | ) | $ | (35,337 | ) | ||
Adjustments to reconcile net loss prior to allocation of noncontrolling interest to net cash provided by operating activities: |
|||||||||||
Depreciation and amortization |
13,592 | 19,327 | 18,722 | ||||||||
Amortization of licenses and software development(1) |
241,240 | 327,885 | 257,051 | ||||||||
Goodwill impairment charges |
— | 118,799 | — | ||||||||
Gain on sale of discontinued operations |
— | (2,042 | ) | (1,513 | ) | ||||||
Loss on disposal of property and equipment |
780 | 2,835 | 270 | ||||||||
Restructuring charges |
5,671 | 12,266 | — | ||||||||
Amortization of debt issuance costs |
529 | — | — | ||||||||
Amortization of interest |
818 | 846 | 825 | ||||||||
(Gain) loss on investments |
(797 | ) | 6,779 | (13 | ) | ||||||
Stock-based compensation(2) |
11,883 | 18,665 | 22,860 | ||||||||
Tax benefit related to stock-based awards |
— | — | 3,921 | ||||||||
Excess tax benefit related to stock-based awards |
— | — | (2,157 | ) | |||||||
Deferred income taxes |
2,532 | 33,388 | (42,537 | ) | |||||||
Changes in operating assets and liabilities: |
|||||||||||
Accounts receivable, net of allowances |
23,460 | 38,529 | (38,232 | ) | |||||||
Inventory |
12,245 | 10,577 | (9,622 | ) | |||||||
Licenses |
(41,809 | ) | (59,979 | ) | (38,423 | ) | |||||
Software development |
(180,838 | ) | (254,220 | ) | (225,433 | ) | |||||
Prepaid expenses and other current assets |
14,699 | (5,218 | ) | (7,031 | ) | ||||||
Accounts payable |
(789 | ) | (16,266 | ) | 30,635 | ||||||
Accrued and other liabilities |
(52,379 | ) | (14,793 | ) | 40,826 | ||||||
Income taxes |
(5,500 | ) | (138 | ) | 15,474 | ||||||
Net cash provided by (used in) operating activities |
33,385 | (194,174 | ) | (9,714 | ) | ||||||
INVESTING ACTIVITIES: |
|||||||||||
Proceeds from sales and maturities of available-for-sale investments |
25,776 | 118,295 | 617,754 | ||||||||
Proceeds from sales and maturities of trading investments |
8,000 | — | — | ||||||||
Purchase of available-for-sale investments |
(96,559 | ) | (47,365 | ) | (458,561 | ) | |||||
Other long-term assets |
147 | 66 | (986 | ) | |||||||
Acquisitions, net of cash acquired |
(840 | ) | (4,847 | ) | (32,636 | ) | |||||
Net proceeds from sale of discontinued operations |
— | 2,042 | 1,513 | ||||||||
Purchases of property and equipment |
(6,308 | ) | (8,658 | ) | (21,264 | ) | |||||
Net cash provided by (used in) investing activities |
(69,784 | ) | 59,533 | 105,820 | |||||||
FINANCING ACTIVITIES: |
|||||||||||
Stock repurchase |
— | — | (54,910 | ) | |||||||
Proceeds from issuance of common stock to employees |
1,174 | 9,594 | 26,240 | ||||||||
Payment of debt issuance costs |
(3,646 | ) | — | — | |||||||
Proceeds from issuance of convertible senior notes |
100,000 | — | — | ||||||||
Borrowings on secured credit lines |
2,500 | 29,300 | — | ||||||||
Payment of secured credit lines |
(13,610 | ) | (4,940 | ) | — | ||||||
Excess tax benefit related to stock-based awards |
— | — | 2,157 | ||||||||
Net cash provided by (used in) financing activities |
86,418 | 33,954 | (26,513 | ) | |||||||
Effect of exchange rate changes on cash |
6,501 | (15,275 | ) | 3,479 | |||||||
Net increase (decrease) in cash and cash equivalents |
56,520 | (115,962 | ) | 73,072 | |||||||
Cash and cash equivalents—beginning of period |
131,858 | 247,820 | 174,748 | ||||||||
Cash and cash equivalents—end of period |
$ | 188,378 | $ | 131,858 | $ | 247,820 | |||||
Supplemental cash flow information: |
|||||||||||
Cash paid during the period for income taxes |
$ | 12,580 | $ | 16,184 | $ | 14,076 | |||||
Cash paid during the period for interest |
$ | 2,876 | $ | 348 | $ | 190 | |||||
- (1)
- Excludes
amortization of capitalized stock-based compensation expense.
- (2)
- Includes the net effects of capitalization and amortization of stock-based compensation expense.
See notes to consolidated financial statements.
52
THQ INC. AND SUBSIDIARIES
NOTES TO CONSOLIDATED FINANCIAL STATEMENTS
1. Description of Business and Summary of Significant Accounting Policies
We are a leading worldwide developer and publisher of interactive entertainment software for all popular game systems, including:
- •
- home video game consoles such as the Microsoft Xbox 360 ("Xbox 360"), Nintendo Wii ("Wii"), Sony
PlayStation 3 ("PS3") and Sony PlayStation 2 ("PS2");
- •
- handheld platforms such as the Nintendo DS and DSi (collectively referred to as "DS"), and Sony PlayStation Portable
("PSP");
- •
- wireless devices, including the iPhone, iTouch and iPad; and
- •
- personal computers ("PCs"), including games played online.
We also develop and publish titles for digital distribution via Sony's PlayStation Network ("PSN") and Microsoft's Xbox LIVE Marketplace ("Xbox LIVE") and Xbox LIVE Arcade ("XBLA"), as well as digitally offer our PC titles through online download stores and services such as Steam. We believe that digital delivery of games and game content is becoming an increasingly important part of our business.
Our titles span a wide range of categories, including action, adventure, fighting, racing, role-playing, simulation, sports and strategy. We have created, licensed and acquired a group of highly recognizable brands, which we market to a variety of consumer demographics ranging from products targeted at core gamers to products targeted to children and the mass market. Our portfolio of Core Games includes games based on popular fighting brands such as the Ultimate Fighting Championship ("UFC") and World Wrestling Entertainment ("WWE"); racing games based on our MX vs. ATV brand; and action, shooter and strategy games based on our owned intellectual properties such as Company of Heroes, Darksiders, Red Faction, and Saints Row, as well as games based on Games Workshop's Warhammer 40,000 universe. Our Kids, Family and Casual portfolio includes games based on popular brands such as DreamWorks Animation, Disney•Pixar, Marvel Entertainment, NBC's The Biggest Loser, Nickelodeon, and Sony Picture Consumer Product's JEOPARDY! and Wheel of Fortune, as well as games based on our owned intellectual properties, including de Blob and Drawn to Life.
Principles of Consolidation. The consolidated financial statements include the accounts of THQ Inc. and our wholly-owned and majority owned subsidiaries. The consolidated financial statements also include the THQ / JAKKS Pacific LLC ("LLC") joint venture, which was comprised of THQ and JAKKS Pacific, Inc. ("Jakks"), through December 31, 2009, the date the LLC was dissolved (see "Note 17—Settlement Agreements"). The results of operations for acquired companies have been included in the consolidated statements of operations beginning on the closing date of acquisition. All material intercompany balances and transactions have been eliminated in consolidation.
We have consolidated the results of THQ*ICE LLC (a joint venture with ICE Entertainment, Inc., a Delaware Corporation) in the consolidated financial statements as we believe we are the primary beneficiary and would receive the majority of expected returns or absorb the majority of expected losses of the entity. We sold our interest in THQ*ICE LLC on April 30, 2010 and thus after this date, we will not have income or loss attributable to noncontrolling interest.
53
Fiscal Year. We report our fiscal year on a 52/53-week period with our fiscal year ending on the Saturday nearest March 31. The results of operations for the fiscal years ended March 31, 2010, 2009 and 2008 contain the following number of weeks:
| Fiscal Period | Number of Weeks | Fiscal Period End Date | ||
|---|---|---|---|---|
Year ended March 31, 2010 ("fiscal 2010") |
53 weeks | April 3, 2010 | ||
Year ended March 31, 2009 ("fiscal 2009") |
52 weeks | March 28, 2009 | ||
Year ended March 31, 2008 ("fiscal 2008") |
52 weeks | March 29, 2008 |
For simplicity, all fiscal periods in our consolidated financial statements and accompanying notes are presented as ending on a calendar month end.
Pervasiveness of Estimates. The preparation of financial statements in conformity with accounting principles generally accepted in the United States of America requires management to make estimates and assumptions that affect the reported amounts of assets and liabilities and disclosure of contingent assets and liabilities at the date of the financial statements and the reported amounts of net sales and expenses during the reporting period. Actual results could differ from those estimates. The most significant estimates relate to accounts receivable allowances, licenses, software development, revenue recognition, stock-based compensation expense and income taxes.
Foreign Currency Translation. Assets and liabilities of foreign operations are translated at current rates of exchange while results of operations are translated at average rates in effect for the period. Translation gains or losses are shown as a separate component of accumulated other comprehensive income (loss). Foreign currency transaction gains and losses result from exchange rate changes for transactions denominated in currencies other than the functional currency and are included in interest and other income (expense), net in our consolidated statements of operations. For fiscal 2010, foreign currency transaction losses were $1.1 million, compared to gains of $0.8 million and $0.5 million in fiscal 2009 and 2008, respectively.
Cash, Cash Equivalents and Investment Securities. We consider all money market funds and highly liquid investments with maturities of three months or less when purchased to be cash equivalents.
Investments designated as trading securities are bought and held principally for the purpose of selling them in the near term and are reported at fair value, with unrealized gains and losses recognized in earnings. Investments designated as available-for-sale securities are carried at fair value based on quoted market prices or estimated based on quoted market prices for financial instruments with similar characteristics. Unrealized gains and losses of the Company's available-for-sale securities are excluded from earnings and reported as a component of accumulated other comprehensive income (loss). Additionally, the Company assesses whether an other-than-temporary impairment loss on its available-for-sale securities has occurred due to declines in fair value or other market conditions. Declines in fair value that are considered other-than-temporary are recorded as interest and other income (expense), net, in the consolidated statements of operations.
In general, investments with original maturities of greater than three months and remaining maturities of less than one year when purchased are classified as short-term investments. Investments with maturities beyond one year may also be classified as short-term based on their highly liquid nature and because such investments represent the investment of cash that is available for current operations.
The Company's investments include auction rate securities ("ARS"). These ARS are variable rate bonds tied to short-term interest rates with long-term maturities. ARS have interest rate resets through a modified Dutch auction at predetermined short-term intervals, typically every 7, 28, or 35 days. Interest on ARS is generally paid at the end of each auction process or semi-annually and is based upon the interest rate determined during the prior auction. The majority of our ARS are AAA/Aaa rated, and are typically collateralized by student loans guaranteed by the U.S. government under the Federal Family Education
54
Loan Program or backed by monoline bond insurance companies. See "Note 3—Investment Securities" for further details.
Financial Instruments. The carrying value of certain financial instruments, including cash and cash equivalents, accounts receivable, accounts payable, accrued expenses, accrued royalties, and secured credit lines approximate fair value based on their short-term nature. Investments classified as available-for-sale and trading are stated at fair value.
The assets or liabilities associated with our derivative instruments and hedging activities are recorded at fair value in other current assets or liabilities, respectively, on our consolidated balance sheets. As discussed below, gains and losses resulting from changes in fair value are accounted for depending on the use of the derivative and whether it is designated and qualifies for hedge accounting.
We utilize forward contracts in order to reduce financial market risks. These instruments are used to hedge foreign currency exposures of underlying assets, liabilities, or certain forecasted foreign currency denominated transactions. Our accounting policies for these instruments are based on whether they meet the criteria for designation as hedging transactions. Changes in fair value of derivatives that are designated as cash flow hedges, are highly effective, and qualify as hedging instruments, are recorded in other comprehensive income until the underlying hedged item is recognized in earnings within the financial statement line item consistent with the hedged item. Any ineffective portion of a derivative change in fair value is immediately recognized in earnings. During the periods presented we did not have any derivatives that qualify for hedge accounting. Changes in the fair value of derivatives that do not qualify for hedge accounting treatment are recorded in earnings. The fair value of foreign currency contracts is estimated based on the forward rate of the various hedged currencies as of the end of the period.
Accounts Receivable Allowances. We derive revenue from sales of packaged software for video game systems and PCs and sales of content and services over the Internet and for wireless devices. Product sales are recognized net of allowances for price protection and returns and various customer discounts. We typically only allow returns for our PC products; however, we may decide to provide price protection or allow returns for our video games after we analyze: (i) inventory remaining in the retail channel, (ii) the rate of inventory sell-through in the retail channel, and (iii) our remaining inventory on hand. We maintain a policy of giving credits for price protection and returns, but we do not give cash refunds. We use significant judgment and make estimates in connection with establishing allowances for price protection, returns, and doubtful accounts in any accounting period. Included in our accounts receivable allowances is our allowance for co-operative advertising that we engage in with our retail channel partners. Our co-operative advertising allowance is based upon specific contractual commitments and does not involve estimates made by management.
We establish sales allowances based on estimates of future price protection and returns with respect to current period product sales. We analyze historical price protection granted, historical returns, current sell-through of retailer and distributor inventory of our products, current trends in the video game industry and the overall economy, changes in customer demand and acceptance of our products, and other related factors when evaluating the adequacy of the price protection and returns allowance. In addition, we monitor the volume of our sales to retailers and distributors and their inventories, because slow-moving inventory in the distribution channel can result in the requirement for price protection or returns in subsequent periods. Actual price protection and returns in any future period are uncertain. While we believe we can make reliable estimates for these matters, if we changed our assumptions and estimates, our price protection and returns reserves would change, which would impact the net sales we report. In addition, if actual price protection and returns were significantly greater than the reserves we have established, the actual results of our reported net sales would decrease. Conversely, if actual price protection and returns were significantly less than our reserves, our reported net sales would increase. In circumstances when we do not have a reliable basis to estimate returns and price protection or are unable
55
to determine that collection of a receivable is probable, we defer the sale until such time as we can reliably estimate any related returns and allowances and determine that collection of the receivable is probable.
Similarly, we must use significant judgment and make estimates in connection with establishing allowances for doubtful accounts in any accounting period. We analyze customer concentrations, customer credit-worthiness and current economic trends when evaluating the adequacy of the allowance for doubtful accounts. Material differences may result in the amount and timing of our bad debt expense for any period if we made different judgments or utilized different estimates. If our customers experience financial difficulties and are not able to meet their ongoing financial obligations to us, our results of operations may be adversely impacted.
Concentrations of Credit Risk. Financial instruments which potentially subject us to concentration of credit risk consist principally of cash and cash equivalents, short-term investments, accounts receivable and long-term investments. We place cash and cash equivalents and short-term investments with high credit-quality financial institutions and limit the amount of credit exposure to any one financial institution. We believe the risk related to cash and cash equivalents, and accounts receivable is not material due to the short-term nature of such assets. Our investments include significant holdings of ARS. Although there has been recent uncertainty in the credit markets, all of the securities are investment grade securities, and we have no reason to believe that any of the underlying issuers of our ARS are presently at risk or that the underlying credit quality of the assets backing our ARS has been impacted by the reduced liquidity of these investments. See "Note 3—Investment Securities" in the notes to the consolidated financial statements for further information related to our investments.
Most of our sales are made directly to mass merchandisers and national retailers. Due to the increased volume of sales to these channels, we have experienced an increased concentration of credit risk, and as a result, may maintain individually significant receivable balances with such mass merchandisers and national retailers. We perform ongoing credit evaluations of our customers, maintain an allowance for potential credit losses, and most of our foreign receivables are covered by credit insurance. As of March 31, 2010 and 2009, 20% and 16%, respectively, of our gross accounts receivable outstanding was with one major customer. Our largest single customer accounted for 17% of our gross sales in fiscal 2010, 14% of our gross sales in fiscal 2009 and 14% of our gross sales in fiscal 2008. Our second largest customer accounted for 15% of our gross sales in fiscal 2010, 13% of our gross sales in fiscal 2009 and 12% of our gross sales in fiscal 2008.
Inventory. Inventory, which consists principally of finished products, is stated at the lower of cost (moving weighted average) or market. We estimate the net realizable value of slow-moving inventory on a title by title basis, and charge the excess of cost over net realizable value to cost of sales—product costs.
Property and Equipment. Property and equipment are recorded at cost. Depreciation is computed using the straight-line method over the estimated useful lives of the assets. Leasehold improvements are depreciated over the shorter of their useful lives or the remaining lease term.
Licenses. Minimum guaranteed royalty payments for intellectual property licenses are initially recorded on our balance sheet as an asset (licenses) and as a liability (accrued royalties) at the contractual amount upon execution of the contract if no significant performance obligation remains with the licensor. When a significant performance obligation remains with the licensor, we record royalty payments as an asset (licenses) and as a liability (accrued royalties) when payable rather than upon execution of the contract. Royalty payments for intellectual property licenses are classified as current assets and current liabilities to the extent such royalty payments relate to anticipated product sales during the subsequent year and long-term assets and long-term liabilities if such royalty payments relate to anticipated product sales after one year.
We evaluate the future recoverability of our capitalized licenses on a quarterly basis. The recoverability of capitalized license costs is evaluated based on the expected performance of the specific products in which
56
the licensed trademark or copyright is to be used. As many of our licenses extend for multiple products over multiple years, we also assess the recoverability of capitalized license costs based on certain qualitative factors such as the success of other products and/or entertainment vehicles utilizing the intellectual property, whether there are any future planned theatrical releases or television series based on the intellectual property and the rights holder's continued promotion and exploitation of the intellectual property. Prior to the related product's release, we expense, as part of cost of sales—license amortization and royalties, capitalized license costs when we estimate such amounts are not recoverable.
Licenses are expensed to cost of sales—license amortization and royalties at the higher of (i) the contractual royalty rate based on actual net product sales related to such license, or (ii) an effective rate based upon total projected net sales related to such license. When, in management's estimate, future cash flows will not be sufficient to recover previously capitalized costs, we expense these capitalized costs to cost of sales—license amortization and royalties. If actual net sales or revised forecasted net sales fall below the initial forecasted net sales for a particular license, the charge to cost of sales—license amortization and royalties expense may be larger than anticipated in any given quarter. At March 31, 2010, the net carrying value of our licenses was $140.3 million and is reflected as "Licenses" and "Licenses, net of current portion" in the consolidated financial statements. Additionally, as of March 31, 2010 we had commitments of $122.3 million that are not reflected in our consolidated financial statements due to remaining performance obligations of the licensor. If we were required to impair these licenses, due to changes in market conditions or product acceptance, our results of operations could be materially adversely affected.
Software Development. We utilize both internal development teams and third-party software developers to develop our software. We capitalize software development costs once technological feasibility is established and we determine that such costs are recoverable against future net sales. We evaluate technological feasibility on a product-by-product basis. For products where proven game engine technology exists, the establishment of technological feasibility may occur early in the development cycle. We capitalize the milestone payments made to third-party software developers and the direct payroll and overhead costs for our internal development teams. Amounts related to software development for which technological feasibility is not yet met are charged as incurred to product development expense in our consolidated statements of operations.
On a quarterly basis, we compare our unamortized software development costs to net realizable value, on a product-by-product basis. The amount by which any unamortized software development costs exceed their net realizable value is charged to cost of sales—software amortization and royalties. The net realizable value is the estimated future net sales from the product, reduced by the estimated future direct costs associated with the product such as completion costs, cost of sales and advertising.
Commencing upon product release, capitalized software development costs are amortized to cost of sales—software amortization and royalties based on the ratio of current gross sales to total projected gross sales. In fiscal 2010, we recorded $10.8 million of additional amortization expense related to the cancellation of certain games. As of March 31, 2010, the net carrying value of our software development was $159.0 million.
The milestone payments made to our third-party developers during their development of our games are typically considered non-refundable advances against the total compensation they can earn based upon the sales performance of the products. Any additional compensation earned beyond the milestone payments is expensed to cost of sales—software amortization and royalties as earned. Additionally, we have a studio bonus plan that allows for our internal product development staff to participate in the success of the games they develop. As certain performance targets are reached, any additional compensation earned under the studio bonus plan is expensed to cost of sales—software amortization and royalties.
Revenue Recognition. We recognize net sales for packaged software when title and risk of loss transfers to the customer, provided that no significant vendor support obligations remain outstanding and that collection of the resulting receivable is deemed probable by management. Certain products are sold to
57
customers with a street date (the earliest date these products may be sold by retailers). For these products we recognize net sales on the later of the street date or the sale date.
Some of our packaged software products are developed with the ability to be connected to, and played via, the Internet. In order for consumers to participate in online communities and play against one another via the Internet, we (either directly or through outsourced arrangements with third parties) maintain servers that support an online service we provide to consumers for activities such as matchmaking, roster updates, tournaments and player rankings. Generally, we do not consider the online service to be a deliverable as it is incidental to the overall product offering. Accordingly, we do not defer any net sales related to products containing the limited online service.
In instances where the online service is considered a deliverable and where we have significant continuing involvement in addition to the software product, we account for the sale as a "bundled" sale, or multiple element arrangement, in which we sell both the packaged software product and the online service for one combined price. Vendor specific objective evidence for the fair value of the online service does not exist as we have not separately offered or charged for the online service. Therefore, when the online service is determined to be a deliverable, we recognize the revenue from sales of such software products ratably over the estimated online service period of six months, beginning the month after shipment of the software product. Costs of sales related to such products are also deferred and recognized with the related net sales and include product costs, software amortization and royalties, and license amortization and royalties. At March 31, 2010 the deferred net sales related to these games was $1.4 million and is included within accrued and other current liabilities in our consolidated balance sheet.
Determining whether the online service for a particular game constitutes a deliverable is subjective and requires management's judgment. Determining the estimated service period over which to recognize the related net sales and costs of sales is also subjective and involves management's judgment.
Although we generally sell our products on a no-return basis, in certain circumstances we may allow price protection, returns or other allowances on a negotiated basis. We estimate such price protection, returns or other allowances based upon management's evaluation of our historical experience, retailer inventories, the nature of the titles and other factors. Such estimates are deducted from gross sales. See "Note 5—Accounts Receivable Allowances." Software is sold under a limited 90-day warranty against defects in material and workmanship. To date, we have not experienced material warranty claims.
Software Licenses: For those agreements that provide the customers the right to multiple copies in exchange for guaranteed minimum royalty amounts, net sales are recognized at delivery of the product master or the first copy. Per copy royalties on sales that exceed the guarantee are recognized as earned.
We also license the rights to our owned intellectual property and through these agreements we receive royalties from the licensees. We recognize these royalties as net sales as statements of amounts earned are received from our licensees. For those agreements which provide for guaranteed minimum royalty amounts, we recognize such minimums as net sales when no further performance obligations exist. We recognize any upfront licensing fee received over the term of the agreement.
Wireless Revenue: We recognize wireless revenue principally from the sale or subscription of our applications to wireless subscribers under distribution agreements with wireless carriers in the period in which the applications are purchased by the subscribers, assuming that: fees are fixed and determinable; we have no significant obligations remaining and collection of the related receivable is reasonably assured. In accordance with the distribution agreements, the wireless carriers are responsible for billing, collecting and remitting our fees to us. The wireless carriers generally report the final sales data to us within 10 to 45 days following the end of each month. When final sales data is not available in a timely manner for reporting purposes, we estimate our net sales based on available sales data and historical trends. We will record differences between estimated net sales and actual net sales in the next reporting period once the actual amounts are determined.
58
We recognize as net sales the net amount the wireless carrier pays to us upon the sale of our applications, net of any service or other fees earned and deducted by the wireless carrier.
Shipping and Handling. Shipping and handling costs, which consist primarily of packaging and transportation charges incurred to move finished goods to customers, are included in costs of sales—product costs.
Advertising. Advertising and sales promotion costs are generally expensed as incurred, except for television airtime and print media costs associated with media campaigns, which are deferred and charged to expense in the period the airtime or advertising space is used for the first time. We engage in co-operative advertising with some of our retail channel partners. We accrue the associated costs when net sales are recognized and such amounts are included in selling and marketing expense if there is a separate identifiable benefit for which we can reasonably estimate the fair value of the benefit identified; otherwise, they are recognized as a reduction of net sales. Advertising costs, included in selling and marketing expense, for fiscal 2010, 2009 and 2008 were $69.7 million, $77.6 million and $85.7 million, respectively.
Goodwill and Other Intangible Assets. In the three months ended December 31, 2008, specifically in the latter half of that fiscal quarter, our stock price declined significantly, resulting in a market capitalization that was substantially below the carrying value of our net assets. In addition, the unfavorable macroeconomic conditions and uncertainties had adversely affected our environment. As a result, in connection with the preparation of the financial statements for our fiscal quarter ended December 31, 2008, we performed an interim goodwill impairment test.
We performed the first step of the two-step impairment test, which includes comparing the fair value of our single reporting unit to its carrying value. Due to market conditions at the time of the test, our analysis was weighted towards the market value approach, which is based on recent share prices, and includes a control premium based on recent transactions that have occurred within our industry, to determine the fair value of our single reporting unit. We concluded that the fair value of our single reporting unit was less than the carrying value of our net assets and thus performed the second step of the impairment test. Our step two analysis involved preparing an allocation of the estimated fair value of our reporting unit to the tangible and intangible assets (other than goodwill) as if the reporting unit had been acquired in a business combination. Based on our analysis, we recorded goodwill impairment charges of $118.8 million during fiscal 2009, representing the entire amount of our previously recorded goodwill.
As of March 31, 2010 all identifiable intangible assets, other than licenses and software development, were fully amortized.
Stock-based compensation. We estimate the fair value of stock options and our employee stock purchase plan on date of grant using the Black-Scholes option pricing model which requires the input of subjective assumptions, including the expected volatility of our common stock and an option's expected life. The fair value of our restricted stock and restricted stock units is determined based on the closing trading price of our common stock on the grant date. The amount of expense recognized represents the expense associated with the stock-based awards we expect to ultimately vest based upon an estimated rate of forfeitures. Our estimate of forfeitures is based on historical forfeiture behavior as well as any expected trends in future forfeiture behavior; this rate of forfeitures is updated as necessary and any adjustments needed to recognize the fair value of options that actually vest or are forfeited are recorded. The fair value for awards that are expected to vest is then amortized on a straight-line basis over the requisite service period of the award, which is generally the option vesting term. As a result, the financial statements include amounts that are based upon our best estimates and judgments relating to the expenses recognized for stock-based compensation.
59
Income Taxes. The provision for income taxes is computed using the asset and liability method, under which deferred tax assets and liabilities are recognized based on their expected future tax carrying value. Deferred tax assets and liabilities are measured using the enacted tax rates expected to apply to taxable income in effect for the years in which those tax assets are anticipated to be realized or settled. We record a valuation allowance to reduce deferred tax assets to the amount that is believed more likely than not to be realized.
The calculation of tax liabilities involves judgment, assumptions and estimates in evaluating the application of authoritative accounting guidance, enacted tax laws, our interpretation of tax laws and potential outcomes of audits conducted by tax authorities. Material changes in tax laws, our interpretation of tax laws, or the resolution of tax audits, if and when conducted by tax authorities, could significantly impact the amount of income tax expense in our consolidated financial statements.
Basic and Diluted Earnings Per Share. Basic earnings (loss) per share is computed as net income (loss) attributable to THQ Inc. divided by the weighted-average number of shares outstanding for the period. Diluted earnings (loss) per share reflects the potential dilution that could occur from common shares issuable through stock-based compensation plans including stock options, stock-based awards, purchase opportunities under our ESPP, and the conversion of our convertible senior notes. On August 4, 2009, we issued $100.0 million 5.00% convertible senior notes ("Notes"); see "Note 11—Convertible Senior Notes". Under the provisions of the if-converted method, the Notes are assumed to have been converted at the beginning of the respective period or at the time of issuance if later, and are included in the denominator of the diluted calculation and the after-tax interest expense and amortization of debt issuance costs in connection with the Notes are added back to the numerator of the diluted calculation. However, the if-converted amounts are only included in the numerator and denominator of the diluted calculation if the result of the if-converted calculation is dilutive.
Recently Issued Accounting Pronouncements. In December 2007, the Financial Accounting Standards Board ("FASB") issued Statement of Financial Accounting Standards ("SFAS") No. 160 (Accounting Standards Codification ("ASC") Topic 810), "Noncontrolling Interests in Consolidated Financial Statements" ("FAS 160"). This Statement amends Accounting Research Bulletin ("ARB") No. 51, "Consolidated Financial Statements" to establish accounting and reporting standards for the noncontrolling interest in a subsidiary and for the deconsolidation of a subsidiary. It clarifies that a noncontrolling interest in a subsidiary is an ownership interest in the consolidated entity that should be reported as equity in the consolidated financial statements. FAS 160 is effective for fiscal years and interim periods within those fiscal years, beginning on or after December 15, 2008. We adopted this statement on April 1, 2009. The presentation and disclosure requirements of FAS 160 were applied retrospectively. Other than the change in presentation of noncontrolling interests, the adoption of FAS 160 had no impact on our results of operations, financial position or cash flows.
In June 2009, the FASB issued SFAS No. 166 (ASC Topic 860), "Accounting for Transfers of Financial Assets—an amendment to FASB Statement No. 140," ("FAS 166"). The purpose of FAS 166 is to improve the relevance, representational faithfulness, and comparability of the information that a reporting entity provides in its financial statements about a transfer of financial assets; the effects of a transfer on its financial position, financial performance, and cash flows; and a transferor's continuing involvement, if any, in transferred financial assets. FAS 166 is effective at the start of a company's first fiscal year beginning after November 15, 2009, which will be our fiscal year 2011. The adoption did not have a material impact on our results of operations, financial position or cash flows.
In June 2009, the FASB issued SFAS No. 167 (ASC Topic 810), "Amendments to FASB Interpretation No. 46(R)," ("FAS 167"). The purpose of FAS 167 is to improve financial reporting by enterprises involved with variable interest entities. FAS 167 is effective at the start of a company's first fiscal year beginning after November 15, 2009, or January 1, 2010 for companies reporting earnings on a calendar-year basis, which will be our fiscal year 2011. Our adoption of this pronouncement on April 1, 2010 did not have a
60
material impact on our results of operations, financial position or cash flows. In December 2009, the FASB issued ASU 2009-17, "Consolidations (Topic 810)—Improvements to Financial Reporting by Enterprises Involved with Variable Interest Entities," which codified FAS 167.
In October 2009, the FASB issued ASU 2009-13, "Revenue Recognition (Topic 605): Multiple-Deliverable Revenue Arrangements—a consensus of the FASB Emerging Issues Task Force" ("ASU 2009-13"). ASU 2009-13 provides criteria for separating consideration in multiple-deliverable arrangements. It establishes a selling price hierarchy for determining the price of a deliverable and expands the disclosures related to a vendor's multiple-deliverable revenue arrangements. ASU 2009-13 is effective prospectively for arrangements entered into or materially modified in years beginning after June 15, 2010, which will be our fiscal 2012. We are still evaluating the impact that the adoption of ASU 2009-13 will have on our results of operations, financial position or cash flows.
In January 2010, the FASB issued ASU 2010-02, "Consolidation (Topic 810): Accounting and Reporting for Decreases in Ownership of a Subsidiary" ("ASU 2010-02"). This amendment to Topic 810 clarifies, but does not change, the scope of current US GAAP. It clarifies the decrease in ownership provisions of Subtopic 810-10 and removes the potential conflict between guidance in that Subtopic and asset derecognition and gain or loss recognition guidance that may exist in other US GAAP. An entity will be required to follow the amended guidance beginning in the period that it first adopts FAS 160 (now included in Subtopic 810-10). For those entities that have already adopted FAS 160, the amendments are effective at the beginning of the first interim or annual reporting period ending on or after December 15, 2009, which will be our quarter ended March 31, 2010. The amendments should be applied retrospectively to the first period that an entity adopted FAS 160. Our adoption of this pronouncement did not have a material impact on our results of operations, financial position or cash flows.
In January 2010, the FASB issued ASU 2010-06, "Fair Value Measurements and Disclosures (Topic 820): Improving Disclosures about Fair Value Measurements" ("ASU 2010-06"). ASU 2010-06 amends ASC 820 and clarifies and provides additional disclosure requirements related to recurring and non-recurring fair value measurements and employers' disclosures about postretirement benefit plan assets. ASU 2010-06 is effective for interim and annual reporting periods beginning after December 15, 2009, which was our quarter ending March 31, 2010. Our adoption of this pronouncement did not have a material impact on our results of operations, financial position or cash flows. Disclosures about purchases, sales, issuances, and settlements in the roll forward activity in Level 3 fair value measurements are effective for fiscal years beginning after December 15, 2010, and for interim periods within those fiscal years, which will be our quarter ending June 30, 2011. The adoption is not expected to have a material impact on our results of operations, financial position or cash flows.
2. Cash and Cash Equivalents
The following table summarizes the components of our cash and cash equivalents (in thousands):
| |
March 31, 2010 |
March 31, 2009 |
||||||
|---|---|---|---|---|---|---|---|---|
Cash and time deposits |
$ | 116,170 | $ | 93,624 | ||||
Money market funds |
21,049 | 38,234 | ||||||
Negotiable certificates of deposit(1) |
28,545 | — | ||||||
Corporate securities |
8,439 | — | ||||||
Municipal securities(2) |
14,175 | — | ||||||
Cash and cash equivalents |
$ | 188,378 | $ | 131,858 | ||||
- (1)
- Negotiable certificates of deposit consist of deposits issued by institutions outside the U.S.
61
- (2)
- Municipal securities consist of bonds issued or deemed to be guaranteed by non-U.S. governments.
As of March 31, 2010 we had $51.2 million of trading securities classified as cash equivalents. These investments are made up of negotiable certificates of deposit, corporate securities, and municipal securities, which, when purchased by us, had remaining maturities of three months or less. There were no gains or losses on these trading securities in fiscal 2010. As of March 31, 2009 there were no trading securities classified as cash equivalents.
3. Investment Securities
The following table summarizes our investment securities and their related inception-to-date gross unrealized gains and (losses), as of March 31, 2010 (in thousands):
| |
Amortized Cost |
Gross Unrealized Gains |
Gross Unrealized Losses |
Fair Value |
|||||||||||
|---|---|---|---|---|---|---|---|---|---|---|---|---|---|---|---|
Short-term investments: |
|||||||||||||||
Municipal securities(1) |
$ | 17,222 | $ | 26 | $ | (7 | ) | $ | 17,241 | ||||||
Corporate securities |
64,220 | 187 | (53 | ) | 64,354 | ||||||||||
Negotiable certificates of deposit(2) |
1,347 | — | (1 | ) | 1,346 | ||||||||||
Total short-term investments |
82,789 | 213 | (61 | ) | 82,941 | ||||||||||
Long-term investments: |
|||||||||||||||
Municipal securities(3) |
2,000 | — | (149 | ) | 1,851 | ||||||||||
Total long-term investments |
2,000 | — | (149 | ) | 1,851 | ||||||||||
Total available-for-sale investments |
$ | 84,789 | $ | 213 | $ | (210 | ) | 84,792 | |||||||
Put option |
1,738 | ||||||||||||||
Trading securities(4) |
21,036 | ||||||||||||||
Total short-term investments, pledged |
22,774 | ||||||||||||||
Total investment securities |
$ | 107,566 | |||||||||||||
- (1)
- Municipal
securities classified as short-term includes bonds issued or deemed to be guaranteed by non-U.S.
governments, U.S. agency securities, U.S. Treasury securities, and local governments.
- (2)
- Negotiable
certificates of deposit consist of deposits issued by institutions outside the U.S.
- (3)
- Municipal
securities classified as long-term, consist of municipal ARS substantially all of which are backed by monoline bond
insurance companies.
- (4)
- Trading securities classified as short-term, pledged, consist of student loan ARS substantially all of which are guaranteed by the U.S. government under the Federal Family Educational Loan Program and backed by monoline bond insurance companies.
62
The following table summarizes our investment securities and their related inception-to-date gross unrealized gains and (losses), as of March 31, 2009 (in thousands):
| |
Amortized Cost |
Gross Unrealized Gains |
Gross Unrealized Losses |
Fair Value |
|||||||||||
|---|---|---|---|---|---|---|---|---|---|---|---|---|---|---|---|
Short-term investments: |
|||||||||||||||
Municipal securities |
$ | 6,397 | $ | 5 | $ | (3 | ) | $ | 6,399 | ||||||
Corporate securities |
2,405 | — | — | 2,405 | |||||||||||
Total short-term investments |
8,802 | 5 | (3 | ) | 8,804 | ||||||||||
Long-term investments: |
|||||||||||||||
Municipal securities(1) |
5,475 | — | (450 | ) | 5,025 | ||||||||||
Total long-term investments |
5,475 | — | (450 | ) | 5,025 | ||||||||||
Total available-for-sale investments |
$ | 14,277 | $ | 5 | $ | (453 | ) | $ | 13,829 | ||||||
Put option |
4,541 | ||||||||||||||
Trading securities(1) |
26,077 | ||||||||||||||
Total long-term investments pledged |
30,618 | ||||||||||||||
Total investment securities |
$ | 44,447 | |||||||||||||
- (1)
- The municipal securities included in the table above and classified as long-term are all auction rate securities with most collateralized by student loans guaranteed by the U.S. government under the Federal Family Education Loan Program and the majority of the remaining securities backed by monoline bond insurance companies.
Available-for-sale investments
Our entire portfolio of available-for-sale investments had a fair value of $84.8 million at March 31, 2010, and inception-to-date net unrealized gains of $3,000 that are recorded in accumulated other comprehensive income (loss). Included in our portfolio of available-for-sale investments at March 31, 2010, are inception-to-date gross unrealized losses of $0.2 million; these losses are temporary, as we believe the decline in fair value is primarily attributable to the limited liquidity of these investments. During fiscal 2010, no securities had an other-than-temporary impairment. During fiscal 2009, we recorded impairment charges of $6.3 million to interest and other income (expense), net, related to declines in fair value that we concluded were other than temporary. Of this fiscal 2009 impairment, $2.0 million related to a downgrade in one security's rating from A to CCC- and $4.3 million related to securities received as collateral for former auction rate securities ("ARS") that were required to be unwound as a result of Lehman Brothers filing for bankruptcy protection.
Included in our portfolio of available-for-sale investments at March 31, 2010 are two long-term municipal securities, both ARS, which had a fair value of $1.9 million and inception-to-date unrealized losses of $0.1 million, and have been in a continuous unrealized loss position for more than 12 months. These losses are temporary as we believe the decline in fair value is primarily attributable to the limited liquidity of these investments. None of the available-for-sale securities held as of March 31, 2009 were in an unrealized loss position for more than 12 months.
The amount of pre-tax net unrealized gains on available-for-sale securities that has been included in accumulated other comprehensive income in fiscal 2010 was $1.0 million. In addition, in fiscal 2010, we had a pre-tax unrealized holding gain of $1.7 million on our investment in Yuke's Co., Ltd. ("Yuke's") that is classified as available-for-sale and is included in other long-term assets, net (see "Note 8—Other Long-Term Assets").
63
During fiscal 2010 there were $0.6 million of pre-tax realized gains and no realized losses from sales of available-for-sale securities. During fiscal 2009 there were $0.1 million of pre-tax realized gains and $0.4 million of pre-tax realized losses from sales of available-for-sale securities. Realized gains and losses on sales of available-for-sale securities are recognized in net income on the specific identification basis.
The following table summarizes the amortized cost and fair value of our available-for-sale investment securities, classified by stated maturity, at March 31, 2010 (in thousands):
| |
Amortized Cost |
Fair Value |
|||||||
|---|---|---|---|---|---|---|---|---|---|
Short-term investments: |
|||||||||
Due in one year or less |
$ | 31,834 | $ | 31,888 | |||||
Due after one year through five years |
50,955 | 51,053 | |||||||
Total short-term investments |
82,789 | 82,941 | |||||||
Long-term investments: |
|||||||||
Due after one year through five years |
500 | 490 | |||||||
Due after ten years |
1,500 | 1,361 | |||||||
Total long-term investments |
2,000 | 1,851 | |||||||
Total available-for-sale investment securities |
$ | 84,789 | $ | 84,792 | |||||
The following table summarizes the amortized cost and fair value of our investment securities, classified by stated maturity as of March 31, 2009 (in thousands):
| |
Amortized Cost |
Fair Value |
|||||||
|---|---|---|---|---|---|---|---|---|---|
Short-term investments: |
|||||||||
Due in one year or less |
$ | 8,802 | $ | 8,804 | |||||
Total short-term investments |
8,802 | 8,804 | |||||||
Long-term investments: |
|||||||||
Due after one year through five years |
500 | 490 | |||||||
Due after ten years |
4,975 | 4,535 | |||||||
Total long-term investments |
5,475 | 5,025 | |||||||
Total investment securities |
$ | 14,277 | $ | 13,829 | |||||
Auction Rate Securities
At March 31, 2010, we had $1.9 million of ARS classified as long-term available-for-sale investments, and $21.0 million of ARS classified as short-term trading investments, pledged. These ARS are variable rate bonds tied to short-term interest rates with long-term maturities. ARS have interest rate resets through a modified Dutch auction at predetermined short-term intervals, typically every 7, 28, or 35 days. Interest on ARS is generally paid at the end of each auction process or semi-annually and is based upon the interest rate determined during the prior auction. In addition, as further discussed below, we held a $1.7 million put option related to the short-term trading ARS that is also classified as short-term investments, pledged.
In October 2008, we entered into a settlement agreement with UBS, the broker of certain of our ARS (the "UBS Agreement"). The UBS Agreement provides us with Auction Rate Securities Rights ("Rights") to sell such ARS to UBS at the par value of the underlying securities at any time during the period from June 30, 2010 through July 2, 2012. These Rights are a freestanding instrument accounted for separately from the ARS, and are registered, nontransferable securities accounted for as a put option. Under the UBS Agreement, UBS may, at its discretion, sell the ARS at any time through July 2, 2012 without prior
64
notice, and must pay us par value for the ARS within one day of the settlement. The put option had a fair value of $1.7 million and is recorded in short-term investments, pledged in our March 31, 2010 consolidated balance sheet along with the underlying ARS which have a fair value of $21.0 million.
In fiscal 2010, the put option had a decline in value of $2.8 million which is recorded as a loss in interest and other income (expense), net in the consolidated statement of operations. Of this $2.8 million loss, $1.1 million relates to ARS which were settled in fiscal 2010, and is offset by a gain of $1.1 million on the settlement of the underlying ARS. The remaining loss on the put option of $1.7 million relates to trading securities still held by us at March 31, 2010, for which there is an offsetting gain of $1.9 million related to changes in their fair value. In aggregate, the gains from trading securities net almost entirely against the loss recognized on the put option.
In fiscal 2009, $0.2 million of net mark-to-market losses have been recorded in interest and other income (expense), net, in the accompanying consolidated statement of operations, related to trading securities still held at March 31, 2009. Included in the $0.2 million of net mark-to-market losses were gross losses of $5.5 million related to transfers of securities from the available-for-sale category into the trading category.
Additionally, pursuant to the UBS Agreement, we have the ability to borrow up to 75% of the market value of the ARS (as determined by UBS) at any time, on a no net interest basis, to the extent that such ARS continue to be illiquid or until June 30, 2010 (see "Note 10—Secured Credit Lines") and in return, we agreed to release UBS from certain potential claims related to the ARS in certain specified circumstances. The credit line is secured by certain of our ARS held with UBS, which have a par value of $23.0 million and a fair value of $21.0 million at March 31, 2010. At March 31, 2010, we had $13.2 million in borrowings outstanding under the UBS Agreement.
4. Fair Value
Fair value is the price that would be received to sell an asset or paid to transfer a liability in an orderly transaction between market participants on the measurement date. Valuation techniques used to measure fair value must maximize the use of observable inputs and minimize the use of unobservable inputs. There is a fair value hierarchy based on three levels of inputs, of which the first two are considered observable and the last unobservable, that may be used to measure fair value. We used the following methods and assumptions to estimate the fair value of our investment securities:
- •
- Level 1—Quoted prices in active markets for identical assets or liabilities that the reporting entity
has the ability to access at the measurement date. We do not adjust the quoted prices for these investments.
- •
- Level 2—Inputs other than Level 1 that are observable, either directly or indirectly, such as
quoted prices for similar assets or liabilities in active markets; quoted prices for identical or similar assets or liabilities in markets that are not active; or other inputs that are observable or
can be corroborated by observable market data for substantially the full term of the assets or liabilities.
- •
- Level 3—Discounted cash flow analysis using unobservable inputs that are supported by little or no market activity and that are significant to the fair value of the assets or liabilities, as discussed further below.
Our policy is to recognize transfers between these levels of the fair value hierarchy as of the beginning of the reporting period.
65
The following table summarizes our financial assets measured at fair value on a recurring basis as of March 31, 2010 (in thousands):
| |
Level 1 | Level 2 | Level 3 | Total | |||||||||||
|---|---|---|---|---|---|---|---|---|---|---|---|---|---|---|---|
Cash equivalents: |
|||||||||||||||
Money market funds |
$ | 21,049 | $ | — | $ | — | $ | 21,049 | |||||||
Negotiable certificates of deposit |
— | 28,545 | — | 28,545 | |||||||||||
Corporate securities |
— | 8,439 | — | 8,439 | |||||||||||
Municipal securities |
— | 14,175 | — | 14,175 | |||||||||||
Short-term investments: |
|||||||||||||||
Municipal securities |
— | 17,241 | — | 17,241 | |||||||||||
Corporate securities |
— | 64,354 | — | 64,354 | |||||||||||
Negotiable certificates of deposit |
— | 1,346 | — | 1,346 | |||||||||||
Short-term investments, pledged: |
|||||||||||||||
Student loan ARS |
— | — | 21,036 | 21,036 | |||||||||||
Put option |
— | — | 1,738 | 1,738 | |||||||||||
Long-term investments: |
|||||||||||||||
Municipal securities |
— | — | 1,851 | 1,851 | |||||||||||
Other long-term assets, net: |
|||||||||||||||
Investment in Yuke's |
5,564 | — | — | 5,564 | |||||||||||
Total |
$ | 26,613 | $ | 134,100 | $ | 24,625 | $ | 185,338 | |||||||
The following table summarizes our financial assets measured at fair value on a recurring basis as of March 31, 2009 (in thousands):
| |
Level 1 | Level 2 | Level 3 | Total | |||||||||||
|---|---|---|---|---|---|---|---|---|---|---|---|---|---|---|---|
Cash Equivalents: |
|||||||||||||||
Money market funds |
$ | 38,234 | $ | — | $ | — | $ | 38,234 | |||||||
Short-term investments: |
|||||||||||||||
Municipal securities |
— | 6,399 | — | 6,399 | |||||||||||
Corporate securities |
1,343 | 1,062 | — | 2,405 | |||||||||||
Long-term investments: |
|||||||||||||||
Municipal securities |
— | — | 31,102 | 31,102 | |||||||||||
Put option |
— | — | 4,541 | 4,541 | |||||||||||
Investment in Yuke's |
3,847 | — | — | 3,847 | |||||||||||
Total |
$ | 43,424 | $ | 7,461 | $ | 35,643 | $ | 86,528 | |||||||
Level 3 assets primarily consist of ARS, the majority of which are AAA/Aaa rated and collateralized by student loans guaranteed by the U.S. government under the Federal Family Education Loan Program and backed by monoline bond insurance companies. Substantially all of the remaining ARS are also backed by monoline bond insurance companies. We historically invested in these securities as part of our cash management program. However, the lack of liquidity in these credit markets has prevented us and other investors from selling these securities. As such, $1.9 million of these investments, not subject to the UBS Agreement, are classified as long-term at March 31, 2010 to reflect the lack of liquidity. We believe we have the ability to, and intend to, hold these ARS classified as available-for-sale until the auction process recovers or the securities mature. All of the securities are investment grade securities, and we have no reason to believe that any of the underlying issuers of these ARS are presently at risk or that the underlying credit quality of the assets backing these ARS has been impacted by the reduced liquidity of these investments. We have continued to receive interest payments on these ARS according to their terms.
66
We have estimated the fair value of these ARS using a discounted cash flow analysis that considered the following key inputs: i) credit quality, ii) estimates on the probability of the issue being called or sold prior to final maturity, iii) current market rates, and iv) estimates of the next time the security is expected to have a successful auction. The contractual terms of these securities do not permit the issuer to call, prepay or otherwise settle the securities at prices less than the stated par value of the security.
We have elected fair value accounting for the put option recorded in connection with the UBS Agreement, discussed in "Note 3—Investment Securities." This election was made in order to mitigate volatility in earnings caused by accounting for the put option and underlying ARS under different methods. We have estimated the value of the put option as the difference between the par value of the underlying ARS and the fair value of the ARS, after applying an estimated risk discount, as the put option gives us the right to sell the underlying ARS to the broker during the period June 30, 2010 to July 2, 2012 for a price equal to the par value.
The following table provides a summary of changes in fair value of our Level 3 financial assets in fiscal 2009 and 2010 (in thousands):
| |
Level 3 Fair Value Measurements |
||||
|---|---|---|---|---|---|
Balance at March 31, 2008 |
$ | 54,419 | |||
Total gains or (losses) (realized/unrealized): |
|||||
Included in earnings |
(4,554 | ) | |||
Included in accumulated other comprehensive income |
1,033 | ||||
Purchases, sales, issuances and settlements, net |
(11,120 | ) | |||
Transfers out of Level 3 |
(4,135 | ) | |||
Balance at March 31, 2009 |
$ | 35,643 | |||
Total gains or (losses) (realized/unrealized): |
|||||
Included in earnings |
156 | ||||
Included in accumulated other comprehensive income |
117 | ||||
Purchases, sales, issuances and settlements, net |
(8,880 | ) | |||
Transfers out of Level 3 |
(2,411 | ) | |||
Balance at March 31, 2010 |
$ | 24,625 | |||
In fiscal 2009, transfers out of Level 3 represent three ARS related to the Lehman Brothers bankruptcy, that once received, were valued using Level 1 and Level 2 inputs.
In fiscal 2010, transfers out of Level 3 represent ARS for which we received a call notice prior to September 30, 2009. Accordingly, these ARS were valued using Level 1 inputs and were classified as short-term investments in the condensed consolidated financial statements at September 30, 2009. In fiscal 2010, these ARS were settled at par.
Financial Instruments
The carrying value of certain financial instruments, including cash and cash equivalents, accounts receivable, accounts payable, accrued expenses, accrued royalties, and secured credit lines approximate fair value based on their short-term nature. Investments classified as available for sale and trading are stated at fair value.
The book value and fair value of our convertible senior notes at March 31, 2010 was $100.0 million and $109.4 million, respectively; we estimated the fair value based on level 2 inputs, specifically, inputs other than level 1 that are observable.
67
We transact business in many different foreign currencies and are exposed to financial market risk resulting from fluctuations in foreign currency exchange rates, particularly the GBP and the Euro, which may result in a gain or loss of earnings to us. We utilize foreign exchange forward contracts to mitigate foreign currency risk associated with foreign currency-denominated assets and liabilities, primarily certain inter-company receivables and payables. Our foreign exchange forward contracts are not designated as hedging instruments and are accounted for as derivatives whereby the fair value of the contracts are reported as other current assets or other current liabilities in our consolidated balance sheets, and the associated gains and losses from changes in fair value are reported in interest and other income (expense), net in the consolidated statements of operations.
Cash Flow Hedging Activities. From time to time, we hedge a portion of our foreign currency risk related to forecasted foreign currency denominated sales and expense transactions by entering into foreign exchange forward contracts that generally have maturities less than 90 days. Our hedging programs reduce, but do not entirely eliminate, the impact of currency exchange rate movements in net sales and operating expenses. During fiscal 2010, we entered into foreign exchange forward contracts related to cash flow hedging activities in the notional amount of $29.2 million. These contracts were settled during fiscal 2010 and resulted in a loss of $0.7 million, which is included in interest and other income (expense), net in our consolidated statements of operations. There were no such cash flow hedge activities during fiscal 2009.
Balance Sheet Hedging Activities. We utilize foreign exchange forward contracts to mitigate foreign currency risk associated with foreign currency-denominated assets and liabilities, primarily certain inter-company receivables and payables. Our foreign exchange forward contracts are not designated as hedging instruments and are accounted for as derivatives whereby the fair value of the contracts are reported as other current assets or other current liabilities in our consolidated balance sheets, and the associated gains and losses from changes in fair value are reported in interest and other income (expense), net in the consolidated statements of operations. The forward contracts generally have a contractual term of one month or less and are transacted near month-end. Therefore, the fair value of the forward contracts generally is not significant at each month-end.
At March 31, 2010 and March 31, 2009, we had foreign exchange forward contracts related to balance sheet hedging activities in the notional amount of $90.1 million and $67.2 million, respectively, with a fair value that approximates zero at both March 31, 2010 and March 31, 2009. We estimated the fair value of these contracts using Level 1 inputs, specifically, inputs obtained in quoted public markets. The net gain recognized from these contracts during fiscal 2010 was $4.8 million. The net loss recognized from these contracts during fiscal 2009 was $2.3 million. These gains and losses are included in interest and other income (expense), net in our consolidated statements of operations.
68
5. Accounts Receivable Allowances
Accounts receivable allowances at March 31, 2010, 2009 and 2008 consisted of the following (in thousands):
| |
Balance at Beginning of Period |
Provisions | Deductions | Balance at End of Period |
|||||||||
|---|---|---|---|---|---|---|---|---|---|---|---|---|---|
Year ended March 31, 2010 |
|||||||||||||
Allowance for price protection and returns |
$ | 75,312 | $ | 139,121 | $ | (145,307 | ) | $ | 69,126 | ||||
Allowance for co-op advertising |
13,327 | 28,758 | (35,417 | ) | 6,668 | ||||||||
Allowance for doubtful accounts and other |
12,394 | 118 | (10,762 | ) | 1,750 | ||||||||
Total |
$ | 101,033 | $ | 167,997 | $ | (191,486 | ) | $ | 77,544 | ||||
Year ended March 31, 2009 |
|||||||||||||
Allowance for price protection and returns |
$ | 92,788 | $ | 194,562 | $ | (212,038 | ) | $ | 75,312 | ||||
Allowance for co-op advertising |
19,907 | 53,309 | (59,889 | ) | 13,327 | ||||||||
Allowance for doubtful accounts and other |
346 | 14,412 | (2,364 | ) | 12,394 | ||||||||
Total |
$ | 113,041 | $ | 262,283 | $ | (274,291 | ) | $ | 101,033 | ||||
Year ended March 31, 2008 |
|||||||||||||
Allowance for price protection and returns |
$ | 66,071 | $ | 185,921 | $ | (159,204 | ) | $ | 92,788 | ||||
Allowance for co-op advertising |
13,612 | 48,008 | (41,713 | ) | 19,907 | ||||||||
Allowance for doubtful accounts and other |
866 | 67 | (587 | ) | 346 | ||||||||
Total |
$ | 80,549 | $ | 233,996 | $ | (201,504 | ) | $ | 113,041 | ||||
6. Balance Sheet Details
Inventory. Inventory at March 31, 2010 and 2009 consisted of the following (in thousands):
| |
March 31, 2010 |
March 31, 2009 |
||||||
|---|---|---|---|---|---|---|---|---|
Components |
$ | 2,447 | $ | 2,225 | ||||
Finished goods |
11,523 | 23,560 | ||||||
Inventory |
$ | 13,970 | $ | 25,785 | ||||
Property and Equipment, net. Property and equipment, net at March 31, 2010 and 2009 consisted of the following (in thousands):
| |
Useful Lives |
March 31, 2010 |
March 31, 2009 |
|||||||
|---|---|---|---|---|---|---|---|---|---|---|
Building |
30 yrs | $ | 730 | $ | 730 | |||||
Land |
— | 401 | 401 | |||||||
Computer equipment and software |
3-10 yrs | 53,454 | 50,382 | |||||||
Furniture, fixtures and equipment |
5 yrs | 7,444 | 7,705 | |||||||
Leasehold improvements |
3-6 yrs | 12,978 | 12,686 | |||||||
Automobiles |
2-5 yrs | 78 | 58 | |||||||
|
75,085 | 71,962 | ||||||||
Less: accumulated depreciation |
(46,711 | ) | (38,451 | ) | ||||||
Property and equipment, net |
$ | 28,374 | $ | 33,511 | ||||||
69
Depreciation expense associated with property and equipment amounted to $12.8 million, $17.5 million and $17.4 million for fiscal 2010, 2009 and 2008, respectively.
Accrued and Other Current Liabilities. Accrued and other current liabilities at March 31, 2010 and 2009 consisted of the following (in thousands):
| |
March 31, 2010 |
March 31, 2009 |
||||||
|---|---|---|---|---|---|---|---|---|
Accrued liabilities |
$ | 16,613 | $ | 25,425 | ||||
Settlement payment due to Jakks |
6,000 | — | ||||||
Accrued compensation |
34,696 | 27,058 | ||||||
Accrued venture partner expense |
— | 56,692 | ||||||
Deferred revenue, net |
6,403 | 17,289 | ||||||
Accrued third-party software developer milestones |
23,676 | 21,526 | ||||||
Accrued royalties |
49,944 | 42,150 | ||||||
Accrued and other current liabilities |
$ | 137,332 | $ | 190,140 | ||||
The current and long-term portions of the settlement payments due to Jakks reflects the present value of the consideration payable under the agreement between THQ and Jakks, as explained further in "Note 17—Settlement Agreements."
Accrued venture partner expense consisted of the preferred payments owed to Jakks for WWE video games sold under a license granted by World Wrestling Entertainment, Inc. for the period beginning July 1, 2006 and ending December 31, 2009. On August 17, 2009, we entered into a settlement agreement with Jakks that established the preferred payment rate owed to Jakks at a rate 40% lower than the previous contract rate. We had been accruing this expense at the contract payment rate that expired June 30, 2006, which, prior to the settlement, was the best basis available upon which to estimate this expense. As a result of establishing the preferred payment rate for the period under dispute, we revised our previous estimate, which resulted in a one-time reduction in accrued venture partner expense of $24.2 million, with a corresponding reduction in venture partner expense during the three months ended September 30, 2009. In addition, during the three months ended September 30, 2009, we paid Jakks $33.5 million, which we had previously not paid, pending the settlement of the preferred return rate matter (inclusive of a $32.8 million settlement amount related to the period beginning July 1, 2006 and ending March 31, 2009). As further explained in "Note 17—Settlement Agreements," the LLC was terminated as of December 31, 2009; the final amounts due Jakks were paid within fiscal 2010 and accordingly, the balance in accrued venture partner expense at March 31, 2010 was zero.
Other Long-Term Liabilities. Other long-term liabilities at March 31, 2010 and 2009 consisted of the following (in thousands):
| |
March 31, 2010 |
March 31, 2009 |
||||||
|---|---|---|---|---|---|---|---|---|
Accrued royalties |
$ | 75,163 | $ | 19,986 | ||||
Unrecognized tax benefits and related interest |
1,612 | 5,158 | ||||||
Deferred rent |
5,148 | 4,434 | ||||||
Accrued liabilities |
4,741 | 3,925 | ||||||
Settlement payment due to Jakks |
12,161 | — | ||||||
Other long-term liabilities |
$ | 98,825 | $ | 33,503 | ||||
70
7. Other Intangible Assets
Intangible assets include licenses, software development and other intangible assets. Intangible assets are included in other long-term assets, net, except licenses and software development, which are reported separately in the consolidated balance sheets. Other intangible assets at March 31, 2010 and 2009 consisted of the following (in thousands):
| |
|
March 31, 2010 | March 31, 2009 | |||||||||||||||||||
|---|---|---|---|---|---|---|---|---|---|---|---|---|---|---|---|---|---|---|---|---|---|---|
| |
Useful Lives |
Gross Carrying Amount |
Accumulated Amortization |
Net Amount |
Gross Carrying Amount |
Accumulated Amortization |
Net Amount |
|||||||||||||||
Software technology |
2-5 years | $ | 4,009 | $ | (4,009 | ) | $ | — | $ | 3,955 | $ | (930 | ) | $ | 3,025 | |||||||
Trade names |
3-10 years | 1,102 | (1,102 | ) | — | 1,282 | (624 | ) | 658 | |||||||||||||
Non-compete / Employment contracts |
1.5-6.5 years | 633 | (633 | ) | — | 633 | (615 | ) | 18 | |||||||||||||
Total |
$ | 5,744 | $ | (5,744 | ) | $ | — | $ | 5,870 | $ | (2,169 | ) | $ | 3,701 | ||||||||
Finite-lived other intangible assets were amortized using the straight-line method over the lesser of their estimated useful lives or the agreement terms, typically from one and one-half to ten years and are assessed for impairment whenever events or changes in circumstances indicate that their carrying amount may not be recoverable. Amortization of other intangible assets for fiscal 2010, 2009 and 2008 was $0.8 million, $1.8 million and $1.3 million, respectively. Additionally, in fiscal 2010 we recognized $2.9 million of restructuring charges related to the write-off of intangible assets related to our fiscal 2009 realignment plan.
8. Other Long-Term Assets
In addition to other intangible assets, other long-term assets include our investment in Yuke's, a Japanese video game developer. We own approximately 15% of Yuke's, which is publicly traded on the Nippon New Market in Japan. This investment is classified as available-for-sale and reported at fair value with unrealized holding gains and losses excluded from earnings and reported as a component of other comprehensive income (loss) until realized. In fiscal 2010 the pre-tax unrealized holding gain related to our investment in Yuke's was $1.7 million, and in fiscal 2009 the pre-tax unrealized holding loss was $3.2 million. As of March 31, 2010, the inception-to-date net unrealized holding gain on our investment in Yuke's was $2.4 million. Due to the long-term nature of this relationship, this investment is included in other long-term assets in the consolidated balance sheets.
Other long-term assets as of March 31, 2010 and 2009 consisted of the following (in thousands):
| |
March 31, 2010 |
March 31, 2009 |
||||||
|---|---|---|---|---|---|---|---|---|
Investment in Yuke's |
$ | 5,564 | $ | 3,847 | ||||
Other intangible assets (see Note 7) |
— | 3,701 | ||||||
Deferred financing costs |
2,781 | — | ||||||
Other |
2,255 | 2,931 | ||||||
Total other long-term assets |
$ | 10,600 | $ | 10,479 | ||||
9. Restructuring
During fiscal 2009, we updated our strategic plan in an effort to increase our profitability and cash flow generation. We significantly realigned our business to focus on fewer, higher quality games, and have established an operating structure that supports our more focused product strategy. The realignment included the cancellation of several titles in development, the closure or spin-off of several of our
71
development studios, and the streamlining of our corporate organization in order to support the new product strategy, including reductions in worldwide personnel.
As a result of these initiatives, we recorded $5.7 million and $12.3 million in restructuring charges for fiscal 2010 and 2009, respectively, resulting in restructuring charges of $18.0 million incurred to date. Restructuring charges are recorded as restructuring expenses in our consolidated statement of operations and include the costs associated with lease abandonments less estimates of sublease income, write-off of related long-lived assets due to the studio closures, as well as costs of other non-cancellable contracts. We do not expect any future charges under the fiscal 2009 realignment, other than additional facility related charges in the event actual and estimated sublease income changes.
The following table summarizes the significant components and activity under the restructuring plan for fiscal 2010 and 2009 and the accrual balances as of March 31, 2010 and 2009 (in thousands):
| |
Lease and Contract Terminations |
Asset Impairments |
Total | ||||||||
|---|---|---|---|---|---|---|---|---|---|---|---|
Balance as of March 31, 2008 |
$ | — | $ | — | $ | — | |||||
Charges to operations |
5,617 | 6,649 | 12,266 | ||||||||
Non-cash write-offs |
— | (6,649 | ) | (6,649 | ) | ||||||
Cash payments |
(1,447 | ) | — | (1,447 | ) | ||||||
Foreign currency and other adjustments |
886 | — | 886 | ||||||||
Balance as of March 31, 2009 |
$ | 5,056 | $ | — | $ | 5,056 | |||||
Charges to operations |
1,936 | 3,735 | 5,671 | ||||||||
Non-cash write-offs |
— | (3,735 | ) | (3,735 | ) | ||||||
Cash payments |
(4,828 | ) | — | (4,828 | ) | ||||||
Foreign currency and other adjustments |
228 | — | 228 | ||||||||
Balance as of March 31, 2010 |
$ | 2,392 | $ | — | $ | 2,392 | |||||
As of March 31, 2010, $1.6 million of the restructuring accrual is included in accrued short-term liabilities and $0.8 million is included in other long-term liabilities. As of March 31, 2009, $2.2 million of the restructuring accrual was included in accrued short-term liabilities and $2.8 million was included in other long-term liabilities. The accrual balance as of March 31, 2010 relates to future lease payments for facilities vacated under our 2009 restructuring plan, offset by estimates of future sublease income. We expect the final settlement of this accrual to occur by August 1, 2015, which is the last payment date under our longest lease agreement that was abandoned under our restructuring.
In fiscal 2010, related to the 2009 realignment plan, we also incurred:
- •
- non-cash charges of $7.9 million, recorded in cost of sales—software amortization and
royalties, related to the write-off of capitalized software for games that were cancelled in connection with the realignment plan; and
- •
- cash charges of $1.3 million related to severance and other employee benefits. Employee related severance costs are classified in product development, selling and marketing, and general and administrative expenses in the accompanying consolidated statements of operations based upon the employee's classification.
In fiscal 2009, related to the realignment plan, we also incurred:
- •
- non-cash charges of $63.3 million, recorded in cost of sales—software amortization and
royalties, related to the write-off of capitalized software for games that were cancelled in connection with the realignment plan;
- •
- non-cash charges of $1.0 million, recorded in cost of sales—license amortization and royalties, related to impairment of licenses in connection with the cancelled games; and
72
- •
- cash charges of $12.7 million related to severance and other employee benefits. Employee related severance costs are classified in product development, selling and marketing, and general and administrative expenses in the accompanying consolidated statements of operations based upon the employee's classification.
10. Secured Credit Lines
In October 2008, we obtained a line of credit with UBS in conjunction with the ARS settlement agreement (see "Note 3—Investment Securities"), which allows for borrowings of up to 75% of the market value of the ARS, as determined by UBS. Borrowings under the line of credit are due on demand and are secured by certain of our ARS held with UBS, which have a par value of $23.0 million and a fair value of $21.0 million at March 31, 2010. As long as any borrowings are outstanding under the line of credit, all interest, dividends, distributions, premiums, and other income and payments received into our ARS investment account at UBS will be automatically transferred to UBS as payments on the line of credit. Additionally, proceeds from any liquidation, redemption, sale or other disposition of all or part of the ARS will be automatically transferred to UBS as payments. If these payments are insufficient to pay all accrued interest on the borrowings by the monthly due date, then UBS will either require us to make additional interest payments or, at UBS' discretion, capitalize unpaid interest as an additional advance. UBS' intent is to cause the interest rate payable by us to be equal to the weighted average interest or dividend rate payable to us on the ARS pledged as collateral. Upon cancellation of the line of credit, we will be reimbursed for any amount paid in interest on the line of credit that exceeds the income on the ARS. We had $13.2 million in borrowings outstanding, at an interest rate of 0.6%, on this line of credit at March 31, 2010.
In December 2008, we obtained a margin account at Wells Fargo & Company for the purpose of borrowing against our ARS; this account was terminated in the three months ended December 31, 2009.
11. Convertible Senior Notes
On August 4, 2009, we issued $100.0 million 5.00% convertible senior notes ("Notes"). After offering costs, the net proceeds to THQ were $96.8 million. The Notes are due August 15, 2014, unless earlier converted, redeemed or repurchased. The Notes pay interest semiannually, in arrears on February 15 and August 15 of each year, beginning February 15, 2010, through maturity and are convertible at each holder's option at any time prior to the close of business on the trading day immediately preceding the maturity date. The Notes are our unsecured and unsubordinated obligations.
The Notes are initially convertible into shares of our common stock at a conversion rate of 117.4743 shares of common stock per $1,000 principal amount of Notes, equivalent to an initial conversion price of approximately $8.51 per share. At this conversion rate and upon conversion of 100% of our Notes outstanding at March 31, 2010, our Notes would convert into 11.7 million shares of common stock. The conversion rate is subject to adjustment in certain events such as a stock split, the declaration of a dividend or the issuance of additional shares. Also, the conversion rate will be subject to an increase in certain events constituting a make-whole fundamental change; the maximum number of shares to be issued under which cannot exceed 14.7 million. The Notes will be redeemable, in whole or in part, at our option, at any time after August 20, 2012 for cash, at a redemption price of 100% of the principal amount of the Notes, plus accrued but unpaid interest, if the price of a share of our common stock has been at least 150% of the conversion price then in effect for specified periods. In the case of certain events such as acquisition or liquidation of THQ, or delisting of our common stock from a U.S. national securities exchange, holders may require us to repurchase all or a portion of the Notes for cash at a purchase price of 100% of the principal amount of the Notes, plus accrued and unpaid interest.
Costs incurred related to the Notes offering amounted to $3.2 million and are classified as other long-term assets, net in the consolidated balance sheet at March 31, 2010; these costs are being amortized on a
73
straight-line basis over the term of the Notes. Amortization expense associated with these costs was $0.4 million in fiscal 2010 and is classified as interest and other income (expense), net in the consolidated statements of operations. Additionally, interest expense related to the Notes was $3.1 million in fiscal 2010 and is classified as interest and other income (expense), net in the consolidated statement of operations. The effective interest rate, including amortization of debt issuance costs, for fiscal 2010 was 5.35%. In fiscal 2010 we paid $2.7 million in interest on the Notes.
12. Credit Facility
On June 30, 2009, we entered into a Loan and Security Agreement (the "Credit Facility") with Bank of America, N.A. ("B of A"), as agent, and the lenders party thereto from time to time. The Credit Facility provides for a $35.0 million revolving credit facility, which can be increased to $50.0 million, subject to lender consent, pursuant to a $15.0 million accordion feature, and includes a $15.0 million letter of credit subfacility.
The Credit Facility has a three-year term and bears interest at a floating rate equivalent to, at our option, either the base rate plus a spread of 1.0% to 2.5% or LIBOR plus 2.5% to 4.0%, depending on the fixed charge coverage ratio. Borrowings under the Credit Facility are conditioned on our maintaining a certain fixed charge coverage ratio and a certain liquidity level, as set forth in the Credit Facility. In fiscal 2010, we incurred fees totaling $0.6 million related to the initiation of the Credit Facility, of which $0.4 million was a closing fee paid to B of A. We will be required to pay other customary fees, including an unused line fee based on usage under the Credit Facility. The borrowing capacity under the Credit Facility fluctuates based upon our levels of U.S. accounts receivable, subject to standard deductions and reserves. At March 31, 2010, we had no borrowings under the Credit Facility and $35.0 million of available borrowing capacity. In fiscal 2010, we incurred unused line fees amounting to less than $0.1 million; these fees are classified as general and administrative expenses in the consolidated statements of operations.
The Credit Facility is guaranteed by most of our domestic subsidiaries (each, an "Obligor") and secured by substantially all of our assets.
The Credit Facility contains customary affirmative and negative covenants, including, among other terms and conditions, limitations on our and each Obligor's ability to: create, incur, guarantee or be liable for indebtedness (other than certain types of permitted indebtedness); dispose of assets outside the ordinary course (subject to certain exceptions); acquire, merge or consolidate with or into another person or entity (other than certain types of permitted acquisitions); create, incur or allow any lien on any of their respective properties (except for certain permitted liens); make investments or capital expenditures (other than certain types of investments or capital expenditures); or pay dividends or make distributions (each subject to certain limitations). In addition, the Credit Agreement provides for certain events of default such as nonpayment of principal and interest when due there under, breaches of representations and warranties, noncompliance with covenants, acts of insolvency and default on certain material contracts (subject to certain limitations and cure periods). At March 31, 2010 we were in compliance with all covenants related to the Credit Facility.
13. Capital Stock Transactions
On July 31, 2007 and October 30, 2007, our board authorized the repurchase of up to $25.0 million of our common stock from time to time on the open market or in private transactions, for an aggregate of $50.0 million. As of March 31, 2010 and 2009 we had $28.6 million, authorized and available for common stock repurchases. During fiscal 2010 we did not repurchase any shares of our common stock. There is no expiration date for the authorized repurchases.
74
14. Accumulated Other Comprehensive Income (Loss)
The components of accumulated other comprehensive income (loss) were as follows (in thousands):
| |
Foreign Currency Translation Gains (Losses) |
Net Unrealized Gains (Losses) on Securities |
Net Accumulated Other Comprehensive Income (Loss) |
|||||||
|---|---|---|---|---|---|---|---|---|---|---|
Balance at March 31, 2007 |
$ | 16,107 | $ | 1,496 | $ | 17,603 | ||||
Other comprehensive income |
9,372 | 219 | 9,591 | |||||||
Balance at March 31, 2008 |
25,479 | 1,715 | 27,194 | |||||||
Other comprehensive loss |
(28,019 | ) | (1,567 | ) | (29,586 | ) | ||||
Balance at March 31, 2009 |
(2,540 | ) | 148 | (2,392 | ) | |||||
Other comprehensive income |
8,978 | 1,281 | 10,259 | |||||||
Balance at March 31, 2010 |
$ | 6,438 | $ | 1,429 | $ | 7,867 | ||||
The foreign currency translation adjustments relate to indefinite investments in non-U.S. subsidiaries and thus are not adjusted for income taxes.
15. Earnings (Loss) Per Share
Basic earnings (loss) per share is computed as net income (loss) attributable to THQ Inc. divided by the weighted-average number of shares outstanding for the period. Diluted earnings per share reflects the potential dilution that could occur from common shares issuable through stock-based compensation plans including stock options, stock-based awards, purchase opportunities under our ESPP, and the conversion of the Notes (see "Note 11—Convertible Senior Notes"). Under the provisions of the if-converted method, the Notes are assumed to have been converted at the beginning of the respective period, or at the time of issuance if later, and are included in the denominator of the diluted calculation and the after-tax interest expense and amortization of debt issuance costs in connection with the Notes are added back to the numerator of the diluted calculation. However, the if-converted amounts are only included in the numerator and denominator of the diluted calculation if the result of the if-converted calculation is dilutive.
The following table is a reconciliation of the weighted-average shares used in the computation of basic and diluted loss per share for the periods presented (in thousands):
| |
Fiscal Year Ended March 31, | |||||||||
|---|---|---|---|---|---|---|---|---|---|---|
| |
2010 | 2009 | 2008 | |||||||
Net loss attributable to THQ Inc. used to compute basic loss per share |
$ | (9,017 | ) | $ | (431,112 | ) | $ | (35,337 | ) | |
Weighted average number of shares outstanding—basic |
67,522 |
66,861 |
66,475 |
|||||||
Dilutive effect of potential common shares |
— | — | — | |||||||
Number of shares used to compute loss per share—diluted |
67,522 | 66,861 | 66,475 | |||||||
As a result of our net loss for fiscal 2010, the result of the if-converted calculation applied to our Notes issued on August 4, 2009, was antidilutive and as such we did not include the potential conversion of 11.7 million shares under our Notes in our diluted loss per share calculation. Additionally, after-tax interest expense and amortization of debt issuance costs in connection with the Notes totaling $3.1 million and $0.4 million (net of tax of zero; see "Note 19—Income Taxes" for further information), respectively, was not added back to the numerator of the diluted calculation for fiscal 2010.
75
As a result of our net loss for fiscal years 2010, 2009, and 2008, all potential shares were excluded from the computation of diluted earnings per share, as their inclusion would have been antidilutive. There were 10.4 million, 9.0 million and 5.2 million potential common shares that were excluded from the computation of diluted loss per share for fiscal 2010, 2009 and 2008, respectively. Had we reported net income for fiscal 2010, 2009 and 2008, an additional 0.3 million, 0.7 million and 1.8 million shares of common stock, respectively, would have been included in the number of shares used to calculate diluted earnings per share.
16. Employee Defined Contribution Plan
For our United States employees we sponsor a defined contribution plan under Section 401(k) of the Internal Revenue Code. The plan allows for discretionary company matching of employee contributions as well as discretionary profit-sharing contributions based on company performance. We also have various defined contribution/pension plans for our non-U.S. employees, some of which are required by local laws, and allow or require company contributions. Employer contributions under all defined contribution/pension plans were $1.9 million, $5.9 million and $6.1 million in fiscal 2010, 2009 and 2008, respectively. The decrease in employer contributions in fiscal 2010 was related to our cost containment efforts for discretionary plans.
17. Settlement Agreements
Settlement Agreement between THQ and Jakks related to the Preferred Return Arbitration
In June 1998, the THQ / Jakks Pacific, LLC ("LLC") joint venture entered into a video game license agreement with the WWE; the license granted the LLC exclusive worldwide rights to publish video games based upon WWE content (the "License"). In October 1999, we entered into an operating agreement with JAKKS Pacific, Inc. ("Jakks") that governed our relationship with respect to the License (the "LLC Operating Agreement"). Pursuant to the LLC Operating Agreement, THQ was responsible for funding all operations, including all payments owed to WWE, and managing the day-to-day operations of the LLC, including all tasks necessary to develop and publish the WWE-licensed games; Jakks was responsible for the approval process and other relationship matters with WWE.
Pursuant to the terms of the LLC Operating Agreement, JAKKS was entitled to a preferred payment from net sales derived from exploitation of the WWE videogame license (the "Preferred Return"); THQ was entitled to the remaining profits and cash distributions of the LLC. Accordingly, prior to December 31, 2009, the results of the LLC were consolidated with our results, as THQ was determined to be the primary beneficiary of the LLC. The Preferred Return was classified as "cost of sales—venture partner expense" in the accompanying consolidated statements of operations. The LLC was dissolved as of December 31, 2009 (see below—"Agreements between THQ and Jakks") and thus as of January 1, 2010 we will no longer consolidate the LLC's results nor record a venture partner expense.
The LLC Operating Agreement set the rate of the Preferred Return through December 31, 2003 and thereafter THQ and Jakks extended the Preferred Return rate through June 30, 2006. The percentage of the Preferred Return for the period beginning July 1, 2006 and ending December 31, 2009 (the "Subsequent Distribution Period") was to be determined by agreement or, failing that, by arbitration. The parties were unable to reach agreement on the Preferred Return rate for the Subsequent Distribution Period and thus submitted their dispute to binding arbitration. In July, 2009, the arbitrator rendered a decision accepting our position and establishing a significantly lower Preferred Return rate to JAKKS. The new rate was effective as of July 1, 2006 and applied through December 31, 2009. On August 17, 2009, we entered into a settlement agreement with JAKKS, which reflected the decision of the arbitrator. From July 1, 2006 through June 30, 2009, we had been accruing this expense at the contract payment rate that expired June 30, 2006, which, prior to the arbitrator's decision, was the best basis available upon which to estimate this expense. As a result of establishing the Preferred Return rate for the period under dispute,
76
we revised our previous estimate which resulted in a one-time reduction in accrued venture partner expense of $24.2 million, with a corresponding reduction in venture partner expense during the three months ended September 30, 2009. In August 2009, we paid Jakks $32.8 million, related to the period beginning July 1, 2006 and ending March 31, 2009, which we had previously not paid, pending the settlement of the Preferred Return rate matter.
Settlement Agreements related to the License
From October 2004 through December 2009, we were involved in various legal disputes with both WWE and Jakks related to the License. On December 22, 2009, we entered into settlement agreements with both WWE and Jakks related to the License and the LLC. The material terms of the agreements are summarized below. The summary is qualified in its entirety by reference to the Agreements.
Settlement Agreement between THQ and WWE
The settlement agreement between THQ and the WWE provides that (i) THQ will pay $13,175,000 to the WWE; (ii) WWE will dismiss with prejudice all remaining claims against THQ, Jakks and the LLC; and (iii) THQ and WWE will release claims against each other (including claims against Brian Farrell) as more fully specified in the WWE Settlement Agreement. The settlement agreement contained a provision stating that it would not become effective unless and until, prior to December 31, 2009, (a) THQ and WWE entered into a new license agreement for WWE video games, (b) WWE entered into a release agreement with Jakks, and (c) THQ entered into a settlement agreement with Jakks. This settlement agreement became effective on December 22, 2009. Accordingly, in December 2009, THQ paid $13,175,000 to WWE and all remaining claims against THQ, Jakks and the LLC were dismissed or withdrawn, with prejudice.
Agreements between THQ and Jakks
We entered into two agreements with Jakks. The first settlement agreement (1) terminated the LLC Operating Agreement and provided for the parties to dissolve the LLC as of December 31, 2009; (2) vests ownership of, and all right, title and interest in and to, all assets, obligations and liabilities of the LLC, including, but not limited to, intellectual property belonging to the LLC in THQ, effective January 1, 2010; (3) allows THQ to enter into a video game license with WWE effective January 1, 2010; and (4) provides that the LLC shall not renew the License and that any notice of renewal sent to the WWE shall be of no force and effect and thus the License shall terminate as of December 31, 2009. As consideration for the termination provisions set forth in this agreement, THQ agreed to pay Jakks a total of $20.0 million as follows: (a) $6.0 million on or before June 30, 2010; (b) $6.0 million on or before June 30, 2011; (c) $4.0 million on or before June 30, 2012; and (d) $4.0 million on or before June 30, 2013. The present value of these amounts is included in other current liabilities and other long-term liabilities in our March 31, 2010 consolidated balance sheet. The LLC was dissolved as of December 31, 2009.
The second settlement agreement between THQ and Jakks provides that THQ shall make the payments to Jakks as set forth in the above-referenced agreement and that the parties will dismiss and/or withdraw with prejudice all outstanding claims against each other. As of December 31, 2009, both parties had dismissed or withdrew, with prejudice, all claims against each other.
To determine the appropriate accounting for the settlement agreements, we first identified the various elements of each arrangement. We determined that we were not able to reliably estimate the fair value of the litigation component of the settlement, and thus have measured this component as the residual value remaining after determining the fair value of any assets received. The fair value of the assets received—the new WWE license—was determined using Level 3 valuation inputs; specifically, a discounted future cash flow model, over the eight-year term of the license, and we concluded that the license rate approximated
77
fair value. As a result, in the period ended December 31, 2009, we recorded a $29.5 million charge which was classified as venture partner expense and represented the present value of the current and future cash payment contained in the settlement (the residual value), less amounts previously accrued.
18. Stock-based Compensation
Prior to July 20, 2006, we utilized two stock option plans: the THQ Inc. Amended and Restated 1997 Stock Option Plan (the "1997 Plan") and the THQ Inc. Third Amended and Restated Nonexecutive Employee Stock Option Plan (the "NEEP Plan"). The 1997 Plan provided for the issuance of up to 14,357,500 shares available for employees, consultants and non-employee directors, and the NEEP Plan provided for the issuance of up to 2,142,000 shares available for nonexecutive employees of THQ of which no more than 20% was available for awards to our nonexecutive officers and no more than 15% was available for awards to the nonexecutive officers or general managers of our subsidiaries or divisions. The 1997 Plan and the NEEP Plan were cancelled on July 20, 2006, the same day THQ's stockholders approved the THQ Inc. 2006 Long-Term Incentive Plan ("LTIP").
Under the 1997 Plan, we granted incentive stock options, non-qualified stock options, performance accelerated restricted stock ("PARS") and performance accelerated restricted stock units ("PARSUs"). The NEEP Plan provided for the grant of only non-qualified stock options to non-executive officers of the Company. The LTIP provides for the grant of stock options (including incentive stock options), stock appreciation rights ("SARs"), restricted stock awards, restricted stock units ("RSUs"), and other performance awards (in the form of performance shares or performance units) to eligible directors and employees of, and consultants or advisors to, the Company. Subject to certain adjustments, as of March 31, 2010, the total number of shares of THQ common stock that may be issued under the LTIP shall not exceed 11,500,000 shares. Shares subject to awards of stock options or SARs will count as one share for every one share granted against the share limit, and all other awards will count as 2.17 shares for every one granted against the share limit. As of March 31, 2010, we had 5,616,298 shares available for grant under the LTIP.
The purchase price per share of common stock purchasable upon exercise of each option granted under the 1997 Plan, the NEEP Plan and the LTIP may not be less than the fair market value of such share of common stock on the date that such option is granted. Generally, options granted under our plans become exercisable over three years and expire on the fifth anniversary of the grant date. Other vesting terms are as follows:
- •
- PARS and PARSUs that have been granted to our officers under the 1997 Plan and the LTIP vest with respect to 100% of the
shares subject to the award on the fifth anniversary of the grant date subject to continued employment of the grantee; provided, however, 20% of the shares subject to each award will vest on each of
the first through fourth anniversaries of the grant date if certain performance targets for the Company are attained each fiscal year.
- •
- PARSUs granted to our non-employee directors under the 1997 Plan are currently fully vested.
- •
- Deferred Stock Units ("DSUs") granted to our non-employee directors under the LTIP vest monthly over a twelve
month period; provided, however, DSUs may not be released to a director until thirteen months after the date of grant. DSUs granted to our non-employee directors prior to July 31,
2008 under the LTIP vested immediately but were also subject to a thirteen-month release restriction.
- •
- RSUs granted to our employees do not carry any performance or acceleration conditions. Certain awards vest with respect to 100% of the shares on the third anniversary of the grant date and other awards vest at each anniversary of the grant date over a three-year period, all subject to continued employment of the grantee.
78
The fair value of our restricted stock and restricted stock units is determined based on the closing trading price of our common stock on the grant date. The fair value of PARS, PARSUs, DSUs and RSUs granted is amortized over the vesting period.
Beginning in March 2007, we offered our non-executive employees the ability to participate in an employee stock purchase plan, as amended and restated ("ESPP"). Under the ESPP, up to 1,500,000 shares of our common stock may be purchased by eligible employees during six-month offering periods that commence each March 1 and September 1, or the first business day thereafter (each, an "Offering Period"). The first business day of each Offering Period is referred to as the "Offering Date." The last business day of each Offering Period is referred to as the "Purchase Date." Pursuant to our ESPP, eligible employees may authorize payroll deductions of up to 15 percent of their base salary, subject to certain limitations, to purchase shares of our common stock at 85 percent of the lower of the fair market value of our common stock on the Offering Date or Purchase Date. The fair value of the ESPP options granted is amortized over the offering period.
Stock-based compensation includes all awards and purchase opportunities: stock options, PARS, PARSUs, DSUs, RSUs and ESPP options. Nonvested shares and vested shares refer to our PARS, PARSU, DSU and RSU awards.
For fiscal 2010, 2009 and 2008, stock-based compensation expense recognized in the consolidated statements of operations was as follows (in thousands):
| |
Year Ended March 31, | ||||||||||
|---|---|---|---|---|---|---|---|---|---|---|---|
| |
2010 | 2009 | 2008 | ||||||||
Cost of sales—software amortization and royalties |
$ | 3,408 | $ | 5,797 | $ | 6,800 | |||||
Product development |
2,606 | 3,242 | 4,773 | ||||||||
Selling and marketing |
1,181 | 2,432 | 2,654 | ||||||||
General and administrative |
4,688 | 7,128 | 8,444 | ||||||||
Stock-based compensation expense before income taxes |
11,883 | 18,599 | 22,671 | ||||||||
Income tax benefit(1) |
(3,352 | ) | (5,447 | ) | (6,132 | ) | |||||
Total stock-based compensation expense after income taxes |
$ | 8,531 | $ | 13,152 | $ | 16,539 | |||||
- (1)
- Income tax benefit presented for fiscal 2010 and a portion of fiscal 2009 is presented prior to consideration of our deferred tax asset valuation allowance; see "Note 19—Income Taxes" for further information.
As discussed in "Note 1—Description of Business and Summary of Significant Accounting Policies," we capitalize relevant amounts of stock-based compensation expense. The following table summarizes stock-based compensation expense included in our consolidated balance sheets as a component of software development (in thousands):
Balance at March 31, 2008 |
$ | 2,802 | ||
Stock-based compensation expense capitalized during the period |
5,368 | |||
Amortization of capitalized stock-based compensation expense |
(5,797 | ) | ||
Balance at March 31, 2009 |
$ | 2,373 | ||
Stock-based compensation expense capitalized during the period |
2,637 | |||
Amortization of capitalized stock-based compensation expense |
(3,408 | ) | ||
Balance at March 31, 2010 |
$ | 1,602 | ||
79
Stock-based compensation expense is based on awards that are ultimately expected to vest and accordingly, stock-based compensation expense recognized in fiscal 2010, 2009, and 2008 has been reduced by estimated forfeitures. Our estimate of forfeitures is based on historical forfeiture behavior as well as any expected trends in future forfeiture behavior.
The fair value of stock options and ESPP options granted is estimated on the date of grant using the Black-Scholes option pricing model. Anticipated volatility is based on implied volatilities from traded options on our stock and on our stock's historical volatility. The expected term of our stock options granted is based on historical exercise data and represents the period of time that stock options granted are expected to be outstanding and the expected term for our ESPP options is the six-month offering period. Separate groups of employees that have similar historical exercise behavior are considered separately for valuation purposes. The risk-free rate for periods within the expected lives of stock options and ESPP options are based on the US Treasury yield in effect at the time of grant.
The weighted-average grant-date fair value per share of options granted during fiscal 2010, 2009 and 2008 was $2.77, $3.25 and $8.28, respectively, and were based on the weighted-average assumptions noted in the table below.
| |
Year Ended March 31, 2010 |
Year Ended March 31, 2009 |
Year Ended March 31, 2008 |
|||||||
|---|---|---|---|---|---|---|---|---|---|---|
Dividend yield |
— | % | — | % | — | % | ||||
Anticipated volatility |
65.6 | % | 46.8 | % | 36 | % | ||||
Weighted-average risk-free interest rate |
1.5 | % | 1.8 | % | 3.9 | % | ||||
Expected lives |
3.0 years | 3.0 years | 3.2 years | |||||||
The fair value per share of ESPP options for the six-month offering periods that began on March 1, 2010, September 1, 2009 and September 2, 2008, was $1.62, $1.98, and $3.98, respectively, and were based on the weighted-average assumptions noted in the table below.
| |
March 1, 2010 | September 1, 2009 | September 2, 2008 | |||||||
|---|---|---|---|---|---|---|---|---|---|---|
Dividend yield |
— | % | — | % | — | % | ||||
Anticipated volatility |
48.1 | % | 84.5 | % | 36.8 | % | ||||
Weighted-average risk-free interest rate |
0.2 | % | 0.2 | % | 1.9 | % | ||||
Expected lives |
0.5 years | 0.5 years | 0.5 year | |||||||
80
A summary of our stock option activity for fiscal 2010, 2009 and 2008 is as follows (in thousands, except per share amounts):
| |
Options | Weighted- Average Exercise Price |
Weighted- Average Remaining Contractual Term (in years) |
Aggregate Intrinsic Value |
||||||||||
|---|---|---|---|---|---|---|---|---|---|---|---|---|---|---|
Outstanding at March 31, 2007 |
7,564 | $ | 19.15 | |||||||||||
Granted |
2,982 | $ | 27.44 | |||||||||||
Exercised |
(1,422 | ) | $ | 14.89 | ||||||||||
Forfeited/expired/cancelled |
(1,007 | ) | $ | 25.86 | ||||||||||
Outstanding at March 31, 2008 |
8,117 | $ | 22.10 | |||||||||||
Granted |
3,925 | $ | 10.40 | |||||||||||
Exercised |
(438 | ) | $ | 13.71 | ||||||||||
Forfeited/expired/cancelled |
(2,779 | ) | $ | 20.42 | ||||||||||
Outstanding at March 31, 2009 |
8,825 | $ | 17.84 | |||||||||||
Granted |
4,203 | $ | 6.26 | |||||||||||
Exercised |
(121 | ) | $ | 4.62 | ||||||||||
Forfeited/expired/cancelled |
(3,701 | ) | $ | 15.89 | ||||||||||
Outstanding at March 31, 2010 |
9,206 | $ | 13.51 | 3.1 | $ | 6,914 | ||||||||
Vested and expected to vest |
8,392 | $ | 13.94 | 3.1 | $ | 6,248 | ||||||||
Exercisable at March 31, 2010 |
3,678 | $ | 20.73 | 1.8 | $ | 1,105 | ||||||||
The aggregate intrinsic value is calculated as the difference between the exercise price of a stock option and the quoted price of our common stock at March 31, 2010. It excludes stock options that have exercise prices in excess of the quoted price of our common stock at March 31, 2010. The aggregate intrinsic value of stock options exercised during fiscal 2010, 2009 and 2008 was $0.2 million, $2.6 million and $19.5 million, respectively.
81
A summary of the status of our nonvested shares for fiscal 2010, 2009, and 2008 is as follows (in thousands, except per share amounts):
| |
Shares | Weighted- Average Grant-date Fair Value Per Share |
|||||
|---|---|---|---|---|---|---|---|
Nonvested shares at March 31, 2007 |
339 | $ | 21.81 | ||||
Granted |
494 | $ | 29.74 | ||||
Vested |
(92 | ) | $ | 23.60 | |||
Forfeited/cancelled |
(129 | ) | $ | 25.34 | |||
Nonvested shares at March 31, 2008 |
612 | $ | 22.16 | ||||
Granted |
369 | $ | 17.73 | ||||
Vested |
(83 | ) | $ | 22.88 | |||
Forfeited/cancelled |
(179 | ) | $ | 20.99 | |||
Nonvested shares at March 31, 2009 |
719 | $ | 20.09 | ||||
Granted |
42 | $ | 6.49 | ||||
Vested |
(135 | ) | $ | 11.66 | |||
Forfeited/cancelled |
(167 | ) | $ | 20.74 | |||
Nonvested shares at March 31, 2010 |
459 | $ | 19.40 | ||||
The unrecognized compensation cost, that we expect to recognize, related to our nonvested stock-based awards at March 31, 2010, and the weighted-average period over which we expect to recognize that compensation, is as follows (in thousands):
| |
Unrecognized Compensation Cost at March 31, 2010 |
Weighted- Average Period (in years) |
|||||
|---|---|---|---|---|---|---|---|
Stock options |
$ | 11,117 | 1.4 | ||||
Nonvested shares |
3,258 | 1.7 | |||||
ESPP |
187 | 0.4 | |||||
|
$ | 14,562 | |||||
Cash received from exercises of stock options for fiscal 2010, 2009 and 2008 was $0.6 million, $6.0 million and $21.1 million, respectively. The actual tax benefit realized for the tax deductions from exercises of all stock-based awards totaled zero for fiscal 2010 and 2009 and $5.5 million for fiscal 2008.
During fiscal 2010 we increased additional paid-in capital by $4.1 million (net of tax of $0.2 million) related to a reduction in our unrecognized tax benefits, primarily related to favorable resolutions of U.S. federal income tax examinations for the years March 31, 2004 through March 31, 2005.
The fair value of all our stock-based awards that vested during fiscal 2010, 2009 and 2008 was $12.5 million, $22.4 million and $23.5 million, respectively.
Non-Employee Stock Warrants. In prior years, we granted stock warrants to third parties in connection with the acquisition of licensing rights for certain key intellectual property. The warrants vested upon grant and are exercisable over the term of the warrant. The exercise price of third-party stock warrants is equal to the fair market value of our common stock at the date of grant. No third-party stock warrants were granted or exercised during fiscal 2010, 2009 and 2008; however, warrants for 240,000 shares expired, unexercised in fiscal 2010.
82
At March 31, 2010, we had 150,000 stock warrants outstanding with an exercise price of $10.45 per share and an expiration date of December 31, 2013. At March 31, 2009 and 2008 we had 390,000 stock warrants outstanding with a weighted average exercise price per share of $12.32.
We measure the fair value of our warrants granted on the measurement date. The fair value of each stock warrant issued to licensors is capitalized and amortized to cost of sales—license amortization and royalties expense when the related product is released and the related net sales are recognized. In fiscal 2010, 2009 and 2008, we incurred amortization expense of $0.1 million, $0.4 million, and $0.5 million, respectively, related to these warrants. Additionally, the recoverability of intellectual property licenses is evaluated on a quarterly basis with amounts determined as not recoverable being charged to expense. In connection with the evaluation of capitalized intellectual property licenses, any capitalized amounts for related third-party stock warrants are additionally reviewed for recoverability with amounts determined as not recoverable being amortized to expense.
19. Income Taxes
United States and foreign income (loss) before taxes and details of the provision for income tax were as follows (in thousands):
| |
Fiscal Year Ended March 31, | |||||||||||
|---|---|---|---|---|---|---|---|---|---|---|---|---|
| |
2010 | 2009 | 2008 | |||||||||
Income (loss) from continuing operations before income taxes: |
||||||||||||
United States |
$ | (26,470 | ) | $ | (384,363 | ) | $ | (99,868 | ) | |||
Foreign |
14,765 | (2,867 | ) | 27,233 | ||||||||
|
$ | (11,705 | ) | $ | (387,230 | ) | $ | (72,635 | ) | |||
Provision for income tax expense (benefit): |
||||||||||||
Current |
||||||||||||
Federal |
$ | (4,302 | ) | $ | 1,734 | $ | (4,552 | ) | ||||
State |
316 | 90 | (102 | ) | ||||||||
Foreign |
3,487 | 10,461 | 13,601 | |||||||||
Total current |
(499 | ) | 12,285 | 8,947 | ||||||||
Deferred |
||||||||||||
Federal |
1,337 | 24,478 | (33,930 | ) | ||||||||
State |
— | 11,294 | (6,317 | ) | ||||||||
Foreign |
(591 | ) | (1,831 | ) | (4,485 | ) | ||||||
Total deferred |
746 | 33,941 | (44,732 | ) | ||||||||
Provision for income tax expense (benefit) |
$ | 247 | $ | 46,226 | $ | (35,785 | ) | |||||
83