Attached files
Table of Contents
UNITED STATES
SECURITIES AND EXCHANGE COMMISSION
Washington, D.C. 20549
Form 10-K
ANNUAL REPORT PURSUANT TO SECTION 13 OR 15(d)
OF THE SECURITIES EXCHANGE ACT OF 1934
For the fiscal year ended March 31, 2010
Commission File Number: 001-33590
MF GLOBAL HOLDINGS LTD.
(Exact name of registrant as specified in its charter)
| Delaware | 98-0551260 | |
| (State or other jurisdiction of incorporation or organization) | (I.R.S. employer Identification no.) | |
| 717 Fifth Avenue New York, NY |
10022 | |
| (Address of principal executive offices) | (Zip Code) | |
(212) 589-6200
(Registrant’s telephone number, including area code)
Securities registered pursuant to Section 12(b) of the Act:
| Title of Each Class | Name of Each Exchange on Which Registered | |
| Common Stock, $1.00 par value per share | New York Stock Exchange |
Securities registered pursuant to Section 12(g) of the Act:
None
Indicate by check mark if the registrant is a well-known seasoned issuer, as defined in Rule 405 of the Securities Act. Yes x No ¨
Indicate by check mark if the registrant is not required to file reports pursuant to Section 13 or 15(d) of the Act. Yes ¨ No x
Indicate by check mark whether the registrant (1) has filed all reports required to be filed by Section 13 or 15(d) of the Securities Exchange Act of 1934 during the preceding 12 months (or for such shorter period that the registrant was required to file such reports), and (2) has been subject to such filing requirements for the past 90 days. Yes x No ¨
Indicate by check mark whether the registrant has submitted electronically and posted on its corporate Web site, if any, every Interactive Data File required to be submitted and posted pursuant to Rule 405 of Regulation S-T (§232.405 of this chapter) during the preceding 12 months (or for such shorter period that the registrant was required to submit and post such files). Yes ¨ No ¨
Indicate by check mark if disclosure of delinquent filers pursuant to Item 405 of Regulation S-K is not contained herein, and will not be contained, to the best of registrant’s knowledge, in definitive proxy or information statements incorporated by reference in Part III of this Form 10-K or any amendment to this Form 10-K. x
Indicate by check mark whether the registrant is a large accelerated filer, an accelerated filer, a non-accelerated filer, or a smaller reporting company. See definitions of “large accelerated filer,” “accelerated filer” and “smaller reporting company” in Rule 12b-2 of the Exchange Act. (Check one):
| Large accelerated filer x | Accelerated filer ¨ | |||||
| Non-accelerated filer ¨ | Smaller reporting company ¨ |
Indicate by check mark whether the registrant is a shell company (as defined in Rule 12b-2 of the Exchange Act). Yes ¨ No x
As of September 30, 2009, the aggregate market value of the registrant’s common stock held by non-affiliates of the registrant was approximately $883.3 million. As of April 30, 2010, there were 121,807,105 shares of the registrant’s common stock outstanding.
DOCUMENTS INCORPORATED BY REFERENCE
Portions of MF Global Holdings Ltd.’s Proxy Statement for its 2010 Annual Meeting of Stockholders to be held on August 12, 2010 are incorporated by reference in this Annual Report on Form 10-K in response to Part III, Items 10, 11, 12, 13 and 14.
Table of Contents
MF GLOBAL HOLDINGS LTD.
ANNUAL REPORT ON FORM 10-K FOR THE FISCAL YEAR ENDED MARCH 31, 2010
Table of Contents
CERTAIN FREQUENTLY USED TERMS
Throughout this Annual Report on Form 10-K, unless otherwise specified or if the context otherwise requires:
| • | “MF Global”, “we”, “us” and “our” refer to MF Global Holdings Ltd., a holding company incorporated under the laws of Delaware, and its subsidiaries, except that if the context refers to events taking place before January 4, 2010, “MF Global”, “we”, “us”, and “our” refers to MF Global Ltd., a Bermuda company which domesticated to Delaware on January 4, 2010. |
| • | “Man Financial” refers to the former brokerage division of Man Group (as defined below), which historically operated through numerous direct and indirect subsidiaries of Man Group, that was separated from Man Group in connection with our initial public offering (IPO), which we completed on July 23, 2007, and is the business we now operate independently from Man Group under the brand name “MF Global”. |
| • | “Man Group” refers to our former parent company, Man Group plc, a U.K. public limited company, and its subsidiaries. |
| • | “fiscal 2006”, “fiscal 2007”, “fiscal 2008”, “fiscal 2009” and “fiscal 2010” mean the 12-month periods ended March 31, 2006, 2007, 2008, 2009 and 2010, respectively. |
1
Table of Contents
FORWARD-LOOKING STATEMENTS
This report contains forward-looking statements that are based on our present beliefs and assumptions and on information currently available to us. You can identify forward-looking statements by terminology such as “may”, “will”, “should”, “could”, “would”, “targets”, “goal”, “expect”, “intend”, “plan”, “anticipate”, “believe”, “estimate”, “predict”, “potential”, “continue”, or the negative of these terms or other comparable terminology. These statements relate to future events or our future financial performance and involve known and unknown risks, uncertainties and other factors that may cause our actual results, levels of activity, performance or achievements to differ materially from those expressed or implied by these forward-looking statements. There are important factors that could cause our actual results, levels of activity, performance or achievements to differ materially from the results, levels of activity, performance or achievements expressed or implied by the forward-looking statements. In particular, you should consider the risks and uncertainties described under “Item 1.A. Risk Factors”. Although we believe that the expectations reflected in the forward-looking statements are reasonable, we cannot guarantee future results, levels of activity, performance or achievements. We caution you not to place undue reliance on these forward-looking statements. Forward-looking statements in this report include, but are not limited to, statements about:
| • | expectations regarding the business environment in which we operate and the trends in our industry such as changes in trading volume and interest rates; |
| • | our liquidity requirements and our ability to obtain access to necessary liquidity; |
| • | our ability to continue to provide value-added brokerage services; |
| • | our ability to capitalize on market convergence; |
| • | our ability to continue to diversify our service offerings; |
| • | our ability to pursue opportunities for enhanced operating margins; |
| • | our ability to expand our business in existing or new geographic regions; |
| • | our ability to continue to expand our business through acquisitions or organic growth; |
| • | our ability to become a primary dealer; |
| • | the effects of pricing and other competitive pressures on our business as well as our perceptions regarding our business’ competitive position; |
| • | our accuracy regarding our expectations of our revenues and various costs and of expected cost savings; |
| • | exposure to client and counterparty default risks as well as the effectiveness of our risk-management; |
| • | exposure to market and other risks from our principal transactions; |
| • | our exposure to credit, counterparty, and concentration risk; |
| • | our ability to retain our management team and other key employees; |
| • | fluctuations in interest rates and currency exchange rates and their possible effects on our business; |
| • | the likelihood of success in, and the impact of, litigation or other legal or regulatory challenges involving our business; |
| • | the impact of any changes in domestic and foreign regulations or government policy, including any changes or reviews of previously issued regulations and policies; |
| • | changes in exchange membership requirements; |
| • | our ability to increase the percentage of our revenues from the Asia/Pacific region; |
| • | changes in our taxes and tax rate; |
| • | our ability to maintain trading volumes and market share; |
| • | our ability to maintain our credit rating and the effects that changes to our credit rating would have on our business and operations; |
| • | our ability to maintain our existing technology systems and to keep pace with rapid technological developments; and |
| • | our ability to retain existing clients and attract new ones. |
We caution that you should not place undue reliance on any of our forward-looking statements. Further, any forward-looking statement speaks only as of the date on which it is made. New risks and uncertainties arise from time to time, and it is impossible for us to predict those events or how they may affect us. Except as required by law, we have no duty to, and do not intend to, update or revise the forward-looking statements in this report after the date of this report.
2
Table of Contents
PART I
| ITEM 1. | BUSINESS |
BUSINESS OVERVIEW
We are a leading brokerage firm offering customized solutions in the global cash and derivatives markets. We provide execution and clearing services for products in the exchange-traded and over-the-counter, or OTC, derivative markets, as well as for products in the cash market. We provide our clients with access to many of the largest and fastest growing markets and products throughout the world.
Our business model is global and client-driven, and we have organized our business to centrally manage our resources to offer clients an expansive array of products across a broad range of markets and geographies. Our history dates back more than 200 years to a brokerage business that was a founding member of some of the world’s first futures exchanges. After an initial public offering in July 2007, we separated from Man Group plc, our former parent, and became an independent public company with shares listed on the New York Stock Exchange (NYSE: MF). We seek to discover and help clients capitalize on market opportunities through our international brokerage network, expansive product offerings, value-added product expertise and consistent, high-quality service.
Available Information
We make available free of charge, on or through the “Investor Relations” section of our corporate website under “SEC Filings”, annual reports on Form 10-K, quarterly reports on Form 10-Q, current reports on Form 8-K, Forms 3, 4 and 5 filed on behalf of directors and executive officers, and any amendments to those reports filed or furnished pursuant to the Securities Exchange Act of 1934, and our proxy statement as soon as reasonably practicable after such materials are electronically filed with, or furnished to, the Securities and Exchange Commission (the “SEC”). Also posted on our corporate website is our Code of Business Conduct and Ethics (the “Code”) governing our directors, officers and all employees. Within the time period required by the SEC, we will post on our corporate website any amendments and waivers to such Code applicable to our executive officers and directors, as defined in the Code. Our Internet address is www.mfglobal.com.
Our Board of Directors (the “Board”) has standing Audit and Risk, Compensation, Nominating and Corporate Governance and Executive committees. Each of these Board committees has a written charter approved by the Board. Copies of each committee charter, along with our Corporate Governance Guidelines, are posted on our website. None of the information on our corporate website is incorporated by reference into this report.
Shareholders may also obtain, free of charge, printed copies of any of the above materials by sending a request to MF Global, Investor Relations, 717 Fifth Avenue, 9th Floor, New York, NY 10022, by calling (212) 589-6200, or by sending an email to investorrelations@mfglobal.com.
Description of Business
We are a leading brokerage firm in the global cash and derivatives markets, based on the amount of volume we direct to many of the world’s largest derivatives exchanges, the number of clients we serve, the client balances we maintain, and the extent of our global presence. We have a global client base and offices all over the world, including in Chicago, Dubai, Geneva, Hong Kong, London, Mumbai, New York, Paris, Singapore, Sydney, Taipei, Tokyo, and Toronto. We provide our clients with global market access to more than 70 securities and futures exchanges and also facilitate trades in the over-the-counter markets. As of March 31, 2010, we had approximately 3,200 employees.
Our clients include corporations, hedge funds and other asset managers, and sovereign institutions, as well as professional traders and individual investors. We principally offer execution and clearing services for five general types of products: fixed income, commodities, foreign exchange, interest rates (which includes exchange-listed futures and options) and equities. We have a broad retail product offering as well. MF Global Holdings Ltd., is incorporated in Delaware and our principal executive office is located in New York, New York.
3
Table of Contents
We derive revenues from three main sources: commission fees generated from execution and clearing services; principal transactions, which include matched-principal and other principal transactions, primarily executed to facilitate client trades; and net interest income on (i) cash balances in our clients’ accounts, most of which are maintained by our clearing clients to meet margin requirements as well as (ii) interest related to our collateralized financing arrangements and principal transactions activities.
For fiscal 2010, 2009 and 2008, we generated (i) total revenues of $2,145.4 million, $2,914.8 million, and $6,019.8 million, respectively, (ii) revenues net of interest and transaction-based expenses of $1,015.0 million, $1,426.7 million, and $1,636.3 million, respectively, and (iii) incurred net loss attributable to MF Global Holdings Ltd. of $137.0 million, $49.1 million, and $69.5 million, respectively.
COMPETITIVE ADVANTAGES
The following key strengths have helped us to achieve a leadership role within our industry:
Extensive Market and Business Expertise
We believe our clients value the in-depth industry experience and market knowledge that our brokers, product specialists, traders, and research analysts share with clients. For example, many members of our sales and trading teams have spent all or most of their careers covering the same products and have substantial experience in, and knowledge of, their underlying markets as well as the derivatives and cash markets generally. Furthermore, because we are an active participant on many exchanges and in many types of OTC markets, we can use our expertise and market knowledge to facilitate client transactions and to provide liquidity to our clients.
Leading Market Position
We are a leading brokerage firm in the global derivatives markets based on the amount of volumes we direct to many of the world’s largest derivatives exchanges, the number of clients we serve, the client balances we maintain and the extent of our global presence. We believe we have a strong market position in certain products in the cash markets, primarily fixed income and foreign exchange.
Because of our strong market position on many futures exchanges, we believe that we attract an additional volume of client orders for execution in those markets. Furthermore, because of the high volume of trade orders that our clients generate in the aggregate, as well as the diversity of our client base (which includes corporate clients, broker/dealers, hedge funds and other asset managers, sovereign institutions, professional traders and individuals, many of whom pursue a wide variety of different trading strategies), we believe that we can offer clients a broad and deep pool of liquidity, which we believe is highly attractive to market participants. The volume of our order flow across different asset classes, products and regions also allows us to provide our clients with real-time market insight, which we believe our clients value.
Broad Global Footprint and Diverse Product Offerings
We meet our clients demand for a single point of access to the world’s most active market places and global distribution network. We operate on four continents and on more than 70 exchanges, which gives clients the opportunity to access information, markets and liquidity in a wide array of products within the global derivatives and cash markets, including fixed income, commodities, foreign exchange, equities and interest rate products. Our global reach is broader than many of our competitors and we believe that our competitors would find it difficult, time-consuming and expensive to replicate our global network, as each exchange requires membership or a clearing relationship with a member and connectivity to the exchange, and many countries require licenses to operate.
Client-Driven Focus
We are focused on developing long-term relationships with our clients and providing them with a consistently high level of service worldwide. Our dedicated teams tailor solutions to fit each individual client’s unique needs, providing objective insight shaped by experience. We are dedicated to enhancing our systems, fostering the flow of information and providing
4
Table of Contents
market insight to clients, as well as sharing and improving processes to deliver even greater value to our customers worldwide. We believe these ongoing efforts will continue to align our organization with our clients and allow us consistently to meet their needs and exceed expectations.
Experienced Management Team
We have a highly experienced management team. Each member of our team has a strong track record of success and has extensive experience in the securities or futures industry. Several members of our management team began their careers in the sales and trading of commodities or securities products prior to taking on greater corporate managerial responsibility. Our management team brings a strong understanding of the needs of our clients worldwide, as well as the markets in which they wish to trade.
GROWTH STRATEGY
We believe there are significant opportunities to deliver near- and long-term value to our shareholders and clients, as well as to enhance our position as a leading brokerage firm. Our first objective is to maximize profitability of our existing business. An important element of this goal is to build a “one firm” culture with meaningful employee ownership in which our employees are motivated to collaborate on firm-wide objectives and their interests are aligned with our shareholders.
Furthermore, to better serve our clients and facilitate client transactions, we intend to use our market expertise and knowledge and enhance our market insight by taking positions in markets, committing greater capital and taking risk to provide liquidity to our clients. We believe that our willingness to make markets, commit capital and take risk in a broad range of fixed income, foreign exchange, commodity, equity and listed interest rate products will enhance our client relationships.
We also intend to leverage our existing core strengths, as described above under “—Competitive Advantages”, to expand into new areas and drive greater benefits for clients and shareholders. In particular, we believe that as the financial services industry has consolidated and the largest investment banks and brokerages have increased their scale of operations, an opportunity now exists for a global, mid-sized, full-service brokerage firm that can service many of the smaller and mid-sized clients underserved by larger firms. We believe that we will be well-positioned to build our business by combining our market breadth and expertise in a high-integrity firm focused on our clients’ long-term needs and interests. There may also be opportunities in the future to enter ancillary businesses that enhance our abilities to service our clients’ needs, including investment management or corporate advisory services.
OUR BUSINESS
We offer customized solutions to our diverse client base across a broad array of products and services, markets and geographic regions and through multiple distribution channels. We centrally manage our businesses as a global organization and offer clients the ability to trade multiple products through a single intermediary with a worldwide presence. We describe our products and services, markets, clients and geographic presence below.
Products and Services
We principally provide our clients with execution and clearing services for five general types of products: equities, fixed income, interest rate products (which include listed futures and options), foreign exchange and commodities. We classify currency futures within foreign exchange and equity index futures within equities.
We execute orders for our clients either on an agency or principal basis. When we execute for a client on an agency basis, we typically direct the order to an exchange or OTC market where it is matched with a corresponding order for execution. When we execute a client order on a principal basis, we take the other side of the trade for our own account to facilitate client orders. In some cases, we will simultaneously enter into an offsetting “back to back” trade with another party (which we refer to as a “matched principal transactions”). In certain other cases, we will look to enter into offsetting trades or hedging positions with another party relatively quickly or we may retain the exposure for a longer period of time. In order to gain ongoing insight into market depth and liquidity, or to facilitate client transactions, we may also take positions in the market for our
5
Table of Contents
own account, and we may not always hedge such transactions. On a limited basis, we may also enter into unhedged principal transactions in order to monetize our market views. We expect to increasingly recognize trading income as part of our ongoing activity for our clients in various markets, and to selectively increase our risk taking, generally making fuller use of our current risk appetite and operating within the authority delegated by our board of directors.
We also act as a clearing firm for clients who execute trades in futures and options on derivatives exchanges where we are approved as a clearing member. These include all major derivatives exchanges in the U.S. and Europe as well as certain Asia Pacific markets. We may act as the clearing firm for clients who use us to execute their orders, as well as for clients who use other executing brokers or execute their orders directly on the exchange. We also provide clearing services for a growing number of transactions executed in the OTC and cash markets.
We also provide, or expect to begin providing, various investment/advisory services; while these activities are just beginning at present, they could grow in the coming year, especially in the Asia Pacific region.
Equities
We provide research, execution and clearing services for both listed and OTC equity-linked derivatives and cash securities. Equity-linked derivatives and cash equity securities represent a large and growing market. Equity-linked derivatives include futures, options, contracts for differences, convertible stock and other derivatives whose underlying value is related to the price of one or more stocks, baskets of stocks or stock indices. These derivatives may relate to domestic or foreign companies, funds, indices or other investment vehicles. We principally trade equity-linked derivatives and cash equity securities on major exchanges and OTC markets in the United States, Europe and Asia Pacific region. We recently expanded our U.S. equity derivatives, portfolio trading and electronic trading services teams to better service our institutional client base in a variety of liquid markets around the globe.
Our primary clients for equity-linked derivatives and cash securities are asset managers, hedge funds, broker/dealers and professional traders.
Fixed Income and Interest Rate Products
We provide execution, clearing, and financing services for both fixed income and interest rate derivative products. The cash fixed income and interest rate derivatives markets are among the largest markets in the world. The interest rate derivative products we trade include futures, options and swaps related to interest rates as well as cash products such as U.S. Treasury securities, European government debt, agency and non-agency mortgage-backed securities, sovereign and supranational bonds and corporate bonds.
We also engage in fixed income prime brokerage services. These prime brokerage services include execution, clearing, client financing, securities lending and other administrative services. In addition, we offer prime brokerage clients electronic access to a variety of liquid markets around the globe. The revenue we earn from prime brokerage activities consists of commissions, interest income on client custodial accounts and markups from principal transactions.
Our fixed income and interest rate derivatives products clients include hedge funds and asset managers, financial institutions, broker dealers and corporations. Our fixed income group’s clients also include a growing number of government entities and sovereign institutions. Our interest rate derivatives products group also serves professional traders seeking either to make speculative investments or to hedge their exposure to interest rate fluctuations.
Foreign Exchange
The market for foreign exchange products is generally regarded as the largest and most liquid financial market in the world as measured by market volume. We provide foreign exchange services directly to our clients on an agency and principal basis. As a principal, we facilitate the execution of client orders by executing an order for our own account, and may execute an offsetting trade with another party, most likely another foreign exchange dealer or market maker. By serving as the counterparty or financial intermediary to the buyer and the seller in these transactions, we enable our clients to access liquidity and competitive pricing on an anonymous basis while delivering customer order flow to our liquidity providers. We also offer straight-through electronic execution that affords our clients the same liquidity directly from our foreign exchange counterparties.
6
Table of Contents
Most foreign exchange trades are conducted on non-listed markets. Our clients in the foreign exchange market represent most segments of our customer base, including corporate hedgers, asset managers, professional traders, hedge funds and individual investors.
Commodities
Metals
We provide clients execution, clearing and financing services for transactions relating to derivative contracts including futures, options, forward sale agreements and other types of instruments based on the price of metals, steel products and industrial materials. Depending on the type of transaction, we may act as an agent or as a principal. We also provide contract administration for certain futures, options and OTC products. We work with our clients to develop risk-management and trading strategies and offer our clients extensive market research materials. Metal derivatives are traded both on exchanges and in the OTC markets. MF Global is one of 12 designated “ring dealing” members of the world’s largest metals exchange, the London Metal Exchange, which enables us to offer our clients special trading access and other rights on the London Metal Exchange that are not offered to non-ring dealing members. We are also a member of COMEX, a division of the CME Group, Inc.
Our primary clients for metal derivatives include a wide range of producers, consumers, manufacturers and dealers that buy and sell physical metals that they need to operate their businesses as well as professional investors, such as commodity trading advisors and hedge fund managers.
Energy
The energy derivatives market has grown significantly in recent years. Derivative contracts for energy commodities include futures, options, swaps and forward sale agreements on energy products, including crude oil, natural gas, heating oil, gasoline, propane, electricity and other energy commodities. These derivatives are traded both on exchanges and in the OTC markets. We have a leading market position in exchange-listed and OTC-traded energy derivatives. We have consistently been ranked as one of the leading providers by volume of clearing and execution services on both the New York Mercantile Exchange (NYMEX) and ICE Futures Europe. Our U.S. exchange-traded natural gas futures business is augmented by a New York-based OTC desk. Our primary clients for energy derivatives include oil companies, refineries and other enterprises seeking to lock in prices of various energy commodities they need to operate their businesses, as well as asset managers seeking to enter into speculative or arbitrage transactions.
Agricultural Commodities and Other
We offer our clients access to a number of agricultural commodities markets such as the grain and oilseed futures and options markets in the United States and the soft commodities markets listed in North America, Europe and Asia Pacific. These derivatives are traded both on exchanges and in the OTC markets. Our primary clients include producers, consumers, dealers, and asset managers.
Markets
We provide our clients access to three primary types of markets: exchange-traded derivatives, OTC derivatives and cash markets.
Exchange-Traded Derivative Markets
We execute client trades in exchange-traded derivatives. Generally, exchange-traded derivatives refer to futures contracts traded on futures exchanges. As a clearing broker, we also clear trades that we have executed for our clients, and we also clear trades executed by other brokers. The principal products for which we execute and clear exchange-traded derivatives include interest rate products, equities and commodities. The principal exchanges on which we execute futures and options trades include the Chicago Mercantile Exchange, the Chicago Board of Trade and the New York Mercantile Exchange in the United States; Eurex, Euronext.Liffe, ICE Futures Europe and the London Metals Exchange in Europe; and the Sydney Futures Exchange and Singapore Exchange in the Asia Pacific region.
7
Table of Contents
Exchange traded futures and options include trading in futures, options on futures, and options on other securities. Futures contracts are standardized agreements to buy or sell a commodity or financial product at a specified price in the future. The buyer and seller of a futures contract agree on a price today for a product to be delivered or settled and paid for in the future. Each contract specifies the quantity of the product and the time of delivery or payment. An option on a futures contract is the right, but not the obligation, to buy or sell a futures contract at a specified price on or before a certain expiration date. These products provide a means for hedging price risk, asset allocation, speculation or arbitrage.
All futures contracts and options on futures contracts are cleared through a clearing house, which acts as a central counterparty to all transactions. Clearing is the procedure by which the clearing house stands as buyer to every seller and seller to every buyer.
By interposing itself between the clearing members of every trade, the clearinghouse guarantees to a counterparty each clearing member’s performance, thereby eliminating the need for a seller (acting through its clearing broker) to evaluate the credit risk of a buyer and its clearing member. Accordingly, clearing members function as intermediaries between market participants and a clearing house. In effect, the clearinghouse takes on the counterparty credit risk of the clearing member, and the clearing member assumes the credit risk of each of its client market participants. Clearing members manage the risk of their client market participants by holding margin furnished by their client and managing the amount of margin required, depending upon, among other things, market movements and the exposure of the clearing member’s clients to those movements.
Exchanges require clients to maintain minimum amounts of collateral in margin accounts to secure their performance obligations on their open positions. Consistent with our disciplined approach to risk management, we monitor each client’s open positions and related risk of default closely and, where we believe it is appropriate, we may adjust our clients’ margin requirements above the minimum amounts set by the exchanges in an effort to ensure that each client’s collateral is sufficient, in our view, to support their open positions. In addition to providing credit protection, the funds clients deposit with us as margin for their trading activities also provide us with an important source of revenue, as we are able to earn interest income on the cash balances in many of our clients’ margin accounts.
OTC Derivative Markets
Over-the-counter derivatives, or OTC derivatives, is a term used to describe traded products that are not listed on a futures exchange. The principal markets in which we execute OTC derivatives trades include energy, metals, other commodities and equities. We execute, and in limited circumstances finance, a wide array of OTC derivatives, including forwards, options, swaps and other derivative products. Historically, transactions in OTC markets have been settled on a principal-to-principal basis, without any clearinghouse or clearing firm acting as an intermediary, but as OTC contracts become standardized, regulators and participants have increasingly demanded the greater stability offered by a centrally cleared environment, and we and other market participants have begun to provide these clearing services for a growing number of OTC trades. We also have the capability to design OTC derivative products that can be tailored to meet our clients’ individual investment needs, subject to applicable laws and regulations. For example, in the U.K., we were a prominent early provider of contracts for differences, which are OTC derivatives that are linked to a listed equity security or index to enable purchasers to establish long or short exposures to equity securities for which there is no existing listed futures market.
In contrast to listed futures contracts, participants in the OTC markets have the ability to trade both standardized and customized contracts, where counterparties can specify contract terms, such as the underlying commodity, delivery date and location, term and contract size. Furthermore, while exchanges often limit their hours of operation and restrict direct trading access to a limited number of exchange members, OTC markets typically operate for longer periods of the day and membership in an exchange is not required, although there may be certain regulatory requirements with respect to market participation. For example, certain OTC energy markets operate seven days a week for 23 hours per day and participation is generally limited to electronic liquidity providers and commercial parties.
In the OTC derivatives markets, swap contracts (in the form of OTC derivatives) are commonly used to reduce or gain exposure to price movements related to a commodity or financial product. Swap contracts have historically been less standardized than futures contracts (discussed above), and are financially settled typically against either a futures contract price or an index price in order to hedge against or gain exposure to price fluctuations.
8
Table of Contents
Cash Markets
We facilitate transactions with respect to a broad array of cash products for our clients, including listed equity securities, debt securities (for example, U.S. Treasury securities and corporate bonds traded in the OTC markets) and foreign exchange products (for example, OTC foreign exchange contracts and spot transactions) on both an agency and a principal, including matched-principal, basis. We also clear many of these products for our clients. For example, U.S. equities are cleared by The Depository Trust & Clearing Corporation, and U.S. Treasuries are cleared by The Fixed Income Clearing Corporation. Foreign exchange transactions do not settle through a clearinghouse but are instead settled on a bilateral basis between the counterparties. We also finance our clients’ transactions in some of these cash products through purchases of securities under agreements to resell (“resale agreements”), sales of securities under agreements to repurchase (“repurchase agreements”) and securities lending transactions.
Clients
As our business has expanded into new markets, we have broadened our client base through acquisitions, internal development of execution and clearing services targeted at different clients, cross-selling between our various product groups and clients, and sales and marketing efforts. We regard our client base as a whole and seek to provide them with access to a wide variety of derivatives and cash markets. We believe that facilitating order flow from a diverse client base enables us to provide efficient execution across a range of products, markets and regions.
Corporations
Industrial and financial companies rely on us to provide them with access to an array of markets. They look to us for risk management support, as they seek to hedge exposures in commodities, foreign exchange, interest rates, or securities. As more companies have increased their focus on their own risk management, this category of clients has grown.
Broker/Dealers
Other intermediaries and financial institutions, such as broker-dealers, utilize our services, including execution and clearing. These clients may take a view on market movements with the hope of achieving attractive investment returns.
Asset Managers and Hedge Funds
Our asset manager clients include managers of large mutual funds, commodity trading advisors (CTAs), commodity pool operators (CPOs), and other investment advisors. Our hedge fund clients include a range of alternative investment companies. Hedge funds and other asset managers in the derivatives and cash brokerage industry will continue to be a significant force in driving demand for increasingly sophisticated risk-management products.
Sovereign and Official Institutions
Sovereign and official institutions include government entities, central banks, and other official institutions such as the Bank for International Settlements, the European Central Bank and the International Bank for Reconstruction and Development. We provide these clients with a range of support, including execution, settlement, and clearing as well as market research and economic analysis. As we expand our fixed income product offerings, we expect that revenue generated from the trading activities of these clients will increase.
Professional Traders
Individual professional traders are either local floor traders or other professional traders. Local floor traders are individual members of derivatives exchanges who trade for their own account on the floors of exchanges. Professional traders are clients trading electronically from dedicated facilities built to service their needs. Professional traders serve an important role in the market as liquidity providers for the exchanges of which they are members by providing order flow and thus adding liquidity to the markets. As floor-based trading has migrated to electronic platforms, local traders have also transitioned to the use of electronic platforms. Professional traders are typically high-volume clients who require an operating platform that provides them rapid execution at a low cost, which may result in our earning lower per transaction fees. We have strong relationships
9
Table of Contents
with a number of local trading groups and professional traders in Europe, North America and the Asia Pacific region. We believe we play a leading role in providing professional traders in these regions with online access to equities, interest rates, commodities and foreign exchange markets around the world.
Individual Investors
We consider individual investors to be high-net worth or other individuals who establish individual or joint trading and investment accounts for speculation or hedging and individuals setting up trading corporations. Individual investors also include any of the above accounts managed by a third party. Through internal initiatives and a series of acquisitions, including our acquisition of Refco, we have developed a significant individual investor business. We have extensive individual investor teams in North America, Europe and Asia Pacific. Some of our individual investor business is generated through a network of introducing brokers, who direct futures and options order flows from individual investors to us for execution and clearing.
Geographic Regions
We execute trades for clients located principally in three geographic regions: Europe, North America and the Asia Pacific region. Our operations in each region are organized to service the institutional and retail clients located in that region. In each region, we execute trades involving a wide range of products on a number of markets.
There are a number of countries in which we do not currently maintain offices but conduct a significant amount of business. For example, based on information that we have gathered, we believe that, despite the fact that we do not have an office in mainland China, we are a leading provider of financial risk management products to the Chinese metals industry. We service these clients though our offices in London, Hong Kong and Sydney.
Our global and product-driven model allows us to provide each of our clients with services that encompass any and all combinations of our products and markets, subject to applicable law and regulations. Our global presence, combined with our expertise in a wide variety of products, enables us to meet the diverse needs of our clients. For a discussion of our segment and geographic information, see Note 16 to our audited consolidated and combined financial statements.
Sales and Marketing
We offer our products and services through three primary distribution channels: employee brokers and sales professionals, introducing brokers, and online platforms.
Our employee brokers and sales professionals conduct the majority of our sales and marketing activities. They are primarily responsible for attracting new—and maintaining existing—client relationships and providing the services that clients request including risk management. We also employ a large number of sales professionals, most of whom are former brokers and traders with extensive experience within the financial services sector. Since our business is highly regulated, we employ brokers and sales professionals who understand the regulatory requirements relevant to marketing in this field and who are appropriately licensed as required by applicable laws.
We also obtain clients through relationships with introducing brokers, who are individuals or organizations that have relationships with various retail, professional or institutional clients of their own. Introducing brokers provide all the typical functions of a broker, except they do not accept money, securities or property of a client. Introducing brokers direct orders made by their clients to us for execution and clearing.
In addition to our employee brokers and sales teams and introducing brokers, we also provide market access, products and services to clients through multiple online trading platforms. Our online trading platforms provide clients access to the futures markets from any location where they are able to access the Internet. Other online trading platforms that we offer enable our clients to enter into complex options and equities transactions online and manage multiple accounts with one user identification. Our clients also have access to multiple online trading platforms for foreign exchange. For clients who choose not to use our online trading platforms, we support major third-party order entry systems independently contracted by clients. Where permissible, we may from time to time conduct marketing through our online trading platforms.
10
Table of Contents
Competition
The derivatives and cash brokerage industry is highly fragmented and competitive, and we expect that competition will continue to intensify in the future. We compete for clients on the basis of our breadth of product and market offerings, transaction fees and the speed and quality of execution. Our ability to compete is driven by the products, markets, liquidity and technology we provide throughout our global footprint.
We compete with a significant number of financial intermediaries in the U.S. and throughout the world in one or more markets. Although no one competitor operates in all of our markets, one broker, Newedge, which is a large, well capitalized broker with global operations, competes in many of our markets.
In addition, affiliates of the largest commercial and investment banks, including Bank of America, Citigroup, Goldman Sachs, JPMorgan, UBS and other major multi-national banks compete with us in key areas such as clearing services, which is a significant source of our revenue. We compete with a large number of independent brokerage firms, such as R.J. O’Brien in the United States, as well as regional brokers in particular markets around the world. Within the regions in which we operate, we have also witnessed the proliferation of online trading platforms which now compete directly with our retail and OTC trading operations globally.
We also face increasing competition from numerous domestic and foreign exchanges. As major exchanges have merged, formed global alliances, embraced electronic trading and transformed themselves from member-owned to publicly-traded, profit-driven enterprises, they have often aggressively sought to build trading volume by offering clients access to their trading facilities. In some cases, this has led to clients bypassing voice brokers and executing their trades online (a phenomenon also known as disintermediation) as well as price-compression, where voice brokers have had to reduce their execution fees as volumes have increased. This trend has also led to exchanges expanding their clearing services for a wider range of products.
Notwithstanding these industry trends, we believe that these developments provide opportunities for us because we can offer clients efficient access to more products, markets and regions than many of our competitors, as well as deep internal liquidity in many of our markets. Moreover, because we provide both execution and clearing services, we are less vulnerable to competitive pressures affecting the market for execution services alone. As a result, we believe we are well positioned to withstand the pressures of disintermediation in our industry.
Risk Management
We believe that effective risk management is critical to the success of our business. Consequently, we have established—and continue to evolve and improve—a global enterprise wide risk management framework to manage all aspects of our risks. The risk-management framework globally embeds a robust risk-management environment through a strong governance structure that (i) clearly defines roles and responsibilities, (ii) delegates authority for risk control and risk taking to specific individuals, and (iii) documents approved methodologies for the identification, measurement, control and mitigation of risk.
We believe that risk management is the responsibility of all of our employees. We seek to consistently and comprehensively identify, assess, monitor and control all financial, operational, compliance and business risks across all of our businesses in a coordinated manner. Business areas, pursuant to delegated authority, have primary responsibility for risk management by balancing our ability to profit from our revenue-generating activities with our exposure to potential losses. Specialist teams in the risk department monitor our risk exposures globally. Client, counterparty and house account positions are monitored against limits 24 hours a day when markets and exchanges are open. Risk-department teams communicate their findings to our regional officers and to local decision-making bodies to allow us to react rapidly to address any developing risks.
Our Chief Risk Officer, who reports directly to our Chief Executive Officer, leads the risk department and monitors and reports on our risk matters. The Chief Risk Officer promotes company-wide adherence to MF Global’s enterprise risk management framework and has global responsibility for monitoring and facilitating control of financial, operational and business risks. Several risk officers support the Chief Risk Officer, including the Regional Heads of Risk for North America, Europe, and Asia Pacific and the Global Heads of Credit, Market and Operational Risks.
11
Table of Contents
Senior management takes an active role in the risk management process and expects all employees to understand and comply with their delegated risk responsibilities, relevant risk policies, and compliance requirements. Additionally, all employees are expected to escalate risk incidents and any matters of concern to management in order to ensure timely risk-mitigation action by the appropriate personnel.
Our Chief Risk Officer regularly reports to our Board of Directors. Reports detail global risk exposures and escalate risks that exceed defined tolerances. The risk reporting process is designed to enable us to assess the levels of risk present throughout our operating environment on a near real-time basis and to take any necessary remedial action in a timely manner.
See also “Item 7A. Quantitative and Qualitative Disclosures about Market Risk.”
Technology Systems and Business Continuity
We operate our business using a series of integrated platforms, enabling us to offer our products across an array of markets to clients located around the world. These platforms employ several principal trade processing systems, each with multiple points of access. Automated connectivity among the core segments of our processing platform enables us to execute and clear cross-border client trades on a global basis both directly and through omnibus accounts maintained between our main operating subsidiaries. In each case, we have long-term licensing agreements for the continued use of these industry-leading technologies, which enable us to run our operations effectively without having to incur costs to develop proprietary technology. We also employ complementary systems in other products such as cash securities.
The security and integrity of our processing and other support systems are of great importance to our business. We regularly test our business-critical systems, and we are continually working to enhance our remote back-up and disaster recovery systems.
Regulation and Exchange Memberships
We have a long history of operating in a highly regulated industry. Our business activities are extensively regulated by a number of U.S. and foreign regulatory agencies and exchanges. These regulatory bodies and exchanges are charged with protecting investors by imposing requirements relating typically to capital adequacy, licensing of personnel, conduct of business, protection of client assets, record-keeping, trade-reporting and other matters. They have broad powers to monitor compliance and punish non-compliance with their rules. If we fail to comply with applicable regulations, we may be subject to censure, fines, cease-and-desist orders, suspension of our business, removal of personnel, civil litigation, revocation of operating licenses or other sanctions. Furthermore, new regulations, changes in current regulations as well as changes in the interpretation or enforcement of existing laws or rules in the United Kingdom, United States or elsewhere, may affect our business and operations and the policies and procedures we follow.
Minimum capital requirements are a significant part of the regulatory framework in which we operate. We are subject to stringent minimum capital requirements in the United States, the United Kingdom and several other jurisdictions. These rules which specify the minimum amounts of capital that we must have available to support our clients’ open trading positions, including the amount of assets we must maintain in relatively liquid form, are designed to measure general financial integrity and liquidity. Compliance with minimum capital requirements may limit our operations if we cannot maintain the required levels of capital. Moreover, any change in these rules or the imposition of new rules affecting the scope, coverage, calculation or amount of capital we are required to maintain could restrict our ability to operate our business and adversely affect our operations. We currently maintain regulatory capital in excess of all applicable requirements.
From time to time, we receive inquiries or requests from our regulators (for example, the Commodity Futures Trading Commission or the Financial Services Authority) which require us to undertake compliance reviews and/or remedial action with respect to our policies and procedures.
12
Table of Contents
Securities and Futures Regulation
The principal geographic regions in which we operate and the primary regulators, self-regulatory organizations and exchanges that have supervisory authority over us in those regions include:
| Country/Region |
Principal Regulators and Self-Regulatory Organizations |
Principal Exchanges and Clearinghouses | ||
| United States | Commodity Futures Trading Commission | Chicago Mercantile Exchange/Chicago Board of Trade | ||
| Securities and Exchange Commission National Futures Association |
New York Mercantile Exchange IntercontinentalExchange | |||
| Financial Industry Regulatory Authority | ICE Futures U.S | |||
| Chicago Board Options Exchange | International Securities Exchange | |||
| Chicago Board Options Exchange | ||||
| Options Clearing Corporation | ||||
| Boston Options Exchange | ||||
| NASDAQ | ||||
| NYSE Arca | ||||
| Canada | Investment Dealers Association | Bourse de Montréal | ||
| Toronto Stock Exchange | ||||
| Europe | Financial Services Authority | Eurex | ||
| Bundesbank and German Financial Supervisory Authority | Euronext.liffe | |||
| ICE Futures | ||||
| London Metal Exchange London Stock Exchange LCH.Clearnet | ||||
| India | Forward Markets Commission Securities and Exchange Board of India |
Multi Commodity Exchange National Commodities & Derivatives Exchange National Stock Exchange Bombay Stock Exchange MCX Stock Exchange | ||
| Singapore | Monetary Authority of Singapore | Singapore Exchange Ltd. | ||
| Australia | Australian Securities & Investments Commission | Sydney Futures Exchange/Australian Securities Exchange | ||
| Hong Kong | Securities and Futures Commission | Hong Kong Futures Exchange | ||
| Hong Kong Stock Exchange | ||||
| Taiwan | Securities and Futures Bureau | Taiwan Futures Exchange | ||
| U.A.E. (Dubai) | Dubai Financial Services Authority Emirates Securities and Commodities Authority Dubai Multi Commodities Centre |
Dubai Gold & Commodities Exchange | ||
North America: In the United States, our regulators are the Commodity Futures Trading Commission, the National Futures Association, the SEC, and the Financial Industry Regulatory Authority, or FINRA. Our designated examining authority is the Chicago Mercantile Exchange with respect to our activities as a futures commission merchant and the Chicago Board Options Exchange with respect to our activities as a broker-dealer. We are a member of many exchanges, including the Chicago Mercantile Exchange/Chicago Board of Trade, New York Mercantile Exchange, ICE Futures U.S., IntercontinentalExchange, International Securities Exchange, Chicago Board Options Exchange, Options Clearing
13
Table of Contents
Corporation, Boston Options Exchange, NASDAQ and NYSE Arca. In Canada, we are regulated by the Investment Dealers Association, and are a member of the Bourse de Montreal and the Toronto Stock Exchange.
Europe: In the United Kingdom, our primary regulator is the U.K. Financial Services Authority. We are a member of many exchanges, including Eurex, Euronext.Liffe (and U.S. exchanges), ICE Futures, the London Metal Exchange, the London Stock Exchange and LCH.Clearnet.
Asia Pacific: In Singapore, our primary regulator is the Monetary Authority of Singapore and we are a member of the Singapore Exchange. In Hong Kong, our primary regulator is the Securities and Futures Commission and we are a member of the Hong Kong Futures Exchange and Hong Kong Stock Exchange. In India, our primary regulators are the Securities and Exchange Board of India and the Forward Markets Commission. Our subsidiaries in India are members of the National Stock Exchange, National Commodity & Derivative Exchange, the Multi Commodity Exchange of India, the Bombay Stock Exchange and the MCX Stock Exchange. In Australia, our primary regulator is the Australian Securities and Investment Commission and we are a member of the Sydney Futures Exchange and the Australian Securities Exchange. In Taiwan, we maintain a branch of our Singapore company, which is regulated by the Securities and Futures Bureau, and our subsidiary, MF Global Futures Trust Co. Ltd., is regulated by the Financial Supervisory Commission.
In addition to those rules and regulations that are imposed by the various regulators, self-regulatory organizations and exchanges, the U.S. federal and state governments as well as non-U.S. governments have imposed a number of other regulations with which we must comply, including:
Regulations applicable in and outside the United States
The U.S. and non-U.S. government agencies, regulatory bodies and self-regulatory organizations, as well as state securities commissions and other state regulators in the United States, are empowered to conduct administrative proceedings that can result in censure, fine, the issuance of cease and desist orders, or the suspension or expulsion of a broker-dealer or its directors, officers or employees. From time to time, our subsidiaries have been subject to investigations and proceedings, and sanctions have been imposed for infractions of various regulations relating to our activities, none of which has had a material adverse effect on us or our businesses.
The USA PATRIOT Act of 2001 (PATRIOT Act), contains anti-money laundering and financial transparency laws and mandates the implementation of various regulations applicable to all financial institutions, including standards for verifying client identification at account opening, and obligations to monitor client transactions and report suspicious activities. Through these and other provisions, the PATRIOT Act seeks to promote the identification of parties that may be involved in terrorism, money laundering or other suspicious activities. Many anti-money laundering laws outside the United States contain similar provisions. The obligation of financial institutions, including ours, to identify their clients, to monitor for and report suspicious transactions, to respond to requests for information by regulatory authorities and law enforcement agencies, and to share information with other financial institutions, has required the implementation and maintenance of internal practices, procedures and controls that have increased, and may continue to increase, our costs, and any failure with respect to our programs in this area could subject us to substantial liability and regulatory fines.
The United States government maintains various economic sanctions programs which are administered by the U.S. Treasury Department’s Office of Foreign Assets Control (“OFAC”) and generally prohibit or restrict trade and investment in and with sanctions targets or the blocking of the sanctions targets’ assets. Some of these programs are broad and impose country—specific economic sanctions (such as those targeting Burma (Myanmar), Cuba, Iran, North Korea, Sudan and Syria); other programs target “specially designated” individuals and entities that are engaged in certain activities, such as proliferation of weapons of mass destruction, terrorism and narcotics trafficking, as well as activities particular to certain countries, such as undermining democratic processes or institutions in Zimbabwe. Penalties for violating the OFAC-administered sanctions can be severe, including significant civil and criminal monetary penalties as well as potential imprisonment. We have established policies and procedures designed to assist our company’s and our personnel’s compliance with applicable OFAC sanctions. Although we believe that our policies and procedures are effective, there can be no assurance that our policies and procedures will effectively prevent us from violating the OFAC-administered sanctions in every transaction in which we may engage.
As discussed above, many of our subsidiaries are subject to regulatory capital requirements in jurisdictions throughout the world. Subsidiaries not subject to separate regulation may hold capital to satisfy local tax guidelines, rating agency requirements or internal policies, including policies concerning the minimum amount of capital a subsidiary should hold based upon its underlying risk.
14
Table of Contents
Certain of our businesses are subject to compliance with regulations enacted by U.S. federal and state governments, the European Union or other jurisdictions and/or enacted by various regulatory organizations or exchanges relating to the privacy of the information of clients, employees or others, and any failure to comply with these regulations could expose us to liability and/or reputational damage
EXECUTIVE OFFICERS OF MF GLOBAL
Set forth below is information regarding our executive officers as of May 27, 2010:
| Name |
Age | Position | ||
| Jon S. Corzine |
63 | Chairman and Chief Executive Officer | ||
| Thomas Connolly |
52 | Global Head of Human Resources | ||
| Laurie R. Ferber |
57 | General Counsel | ||
| Karel F. Harbour |
58 | Chief Operating Officer and Interim Managing Director, Asia Pacific | ||
| Thomas M. Harte |
57 | Managing Director, North America | ||
| J. Randy MacDonald |
54 | Chief Financial Officer | ||
| Michael K. Roseman |
49 | Chief Risk Officer | ||
| James Rowsell |
53 | Managing Director, Europe |
Executive officers are appointed by and serve at the pleasure of our board of directors. A brief biography of each person who serves as an executive officer is set forth below.
Jon S. Corzine. Mr. Corzine is our Chairman and Chief Executive Officer. Before joining MF Global in March 2010, Mr. Corzine most recently served as New Jersey’s 54th governor from January 2006 until January 2010. Prior to that time, he was elected to represent New Jersey in the United States Senate from January 2001 until January 2006. During his tenure as a United States Senator, Mr. Corzine served on the Senate Banking, Budget, Energy and Natural Resources, and Intelligence Committees. Prior to serving in the United States Senate, Mr. Corzine was the Chairman and Senior Partner of The Goldman Sachs Group, L.P. from December 1994 to June 1998 and Co-Chairman and Co-Chief Executive Officer of The Goldman Sachs Group, L.P. from June 1998 to January 1999. Mr. Corzine began his career at Goldman Sachs as a bond trader in 1975. Mr. Corzine is also an operating partner and advisor at J.C. Flowers & Co. LLC (“JCF”), which is an affiliate of one of our largest shareholders. He will also hold the title of John L. Weinberg/Goldman, Sachs & Co. Visiting Professor at Princeton University’s Woodrow Wilson School of Public and International Affairs for the 2010-2011 academic year.
Thomas Connolly. Mr. Connolly is our Global Head of Human Resources. Before joining our company in January 2009, he served as a senior vice president of human resources operations at Lehman Brothers from 2007 through 2009. From 2004 through 2007, he served as vice president, compensation and international benefits at The Hartford Financial Services Group, and from 1998 through 2003, he served as Managing Director, Human Resources at UBS. He has also held various human resources management positions at Aetna, Citicorp and Goldman Sachs. Mr. Connolly received a B.A. from the University of Connecticut, an M.S. from the Stevens Institute of Technology, and an M.B.A. from New York University – Stern School of Business.
Laurie R. Ferber. Ms. Ferber is our General Counsel and is responsible for our legal and compliance functions, has operational and administrative responsibility for our internal audit function, and is also responsible for our regulatory relationships. As a member of the Office of the CEO, she also plays a key role in developing and implementing MF Global’s corporate strategy. Prior to joining MF Global in 2009, Ms. Ferber was general counsel and chief regulatory officer for International Derivatives Clearing Group (IDCG). From 1987 to 2008, she held a number of business and legal positions at Goldman, Sachs, including roles in J. Aron & Company, the Economic Derivatives group, the Power Trading group, the Fixed Income, Currency and Commodities group, and Business Selection and Conflicts. Earlier in her career, Ms. Ferber was general counsel of Drexel Burnham Lambert Trading Corp. and also traded energy products. She was an associate at Skadden, Arps, Slate, Meagher & Flom, and at Schulte, Roth & Zabel. Ms. Ferber earned her J.D. from New York University School of Law and her B.S. from the State University of New York at Buffalo. She currently serves on the Board of Trustees of the Institute for Financial Markets and New York University School of Law, and is a member of the Lincoln Center Business Council.
15
Table of Contents
Karel F. Harbour. Mr. Harbour has served as our Chief Operating Officer since December 2008 and formerly served as chief operating officer for our European entities. In May 2010, he was appointed our interim Managing Director—Asia/Pacific. As our Chief Operating Officer, Mr. Harbour has responsibility for operations for all MF Global entities in more than a dozen countries worldwide. Mr. Harbour joined MF Global in 2002 through the acquisition of GNI Ltd., which he joined in 1983 and served in various positions, including deputy CEO. Mr. Harbour received a Bachelor of Science degree in economics from Southampton University. He is a Chartered Accountant and a Fellow of the Institute of Chartered Accountants.
Thomas M. Harte. Mr. Harte is our Managing Director, North American. Prior to the reorganization, Mr. Harte served as an Executive Vice President of Man Financial and a director of Man Group USA Inc. since 1993. He has been the chief executive officer of Man Financial’s New York based businesses since 2006, was responsible for the Chicago office from 1995 to 1998 and has been responsible for our corporate acquisition activities since joining us in 1993 from Paine Webber Inc., where he was a Managing Director of their Commercial Futures Division from 1990. Mr. Harte was a Senior Vice President of Drexel Burnham Lambert from 1980 to 1990 where he was a manager of its institutional futures department in London from 1983 to early 1984 and then in New York through 1990. He began his career at Blyth Eastman Dillon in 1978 where he was a Vice President of Corporate Strategy and was an architect of their entry into the futures business. Mr. Harte has a bachelor’s degree from Fordham University and a masters in international business from the Thunderbird Graduate School of International Management.
J. Randy MacDonald. Mr. MacDonald is our Chief Financial Officer. Mr. MacDonald joined our company in April 2008. In this role, he is responsible for leading our financial operations, (including treasury, tax and finance, and management and external reporting), and strategy, mergers and acquisitions, human resources, investor relations, internal and external communications, marketing, strategic sourcing, and the program management office. From May 2006 to July 2008, Mr. MacDonald served as a director on the board for GFI Group. He was on the Audit and Compensation committees. Before joining MF Global, Mr. MacDonald held a number of positions at TD Ameritrade Holding Corp. from 2000 to 2007. Over the course of his seven-year tenure at TD Ameritrade, Mr. MacDonald served as executive vice president, chief financial officer and treasurer, chief administrative officer and chief operating officer. He retired from TD Ameritrade in April 2007. Prior to joining TD Ameritrade, Mr. MacDonald was chief financial officer of Investment Technology Group, Inc., a public company that specializes in agency brokerage and technology. From 1989 to 1994, Mr. MacDonald was a vice president and group manager for Salomon Brothers. Earlier in his career, Mr. MacDonald was an audit senior manager at Deloitte & Touche focused on commercial banking, real estate joint ventures and financial services. He began his career at Ernst & Young performing financial audits with a focus on international operations. Mr. MacDonald holds a Bachelor of Science degree in Accounting from Boston College.
Michael K. Roseman. Mr. Roseman has served as our Chief Risk Officer since August 2008. He is responsible for the overall management of MF Global’s risk department worldwide including market, credit, and operational risk. Before joining MF Global, Mr. Roseman served as chief risk officer for the Americas at Newedge Group. He joined Newedge (formerly, Fimat, USA) in 2004 before its merger with Calyon, and while at Newedge, he oversaw all aspects of risk related to their Americas brokerage business. Before his position at Newedge, Mr. Roseman headed U.S. risk oversight at Bank of Montreal from 2001 to 2004. He also held several positions at Sanwa Financial Products from 1994 to 2001 including head of market risk. Mr. Roseman has a B.S. in Engineering from the University of Delaware and an MBA from the Kenan Flagler Graduate School of Business at the University of North Carolina.
James L. Rowsell. Mr. Rowsell is our Managing Director, Europe. He oversees operations in London, Paris, Geneva, and Zurich, and is responsible for the firm’s European growth strategy across asset classes and customer profiles. Prior to joining MF Global in 2003, he spent a number of years at Citigroup, most recently as head of equity sales for Europe. From 1995 to 1998, he was head of sales for the UK and Pan-Europe for HSBC. He also held a number of positions at James Capel & Company between 1988 and 1995, where he specialized in equity sales to UK institutions and specialist sales in telecommunications and technology. Mr. Rowsell qualified as a barrister at the Inns of Court School of Law, which is now a part of the City Law School.
On May 13, 2010, we received notice from Mr. Laurence O’Connell that he was resigning from us as Managing Director of Asia Pacific. Immediately following Mr. O’Connell’s resignation, Mr. Karel Harbour was appointed as interim Managing Director of Asia Pacific. Mr. Harbour will also continue in his current role as our Chief Operating Officer. Consistent with Mr. O’Connell’s employment arrangement, Mr. O’Connell will make himself available to us as necessary through July 19, 2010. We will continue to pay Mr. O’Connell’s base salary and benefits through December 31, 2010 and will facilitate his repatriation. Mr. O’Connell will not receive any other separation payments.
16
Table of Contents
| ITEM 1A. | RISK FACTORS |
We face risks in operating our business, including risks that may prevent us from achieving our business objectives or that may adversely affect our business, financial condition and operating results. We present these risks according to the following categories: Risks related to Our Industry and Business; Risks related to Our Capital Needs and Financial Position; Risks related to Regulation and Litigation; Risks related to Our Operations and Technology; and Risks related to the Change in our Jurisdiction of Incorporation.
RISKS RELATED TO OUR INDUSTRY AND BUSINESS
Conditions in the financial services industry and the securities markets, especially decreases in trading volumes, interest rates and market liquidity, may hurt our business.
We generate revenues principally from commissions from execution and clearing services, spreads from principal transactions and net interest income earned on cash balances in certain of our clients’ accounts as well as interest related to our fixed income and principal transaction activities. These revenue sources are dependent on a combination of factors including the level of trading volumes, interest rates, credit spreads and market liquidity, as well as global market and economic conditions generally. A decrease in trading volumes or market liquidity, or a continued period of extraordinarily low interest rates, either individually or in combination, could adversely affect our business and profitability.
The volume of transactions our clients conduct with us and the revenue we generate from interest income is directly affected by a number of U.S. and international market factors, most of which are beyond our control, including:
| • | economic, political and market conditions; |
| • | broad trends in the brokerage and finance industry; |
| • | changes in customer trading demand and speculative trading activities in the markets; |
| • | supply and demand for commodities; |
| • | financial strength of market participants; |
| • | availability of credit and capital use in trading; |
| • | legislative and regulatory changes; |
| • | actions of our competitors; |
| • | consolidation among exchanges and our competitors; |
| • | introduction of new products; |
| • | changes in cost and fee structures; |
| • | changes in government monetary policies; |
| • | the level and volatility of foreign exchange rates; |
| • | disruptions in markets due to terrorism, war or extreme weather events or other natural disasters; and |
| • | new market entrants. |
Any one or more of the factors listed above, or other factors, may contribute to a decline in trading volumes or market liquidity. Any significant decline in trading volume in the financial markets generally, or the fixed income, interest rate product, equity, foreign exchange or commodity markets in particular, could have a material adverse effect on our business and operating results.
For example, in calendar year 2008 and part of calendar year 2009, the global financial services industry and the securities and futures markets experienced significant and adverse conditions, including a substantial contraction of credit, significantly increased volatility, outflows of customer assets and investments, losses resulting from declining asset values, defaults on securities and loans and substantially reduced liquidity. As a result, many financial institutions and market participants required additional capital infusions, merged with larger and stronger competitors, became bank holding companies, and, in some cases, failed. Many of the firms that have been adversely affected by the financial crisis were or are our clients or our counterparties. As a result of this instability of the financial markets and the lack of readily available credit (or capital), we believe that many of our clients and counterparties decreased their trading volume and risk exposure.
17
Table of Contents
Factors affecting trading volume are complex and historical precedent may not necessarily be meaningful. For example, historically, trading volume on U.S. derivatives exchanges tend to increase during periods of uncertainty due to increased hedging activity and the desire to manage the risks associated with, or to speculate on, volatility in the equity markets, fluctuations in interest rates, and price changes in foreign exchange, commodity, and other markets. However, during the recent economic volatility, we experienced decreased volume during parts of 2008 and 2009, which we believe was due primarily to our clients and other market participants decreasing risk exposure and the lack of available capital.
A reduction in our overall trading volume could also render the markets in which we operate less attractive to participants as a source of liquidity and could result in further losses of trading volume and the associated transaction-based revenues. Such diminution of liquidity could also make it more difficult for us to generate profit margins on principal transactions. Accordingly, any reduction in trading volumes or market liquidity could have a material adverse effect on our business and financial results.
In addition to trading volumes, revenues are affected by the level of interest rates, as we generate revenue from net interest earned on the investment of the margin funds as well as other cash our clients place with us. Our interest income is directly affected by the spread between the interest rates we pay our clients on their cash balances and the interest rates we earn from re-investing their cash balances. While these spreads have remained within a relatively constant range over time, they can widen or narrow when interest rate trends change. In addition, a portion of our interest income relates to client balances on which we do not pay interest, and thus in these cases, interest income directly depends on the absolute level of interest rates. As a result, a portion of our interest income may decline or remain at current depressed levels if interest rates fall or remain at current low levels, regardless of the spreads that determine most of our interest income. As a general matter, our financial performance benefits from higher interest-rate environments, which typically increase our net interest income, and is negatively affected when short-term interest rates are low, because those environments reduce interest income. Our net interest income may also decline if clients reduce surplus margin balances they hold with us, either because they are removing excess cash, or reducing their trading activity in the wider market generally (for example, during the financial crisis in 2008) or with us specifically. As a result of the interest rate environment over the past fiscal year, our interest income has substantially contracted, which has adversely impacted our financial results.
We also earn interest income from collateralized financing arrangements, which include resale agreements and securities lending transactions we enter into in conjunction with our principal transactions. Interest income earned in connection with collateralized financing transactions depends on the difference between the interest rates we pay to our clients on their cash collateral and the interest rates we receive from investing that collateral.
Fluctuations in interest rates are caused by many of the factors identified above as well as others. Any significant narrowing in short-term interest rate spreads or overall levels could have a material adverse effect on our business and operating results.
We face intense competition from other companies within the financial services industry, and if we are not able to compete successfully with them, our business may be harmed.
The derivatives and cash brokerage industry is highly competitive, and we expect that competition will continue to intensify in the future. Many of our current and potential competitors have larger client bases, more established name recognition and greater financial, marketing, technological and personnel resources than we do. Further, some of our competitors may be better capitalized, and some may have received direct or indirect subsidies from their respective national governments following the global economic crisis. As a result of these subsidies, these competitors may have lower operating costs due to lower costs of capital or may be perceived by clients as having the benefit of the implicit guarantee of their home government. Furthermore, because some of our competitors are better capitalized, they are able to participate in certain markets that we are excluded from because of our smaller size, such as clearing for credit default swaps. Therefore, our current and potential competitors may be able to, among other things:
| • | maintain a stronger credit rating than we do; |
| • | enjoy greater access to, and have a lower cost of, capital, which may allow them to provide more favorable financing or liquidity to clients than we can provide; |
| • | develop and provide products and services that are more attractive to clients than ours, in one or more of our markets; |
18
Table of Contents
| • | provide execution and clearing services that are more rapid, reliable or comprehensive, or less expensive than ours; |
| • | provide products and services we do not offer; |
| • | offer products and services at prices below ours to gain market share and to promote other businesses in which we engage to only a limited extent; |
| • | offer better, faster and more reliable technology; |
| • | outbid us for desirable acquisition targets; |
| • | market, promote and sell their products and services more effectively; and |
| • | develop stronger relationships with clients. |
We compete with a significant number of brokers in the U.S. and throughout the world in one or more markets. Although no one competitor operates in all of our markets, one broker, Newedge, which is a large, well capitalized broker with global operations, competes in many of our markets. In addition, affiliates of the largest financial institutions, including Bank of America, Citigroup, Goldman Sachs, JPMorgan Chase, and UBS compete with us in key areas such as clearing services, which is a significant source of our revenue. We also compete with a large number of independent brokerage firms, such as R.J. O’Brien in the United States, as well as regional brokers in particular markets around the world. We have also witnessed the continuing increase of online trading platforms that provide direct competition to our traditional brokerage business.
New or existing competitors could make it difficult for us to maintain our current market share or increase it in desirable markets. Even if competitors do not significantly erode or limit our market share, they may offer their services at lower prices, and we may be required to reduce our fees significantly to remain competitive. A fee reduction without a commensurate reduction in expenses or increase in volume would decrease our profitability.
Our business could be adversely affected if we are unable to retain our existing clients or attract new clients.
The success of our business depends on our ability to maintain and increase our client base. Our clients are particularly sensitive to the diversity and flexibility of the services, products, markets and regions that we make available; the quality, speed and reliability of our order execution and clearing services; our perceived and actual creditworthiness; and the costs of using our services. Because the financial services industry in general, and the futures brokerage industry in particular, is subject to rapid innovation in products and services, particularly with regard to technological development, we face intense competitive pressure to continuously enhance our product and service offerings in order to maintain and increase our client base. Fast and reliable systems technology with global reach has been a critical aspect of client service, and we must be able to keep pace with important industry innovations, an effort which could be costly and present operational and other risks. We may also face difficulties in attracting new clients if we fail to offer a range of services as broad as our competitors offer. Further, if our reputation for quality, speed and reliability is impaired, or if we fail to enhance existing or create new products and services or enter into new markets and regions, we may not be able to attract new clients which may inhibit our growth.
Our clients are not obligated to use our services and at any time could easily and quickly switch providers of execution and clearing services, transfer their positions or decrease their trading activity conducted through us. This is particularly true for our institutional clients who are sophisticated users of brokerage services, often have relationships with a number of competing brokers, and generate a disproportionately large share of our client trading volumes. As a result, we are vulnerable to potentially significant and sudden loss of revenues from our institutional client base. Similarly, while individual investors in the past have generally been less likely to change brokers, their demand for brokerage services has generally been sensitive to broader market trends, so a significant downturn in the markets or unusually heightened volatility in the derivatives or cash markets could lead to a substantial decline in revenues from our individual investor client base. Many of our clients have longstanding relationships with individuals or teams within our company. To the extent any of those individuals or teams seek alternative employment, we may be in jeopardy of losing those clients.
19
Table of Contents
Our international operations present special challenges that we may not be able to meet, and this could adversely affect our financial results.
We currently conduct business internationally and expect to continue to expand our international operations. During fiscal 2010, we generated approximately 33.3% of our revenues, net of interest and transaction-based expenses, in Europe and 13.9% in Asia. We face significant risks and challenges in conducting business in international markets, particularly in developing regions. These risks and challenges include, but may not be limited to:
| • | potentially unstable or adverse political climates; |
| • | local laws that could be unfavorable to our business or foreign investors; |
| • | less developed technological infrastructure and higher costs, which could make our products and services less attractive or accessible in emerging markets; |
| • | difficulty in complying with the diverse regulatory requirements of multiple jurisdictions, which may be more burdensome, subject to unexpected changes, or not clearly defined, potentially exposing us to significant compliance costs and regulatory penalties; |
| • | inability to enforce contracts in some jurisdictions; |
| • | difficulties and costs associated with staffing and managing foreign operations; |
| • | difficulties and costs associated with commencing operations in new jurisdictions; |
| • | fluctuations in foreign currency exchange rates; |
| • | tariffs and other trade barriers; |
| • | regulatory requirements that limit our ability to expand our presence in emerging and/or developing countries; |
| • | currency and tax laws that may prevent or restrict the transfer of capital and profits among our various operations around the world; |
| • | time zone, language and cultural differences among personnel in different areas of the world; and |
| • | other barriers to entry that make it difficult or costly to establish our business. |
Furthermore, due to cultural, regulatory and other factors, we may be at a competitive disadvantage in those regions relative to local firms or to international firms that have a well-established local presence. In some locations, we may need to acquire local capacity or enter into joint ventures with local firms in order to gain a presence, and we may face intense competition from other international firms over relatively scarce opportunities for market entry. This competition could make it difficult for us to expand our business as planned.
In order to be competitive in some local non-U.S. markets, or in some cases because of restrictions on the ability of foreign firms to do business locally, we have sought and may in the future seek to operate through joint ventures with local firms. For example, in India, we own a 70.2% interest in MF Global Sify Securities India Private Ltd. and a 75.0% of MF Global Financial Services India Private Limited, and in Taiwan, we currently own a 73.2% interest in MF Global Futures Trust Co. Ltd. and a 19.5% interest in Polaris MF Global Futures Co. Ltd., a publicly traded company. Doing business through joint ventures may limit our ability to control the conduct of the business, require us to allow our joint-venture partners veto rights over material actions, or could expose us to reputational and operational risks. In addition, due to the intense competition from other international brokers seeking to enter these fast-growing markets, we may have difficulty finding suitable local firms willing to enter into the kinds of relationships with us that we may need to gain access to these markets.
Our principal transactions expose us to market and other risks.
Our principal transactions expose us to market risk, which could result in losses that adversely affect our results of operations of our business. Market risk refers to the risk fluctuations in financial instruments, commodity market prices, market indices, foreign-exchange rates, interest rates, market or instrument correlations, implied volatilities (the price volatility of the underlying instrument imputed from option prices), or other market factors will result in losses for a position or portfolio. Accordingly, when we act as principal in a transaction and take a position for our own account, market fluctuations that are different than what we expect could result in substantial losses. For more information about our market risk and market-risk management methods, see “Item 7A. Qualitative and Quantitative Disclosure about Market Risk—Market Risk”.
We engage in principal transactions—purchasing, selling or otherwise taking positions for our own account—primarily to facilitate the execution of existing client orders or in anticipation that future orders will become available to fill the other side of a transaction. When facilitating client transactions as a principal, we sometimes choose to not fully offset trades or choose
20
Table of Contents
to execute offsetting trades whose terms differ from the clients’ trades. To the extent that we may not be able to efficiently or advantageously hedge or reverse our principal-transaction positions, or to the extent that such principal transactions remain unhedged, our capital will be exposed to risk of loss. Additionally, we may be exposed to market risk when, in conjunction with ongoing or anticipated client activity or otherwise for our own account, we enter into trades or other transactions, which may or may not be hedged, in which we seek to monetize our views on the market. Principal transactions may also expose us to concentration risk, as discussed below under “Risk factors—Concentration of credit and market risk could expose us to potentially significant losses.” As we grow our business, including continuing to facilitate our clients’ transactions and increasing our principal trading activities, our exposure to market risk and trading losses may increase. Although we expect to increasingly recognize trading income as part of our ongoing activity for our clients and to continue monetizing, on a limited basis, our market views with unhedged principal transactions, there can be no assurance that we can increase the level of this activity or that it will be as profitable as we may anticipate or at all.
Even transactions where we execute client orders by entering into a requested client trade for our own account and then, relatively quickly thereafter, entering into an offsetting trade or a series of trades with one or more third parties may expose us to market risk. In cases where an offsetting trade is undertaken to eliminate or limit our exposure to changes in market prices, if our trades are not completely offset, not perfectly hedged or are poorly timed (for example, the risk that market prices will change before we are able to execute an offsetting trade or a series of trades), we may incur trading losses. Furthermore, although matched-principal transactions limit market risk, the transactions do not limit counterparty risk, which is discussed in greater detail under “Item 1A. Risk Factors—Our business exposes us to significant client and counterparty credit risks”.
We may also take positions for our own account in order to hedge our exposure to changes in foreign currency exchange rates and interest rate risks arising from the global character and financial focus of our operations and each of those types of transactions also expose us to market risk. Because of the limitations and uncertainties inherent in hedging strategies, our exposure to market risk from these transactions may not be fully offset or may not always be fully known. Similarly, we may make investments as part of our asset-liability management activities that expose us to market risk, particularly but not exclusively, from interest rate movements.
We cannot guarantee that we will not incur significant losses at any time, even with respect to our client facilitation of transactions through matched-principal execution, and particularly in the event of severe market stress.
Our business exposes us to significant client and counterparty credit risks.
Credit risk arises from the possibility that we may suffer losses due to the failure of clients, counterparties and borrowers to satisfy their financial obligations to us at all or in a timely manner. We are subject to credit risk in connection with many of our business activities and we may be materially and adversely affected in the event of a significant default by our clients or counterparties. Credit risks we face include, among others:
| • | exposure to counterparties with whom we place funds, such as when we post margin with exchanges and brokers, deposit both our own funds and those of our clients with banks, enter into repurchase and resale agreements and enter into stock lending and stock borrowing transactions; |
| • | exposure to issuers of securities we purchase or that are referenced in underlying securities we purchase; |
| • | exposure to client inability or unwillingness to meet obligations when adverse market movements result in a trading loss and the client’s posted margin is insufficient to satisfy the deficit; such margin deficiency may be caused by a failure to monitor client positions and accurately evaluate risk exposures, leading to our failure to require clients to post adequate initial margins or increase margins as necessary to keep pace with market movements and subsequent account deficits; |
| • | exposure to clients to whom we provide secured (i.e., collateralized), unsecured and risk-based financing lines to cover initial and variation margin and exposure to clients with whom we trade on an OTC basis for OTC transactions that are not fully collateralized; |
| • | market risk exposure due to delayed or failed settlement, which, if not corrected, could become our responsibility as a clearing broker, or which could cause us losses if we were the counterparty and principal; |
| • | exposure to the possibility that execution-only clients will not pay us, or will delay paying us, the commission owed on trades we have executed; |
21
Table of Contents
| • | exposure to the risk that a clearing member of an exchange or clearing house where we are also a clearing member may default—should the amount of the default exceed the member’s margin and clearing fund deposits, we may suffer losses as the shortfall is absorbed pro rata from the deposits of the remaining clearing members or we are subject to additional capital calls in some cases; |
| • | exposure to the risk that political or economic failure, action, or embargo imposed on or by a specific country will prevent a transaction, or prevent a client or counterparty, or a group of clients or counterparties from completing a transaction as expected; and |
| • | exposure to concentration risk, that is, a large exposure to a single client or counterparty, exposure to a group of connected clients or counterparties, or multiple exposures to a group of unrelated clients or counterparties whose risk of default is driven by common factors—for example, a similar business, industry, geographical location or product exposure. |
Clients and counterparties that owe us money or securities may default on their obligations to us due to bankruptcy, lack of liquidity, operational failure or other reasons. Our reputation may be damaged if we are associated with a client or counterparty that defaults, even if we do not have any direct losses from such an event.
Although we have procedures for reviewing the creditworthiness of our clients and counterparties, the risk of default may arise from events or circumstances that are difficult to detect or foresee. Some of our risk management methods depend upon the evaluation of information regarding clients and markets that is provided to us by the client or is publicly available or otherwise accessible by us. That information may not, in all cases, be accurate, complete, up-to-date or properly evaluated.
In addition, concerns about, or a default by, one institution could lead to significant liquidity problems, losses or defaults by other institutions, which in turn could adversely affect us. We may also be adversely affected if settlement, clearing or payment systems, such as Euroclear or Continuous Linked Settlement, become unavailable, fail or are subject to systemic delays for any reason outside our control.
For an analysis of our credit risk—please refer to “Item 7A. Quantitative and Qualitative Disclosures about Market Risk—Credit Risk”.
Concentration of credit and market risk could expose us to potentially significant losses.
Credit concentration risk is the risk arising from a large exposure to a single client or counterparty, exposure to a group of connected clients or counterparties, or multiple exposures to a group of unrelated clients or counterparties whose risk of default is driven by common factors—for example, a similar business, industry, geographical location or product exposure. While we monitor client and counterparty concentrations, our efforts to mitigate concentration risks may not be successful and we may become exposed to potentially significant losses.
Market concentration risk is the risk arising from large exposures to a single financial instrument or market, group of related financial instruments or markets, or group of unrelated financial instruments or markets whose risk is driven by common factors. We may hold large position concentrations in a single issuer’s or industry’s securities or other instruments in order to execute existing or anticipated client-facilitation transactions; maintaining this inventory to facilitate client transactions exposes us to potentially higher market risk and associated losses than would occur if our positions were less concentrated. Successfully managing a concentrated market portfolio, and deriving profit from the differences between prices at which we buy and sell securities or other instruments, relies upon:
| • | our ability to attract order flow; |
| • | market interaction and general market conditions; |
| • | the skills of our trading personnel; |
| • | the effectiveness of our hedging strategies and risk management processes; |
| • | the price volatility of the specific securities or other instruments held in inventory; and |
| • | the availability and allocation of capital. |
We cannot guarantee that we will be able to manage such risk successfully or that we will not experience significant losses from such activities.
In addition, disruptions in the liquidity or transparency of the financial markets, such as in 2008 and part of 2009, may result in our inability to transact in certain instruments or positions held by us for client-facilitation or principal trading purposes, thereby leading to increased concentrations of those newly-illiquid positions and, subsequently, exposing us to
22
Table of Contents
market concentration risk. These concentrations could expose us to losses if the mark-to-market values of the securities or other instruments or positions held on our balance sheet decline causing us to recognize losses on our financial statements. Moreover, the inability to reduce our positions not only increases the market and credit risks associated with such positions, but also increases the level of risk-weighted assets on our balance sheet, thereby increasing our capital requirements and funding costs, all of which could adversely affect our businesses’ operations and profitability.
Our business could be adversely affected if we do not successfully implement the recent and ongoing realignment and restructuring of our business.
Beginning in late 2008, we reorganized our management and the way we sell our products. A principal focus of this reorganization was the implementation of a global management approach to our various product offerings to accommodate the global nature of our company. Beginning in fiscal 2010 we increased the use of equity as part of our employees’ compensation. More recently, we have announced certain immediate tactical decisions designed to better align our resources and improve our earnings profile, including the following actions to control and reduce our costs:
| • | intended reduction of our workforce by 10 to 15% across the entire company during our first quarter of fiscal 2011; |
| • | implementation of a firm-wide hiring freeze; |
| • | cancellation, postponement or restructuring of non-core projects and initiatives; and |
| • | setting compensation to net revenue ratio targets for every business area and the firm as a whole. |
We expect to incur severance and other costs in the first half of fiscal 2011 in connection with the foregoing, the amounts of which have not yet been quantified and may have an adverse effect on our profitability. In addition, we may experience difficulties in implementing these cost controls, restructuring measures and other initiatives in a timely manner, and we may experience delays and unexpected costs and expenses in implementing these plan. Any of these difficulties may prevent us from realizing in full or in part the anticipated benefits and savings from these actions. Because of these and other factors (some of which are outside of our control), we cannot predict whether we will realize the purpose and anticipated benefits of these measures. If we are unable to achieve or maintain all of these plans, or if unanticipated events occur, our business and results of operations may be adversely affected. For example, we may unintentionally eliminate more positions than necessary and as a result discover either that we lack the human resources necessary for future growth or that we must hire new personnel in order to maintain an effective control environment or compliance and regulatory oversight function. In addition, we may incur more than anticipated severance or other costs because of unanticipated litigation or other issues relating to our reduction in workforce. Our shift in compensation policy and culture may also adversely affect our employees’ desire to remain with our company, and a departure of a significant number of employees could adversely affect our business. Further, if we experience additional adverse changes to our business, we may face further restructuring or reorganization activities in the future.
Our business may be adversely affected if we do not maintain our network of introducing brokers.
We receive a significant amount of our individual investor business through our network of introducing brokers, who assist us in establishing new client relationships for whom we execute and clear trades. Our introducing brokers also often provide marketing and other services for us to attract and retain clients for whom we execute and clear trades. We compensate these introducing brokers for introducing clients to us. Many of our relationships with introducing brokers are non-exclusive or may be terminated by the brokers with relatively short notice or no notice. In addition, our introducing brokers have no obligation to provide us with new client relationships or minimum transaction volumes. Our failure to maintain relationships with these introducing brokers or the failure of these introducing brokers to establish and maintain client relationships could result in a loss of revenues, which could adversely affect our business. To the extent any of our competitors offer more favorable compensation to one of our introducing brokers, we could lose the broker’s services or need to increase the compensation we pay to retain the broker. Our relationships with our introducing brokers also may expose us to significant reputational and other risks. See “—Risks Related to Regulation and Litigation—We could be harmed by misconduct that is difficult to detect or deter”.
If we are unable to attract and maintain our highly skilled management team, brokers and other employees, our business could be adversely affected.
Our performance and future success largely depends on the talents and efforts of highly skilled individuals; therefore, our continued ability to compete effectively in our business, to manage our businesses effectively and to expand into new businesses and geographic areas depends on our ability to attract new employees and to retain and motivate our existing
23
Table of Contents
employees. Failure to retain one or more members of our management team, particularly Jon Corzine, our Chairman and Chief Executive Officer, or other key employees, or failure to attract skilled personnel, could adversely affect our ability to manage our business effectively and execute our business strategy.
Due to the complexity and risks associated with financial services and the specialized knowledge required to conduct and grow our business effectively, the demand and competition for qualified personnel is intense. Many of our brokers and traders have long-standing relationships with particular clients; the departure of any such employee could adversely affect our relationships with those clients, potentially resulting in the loss of one or more of such clients and related revenues. The time and costs required to identify, recruit and train replacements should we fail to retain our current employees could be significant. If we fail to continue to provide competitive levels of compensation, or if we otherwise fail to provide a desirable work environment, many of our employees could find employment at other firms. In particular, failure to retain and attract experienced personnel, including qualified support, compliance and technology personnel could result in execution errors or regulatory infractions. In emerging markets, we are often competing for qualified employees with entities that have a significantly greater presence or more extensive experience in the region.
Our ability to retain and attract highly skilled employees—both management and non-management—could depend heavily on the level of compensation we can offer. Consequently, our profitability could decline as we compete for personnel. The imposition on us or our employees of certain of the currently proposed restrictions or taxes on employee compensation may adversely affect our ability to attract and retain qualified senior management and employees.
Our risk management policies, procedures and systems might not be effective in mitigating risk and loss to us.
To manage the significant risks inherent in our business, we must maintain effective policies, procedures and systems that enable us to identify, monitor and control our exposure to financial, operational, and business risks. For a description of our risk management approach, see “Item 1. Business—Our Business—Risk Management”. This risk management function requires, among other things, that we properly record and verify many hundreds of thousands of transactions and events each day and that we continuously monitor and evaluate the size and nature of our clients’ positions and their associated risks. Because of extremely high transaction volumes, it is not practicable for us to review and assess every single transaction or to monitor at every moment in time our clients’ positions and their attendant risks.
We must rely upon our analysis of publicly or otherwise available information about markets, personnel, clients or other matters. That information may not in all cases be accurate, complete, up-to-date or properly analyzed. Further, we rely on a combination of technical and human controls and supervision that are subject to error and potential failure, the challenges of which are exacerbated by the 24-hour-a-day, global nature of our business.
Our risk-management framework was designed using internally-developed risk-control methods, documented historical behavior, and our observation of industry practices. However, our methods may not prevent future losses, particularly losses stemming from extreme market movements for which little or no historical precedent exists or which our risk management scenarios may not anticipate. Thus, our risk management framework may suffer from flaws in design, implementation, or the lack of adequate, accurate or timely information. Further, our risk management methods may not identify a risk or link a risk to a potential loss. If our risk management efforts are not effective, we may not prevent losses that could have a material adverse effect on our financial condition or operating results. In addition, a failure to exercise reasonable risk oversight could subject us to litigation, particularly from our clients, and sanctions or fines from regulators.
The current trend toward electronic trade execution has diminished the role of some brokers in the execution process. We must continue to offer attractive, value-added services to keep pace with this trend and other industry changes or our business could be adversely affected.
While clients have traditionally relied on brokers to execute trades, a growing number of exchanges have developed systems that permit orders to be routed through brokers electronically, thereby enabling clients to avoid more-costly voice-execution services and pressuring brokers to lower their execution-commission rates. In a number of cases, exchanges provide large clients with direct electronic access, enabling them to bypass brokers in the trade-execution process altogether —a trend known as “broker disintermediation”. For example, some of our largest institutional clients are now able to execute orders on some exchanges directly by electronic means and, as a result, the portion of the fees we earn from these clients for execution services has, in some cases, declined relative to the portion we earn from providing clearing services for these
24
Table of Contents
trades. As exchanges devote substantial resources to developing more efficient ways for clients to execute orders with reduced broker involvement, our revenues and profitability could suffer to the extent we are unsuccessful in continuing to attract clients to execute through us by, among other things, enhancing the value-added execution services we offer. Furthermore, to maintain our client relationships as they transition to electronic trade execution, we may be required to make substantial investments in upgrading and maintaining our information technology systems and these additional expenses could further erode the profitability of servicing these clients. Additionally, market structure and practices in our industry could change significantly in other ways, including some we may not foresee, and we may not be able to adapt on a timely and cost-effective basis. To the extent that we do not adapt as rapidly or efficiently to industry changes as our competitors do, our business could suffer.
Our growth strategy involves significant risks, and if we are unable to manage them effectively, our business may be materially harmed.
In the past, we have significantly expanded our business both organically and through acquisitions that have extended our presence into new markets as well as delivered scale within existing markets. We intend to continue our organic growth in those product areas where we have strength or a competitive advantage. We may also opportunistically pursue acquisitions of entire brokerage units or businesses, buy client accounts from other brokers, or recruit other brokers’ client-facing personnel.
Acquisitions entail numerous risks and challenges, including but not limited to the following:
| • | difficulties in the integration and retention of acquired client accounts or personnel and, in cases where we acquire an entire company or unit, the integration and effective deployment of operations or technologies; for example, the timely transfer of client accounts is key to the success of our acquisitions, and failure to quickly integrate our software systems with those of an acquired company could result in errors or service disruptions, which could adversely affect our ability to maintain an ongoing relationship with any affected clients; |
| • | strain on our operations, information technology, compliance and financial systems, managerial controls and procedures, and our people; |
| • | the need to modify our systems or to add management resources; |
| • | unforeseen difficulties in the acquired operations, causing disruption of our ongoing business; |
| • | challenges in identifying pre-existing weaknesses or deficiencies in the acquired business’ risk management, internal controls or technology systems; |
| • | failure to achieve transaction-related cost savings or other financial, operating, or strategic objectives; |
| • | required amortization of acquired intangible assets, which would reduce future reported earnings; |
| • | possible adverse short-term effects on our cash flows or operating results, for example, when we acquire another company, we could incur severance payments and other acquisition-related costs that could reduce our net income; |
| • | increased regulatory oversight and obligations, including higher capital requirements; |
| • | diversion of management’s attention from other business concerns; |
| • | assumption of unknown material liabilities or regulatory non-compliance issues; and |
| • | failure to obtain necessary regulatory approvals. |
In addition, we may be unable to pursue our acquisition strategy. Competition for suitable acquisition targets is intense. Many of our largest competitors have substantially greater financial resources than we do and are able to outbid us on the most desirable targets. We may lack the financial resources necessary to consummate acquisitions in the future or may be unable to secure financing on favorable terms. We may not be able to identify suitable acquisition targets, or to complete any transactions we identify on sufficiently favorable terms, to meet our strategic goals. We also may be unable to obtain regulatory or other governmental approvals that may be necessary to complete acquisitions. In addition, any future acquisitions may entail significant transaction costs and risks associated with entry into new markets. Even when we complete an acquisition, we may not realize the benefits we expected to attain.
Organic growth presents risks similar to those associated with acquisitions. In particular, if we expand our operations too rapidly or otherwise beyond our ability to manage them effectively, we could encounter serious operational issues and expose ourselves to increased operational and perhaps regulatory risk. For example, we may lack sufficient personnel with the requisite expertise or skills to manage or oversee new products or businesses. Organic growth may also require us to increase our capital or other financial resources, the cost of which, depending on market conditions, may be prohibitive.
25
Table of Contents
Both organic growth and growth by acquisition may impair our ability to manage risk and ensure regulatory compliance, which may result in financial loss or regulatory violations, any of which could adversely affect our business, operating results, or financial condition.
Failure to manage risks that arise from both acquisitions and organic growth could have a material adverse effect on our business, financial condition and operating results.
MF Global Holdings Ltd. is a holding company and its liquidity depends, in part, on payments from its subsidiaries, which are subject to restrictions.
MF Global Holdings Ltd., is a holding company and, therefore, depends on dividends, distributions and other payments from its subsidiaries to fund dividend payments and to fund all payments on its obligations, including debt obligations. Many of our subsidiaries, including our broker-dealer and our regulated UK subsidiaries, are subject to laws that restrict dividend payments or authorize regulatory bodies to block or reduce the flow of funds from those subsidiaries to our parent. In addition, our broker-dealer and our regulated subsidiaries are subject to restrictions on their ability to lend or transact with affiliates and to minimum regulatory capital requirements, as well as restrictions on their ability to use funds deposited with them in brokerage accounts to fund their businesses. Additional restrictions on related-party transactions, increased capital requirements and additional limitations on the use of funds on deposit in brokerage accounts, as well as lower earnings, can reduce the amount of funds available to meet the obligations of our parent and even require our parent to provide additional funding to such subsidiaries. Restrictions or regulatory action of that kind could impede access to funds that we need to make payments on our obligations, including debt obligations, or dividend payments. In addition, our right to participate in a distribution of assets upon a subsidiary’s liquidation or reorganization is subject to the prior claims of the subsidiary’s creditors.
Furthermore, we guarantee many of the obligations of our consolidated subsidiaries. These guarantees may require us to provide substantial funds or assets to our subsidiaries or their creditors or counterparties at a time when we are in need of liquidity to fund our own obligations. See “Business—Regulation” in Part I, Item 1 of this Annual Report on Form 10-K.
We may be required to recognize further impairments of our goodwill or other intangible assets, which could adversely affect our results of operations or financial condition.
The determination of the value of goodwill and intangible assets requires management to make estimates and assumptions that affect our consolidated financial statements. We are required to test goodwill for impairment annually, or in interim periods if certain events occur indicating that the carrying value may be impaired. We assess potential impairments to intangible assets when there is evidence that events or changes in circumstances indicate that the carrying amount of an asset may not be recovered. Our judgments regarding the existence of impairment indicators and future cash flows related to goodwill and intangible assets are based on several factors, which include:
| • | the operational performance of our acquired businesses; |
| • | management’s current business plans, which factor in current market conditions including contract and product volumes and pricing for future periods; |
| • | the estimated fair value and yield of our debt, preferred securities, and equity, market capitalization; |
| • | the trading price of our common stock; |
| • | changes in customer attrition and trading volumes; and |
| • | other relevant factors. |
When estimating impairment assessments, management uses discounted cash flow analysis, which requires the subjective selection and interpretation of data inputs; depending on market conditions at the testing date, a very limited amount of observable market data may exist from which to select inputs for use in the discounted cash flow model.
In fiscal 2010, our market capitalization was significantly lower than our book value. We performed impairment tests of our goodwill and during the year ended March 31, 2010, we recognized a charge of $3.4 million to impair all of our goodwill. Also during the fourth quarter of fiscal 2010, we recorded a charge of $50.6 million to impair certain intangible assets. These non-cash charges materially impacted our equity and results of operations in 2010, but did not affect our ongoing business operations, liquidity, cash flow or compliance with covenants for our credit facilities. We may record additional goodwill in future periods related to our existing earn out arrangements or future acquisitions.
26
Table of Contents
Changes to our business plan, continued macroeconomic weakness, declines in operating results, and continued low market capitalization may result in our having to perform an interim goodwill impairment test or an intangible asset impairment test. These types of events and the resulting analysis could result in further goodwill or intangible asset impairment charges in future periods.
We have recorded significant deferred tax assets reflecting our expectation of carrying certain losses forward against future income in certain jurisdictions. If we are unable to generate positive earnings in such jurisdictions, we may be forced record valuation allowances against previously-booked deferred tax assets, which could have a significant adverse impact on our financial results.
In certain jurisdictions, we have generated pre-tax losses that, in accordance with applicable tax law, we expect to be able to carry forward and offset against future profits to reduce relevant taxes going forward. We have recorded significant deferred tax assets reflecting our expectation of using these loss carryforwards against future income. If we are not able to generate profits in these jurisdictions in future periods, we may be required to record valuations allowances against these deferred tax assets. Recording valuation allowances against these deferred tax assets could have a significant adverse impact on our financial results.
RISKS RELATED TO OUR CAPITAL NEEDS AND FINANCIAL POSITION
We must maintain substantial amounts of capital and liquidity to conduct and grow our business.
If we have insufficient capital and liquidity we may not be able to maintain our operations or grow our business in accordance with our strategy. Our ability to provide clearing services, which is a critical part of our business, depends heavily on our ability to maintain capital, including equity capital at or above specified minimum levels required by various regulators throughout the world. Our failure to do so could expose us to significant penalties and sanctions, which we describe under “—Risks Related to Regulation and Litigation—We are subject to regulatory capital requirements which could constrain our growth and subject us to regulatory sanctions”. We also need capital and liquidity to protect us against the risk of default by our clearing clients and against clearing and settlement payment delays, caused by systemic problems outside our control in one country or between countries. Therefore, we may maintain capital and liquidity at levels determined in accordance with our internal risk management guidelines that could be greater than regulatory requirements. Thus, as a clearing broker, we must maintain capital and liquidity not only to comply with applicable laws and regulations, but to manage the risks inherent in our clearing operations in accordance with guidelines that we believe to be appropriate. If our risk management guidelines are insufficient or if we do not apply them properly we may not hold capital or liquidity to cover our needs. To the extent the levels we hold either at group or in an individual entity are insufficient, the firm and/or the entity is exposed to failure.
Our credit ratings could be adversely affected if we do not maintain sufficient capital and liquidity. Furthermore, we rely on uncommitted credit lines to finance our day-to-day clearing operations. Liquidity or capital issues, whether perceived or real, could prompt these lenders to reduce the amount of financing we use to conduct our clearing operations, which in turn could prompt us to reduce the amount of business we conduct and could accelerate client withdrawals. Thus, if we are unable to maintain capital at levels that the rating agencies or the market generally consider appropriate for our business, if we experience actual or perceived liquidity issues, or if for any other reason the market loses confidence in our financial condition, we may not be able to provide competitive clearing services, which are a major part of our business, and our clients could withdraw assets from their accounts, which could impair a substantial source of our interest income. Generally, clients clear their trades—and clearinghouses and other clearing firms deal—only with firms that are regarded as well capitalized and that maintain acceptable credit ratings from the independent rating agencies, such as Standard and Poor’s, Moody’s and Fitch.
Generally, principal trading activities have higher regulatory capital requirements than agency execution and clearing activities. Accordingly, our facilitation of client transactions through our principal trading activities could be curtailed if we do not have access to adequate capital and liquidity.
Therefore, we must maintain continuous access to adequate and sufficiently liquid sources of capital, including equity capital and external committed facilities on acceptable terms. Failure to do so could have severe consequences from a regulatory, operational or credit counterparty and solvency perspective. Even a less severe outcome, such as retaining the ability to obtain capital and liquidity but only at a higher cost, could significantly increase our interest expense and impair our earnings.
27
Table of Contents
Our business may be adversely affected by a reduction in our credit ratings.
If we do not demonstrate sufficient profitability in the future, we face the possibility of having our credit rating downgraded. In the event of a downgrade of our credit rating by one or more credit rating agencies, our business may be adversely affected. Some of the factors that could lead to a downgrade in our credit rating have been described in reports issued by certain rating agencies, and these factors include, but are not limited to, our profitability each quarter as compared against rating agency expectations, our ability to maintain a conservative liquidity profile, our ability to maintain the value of our franchise, deterioration in our trading volumes or operating cash flows, and a decline in maintenance margin funds or excess capital levels at our regulated subsidiaries.
A reduction in our credit ratings could increase our borrowing costs or trigger our obligations under certain bilateral provisions in some of our collateralized financing contracts or our bilateral contracts in the OTC markets. Under these provisions, if one or more of our credit ratings were decreased, counterparties could be permitted to terminate contracts made with us or require us to post additional collateral pursuant to ratings maintenance requirements. Termination of our OTC contracts or collateralized financing contracts could cause us to sustain losses and impair our liquidity by requiring us to find other sources of financing or to make significant cash payments or securities movements. Should we be unable to readily access capital and liquidity, our clients may be unwilling to clear their transactions through us. A reduction in our credit ratings could harm the way we are perceived by clients and could limit our attractiveness as a counterparty in OTC transactions.
In addition, any announcement by a rating agency that our credit rating is being downgraded, or even that we are being placed on “negative watch”, could have a serious adverse impact on our operating results and our financial condition, as was the case following the February 2008 unauthorized trading incident when we were put on “negative watch” by our rating agencies and downgraded by two out of three of them. Moreover, concerns about our credit ratings may limit our ability to pursue acquisitions and, to the extent we pursue acquisitions that affect our credit ratings, our business may suffer. To avoid placing our credit rating at risk, we may need to limit the growth of our business, or we may even need to reduce our operations or other expenses to improve profitability.
A credit-rating downgrade could also compel us to raise additional capital on unfavorable terms, which could result in substantial additional interest or other expenses and lower earnings. If we were forced to raise equity capital, that action could result in substantial dilution to our existing shareholders.
Fluctuations in currency exchange rates could reduce our earnings.
Our revenues and expenses are denominated primarily in U.S. dollars, British pounds and Euros. The largest percentage of our revenue is denominated in U.S. dollars, while the largest percentage of our non-U.S. expenses is denominated in British pounds and Euros. As a result, our earnings could be affected by changes in the U.S. dollar/British pound and U.S. dollar/Euro exchange rate and, to a lesser extent, changes in the U.S. dollar versus Asian currencies. Such changes have occurred in recent years, exerting downward or upward pressure on our earnings. Although we may seek to mitigate our exposure to currency exchange rates through hedging transactions in accordance with our policies on hedging, these efforts may not always be successful. For example, we realized net currency translation gains of $12.6 million for fiscal 2009 and $3.9 million for fiscal 2008, but a net currency translation loss of $15.6 million for fiscal 2010. See “Item 7A. Quantitative and Qualitative Disclosures about Market Risk—Market Risk.” Adverse trends in currency exchange rates could have a harmful effect on our earnings, and although we have realized net currency translation gains in some recent periods, we could incur significant currency translation losses in the future. Moreover, changes in currency exchange rates from one period to the next could make historical and future period-to-period comparisons of our performance more difficult.
Our operating results are subject to significant fluctuations due to seasonality and, as a result, our operating results in any particular period may not be a reliable indicator of our future or annual performance.
In prior years, our business has experienced seasonal fluctuations, reflecting reduced trading activity during summer months, particularly in August. We also generally experience reduced trading activity in December due to seasonal holidays. In addition, trading in some commodity derivatives, such as energy, is affected by the supply of, and demand for, the underlying commodity, which is seasonal and may change significantly. We also may experience reduced revenues in a quarter due to a decrease in the number of business days in that quarter. As a result of these seasonal fluctuations, our operating results in any particular period may not be a reliable indicator of our future or annual performance.
28
Table of Contents
RISKS RELATED TO REGULATION AND LITIGATION
We operate in a heavily regulated environment that imposes significant compliance requirements. Non-compliance with these requirements could subject us to sanctions and adversely affect our business.
We are extensively regulated by governmental bodies and self-regulatory organizations worldwide. Many of the regulations we are governed by are intended to protect the public, our clients and the integrity of the markets, and not necessarily our shareholders. In the United Kingdom, we are principally regulated by the Financial Services Authority, or FSA. In the United States, we are principally regulated in the futures markets by the Commodity Futures Trading Commission (CFTC) and the Chicago Mercantile Exchange (CME), and in the securities markets by the Securities and Exchange Commission (SEC), the Financial Industry Regulatory Authority (FINRA) and the Chicago Board Options Exchange (CBOE). Further, as participants in the financial services industry, our business must comply with the anti-money laundering laws of the jurisdictions in which we do business, including, in the U.S., the USA PATRIOT Act, which requires us to know certain information about our clients and to monitor their transactions for suspicious activities. Our business is also subject to rules promulgated by the U.S. Office of Foreign Assets Control, or OFAC, which require that we refrain from doing business, or allow our clients to do business through us, in certain countries or with certain organizations or individuals on a prohibited list maintained by the U.S. government. We are also regulated in all regions by local regulatory authorities and the various exchanges of which we are members. For example, we are regulated by the Monetary Authority of Singapore, the Securities and Exchange Board of India, and the Australian Securities and Investment Commission, among others. These regulators and self-regulatory organizations influence the conduct of our business and regularly examine our business to monitor our compliance with their regulatory requirements. Among other things, we are subject to regulation with regard to:
| • | our sales practices, including our interaction with and solicitation of clients and our marketing activities; |
| • | the custody, control and safeguarding of our clients’ assets; |
| • | account statements, record keeping and retention; |
| • | maintaining specified minimum amounts of capital and limiting withdrawals of funds from our regulated operating subsidiaries; |
| • | regular financial and other reporting to regulators; |
| • | anti-money laundering and other reporting practices; |
| • | licensing for our operating subsidiaries and our employees; |
| • | identifying our clients and determining the beneficial ownership of assets held by our clients, gathering required information about them and monitoring their account activities; |
| • | payments made to foreign-government officials and control practices designed to prevent such payments; |
| • | the conduct of our directors, officers, employees and affiliates; and |
| • | supervision of our business. |
We face risks that our policies, procedures, technology and personnel directed toward complying with the foregoing types of laws and regulations may be insufficient and that we could be subject to significant regulatory, criminal and civil penalties due to non-compliance. These penalties could have a material adverse effect on our business, financial condition and operating results. See “Item 1. Business—Our Business—Regulation and Exchange Memberships” for further discussion of these matters.
Many of the laws and regulations by which we are governed grant regulators broad powers to investigate and enforce compliance with their rules and regulations and to impose penalties and other sanctions for non-compliance. See “Item 3. Legal Proceedings”. If a regulator finds that we have failed to comply with its rules and regulations, we may be subject to fines or other sanctions, which could adversely affect our reputation and operations. In particular, certain of the requirements that we must comply with are focused on protecting our individual investor clients. If we fail to comply with applicable laws, rules or regulations, we may be subject to censure, fines, cease-and-desist orders, suspension of our business, removal of personnel, civil litigation or other sanctions, including, in some cases, increased reporting requirements or other undertakings, revocation of our operating licenses or criminal conviction. In addition, if we fail to comply with applicable laws, rules or regulations, particularly from our retail clients, we may also be subject to the loss of clients, negative publicity and litigation. Our ability to monitor compliance with all applicable laws and regulations is dependent in large part on our internal compliance function as well as our ability to attract and retain qualified compliance personnel. Non-compliance with applicable laws or regulations could adversely affect our reputation, prospects, revenues and earnings.
29
Table of Contents
The regulatory environment in which we and our clients operate is subject to continual change.
The legislative and regulatory environment in which we operate has undergone significant changes in the recent past and future regulatory changes in our industry are likely given the events observed since 2008. The governmental bodies and self-regulatory organizations that regulate our business may propose and consider additional legislative and regulatory initiatives and may adopt new or revised laws and regulations. As a result, in the future, we or our clients may become subject to new regulations that could affect the way in which we conduct our business and could make our business less profitable.
For example, recent market disruptions have led to numerous proposals in the United States and internationally for changes in the regulation and taxation of the financial services industry, including increased capital or new liquidity or leverage requirements, any of which could adversely affect us or our clients and the way we operate. On May 20, 2010, the U.S. Senate approved a bill relating to financial reform entitled the “Restoring American Financial Stability Act of 2010” and in December 2009, the U.S. House of Representatives approved a financial reform bill entitled the “Wall Street Reform and Consumer Protection Act of 2009”. Both bills propose significant changes to the U.S. financial regulatory system, the way financial institutions operate and the way that these institutions are structured. Although it is too early to predict how the proposed financial reform bills when and if they are reconciled and enacted will affect our business and operations, this legislation could adversely affect our business or operations directly (if, for example, the enacted legislation prohibits a practices or transactions in which we now engage) or indirectly (if, for example, our clients’ business and operations are adversely affected).
Changes in the interpretation or enforcement of existing laws and regulations by our regulators may also adversely affect our business. In addition, changes in the regulatory enforcement environment may create uncertainty over certain practices or types of transactions that in the past were considered permissible and appropriate among financial services firms, but that later have been called into question or have had additional regulatory requirements imposed on them. Legal or regulatory uncertainty and additional regulatory requirements could result in a loss of business. As discussed above, new and changing regulatory requirements may make it more difficult or less profitable for us to operate our business.
We are subject to regulatory capital requirements which could constrain our growth and subject us to regulatory sanctions.
The CFTC, SEC, FSA and other U.S. and non-U.S. regulators require us to maintain specific minimum levels of regulatory capital in our operating subsidiaries that conduct our futures and securities business. As of March 31, 2010, we were required to maintain approximately $1.2 billion minimum capital, which includes regulatory early warning requirements, in the aggregate across all jurisdictions (including $45.9 million in respect of goodwill and other intangible assets).
Regulators require a minimum amount of shareholders’ equity to support the regulatory requirements, the percentage of which will vary by regulator and jurisdiction, while the balance of the regulatory requirements may be satisfied by subordinated liabilities. We generally maintain total regulatory capital in excess of the minimum requirements in order to meet our internal risk management guidelines and, as a result, our capital costs could be substantially higher than those attributable solely to applicable regulatory or self-regulatory requirements.
Regulators continue to evaluate and modify regulatory capital requirements from time to time in response to market events and to improve the stability of the international financial system. For example, in the UK, the FSA periodically reviews and assesses our company and the businesses that we operate to determine the minimum capital requirements that our UK regulated entities must maintain.
Even if regulators do not change existing regulations or adopt new ones, our minimum capital requirements could generally increase in proportion to the size of the business conducted by our regulated subsidiaries as noted above. If we are unable to cost-effectively meet higher regulatory capital requirements we may not be able to expand our operations and increase our revenues. In addition, our ability to allocate our capital resources most efficiently throughout our global operations may be constrained to the extent that we are not permitted to withdraw regulatory capital (including excess regulatory capital) maintained by our subsidiaries without prior regulatory approval or notice. In particular, these restrictions could limit our ability to withdraw funds needed to satisfy our ongoing operating expenses, debt service and other cash needs.
Regulators monitor our levels of capital closely. We are required to report periodically the amount of regulatory capital we maintain to our regulators on a regular basis, and we must report any deficiencies or material declines promptly. While we expect that our current amount of regulatory capital will be sufficient to meet anticipated short-term increases in requirements, any failure to maintain the required levels of regulatory capital, or to report any capital deficiencies or material declines in capital could result in severe sanctions, including fines, censure, restrictions on our ability to conduct business
30
Table of Contents
and suspension or revocation of our registrations. The imposition of one or more of these sanctions could ultimately lead to our liquidation, or the liquidation of one or more of our subsidiaries. For more information on the minimum regulatory capital requirements for our subsidiaries, see “Item 1. Business—Our Business—Regulation and Exchange Memberships”.
We could be harmed by misconduct that is difficult to detect and deter.
A number of highly publicized cases involving fraud or other misconduct by employees of financial services firms have come to light in recent years. Like our peers, we are exposed to risks relating to misconduct by our employees, our clients’ employees, introducing brokers or other third parties with whom we have relationships. For example, our employees could execute unauthorized transactions for our clients, for themselves or any of our accounts; use client assets improperly or without authorization; perform improper activities on behalf of clients; use confidential client or company information for improper purposes; or mis-record or otherwise try to hide improper activities from us. Such exposures could be heightened in the case of individual investors’ accounts over which our brokers, in limited circumstances, exercise discretionary authority.
Misconduct by employees of our clients could also expose us to claims for financial losses or regulatory proceedings when it is alleged that we or our employees knew or should have known that an employee of our client was not authorized to undertake certain transactions. Dissatisfied clients could make claims against us, including but not limited to claims for negligence, fraud, unauthorized trading, failure to supervise, inadequate disclosure of risks, breach of fiduciary duty, intentional misconduct or unauthorized transactions.
Although we do not control the activities of our introducing brokers, we could be held responsible for their improper conduct. If an introducing broker executes trades through us that are improper or unauthorized, our regulators could hold us responsible if they were to conclude that we knew or should have known that the trades were unlawful. Moreover, a substantial number of our introducing brokers in the United States are “guaranteed” introducing brokers, meaning that we have agreed to use our capital to effectively guarantee their capital in exchange for their agreement to affect client trades exclusively through us. Under the Commodity Exchange Act, we are financially responsible for the obligations of our guaranteed introducing brokers, and we are also effectively responsible for their obligation to comply with the Commodity Exchange Act and CFTC rules and regulations. Because we cannot exercise the same level of control and oversight over a “guaranteed introducing broker” as compared to our employees, our financial responsibilities for the obligations of our “guaranteed introducing brokers” present additional risk to our company.
Accordingly, employee or introducing broker misconduct could subject us to financial losses or regulatory sanctions and seriously harm our reputation. Our controls may not be effective in detecting this type of activity.
Inadvertent employee error could subject us to financial loss, litigation, or regulatory action.
Our employees or introducing brokers may commit errors that could subject us to financial losses, claims for negligence or regulatory actions. Employee errors, including but not limited to, mistakes in executing, recording or reporting transactions for clients, could cause us to enter transactions that clients disavow and refuse to settle. Employee errors expose us to the risk of material losses until the errors are detected and the transactions are unwound or reversed. The risk of employee error or miscommunication may be greater for products that are new or have non-standardized terms. Further, such errors may be more likely to occur in the aftermath of any acquisitions during the integration of or migration from technological systems.
We are subject to significant litigation risk, which could adversely affect our business.
Many aspects of our business involve risks that expose us to substantial liability under U.S. federal and state and non-U.S. laws and court decisions, as well as the rules and enforcement efforts of our regulators and self-regulatory organizations worldwide. These risks include, among others, disputes with clients and other market participants over terms of a trade, client losses resulting from system delay or failure and client claims that we or our employees executed unauthorized transactions, recommended unsuitable trades, made materially false or misleading statements or lost or diverted client assets in our custody. We may also be subject to regulatory investigation and enforcement actions seeking to impose significant fines or other sanctions, which in turn could trigger civil litigation.
The volume of claims and the amount of damages and fines claimed in litigation and regulatory proceedings against financial intermediaries have continued to increase. The large notional values of the trades we execute, together with rapid price movements in our markets, could result in potentially large damage claims in any litigation resulting from trading activity. Dissatisfied clients, particularly individual investors, frequently make claims against their brokers, including us, regarding the quality of trade execution, improperly settled trades, mismanagement or even fraud, and these claims may increase as our business expands. Litigation may also arise from disputes over the exercise of our rights with respect to client accounts and
31
Table of Contents
collateral and our efforts to recover client debits. We are obligated to defend ourselves in many client disputes by means of arbitration: arbitral decisions resolving these disputes may be based on perceived equities rather than solely upon legal precedent, and accordingly, our losses in connection with arbitration awards are difficult to estimate for purposes of settlement negotiations and for the purposes of creating appropriate loss reserves.
Even if we prevail in any litigation or enforcement proceedings against us, we could incur significant legal expenses defending against the claims, even those without merit. Moreover, because even meritless claims could damage our reputation or raise concerns among our clients, we may feel compelled to settle claims at significant cost. An adverse resolution of any claims or proceedings against us could have a material adverse effect on our reputation, financial condition or operating results. For example, the Commercial Court in London ruled last year that we must pay a former client approximately $30 million in compensation for damages suffered as a result of fraudulent misrepresentations made over seven years ago by a former broker. As a result, in addition to the monetary loss sanctioned by the court, we may also suffer reputational harm even though these losses occurred over seven years ago before we were an independent company. See “Item 3. Legal Proceedings”. In addition, we may be named as one of a number of defendants in a matter that attracts significant public attention and even if we are ultimately found not to be the main liable party and even if we have no legal liability, our reputation could be adversely affected, and as a result, our business could be adversely affected as well.
Our business may be adversely affected if our reputation is harmed.
Our business is subject to significant reputational risks. If we fail, or appear to fail, to address various issues that may affect our reputation, our business, firm and shareholders could be seriously harmed. Issues could include real or perceived legal or regulatory violations or be the result of a failure in governance, risk-management, technology or operations. Similarly, market rumors and actual or perceived association with counterparties whose own reputation is under question could seriously harm our business. Claims of employee misconduct, adverse publicity, conflict of interests, ethical issues, money laundering, privacy concerns and unfair sales and trading practices could also cause significant reputational damages. Such reputational damage could result not only in an immediate financial loss to the business, but also loss of clients, capital, liquidity and shareholder value to the firm. In recent years, a number of financial services firms have suffered significant damage to their reputations from highly publicized incidents or rumors that in turn resulted in sudden and in some cases irreparable harm to their business.
RISKS RELATED TO OUR OPERATIONS AND TECHNOLOGY
A failure in our operational systems or infrastructure, or those of third parties, could impair our liquidity, disrupt our business, result in the disclosure of confidential information, damage our reputation and cause losses.
Rapid, reliable processing of orders and information is critical to our business and our clients, since any delay or disruption could cause significant financial losses. Moreover, if our clients become concerned about the reliability of our systems, they could quickly move their business to our competitors.
Our computer and communications systems could slow down, malfunction or fail for a variety of reasons, including loss of power, vendor or network failure, acts of war or terrorism, human error, natural disasters, fire, sabotage, hardware or software malfunctions or defects, computer viruses or worms, heavy stress placed on our systems during peak trading times, intentional acts of vandalism, client error or misuse, lack of proper maintenance or monitoring and similar events. Our systems could also fail in the event of a sudden, unpredicted surge in trading volume, which could occur in times of severe market stress. Many of these risks are beyond our control.
If events of the kind described above were to occur in the future, they could cause material disruption or failure of our computer and communications systems, with any number of severe consequences, including:
| • | unanticipated disruptions to our business and operations; |
| • | unanticipated disruptions in service to our clients; |
| • | slower response times; |
| • | delays in our or our clients’ trade execution; |
| • | failed settlement of trades; and |
| • | incomplete or inaccurate recording, reporting or processing of trades. |
32
Table of Contents
Any upgrades or expansions to our systems or networks may require significant expenditures of funds and may also increase the probability that we could suffer system degradations and failures. Relocations of our data center or offices, such as our planned London and New York office relocations, are logistically and technically complicated, and may increase the probability that we suffer system degradation or failure. Future system expansions, implementations, back-ups and disaster recovery plans may not be effective and may not address unanticipated or predicted trading volume increases or service disruption scenarios entirely. The same may be true for our third-party service providers. If enhancements or upgrades of third-party software and systems cannot be integrated with our technologies or if the technologies on which we rely fail to respond to industry standards or technological changes, we may be required to design our own proprietary systems. Software products may contain defects or errors, especially when first introduced or when new versions or enhancements are released.
Delay, disruption or failure of our communications and computer systems may lead to financial losses, litigation, arbitration claims by our clients, or investigations and sanctions by our regulators. Our reputation could also be harmed, causing us to lose existing clients and business and making it more difficult for us to attract new clients. Further, any resulting financial losses could be magnified by price movements of contracts involved in trades that are delayed or fail due to these events, and we may be unable to take corrective action to mitigate these losses.
Our systems and those of our third-party service providers may be vulnerable to security risks, which could, among other things, result in wrongful use of our information, or make our electronic platforms unattractive to participants.
The networks we use, including our online trading platforms and those of our third-party service providers, as well as the networks of the exchanges and other market participants with whom we interact, may be vulnerable to unauthorized access, computer viruses and other security problems, including the inadvertent dissemination of non-public information. Any such problems or security breaches could result in our having liability to one or more third parties. Persons who circumvent security measures or gain access to client information could wrongfully use our or our clients’ information, or cause interruptions or malfunctions in our operations, any of which could have a material adverse effect on our business, financial condition and operating results. While we rely in part on security services and software provided by outside vendors to reduce this risk, we may nonetheless be subject to serious security breaches and other disruptions.
If an actual, threatened or perceived breach of our or our service providers’ security measures were to occur, or if we were to release confidential client information inadvertently, our reputation could be impaired and the market perception of the effectiveness of our security measures could be harmed. As a result, clients may reduce or stop their use of our services, including our online trading platforms. We or our service providers may be required to expend significant resources to protect against the threat of security breaches or to alleviate problems caused by any breaches. The security measures we rely on may prove to be inadequate and could cause incidental system failures and delays, and thus could lower trading volumes and adversely affect our reputation, business, financial condition and operating results. Further, breaches in client privacy could result in legal fines or penalties.
We rely on third-party providers and other suppliers for a number of services that are important to our business. An interruption or cessation of an important service or supply by any third party could have a material adverse effect on our business.
We depend on a number of suppliers, such as third-party electronic platforms to process trades, online service providers, hosting service and software providers, data processors, software and hardware vendors, banks, and telephone companies, for elements of our trading, clearing and other systems. The general trend toward industry consolidation may increase the risk that these services may not be available to us in the future. Moreover, we rely on access to certain data used in our business through licenses with third parties. If these companies were to discontinue providing services to us, we would likely experience significant disruption to our business.
We cannot provide assurance that any of these providers will be able to continue to provide these services in an efficient, cost-effective manner or that they will be able to adequately expand their services to meet our needs. We also cannot assure you that any of these providers will not terminate our business relationship with them for competitive reasons or otherwise. An interruption in or the cessation of an important service or supply by any third party and our inability to make alternative arrangements in a timely manner, or at all, would result in lost revenues and higher costs. In addition, even if we made alternative arrangements, these arrangements may prove to be less effective or reliable or more costly. Further, changing systems
33
Table of Contents
could also result in service interruptions or failures during an initial transition period, which could subject us to loss, including loss of client business, and make us less competitive over the longer term.
We must regularly maintain and upgrade our computer and communications systems in response to technological change and client and regulatory demands in order to remain competitive, which is resource intensive.
The markets in which we compete are characterized by rapidly changing technology, evolving client demand and the emergence of new industry standards and practices that could render our existing technology and systems inadequate or obsolete. Our future success depends in part on our ability to respond to demand for new services, products and technologies on a timely and cost-effective basis, and to adapt to technological advancements and changing standards, so as to address the increasingly sophisticated and varied needs of our clients and prospective clients. We may not be successful in developing, introducing or marketing new services, products and technologies. Any new service, product or technology we develop may not be accepted by the market. Any failure on our part to anticipate or respond adequately to technological advancements, client requirements or changing industry standards, could have a material adverse effect on our business, financial condition and operating results. We must also devote resources to the regular maintenance of our systems, which, together with any necessary upgrades or expansions, could require significant expenditures of funds.
We depend on outside vendors to provide some of the principal computerized systems we use to execute and clear client trades. Our ability to modify these outside systems is limited. As a result, as our markets expand and our clients’ trading and investment needs evolve, we may need to develop further our own proprietary systems to supplement or even replace some existing systems. That process would require a very significant capital investment and could involve difficult transition periods when service may be interrupted or may fail.
If and when we decide, or are required, to upgrade or expand our systems (including our own proprietary systems), we may not have the funds necessary and the changes we make or undertake to make may not be successful or accepted by our clients. Our failure to maintain our systems as necessary or to upgrade and expand them in response to evolving client demands or emerging industry standards would have a material adverse effect on our business and results of operations.
RISKS RELATED TO THE CHANGE IN OUR JURISDICTION OF INCORPORATION
Our Corporate Effective Tax Rate may increase as a result of becoming a U.S. domiciled corporation.
We changed the jurisdiction of incorporation of our parent company, MF Global Holdings Ltd. (formerly MF Global Ltd.), from Bermuda to Delaware, which change is referred to as the “Domestication”. As a result of the Domestication, we became subject to U.S. tax on our income and capital gains. As a result, our corporate effective tax rate may increase significantly, which could materially impact our financial results, including our earnings and cash flow, for periods after the Domestication. Our corporate effective tax rate, which fluctuates significantly from period to period, is based upon the application of currently applicable income tax laws, regulations and treaties, as well as current judicial and administrative interpretations of these income tax laws, regulations and treaties, in various jurisdictions, including many other than the jurisdiction where our parent is organized and domiciled.
The highest statutory corporate tax rate for U.S. federal income tax purposes is 35%. Our effective tax rate for purposes of financial reporting may, however, vary significantly from the statutory rates under which we operate (including the U.S. statutory rate that would apply after the Domestication) because of, among other things, timing differences in the recognition of income and expense for U.S. GAAP and tax purposes, and differences in how each jurisdiction in which we operate treats the same item of income or expense. We are unable to predict the impact of the Domestication on our effective tax rate going forward for future years. In addition, the tax laws of the United States and other jurisdictions could change in the future, and those changes could cause a material increase in our effective tax rate at a later date as well.
| ITEM 1B. | UNRESOLVED STAFF COMMENTS |
There are no material unresolved written comments that were received from the SEC staff 180 days or more before the end of our fiscal year relating to our periodic or current reports under the Securities Exchange Act of 1934, as amended.
34
Table of Contents
| ITEM 2. | PROPERTIES |
Our principal executive offices are located at 717 Fifth Avenue, New York, New York. We lease office space in 12 countries throughout North America, Europe and the Asia Pacific region, including offices in New York, Chicago, Kansas City, San Francisco, Toronto, Montreal, London, Paris, Geneva, Zurich, Singapore, Hong Kong, Taipei, Tokyo, Dubai, Mumbai, New Delhi, Bangalore, Sydney and Brisbane. Certain leases are subject to escalation clauses and include leasehold improvements, furniture, fixtures and equipment located in our offices. We believe that our leased facilities are adequate to meet anticipated requirements for our current lines of business for the foreseeable future.
| ITEM 3. | LEGAL PROCEEDINGS |
Set forth below are the potentially material litigations and regulatory proceedings to which we are a party or in which we are involved.
Unauthorized Trading Incident of February 26/27, 2008
One of our brokers, Evan Dooley, trading for his own account out of a Memphis, Tennessee branch office through one of our front end order entry systems, Order Express, put on a significant wheat futures position during the late evening of February 26, 2008 and early morning of February 27, 2008. The positions were liquidated at a loss of $141.0 million on February 27, 2008. The trades were unauthorized and because the broker had no apparent means of paying for the trades, we, as a clearing member of the exchange, were required to pay the $141.0 million shortfall (the “Dooley Trading Incident”). The exchange and regulators were immediately notified, the broker was promptly terminated, and a public announcement of the loss was made by us the next day. As a result of the Dooley Trading Incident:
| • | Class Action Suits. We, Man Group, certain of our current and former officers and directors, and certain underwriters for the IPO have been named as defendants in five actions filed in the United States District Court for the Southern District of New York. These actions, which purport to be brought as class actions on behalf of purchasers of MF Global stock between the date of the IPO and February 28, 2008, seek to hold defendants liable under §§ 11, 12 and 15 of the Securities Act of 1933 for alleged misrepresentations and omissions related to our risk management and monitoring practices and procedures. The five purported shareholder class actions have been consolidated for all purposes into a single action. We made a motion to dismiss which has been granted, with plaintiff having a right to replead and/or appeal the dismissal. Plaintiffs made a motion to replead by filing an amended complaint, which was denied. Plaintiffs have appealed. Because the motion to dismiss was made before discovery, the litigation is in its early stages, and in the event plaintiffs successfully appeal we believe we have meritorious defenses. Therefore, no provision for losses has been recorded in connection with this matter. |
| • | The U.S. Attorney’s Office, Chicago Examination. The U.S. Attorney’s Office in Chicago, Illinois examined Mr. Dooley and the unauthorized trades. We have been cooperating with the U.S. Attorney’s Office, which has informed us that we are not a target of their investigation. In late April 2010, the U.S. Attorney’s Office indicted Mr. Dooley for wire fraud and violating the Commodities Exchange Act’s speculative position limits. |
| • | Commodity Futures Trading Commission Proceeding. Immediately after the Dooley Trading Incident, the CFTC, in coordination with the Chicago Mercantile Exchange (“CME”), began an investigation relating to the circumstances of the Dooley Trading Incident. During the course of that investigation, we established an accrual of $10.0 million to cover possible civil monetary penalties in any potential CFTC action relating to the Dooley Trading Incident and the two other matters referred to below under the captions “CFTC Potential Action” and “CFTC Natural Gas Price Information Investigation” (collectively, the “CFTC Proceedings”). The three separate matters comprising the CFTC Proceedings (together with a fourth non-material matter) were settled in a single comprehensive Order (the “CFTC Settlement”). Under the CFTC Settlement, we, without admitting or denying any of the allegations made by the CFTC against us, accepted charges of lack of supervision in each of the matters, agreed to pay an aggregate civil monetary penalty of $10.0 million and agreed to a cease and desist order. In addition, we agreed to specific undertakings related to our supervisory procedures and practices, as well as to engage an independent outside firm (Promontory Financial Group) to review and assess the implementation of the undertakings and certain recommendations previously made by Promontory Financial Group to, and accepted by, us. |
35
Table of Contents
| • | CME Proceedings. At the same time as the CFTC Settlement, without admitting or denying the allegations made by the CME relating to the Dooley Trading Incident, we settled a CME Administrative Proceeding by paying a fine of $0.5 million and agreeing to certain undertakings essentially coextensive with the CFTC undertakings referred to in the CFTC Settlement. We had previously established an accrual of $0.5 million to cover any potential fines in the CME proceeding. |
| • | Retention of Consultants. Our Nominating and Corporate Governance Committee, composed of certain independent Board members, hired two consultants to help advise them and, through them, us, on matters relating to the Dooley Trading Incident. FTI Consultants advised on technology-related matters and Promontory Financial Group advised on policies and procedures in the risk aspects of our business. |
| • | Insurance Claim. We filed a claim under our Fidelity Bond Insurance (the “Bond”), which provides coverage for wrongful or fraudulent acts of employees, seeking indemnification for this loss. After months of investigation, our Bond insurers have denied payment of this claim based on certain definitions and exclusions to coverage in the Bond. They have also initiated an action against us in the Supreme Court of the State of New York seeking a declaration that there is no coverage for this loss under the Bond. We believe the insurers’ position to be in error and have filed a counterclaim in order to seek to enforce our right to payment in court. |
CFTC Potential Action
In May 2007, our U.S. operating subsidiary, MF Global Inc., formerly known as Man Financial Inc. (“MFGI”), and two of our individual employees received what is commonly referred to as a “Wells notice” from the staff of the Division of Enforcement of the CFTC. The notice relates to two trades that we executed in 2004 for a customer and reported to NYMEX. This matter was settled under the terms of the CFTC Settlement referred to above under “Unauthorized Trading Incident of February 26/27, 2008—Commodity Futures Trading Commission Proceeding”.
CFTC Natural Gas Price Information Investigation
We have been cooperating in an investigation conducted by the U.S. Attorney’s Office in the Southern District of New York, which has brought an indictment in a related matter, and by a New York County Grand Jury. The CFTC and the SEC have also been involved in the investigation and each has brought cases in related matters. The investigation centers around trading by a market making energy trader at Bank of Montreal (“BMO”) who allegedly mismarked his book. One of our brokers did business with the BMO trader and used bid and offer prices for forward OTC trades the BMO trader sent to him as a basis for prices which our broker disseminated to our customers, including BMO, as price indications that reflected a consensus. We have been told that neither we nor our broker are targets of the Grand Jury investigation. This matter was settled under the terms of the CFTC Settlement referred to above under “Unauthorized Trading Incident of February 26/27, 2008—Commodity Futures Trading Commission Proceeding”.
Bank of Montreal (“BMO”)
On August 28, 2009, BMO instituted suit against us and our former broker, Joseph Saab (as well as a firm named Optionable, Inc. and five of its principals or employees), in the United States District Court for the Southern District of New York. In its complaint, BMO asserts various claims against all defendants for their alleged misrepresentation of price quotes to BMO’s Market Risk Department (“MRD”) as independent quotes when defendants knew, or should have known, that David Lee, BMO’s trader, created the quotes which, in circular fashion, were passed on to BMO through our broker, thereby enabling Lee substantially to overvalue his book at BMO. BMO further alleges that we and Saab knew that Lee was fraudulently misrepresenting prices in his options natural gas book and aided and abetted his ability to do so by our actions in sending price indications to the MRD of BMO, and substantially assisted Lee’s breach of his fiduciary duties to BMO as its employee. The facts underlying this action also relate to the investigation described above in “CFTC Natural Gas Price Information Investigation”. The Complaint seeks to hold all defendants jointly and severally liable and, although it does not specify an exact damage claim, it claims CAD 680.0 million (approximately $669.7 million) as a pre-tax loss for BMO in its natural gas trading, and claims that it would not have paid brokerage commissions to us (and Optionable, Inc.), would not have continued Lee and his supervisor as employees at substantial salaries and bonuses, and would not have incurred substantial legal costs and expenses to deal with the Lee mispricing. We made a motion to dismiss the complaint which is pending before the court. This litigation is in its very earliest stages. No provision for losses has been recorded in connection with this matter.
36
Table of Contents
Parabola/Tangent
In December 2006, Parabola/Tangent filed a claim in the Commercial Court in London against us and one of our brokers alleging alternatively fraudulent and negligent misrepresentation and breach of fiduciary duty in connection with execution-only accounts that were active in our London office between July 2001 and February 2002. The claimants sought £3.2 million (approximately $5.3 million) in damages and speculative claims, including claims for lost profits, of up to an additional £28.0 million (approximately $46.1 million). A trial began in March 2009. In May 2009 a judgment was rendered in favor of the plaintiff and against us in the amount of £19.29 million plus interest and costs. We have appealed this judgment. An expense of $8.0 million was recorded in the three months ended March 31, 2009 in connection with this litigation, based on the judgment rendered, after adjusting for insurance proceeds of $23.5 million. In May 2010 the Court of Appeals denied our appeal and affirmed the judgment rendered by the commercial court. We are considering our options for further appeal to the Supreme Court.
Eagletech Communications Inc., et al. v. Citigroup, Inc. et al.
Our U.S. operating subsidiary, MFGI, was named as a co-defendant in an action filed in Florida State Court by Eagletech Communications Inc. (“Eagletech”) and three of its alleged shareholders against 21 defendants, including banks, broker-dealers and clearing brokers, as well as “100 John Doe defendants or their nominee entities”. The complaint alleges that the defendants engaged in a criminal conspiracy designed to manipulate the publicly traded share price of Eagletech stock. Plaintiffs seek unspecified compensatory and special damages, alleging that “Man Group PLC d/b/a Man Financial Inc” participated in the conspiracy by acting as a clearing broker for a broker-dealer that traded in Eagletech stock. The complaint asserts claims under RICO, the Florida Securities and Investor Protection Act, the Florida Civil Remedies for Criminal Practices Act and a related negligence claim. On May 9, 2007, defendants filed a notice removing the State Court action to Federal Court pursuant to 28 U.S.C. § 1441(a). On October 2, 2007, Plaintiffs filed a first amended complaint in the Federal Court action asserting additional claims against Man Financial Inc under Florida common law, including civil conspiracy, conversion and trespass to chattels. On February 26, 2008, the financial institution defendants, including MF Global Inc., filed a motion to dismiss seeking dismissal of all claims asserted in the amended complaint on the ground that the claims are barred by the Private Securities Litigation Reform Act (“PSLRA”) and preempted by the federal securities laws. On June 27, 2008, the Court partially granted the motion, holding that the federal RICO claims are barred by the PSLRA and dismissing the RICO claims with prejudice. The Court declined to exercise supplemental jurisdiction over the state law claims and remanded those claims to the Florida State Court. On July 25, 2008, plaintiffs filed a notice of appeal of the Court’s June 27, 2008 decision to the United States Court of Appeals for the Eleventh Circuit but subsequently withdrew its appeal. We are unsure of whether plaintiffs will pursue the State Court action. Since the case is in its earliest stages, it is difficult to determine exposure, if any. We intend to vigorously defend this matter. No provision for losses has been recorded in connection with this litigation.
Amacker v. Renaissance Asset Management Fund et. al.
In December 2007, we, along with four other futures commission merchants (“FCMs”), were named as defendants in an action filed in the United States District Court in Corpus Christi, Texas by 47 individuals who were investors in a commodity pool (RAM I LLC) operated by Renaissance Asset Management LLC. The complaint alleges that we and the other defendants violated the Commodity Exchange Act and alleges claims of negligence, common law fraud, violation of a Texas statute relating to securities fraud and breach of fiduciary duty for allegedly failing to conduct due diligence on the commodity pool operator and commodity trading advisor, having accepted executed trades directed by the commodity trading advisor, which was engaged in a fraudulent scheme with respect to the commodity pool, and having permitted the improper allocation of trades among accounts. The plaintiffs claim damages of $32.0 million, plus exemplary damages, from all defendants. All of the FCM defendants moved to dismiss the complaint for failure to state a claim upon which relief may be granted. Following an initial pre-trial conference, the court granted plaintiffs leave to file an amended complaint. On May 9, 2008, plaintiffs filed an amended complaint in which plaintiffs abandoned all claims except a claim alleging that the FCM defendants aided and abetted violations of the Commodity Exchange Act. Plaintiffs now seek $17.0 million in claimed damages plus exemplary damages from all defendants. We filed a motion to dismiss the amended complaint which was granted by the court and appealed by the plaintiffs. The case is at its earliest stages so it is not possible to determine our exposure, if any. In any event, we intend to vigorously defend this matter. No provision for losses has been recorded in connection with this litigation.
37
Table of Contents
Leaderguard Matter
Proceedings had been instituted against our U.K. subsidiary by the liquidator of Leaderguard Spot Forex Limited (“LSF”), a Mauritius based investment firm that became insolvent in March 2005. Our U.K. subsidiary (originally through GNI Limited and then Man Financial Limited) provided foreign exchange broking services to two companies in the Leaderguard group between 2001 and 2005. The claim alleged, inter alia, that we were complicit in assisting the directors of various Leaderguard group companies to breach fiduciary duties owed by such directors to their companies and that we knowingly benefited from assets received in breach of such fiduciary duties. The claim further alleged we are liable to account for funds lost through transactions executed by such directors with our U.K. company which are alleged to amount to $18.0 million. The Leaderguard liquidator dismissed the action on July 17, 2009. No provision for losses was recorded in connection with this matter.
Class Action Suit
We and certain of our executive officers and directors had been named as defendants in an action filed in the United States District Court for the Southern District of New York. This action, which purported to be brought as a class action on behalf of purchasers of MF Global stock between March 17, 2008 and June 20, 2008, sought to hold defendants liable under §§ 10 and 20 of the Securities Exchange Act of 1934 for alleged misrepresentations and omissions related to our financial results and projections and capital structure. We filed a motion to dismiss which the court granted, with prejudice.
Voiran Trading Limited
On December 29, 2008, we received a letter before action from solicitors on behalf of Voiran Trading Limited (“Voiran”) which has now brought an LME arbitration proceeding. The letter and arbitration proceeding alleges that our U.K. affiliate was grossly negligent in advice it gave to Voiran between April 2005 and April 2006 in relation to certain copper futures contracts and claims $37.6 million in damages. This litigation is in its very earliest stages. No provision for losses has been recorded in connection with this matter.
Sentinel Bankruptcy
The Liquidation Trustee (“Trustee”) for Sentinel Management Group, Inc. (“Sentinel”) sued MF Global Inc. in June 2009 on the theory that our withdrawal of $50.2 million within 90 days of the filing of Sentinel’s bankruptcy petition on August 17, 2007 is a voidable preference under Section 547 of the Bankruptcy Code and, therefore, recoverable by the Trustee, along with interest and costs. We believe there are substantial defenses available to us and we intend to resist the Trustee’s attempt to recover those funds from us. In addition, to the extent the Trustee recovered any funds from us, we would be able to assert an offsetting claim in that amount against the assets available in Sentinel’s bankruptcy case. The matter is in its early stages and litigation has just commenced. No provision for losses has been recorded in connection with this claim.
Agape World
In May 2009, investors in a venture set up by Nicholas Cosmo sued Bank of America and us, among others, in the United States District Court for the Eastern District of New York, alleging that we, among others, aided and abetted Cosmo and related entities in a Ponzi scheme in which investors lost $400.0 million. We have made a motion to dismiss which has been granted with prejudice. The litigation is in its earliest stages. We believe we have meritorious defenses and intend to vigorously defend this matter. No provision for losses has been recorded in connection with this matter.
Phidippides Capital Management/Mark Trimble
In the late spring of 2009, we were sued in Oklahoma State Court by customers who were substantial investors with Mark Trimble and/or Phidippides Capital Management. Trimble and Phidippides may have been engaged in a Ponzi scheme. Plaintiffs allege that we “materially aided and abetted” Trimble’s and Phidippides’ violations of the anti-fraud provisions of the Oklahoma securities laws and they are seeking damages “in excess of” $0.01 million each. We made a motion to dismiss which was granted by the court. Plaintiffs have appealed. We believe we have meritorious defenses and intend to vigorously defend this matter. No provision for losses has been recorded in connection with this matter.
38
Table of Contents
Man Group Receivable
In late April 2009, we formally requested that Man Group (our largest shareholder at the time and former parent company) make a payment of $29.8 million that Man Group owes to us in connection with the recapitalization of our balance sheet at the time of the IPO in fiscal 2008. Man Group has demanded arbitration and we have agreed to an arbitration by the London Court of International Arbitration. As a result of this unresolved claim, we recorded a receivable of $29.8 million in equity. If we prevail in our claim, we would expect to restore our equity by the amount we receive from Man Group (if any) and, if we are not successful, we would expect to write off the receivable to additional paid in capital and not to increase our equity. The reduction in equity does not affect amounts reported in our earnings, our income statement or our cash position for any prior period and we do not expect the resolution of the claim, whether favorable to us or not, to affect our earnings or our income statement for the current or any future period, although any amounts we recover would increase our cash position. This matter has been set for hearing and we intend to pursue the claim vigorously.
Morgan Fuel/Bottini Brothers
MFGI and MF Global Market Services LLC (“Market Services”) are currently involved in litigation with a former customer of Market Services, Morgan Fuel & Heating Co., Inc. (“Morgan Fuel”) and its principals, Anthony Bottini, Jr., Brian Bottini and Mark Bottini (the “Bottinis”). The litigations arise out of trading losses incurred by Morgan Fuel in over-the-counter derivative swap transactions, which were unconditionally guaranteed by the Bottini principals.
| • | MF Global Market Services LLC v. Anthony Bottini, Jr., Brian Bottini and Mark Bottini, FINRA No. 08-03673. On October 6, 2008, Market Services commenced an arbitration against the Bottinis before the Financial Industry Regulatory Authority (“FINRA”) to recover $8.3 million, which is the amount of the debt owed to Market Services by Morgan Fuel after the liquidation of the swap transactions. Each of the Bottinis executed a guaranty in favor of Market Services personally and unconditionally guaranteeing payment of the obligations of Morgan Fuel upon written demand by Market Services. Market Services asserted a claim of breach of contract based upon the Bottinis’ failure to honor the guarantees. |
| • | Morgan Fuel v. MFGI and Market Services, FINRA No. 08-03879. On October 21, 2008, Morgan Fuel commenced a separate arbitration proceeding before FINRA against MFGI and Market Services. Morgan Fuel claims that MFGI and Market Services caused Morgan Fuel to incur approximately $14.2 million in trading losses. Morgan Fuel seeks recovery of $5.9 million in margin payments that it allegedly made to Market Services and a declaration that it has no responsibility to pay Market Services for the remaining $8.3 million in trading losses. Morgan Fuel contends that MFGI and Market Services should not have allowed Morgan Fuel to enter into, or maintain, the swap transactions. The Supreme Court of New York for the County of New York had temporarily stayed the arbitration commenced by Morgan Fuel on the ground that there was no agreement to arbitrate. The motion for a permanent stay was denied and we appealed that decision. The Appellate Division, First Department reversed the order of the Supreme Court of New York and granted the petition to permanently stay the arbitration of Morgan Fuel’s claims. Morgan Fuel is seeking leave to appeal this decision to the Court of Appeals. |
| • | The Bottinis asserted a third-party claim against Morgan Fuel, which in turn asserted a fourth-party claim against MFGI, Market Services and Steven Bellino (a former MFGI employee) in the arbitration proceeding commenced by Market Services. A motion to stay the fourth-party claim had also been denied by the court and we had appealed that decision as well. The Appellate Division, First Department reversed the order of the Supreme Court of New York and granted the petition to permanently stay this claim. Morgan Fuel is seeking leave to appeal this decision to the Court of Appeals. |
It is difficult at this stage to determine exposure, if any. In any event, we intend to pursue our arbitration vigorously. No provision for losses has been recorded in connection with this matter.
Other
In addition to the matters discussed above, from time to time we are party to litigation and regulatory proceedings that arise in the ordinary course of our business. Aside from those matters discussed above, we do not believe that we are party to any pending or threatened litigation or regulatory proceedings that, individually or in the aggregate, would in the opinion of management have a material adverse effect on our business, results of operations, financial condition or cash flows.
| ITEM 4. | RESERVED |
39
Table of Contents
PART II
| ITEM 5. | MARKET FOR REGISTRANT’S COMMON EQUITY, RELATED STOCKHOLDER MATTERS AND ISSUER PURCHASES OF EQUITY SECURITIES |
The principal market on which shares of our common stock are traded is the NYSE. As of May 14, 2010, there were approximately 25 holders of record, which does not reflect those shares of common stock held beneficially or those shares held in a “street” name. Accordingly, the number of beneficial owners of our common stock exceeds this number. On May 26, 2010, the last reported sales price for our common stock on the NYSE was $7.57 per share.
Common Stock Price Range
The following table sets forth, for the fiscal quarters indicated, the high and low sales prices per common share of our common stock as reported by the Consolidated Tape Association.
| 2010 | 2009 | |||||||||||
| High | Low | High | Low | |||||||||
| First quarter |
$ | 6.68 | $ | 4.13 | $ | 15.19 | $ | 5.86 | ||||
| Second quarter |
7.84 | 4.88 | 8.75 | 3.38 | ||||||||
| Third quarter |
8.22 | 5.88 | 4.99 | 1.72 | ||||||||
| Fourth quarter |
8.93 | 6.10 | 4.89 | 2.02 | ||||||||
See table in Item 12, “Equity Compensation Plan Information,” for information relating to compensation plans under which our equity securities are authorized for issuance.
Dividends
We currently do not intend to pay any cash dividends on our common stock in the foreseeable future. We intend to retain all our future earnings, if any, to fund the development and growth of our business. Any future determination whether or not to pay dividends on our common stock will be made, subject to applicable law, by our board of directors and will depend upon our results of operations, financial condition, capital requirements, regulatory and contractual restrictions, our business and investment strategy and other factors that our board of directors deem relevant.
40
Table of Contents
Cumulative Total Return
The following chart shows a comparison of cumulative total return for our shares of common stock, the Hemscott National Investment Brokerage Index and the NYSE Market Index. The total stockholder return assumes $100 invested on July 20, 2007 and assumes all dividends are reinvested.
COMPARISON OF 32 MONTH CUMULATIVE TOTAL RETURN*
Among MF Global Holdings Limited, The NYSE Composite Index
And The Hemscott National Investment Brokerage Index
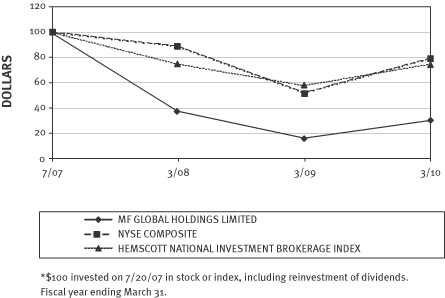
41
Table of Contents
| ITEM 6. | SELECTED FINANCIAL DATA |
The following tables present certain selected financial data for our business. These tables should be read in conjunction with our financial statements and related notes and “Management’s Discussion and Analysis of Financial Condition and Results of Operations” included elsewhere in this Annual Report on Form 10-K.
| YEAR ENDED MARCH 31, | ||||||||||||||||||
| 2010 | 2009 | 2008 | 2007 | 2006 | ||||||||||||||
| (in millions, except per share data) | ||||||||||||||||||
| Statement of Operations |
||||||||||||||||||
| Revenues |
||||||||||||||||||
| Commissions |
$ | 1,386.0 | $ | 1,642.4 | $ | 2,014.8 | $ | 1,666.5 | $ | 1,127.4 | ||||||||
| Principal transactions |
225.4 | 287.7 | 281.9 | 299.6 | 158.6 | |||||||||||||
| Interest income |
491.6 | 872.3 | 3,669.0 | 4,090.4 | 1,388.1 | |||||||||||||
| Other |
42.4 | 112.4 | 54.1 | 37.8 | 29.2 | |||||||||||||
| Total revenues |
2,145.4 | 2,914.8 | 6,019.8 | 6,094.4 | 2,703.2 | |||||||||||||
| Interest and transaction-based expenses: |
||||||||||||||||||
| Interest expense |
288.0 | 495.1 | 3,165.2 | 3,739.3 | 1,173.5 | |||||||||||||
| Execution and clearing fees |
601.8 | 741.0 | 927.4 | 700.4 | 463.4 | |||||||||||||
| Sales commissions |
240.6 | 252.0 | 291.0 | 275.9 | 119.8 | |||||||||||||
| Total interest and transaction-based expenses |
1,130.4 | 1,488.1 | 4,383.6 | 4,715.6 | 1,756.7 | |||||||||||||
| Revenues, net of interest and transaction-based expenses |
1,015.0 | 1,426.7 | 1,636.3 | 1,378.7 | 946.5 | |||||||||||||
| Expenses |
||||||||||||||||||
| Employee compensation and benefits (excluding non-recurring IPO awards) |
673.0 | 796.2 | 896.7 | 834.7 | 595.7 | |||||||||||||
| Employee compensation related to non-recurring IPO awards |
31.8 | 44.8 | 59.1 | — | — | |||||||||||||
| Communications and technology |
118.6 | 122.6 | 118.7 | 102.2 | 72.2 | |||||||||||||
| Occupancy and equipment costs |
39.4 | 44.8 | 35.6 | 29.8 | 24.5 | |||||||||||||
| Depreciation and amortization |
55.1 | 57.8 | 54.8 | 46.8 | 28.2 | |||||||||||||
| Professional fees |
82.1 | 90.4 | 74.6 | 50.1 | 26.7 | |||||||||||||
| General and other |
114.6 | 100.6 | 108.3 | 77.3 | 46.4 | |||||||||||||
| PAAF legal settlement |
— | — | 76.8 | — | — | |||||||||||||
| Broker related loss |
— | — | 141.0 | — | — | |||||||||||||
| IPO-related costs |
0.9 | 23.1 | 56.1 | 33.5 | — | |||||||||||||
| Impairment of intangible assets and goodwill |
54.0 | 82.0 | — | — | — | |||||||||||||
| Refco integration costs |
— | 0.7 | 2.7 | 19.4 | 66.8 | |||||||||||||
| Total other expenses |
1,169.5 | 1,363.1 | 1,624.6 | 1,193.9 | 860.5 | |||||||||||||
| Gains on exchange seats and shares |
8.5 | 15.1 | 79.5 | 126.7 | 33.5 | |||||||||||||
| Net gain on settlement of legal proceeding |
— | — | — | 21.9 | — | |||||||||||||
| Loss on extinguishment of debt |
9.7 | — | 18.3 | — | — | |||||||||||||
| Interest on borrowings |
39.7 | 68.6 | 69.3 | 43.8 | 31.5 | |||||||||||||
| (Loss)/income before provision for income taxes |
(195.4 | ) | 9.9 | 3.6 | 289.7 | 88.0 | ||||||||||||
| (Benefit)/provision for income taxes |
(56.3 | ) | 41.9 | 66.6 | 100.0 | 28.2 | ||||||||||||
| Equity in income/(loss) of unconsolidated companies (net of tax) |
3.8 | (16.2 | ) | (1.7 | ) | 0.1 | 0.3 | |||||||||||
| Net (loss)/income |
(135.3 | ) | (48.1 | ) | (64.7 | ) | 189.7 | 60.1 | ||||||||||
| Net income attributable to noncontrolling interest |
1.7 | 1.0 | 4.9 | 1.7 | 0.3 | |||||||||||||
| Net (loss)/income attributable to MF Global Holdings Ltd. |
$ | (137.0 | ) | $ | (49.1 | ) | $ | (69.5 | ) | $ | 188.0 | $ | 59.8 | |||||
42
Table of Contents
| YEAR ENDED MARCH 31, | ||||||||||||||||||
| 2010 | 2009 | 2008 | 2007 | 2006 | ||||||||||||||
| (in millions, except per share data) | ||||||||||||||||||
| Weighted average number of basic shares outstanding (1) |
123,222,780 | 121,183,447 | 115,027,797 | 103,726,453 | ||||||||||||||
| Weighted average number of diluted shares outstanding (1) |
123,222,780 | 121,183,447 | 115,027,797 | 103,726,453 | ||||||||||||||
| Basic (loss)/earnings per share (2) |
$ | (1.36 | ) | $ | (0.58 | ) | $ | (0.60 | ) | $ | 1.81 | |||||||
| Diluted (loss)/earnings per share (2) |
$ | (1.36 | ) | $ | (0.58 | ) | $ | (0.60 | ) | $ | 1.81 | |||||||
| Dividends declared per share (3) |
$ | — | $ | — | $ | 0.01 | $ | 0.03 | ||||||||||
| Balance Sheet Data |
||||||||||||||||||
| Total assets |
$ | 50,966.1 | $ | 38,835.6 | $ | 49,254.9 | $ | 51,670.3 | $ | 34,314.6 | ||||||||
| Long-term borrowings |
499.4 | 938.0 | — | 594.6 | 617.9 | |||||||||||||
| (1) | The weighted average number of shares of common stock outstanding for periods prior to the reorganization and separation is calculated using the number of shares of common stock outstanding immediately following the reorganization and separation. |
| (2) | Net earnings per share for fiscal 2007 is calculated by dividing historical net income by the weighted average number of shares of common stock outstanding (basic and diluted) during fiscal 2007. |
| (3) | These dividends were paid to Man Group when we were wholly owned by Man Group and are not indicative of future dividends. We currently do not expect to pay any cash dividends on our common shares in the foreseeable future. Dividends declared per share is calculated by dividing dividends paid to Man Group by the number of shares of common stock outstanding (basic) during fiscal 2008 and fiscal 2007. |
43
Table of Contents
| ITEM 7. | MANAGEMENT’S DISCUSSION AND ANALYSIS OF FINANCIAL CONDITION AND RESULTS OF OPERATIONS |
The following Management’s Discussion and Analysis of Financial Condition and Results of Operations (“MD&A”) is intended to help you understand MF Global Holdings Ltd. and its consolidated subsidiaries (the “Company”, “we”, “us” or “our”). Our MD&A should be read in conjunction with our consolidated and combined financial statements and the accompanying notes, included elsewhere in this Annual Report on Form 10-K. On January 4, 2010, we changed our jurisdiction of incorporation from Bermuda to the state of Delaware, a change which we refer to as the “Domestication”. As a result of the Domestication, we have continued our existence as a corporation organized under the laws of the state of Delaware. Accordingly, any references to the “Company”, “MF Global Holdings Ltd.”, “we”, “our”, “us”, and similar terms mean, as of any time prior to the Domestication, MF Global Ltd. and, as of any time after the Domestication, MF Global Holdings Ltd.
Business Overview
We are a leading brokerage firm offering customized solutions in the global cash and derivatives markets. We provide execution and clearing services for products in the exchange-traded and over-the-counter, or OTC, derivative markets, as well as for certain products in the cash market. We provide our clients with global market access to more than 70 securities and futures exchanges and also facilitate trades in the over-the-counter markets. Our clients include corporations, hedge funds and other asset managers, and sovereign institutions, as well as professional traders and individual investors. We principally offer execution and clearing services for five general types of products: fixed income, commodities, foreign exchange, equities and interest rates. We have a broad retail product offering as well. We have offices in Chicago, Dubai, Geneva, Hong Kong, London, Mumbai, New York, Paris, Singapore, Sydney, Taipei, Tokyo, and Toronto among others, considering the applicable legal and regulatory requirements. Our business model is global and client-driven, and we have organized our business to centrally manage our resources to offer clients an expansive array of products across a broad range of markets and geographies. We operate and manage our business as a single operating segment. We do not manage our business by services or product lines, market types, geographic regions, client segments or any other exclusive category.
Consistent with trading activity on major exchanges, the total volume of exchange-traded futures and options we executed and/or cleared decreased 8.5% from 1,832.6 million contracts in fiscal 2009 to 1,676.5 million contracts in fiscal 2010. This is as a result of global market conditions and in contrast to overall growth in our transactions volumes that we have experienced in prior years related to increased volatility in many of the markets in which we operate. For a discussion of the manner in which we calculate our volumes, see “—Factors Affecting our Results—Trading Volumes and Volatility”.
We derive revenues from three main sources: commission fees generated from execution and clearing services; principal transactions, which include matched-principal and other principal transactions, primarily executed to facilitate client trades; and net interest income on (i) cash balances in our clients’ accounts, most of which are maintained by our clearing clients to meet margin requirements as well as (ii) interest related to our collateralized financing arrangements and principal transactions activities.
Significant Business Developments
Reorganization and Separation
In July 2007, Man Group plc (“Man Group”) separated its brokerage business from its asset management business by transferring to us all of the entities and net assets of Man Group and its subsidiaries that comprised its brokerage business, formerly known as Man Financial. In the separation, Man Group retained its asset management business. Man Group transferred the brokerage unit to MF Global Holdings Overseas Limited (formerly known as Man Financial Overseas Ltd.) and MF Global Holdings Europe Limited (formerly known as ED&F Man Group Ltd.), two holding companies incorporated in the United Kingdom (the “Reorganization”). Man Group completed the separation of the brokerage business by transferring all of the outstanding capital stock of MF Global Holdings Overseas Limited, MF Global Holdings Europe Limited, MF Global Singapore Pte Limited (formerly known as Man Financial (S) Pte Limited), and MF Global Holdings HK Limited (formerly known as Man Financial Holdings (HK) Ltd.) to us in exchange for 103,726,353 shares of our common stock (the “Separation”). Following the Reorganization and Separation, Man Group also made a net capital contribution of $516.2 million in cash to us in return for 17,379,493 shares of common stock (the “Recapitalization”).
We have noted on our consolidated balance sheet that an additional payment of $29.8 million is due to us from Man Group in connection with the Recapitalization at the time of the IPO in fiscal 2008. We have made a request for payment, Man
44
Table of Contents
Group has demanded arbitration, and we have agreed to an arbitration by the London Court of International Trade. See “Item 3. Legal Proceedings” for further information.
Initial Public Offering
In July 2007, we completed our IPO of 97,379,765 shares of our common stock, all of which were sold by a subsidiary of Man Group at a price of $30 per share. Following the IPO, Man Group retained approximately 18.6% of our common shares, which it held through one of its subsidiaries. We did not receive any proceeds from the sale of these common shares. Man Group also transferred 1,473,514 common shares previously issued to and held by it to us for $1 in the aggregate by way of a share adjustment based on the difference between the estimated and aggregate offering price of our shares in the IPO. During the three months ended September 30, 2009, Man Group sold, pursuant to a variable forward sale agreement, its remaining investment of approximately 18.4% of our outstanding common stock as of that date. As a result, transactions between us and Man Group are no longer separately disclosed as related party transactions as of September 30, 2009 and for periods thereafter.
In connection with the IPO, we established the 2007 Long-term Incentive Plan (“LTIP”) which provides for the grant of equity compensation awards to eligible employees, consultants, directors and other individuals who provide services to us. On the date of the IPO, we issued restricted stock units, stock options, and restricted stock under the LTIP. Restricted stock units and restricted stock issued at the IPO are defined as non-recurring IPO awards and accounted for as employee compensation related to non-recurring IPO awards on our consolidated and combined statements of operations. The stock compensation charge related to these non-recurring IPO awards is considered a non-cash charge as the cost was incurred by Man Group as part of the IPO. See “—Results of Operations” and Note 10 to our consolidated and combined financial statements for further details.
In October 2009, we initiated a tender offer that enabled eligible employees to exchange options that were granted to them at the time of our IPO for a lower number of restricted stock units. The exchange program was designed so that the fair market value of the new restricted stock units would equal the approximate fair market value of the options exchanged, and as such there was no incremental compensation expense incurred in connection with the exchange. In connection with this tender offer, 3,301,162 options were tendered and exchanged for 284,455 restricted stock units. For additional information on this tender offer, see Note 10 of our consolidated and combined financial statements.
Broker-related Loss
In February 2008, a former broker in one of our U.S. branch offices, trading in the wheat futures market in his personal account, substantially exceeded his authorized trading limit. The broker concerned was promptly terminated. The unauthorized activity resulted in him incurring a loss of $141.0 million which we, as a clearing member, were responsible for settling at the clearinghouse. As a result, the full amount was written off as a bad debt expense in fiscal 2008. See “Item 3. Legal Proceedings” for further information.
Issuance of Non-Cumulative Convertible Preferred Stock and Convertible Notes
On June 25, 2008, we completed the issuance and sale of (i) $150.0 million aggregate principal amount of our 9.00% Convertible Senior Notes due 2038 (the “Convertible Notes”) and (ii) $150.0 million in aggregate liquidation preference of our 9.75% Non-Cumulative Convertible Preferred Stock, Series B (the “Series B Preferred Stock”). See Notes 9 and 18 to our consolidated and combined financial statements for further details. In August 2008, the initial purchasers of the Convertible Notes exercised their option to purchase an additional $60.0 million aggregate principal amount of such notes.
On March 26, 2009, we completed our cash tender offer to purchase all of our $210.0 million Convertible Notes at a purchase price equal to $0.64 per $1.00 of the principal amount, plus accrued interest up to March 25, 2009. We validly repurchased $5.0 million aggregate principal amount of the Convertible Notes. We paid $3.3 million in cash including accrued interest and related bank fees.
Issuance of Cumulative Convertible Preferred Stock and Backstop Commitment
We signed a definitive agreement, dated as of May 20, 2008 and as amended on June 10, 2008, which we refer to as the “backstop commitment”, with an affiliate of J.C. Flowers & Co. LLC in which J.C. Flowers agreed to provide a commitment of up to $300.0 million toward the sale of equity or equity-linked securities. Under the terms of the backstop commitment, on
45
Table of Contents
July 18, 2008, J.C. Flowers purchased $150.0 million in aggregate liquidation preference of a new series of equity securities in the form of cumulative convertible preferred stock, Series A, or the Series A Preferred Stock. See Note 18 to our consolidated and combined financial statements for further details.
On February 3, 2010, we entered into a Transfer Agreement with JCF Fund II, whereby JCF Fund II and certain controlled affiliates transferred their ownership interest in the Series A Shares to JCF MFG Holdco LLC (“JCF LLC”), another controlled affiliate, and JCF LLC agreed to be bound by certain terms and conditions of the investment agreement. For this purpose, the term “controlled affiliate” means a controlled affiliate of J.C. Flowers, of which JCF Fund II is a controlled affiliate.
Two-Year Term Facility
On July 18, 2008, we entered into a credit agreement with several banks that provided for a two-year, $300.0 million unsecured term loan facility (the “Two-Year Term Facility”), which enabled us to prepay loans under our previously outstanding bridge facility that were otherwise due and payable on December 12, 2008. On April 16, 2009, we paid the outstanding balance of $240.0 million on the Two-Year Term Facility ahead of its maturity date of July 16, 2010 thus terminating all remaining obligations under the Two-Year Term Facility. In connection with the early repayment of the Two-Year Term Facility, we recorded a loss on extinguishment of debt of $9.7 million related to the accelerated amortization of debt issuance costs. See Note 9 to our consolidated and combined financial statements for further details.
Parabola/Tangent
On May 6, 2009 a High Court Judge in the U.K. ruled that MF Global UK Ltd. was vicariously liable to pay damages and claimants’ costs to Parabola Investments Limited and Aria Investments Limited. We appealed the decision. An expense of $8.0 million was recorded in fiscal 2009 in connection with this litigation, based on the judgment rendered, after adjusting for insurance proceeds of $23.5 million. In May 2010, the Court of Appeals denied our appeal and affirmed the judgment below. We are considering our options for further appeal to the Supreme Court. See “Item 3. Legal Proceedings” for further information.
Liquidity Facility
In fiscal 2008, we entered into a $1,500.0 million five-year unsecured committed revolving credit facility (the “liquidity facility”) with a syndicate of banks. On December 16, 2009, we repaid $200.0 million of the outstanding balance on our liquidity facility with excess and available cash. As of March 31, 2010, $442.5 million was outstanding under the liquidity facility with the remainder available to us as a committed facility. We intend to keep $300.0 million of the amount outstanding at March 31, 2010 under the liquidity facility as long term debt and as part of our capital structure, unless we replace some or all of these borrowings with other long-term debt. See Note 9 to our consolidated and combined financial statements for further details.
Factors Affecting Our Results
Our business environment directly affects our results of operations. Our results of operations have been and will continue to be affected by many factors, including economic, political and market conditions, broad trends in the brokerage and finance industry, changes in the level of trading activity in the broader marketplace, price levels and price volatility in the derivatives, interest rate, equity, foreign exchange and commodity markets, legislative and regulatory changes and competition, among other factors. Specifically, our business has been impacted by turmoil in global markets during fiscal 2010 and 2009. Financial markets have experienced elevated levels of volatility due to concerns about the outlook for global growth and inflation. In addition, the global equity markets experienced significant declines in the first quarter of fiscal 2010 compared to appreciation in subsequent quarters, mortgage and corporate credit spreads widened in the first half of fiscal 2010 and narrowed subsequently, and the U.S. dollar appreciated against the Euro and British pound in the first half of fiscal 2010 offset by depreciation during subsequent quarters. Furthermore, short-term interest rates have declined over the past fiscal year, and as a result of this decline, our net interest income has been negatively affected over the same period. All of these factors have contributed to our results for the periods presented. Our revenues are substantially dependent on the volume of client transactions we execute and clear and the volatility in the principal markets in which we operate, as well as prevailing interest rates, each of which are described below.
46
Table of Contents
Trading Volumes and Volatility
Our trading volumes are particularly dependent on our clients’ demand for exchange-traded and OTC derivative products, which relate to interest rates, equities, foreign exchange and commodities. Demand for these products is driven by a number of factors, including the degree of volatility of the market prices of the underlying assets—that is, the extent to which and how rapidly those prices change during a given period. Historically, higher price volatility increases the need for some clients to manage price risk and creates opportunities for speculative trading for others. While higher price volatility does not necessarily lead to increases in trading volumes, changes in the absolute price levels of financial assets or commodities can have a significant impact on trading volumes. The total volume of exchange-traded futures and options transactions we executed and/or cleared decreased 8.5% from 1,832.6 million contracts in fiscal 2009 to 1,676.5 million contracts in fiscal 2010. During times of significant economic and political disruptions, clients may seek to manage their exposure to, or speculate on, market volatility. However, as was seen during fiscal 2010 and 2009, extreme volatility and widespread uncertainly can impact the client’s ability to take on or maintain positions, which has the effect of decreasing volumes.
All volume statistics presented herein for fiscal 2010 and 2009 include exchange-traded futures and options contract volumes as derived from our reporting systems, excluding intercompany volumes. We are continuing to enhance our reporting systems in order to improve the analysis of operating data generated by our business.
Interest
Our net interest income, calculated as interest income less interest expense, is directly affected by the spread between short-term interest rates we pay our clients on their account balances and the short-term interest rates we earn from cash balances we hold as well as the duration of the portfolio of client balances invested. Client balances can be impacted by a variety of exogenous factors, including changes in margin requirements at exchanges, market volatility, declining asset values, as well as changes in the composition of margin. Clients, for example, may elect to deposit securities, rather than cash, as margin, which will result in a reduction in our client balances because the securities deposited as margin are not carried on our balance sheet. As a result of these exogenous factors, client balances fluctuate, often significantly, from day to day and may not be indicative of future business.
Our net interest income is also directly affected by interest earned in connection with principal transactions, such as fixed income, securities lending and collateralized financing transactions. While spreads on these transactions remained within a relatively constant range over time, they can widen or narrow when interest rate trends change, as was seen in the narrowing of spreads experienced during fiscal 2010. Accordingly, we carefully monitor and seek to economically hedge our risk exposure as appropriate. In addition, a smaller portion of our interest income relates to client balances on which we do not pay interest and thus is directly affected by the absolute level of short-term interest rates. As a result, our net interest income is impacted by the level and volatility of interest rates, as well as the duration of our portfolio investments made with client balances. Any fair value adjustments to the investments in which client balances are invested are not included in interest but presented in Principal transactions, although they form part of the return on client balances. Included within interest income is the interest we earn on our excess cash. Our interest on borrowings is also affected by changes in interest rates, which could increase or decrease our interest expense on our variable rate debt. Accordingly, the historically low short-term interest rates have negatively affected our net interest income and we cannot offer any assurance that interest rates will increase in the future.
Interest income and expense also includes dividends received and paid on long and short equity instruments, and on stock borrowing or lending positions we use to finance stock positions held to economically hedge issued total return equity swaps or equity futures contracts.
Sources of Revenues
We derive our revenues from commissions, principal transactions, net interest income and other revenues.
Commissions
Commissions are recorded on a trade-date basis as customer transactions occur and include transaction fees we earn for executing trades on an agency basis for clients that do not have clearing accounts with us and clear through another brokerage firm. We provide these services primarily to corporate and broker-dealer clients and asset managers. We charge a per-contract fee that is generally established at market rates and varies based on the product traded. We negotiate these fees
47
Table of Contents
individually with clients and as a result, our transaction rates generally vary among our clients. When we execute client trades on a principal basis, our commissions are included within the mark-up that we earn, and accordingly we record the mark-up from principal transactions under Principal transactions. The amount of fees we earn in any period fluctuates primarily based on the volume of client transactions and the types of products traded, and to a lesser extent on the rates we charge. These fees are also impacted by volume mix in different markets where rates differ.
Commissions also consist of transaction fees we earn for executing and clearing trades for clients that have clearing accounts with us. There are two ways of providing these services to our clients: (1) by both executing and clearing the transaction for the client, or (2) by providing clearing services where the trade is executed by another brokerage firm and then routed to our system for clearing, or “given up” to us because the client has a clearing account with us. We provide these services for a broad range of clients trading in multiple markets. Types of commission activity include equity broking, energy OTC brokerage, futures, contracts for differences (“CFDs”) and financial spread commissions.
Principal Transactions
We execute orders for our clients either on an agency or principal basis. When we execute for a client on an agency basis, we typically direct the order to an exchange or OTC market where it is matched with a corresponding order for execution. When we execute a client order on a principal basis, we take the other side of the trade for our own account to facilitate client orders. In some cases, we will simultaneously enter into an offsetting “back to back” trade with another party (which we refer to as “matched principal transactions”). In certain other cases, we will look to enter into offsetting trades or hedging positions with another party relatively quickly or we may retain the exposure for a longer period of time. In order to gain ongoing insight into market depth and liquidity, or to facilitate client transactions, we may also take positions in the market for our own account, and we may not always hedge such transactions. On a limited basis, we may also enter into unhedged principal transactions in order to monetize our market views. We expect to increasingly recognize trading income as part of our ongoing activity for our clients in various markets, and to selectively increase our risk taking, generally making fuller use of our current risk appetite and operating within the authority delegated by our board. Principal transactions generally yield higher profit margins than commissions that we earn by executing client trades. To a lesser extent, principal transactions also reflect revenues we earn from derivatives transactions we execute for our own account to hedge our corporate exposure to foreign currency and interest rate risk. Principal transactions do not include the net interest earned on related financing arrangements entered into as part of transactions that generate principal transaction revenues, although the net interest is an integral part of the profitability of the trade.
Revenues earned in matched-principal transactions consist of the mark-ups, or profits, we earn on these trades and are net of the value of the trades. Because of our significant order flow and the liquidity in our trading markets generally, in the case of matched-principal transactions, we are usually able to find an appropriate offsetting transaction with another party relatively quickly. By entering into offsetting trades, we reduce or eliminate our exposure to market risk. The offsetting trades we execute may differ from the client trades in some respects, such as duration or other terms. Therefore, we do not completely eliminate our exposure to market risk. In some circumstances, we may not enter into offsetting transactions, thereby exposing us fully to market risk. In conjunction with ongoing or anticipated client activity, or because we have a market view, we may enter into principal transactions to take advantage of temporary price differentials or price movements.
When we engage in principal transactions, including to facilitate customer transactions in OTC commodities and other products in the foreign exchange and fixed income markets and in the listed metals markets in London, what we would otherwise charge as a commission is built into our markup. We seek to price these transactions so that we earn a positive spread, or markup, on the offsetting transaction. The mark-ups represent our compensation for executing these clients’ orders. These revenues are a function of both the price of the underlying asset as well as the spread between the buy and sell prices for the underlying asset. This spread is affected by market conditions, including volatility and volume. Mark-ups are recorded on trade date.
Because we act as principal, rather than as agent, in these transactions, we are required to record realized and unrealized gains and losses relating to these transactions. We also recognize in principal transactions any unrealized gains or losses on our hedged equity swaps and CFDs, together with the unrealized gains and losses on the offsetting equity hedges. Types of principal transaction activity include foreign exchange, metals, equities and equity swaps.
48
Table of Contents
In addition to the above trades, we enter into principal transactions in order to hedge our corporate exposure to foreign currency and interest rate risk. Our economic hedging transactions typically involve cash and derivative products in the foreign exchange market and fixed income derivatives. We enter into derivative transactions to economically hedge our exposure to British pounds and other currencies in which we pay our expense, including our employee compensation and related expenses. We may economically hedge forecasted expenditures in advance of payment. We also enter into derivatives transactions to economically hedge our exposure to changes in interest rates, which could affect the revenues we earn on cash balances and collateralized refinancing transactions as well as our cost of borrowing. We may engage in more interest rate hedging transactions in the future. In accordance with our risk management policies, our hedging transactions do not fully offset our associated risk exposure.
We also enter into principal transactions to invest and manage our liquid corporate assets for asset-liability management purposes. Our investment transactions typically involve government and investment-grade corporate debt securities, agency securities as well as money-market funds. Profits and losses arising from all securities transactions entered into for our own account are recorded on a trade date basis. The net interest earned on the financing related to these investment transactions is recorded within net interest income. We do not separately amortize purchase premiums and discounts associated with proprietary securities transactions, as these are a component of the recorded fair value. Changes in the fair value of such securities are recorded as unrealized gains and losses within principal transactions.
Net interest income
Net interest income represents interest income less interest expense.
We earn interest income from investment of balances in our clients’ accounts, balances in our accounts, collateralized financing arrangements, such as securities lending and purchases of securities under agreements to resell (“resale agreements”) and sales of securities under agreements to repurchase (“repurchase agreements”) we enter into in conjunction with our principal transactions, and on the notional amounts of clients’ positions in CFDs. We also earn interest from investing our capital. We incur related interest expense in connection with many of the transactions from which we derive interest income including payments to customers.
Our net interest income is driven by the amount of client deposits placed with our brokerage operations, the level of prevailing interest rates, the portion of client balances on which we do not pay interest, the level of secured financing transactions provided to our clients and the degree to which we are able to optimize our capital structure. Typically, the net interest that we earn is lower in a lower interest rate environment and higher in a higher interest rate environment.
Revenues from interest income principally represent interest we earn from the investment of client funds deposited with us as margin for trading activities, interest we earn on excess cash balances in our accounts and interest we earn from investing our capital. The majority of the interest income we earn relates to client balances on which we also pay interest to our clients, and therefore the net interest income we earn will depend on the spread between the short-term rates we pay and the short-term rates we earn. A portion of the interest income we earn relates to the client balances of some clients on which we do not pay interest. As a result, the interest income we earn on those client balances will depend on the absolute level of short-term interest rates.
We also earn interest from collateralized financing arrangements, which include resale and repurchase agreements and securities borrowing or lending transactions we enter into in conjunction with our principal transactions. When we enter into resale transactions, we earn interest on the cash payment we make to clients in exchange for securities deposited with us as collateral under agreements to resell at future dates. Conversely, when we enter into repurchase transactions, we pay interest on the cash we receive in exchange for pledging securities we own or have received from clients and are permitted to repledge. The amount of interest we earn depends on client activity and the difference between the interest rate we pay to our clients on their cash collateral and the interest rate we receive from investing the cash received by, or the collateral deposited with, us. These transactions result in a gross-up of Interest income and Interest expense in our consolidated and combined statements of operations, which are effectively netted as part of our revenues, net of interest and transaction-based expenses. Similarly, we enter into transactions where we borrow securities and pay related interest expense on the securities borrowed. Interest income and expense also includes dividends received and paid on long and short equity instruments, as well as stock borrowing or lending positions we use as financing transactions, for stock used to economically hedge issued total return equity swaps or equity futures contracts.
49
Table of Contents
We also earn interest on the notional amount of clients’ positions in CFDs. In these transactions, the parties agree to settle a contract based on the difference between the opening and the closing prices of the contract, and our client posts with us as margin only a small percentage of the initial contract value. We charge these clients interest on the notional amount of the contract for effectively financing the cost of the trade. Included in interest income are the dividends received on the related economic hedges.
The comparison of our period-to-period results described below presents our interest income and interest expense on a net basis. For purposes of presenting revenues, net of interest and transaction-based expenses, interest expense excludes interest paid on short-term and long-term debt, which we disclose separately.
Other Revenues
Other revenues consist of revenues we earn from normal business operations that are not otherwise included above. These types of revenues include:
| • | certain ancillary services provided to clients; |
| • | fees charged to clients for the use of software products; |
| • | insurance proceeds on legal settlements and fees from prior years; and |
| • | profits or losses on the sale or disposal of fixed assets and other long-term investments; |
Components of Expenses
Our expenses consist of three principal components: (1) interest expense, (2) transaction-based expenses and (3) other expenses. A significant portion of our expenses is variable.
Interest Expense
Interest expense includes interest paid to our clients on the funds they maintain with us and interest paid to counterparties in connection with secured financing transactions, such as repurchase agreements and for securities we borrow. As discussed above, a substantial portion of our interest expense pertains to related client transactions from which we derive interest income but with respect to which we also incur interest expense. Our interest income and interest expense are effectively netted in our consolidated and combined statements of operations as part of our revenues, net of interest and transaction-based expenses. The comparison of our period-to-period results described below also presents our interest income and interest expense on a net basis. For purposes of calculating revenues, net of interest and transaction-based expenses, interest expense excludes interest paid on short-term and long-term debt, which are recorded in other expenses.
Transaction-Based Expenses
Transaction-based expenses are variable expenses we incur directly to generate revenues from providing execution and clearing services and consist of (1) execution and clearing fees paid to third parties and (2) sales commissions paid to introducing brokers.
Execution and clearing fees reflect our costs of executing, clearing and settling trades on behalf of our clients. We pay execution- and clearing-related fees primarily to clearing brokers, exchanges, clearinghouses and regulatory and self-regulatory bodies at contractually agreed rates. These expenses are variable and depend on the volume of transactions we execute or clear through these third parties, the types of product traded and the markets in which the products are traded. Execution and clearing fees also include losses due to transactional errors.
Sales commissions consist of fees paid to introducing brokers. We pay introducing brokers a percentage of the commission fees we receive from their clients for providing execution and/or clearing services. We enter into clearing agreements with introducing brokers and customer agreements with their clients, pursuant to which we negotiate our transaction fees and corresponding sales commission for the individual introducing broker. The amount of sales commission we pay is variable and depends on the fee arrangement we have negotiated, which is generally based on the volume of business introduced by the broker or a percentage of the revenues we earn.
50
Table of Contents
Other Expenses
Other expenses consist of expenses relating to (1) employee compensation and benefits (excluding non-recurring IPO awards), (2) employee compensation and benefits related to non-recurring IPO awards, (3) communications and technology, (4) occupancy and equipment costs, (5) depreciation and amortization, (6) professional fees, (7) general and other, (8) PAAF legal settlement costs, (9) broker-related loss, (10) IPO-related costs, (11) impairment of intangible assets and goodwill and (12) Refco integration costs.
Employee Compensation and Benefits
Employee compensation and benefits expense is the principal component of our expenses. These expenses include all compensation paid to employees and any related expenses, such as salaries, sign-on bonuses, incentive compensation and related employee benefits and taxes. The most significant component of our overall employee compensation and benefits expense is the employment costs of our producer staff, which includes our brokers, traders and other personnel interacting with our clients.
Our employee compensation and benefits expense for all employees has both a fixed and variable component. The fixed component consists of base salaries and benefit costs. The variable component depends on whether the employee is classified as producer or professional staff. Producer staff receives production-based compensation, or earnouts, under negotiated arrangements based on the profitability of their team. Professional staff, which generally includes our executive officers and corporate, administrative, accounting, information technology and related support personnel, receive discretionary bonuses on an annual basis that are based broadly on corporate and personal performance and are paid in the first quarter of our fiscal year. Production-based compensation payments are paid periodically during the year, in accordance with the negotiated arrangement. For many of our producer staff, their production-based compensation constitutes a significant component of their overall compensation. Discretionary bonuses for professional staff, excluding members of our executive management team, are generally a smaller component of overall compensation. Production-based compensation and discretionary bonus costs, and therefore employee compensation and benefits expense, vary based on our operating results. We accrue our discretionary bonus costs monthly.
Employee compensation and benefits expenses also include expenses related to awards granted to our employees under several stock-based incentive plans established by Man Group. For a discussion of the Man Group stock compensation plans that our employees participated in prior to the Reorganization and Separation transactions, as well as the accounting for those awards, see Note 10 to our consolidated and combined financial statements. Effective upon completion of the IPO, we granted to our executives and a broad group of other employees initial awards of stock options and/or restricted stock units under our LTIP. These awards took into account existing unvested stock options and/or other stock -based awards of Man Group held by our officers and employees that were forfeited under the terms of the relevant Man Group plans as a result of the Reorganization and Separation transactions.
Employee compensation and benefits related to non-recurring IPO awards refers to stock-based compensation expense for restricted stock and restricted stock units issued in connection with our IPO. Employee compensation and benefits related to non-recurring IPO awards are considered non-recurring and directly attributable to the IPO.
We estimate that we will incur approximately $12.2 million of stock-based compensation expense in the fiscal year ended March 31, 2011 related to IPO awards granted to employees upon consummation of the IPO. Of this amount, approximately $9.7 million represents employee compensation and benefits related to these non-recurring IPO awards. The restricted stock units granted pursuant to the IPO awards generally vest in full on the third anniversary of the pricing of the IPO. The stock options granted pursuant to the IPO awards have an exercise price equal to the $30 IPO price of our shares of common stock and will vest in equal installments over the three-year period and therefore were not exercisable for the first year following the IPO. As mentioned above, in October 2009, we initiated a tender offer that enabled eligible employees to exchange options that were granted to them at the time of our IPO for a lower number of restricted stock units. In connection with this tender offer, 3,301,162 options were tendered and exchanged for 284,455 restricted stock units. For additional information on this tender offer, see Note 10 of our consolidated and combined financial statements.
We expect that our employee compensation and benefits expenses will vary from quarter to quarter due to the performance of our business, the hiring of additional employees associated with the growth of our business and the product and geographic mix of our business, which affects our compensation structure. In addition, we announced a 10% to 15% reduc-
51
Table of Contents
tion in workforce and a cap on some bonus pools which we expect will result in future cost savings. However, we cannot offer any assurance that all of these savings will be successfully realized as there may be unexpected events or overlooked or unknown contingencies that may cause us to alter our plans or reassess our estimates. Furthermore, in connection with our reduction in workforce, we expect to incur severance and other costs in the first half of fiscal 2011, the amount of which have not yet been quantified. As of March 31, 2010, we had approximately 3,200 employees.
Communications and Technology
Communications and technology expenses consist of expenses incurred to purchase, lease, use and maintain the technology-related hardware, software and communications systems we use to operate our business. These types of expenses include expenses incurred to make network or data connections to market platforms, clients or other clearing agents, fees paid for access to external market data, software licenses, repairs and maintenance of hardware and software (including service agreements), as well as expenses for disaster recovery and redundancy systems. These expenses are impacted by the number of producer staff as well as the number of clients that require direct lines or data transfer capabilities. Communications and technology expenses are recognized on an accrual basis.
Occupancy and Equipment Costs
Occupancy and equipment costs expenses consist of expenses incurred to lease, furnish and maintain our offices and other facilities, including rent, real estate broker fees, maintenance fees, utilities, other fixed asset-service fees, repair and leasehold improvement expenses and rents for exchange floor booths. Occupancy and equipment costs are recognized on an accrual basis.
Depreciation and Amortization
Depreciation and amortization expenses consist of expenses related to the depreciation of facilities, furniture, fixtures and equipment and the amortization of intangible assets, including acquired client relationships and internally developed software. Depreciation and amortization expenses are recognized over the asset’s useful life.
Professional Fees
Professional fees consist of fees paid to consultants and advisors, including audit, legal, information technology and recruiting costs. Professional fees do not include any legal settlement costs, which are recorded as part of general and other expenses below. Professional fee expenses are recognized on an accrual basis.
As a public company, we are subject to various reporting, corporate governance and regulatory compliance requirements, including the requirements of the Sarbanes-Oxley Act of 2002 and the SEC rules and regulations implementing that Act, the Exchange Act, the NYSE listing standards and regulatory requirements such as the BASEL II capital adequacy framework and the Markets in Financial Instruments Directive. To continue to comply with these requirements, we expect to incur additional professional fees in fiscal 2011.
General and Other
General and other expenses consist of other expenses that have not been separately classified in our statement of operations. These types of expenses include, among other items, travel and entertainment, advertising, promotion, insurance premiums, bad debts, legal settlement costs, foreign currency translation gains and losses, and general banking expenses. The amount of general and other expenses incurred by a particular team will impact the profitability of that team and, therefore, the amount of the production-based compensation received by its staff. We believe that this compensation structure encourages our producer staff to manage their travel and entertainment and other general expenses accordingly. General and other expenses are recognized on an accrual basis.
PAAF Legal Settlement
PAAF legal settlement costs were recorded in fiscal 2008 following active discussions to settle litigation against our U.S. operating company, MF Global Inc., brought by a court-appointed receiver for PAAF and its fund manager and commodity pool
52
Table of Contents
operator. PAAF legal settlement costs are recorded as litigation accruals in the periods in which they were incurred. On December 3, 2007, we entered into an agreement to settle this matter. Man Group agreed to indemnify us for amounts in excess of $50.0 million relating to all costs, expenses and liabilities we incurred as a result of the PAAF litigation and any other claims or litigation arising from the facts and circumstances which give rise to that claim, net of any insurance proceeds we receive. During fiscal 2009, we received a $62.1 million insurance reimbursement in connection with the PAAF litigation, of which $54.6 million represented the settlement and $7.5 million represented legal fees and costs. This was recorded in Other revenues in our consolidated and combined statement of operations.
Broker-related Loss
As discussed above, a former registered representative in one of our offices substantially exceeded his authorized trading limit and we, as the clearing member, were responsible for the resulting loss of $141.0 million in fiscal 2008. We recorded the full amount as a bad debt expense.
IPO-Related Costs
In connection with the Reorganization, Separation and Recapitalization transactions, we have incurred legal, consulting and other non-recurring professional fees, including fees relating to implementing new reporting and corporate governance requirements, adapting our accounting systems and marketing activities undertaken as part of our rebranding effort. As MF Global did not receive any proceeds from the IPO, these costs have been expensed.
Impairment of intangible assets and goodwill
As discussed in Note 3 to our consolidated and combined financial statements, during fiscal 2010 and 2009, we completed impairment testing of goodwill and identified triggering events that required an impairment analysis to be performed related to certain intangible assets. As a result of our analyses, we determined all of our goodwill and a portion of our intangible assets were impaired. Consequently, we recorded the impairment charge in our consolidated and combined statements of operations.
Refco Integration Costs
Refco integration costs consist of the costs incurred in connection with our acquisition of the Refco assets in November 2005, including retention costs and bonuses, redundancy and severance payments and professional fees. These costs do not reflect new contracts but rather the performance of previously existing agreements.
Gains on Exchange Seats and Shares
Gains on exchange seats and shares consist of unrealized gains or losses we recognize on exchange seats or shares we hold in excess of the exchange seats and shares we are required to hold to conduct our business, which we refer to as excess seats and shares. The amount of any unrealized gain or loss is based on changes in the mark-to-market value of the excess seats or shares. We also recognize realized gains or losses on the sale of any seats and/or shares. The amount of any realized gain is based on the difference between the book value of such seats and/or shares and the sale price. Finally, gains on exchange seats and shares also include dividend income we earn from exchange seats or shares. All exchange seats or shares that we are required to hold in order to conduct our business are recorded at cost and do not impact our statements of operations. Certain exchange shares are subject to restrictions on resale.
Loss on Extinguishment of Debt
Loss on extinguishment of debt in fiscal 2010 resulted from the early repayment of the Two-Year Term Facility in April 2009. In repaying the Two-Year Term Facility prior to its scheduled maturity, we incurred a loss on the early extinguishment of debt of $9.7 million. The loss has been disclosed separately within our consolidated statement of operations for fiscal 2010. Loss on extinguishment of legacy debt held prior to our IPO consists of losses that we incurred as the result of the repayment of outstanding borrowings, including private placement notes to third parties, and related interest swaps, prior to their scheduled maturity. In repaying the private placement notes and interest rate swaps prior to their scheduled maturity, we
53
Table of Contents
incurred a loss on the early extinguishment of debt of $18.3 million, which has been disclosed separately within our consolidated and combined statement of operations for fiscal 2008.
Interest on Borrowings
Interest on borrowings consist of interest expense incurred on borrowings from third parties, including third-party liquidity facilities as well as interest expense charged to us by Man Group for subordinated borrowings. This interest expense is incurred separately from trading activities and client transactions. In connection with the Reorganization and Separation transactions, we entered into a bridge loan and used the proceeds of the bridge loan to repay indebtedness to Man Group and third parties. For a discussion of our historical borrowings, see Note 9 to our consolidated and combined financial statements.
Benefit/Provision for Income Taxes
Our benefit or provision for income taxes includes all current and deferred provisions for federal, state, local and foreign taxes.
We account for income taxes under the asset and liability method prescribed by US GAAP. Under this method, deferred income taxes reflect the net tax effects of temporary differences between the carrying amount of assets and liabilities for financial statement and income tax purposes, as determined under applicable tax laws and rates. A valuation allowance is provided for deferred tax assets when it is more likely than not that some portion of the deferred tax assets will not be realized. Any increase or decrease in a valuation allowance could have a material adverse or beneficial impact on our income tax benefit or provision and net income or loss in the period in which the determination is made. Our effective income tax rate can vary from period to period, depending on, among other factors, the geographic and business mix of our earnings, the availability of losses, the level of non-deductible expenses and the effect of tax audits.
Our effective tax rates for fiscal 2010, 2009 and 2008 were 28.8%, 420.9% and 1,850.2% respectively. For fiscal 2008, our tax expense was impacted by non-deductible expenses and a $75.7 million one-time tax expense associated with our separation from Man Group. For fiscal 2009, the non-recurrence of these items was partly offset by the effects of certain non-deductible expenses, including the impairment of goodwill, an increase in the valuation allowance associated with deferred tax assets unlikely to be monetized, the impact of our reduced share price on the value of vested equity awards to employees and a greater percentage of income being generated in higher-tax jurisdictions. For fiscal 2010, our tax benefit was impacted by higher non-deductible expenses, increased valuation allowance, changes in uncertain tax positions, the impact of our reduced share price on the value of vested equity awards to employees and a greater percentage of our results in higher tax jurisdictions. Partially offsetting these items in fiscal 2010 are certain tax credits, reductions in tax liabilities related to prior years and a one-time benefit from the change in our corporate domicile. Our tax rate from ongoing operations for fiscal 2010 was 28.8%.
Man Group agreed to indemnify us against certain specified tax and other liabilities that may arise in connection with the Reorganization and Separation and the IPO, subject to various limitations and conditions. To the extent that we incur a tax or other liability for which we are indemnified, our payment of the liability should generally be offset from a financial perspective by our receipt of the indemnity payments (subject to timing differences and the extent of the indemnification). Even if we are fully indemnified against a particular tax or other liability, however, our financial results of operations as reflected in our consolidated and combined financial statements could be adversely affected. For accounting purposes, an indemnity payment would generally be treated as a net capital contribution to us from Man Group, and the incurrence of the related liability could reduce our net income as reported in our consolidated and combined financial statements. The Reorganization and Separation and our IPO have caused us to incur tax liabilities for which we received the economic benefit of an indemnity payment under the tax matters deed. While those liabilities do not affect our cash flow, assuming we receive full indemnification, they do have a significant non-cash impact on our statement of operations for the period following the offering. The $75.7 million reorganization tax charge described above and reflected in our results for fiscal 2008 is one such case. While not all of this charge is required to be paid currently, we received $63.1 million to date from Man Group, including $8.1 million in fiscal 2009, and we have paid these deposits over to the relevant tax authorities.
We have deferred tax assets recorded on our consolidated balance sheets related to stock compensation awards issued in connection with the IPO. Due to declines in our stock price, the amount of these assets may not equal the tax benefit ultimately realized at the date of delivery of these awards, as the deferred tax assets are based on the stock awards’ grant date
54
Table of Contents
fair value; any shortfall will result in a charge to the income statement. We have no pool of windfall tax benefits. With respect to the IPO awards that vest on July 18, 2010, we estimate an expense in the income statement of between $21.0 million and $25.0 million for this shortfall if the stock closes within a range of $8-10 per share on that date.
Equity in Earnings of Unconsolidated Companies (net of tax)
Equity in earnings of unconsolidated companies includes our pro rata share of earnings for entities in which we own between 20% and 50% of the entity’s common equity and over which we have the ability to exert influence, although not control, relating to such entities’ operating and financial policies. As of March 31, 2010, we owned a 19.5% interest in Polaris MF Global Futures Co Ltd and no longer have an interest in U.S. Futures Exchange LLC (“USFE”).
Noncontrolling Interest in Income of Consolidated Companies (net of tax)
We consolidate the results of operations and financial position of entities we control, but do not wholly own. We own 70.2% of MF Global Sify Securities India Private Limited, 75.0% of MF Global Financial Services India Private Limited and 73.2% of MF Global Futures Trust Co. Ltd. Earnings for these entities are consolidated on a post-tax basis.
Results of Operations
Basis of Presentation
We operate and manage our business on an integrated basis as a single operating segment. We derive our revenues principally from execution and clearing services we provide to our clients, including interest income related to providing these services, and from principal transactions. While we provide these services to a diverse client base across multiple products, markets and geographic regions, we do not manage our business, allocate resources or review our operating results based on the type of client, product or trading market or the geographic region in which these services are provided. For information related to our geographic regions, see Note 16 to our consolidated and combined financial statements.
On April 1, 2009, we adopted two new accounting standards each of which was effective for fiscal 2010 and interim periods within such fiscal year. These standards required retrospective application and resulted in an adjustment to prior period financial statements. The first standard discusses accounting for noncontrolling interests in consolidated financial statements and resulted in a $12.8 million increase to total equity for fiscal 2009 upon adoption. The second standard discusses accounting for convertible debt instruments that may be settled in cash upon conversion including partial cash settlement and resulted in a $0.4 million increase to Net loss attributable to MF Global Holdings Ltd., $1.0 million decrease to total assets, $7.0 million decrease to total liabilities and a $6.0 million increase to total equity for fiscal 2009 upon adoption.
The audited consolidated and combined financial statements for fiscal 2010 represents our third annual reporting period subsequent to becoming a publicly-traded company. Prior to July 1, 2007, our financial statements were prepared on a combined carve-out basis as if we had existed on a stand-alone basis and in conformity with U.S. GAAP, as described above.
Our audited consolidated and combined financial statements include the carve-out accounts of Man Financial, the brokerage business of Man Group plc, and its majority and wholly owned subsidiaries, in each case using the historical basis of accounting for the results of operations, assets and liabilities of the respective businesses. Our audited consolidated and combined financial statements may not necessarily reflect the results of operations, financial position and cash flows we would have achieved had we actually existed on a stand-alone basis during the periods presented. Transactions between us and Man Group until September 30, 2009 and entities that remain part of Man Group after the IPO, herein referred to as “related party” or “affiliated” transactions, have not been eliminated in combination, but all significant intercompany balances and transactions between the entities included in our audited consolidated and combined financial statements have been eliminated in combination.
Our audited consolidated and combined financial statements include our direct expenses as well as our allocation of expenses arising from shared services and infrastructure provided to us by Man Group. These expenses primarily relate to employee compensation and benefits, use of office facilities and services related to overall corporate functions, including tax, legal, risk management, insurance, finance, internal audit and executive management. These expenses have been allocated to us using estimates that management considers a reasonable reflection of our use of these services or benefits we received. See Note 17 to our consolidated and combined financial statements for further information related to these costs.
55
Table of Contents
Management believes that our audited consolidated and combined financial statements include normally recurring adjustments and accruals necessary for a fair presentation of the audited consolidated and combined balance sheets, statements of operations, cash flows, changes in equity and comprehensive income for the periods presented. Certain prior year amounts have been reclassified to conform to current year presentation. Specifically, during the second quarter of fiscal 2008, we began classifying the total return equity swaps entered into as part of a matched equity hedge in principal transactions rather than in net interest. Additionally, we also began presenting the interest and dividends earned on contracts for differences on a gross rather than net basis within interest income and interest expense. This reclassification did not result in any changes to revenues, net of interest and transaction based expenses, or net income. During fiscal 2008, we also recorded an $8.8 million reduction to interest income, a $4.8 million adjustment to principal transactions, and a $1.9 million reduction to employee compensation and benefits, in each case related to errors in prior year accruals that were deemed immaterial to all prior periods presented. Secondly, during fiscal 2009, we identified errors in our previously reported financial statements. These errors related to the historical accounting for specific exchange and clearing fees, the timing and amount of certain accruals, the accounting for transactions related to the spin-off of our operations from Man Group in connection with our IPO, including the deductibility of certain taxes from that transaction, as well as the classification of certain revenues and expenses between line items in our consolidated and combined statements of operations. The impact of the errors on net income for fiscal 2008 was an increase of $1.4 million. We do not believe that these adjustments are quantitatively or qualitatively material to the results of the respective reporting periods, our projected results for the current year, any prior year’s earnings, earnings trends, or financial statement line items.
56
Table of Contents
Year Ended March 31, 2010 Compared to the Year Ended March 31, 2009:
(Amounts in millions except share data)
| FOR THE YEAR ENDED MARCH 31, | |||||||||||
| 2010 | 2009 | % Change | |||||||||
| Revenues |
|||||||||||
| Commissions |
$ | 1,386.0 | $ | 1,642.4 | (15.6 | ) | |||||
| Principal transactions |
225.4 | 287.7 | (21.7 | ) | |||||||
| Interest income |
491.6 | 872.3 | (43.6 | ) | |||||||
| Other |
42.4 | 112.4 | (62.3 | ) | |||||||
| Total revenues |
2,145.4 | 2,914.8 | (26.4 | ) | |||||||
| Interest and transaction-based expenses: |
|||||||||||
| Interest expense |
288.0 | 495.1 | (41.8 | ) | |||||||
| Execution and clearing fees |
601.8 | 741.0 | (18.8 | ) | |||||||
| Sales commissions |
240.6 | 252.0 | (4.5 | ) | |||||||
| Total interest and transaction-based expenses |
1,130.4 | 1,488.1 | (24.0 | ) | |||||||
| Revenues, net of interest and transaction-based expenses |
1,015.0 | 1,426.7 | (28.9 | ) | |||||||
| Expenses |
|||||||||||
| Employee compensation and benefits (excluding non-recurring IPO awards) |
673.0 | 796.2 | (15.5 | ) | |||||||
| Employee compensation related to non-recurring IPO awards |
31.8 | 44.8 | (29.0 | ) | |||||||
| Communications and technology |
118.6 | 122.6 | (3.3 | ) | |||||||
| Occupancy and equipment costs |
39.4 | 44.8 | (12.1 | ) | |||||||
| Depreciation and amortization |
55.1 | 57.8 | (4.7 | ) | |||||||
| Professional fees |
82.1 | 90.4 | (9.2 | ) | |||||||
| General and other |
114.6 | 100.6 | 13.9 | ||||||||
| IPO-related costs |
0.9 | 23.1 | (96.1 | ) | |||||||
| Impairment of intangible assets and goodwill |
54.0 | 82.0 | (34.1 | ) | |||||||
| Refco integration costs |
— | 0.7 | (100.0 | ) | |||||||
| Total other expenses |
1,169.5 | 1,363.1 | (14.2 | ) | |||||||
| Gains on exchange seats and shares |
8.5 | 15.1 | (43.7 | ) | |||||||
| Loss on extinguishment of debt |
9.7 | — | 100.0 | ||||||||
| Interest on borrowings |
39.7 | 68.6 | (42.1 | ) | |||||||
| (Loss)/income before provision for income taxes |
(195.4 | ) | 9.9 | (2,073.7 | ) | ||||||
| (Benefit)/provision for income taxes |
(56.3 | ) | 41.9 | (234.4 | ) | ||||||
| Equity in income/(loss) of unconsolidated companies (net of tax) |
3.8 | (16.2 | ) | (123.5 | ) | ||||||
| Net loss |
(135.3 | ) | (48.1 | ) | 181.3 | ||||||
| Net income attributable to noncontrolling interest (net of tax) |
1.7 | 1.0 | 70.0 | ||||||||
| Net loss attributable to MF Global Holdings Ltd. |
$ | (137.0 | ) | $ | (49.1 | ) | 179.0 | ||||
| Loss per share: |
|||||||||||
| Basic |
$ | (1.36 | ) | $ | (0.58 | ) | |||||
| Diluted |
$ | (1.36 | ) | $ | (0.58 | ) | |||||
| Weighted average number of shares of common stock outstanding: |
|||||||||||
| Basic |
123,222,780 | 121,183,447 | |||||||||
| Diluted |
123,222,780 | 121,183,447 | |||||||||
57
Table of Contents
Overview
Revenues, net of interest and transaction-based expenses, decreased $411.7 million, or 28.9%, to $1,015.0 million for fiscal 2010 from $1,426.7 million for fiscal 2009. The decrease in revenues, net of interest and transaction based expenses, was due in part to lower net interest generated from client funds due to declining interest rates, the narrowing of short-term credit spreads in fixed income and reduced volatility and bid-ask spreads in the commodities and foreign exchange markets. See “—Supplementary Data” for further details. The decrease was also due to an 8.5% decrease in our total volumes of executed and/or cleared exchange-traded futures and options transactions from 1,832.6 million contracts for fiscal 2009 to 1,676.5 million contracts for fiscal 2010. The decrease of 156.1 million contracts in our total volumes of executed and/or cleared exchange-traded futures and options transactions was spread across many of our primary products, markets and geographic regions. In addition, during fiscal 2009, there was an increase in other revenues that reflected a $62.1 million insurance reimbursement in connection with the litigation brought by a court appointed receiver for Philadelphia Alternative Asset Fund Ltd. (“PAAF”) and its fund manager and commodity pool operator, Philadelphia Asset Management Co. LLC. Excluding the litigation insurance reimbursement, revenues, net of interest and transaction-based expenses would have decreased $349.6 million or 25.6%.
Our other expenses, which refer to our expenses other than interest and transaction-based expenses, decreased $193.6 million, or 14.2%, to $1,169.5 million for fiscal 2010 from $1,363.1 million for fiscal 2009. The decrease was primarily due to a reduction of $123.2 million in employee compensation and benefits (excluding non-recurring IPO awards) which correlates with decreased net revenues, a reduction in impairment of intangible assets and goodwill of $28.0 million, a reduction of $22.9 million related to lower IPO-related and Refco integration costs, a reduction of $13.0 million of stock-based compensation expense on our equity awards issued in connection with the completion of our IPO, a reduction of $8.3 million in professional fees, a reduction of $5.4 million in occupancy and equipment costs and a reduction of $4.0 million in communications and technology costs. These reductions for fiscal 2010 were partially offset by an increase in general and other expenses of $14.0 million. This increase in general and other expenses was due to $15.6 million in foreign exchange translation losses arising during fiscal 2010 compared to foreign exchange translation gains of $12.6 million for fiscal 2009, offset by a decrease of $9.9 million in bad debt expense.
Loss before provision for income taxes was $195.4 million for fiscal 2010 compared to income of $9.9 million for fiscal 2009. This loss was primarily due to decreased revenues, net of interest and transaction-based expenses, the $9.7 million loss on extinguishment of debt that we incurred in relation to the early repayment of the Two-Year Term Facility and a decrease of $6.6 million in gains on exchange seats and shares. The loss was partially offset by the decrease in other expenses mentioned above and a decrease of $28.9 million in interest on borrowings.
Net loss increased $87.2 million to $135.3 million for fiscal 2010 from $48.1 million for fiscal 2009. Net loss is impacted by the items discussed above, plus a decreased effective tax rate while in a loss position resulting from higher non-deductible costs, increased valuation allowance and uncertain tax position reserves, the impact of our share price on the value of vested equity compensation and an increase in our operating results being earned in higher tax jurisdictions. Partially offsetting these items are tax credits, a one-time benefit due to our change in corporate domicile and reductions in prior year liabilities.
Revenues
Commissions
Commissions decreased $256.4 million, or 15.6% to $1,386.0 million for fiscal 2010 from $1,642.4 million for fiscal 2009. The decrease was partially due to an 8.5% decrease in our total volumes of executed and/or cleared exchange-traded futures and options transactions from 1,832.6 million contracts for fiscal 2009 to 1,676.5 million contracts for fiscal 2010. Commissions consist of both execution-only and cleared commissions. The decrease in our transaction volumes and commissions was attributed to (i) reduced volumes due to middle market and smaller clients, which tend to be more profitable, reducing their trading activity as a result of the unprecedented volatility and unstable market conditions, (ii) the continuing self-execution of trades by clients on NYMEX as they shift from floor based to screen based executions, (iii) volume decreases impacted by a depressed economic climate as larger corporate customers are affected by market turmoil and have reduced their risk appetite, (iv) reductions in equity transactions as a result of declining stock market values in Europe and India upon which certain commissions are calculated and (v) decreases in trading in interest rate and commodities products and by individual investor clients, which are not always driven by valuation. These changes also reduced our yields on our total trades, as market dislocations reduced rates earned from large corporate clients, thereby further decreasing commissions.
58
Table of Contents
Principal Transactions
Revenue from principal transactions decreased $62.3 million, or 21.7%, to $225.4 million for fiscal 2010 from $287.7 million for fiscal 2009. Principal transactions do not reflect the net interest income earned from principal transactions and related financing transactions, which is included in interest income and expense. Net interest income earned from these principal transactions and related financing transactions was $53.3 million for fiscal 2010 compared to $150.2 million for fiscal 2009. When factoring in net interest income from principal transactions and related financing transactions, which is how management views the business, principal transactions revenues decreased $159.2 million, or 36.4%, to $278.7 million for fiscal 2010 from $437.9 million for fiscal 2009. The decrease in principal transactions was attributable to reduced matched principal brokerage in foreign exchange, equities and commodities markets which decreased from $214.2 million to $140.5 million for fiscal 2009 and 2010, respectively, as well as a reduction in fixed income revenue resulting from narrowing short-term credit spreads, which decreased from gains of $40.7 million to losses of $5.1 million for fiscal 2009 and 2010, respectively. See “—Supplementary Data” for further information on principal transactions revenues.
Interest Income, Net
Interest income, net, decreased $173.6 million, or 46.0%, to $203.6 million for fiscal 2010 from $377.2 million for fiscal 2009. This decrease was primarily due to declining interest rates and a decrease in net interest generated from principal transactions and related financing transactions as described further below. The average federal funds rate in the United States decreased from 1.03% during fiscal 2009 to 0.15% during fiscal 2010. This contributed to net interest from client funds and excess cash decreasing $76.7 million from $227.0 million for fiscal 2009 to $150.3 million for fiscal 2010 due to (i) reduced rates earned on excess cash during fiscal 2010, (ii) narrower spreads earned on client funds as we reduced the duration of our investment portfolio of client balances from last year to ensure we had significant liquidity in the current volatile environment to meet client needs and (iii) clients withdrawing some of their excess cash since last year, consistent with the trend in the market, to increase their own liquidity during these volatile times. The decline in interest income, net, was also driven by a 64.5% decrease in net interest generated from principal transactions and related financing transactions from $150.2 million for fiscal 2009 to $53.3 million for fiscal 2010. This decrease was due to the narrower spreads earned by our fixed income products during fiscal 2010, consisting of both repurchase and resale transactions, stock borrowing and lending activities and dividends paid on short equity positions we held as hedges to equity futures contracts purchased from customers through a central clearing counterparty. See “— Supplementary Data” for further information on the components of net interest income.
Other Revenues
Other revenues decreased $70.0 million, or 62.3%, to $42.4 million for fiscal 2010 compared to $112.4 million for fiscal 2009. This decrease was primarily due to the $62.1 million one-time PAAF litigation settlement reimbursement that we received during fiscal 2009. In the absence of this settlement, other revenues decreased $7.9 million, or 15.7% reflecting a reduction in recharges to clients for local taxes in certain European markets and decreased ancillary third-party fees received from clients and other counterparties for the use of various trading systems, data and other professional staff and support services, all of which were affected by declining trading volumes. These decreases were partially offset by a $3.2 million settlement we received in fiscal 2010, in relation to litigation regarding our prior acquisition of Refco assets.
Transaction-based Expenses
Execution and Clearing Fees
Execution and clearing fees decreased $139.2 million, or 18.8%, to $601.8 million for fiscal 2010 from $741.0 million for fiscal 2010. This decrease was primarily due to an 8.5% decrease in our volume of executed and/or cleared exchange-traded futures and options transactions from 1,832.6 million contracts for fiscal 2009 to 1,676.5 million contracts for fiscal 2010. During fiscal 2010, we experienced decreased transaction volumes, spread across many of our primary markets, products and geographic regions. Our execution and clearing fees are not fixed, but instead are calculated on a per-contract basis, and vary based on the market on which transactions are executed and cleared. Not all transactions that generate execution-only revenue generate corresponding execution or clearing fees, while some matched principal transactions do. Included within execution and clearing fees are losses due to transactional errors, which increased from 0.6% of revenues, net of interest and transaction based expenses, for fiscal 2009 to 0.7% of revenues, net of interest and transaction based expenses, for fiscal 2010.
59
Table of Contents
Sales Commissions
Sales commissions decreased $11.4 million, or 4.5% to $240.6 million for fiscal 2010 from $252.0 million for fiscal 2009. This decrease was primarily due to declining trading volume as a result of lack of client confidence in the markets, unstable market conditions and investors not trading with the same frequency during fiscal 2010 as compared to fiscal 2009. Depending on the specific arrangements with introducing brokers, decreased volumes from individual investor clients transacting through introducing brokers usually result in a proportionate decrease in commissions paid to brokers. However, a large part of our business is not generated by introducing brokers and therefore not all changes to volumes result in a proportionate change to sales commissions.
Other Expenses
Employee Compensation and Benefits (Excluding Non-Recurring IPO Awards)
These expenses refer to all employee compensation, including stock based compensation expense for equity instruments, but excludes restricted stock and restricted stock units issued in connection with the IPO. Employee compensation and benefits (excluding IPO awards) decreased $123.2 million, or 15.5%, to $673.0 million for fiscal 2010 from $796.2 million for fiscal 2009. This decrease was primarily due to (i) reduced variable compensation paid to employees based on lower net revenues, volume and profit contributions, (ii) a reduction in termination expenses from $38.1 million for fiscal 2009 to $6.4 million for fiscal 2010, (iii) the $27.5 million write-down of upfront compensation costs, and (iv) reduced discretionary bonus expense of $11.7 million. Related to the write-down of upfront compensation costs, we commenced a strategic assessment of our cost base, including reviews of our compensation structure and non-compensation expenses. As a result of these reviews, we eliminated future service requirements on the majority of previously granted sign-on bonuses and other retention payments which resulted in a onetime write-down of upfront compensation payments. Related to the discretionary bonus expense, we have elected to expand our use of stock-based awards as payment for employees’ incentive compensation, which we believe will further align the interests of our employees with the interests of shareholders. Accordingly, during fiscal 2010, management decided to increase the percentage of compensation paid in three-year vesting stock awards, and reduced discretionary bonus expense by $11.7 million.
This overall 15.5% decrease was partially offset by increases in payroll expenses due to increased professional headcount. Fixed producer and professional compensation as a percentage of total employee compensation and benefits (excluding IPO awards) was 62.8% for fiscal 2010 compared to 42.5% for fiscal 2009. Excluding termination costs and the write-down of upfront compensation payments, the ratio of fixed producer and professional compensation as a percentage of total employee compensation and benefits (excluding IPO awards) was 66.1% for fiscal 2010 compared to 44.6% for fiscal 2009. Employee compensation and benefits (excluding IPO awards), as a percentage of revenues, net of interest and transaction-based expenses, increased to 66.3% for fiscal 2010 from 55.8% for fiscal 2009. Excluding termination costs and the write-down of upfront compensation payments, employee compensation and benefits (excluding IPO awards), as a percentage of revenues, net of interest and transaction based expenses increased to 63.0% for fiscal 2010 from 53.1% for fiscal 2009.
In December 2009, the U.K. government introduced legislation which would impose a 50% charge on certain discretionary bonus payments in excess of £0.025 million, made between December 9, 2009 and April 5, 2010 to U.K. employees within the financial services industry. As of March 31, 2010, this law had not been enacted and no accrual had been made with respect to this item in our financial statements. This law was enacted in April 2010. We continue to monitor the guidance from, and to work with, the U.K. authorities to analyze the potential application of this law on bonuses paid to our U.K. employees. At this time, we are still evaluating the impact the laws will have on our financial results and are holding discussions with U.K. Inland Revenue. We estimate that the potential liability will be in the range of $5.0 million to $20.0 million, will be accrued during our first quarter of fiscal 2011 and paid during our second quarter of fiscal 2011.
Employee Compensation and Benefits Related to Non-Recurring IPO Awards
These expenses refer to stock-based compensation expense for restricted stock and restricted stock units issued in connection with our IPO. Employee compensation and benefits related to non-recurring IPO awards decreased $13.0 million, or 29.0%, to $31.8 million for fiscal 2010 from $44.8 million for fiscal 2009. This decrease is primarily attributable to the accelerated vesting of certain awards in fiscal 2009 as well as the impact in fiscal 2010 of reduced expense from forfeitures during the prior fiscal year. These expenses are considered non-recurring and directly attributable to the IPO.
60
Table of Contents
Communications and Technology
Communications and technology expenses decreased $4.0 million, or 3.3%, to $118.6 million for fiscal 2010 from $122.6 million for fiscal 2009. This decrease was due to reduced software licensing and maintenance costs, a reduction in outsourced computer services and decreased telecommunication expenses resulting from the consolidation of the CBOT and CME exchange floors as a result of which we now require less equipment to participate on the combined CME/CBOT exchange floors. In addition, we experienced reduced market data research and communications expenses, reflecting fewer client trades during fiscal 2010 as compared to fiscal 2009. This caption also includes software licenses and costs related to our trading systems. Communications and technology, as a percentage of revenues, net of interest and transaction-based expenses, increased to 11.7% for fiscal 2010 from 8.6% for fiscal 2009.
Occupancy and Equipment Costs
Occupancy and equipment costs decreased $5.4 million, or 12.1%, to $39.4 million for fiscal 2010 from $44.8 million for fiscal 2009, primarily due to higher costs incurred during fiscal 2009 as a result of the relocation to new leased premises in London and the renewal of and additional leased office space in New York. This decrease was offset by increased costs in fiscal 2010 due to the leasing of additional office space in Chicago. Occupancy and equipment costs, as a percentage of revenues, net of interest and transaction-based expenses, increased to 3.9% for fiscal 2010 as compared to 3.1% for fiscal 2009.
Depreciation and Amortization
Depreciation and amortization expenses decreased $2.7 million, or 4.7%, to $55.1 million for fiscal 2010 from $57.8 million for fiscal 2009, primarily due to reduced amortization expense on intangible assets of $2.8 million as a result of certain intangible asset impairments related to customer relationships and trade names recognized in fiscal 2009. Depreciation and amortization, as a percentage of revenues, net of interest and transaction-based expenses, increased to 5.4% for fiscal 2010 from 4.1% for fiscal 2009.
Professional Fees
Professional fees decreased $8.3 million, or 9.2%, to $82.1 million for fiscal 2010 from $90.4 million for fiscal 2009, primarily due to $7.3 million of legal and consulting fees that are included in fiscal 2009 which were incurred in relation to a one-time broker-related loss in fiscal 2008. In addition, we reduced professional fees through enhanced internal accounting, legal and regulatory processes and by internalizing certain functions which are now partially reflected in increased professional headcount. Professional fees, as a percentage of revenues, net of interest and transaction-based expenses, increased to 8.1% for fiscal 2010 from 6.3% for fiscal 2009.
General and Other
General and other expenses increased $14.0 million, or 13.9%, to $114.6 million for fiscal 2010 from $100.6 million for fiscal 2009. This increase was due primarily to a $28.2 million variance in foreign currency translation expenses, as reflected in a move from gains of $12.6 million during fiscal 2009 to losses of $15.6 million during fiscal 2010. The foreign currency translation loss during fiscal 2010 included (i) a $4.1 million currency translation loss related to the Parabola litigation, which was recorded in May 2009, but applied retrospectively to March 31, 2009, due to accounting requirements and (ii) a $15.6 million currency translation loss driven by adverse movements of the British Pound and Euro to U.S. Dollar exchange rates. In addition, our higher insurance premiums increased $0.5 million and non-trading related expenses increased $1.4 million. The increases in foreign currency expense, insurance premiums and non-trading related expenses were partially offset by lower travel and entertainment costs of $3.4 million, decreased legal settlements of $2.5 million as well as lower bad debt expense, which decreased from $19.7 million of expense for fiscal 2009 to $9.7 million for fiscal 2010. This decrease in bad debt expense was primarily due to the bankruptcy of Lehman Brothers and the resulting bad debt reserve established during fiscal 2009. Bad debts decreased to 1.0% of revenues, net of interest and transaction based expenses for fiscal 2010 compared to 1.4% for fiscal 2009. General and other expenses, as a percentage of revenues, net of interest and transaction-based expenses, increased to 11.3% for fiscal 2010 from 7.1% for fiscal 2009.
61
Table of Contents
IPO-related Costs
We incurred costs of $0.9 million and $23.1 million, or approximately 0.1% and 1.6% of our revenues, net of interest and transaction-based expenses, for fiscal 2010 and 2009, respectively in connection with the Reorganization, Separation and Recapitalization transactions and the IPO, which we refer to as IPO-related costs. These costs consisted primarily of legal, accounting and consulting fees. Since we did not receive proceeds from the IPO, we expensed these costs. The current year costs are primarily related to continuing compliance with the Sarbanes-Oxley Act. We do not expect these costs to continue in future years.
Impairment of Intangible assets and Goodwill
We recorded a total impairment charge of $54.0 million and $82.0 million, or approximately 5.3% and 5.7% of our revenues, net of interest and transaction-based expenses in fiscal 2010 and 2009, respectively based on our annual impairment testing of goodwill and intangible assets. Based on the results of our analyses, we determined that our market capitalization and the fair value derived from the discounted cash flow model was less than the estimated fair value of our balance sheet and we therefore recorded a charge of $3.4 million and $76.8 million for fiscal years 2010 and 2009, respectively, to write-off the entire amount of our goodwill. We have an earn-out arrangement that could result in additional goodwill being recorded in future periods and will continue to assess our goodwill annually or whenever events or changes in circumstances indicate that an interim assessment is necessary.
We also identified triggering events during the fourth quarters of fiscal 2010 and 2009 that required an impairment analysis to be performed related to certain intangible assets. Due to the decrease in expected cash flows from certain long-lived intangible assets related to higher customer attrition and lower velocity as originally estimated in the purchase accounting model, we concluded that such assets were not fully recoverable. As a result of our analyses, we recorded impairment charges of $50.6 million for fiscal 2010 related to customer relationships and $5.2 million for fiscal 2009 related to customer relationships and trade names.
Refco Integration Costs
We did not incur any Refco integration costs for fiscal 2010 as compared to $0.7 million for fiscal 2009. The costs incurred in fiscal 2009 were directly related to the Refco acquisition, primarily related to retention and severance of Refco personnel. These costs are not considered part of normal operations.
Gains on Exchange Seats and Shares
Gains on exchange seats and shares decreased $6.6 million to $8.5 million for fiscal 2010 from $15.1 million for fiscal 2009. The amount of unrealized gains recorded is based on the fair market value movements of the remaining excess seats and shares. The gains for fiscal 2010 were primarily due to gains on the sale of CME, NYMEX and BOTCC shares, and dividends received from CME, LME and LCH. The gains for fiscal 2009 were primarily due to gains on the sale of NYMEX shares and dividends received following the CME/NYMEX merger. Absent future demutualizations or changes in trading requirements, we do not expect to recognize material amounts of gains on seats and shares in future periods.
Loss on Extinguishment of Debt
Loss on extinguishment of debt was a result of the early repayment of the Two-Year Term Facility in April 2009. In repaying the Two-Year Term Facility prior to its scheduled maturity, we incurred a loss on the early extinguishment of debt of $9.7 million in the first quarter of fiscal 2010. The loss has been disclosed separately within our consolidated statement of operations.
Interest on Borrowings
Interest on borrowings decreased $28.9 million, or 42.1%, to $39.7 million for fiscal 2010 from $68.6 million for fiscal 2009. This decrease was primarily due to lower levels of outstanding debt and a decrease in interest rates, particularly the LIBOR rate. During fiscal 2010 we repaid $200.0 million of the outstanding balance on our liquidity facility and, as mentioned above, we also paid the remaining outstanding balance of $240.0 million on the Two-Year Term Facility. Interest from borrowings, as a percentage of revenues, net of interest and transaction-based expenses, decreased to 3.9% for fiscal 2010 from 4.8% for fiscal 2009.
62
Table of Contents
Provision for Income Taxes
Income taxes decreased $98.2 million from a tax provision of $41.9 million for fiscal 2009, to tax benefits of $56.3 million for fiscal 2010. Our effective income tax rate was 28.8%, down from 420.9% for fiscal 2009. The decrease in the effective tax rate results from (i) increased taxes offsetting the tax benefit, primarily from higher non-deductible costs, increased valuation allowance and uncertain tax position reserves, (ii) the impact of our share price on the value of vested equity compensation, and (iii) an increase in our operating results being earned in higher tax jurisdictions. Partially offsetting these items are certain tax credits, a one-time benefit due to our change in corporate domicile and reductions in prior year liabilities due to changes in tax law and the filing of our tax returns. Our effective tax rate on ongoing operations (excluding discrete items) was approximately 28.8% for fiscal 2010 compared to 38.8% for fiscal 2009.
63
Table of Contents
Year Ended March 31, 2009 Compared to the Year Ended March 31, 2008:
(Amounts in millions except share data)
| FOR THE YEAR ENDED MARCH 31, | |||||||||||
| 2009 | 2008 | % Change | |||||||||
| Revenues |
|||||||||||
| Commissions |
$ | 1,642.4 | $ | 2,014.8 | (18.5 | )% | |||||
| Principal transactions |
287.7 | 281.9 | 2.1 | ||||||||
| Interest income |
872.3 | 3,669.0 | (76.2 | ) | |||||||
| Other |
112.4 | 54.1 | 107.8 | ||||||||
| Total revenues |
2,914.8 | 6,019.8 | (51.6 | ) | |||||||
| Interest and transaction-based expenses: |
|||||||||||
| Interest expense |
495.1 | 3,165.2 | (84.4 | ) | |||||||
| Execution and clearing fees |
741.0 | 927.4 | (20.1 | ) | |||||||
| Sales commissions |
252.0 | 291.0 | (13.4 | ) | |||||||
| Total interest and transaction-based expenses |
1,488.1 | 4,383.6 | (66.1 | ) | |||||||
| Revenues, net of interest and transaction-based expenses |
1,426.7 | 1,636.3 | (12.8 | ) | |||||||
| Expenses |
|||||||||||
| Employee compensation and benefits (excluding non-recurring IPO awards) |
796.2 | 896.7 | (11.2 | ) | |||||||
| Employee compensation related to non-recurring IPO awards |
44.8 | 59.1 | (24.2 | ) | |||||||
| Communications and technology |
122.6 | 118.7 | 3.3 | ||||||||
| Occupancy and equipment costs |
44.8 | 35.6 | 25.8 | ||||||||
| Depreciation and amortization |
57.8 | 54.8 | 5.5 | ||||||||
| Professional fees |
90.4 | 74.6 | 21.2 | ||||||||
| General and other |
100.6 | 108.3 | (7.1 | ) | |||||||
| PAAF legal settlement |
— | 76.8 | (100.0 | ) | |||||||
| Broker related loss |
— | 141.0 | (100.0 | ) | |||||||
| IPO-related costs |
23.1 | 56.1 | (58.8 | ) | |||||||
| Impairment of intangible assets and goodwill |
82.0 | — | 100.0 | ||||||||
| Refco integration costs |
0.7 | 2.7 | (74.1 | ) | |||||||
| Total other expenses |
1,363.1 | 1,624.6 | (16.1 | ) | |||||||
| Gains on exchange seats and shares |
15.1 | 79.5 | (81.0 | ) | |||||||
| Loss on extinguishment of debt |
— | 18.3 | (100.0 | ) | |||||||
| Interest on borrowings |
68.6 | 69.3 | (1.0 | ) | |||||||
| Income before provision for income taxes |
9.9 | 3.6 | 175.0 | ||||||||
| Provision for income taxes |
41.9 | 66.6 | (37.1 | ) | |||||||
| Equity in loss of unconsolidated companies (net of tax) |
(16.2 | ) | (1.7 | ) | 852.9 | ||||||
| Net loss |
(48.1 | ) | (64.7 | ) | (25.7 | ) | |||||
| Net income attributable to noncontrolling interest (net of tax) |
1.0 | 4.9 | (79.6 | ) | |||||||
| Net loss attributable to MF Global Holdings Ltd. |
$ | (49.1 | ) | $ | (69.5 | ) | (29.4 | ) | |||
| Loss per share: |
|||||||||||
| Basic |
$ | (0.58 | ) | $ | (0.60 | ) | |||||
| Diluted |
$ | (0.58 | ) | $ | (0.60 | ) | |||||
| Weighted average number of shares of common stock outstanding: |
|||||||||||
| Basic |
121,183,447 | 115,027,797 | |||||||||
| Diluted |
121,183,447 | 115,027,797 | |||||||||
64
Table of Contents
Overview
Revenues, net of interest and transaction-based expenses, decreased $209.6 million, or 12.8%, to $1,426.7 million for fiscal 2009 from $1,636.3 million for fiscal 2008. During fiscal 2009, there was an increase in other revenues of $58.3 million that reflected a $62.1 million insurance reimbursement in connection with the litigation brought by a court appointed receiver for Philadelphia Alternative Asset Fund Ltd. (“PAAF”) and its fund manager and commodity pool operator, Philadelphia Asset Management Co. LLC. During fiscal 2008 we recognized a loss on interest rate forward contracts of $51.4 million as a result of incremental changes in interest rates, which we reclassified from other comprehensive income/ (loss) to principal transactions. For further information related to our derivative instruments and hedging activities, see Note 2 to our consolidated and combined financial statements. Excluding the litigation insurance reimbursement and loss on these interest rate forward contracts, revenues, net of interest and transaction-based expenses, decreased 19.1% from $1,687.7 million in fiscal 2008 to $1,364.6 million in fiscal 2009. The decrease was primarily due to a 12.0% decrease in our total volumes of executed and/or cleared exchange-traded futures and option transactions from 2,082.7 million contracts for fiscal 2008 to 1,832.6 million contracts for fiscal 2009. The decrease of 250.1 million contracts in our total volumes of executed and/or cleared exchange-traded futures and option transactions was spread across many of our primary products, markets and regions, especially our professional trader volumes, as these customers tend to reduce trading during periods of significant volatility. The decrease is also reflective of the significant volumes experienced last year. There was also lower net interest income generated from client funds due to declining interest rates and the narrowing of short-term credit spreads coupled with the reduced duration in the investment of client funds. See “—Supplementary Data” for further details.
Our other expenses, which refer to our expenses other than interest and transaction-based expenses, decreased $261.5 million, or 16.1%, to $1,363.1 million for fiscal 2009 from $1,624.6 million for fiscal 2008. The decrease was primarily due to the $141.0 million broker-related loss incurred in fiscal 2008, a reduction of $100.5 million in employee compensation and benefits (excluding non-recurring IPO awards) reflecting lower net revenues, a reduction of $76.8 million of expense related to the fiscal 2008 PAAF litigation settlement, a reduction of $35.0 million related to lower IPO-related and Refco integration costs, and a reduction of $14.3 million of stock-based compensation expense on our equity awards issued in connection with the IPO. These reductions for fiscal 2009 were offset by the $82.0 million impairment of intangible assets and goodwill, a $4.2 million increase in professional fees incurred in connection with a broker-related loss, and $11.6 million in incremental professional fees comprised of audit fees, legal fees, and other consulting fees incurred as a stand-alone public company. The decrease in other expenses was also offset by a $16.1 million increase in expenses relating to communications and technology, occupancy and equipment, and depreciation and amortization, all generated by the growth in our business and our infrastructure.
Income before provision for income taxes increased $6.3 million, or 175.0%, to $9.9 million for fiscal 2009 from $3.6 million for fiscal 2008. This increase was mainly due to decreased other expenses mentioned above as well as the broker-related loss, non-recurring expenses related to the IPO and loss on extinguishment of borrowings of $18.3 million in fiscal 2008. This increase was offset by decreased revenues, net of interest and transaction-based expenses, and a decrease of $64.4 million in gains on exchange seats and shares.
Net loss attributed to MF Global Holdings Ltd. decreased $20.4 million to $49.1 million for fiscal 2009 from $69.5 million for fiscal 2008. Net loss is impacted by the items discussed above, as well as the increased tax impact of non-deductible costs including the impairment of goodwill, the impact of our share price on the value of vested equity awards made to employees and a greater percentage of our income being earned in higher-tax jurisdictions, offset by the non-recurrence of the $75.7 million onetime tax charge triggered by the IPO in fiscal 2008.
Revenues
Commissions
Commissions decreased $372.4 million, or 18.5%, to $1,642.4 million for fiscal 2009 from $2,014.8 million for fiscal 2008. This decrease was due to a 12.0% decrease in our total volume of executed and/or cleared exchange-traded futures and options transactions from 2,082.7 million contracts for fiscal 2008 to 1,832.6 million contracts for fiscal 2009. The decrease in our transaction volumes and commissions was attributed to reductions in equity transactions as a result of declining stock market values in Europe and India upon which certain commissions are calculated and decreases in trading in interest rate products, commodities and private clients, which are not always driven by values. Volumes were also impacted
65
Table of Contents
by the continuing self-execution of trades by clients on NYMEX as they shift from floor based to screen based executions. Our decrease in commissions was also due to rate decreases due to larger corporate customers affected by market turmoil. We also experienced reduced volumes due to middle market and smaller clients, which tend to be more profitable, reducing their trading activity as a result of the unprecedented volatility and unstable market conditions. These changes also reduced our yields on our total trades, as market dislocations reduced rates on large corporate clients, thereby further decreasing commissions. We experienced a decrease in execution and clearing volumes across almost all products, markets and regions, in particular with professional traders who tend to reduce trading during periods of significant volatility.
Principal Transactions
Principal transactions increased $5.8 million, or 2.1%, to $287.7 million for fiscal 2009 from $281.9 million for fiscal 2008. Principal transactions do not reflect the net interest income earned from collateralized transactions related to principal transactions revenues, which is included in interest income and expense. This net interest income was $150.2 million for fiscal 2009 as compared to $94.7 million for fiscal 2008. In fiscal 2008, we recorded a $51.4 million loss in principal transactions for interest rate forward contracts following unfavorable movements in interest rates. These were entered into for an anticipated issuance of debt, which did not occur. As a result, we no longer qualified for cash flow hedge accounting treatment and reclassified the loss from other comprehensive income/ (loss) to principal transactions. When factoring in net interest, which is how management views the business, and excluding the loss on the cash flow hedge, principal transactions revenues increased $9.9 million, or 2.3%, to $437.9 million for fiscal 2009 from $428.0 million for fiscal 2008. The increase in principal transactions was primarily attributable to the mark-to-market gains on the investment of client funds in our agency portfolio as well as an increase in fixed income transactions resulting from wider spreads and significant trading from new customers. These increases were offset by reduced matched principal brokerage in energy and agriculture markets. See “—Supplementary Data” for further quarterly information on principal transactions revenues.
Interest Income, Net
Interest income, net, decreased $126.6 million, or 25.1%, to $377.2 million for fiscal 2009 from $503.8 million for fiscal 2008. This decrease was primarily due to declining interest rates offset by an increase in net interest generated from principal transactions, related financing transactions and the impact of equity swaps. The average federal funds rate in the United States decreased from 3.84% during fiscal 2008 to 1.03% during fiscal 2009. Net interest from client funds and excess cash decreased 44.5% from $409.1 million for fiscal 2008 to $227.0 million for fiscal 2009 due to (i) reduced rates earned on excess cash during fiscal 2009, (ii) narrower spreads earned on client funds as we reduced the duration of our investment portfolio of client balances to ensure we had significant liquidity in the current volatile environment to meet client needs and (iii) clients withdrawing some of their excess cash, consistent with the trend in the market, to increase liquidity during these volatile times. Despite the decreases mentioned above, the decline in interest income, net, was offset by a 58.6% increase in net interest generated from principal transactions and related financings transactions from $94.7 million for fiscal 2008 to $150.2 million for fiscal 2009. This was due to the wide spreads benefiting our fixed income products, consisting of both secured financings of repurchase and resale transactions and stock borrowing and lending activities. See “—Supplementary Data” for further information on the components of net interest income.
Other Revenues
Other revenues increased $58.3 million, or 107.8%, to $112.4 million for fiscal 2009 compared to $54.1 million for fiscal 2008. This increase is primarily due to the onetime PAAF litigation insurance reimbursement of $62.1 million received in fiscal 2009. In the absence of this settlement, other revenues decreased $3.8 million, or 7.0% reflecting the decrease in trading volumes resulting in decreased ancillary third-party fees received from clients and other counterparties for the use of various trading systems, data and other professional staff and support services. These fees include fees for equity market research, processing fees, fees for the use of screens and 24-hour access.
66
Table of Contents
Transaction-based Expenses
Execution and Clearing Fees
Execution and clearing fees decreased $186.4 million, or 20.1%, to $741.0 million for fiscal 2009 from $927.4 million for fiscal 2008. This decrease was primarily due to a 12.0% decrease in our volume of executed and/or cleared exchange-traded futures and options transactions from 2,082.7 million contracts for fiscal 2008 to 1,832.6 million contracts for fiscal 2009. During fiscal 2009, we experienced decreased transaction volumes in most of our principal markets, products and geographic regions. Our execution and clearing fees are not fixed, but instead are calculated on a per-contract basis, and vary based on the market on which transactions are executed and cleared. Not all execution only transactions generate execution or clearing fees, while some matched principal transactions do. Included within execution and clearing fees are losses due to transactional errors, which decreased from 1.0% of revenues, net of interest and transaction based expenses, for fiscal 2008 to 0.6% of revenues, net of interest and transaction based expenses, for fiscal 2009.
Sales Commissions
Sales commissions decreased $39.0 million, or 13.4% to $252.0 million for fiscal 2009 from $291.0 million for fiscal 2008. This was primarily due to declining trade activity as a result of lack of client confidence and unstable market conditions during fiscal 2009. Depending on the specific arrangements with introducing brokers, decreased volumes from retail clients transacting through introducing brokers usually result in a proportionate decrease in commissions paid to brokers. However, a large part of our business is not generated by introducing brokers and therefore all changes to volumes do not impact sales commissions.
Other Expenses
Employee Compensation and Benefits (Excluding Non-Recurring IPO Awards)
These expenses refer to all employee compensation including stock based compensation expense for equity instruments, but exclude restricted shares and restricted share units issued at the IPO. Employee compensation and benefits excluding IPO awards decreased $100.5 million, or 11.2%, to $796.2 million for fiscal 2009 from $896.7 million for fiscal 2008. This decrease was primarily due to decreases in variable compensation paid to employees based on sales, volume and profit contributions, offset in part by incremental payroll expenses due to increased headcount as well as termination expenses of $38.1 million, primarily related to former senior executives. In addition, $14.6 million of the decrease related to the non-recurring accelerated vesting charge of predecessor Man Group stock-based compensation awards recognized during fiscal 2008. Fixed producer and professional compensation as a percentage of total employee compensation and benefits was 38.7% for fiscal 2009 as compared to 33.8% for fiscal 2008. Excluding termination costs, the ratio of fixed producer and professional compensation as a percentage of total employee compensation and benefits excluding IPO awards was 34.0% in fiscal 2009. Employee compensation and benefits excluding IPO awards, as a percentage of revenues, net of interest and transaction-based expenses, increased to 55.8% for fiscal 2009 from 54.8% for fiscal 2008. Excluding termination costs, employee compensation and benefits excluding IPO awards, as a percentage of revenues, net of interest and transaction based expenses was 53.1% in fiscal 2009.
Employee Compensation and Benefits Related to Non-Recurring IPO Awards
These expenses refer to stock-based compensation expense for restricted shares and restricted share units issued in connection with the IPO. Employee compensation and benefits related to non-recurring IPO awards decreased $14.3 million, or 24.2%, to $44.8 million for the fiscal year ended March 31, 2009 from $59.1 million for fiscal 2008. This decrease is attributable to the decrease in nonvested restricted share and restricted share unit awards in fiscal 2009 as well as the modification and revaluation of former officers’ awards causing a reduction in expense. These expenses are considered non-recurring and directly attributable to the IPO.
Communications and Technology
Communications and technology expenses increased $3.9 million, or 3.3%, to $122.6 million for fiscal 2009 from $118.7 million for fiscal 2008. This increase was primarily due to increases in software licensing costs as well as market data research and communications expenses, reflecting increased clients during the current period. This caption also includes
67
Table of Contents
software licenses and costs related to the trading systems. Communications and technology, as a percentage of revenues, net of interest and transaction-based expenses, increased to 8.6% for fiscal 2009 from 7.3% for fiscal 2008.
Occupancy and Equipment Costs
Occupancy and equipment costs increased $9.2 million, or 25.8%, to $44.8 million for fiscal 2009 from $35.6 million for fiscal 2008, primarily due to increased rent as a result of the relocation to new leased premises in London and the renewal of and additional leased office space in New York. Occupancy and equipment costs, as a percentage of revenues, net of interest and transaction-based expenses, increased to 3.1% for fiscal 2009 as compared to 2.2% for fiscal 2008.
Depreciation and Amortization
Depreciation and amortization increased $3.0 million, or 5.5%, to $57.8 million for fiscal 2009 from $54.8 million for fiscal 2008. This increase was due to the amortization of additional client relationships and other intangible assets acquired with the businesses of FXA Securities Ltd in June 2007 and BrokerOne Pty Ltd in September 2007. In addition, there was an increase in depreciation of leasehold improvements following the acquisition of an additional floor in our New York office and depreciation on a new treasury system. Depreciation and amortization, as a percentage of revenues, net of interest and transaction-based expenses, increased to 4.1% for fiscal 2009 from 3.3% for fiscal 2008.
Professional Fees
Professional fees increased $15.8 million, or 21.2%, to $90.4 million for fiscal 2009 from $74.6 million for fiscal 2008. This increase was primarily due to $8.5 million in increased professional fees related to enhanced accounting, legal and regulatory requirements as a public company. In addition, we incurred legal and consulting fees of $7.3 million associated with the broker-related loss incurred in fiscal 2008. Professional fees, as a percentage of revenues, net of interest and transaction-based expenses, increased to 6.3% for fiscal 2009 from 4.6% for fiscal 2008.
General and Other
General and other expenses decreased $7.7 million, or 7.1%, to $100.6 million for fiscal 2009 from $108.3 million for fiscal 2008. This decrease was due primarily to decreased travel and entertainment expenses of $2.7 million, decreased advertising costs of $0.1 million, increased gains from currency translation of $8.7 million and decreased general operating expenses of $11.6 million. These decreases were offset by increased insurance premiums of $5.1 million and higher bad debt expense of $10.3 million, mainly from the bankruptcy of Lehman Brothers and resulting provision on all receivables with them, which increased to 1.4% from 0.6% of revenues, net of interest and transaction based expenses. In addition, there was an $8.0 million litigation expense related to a legal judgment in the U.K., recorded net of insurance proceeds, recorded in fiscal 2009 and a $10.0 million accrual for potential CFTC civil monetary penalties in the U.S recorded in fiscal 2008. General and other expenses, as a percentage of revenues, net of interest and transaction-based expenses, increased to 7.1% for fiscal 2009 from 6.6% for fiscal 2008.
PAAF legal settlement
On December 3, 2007, we settled the litigation against our U.S. operating company brought by a court appointed receiver for PAAF and its fund manager and commodity pool operator. As a result of this settlement, we recorded a litigation accrual of $74.8 million in fiscal 2008. On December 26, 2007, we also settled a related investigation by the CFTC arising out of the PAAF matter and accrued an additional $2.0 million for fiscal 2008. During fiscal 2009, we received a $62.1 million insurance reimbursement in connection with the PAAF litigation that has been recorded in Other revenues in our consolidated and combined statement of operations.
Broker-related Loss
In connection with the broker-related loss mentioned above, we incurred a loss of $141.0 million, which was written off as a bad debt expense for fiscal 2008. This cost is considered unusual.
68
Table of Contents
IPO-related Costs
We incurred costs of $23.1 million and $56.1 million, or approximately 1.6% and 3.4% of our revenues, net of interest and transaction-based expenses, for fiscal 2009 and 2008, respectively in connection with the Reorganization, Separation and Recapitalization transactions and the IPO, which we refer to as IPO-related costs. These costs consisted primarily of legal, accounting and consulting fees. Since we did not receive proceeds from the IPO, we expensed these costs. The current year costs are primarily related to Sarbanes-Oxley compliance. We expect these costs will reduce significantly in future years.
Impairment of Intangible assets and Goodwill
We recorded an impairment charge of $82.0 million in fiscal 2009 based on our annual impairment testing of goodwill and intangibles. Our annual testing identified triggering events that required an impairment analysis to be performed related to goodwill and certain intangible assets. As a result of our analyses, we determined all of our goodwill and a portion of our intangible assets were impaired. There was no such impairment charge recorded in fiscal 2008.
Refco Integration Costs
Refco integration costs decreased by $2.0 million, to $0.7 million for fiscal 2009 from $2.7 million for fiscal 2008. We incurred integration costs directly related to the Refco acquisition, primarily related to retention and severance of Refco personnel. These costs do not reflect new contracts but rather the completion of previously existing agreements. Refco integration costs, as a percentage of revenues, net of interest and transaction-based expenses, decreased to less than 0.1% for fiscal 2009 from 0.2% for fiscal 2008. These costs are not considered part of normal operations and will continue to reduce in future periods.
Gains on Exchange Seats and Shares
Gains on exchange seats and shares decreased $64.4 million to $15.1 million for fiscal 2009 from $79.5 million for fiscal 2008. The amount of unrealized gains recorded is based on the fair market value movements of the remaining excess seats and shares. During fiscal 2009, we realized gains on the sale of NYMEX shares and dividends received following the CME/NYMEX merger. The gains for fiscal 2008 were primarily due to gains on the sale of shares of ICE, Euroclear, NYMEX, CBOT and CME, offset by mark-to-market losses on all our excess exchange shares. During fiscal 2008, substantially all of our excess exchange seats and shares were significantly reduced either through their contribution to a subsidiary of Man Group in connection with the Reorganization and Separation transactions, or disposal to third parties. As a result, absent future demutualizations or changes in trading requirements, we do not expect to recognize material amounts of gains on seats and shares in future periods.
Loss on Extinguishment of Debt
Prior to the IPO, our outstanding borrowings included private placement notes to third parties. In connection with these notes, we had interest rate swaps in place to swap the fixed interest payments to floating rates. In July 2007, in connection with the IPO, we repaid these borrowings and related interest rate swaps prior to their scheduled maturity. In repaying the private placement notes and interest rate swaps prior to their scheduled maturity, we incurred a loss on the early extinguishment of debt of $18.3 million, which has been disclosed separately within our consolidated and combined statement of operations for fiscal 2008.
Interest on Borrowings
Interest on borrowings decreased $0.7 million, or 1.0%, to $68.6 million for fiscal 2009 from $69.3 million for fiscal 2008. This decrease was primarily due to lower levels of debt and a decrease in interest rates, particularly the LIBOR rate. During fiscal 2009 we paid off the remaining portion of our $1,400.0 million bridge facility. Interest from borrowings, as a percentage of revenues, net of interest and transaction-based expenses, increased to 4.8% for fiscal 2009 from 4.2% for fiscal 2008.
Provision for Income Taxes
Income taxes decreased $24.7 million, to $41.9 million, for fiscal 2009 from $66.6 million for fiscal 2008. Our effective tax rate was 420.9%, down from 1,850.2% for fiscal 2008. The decrease in the effective tax rate primarily relates to non-deductible costs and tax expense related to the IPO transaction partly offset by non-deductible expenses including the
69
Table of Contents
impairment of goodwill, the impact of our share price on the value of vested equity compensation, and a greater percentage of profits being generated in higher tax jurisdictions. Our effective tax rate on ongoing operations is 38.8% for fiscal 2009 as compared to 33.6% in fiscal 2008.
Supplementary Data
The table below calculates total principal transactions revenue, including the net interest generated from financing transactions related to principal transactions:
| THREE MONTHS ENDED | YEARS ENDED MARCH 31, | ||||||||||||||||||||||||||||||
| JUNE 30, | SEPTEMBER 30, | DECEMBER 31, | MARCH 31, | ||||||||||||||||||||||||||||
| 2008 | 2009 | 2008 | 2009 | 2008 | 2009 | 2009 | 2010 | 2009 | 2010 | ||||||||||||||||||||||
| Principal transactions |
$ | 63.2 | $ | 45.7 | $ | 69.2 | $ | 40.2 | $ | 109.9 | $ | 89.6 | $ | 45.3 | $ | 50.0 | $ | 287.7 | $ | 225.4 | |||||||||||
| Net interest generated from principal transactions and related financing transactions |
36.5 | 42.8 | 24.9 | 35.9 | 51.4 | (28.4 | ) | 37.4 | 3.0 | 150.2 | 53.3 | ||||||||||||||||||||
| Total principal transactions revenue |
$ | 99.7 | $ | 88.5 | $ | 94.1 | $ | 76.1 | $ | 161.3 | $ | 61.2 | $ | 82.7 | $ | 53.0 | $ | 437.9 | $ | 278.7 | |||||||||||
The table below provides an analysis of the components of net interest income:
| THREE MONTHS ENDED | YEARS ENDED MARCH 31, | ||||||||||||||||||||||||||||||
| JUNE 30, | SEPTEMBER 30, | DECEMBER 31, | MARCH 31, | ||||||||||||||||||||||||||||
| 2008 | 2009 | 2008 | 2009 | 2008 | 2009 | 2009 | 2010 | 2009 | 2010 | ||||||||||||||||||||||
| Net interest generated from client payables and excess cash |
$ | 70.5 | $ | 33.3 | $ | 75.6 | $ | 29.9 | $ | 46.5 | $ | 42.9 | $ | 34.3 | $ | 44.2 | $ | 227.0 | $ | 150.3 | |||||||||||
| Net interest generated from principal transactions and related financing transactions |
36.5 | 42.8 | 24.9 | 35.9 | 51.4 | (28.4 | ) | 37.4 | 3.0 | 150.2 | 53.3 | ||||||||||||||||||||
| Total net interest income |
$ | 107.0 | $ | 76.1 | $ | 100.5 | $ | 65.8 | $ | 97.9 | $ | 14.5 | $ | 71.7 | $ | 47.2 | $ | 377.2 | $ | 203.6 | |||||||||||
The table below calculates net revenues from client payables and excess cash:
| THREE MONTHS ENDED | YEARS ENDED MARCH 31, | ||||||||||||||||||||||||||||||||
| JUNE 30, | SEPTEMBER 30, | DECEMBER 31, | MARCH 31, | ||||||||||||||||||||||||||||||
| 2008 | 2009 | 2008 | 2009 | 2008 | 2009 | 2009 | 2010 | 2009 | 2010 | ||||||||||||||||||||||||
| Net interest generated from client payables and excess cash |
$ | 70.5 | $ | 33.3 | $ | 75.6 | $ | 29.9 | $ | 46.5 | $ | 42.9 | $ | 34.3 | $ | 44.2 | $ | 227.0 | $ | 150.3 | |||||||||||||
| Principal transactions revenues from investment of client payables |
(0.9 | ) | 0.2 | 2.1 | 2.7 | 31.1 | 1.3 | (7.8 | ) | (2.3 | ) | 24.5 | 1.9 | ||||||||||||||||||||
| Total net revenues from client payables and excess cash |
$ | 69.6 | $ | 33.5 | $ | 77.7 | $ | 32.6 | $ | 77.6 | $ | 44.2 | $ | 26.5 | $ | 41.9 | $ | 251.5 | $ | 152.2 | |||||||||||||
70
Table of Contents
Liquidity and Capital Resources
We have multiple sources of liquidity. We expect our primary liquidity needs over the next 12 months to be for working capital, debt service obligations and preferred dividend obligations. We believe we will have sufficient liquidity to meet these obligations given our expected cash flows from operations and our available sources of liquidity. Our available sources of liquidity as of March 31, 2010 included: (i) our committed $1,500.0 million five-year unsecured revolving liquidity facility with various banks, which we refer to as our “liquidity facility”, and which terminates in June 2012, under which we currently have $442.5 million outstanding and $1,057.5 million that is undrawn at March 31, 2010; (ii) available excess capital in our regulated subsidiaries, the withdrawal of which is subject to regulatory approval; and (iii) available excess cash held in the bank accounts of non-regulated subsidiaries. See”-Credit Facilities and Sources of Liquidity” for further information. In addition, we have customer collateral, which is not included on our balance sheet but can be re-hypothecated to us, and non-segregated customer payables, both of which may be considered an additional layer of liquidity. Non-segregated customer cash in some jurisdictions is also available for other client liquidity demands which helps mitigate the use of our own cash. We also rely on uncommitted lines of credit from multiple sources to fund our day-to-day execution operations. Further, on September 25, 2009, we filed a registration statement with the SEC using a “shelf” registration process. Under this shelf process, we may sell securities, including common or preferred stock, debt securities, and warrants to purchase common or preferred stock or debt securities, in one or more offerings. Any sale of such securities would be dependent upon market conditions around the time of sale and there can be no assurance that we will sell any such securities. As noted in the registration statement, unless otherwise specified in an applicable prospectus supplement or other offering material, we intend to use the net proceeds from any sales of securities for general corporate purposes.
On April 16, 2009, we repaid the remaining outstanding balance of $240.0 million on the Two-Year Term Facility ahead of its maturity of July 2010 thus terminating all remaining obligations under the Two-Year Term Facility. On December 16, 2009, we repaid $200.0 million of the outstanding balance on our liquidity facility with excess and available cash. See Note 9 to our consolidated and combined financial statements for further information.
As the credit markets and our financial position and business have evolved, we have continuously assessed our capital structure and the opportunities to reposition or restructure it, including by extending maturities (which may require a reduction in the availability under our liquidity facility). In particular, our management has been considering the appropriate debt structure we should have, as well as the level of common stock, preferred stock and Convertible Notes we have outstanding. Factors that our management considers with respect to any such repositioning or restructuring include rating agency viewpoints, our growth strategy, adequacy of permanent capital, near term profitability, and the return on investment for our shareholders.
Working Capital Needs
Our cash flows are complex, interrelated, and highly dependent upon our operating performance, levels of client activity and financing activities. We view our working capital exclusive of non-earning assets and inclusive of our long-term borrowings. Our working capital decreased to $1,588.1 million as of March 31, 2010 from $2,085.5 million as of March 31, 2009 primarily due to the early repayment of the Two-Year Term Facility of $240.0 million and partial repayment of $200.0 million of outstanding balances under the liquidity facility.
71
Table of Contents
As of March 31, 2010 and 2009, total working capital was calculated as follows:
| MARCH 31, | ||||||
| 2010 | 2009 | |||||
| (dollars in millions) | ||||||
| TOTAL ASSETS |
$ | 50,966.1 | $ | 38,835.6 | ||
| Less Non-earning assets: |
||||||
| Receivables—Other |
44.4 | 36.9 | ||||
| Memberships in exchanges, at cost |
6.3 | 6.4 | ||||
| Furniture, equipment and leasehold improvements, net |
73.0 | 62.7 | ||||
| Intangible assets, net |
73.4 | 151.7 | ||||
| Other assets |
222.7 | 191.4 | ||||
| Subtotal non-earning assets |
419.8 | 449.0 | ||||
| Less Total liabilities: |
49,600.5 | 37,387.9 | ||||
| Add Borrowings |
642.3 | 1,086.8 | ||||
| TOTAL WORKING CAPITAL |
$ | 1,588.1 | $ | 2,085.5 | ||
Our primary requirement for working capital relates to funds we are required to maintain at exchanges and clearing organizations to support our clients’ trading activities. We require that our clients deposit collateral with us in support of their trading activities, which we in turn deposit with exchanges or clearing organizations to satisfy our obligations. These required deposits account for the majority of our working capital requirements. As discussed in Note 13 to our consolidated and combined financial statements, we are subject to the requirements of the regulatory bodies and exchanges of which we or our subsidiaries are a member or with which we conduct business. The regulatory bodies and exchanges each have defined capital requirements we must meet on a daily basis. We were in compliance with all of these requirements at March 31, 2010 and 2009. For the purposes of prudential supervision, we as a consolidated group are not subject to consolidated regulatory capital requirements under the European Union’s Capital Requirements Directive.
We have satisfied our primary requirements for working capital in the past from internally generated cash flow and available funds. We believe that our current working capital is more than sufficient for our present requirements. In OTC or non-exchange traded transactions, the amount of collateral we post is based upon our credit rating. Pursuant to our trading agreements with certain liquidity providers, if our credit rating falls, the amount of collateral we are required to post may increase. Some of the factors that could lead to a downgrade in our credit rating have been described in reports issued by certain of the rating agencies, and these factors include, but are not limited to, our profitability each quarter as compared against rating agency expectations, our ability to maintain a conservative liquidity profile, our ability to maintain the value of our franchise, deterioration in our trading volumes or operating cash flows, and a decline in maintenance margin funds or excess capital levels at our regulated subsidiaries.
Notwithstanding the self-funding nature of our operations, we may sometimes be required to fund timing differences arising from counterparty defaults on large transactions due to futures, foreign exchange or securities failures or clients going to delivery without proper instructions or the delayed receipt of client funds. Historically, these timing differences have been funded either with internally generated cash flow or, if needed, with short-term borrowings.
As discussed above, we rely on uncommitted lines of credit from multiple sources to fund day-to-day clearing operations. If these lines of credit are not available to us, we may have to reduce our clearing business, which may negatively impact our revenues.
As a matter of policy, we maintain excess capital to provide liquidity during periods of unusual market volatility, which has been sufficient historically to absorb the impact of volatile market events. Similarly, for our brokerage activities in the OTC markets involving transactions when we act as principal rather than as agent, we have adopted a futures-style margin methodology to protect us against price movements. A futures-style margin methodology allows us to reduce the amount of capital required to conduct this type of business because we are able to post client deposits, rather than our own funds, with clearing organizations or other counterparties, if required. In determining our required capital levels, we also consider the potential for counterparty default on a large transaction, which would require liquidity to cover such default, or a settlement
72
Table of Contents
failure due to mismatched settlement instructions. In many cases, other stock or securities can be pledged as collateral for secured lending to guard against such failure. As a result, we are able to execute a substantial volume of transactions without the need for large amounts of working capital.
Funding for purposes other than working capital requirements, including the financing of acquisitions, has been provided either through internally generated cash flow or through specific long-term financing arrangements.
Credit Facilities and Sources of Liquidity
As described above, we have a $1,500.0 million five-year unsecured committed liquidity facility. As of March 31, 2010, we had $442.5 million in outstanding borrowings. We intend to keep $300.0 million of the amount outstanding at March 31, 2010 under the liquidity facility as long term debt and as part of our capital structure, unless we replace some or all of these borrowings with other long-term debt. The remaining $1,057.5 million is available to us as a committed facility. In addition to this $300.0 million, we have a further $142.5 million outstanding under the liquidity facility.
The liquidity facility expires on June 15, 2012. Borrowings under this liquidity facility bear interest at a rate per annum equal to either, at our option, (1) a designated fluctuating base rate or (2) a designated fluctuating alternative base rate equal to seven-day or one-, two-, three-or six-month LIBOR plus a margin of 0.40% per annum, at our current senior unsecured non-credit enhanced credit rating from Standard & Poor’s and Moody’s. We pay a facility fee of 10 basis points per annum. Effective June 13, 2008, in connection with obtaining the consent of the syndicate of lenders in our liquidity facility to allow us to enter into the Two-Year Term Facility and a drawdown on the liquidity facility, which we used to repay borrowings under our bridge loan, we increased the interest rate margin by 1.10% per annum only on the first $500.0 million outstanding under the liquidity facility. On January 16, 2009, the agreed interest rate increased to 1.50% per annum on the outstanding balance under the liquidity facility due to a change in our credit ratings. In the event our credit ratings are further downgraded beyond a certain level, the rate on the first $500.0 million outstanding under the liquidity facility will increase to 1.85% and the rate on other outstanding amounts will increase to 0.525%. On December 16, 2009, we paid $200.0 million of the outstanding balance of our liquidity facility with excess and available cash. The liquidity facility contains financial and other covenants. In general terms, and subject to certain exceptions, we have agreed to maintain a consolidated tangible net worth of not less than $620.0 million (plus 50% of the proceeds of certain equity offerings and 25% of our consolidated positive net income for each completed fiscal year), and we have agreed not to incur indebtedness through our subsidiaries, incur liens on our assets, merge or consolidate with (or dispose of substantially all of our assets to) any person, engage in material new businesses, engage in transactions with affiliates except on arm’s-length terms or fail to satisfy any regulatory net capital or financial resources requirement or comply with applicable laws or regulations. If we fail to pay any amount when due under the facility or to comply with its other requirements, if we fail to pay any amount when due on other material debt (defined as $50.0 million or more in principal) or other material debt is accelerated in whole or in part by the lenders, or upon certain events of liquidation or bankruptcy, an event of default will occur under the liquidity facility. Upon an event of default, all outstanding borrowings, together with all accrued interest, fees and other obligations, under the liquidity facility will become due and we will not be permitted to make any further borrowings under the liquidity facility. At March 31, 2010, we were not in default of our covenants under the liquidity facility. As previously disclosed, in connection with our Domestication, we obtained an amendment to our liquidity facility to allow us to change our jurisdiction of incorporation by means of a discontinuance from Bermuda and a domestication to Delaware.
We also have other credit agreements with financial institutions, in the form of trading relationships, which facilitate execution, settlement, and clearing flow on a day to day basis for our clients, as well as provide evidence, as required, of liquidity to the exchanges we conduct business on. As of March 31, 2010, we had $6.2 million of issued letters of credit.
73
Table of Contents
As of March 31, 2010, due primarily to the repayment of a portion of our liquidity facility and the full prepayment of our Two-Year Term Facility, our available liquidity and long-term capital decreased to $3,262.0 million from $3,672.6 million, as of March 31, 2009. Our management views long-term capital as all sources of debt and equity from our consolidated balance sheet which includes excess capital. An analysis of our available liquidity and long-term capital position is as follows:
| MARCH 31, | MARCH 31, | |||||||
| Client Assets |
2010 | 2009 | ||||||
| Non-Segregated Payables to customers |
$ | 991.1 | $ | 921.5 | ||||
| Non-Segregated Collateral |
314.0 | 515.0 | ||||||
| 1,305.1 | 1,436.5 | |||||||
| Undrawn Liquidity Sources |
||||||||
| Liquidity Facility—Undrawn Portion (1) |
1,057.5 | 857.5 | ||||||
| 1,057.5 | 857.5 | |||||||
| Long-Term Capital |
||||||||
| Equity |
1,141.4 | 1,223.6 | ||||||
| Preferred Stock (Notional Value) |
300.0 | 300.0 | ||||||
| Liquidity Facility |
300.0 | 500.0 | ||||||
| Two-Year Term Facility |
— | 240.0 | ||||||
| Convertible Notes (Par Value) |
205.0 | 205.0 | ||||||
| Less: Non-Earning Assets (2) |
(419.8 | ) | (449.0 | ) | ||||
| 1,526.6 | 2,019.6 | |||||||
| Less: Required Capital |
(627.2 | ) | (641.0 | ) | ||||
| Excess Capital |
899.4 | 1,378.6 | ||||||
| Total Available Liquidity and Long-Term Capital (3) |
$ | 3,262.0 | $ | 3,672.6 | ||||
| (1) | In October 2008, Lehman Commercial Paper Inc., one of the participating banks with a total commitment amounting to $75.0 million under our $1,500.0 million five-year unsecured revolving liquidity facility filed for bankruptcy and, accordingly, we believe Lehman Commercial Paper Inc. will not fund the balance of its loan commitment, which is $60.0 million. |
| (2) | Non-earning assets consists of other receivables, memberships in exchanges, furniture, equipment and leasehold improvements, goodwill, intangible assets and other assets. |
| (3) | These amounts represent the sum of our available liquidity sources and committed and uncommitted long-term capital. |
Analysis of Cash Flows
We prepare our statement of cash flows in accordance with U.S. GAAP. This may not reflect our daily cash flows or impact of our clients’ transactions on our working capital position. The following tables present, for the periods indicated, the major components of net increases/ (decreases) in cash and cash equivalents:
| YEAR ENDED MARCH 31, | ||||||||||
| 2010 | 2009 | 2008 | ||||||||
| (Dollars in millions) | ||||||||||
| Cash flows from: |
||||||||||
| Operating activities |
$ | 691.4 | $ (349.0 | ) | $ (1,074.6 | ) | ||||
| Investing activities |
(34.6 | ) | (16.3) | 89.2 | ||||||
| Financing activities |
(477.5 | ) | (470.3) | 746.0 | ||||||
| Effect of exchange rate changes |
7.7 | (6.3) | 27.9 | |||||||
| Net increase/(decrease) in cash and cash equivalents |
$ | 187.0 | $ (841.9 | ) | $ (211.5 | ) | ||||
74
Table of Contents
Operating Activities
Net cash provided by operating activities was $691.4 million for fiscal 2010 compared to cash used of $349.0 million and $1,074.6 million in fiscal 2009 and 2008, respectively. Net cash from operating activities primarily consists of net income adjusted for certain non-cash items, including depreciation and amortization, gains on sale of exchange seats and shares, impairment of assets, stock-based compensation expense, loss on extinguishment of debt, loss on cash flow hedges, and deferred income taxes, as well as the effects of changes in working capital. During the year ended March 31, 2010 we recorded amortization of debt issuance costs of $7.9 million and a loss on extinguishment of debt of $9.7 million related to the early repayment of the Two-Year Term Facility. Additionally, during the year ended March 31, 2010, we recorded impairment charges of $54.0 million related to goodwill and intangibles. During the year ended March 31, 2009 we recorded amortization of debt issuance costs of $12.1 million and a gain on extinguishment of debt of $1.5 million due to the tender offer on our Convertible Notes. Additionally, during the year ended March 31, 2009, we recorded impairment charges of $14.6 million related to our equity investment in USFE and $82.0 million related to goodwill and intangibles. During the year ended March 31, 2008, we recorded a loss on extinguishment of debt of $18.3 million and a loss on cash flow hedges of $51.4 million. Working capital results in the most significant fluctuations to cash flows from operating activities, primarily reflecting (1) the levels of our collateralized financing arrangements, including repurchase and resale agreements, securities borrowing/lending transactions, securities owned and securities sold, not yet purchased (2) the levels of our restricted cash and (3) payables to customers due to margin and contractual commitments. Collateralized financing arrangements often result in significant fluctuations in cash flows, as cash is often received or used as collateral in these arrangements, and therefore the level of activity in these transactions at period-end directly impacts our cash flows from operating activities, without a specific correlation to our revenues or net income. Therefore, if cash provided under collateralized financing arrangements increased from one period to the next, this will be reflected as a cash outflow from operating activities. In the years ended March 31, 2010, 2009 and 2008, these arrangements resulted in net cash received of $5,329.2 million and net cash used of $5,458.8 million and $2,070.7 million, respectively. This was offset by changes in securities owned and securities sold, not yet purchased in the years ended March 31, 2010, 2009 and 2008, resulting in cash used of $5,196.8 million and cash received of $4,780.0 million, $2,174.8 million, respectively. Overall, in fiscal 2010, the movements in these arrangements drove the large increase in cash flows from operating activities. Furthermore, our levels of restricted cash also impact our operating cash flows, which for fiscal 2010 and 2009 resulted in cash generated of $33.9 million and $2,304.5 million, respectively, and cash used of $1,832.6 million for fiscal 2008. This activity directly impacts our operating cash flows, as was evidenced during fiscal 2010.
75
Table of Contents
Our client activities generate or use operating cash flows, which we finance through yield enhancement activities discussed below. There has been a change in our balance sheet from March 31, 2009 to March 31, 2010, and we analyze the changes to our client activities and how we have financed these activities as follows:
| MARCH 31, | ||||||||||||||||
| 2010 | 2009 | Change | ||||||||||||||
| (dollars in billions) | ||||||||||||||||
| Drivers of Liquidity—Client Activity |
||||||||||||||||
| Receivables—Customers, net of allowances |
$ | 0.3 | $ | 0.4 | $ | (0.1 | ) | |||||||||
| Payables—Customers |
(11.9 | ) | (11.9 | ) | — | |||||||||||
| Receivables—Brokers, dealers, and clearing organizations |
3.3 | 2.4 | 0.9 | |||||||||||||
| Payables—Brokers, dealers, and clearing organizations |
(2.2 | ) | (1.1 | ) | (1.1 | ) | ||||||||||
| Net (uses)/sources |
(0.3 | ) | ||||||||||||||
| Yield Enhancement Activities |
||||||||||||||||
| Cash and cash equivalents |
0.8 | 0.7 | (0.1 | ) | ||||||||||||
| Restricted cash and segregated securities |
9.7 | 9.7 | — | |||||||||||||
| Securities purchased under agreements to resell |
22.1 | 12.9 | 9.2 | |||||||||||||
| Securities sold under agreements to repurchase |
(29.0 | ) | (14.4 | ) | (14.6 | ) | ||||||||||
| Net |
(5.5 | ) | ||||||||||||||
| Securities borrowed |
4.0 | 8.6 | (4.6 | ) | ||||||||||||
| Securities loaned |
(0.9 | ) | (6.1 | ) | 5.2 | |||||||||||
| Net |
0.6 | |||||||||||||||
| Securities owned |
10.3 | 3.6 | 6.7 | |||||||||||||
| Securities sold, not yet purchased, at fair value |
(4.4 | ) | (2.9 | ) | (1.5 | ) | ||||||||||
| Net |
5.2 | |||||||||||||||
| Net funding sources/(uses) |
0.3 | |||||||||||||||
| $ | 0.0 | |||||||||||||||
Investing Activities
Net cash used in investing activities was $34.6 million for fiscal 2010 and $16.3 million for fiscal 2009 compared to net cash received of $89.2 million for fiscal 2008. These activities primarily relate to proceeds received from the sale of seats and shares related to exchange memberships, offset by purchase of exchange memberships, and furniture, equipment and leasehold improvements. In fiscal 2010 and 2009 we received cash of $1.3 million and $25.5 million from the sale of exchange seats and shares, respectively. These were partially offset by $3.4 million and $6.7 million cash used in connection with earn-out payments related to prior acquisitions in fiscal 2010 and 2009, respectively. Additionally, in fiscal 2010 and 2009, cash used to purchase furniture, equipment and leasehold improvements were $32.5 million and $33.8 million, respectively. In fiscal 2008, we received cash of $177.1 million from the sale of exchange seats and shares, which was partially offset by $58.5 million used (net of cash acquired) in connection with our acquisitions of Broker One, FXA, and ChoiceOdds Gaming, as well as $28.6 million of cash used to purchase furniture, equipment and leasehold improvements.
Financing Activities
Net cash used for fiscal 2010 and 2009 was $477.5 million and $470.3 million, as compared to net cash generated of $746.0 million for fiscal 2008. For fiscal 2010, we paid the remaining balance of $240.0 million on the Two-Year Term Facility and made a partial payment of $200.0 million of the outstanding balances under the liquidity facility. We also repaid other short-term borrowings of $6.0 million and paid preferred dividends of $30.7 million. For fiscal 2009, this mainly related to the
76
Table of Contents
completion of our capital plan to refinance our bridge facility. This included proceeds received from the liquidity facility of $350.0 million, the Two-Year Term Facility of $240.0 million, and proceeds from the issuance of the Convertible Notes of $210.0 million, all offset by $45.5 million of debt issuance costs. We also issued $150.0 million of Series B Preference Shares and $150.0 million of Series A Preference Shares, offset by $75.8 million of issuance costs. These net proceeds were used to pay down the $1,400.0 million bridge facility taken out in connection with the IPO. We also repaid other short-term borrowings of $29.5 million and paid preferred dividends of $18.6 million. For fiscal 2008, this mainly related to the change in capital structure related to the Reorganization, Separation and Recapitalization, which included proceeds from the bridge facility of $1,400.0 million, proceeds from other short-term borrowings of $244.5 million, proceeds from the Recapitalization of $516.2 million received from Man Group and the receipt of $55.0 million from Man Group as indemnification of a tax liability paid by us for an internal spin-off completed by Man Group prior to the IPO. These increases in cash were offset by $472.6 million used to repay the private placement notes owed to third parties, and $927.4 million paid to Man Group as repayment of intercompany borrowings.
Dividend Policy
We currently do not intend to pay any cash dividends on our common shares in the foreseeable future. We intend to retain all our future earnings, if any, to fund the development and growth of our business. Any future determination whether or not to pay dividends on our common shares will be made, subject to applicable law, by our board of directors and will depend upon our results of operations, financial condition, capital requirements, regulatory and contractual restrictions, our business and investment strategy and other factors that our board of directors deem relevant.
On April 28, 2009, July 31, 2009, October 30, 2009 and January 29, 2010, our Board of Directors declared a quarterly dividend on the Series A Preferred Stock and Series B Preferred Stock in amounts of $4.0 million and $3.7 million, respectively, in each period. These dividends had a record date of May 1, 2009, August 5, 2009, November 5, 2009 and February 5, 2010 and were paid on May 14, 2009, August 17, 2009, November 13, 2009 and February 16, 2010, respectively.
Contractual Obligations
The following table provides a summary of our contractual obligations as of March 31, 2010:
| PAYMENTS DUE BY PERIOD (in thousands) | |||||||||||||||
| Total | Less than 1 year |
1-3 years | 4-5 years | More than 5 years | |||||||||||
| Operating Lease Obligations (1) |
$ | 257,110 | $ | 33,013 | $ | 40,740 | $ | 46,152 | $ | 137,206 | |||||
| Liquidity Facility (2) |
304,199 | — | 304,199 | — | — | ||||||||||
| Convertible Notes (3) |
721,600 | — | 55,350 | 36,900 | 629,350 | ||||||||||
| Uncertain tax positions |
21,950 | 2,807 | 18,493 | — | 650 | ||||||||||
| $ | 1,304,859 | $ | 35,820 | $ | 418,782 | $ | 83,052 | $ | 767,206 | ||||||
| (1) | We have operating lease arrangements with unaffiliated parties for the use of certain office facilities, equipment, and computer hardware. Under certain circumstances, payments may be escalated. |
| (2) | We have a revolving credit facility in an aggregate principal amount of up to $1,500.0 million. Included in the revolving credit facility is our interest obligation calculated using thirty-day LIBOR of 0.23388% at March 31, 2010 plus a margin of 0.40% per annum. On December 16, 2009, we repaid $200.0 million of the outstanding balance with excess and available cash. See Note 9 to our audited consolidated and combined financial statements for further details. |
| (3) | We have 9.00% Convertible Notes in an aggregate principal amount of $205.0 million, due 2038. Included in the Convertible Notes is our interest obligation calculated using 9.00% per annum. See Note 9 to our audited consolidated and combined financial statements for further details. |
Off-Balance Sheet Arrangements and Risk
We are a member of various exchanges and clearing organizations. Under the standard membership agreement, members are required to guarantee the performance of other members and, accordingly, if another member becomes unable to satisfy its obligations to the exchange, all other members would be required to meet the shortfall. Our liability under these arrangements is not quantifiable and could exceed the cash and securities we have posted as collateral. However, management
77
Table of Contents
believes that the potential for us to be required to make payments under these arrangements is remote. Accordingly, no contingent liability is carried in the accompanying consolidated balance sheets for these arrangements.
Our client financing and securities settlement activities require us to pledge client securities as collateral in support of various secured financing sources, such as securities loaned. In the event the counterparty is unable to meet its contractual obligation to return client securities pledged as collateral, we may be exposed to the risk of acquiring securities at prevailing market prices in order to satisfy our client obligations. We control this risk by monitoring the market value of securities pledged on a daily basis and by requiring adjustments of collateral levels in the event of excess market exposure. In addition, we establish counterparty limits for such activities and monitor compliance on a daily basis.
In the normal course of business, our client activities involve the execution, settlement and financing of various client transactions. These activities may expose us to off-balance sheet risk in the event our client or the other broker is unable to fulfill its contracted obligations and we have to purchase or sell the financial instrument underlying the contract at a loss. The risk of default depends on the creditworthiness of the counterparty or issuer of the instrument. It is our policy to review, as necessary, the credit standing of each counterparty with which we conduct business. See “Liquidity and Capital Resources—Credit Facilities and Sources of Liquidity” above for discussions of letters of credit issued to our clients.
Critical Accounting Estimates
The preparation of our audited consolidated and combined financial statements requires us to make estimates and assumptions that affect the reported amounts of assets and liabilities and disclosure of contingent assets and liabilities at the date of our audited consolidated and combined financial statements and on the reported amounts of revenues and expenses during the reporting period. We base our estimates and assumptions on historical experience and on various other factors that we believe are reasonable under the circumstances. We consider these accounting estimates to be critical because changes in underlying assumptions or estimates could have the potential to materially impact our financial statements. For example, if factors such as those described in “Item 1A. Risk Factors” cause actual events to differ from the assumptions we used in applying the accounting policies, our results of operations, financial condition and liquidity could be materially adversely affected.
Our significant accounting policies are summarized in Note 2 to our consolidated and combined financial statements. We believe that certain of these policies are critical because they are important to the presentation of our financial condition and results. On an ongoing basis, we evaluate our estimates and assumptions, particularly as they relate to accounting policies that we believe are most important to the presentation of our financial condition and results of operations. We regard an accounting estimate or assumption to be most important to the presentation of our financial condition and results of operations where the nature of the estimate or assumption is material due to the level of subjectivity and judgment necessary to account for highly uncertain matters or the susceptibility of such matters to change; and the impact of the estimate or assumption on our financial condition or operating performance is material.
Intangible Assets, Net
Our intangible assets represent the cash we paid in a business acquisition for the purchase of customer relationships, technology assets, and trade names. We amortize finite-lived intangible assets over their estimated useful lives on a straight-line basis, which range from 4 to 14 years, unless the economic benefits of the intangible are otherwise impaired. We review our intangible assets at least annually for impairment or whenever events or changes in circumstances indicate that the carrying amounts may not be recoverable. If the cash flows supporting our intangible assets deteriorate this could increase the likelihood of us reporting an impairment charge.
Allowance for Doubtful Accounts
Our receivables are generally collateralized with marketable securities. Our allowance for doubtful accounts is based upon management’s continuing review and evaluation of relevant factors, such as collateral value, aging and the financial condition of our clients. The allowance is assessed to reflect our best estimate of probable losses that have been incurred as of the balance sheet date. Any changes are included in the current period operating results. In circumstances where a specific client’s inability to meet its financial obligation is known, we record a specific provision for bad debts against amounts due to reduce the receivable to the amount we reasonably believe will be collected.
78
Table of Contents
Although these reserves have been adequate historically, the default of a large client or prolonged period of weakness in global financial markets could adversely affect the ability of our clients to meet their obligations.
Income Taxes
In the normal course of business, we enter into transactions for which the tax treatment is unclear or subject to varying interpretations. In addition, filing requirements, methods of filing, and the calculation of taxable income in various federal, state and local, and international jurisdictions are subject to different interpretations.
We evaluate and assess the relative risks and merits of the appropriate tax treatment of transactions, filing positions, filing methods, and taxable income calculations after considering statutes, regulations, judicial precedent, and other information, and maintain tax accruals consistent with our evaluation of these relative risks and merits. The result of the evaluation and the assessment is, by nature, an estimate. We are routinely subject to audit and challenges from taxing authorities. If a tax audit or challenge results in an additional tax, penalties, or interest different than amounts previously accrued, we accrue the difference in the period in which the matter concludes.
In certain jurisdictions, we have generated pre-tax losses that, in accordance with applicable tax law, we expect to be able to carry forward and offset against future profits to reduce relevant taxes going forward. We have recorded significant deferred tax assets reflecting our expectation of using these loss carryforwards against future income. If we are not able to generate profits in these jurisdictions in future periods, we may be required to record valuations allowances against these deferred tax assets. Recording valuation allowances against these deferred tax assets could have a significant adverse impact on our financial results.
Legal and Regulatory Reserves
In the ordinary course of business, we have been named as a defendant in a number of legal and regulatory proceedings. We estimate potential losses that may arise out of legal and regulatory proceedings and recognize liabilities for such contingencies to the extent such losses are probable and the amount of loss can be reasonably estimated. We review outstanding claims with internal and external counsel to assess probability and estimates of loss. We reassess the risk of loss as new information becomes available, and reserves are adjusted, as appropriate. Any future increases to our loss contingency reserves or releases from these reserves may affect our results of operations.
Fair Value of Financial Instruments
Financial instruments and related revenues and expenses are recorded in the consolidated and combined financial statements on a trade-date basis. Financial instruments include related accrued interest or dividends. Market value generally is based on published market prices or other relevant factors, including dealer price quotations. Substantially all of our financial instruments are recorded at fair value or contract amounts that approximate fair value. The fair value of a financial instrument is determined using external market quotations or the estimated amount at which the instrument could be exchanged in a current transaction between willing parties, other than in a forced or liquidation sale. Management estimates that the aggregate fair value of financial instruments recognized on the consolidated balance sheets, including receivables, payables, accrued expenses and subordinated borrowings, approximates their fair value, as such financial instruments are short-term in nature, bear interest at current market rates or are subject to frequent fair value repricing.
Commissions
Commission revenues are recorded on a trade-date basis as client transactions occur. Fees are charged at various rates based on the product traded and the method of trade. Commissions consist of income charged for executing trades for counterparties that have clearing accounts with other brokers or institutions and also commissions earned from clients with clearing accounts with us.
Principal Transactions
Revenues from matched-principal transactions are recorded in principal transactions in the consolidated and combined statements of operations. For these activities, a commission is not separately billed to the client; instead a commission equivalent amount is included in the transaction revenues following execution on behalf of the client.
79
Table of Contents
Principal transactions are recorded on the trade date. Profits and losses arising from transactions entered into for our account and risk are recorded on a trade-date basis.
Fair Value of Financial Instruments
We carry a significant portion of our assets and liabilities at fair value. These assets and liabilities consist of financial instruments, including cash and derivative products, and primarily represent our investment, trading, financing and customer facilitation activities. Financial instruments are recorded in the financial statements on a trade-date basis and they include related accrued interest or dividends. Changes in the fair value of financial instruments are recognized in earnings within Principal transactions in our consolidated and combined statements of operations.
We adopted the provisions under ASC 820, Fair Value Measurements and Disclosures (“ASC 820”) as of April 1, 2008. Fair value is defined as the price that would be received to sell an asset or paid to transfer a liability in an orderly transaction between market participants at the measurement date, or an “exit” price. We mark our financial instruments based on quoted market prices, where applicable. Based on market convention we mark our financial instruments based on product class which is generally bid or mid price. If listed prices or quotes are not available, we determine fair value based on comparable market transactions, executable broker quotes, or independent pricing sources with reasonable levels of price transparency. Fair value measurements are not adjusted for transaction costs.
Credit risk is a component of fair value and represents the loss we would incur if a counterparty or an issuer of securities or other instruments we hold fails to perform under its contractual obligations to us, or upon a deterioration in the credit quality of third parties whose securities or other instruments, including OTC derivatives, we hold. To reduce our credit exposures in our operating activities, we generally enter into agreements with our counterparties that permit us to offset receivables and payables with such counterparties and obtain margin and/or collateral from the counterparty on an upfront and ongoing basis. We monitor and manage our credit exposures daily. We consider the impact of counterparty credit risk in the valuation of our assets and our own credit risk in the valuation of our liabilities that are presented at fair value.
Financial instruments are categorized into a three-level valuation hierarchy for disclosure of fair value measurements, as further discussed in Note 19. The hierarchy gives the highest priority to unadjusted quoted prices in active markets for identical assets or liabilities (Level 1 measurements) and the lowest priority to unobservable inputs (Level 3 measurements). A market is active if there are sufficient transactions on an ongoing basis to provide current pricing information for the asset or liability, pricing information is released publicly, and price quotations do not vary substantially either over time or among market makers. Observable inputs reflect the assumptions market participants would use in pricing the asset or liability based on market data obtained from sources independent of the reporting entity. The fair value hierarchy is based on the observability of inputs in the valuation of an asset or liability at the measurement date. In determining the appropriate fair value hierarchy levels, we perform a detailed analysis of our assets and liabilities. At each reporting period, all assets and liabilities for which the fair value measurement is based on significant unobservable inputs are classified as Level 3. The three levels are described as follows:
Level 1—Unadjusted quoted prices in active markets that are accessible at the measurement date for identical, unrestricted assets or liabilities. Level 1 consists of financial instruments whose fair values are determined using quoted market prices.
Level 2—Quoted prices for identical or similar assets or liabilities in markets that are less active, that is, markets in which there are few transactions for the asset or liability that are observable for substantially the full term. Included in Level 2 are those financial instruments for which fair values are estimated using models or other valuation methodologies. These models are primarily industry-standard models utilizing various observable inputs, including time value, yield curve, volatility factors, observable current market and contractual prices for the underlying financial instruments, as well as other relevant economic measures.
Level 3—Prices or valuation techniques that require inputs that are both significant to the fair value measurement and unobservable (i.e., supported by little or no market activity). Level 3 is comprised of financial instruments whose fair value is estimated using internally developed models or methodologies utilizing significant inputs that are not readily observable from objective sources.
Refer to Note 19, Fair Value Measurements and Derivative Activity, for the analysis prepared as of March 31, 2010.
80
Table of Contents
Recent Accounting Pronouncements
In February 2010, the Financial Accounting Standards Board (“FASB”) issued Accounting Standards Update (“ASU”) No. 2010-10, Consolidation—Amendments for Certain Investment Funds (“ASU No. 2010-10”). ASU No. 2010-10 indefinitely defers the effective date of the updated VIE accounting guidance for certain investment funds. To qualify for the deferral, the investment fund needs to meet certain attributes of an investment company, does not have explicit or implicit obligations to fund losses of the entity and is not a securitization entity, an asset-backed financing entity, or an entity formerly considered a qualifying special-purpose entity. ASU No. 2010-10 will be effective for us in the first quarter of fiscal 2011. We are currently assessing the impact to our consolidated financial statements.
In January 2010, the FASB issued ASU No. 2010-06, Fair Value Measurements and Disclosures (“ASU No. 2010-06”). The guidance in ASU No. 2010-06 provides amendments to ASC 820 that requires a reporting entity to disclose separately the amounts of significant transfers in and out of Level 1 and Level 2 fair value measurements and describe the reasons for the transfers. In addition, with regards to Level 3 assets, ASU No. 2010-06 now requires that a reporting entity should present separately information about purchases, sales, issuances and settlements on a gross basis in the reconciliation for fair value measurements using significant unobservable inputs (Level 3). We adopted the new disclosures and clarifications of existing disclosures in the fourth quarter of fiscal 2010. We will adopt the disclosures about purchases, sales, issuances, and settlements in the roll-forward of activity in Level 3 fair value measurements in the first quarter of fiscal 2012.
In September 2009, the FASB issued ASU No. 2009-12, Investments in Certain Entities That Calculate Net Asset Value per Share (or Its Equivalent) (“ASU No. 2009-12”). The guidance in ASU No. 2009-12 amends certain sections in ASC 820 which discusses accounting for fair value measurements and disclosures. The amendments permit, as a practical expedient, a reporting entity to measure the fair value of an investment that is within the scope of the amendments on the basis of the net asset value per share of the investment (or its equivalent) if the net asset value is calculated in a manner consistent with U.S. GAAP for investment companies as of the reporting entity’s measurement date. The amendments also require disclosures by major category of investment to be determined on the basis of the nature and risks of the investment. We adopted ASU No. 2009-12 in the third quarter of fiscal 2010 with no material impact to our consolidated financial statements.
In August 2009, the FASB issued ASU No. 2009-05, Measuring Liabilities at Fair Value (“ASU No. 2009-05”). ASU No. 2009-05 provides amendments to ASC 820, for the fair value measurement of liabilities. It requires a reporting entity to measure the fair value of a liability using certain valuation techniques when a quoted price in an active market for the identical liability is not available. A reporting entity is not required to include a separate input or adjustment relating to the existence of a restriction that prevents the transfer of a liability when fair valuing that liability. The amendments in ASU No. 2009-05 also clarify the hierarchy of the fair value measurements to be used for a quoted price in an active market for the identical liability at the measurement date as well as for the quoted price for the identical liability when traded as an asset in an active market when no adjustments to the quoted price of the asset are required. We adopted ASU No. 2009-05 in the third quarter of fiscal 2010 and there was no material impact on our consolidated financial statements upon adoption.
In June 2009, the FASB issued Statements of Financial Accounting Standards (“SFAS”) No. 168, The FASB Accounting Standards Codification and the Hierarchy of Generally Accepted Accounting Principles—a replacement of FASB Statement No. 162, which was superseded by ASC 105. In September 2009, the FASB also issued ASU No. 2009-01, Topic 105—Generally Accepted Accounting Principles—amendments based on—Statement of Financial Accounting Standards No. 168—The FASB Accounting Standards Codification and the Hierarchy of Generally Accepted Accounting Principles (“ASU No. 2009-01”). ASC 105 and ASU No. 2009-01 established the FASB Accounting Standards Codification as the single source of authoritative U.S. GAAP recognized by the FASB to be applied by non-governmental entities. Rules and interpretive releases of the SEC under authority of federal securities laws are also sources of authoritative GAAP for SEC registrants. On the effective date, the Codification superseded all then-existing, non-SEC accounting and reporting standards. All other non-grandfathered, non-SEC accounting literature not included in ASC 105 and ASU No. 2009-01 became non-authoritative. ASC 105 and ASU No. 2009-01 are effective for financial statements issued for interim and annual periods ending after September 15, 2009. We adopted ASC 105 and ASU No. 2009-01 in the second quarter of fiscal 2010 and made reference to accounting and reporting standards on our consolidated financial statements in accordance with ASC 105 and ASU No. 2009-01 upon adoption.
In June 2009, the FASB issued SFAS No. 167, Amendments to FASB Interpretation No. 46(R) which was codified and superseded by ASU 2009-17 (“ASU No. 2009-17”) in December 2009. ASU No. 2009-17 requires an enterprise to determine the primary beneficiary (or “consolidator”) of a variable-interest entity (“VIE”) based on whether the entity (1) has the power to direct matters that most significantly impact the activities of the VIE, and (2) has the obligation to absorb losses or the right to
81
Table of Contents
receive benefits of the VIE that could potentially be significant to the VIE. ASU No. 2009-17 changes the consideration of kick-out rights in determining if an entity is a VIE which may cause certain additional entities to now be considered VIEs. On January 27, 2010, the FASB agreed to finalize ASU Amendments to Statement 167 for Certain Investment Funds to indefinitely defer consolidation requirements for a reporting enterprise’s interest in certain entities and for certain money market mutual funds under ASU No. 2009-17. The ASU will also amend guidance that addresses whether fee arrangements represent a variable interest for all decision-makers and service-providers. ASU No. 2009-17 will be effective for us in the first quarter of fiscal 2011. We do not expect a material impact on our consolidated financial statements upon adoption.
In June 2009, the FASB issued SFAS No. 166, Accounting for Transfers of Financial Assets—an amendment of FASB Statement No. 140 which was codified and superseded by ASU No. 2009-16 (“ASU No. 2009-16”) in December 2009. ASU No. 2009-16 aims to improve the visibility of off-balance sheet vehicles currently exempt from consolidation and addresses practical issues involving the accounting for transfers of financial assets as sales or secured borrowings. ASU No. 2009-16 also introduces the concept of a “participating interest,” which will limit the circumstances where the transfer of a portion of a financial asset will qualify as a sale, assuming all other derecognition criteria are met. Furthermore, it clarifies and amends the derecognition criteria for determining whether a transfer qualifies for sale accounting. ASU No. 2009-16 is effective as of the beginning of an entity’s first annual reporting period beginning after November 15, 2009. We will adopt ASU No. 2009-16 in the first quarter of fiscal year 2011 and do not expect a material impact on our consolidated financial statements upon adoption.
In June 2008, the FASB issued FASB Staff Position No. EITF 03-6-1, Determining Whether Instruments Granted in Share-Based Payment Transactions Are Participating Securities, which was superseded by ASC 260-10-45 (“ASC 260-10-45”). The guidance in ASC 260-10-45 applies to the calculation of earnings per share for share-based payment awards with rights to dividends or dividend equivalents. It clarifies that unvested share-based payment awards that contain nonforfeitable rights to dividends or dividend equivalents (whether paid or unpaid) are participating securities and shall be included in the computation of earnings per share pursuant to the two-class method. ASC 260-10-45 is effective for financial statements issued for fiscal years beginning after December 15, 2008. We adopted ASC 260-10-45 in the first quarter of fiscal 2010 with no material impact to our consolidated financial statements.
In May 2008, the FASB issued Staff Position No. APB 14-1, Accounting for Convertible Debt Instruments That May Be Settled in Cash upon Conversion (Including Partial Cash Settlement), which was superseded by ASC 470-20. ASC 470-20 specifies that issuers of convertible debt instruments that may be settled in cash upon conversion should separately account for the liability and equity components in a manner that will reflect the entity’s nonconvertible debt borrowing rate when interest cost is recognized in subsequent periods. We adopted ASC 470-20 in the first quarter of fiscal 2010. See Note 1 for further details on the impact of adoption.
In December 2007, the FASB issued SFAS No. 160, Noncontrolling Interests in Consolidated Financial Statements—An Amendment of ARB No. 51, which was superseded by certain sections in ASC 810. ASC 810 establishes accounting and reporting standards for the noncontrolling interest in a subsidiary and for the deconsolidation of a subsidiary. We adopted the guidance in the first quarter of fiscal 2010. See Note 1 for further details on the impact of adoption.
82
Table of Contents
| ITEM 7A. | QUANTITATIVE AND QUALITATIVE DISCLOSURES ABOUT MARKET RISK |
We are exposed to numerous risks in the ordinary course of our business; therefore, effective risk management is critical to the success of our business. We have a comprehensive risk management structure and processes to monitor, evaluate and manage the principal risks we assume in conducting our business. The principal risks we face include:
| • | market risk; |
| • | credit risk; |
| • | capital risk; |
| • | liquidity risk; and |
| • | operational risk. |
Market Risk
Market risk is defined as the risk of loss that arises from fluctuations in values of, or income from, assets and liabilities as a result of movement in market rates or prices.
We are exposed to a degree of market risk inherent in conducting our business and managing the assets and liabilities of our global operations, including interest rate and foreign exchange risk and, to a lesser extent, equity and commodity risk.
Interest rate risk arises from the possibility that changes in interest rates will affect the value of financial instruments that we hold. We are exposed to interest rate risk on various forms of debt that we owe; client cash and margin balances and positions we carry in fixed income securities, equity securities, options and futures. To manage the assets and liabilities of our company and related interest obligations, we invest in various financial instruments in accordance with our internal investment policy. Any changes in interest rates can adversely change our interest income relative to our interest expenses. For further information related to our hedging activities, see Note 2 to our consolidated and combined financial statements.
Currency risk arises from the possibility that fluctuations in foreign exchange rates will impact the value of financial instruments and the value of our assets located outside of the United States. We are exposed to foreign exchange rates because we must keep part of our assets and liabilities in foreign currencies to meet operational, regulatory and other obligations of our non-U.S. operations.
Our revenues and expenses are denominated primarily in U.S. dollars, British pounds and Euros. The largest percentage of our revenues is denominated in U.S. dollars, while a large portion of our non-U.S. dollar expenses is denominated in British pounds. As a result, our earnings can be affected by changes in the U.S. dollar / British pound and U.S. dollar / Euro exchange rates and to a lesser extent, the U.S. dollar exchange rate with other currencies, including those of the Asia Pacific region. From time to time, we may seek to mitigate our exposures to foreign currency exchange rates through hedging transactions.
The table below shows the approximate increase in our other expenses due to instantaneous 10% adverse currency-exchange rate movements against the U.S. dollar in our major currency exposures for the year-end March 31, 2010:
| Adverse exchange rate movement against the U.S. dollar |
Approximate increase in General and Other expenses (in millions) | |||||
| British pounds |
10 | % | $ | 20.2 | ||
| Euro |
10 | % | $ | 3.4 | ||
| Australian dollar |
10 | % | $ | 2.7 | ||
| Singapore dollar |
10 | % | $ | 2.3 | ||
We are also exposed to market risk from interest rate, foreign exchange, equity and commodity positions taken for our own account to support and facilitate client orders, as well as relative value and other positions taken by the business. The risk associated with these positions is calculated using a value-at-risk methodology.
83
Table of Contents
Value-At-Risk
Value-at-risk is an estimate of the potential loss in value due to adverse market movements over a defined time horizon at a specified confidence level.
We report using a 95% confidence level calibration over a one-day time horizon. The reported value-at-risk indicates a threshold at which the expected loss over one day will not exceed that value more than 5% of the trading days of the year.
The modelling of our principal-position risk characteristics requires a number of assumptions and approximations. While management believes that these assumptions and approximations are reasonable, no standard methodology for estimating value-at-risk exists, and different assumptions and / or approximations could produce materially different value-at-risk estimates.
It is implicit in a value-at-risk methodology that individual positions possess risk characteristics that offset each other, referred to as the diversification benefit. We measure the diversification benefit within our portfolio by applying historical market parameters to simulate how the positions in our current portfolio may behave in relation to each other (as opposed to using a static estimate of a diversification benefit, which remains relatively constant from period to period). Thus, our value-at-risk will vary due to changes in the parameters, positions and diversification benefit across our portfolio of financial instruments.
Value-at-risk measures have inherent limitations, including:
| • | historical market conditions and historical changes in market risk factors may not be accurate predictors of future market conditions or future market risk factors; |
| • | value-at-risk measurements are based on current positions, while future risk depends on future positions; |
| • | value-at-risk measurements are based on a one-day measurement period and do not fully capture the market risk of positions that cannot be liquidated or hedged within one day; and |
| • | value-at-risk is not intended to capture worst-case scenario losses and we could incur losses greater than the value-at-risk amounts reported. |
As of March 31, 2010, our end-of-day value-at-risk for financial positions taken for our own account, estimated at a 95% confidence level over a one-day time horizon, was $2.5 million. This calculation excludes exchange shares, U.S. treasury securities deposited at commodity clearing organizations and investments of segregated client funds.
The table below presents the quarterly average, minimum and maximum trading value-at-risk.
| MARCH 31, 2010 | ||||||||||||
| Risk Categories |
Average | Minimum | Maximum | |||||||||
| (Dollars in thousands) | ||||||||||||
| Commodities |
$ | 521 | $ | 305 | $ | 1,057 | ||||||
| Equities |
161 | 36 | 320 | |||||||||
| Fixed Income |
3,372 | 2,542 | 4,345 | |||||||||
| Foreign Exchange |
154 | 91 | 261 | |||||||||
| Diversification effect (1) |
(814 | ) | (433 | ) | (1,747 | ) | ||||||
| Total |
$ | 3,394 | $ | 2,541 | $ | 4,236 | ||||||
| (1) | Equals the difference between total value-at-risk and the sum of the value-at-risk for the four risk categories. This arises because the market risk categories are not perfectly correlated. |
84
Table of Contents
Credit Risk
Credit risk is the possibility that we may suffer a loss from the failure of clients or counterparties to meet their financial obligations in a timely manner. Our business, acting as both an agent and principal in providing execution and clearing services for listed and OTC transactions, exposes us to credit risk. Sources of our exposure to credit risk are described under “Item 1A. Risk Factors”, and include exposure to:
| • | counterparties with whom we place both our own funds or securities and those of our clients; |
| • | issuers of the securities that we hold for our own account, either directly or indirectly; |
| • | client and counterparty losses arising from adverse market moves that they are unable or unwilling to meet; |
| • | clients and counterparties to whom we extend financing lines; |
| • | clients and counterparties through clearing and settlement operations; |
| • | clients who owe us commissions; and |
| • | credit concentration risks. |
Our exposure to the credit risks associated with our clients’ trading and other activities is measured on an individual counterparty basis, as well as by groups of counterparties that share similar attributes. Our credit exposures arise both in relation to contractual positions that are essentially fixed in amount, such as bank deposits, and also in relation to derivative contracts whose value changes as market prices change. For such derivative contracts, the credit risk does not depend solely on the current value of the contract, but also on the potential value of the exposure (net of any margin held as collateral).
Our default risks include both pre-settlement and settlement risk. Pre-settlement risk is the possibility that, should a counterparty default on its obligations, we could incur a loss when we cover the resulting open position because the market price has moved against us. Settlement risk is the possibility that we may pay or release assets to a counterparty and fail to receive the settlement in turn.
We manage credit risk through various means. Placement risk, the exposure to institutions with which we place our own and client funds, including exchanges, banks, and other financial institutions, represents our largest credit risk. Fund-placement activities include, but are not limited to, posting margins with exchanges and brokers, placing funds directly on deposit with banks, resale agreements, and stock lending / borrowing activities. Agencies in which we hold securities also expose us to issuer-credit risk. We manage placement and issuer risks through institutional, issuer, and concentration limits and via counterparty-creditworthiness assessments. MF Global conducts the same or increased levels of due diligence on the counterparty banks with whom we place clients’ segregated funds as we conduct on banks with whom we place our own and non-segregated funds.
We have an independent global credit function that performs credit reviews of our counterparties and clients. The credit process includes due diligence, financial analyses, reviews of past and intended trading activities, as well as internal-rating assessments. The credit review process also includes assigning counterparty or client level trading and position limits, issuer limits, country limits, and other types of credit limits to control and limit our credit exposure to individual counterparties as well as to credit concentrations. Assigned limits reflect the various elements of assessed credit risk and are revised to correspond with changes in the counterparties’ credit profiles.
For margined transactions, which compose a large portion of our clearing business, our clients are required to maintain margin accounts with collateral to support their open trading positions. Most clients are required to cover initial and variation margin requirements within 24 hours. Although we initially establish each client’s margin requirement at the level set by the respective exchanges, we have the ability to increase the requirements to levels we believe are sufficient to cover each client’s open positions. Our principal client-based credit risk arises when a client’s margin collateral cannot support trading obligations due to the client’s trading activity or adverse market changes. To assess the adequacy of margins in changing market environments, we conduct a variety of stress tests and, if market movements affecting client positions require, we will request intra-day margin calls. We also generally reserve the right to liquidate any client position immediately in the event of a failure to meet a margin call.
When we act as clearing broker, we are responsible to our client for the performance of the other party. The risk that our client’s counterparty may fail to perform as expected is mitigated when we clear through an exchange or clearinghouse because the exchange or clearinghouse becomes the other party to our transaction. If a clearing member defaults on its obligations to an exchange or clearinghouse in an amount larger than its margin and clearing fund deposits, then the shortfall is absorbed pro rata from the deposits of other clearing members. Therefore, if we are a member of a clearinghouse or
85
Table of Contents
exchange, we could incur losses resulting from the defaults of other market participants. Although we set limits to control these exposures at the exchange and clearinghouse, the risk is inherent in our business and is largely controlled and influenced by the regulatory bodies that impose rules on the exchanges and clearinghouses.
In line with market practices, we may grant secured (collateralized) and unsecured financing to some of our clients, subject to various regulatory and internal requirements, to enable clients to post initial and variation margin as well as to provide financing in re- purchase agreement transactions. Generally, the financing lines we provide to clients and counterparties are uncommitted lines that we can rescind at any time and are granted based on supporting information such as client financials, rating, and credit due diligence.
Many of our exposures with clients and counterparties are subject to netting agreements which reduce the net exposure to us.
For execution-only clients, our principal credit risk arises from the potential failure of our clients to pay commissions (“commission risk”). We are also exposed to the risk that a clearing broker may refuse to accept a client’s trade, which would require us to assume the positions and the resulting market risk. In such cases, the positions are reconciled with the broker or liquidated.
In addition to the credit review process, we employ a number of stress-testing and other techniques to closely monitor the market environment and our clients’ risks of default based upon exposures created by their open positions. Monitoring techniques may include:
| • | establishing risk parameters based on analysis of historical prices and product price volatility; |
| • | intra-day and end-of-day risk limit, position, and trade monitoring to identify any accounts trading beyond pre-set limits and parameters; |
| • | market risk analysis and evaluation of adequacy of margin requirements for traded products; and |
| • | intra-day stress analysis for material market moves or accounts with material position taking. |
Regulatory Capital Risk
Various domestic and foreign government regulators, as well as self-regulated organizations (such as exchanges), with supervisory responsibility over our business activities require us to maintain specified minimum levels of regulatory capital in our operating subsidiaries. If not properly monitored and adjusted, our regulatory capital levels could fall below the required minimum amounts set by our regulators, which could expose us to various sanctions ranging from fines and censure to imposing partial or complete restrictions on our ability to conduct business.
To mitigate this risk, we continuously evaluate the levels of regulatory capital at each of our operating subsidiaries and adjust the amounts of regulatory capital as necessary to ensure compliance with all regulatory capital requirements. Regulatory authorities may increase or decrease these requirements from time to time. We also maintain excess regulatory capital to accommodate periods of unusual or unforeseen market volatility, and we intend to continue to follow this policy. In addition, we monitor regulatory developments regarding capital requirements and prepare for increases in the required minimum levels of regulatory capital that may occur in the future.
Liquidity Risk
Cash liquidity risk is the risk that, in the normal course of business, we would be unable to generate cash resources to meet our payment obligations as they arise. Our core business, providing execution and clearing brokerage services, does not generally present a substantial cash liquidity risk; however, we may be exposed to cash liquidity risk under adverse market conditions or unexpected events.
Under adverse market conditions, cash liquidity risk related to our exchange clearing activity may rise to a level where exchanges may require us to satisfy obligations relating to open client positions that exceed the amount of collateral available in our clients’ margin accounts. We seek to mitigate this possibility by observing all relevant exchange margin requirements, and maintaining our own- in many cases more stringent- margin requirements intended to ensure that clients will be able to cover their positions in most reasonably-foreseeable economic environments.
86
Table of Contents
To manage our liquidity risk, we have established a liquidity policy designed to ensure that we maintain access to sufficient, readily available liquid assets and committed liquidity facilities. These facilities are available to both our unregulated and regulated subsidiaries to facilitate meeting our financial obligations as they become due under both normal and adverse market conditions. We also evaluate the impact of adverse market conditions on our liquidity risk and adjust our liquid assets appropriately.
Our policy requires us to have sufficient liquidity to satisfy all of our expected cash needs for at least one year without access to the capital markets. In June 2007, we entered into a $1,500.0 million five-year revolving unsecured credit facility with a syndicate of banks ($1,057.5 million of which is undrawn at March 31, 2010). In October 2008, Lehman Commercial Paper Inc., one of the participating banks of the aforementioned credit facility, with a total commitment amounting to $75.0 million, filed for bankruptcy and, accordingly, we believe Lehman Brothers will not fund the balance of its loan commitment, which is $60.0 million. To support the business’ settlement and intra-day requirements, we also maintain committed and uncommitted credit lines with financial institutions. We anticipate accessing these facilities and credit lines from time to time.
Operational Risk
Operational risk is defined as the risk of loss or other adverse consequence arising from inadequate or failed internal processes, people and systems or from external events. Consistent with our competitors, our operations are exposed to a broad number of these types of risks which could have significant impact on our business. To mitigate operational risks, the Operational Risk Department ensures the application of a globally consistent operational risk management framework. The framework includes firm-wide policies, standards and processes for risk identification, assessment, mitigation and reporting in order to create a more transparent and accountable operational risk environment.
Operational risk is inherent in each of our businesses, support and control activities; therefore, the primary day-to-day responsibility for managing operational risk rests with these areas. Each area has established processes, systems and controls to manage operational risk and is responsible for reporting incidents, issues, and control and performance metrics. These reports are summarized for senior management and governance committees. Additionally, we consider the inherent operational risk in new products, systems, and business activities as they are developed or modified.
As a diversified financial services firm, we also rely on an extensive technology platform that includes the utilization of vendor services and software as well as internally developed applications. We seek to mitigate our technology exposures through the implementation of standard controls, contractual agreements, and performance monitoring. More broadly, we have an on-going business continuity management program designed to enable the organization to recover and restore business activities in the event of a disaster or other business disruption.
As deemed prudent, we seek to mitigate the financial effect of certain operational risk events through insurance coverage and may hold economic capital to absorb potential losses.
87
Table of Contents
| ITEM 8. | FINANCIAL STATEMENTS AND SUPPLEMENTARY DATA |
INDEX TO CONSOLIDATED AND COMBINED FINANCIAL STATEMENTS OF MF GLOBAL HOLDINGS LTD.
| Consolidated and Combined Financial Statements as of and for the years ended March 31, 2010, 2009 and 2008: | ||
| Management’s Report on Internal Control over Financial Reporting |
89 | |
| 90 | ||
| 91 | ||
| 92 | ||
| 93 | ||
| 95 | ||
| 96 | ||
| 97 |
88
Table of Contents
MANAGEMENT’S REPORT ON INTERNAL CONTROL OVER FINANCIAL REPORTING
Management of MF Global Holdings Ltd. together with its consolidated subsidiaries (the “Company”), is responsible for establishing and maintaining adequate internal control over financial reporting.
The Company’s internal control over financial reporting is a process designed under the supervision of the Company’s principal executive and principal financial officers to provide reasonable assurance regarding the reliability of financial reporting and the preparation of the Company’s consolidated financial statements for external reporting purposes in accordance with accounting principles generally accepted in the United States of America.
The Company’s internal control over financial reporting includes policies and procedures that pertain to the maintenance of records that, in reasonable detail, accurately and fairly reflect transactions and dispositions of assets; provide reasonable assurances that transactions are recorded as necessary to permit preparation of consolidated financial statements in accordance with accounting principles generally accepted in the United States of America, and that receipts and expenditures are being made only in accordance with authorizations of management and the directors of the Company; and provide reasonable assurance regarding prevention or timely detection of unauthorized acquisition, use or disposition of the Company’s assets that could have a material effect on our financial statements.
Because of its inherent limitations, internal control over financial reporting may not prevent or detect misstatements. In addition, projections of any evaluation of effectiveness to future periods are subject to the risk that controls may become inadequate because of changes in conditions or that the degree of compliance with the policies or procedures may deteriorate.
Management conducted an assessment of the effectiveness of the Company’s internal control over financial reporting as of March 31, 2010 based on the framework established in Internal Control—Integrated Framework issued by the Committee of Sponsoring Organizations of the Treadway Commission. Based on this assessment, management has determined that the Company’s internal control over financial reporting as of March 31, 2010 was effective and that there were no material weaknesses in the Company’s internal control over financial reporting as of that date.
The Company’s internal control over financial reporting as of March 31, 2010 has been audited by PricewaterhouseCoopers LLP, an independent registered public accounting firm, as stated in their report included within, which expresses an unqualified opinion on the effectiveness of the Company’s internal control over financial reporting as of March 31, 2010.
89
Table of Contents
REPORT OF INDEPENDENT REGISTERED PUBLIC ACCOUNTING FIRM
To the Board of Directors and Shareholders of
MF Global Holdings Ltd.:
In our opinion, the accompanying consolidated balance sheets and the related consolidated and combined statements of operations, comprehensive income, changes in equity, and cash flows present fairly, in all material respects, the financial position of MF Global Holdings Ltd. and its subsidiaries (the “Company”) at March 31, 2010 and 2009, and the results of their operations and their cash flows for each of the three years in the period ended March 31, 2010 in conformity with accounting principles generally accepted in the United States of America. Also in our opinion, the Company maintained, in all material respects, effective internal control over financial reporting as of March 31, 2010, based on criteria established in Internal Control—Integrated Framework issued by the Committee of Sponsoring Organizations of the Treadway Commission (COSO). The Company’s management is responsible for these financial statements, for maintaining effective internal control over financial reporting and for its assessment of the effectiveness of internal control over financial reporting, included in the accompanying “Management’s Report on Internal Control over Financial Reporting.” Our responsibility is to express opinions on these financial statements and on the Company’s internal control over financial reporting based on our audits (which were integrated audits in fiscal 2010 and 2009). We conducted our audits in accordance with the standards of the Public Company Accounting Oversight Board (United States). Those standards require that we plan and perform the audits to obtain reasonable assurance about whether the financial statements are free of material misstatement and whether effective internal control over financial reporting was maintained in all material respects. Our audits of the financial statements included examining, on a test basis, evidence supporting the amounts and disclosures in the financial statements, assessing the accounting principles used and significant estimates made by management, and evaluating the overall financial statement presentation. Our audit of internal control over financial reporting included obtaining an understanding of internal control over financial reporting, assessing the risk that a material weakness exists, and testing and evaluating the design and operating effectiveness of internal control based on the assessed risk. Our audits also included performing such other procedures as we considered necessary in the circumstances. We believe that our audits provide a reasonable basis for our opinions.
A company’s internal control over financial reporting is a process designed to provide reasonable assurance regarding the reliability of financial reporting and the preparation of financial statements for external purposes in accordance with generally accepted accounting principles. A company’s internal control over financial reporting includes those policies and procedures that (i) pertain to the maintenance of records that, in reasonable detail, accurately and fairly reflect the transactions and dispositions of the assets of the company; (ii) provide reasonable assurance that transactions are recorded as necessary to permit preparation of financial statements in accordance with generally accepted accounting principles, and that receipts and expenditures of the company are being made only in accordance with authorizations of management and directors of the company; and (iii) provide reasonable assurance regarding prevention or timely detection of unauthorized acquisition, use, or disposition of the company’s assets that could have a material effect on the financial statements.
Because of its inherent limitations, internal control over financial reporting may not prevent or detect misstatements. Also, projections of any evaluation of effectiveness to future periods are subject to the risk that controls may become inadequate because of changes in conditions, or that the degree of compliance with the policies or procedures may deteriorate.
/s/ PricewaterhouseCoopers LLP
New York, New York
May 27, 2010
90
Table of Contents
MF GLOBAL HOLDINGS LTD.
CONSOLIDATED AND COMBINED STATEMENTS OF OPERATIONS
(Dollars in thousands, except share data)
| YEAR ENDED MARCH 31, | ||||||||||||
| 2010 | 2009 | 2008 | ||||||||||
| Revenues |
||||||||||||
| Commissions |
$ | 1,386,044 | $ | 1,642,380 | $ | 2,014,834 | ||||||
| Principal transactions |
225,442 | 287,652 | 281,912 | |||||||||
| Interest income |
491,605 | 872,330 | 3,669,020 | |||||||||
| Other |
42,351 | 112,449 | 54,081 | |||||||||
| Total revenues |
2,145,442 | 2,914,811 | 6,019,847 | |||||||||
| Interest and transaction-based expenses: |
||||||||||||
| Interest expense |
288,044 | 495,131 | 3,165,247 | |||||||||
| Execution and clearing fees |
601,800 | 741,003 | 927,369 | |||||||||
| Sales commissions |
240,579 | 252,011 | 290,972 | |||||||||
| Total interest and transaction-based expenses |
1,130,423 | 1,488,145 | 4,383,588 | |||||||||
| Revenues, net of interest and transaction-based expenses |
1,015,019 | 1,426,666 | 1,636,259 | |||||||||
| Expenses |
||||||||||||
| Employee compensation and benefits (excluding non-recurring IPO awards) |
672,961 | 796,191 | 896,694 | |||||||||
| Employee compensation related to non-recurring IPO awards |
31,827 | 44,819 | 59,131 | |||||||||
| Communications and technology |
118,589 | 122,611 | 118,732 | |||||||||
| Occupancy and equipment costs |
39,390 | 44,830 | 35,622 | |||||||||
| Depreciation and amortization |
55,090 | 57,841 | 54,820 | |||||||||
| Professional fees |
82,147 | 90,367 | 74,576 | |||||||||
| General and other |
114,638 | 100,614 | 108,334 | |||||||||
| PAAF legal settlement |
— | — | 76,814 | |||||||||
| Broker-related loss |
— | — | 141,045 | |||||||||
| IPO-related costs |
894 | 23,117 | 56,133 | |||||||||
| Impairment of intangible assets and goodwill |
53,980 | 82,028 | — | |||||||||
| Refco integration costs |
— | 727 | 2,709 | |||||||||
| Total other expenses |
1,169,516 | 1,363,145 | 1,624,610 | |||||||||
| Gains on exchange seats and shares |
8,493 | 15,054 | 79,519 | |||||||||
| Loss on extinguishment of debt |
9,682 | — | 18,268 | |||||||||
| Interest on borrowings |
39,726 | 68,626 | 69,301 | |||||||||
| (Loss)/income before provision for income taxes |
(195,412 | ) | 9,949 | 3,599 | ||||||||
| (Benefit)/provision for income taxes |
(56,343 | ) | 41,877 | 66,587 | ||||||||
| Equity in income/(loss) of unconsolidated companies (net of tax) |
3,791 | (16,154 | ) | (1,683 | ) | |||||||
| Net loss |
(135,278 | ) | (48,082 | ) | (64,671 | ) | ||||||
| Net income attributable to noncontrolling interest (net of tax) |
1,691 | 976 | 4,871 | |||||||||
| Net loss applicable to MF Global Holdings Ltd. |
$ | (136,969 | ) | $ | (49,058 | ) | $ | (69,542 | ) | |||
| Dividends declared on preferred stock |
30,713 | 18,594 | — | |||||||||
| Cumulative and participating dividends |
— | 2,033 | — | |||||||||
| Net loss applicable to common share holders |
$ | (167,682 | ) | $ | (69,685 | ) | $ | (69,542 | ) | |||
| Loss per share (see Note 12): |
||||||||||||
| Basic |
$ | (1.36 | ) | $ | (0.58 | ) | $ | (0.60 | ) | |||
| Diluted |
$ | (1.36 | ) | $ | (0.58 | ) | $ | (0.60 | ) | |||
| Weighted average number of shares of common stock outstanding: |
||||||||||||
| Basic |
123,222,780 | 121,183,447 | 115,027,797 | |||||||||
| Diluted |
123,222,780 | 121,183,447 | 115,027,797 | |||||||||
The accompanying notes are an integral part of these financial statements.
91
Table of Contents
MF GLOBAL HOLDINGS LTD.
(Dollars in thousands, except share data)
| MARCH 31, | ||||||||
| 2010 | 2009 | |||||||
| Assets |
||||||||
| Cash and cash equivalents |
$ | 826,227 | $ | 639,183 | ||||
| Restricted cash and segregated securities |
9,693,927 | 9,670,494 | ||||||
| Securities purchased under agreements to resell (including $14,825,760 and $0 at fair value, respectively) |
22,125,430 | 12,902,670 | ||||||
| Securities borrowed (including $1,004,017 and $0 at fair value, respectively) |
3,918,553 | 8,624,906 | ||||||
| Securities received as collateral |
52,185 | 54,488 | ||||||
| Securities owned ($8,357,551 and $3,202,430 pledged, respectively) |
10,320,139 | 3,605,908 | ||||||
| Receivables: |
||||||||
| Brokers, dealers and clearing organizations |
3,317,789 | 2,473,341 | ||||||
| Customers (net of allowances of $31,371 and $24,585 respectively) |
292,110 | 415,532 | ||||||
| Affiliates |
— | 95 | ||||||
| Other |
44,418 | 36,884 | ||||||
| Memberships in exchanges, at cost (market value of $19,285 and $19,375, respectively) |
6,262 | 6,370 | ||||||
| Furniture, equipment and leasehold improvements, net |
72,961 | 62,717 | ||||||
| Intangible assets, net |
73,359 | 151,688 | ||||||
| Other assets |
222,720 | 191,359 | ||||||
| TOTAL ASSETS |
50,966,080 | 38,835,635 | ||||||
| Liabilities and Equity |
||||||||
| Short-term borrowings, including current portion of long-term borrowings |
142,867 | 148,835 | ||||||
| Securities sold under agreements to repurchase (including $9,281,426 and $0 at fair value, respectively) |
29,079,743 | 14,271,698 | ||||||
| Securities loaned |
989,191 | 5,951,679 | ||||||
| Obligation to return securities borrowed |
52,185 | 54,488 | ||||||
| Securities sold, not yet purchased, at fair value |
4,401,449 | 2,884,591 | ||||||
| Payables: |
||||||||
| Brokers, dealers and clearing organizations |
2,240,731 | 1,077,379 | ||||||
| Customers |
11,997,852 | 11,766,390 | ||||||
| Affiliates |
— | 1,602 | ||||||
| Accrued expenses and other liabilities |
197,074 | 293,207 | ||||||
| Long-term borrowings |
499,389 | 938,007 | ||||||
| TOTAL LIABILITIES |
49,600,481 | 37,387,876 | ||||||
| Commitments and contingencies (Note 15) |
||||||||
| Preferred stock, $1.00 par value per share; 200,000,000 shares authorized; |
||||||||
| 1,500,000 Series A Convertible, issued and outstanding, cumulative |
96,167 | 96,167 | ||||||
| 1,500,000 Series B Convertible, issued and outstanding, non-cumulative |
128,035 | 128,035 | ||||||
| EQUITY |
||||||||
| Common stock, $1.00 par value per share; 1,000,000,000 shares authorized, 121,698,729 and 120,723,046 shares issued and outstanding, respectively |
121,699 | 120,723 | ||||||
| Treasury stock |
(219 | ) | (97 | ) | ||||
| Receivable from shareholder |
(29,779 | ) | (29,779 | ) | ||||
| Additional paid-in capital |
1,367,948 | 1,335,449 | ||||||
| Accumulated other comprehensive loss (net of tax) |
(5,752 | ) | (24,015 | ) | ||||
| Accumulated deficit |
(328,466 | ) | (191,497 | ) | ||||
| Noncontrolling interest |
15,966 | 12,773 | ||||||
| TOTAL EQUITY |
1,141,397 | 1,223,557 | ||||||
| TOTAL LIABILITIES AND EQUITY |
$ | 50,966,080 | $ | 38,835,635 | ||||
The accompanying notes are an integral part of these financial statements.
92
Table of Contents
MF GLOBAL HOLDINGS LTD.
CONSOLIDATED AND COMBINED STATEMENTS OF CASH FLOWS
(Dollars in thousands, except share data)
| YEAR ENDED MARCH 31, | ||||||||||||
| 2010 | 2009 | 2008 | ||||||||||
| CASH FLOWS FROM OPERATING ACTIVITIES: |
||||||||||||
| Net loss |
$ | (135,278 | ) | $ | (48,082 | ) | $ | (64,671 | ) | |||
| Less: Net income attributable to noncontrolling interest |
1,691 | 976 | 4,871 | |||||||||
| Net loss attributable to MF Global Holdings Ltd. |
$ | (136,969 | ) | $ | (49,058 | ) | $ | (69,542 | ) | |||
| Adjustments to reconcile net income to net cash (used in)/provided by operating activities: |
||||||||||||
| Gains on sale of exchanges seats and shares |
(1,087 | ) | (14,214 | ) | (153,248 | ) | ||||||
| Depreciation and amortization |
55,090 | 57,841 | 54,820 | |||||||||
| Stock-based compensation expense |
64,798 | 80,223 | 103,902 | |||||||||
| Bad debt expense |
9,730 | 19,656 | 150,392 | |||||||||
| Deferred income taxes |
(34,122 | ) | (7,989 | ) | (25,099 | ) | ||||||
| Equity in income of unconsolidated affiliates |
(3,791 | ) | 1,580 | 1,683 | ||||||||
| Dividend received from unconsolidated affiliates |
2,340 | — | — | |||||||||
| Income attributable to noncontrolling interest, net of tax |
1,691 | 976 | 4,871 | |||||||||
| Loss/(gain) on extinguishment of debt |
9,682 | (1,539 | ) | 18,268 | ||||||||
| (Gain)/loss on disposal of furniture, equipment and leasehold improvements |
— | (2 | ) | (338 | ) | |||||||
| Write-down of capitalized professional fees |
— | 1,820 | — | |||||||||
| Employee compensation related to defined benefit plan liability |
— | — | 3,638 | |||||||||
| Loss on cash flow hedges |
— | — | 51,407 | |||||||||
| Amortization of debt issuance costs |
7,897 | 12,073 | — | |||||||||
| Impairment of Equity Investment |
— | 14,574 | — | |||||||||
| Impairment of Intangible assets and goodwill |
53,980 | 82,028 | — | |||||||||
| Decrease/(increase) in operating assets: |
||||||||||||
| Restricted cash and segregated securities |
33,933 | 2,304,468 | (1,832,564 | ) | ||||||||
| Securities purchased under agreements to resell |
(9,222,760 | ) | 119,706 | 2,890,918 | ||||||||
| Securities borrowed |
4,706,436 | (3,975,733 | ) | 194,109 | ||||||||
| Securities owned |
(6,713,687 | ) | 3,764,435 | 3,684,227 | ||||||||
| Receivables: |
||||||||||||
| Brokers, dealers and clearing organizations |
(787,456 | ) | 4,583,645 | (810,151 | ) | |||||||
| Customers |
115,042 | 1,930,717 | (1,687,814 | ) | ||||||||
| Affiliates |
— | 621 | 40,565 | |||||||||
| Other |
(6,991 | ) | 4,101 | 992 | ||||||||
| Other assets |
(10,938 | ) | 51,370 | (68,140 | ) | |||||||
| Increase/(decrease) in operating liabilities: |
||||||||||||
| Securities sold under agreements to repurchase |
14,808,045 | (4,366,334 | ) | 1,763,811 | ||||||||
| Securities loaned |
(4,962,488 | ) | 2,763,525 | (6,919,527 | ) | |||||||
| Securities sold, not yet purchased, at fair value |
1,516,858 | 1,015,552 | (1,509,423 | ) | ||||||||
| Payables: |
||||||||||||
| Brokers, dealers and clearing organizations |
1,162,773 | (5,239,496 | ) | 3,755,345 | ||||||||
| Customers |
126,979 | (3,445,898 | ) | (662,979 | ) | |||||||
| Affiliates |
— | (11,319 | ) | (23,281 | ) | |||||||
| Accrued expenses and other liabilities |
(103,553 | ) | (46,344 | ) | (31,412 | ) | ||||||
| Net cash provided by/(used in) operating activities |
$ | 691,432 | $ | (349,015 | ) | $ | (1,074,570 | ) | ||||
The accompanying notes are an integral part of these financial statements.
93
Table of Contents
MF GLOBAL HOLDINGS LTD.
CONSOLIDATED AND COMBINED STATEMENTS OF CASH FLOWS, continued
(Dollars in thousands, except share data)
| YEAR ENDED MARCH 31, | ||||||||||||
| 2010 | 2009 | 2008 | ||||||||||
| CASH FLOWS FROM INVESTING ACTIVITIES: |
||||||||||||
| Acquisitions, net of $0, $0 and $8,351 cash acquired in 2010, 2009 and 2008, respectively (Note 3) |
$ | (3,364 | ) | $ | (6,653 | ) | $ | (58,468 | ) | |||
| Proceeds from sale of memberships in exchanges |
1,297 | 25,450 | 177,118 | |||||||||
| Purchase of memberships in exchanges |
— | (1,369 | ) | (1,101 | ) | |||||||
| Purchase of furniture, equipment and leasehold improvements |
(32,539 | ) | (33,766 | ) | (28,623 | ) | ||||||
| Proceeds from sale of furniture, equipment and leasehold improvements |
— | 66 | 274 | |||||||||
| Net cash (used in)/provided by investing activities |
(34,606 | ) | (16,272 | ) | 89,200 | |||||||
| CASH FLOWS FROM FINANCING ACTIVITIES: |
||||||||||||
| (Repayment of)/proceeds from bridge financing |
$ | — | $ | (1,400,000 | ) | $ | 1,400,000 | |||||
| (Repayment)/proceeds from other short-term borrowings |
(5,968 | ) | (29,539 | ) | 244,521 | |||||||
| Repayment of private placement notes |
— | — | (472,620 | ) | ||||||||
| Repayment of borrowings from Man Group |
— | — | (927,380 | ) | ||||||||
| (Repayment)/ proceeds from liquidity facility borrowings |
(200,000 | ) | 350,000 | — | ||||||||
| (Repayment)/ proceeds from two-year term facility |
(240,000 | ) | 240,000 | — | ||||||||
| Issuance of convertible notes |
— | 210,000 | — | |||||||||
| Repayment of convertible notes |
— | (3,200 | ) | — | ||||||||
| Payment of debt issuance costs |
(791 | ) | (45,524 | ) | — | |||||||
| Issuance of preferred stock |
— | 300,000 | — | |||||||||
| Preferred stock issuance costs |
— | (75,798 | ) | — | ||||||||
| Proceeds from Recapitalization |
— | — | 516,223 | |||||||||
| Payment of Recapitalization adjustment to Man Group |
— | — | (16,161 | ) | ||||||||
| Proceeds from Man Group for indemnification of tax expense |
— | 3,200 | 54,997 | |||||||||
| Distribution to noncontrolling interest |
— | (828 | ) | (1,145 | ) | |||||||
| Payment to settle interest rate hedge |
— | — | (51,407 | ) | ||||||||
| Payment of dividends on preferred stock |
(30,713 | ) | (18,594 | ) | — | |||||||
| Dividends to Man Group |
— | — | (1,011 | ) | ||||||||
| Net cash (used in)/provided by financing activities |
(477,472 | ) | (470,283 | ) | 746,017 | |||||||
| Effect of exchange rates on cash and cash equivalents |
7,690 | (6,331 | ) | 27,883 | ||||||||
| Increase/(decrease) in cash and cash equivalents |
187,044 | (841,901 | ) | (211,470 | ) | |||||||
| Cash and cash equivalents at beginning of year |
639,183 | 1,481,084 | 1,692,554 | |||||||||
| Cash and cash equivalents at end of year |
$ | 826,227 | $ | 639,183 | $ | 1,481,084 | ||||||
| SUPPLEMENTAL CASH FLOW INFORMATION |
||||||||||||
| Cash paid for interest |
$ | 307,274 | $ | 850,446 | $ | 3,323,564 | ||||||
| Cash paid for income taxes |
$ | 5,897 | $ | 8,589 | $ | 129,707 | ||||||
| SUPPLEMENTAL NON-CASH FLOW INFORMATION |
||||||||||||
| Securities received as collateral |
2,303 | 569,265 | (68,523 | ) | ||||||||
| Obligation to return securities borrowed |
(2,303 | ) | (569,265 | ) | 68,523 | |||||||
| Net distributions to Man Group (1) |
— | — | 139,900 | |||||||||
| Receivable from shareholder |
— | (29,779 | ) | — | ||||||||
| (1) | Represents net non-cash distributions to Man Group for the periods presented resulting from U.S. GAAP and carve-out adjustments and the related tax effects thereof applied to the carve-out accounts of the Company to present the financial statements on a stand-alone basis. |
The accompanying notes are an integral part of these financial statements.
94
Table of Contents
MF GLOBAL HOLDINGS LTD.
CONSOLIDATED AND COMBINED STATEMENT OF CHANGES IN EQUITY
(Dollars in thousands, except share data)
| Common Stock |
Treasury Stock |
Receivable from Shareholder |
Additional paid-in capital |
Accumulated Deficit (Subsequent to Reorganization and Separation) |
Accumulated Other Comprehensive (Loss)/ Income |
Noncontrolling interesting in subsidiaries |
Total Equity | |||||||||||||||||||||||||
| Equity at March 31, 2007 |
$ | 543,256 | ||||||||||||||||||||||||||||||
| Net income prior to Reorganization and Separation |
72,897 | |||||||||||||||||||||||||||||||
| Dividends to Man Group prior to Reorganization and Separation |
(1,011 | ) | ||||||||||||||||||||||||||||||
| Foreign currency translation |
(462 | ) | ||||||||||||||||||||||||||||||
| Change in available for sale securities prior to Reorganization and Separation |
(24,652 | ) | ||||||||||||||||||||||||||||||
| Net distribution to Man Group prior to Reorganization and Separation |
139,900 | |||||||||||||||||||||||||||||||
| Change in noncontrolling interest in subsidiaries |
1,486 | |||||||||||||||||||||||||||||||
| Total Equity prior to Reorganization and Separation |
$ | 731,414 | ||||||||||||||||||||||||||||||
| Issuance of stock as part of Formation and |
||||||||||||||||||||||||||||||||
| Separation |
$ | 103,727 | $ | 620,714 | $ | 6,973 | $ | 731,414 | ||||||||||||||||||||||||
| Effect of Recapitalization |
17,379 | 498,844 | 516,223 | |||||||||||||||||||||||||||||
| Stock repurchased from Man Group |
(1,474 | ) | 1,474 | — | ||||||||||||||||||||||||||||
| Tax indemnification from Man Group as capital contribution |
54,997 | 54,997 | ||||||||||||||||||||||||||||||
| Non cash contribution for Man Group plc equity awards |
1,829 | 1,829 | ||||||||||||||||||||||||||||||
| Stock-based compensation |
103,902 | 103,902 | ||||||||||||||||||||||||||||||
| Net loss following Reorganization and Separation |
$ | (142,439 | ) | (142,439 | ) | |||||||||||||||||||||||||||
| Net income attributable to noncontrolling interest |
4,871 | 4,871 | ||||||||||||||||||||||||||||||
| Foreign currency translation |
$ | 4,239 | 131 | 4,370 | ||||||||||||||||||||||||||||
| Dividend paid to noncontrolling interests |
(1,145 | ) | (1,145 | ) | ||||||||||||||||||||||||||||
| Deferred loss on cash flow hedges (net of $21,077 tax) |
30,330 | 30,330 | ||||||||||||||||||||||||||||||
| Reclassification of deferred loss on cash flow hedges (net of $21,077 tax) |
(30,330 | ) | (30,330 | ) | ||||||||||||||||||||||||||||
| Stock issued |
15 | (15 | ) | — | ||||||||||||||||||||||||||||
| Recapitalization adjustment paid to Man Group |
(16,161 | ) | (16,161 | ) | ||||||||||||||||||||||||||||
| Windfall tax benefit from stock-based compensation |
1,139 | 1,139 | ||||||||||||||||||||||||||||||
| Impact of adoption of ASC 740 |
(990 | ) | (990 | ) | ||||||||||||||||||||||||||||
| Minimum pension liability (net of $512 tax) |
1,845 | 1,845 | ||||||||||||||||||||||||||||||
| Equity at March 31, 2008 |
$ | 119,647 | $ | — | $ | — | $ | 1,265,733 | $ | (142,439 | ) | $ | 6,084 | $ | 10,830 | $ | 1,259,855 | |||||||||||||||
| Stock-based compensation |
80,223 | 80,223 | ||||||||||||||||||||||||||||||
| Net loss attributable to MF Global Holdings Ltd. |
(49,058 | ) | (49,058 | ) | ||||||||||||||||||||||||||||
| Net income attributable to noncontrolling interest |
976 | 976 | ||||||||||||||||||||||||||||||
| Foreign currency translation |
(26,775 | ) | (892 | ) | (27,667 | ) | ||||||||||||||||||||||||||
| Purchase of noncontrolling interest |
2,949 | 2,949 | ||||||||||||||||||||||||||||||
| Disposal of noncontrolling interest |
(1,090 | ) | (1,090 | ) | ||||||||||||||||||||||||||||
| Stock issued |
1,076 | (97 | ) | (1,552 | ) | (573 | ) | |||||||||||||||||||||||||
| Tax indemnification from Man Group |
3,200 | 3,200 | ||||||||||||||||||||||||||||||
| Dividend distributions |
(18,594 | ) | (18,594 | ) | ||||||||||||||||||||||||||||
| Minimum pension liability (net of $765 tax) |
(3,324 | ) | (3,324 | ) | ||||||||||||||||||||||||||||
| Impact of adoption of ASC 470-20 |
6,439 | 6,439 | ||||||||||||||||||||||||||||||
| Receivable from shareholder |
(29,779 | ) | (29,779 | ) | ||||||||||||||||||||||||||||
| Equity at March 31, 2009 |
$ | 120,723 | $ | (97 | ) | $ | (29,779 | ) | $ | 1,335,449 | $ | (191,497 | ) | $ | (24,015 | ) | $ | 12,773 | $ | 1,223,557 | ||||||||||||
| Stock-based compensation |
65,767 | 65,767 | ||||||||||||||||||||||||||||||
| Net loss attributable to MF Global Holdings Ltd. |
(136,969 | ) | (136,969 | ) | ||||||||||||||||||||||||||||
| Net income attributable to noncontrolling interest |
1,691 | 1,691 | ||||||||||||||||||||||||||||||
| Foreign currency translation |
21,026 | 1,502 | 22,528 | |||||||||||||||||||||||||||||
| Stock issued |
976 | (122 | ) | (1,655 | ) | (801 | ) | |||||||||||||||||||||||||
| Windfall benefit to Man Group |
(900 | ) | (900 | ) | ||||||||||||||||||||||||||||
| Dividend distributions |
(30,713 | ) | (30,713 | ) | ||||||||||||||||||||||||||||
| Minimum pension liability (net of $1,074 tax) |
(2,763 | ) | (2,763 | ) | ||||||||||||||||||||||||||||
| Equity at March 31, 2010 |
$ | 121,699 | $ | (219 | ) | $ | (29,779 | ) | $ | 1,367,948 | $ | (328,466 | ) | $ | (5,752 | ) | $ | 15,966 | $ | 1,141,397 | ||||||||||||
The accompanying notes are an integral part of these financial statements.
95
Table of Contents
MF GLOBAL HOLDINGS LTD.
CONSOLIDATED AND COMBINED STATEMENTS OF COMPREHENSIVE INCOME
(Dollars in thousands, except share data)
| YEAR ENDED MARCH 31, | ||||||||||||
| 2010 | 2009 | 2008 | ||||||||||
| Net loss |
$ | (135,278 | ) | $ | (48,082 | ) | $ | (64,671 | ) | |||
| Other comprehensive income adjustments: |
||||||||||||
| Deferred loss on cash flow hedges (net of $21,077 tax) |
— | — | 30,330 | |||||||||
| Loss on cash flow hedges (net of $21,077 tax) |
— | — | (30,330 | ) | ||||||||
| Foreign currency translation adjustment |
22,528 | (27,667 | ) | 4,370 | ||||||||
| Minimum pension liability adjustment (net of $1,074, $765 and $512 tax in 2010, 2009 and 2008, respectively) |
(2,763 | ) | (3,324 | ) | 1,845 | |||||||
| Comprehensive loss |
$ | (115,513 | ) | $ | (79,073 | ) | $ | (58,456 | ) | |||
| Comprehensive income attributable to noncontrolling interest |
3,193 | 84 | 5,002 | |||||||||
| Comprehensive loss attributable to MF Global Holdings Ltd. |
$ | (118,706 | ) | $ | (79,157 | ) | $ | (63,458 | ) | |||
The accompanying notes are an integral part of these financial statements.
96
Table of Contents
MF GLOBAL HOLDINGS LTD.
NOTES TO CONSOLIDATED AND COMBINED FINANCIAL STATEMENTS
(Dollars in thousands, except per share data)
| NOTE 1: | ORGANIZATION AND BASIS OF PRESENTATION |
MF Global Holdings Ltd. (together with its subsidiaries, the “Company”) is a leading brokerage firm offering customized solutions in global cash and derivatives markets. The Company provides execution and clearing services for products in the exchange-traded and over-the-counter derivative markets as well as for products in the cash market. The Company operates globally, with a presence in the United States, the United Kingdom (“U.K.”), France, Singapore, Australia, Hong Kong, Canada, India and Japan, among others. The Company provides its clients with global market access to more than 70 securities and futures exchanges and also facilitates trades in the over-the-counter markets. Its history dates back more than 200 years to a brokerage business that was a founding member of some of the world’s first futures exchanges. After an initial public offering in July 2007, the Company separated from Man Group plc, its former parent, and became an independent public company with shares listed on the New York Stock Exchange. The Company is operated and managed on an integrated basis as a single operating segment.
On January 4, 2010, MF Global Ltd. changed its jurisdiction of incorporation from Bermuda to the State of Delaware, a change which the Company refers to as the “Domestication”. As a result of the Domestication, MF Global Ltd. has continued its existence as a corporation organized under the laws of the State of Delaware under the name of MF Global Holdings Ltd. Accordingly, any references to the “Company”, “MF Global Holdings Ltd.”, and similar terms mean, as of any time prior to the Domestication, MF Global Ltd. and, as of any time after the Domestication, MF Global Holdings Ltd.
The Company’s principal subsidiaries operate as registered futures commission merchants and as broker-dealers or the local equivalent and maintain futures, options, and securities accounts for customers. The Company’s subsidiaries are members of various commodities, futures, and securities exchanges in North America, Europe, and the Asia Pacific region and accordingly are subject to local regulatory requirements including those of the U.S. Commodity Futures Trading Commission (“CFTC”), the U.S. Securities and Exchange Commission (“SEC”), and the U.K. Financial Services Authority (“FSA”), among others.
These audited financial statements include the following:
| • | Subsequent to the Company’s reorganization and separation, the consolidated accounts of MF Global Holdings Ltd. and its subsidiaries. |
| • | Prior to such reorganization and separation, the combined financial statements of Man Financial, the brokerage division of Man Group plc and its subsidiary companies (“Man Group”), a U.K. corporation. |
The Company completed an initial public offering (“IPO”) of its common shares on July 23, 2007.
In July 2007, Man Group plc separated its brokerage business from its asset management business by transferring to the Company all of the entities and net assets of Man Group and its subsidiaries that comprised its brokerage business, formerly known as Man Financial. In the separation, Man Group retained its asset management business. Man Group transferred the brokerage unit and capital stock of certain legal entities to the Company in exchange for 103,726,353 of the Company’s common shares (the “Separation and Reorganization”).
Man Group also made a net capital contribution of $516,223 to the Company in return for 17,379,493 common shares that the Company issued to the Man Group selling shareholder (the “Recapitalization”). The Recapitalization was based on the Company’s estimated equity at June 30, 2007, as adjusted for certain subsequent transactions, and estimated on the date of the Recapitalization, and then subsequently finalized as agreed with additional consideration of $16,161 for activity subsequent to June 30, 2007 but prior to the IPO. Also, the Company received $54,997 from Man Group as reimbursement for a one-time tax charge.
On July 19, 2007, Man Group received all of the net proceeds from the issuance of 97,379,765 shares at an IPO price of $30 per share and retained approximately 18.6% ownership in the Company. The Company did not receive any proceeds from the sale of these common shares. Man Group also transferred 1,473,514 common shares previously issued to and held by them to the Company for one dollar in aggregate by way of a share adjustment based on the difference between the estimated and final IPO price. During the three months ended September 30, 2009, Man Group sold, pursuant to a variable forward sale agreement, its remaining holdings of shares of common stock of the Company.
97
Table of Contents
MF GLOBAL HOLDINGS LTD.
NOTES TO CONSOLIDATED AND COMBINED FINANCIAL STATEMENTS
(Dollars in thousands, except per share data)
The Company has noted that an additional payment of $29,779 is due to the Company from Man Group in connection with the recapitalization at the time of the IPO in fiscal 2008. The Company has made a request of Man Group for payment, who has demanded arbitration, which the Company has agreed to. As a result of this unresolved claim, the Company has reduced equity by $29,779 by recording a receivable from shareholder in equity. If the claim is successful, the Company would expect to restore equity by the amount received from Man Group (if any), and if the claim is not successful would expect to write off the receivable to additional paid in capital and not to increase equity. The reduction in equity does not affect amounts reported in the Company’s earnings, income statement or cash position for any prior period. See Note 15 for further information.
Basis of presentation
The audited consolidated and combined financial statements are prepared in conformity with U.S. generally accepted accounting principles (“U.S. GAAP”) and include the consolidated accounts of MF Global Holdings Ltd. and its subsidiaries. Management believes that these audited consolidated and combined financial statements include all normally recurring adjustments and accruals necessary for a fair statement of the audited consolidated and combined statements of operations, balance sheets, cash flows, changes in equity and comprehensive income for the periods presented. Certain prior year amounts have been reclassified to conform to current period presentation.
All significant intercompany balances and transactions between the Company’s entities have been eliminated in consolidation. Transactions prior to September 30, 2009 between the Company and Man Group and its affiliates are herein referred to as “related party” transactions. The Company’s policy is to consolidate all entities of which it owns more than 50% unless it does not have control. Investments in entities in which the Company generally owns greater than 20% but less than 50%, or exercises significant influence, but not control, are accounted for using the equity method of accounting. As of March 31, 2010 and 2009, the Company had a 19.5% equity investment in Polaris MF Global Futures Co., Ltd (“Polaris”). As of March 31, 2008, the Company had a 47.9% equity investment in U.S. Futures Exchange LLC (“USFE”) which was written down to zero in the year ended March 31, 2009.
Prior to July 1, 2007 the Company’s financial statements were prepared on a combined basis in conformity with U.S. GAAP as if the Company had existed on a stand-alone basis. The combined financial statements were carved out from Man Group and include the accounts of the Company and its majority and wholly owned subsidiaries, in each case using the historical basis of accounting for the results of operations and assets and liabilities of the respective businesses. The carve-out combined financial statements may not necessarily reflect the results of operations, financial position and cash flows if the Company had actually existed on a stand-alone basis during the fiscal 2008 period presented. The carve-out combined financial statements include the Company’s direct expenses arising from shared services and infrastructure provided by Man Group.
Certain prior year amounts have been reclassified to conform to current year presentation. Specifically, during the second quarter of fiscal 2008, the Company began classifying the total return equity swaps entered into as part of a matched equity hedge in principal transactions rather than in net interest. Additionally, the Company also began presenting the interest and dividends earned on contracts for differences on a gross rather than net basis within interest income and interest expense. This reclassification did not result in any change to revenues, net of interest and transaction-based expenses, or net income.
During the year ended March 31, 2008, the Company recorded an $8,800 reduction to interest income, a $4,800 adjustment to principal transactions, and a $1,900 reduction to employee compensation and benefits, in each case related to errors in prior year accruals that were deemed immaterial to all prior periods presented. During the year ended March 31, 2009, the Company identified errors in its previously reported financial statements. These errors related to the historical accounting for specific exchange and clearing fees, the timing and amount of certain accruals, the accounting for transactions related to the spin-off of the Company’s operations from Man Group plc in connection with its IPO, including the deductibility of certain taxes from that transaction, as well as the classification of certain revenues and expenses between line items in the consolidated and combined statements of operations. The impact of the errors on net income for the year ended March 31, 2008 is an increase of $1,357.
98
Table of Contents
MF GLOBAL HOLDINGS LTD.
NOTES TO CONSOLIDATED AND COMBINED FINANCIAL STATEMENTS
(Dollars in thousands, except per share data)
The Company does not believe that these adjustments are quantitatively or qualitatively material to the results of the respective reporting periods, its projected results for the current year, any prior year’s earnings, earnings trends, or financial statement line items.
On April 1, 2009, the Company adopted two new accounting standards each of which is effective for the Company’s fiscal year ending March 31, 2010 and interim periods within such fiscal year. These standards require retrospective application and resulted in an adjustment to prior period financial statements. The first standard discusses accounting for noncontrolling interests in consolidated financial statements and resulted in a $12,773 increase to total equity for the year ended March 31, 2009 upon adoption. The second standard discusses accounting for convertible debt instruments that may be settled in cash upon conversion including partial cash settlement and resulted in a $448 increase to Net loss attributable to MF Global Holdings Ltd. for fiscal 2009. Additionally, this adoption resulted in a $1,002 decrease to total assets, a $6,993 decrease to total liabilities and a $5,991 increase to total equity for the year ended March 31, 2009.
Relationship with Man Group
Historically, Man Group had provided financial and administrative support to the Company. In connection with the IPO, the Company entered into several transitional services agreements with Man Group pursuant to which Man Group agreed to continue to provide the Company with administrative support for certain corporate functions, such as corporate-level coordination and support services related to the Company’s regulatory capital activities, tax administration, corporate secretarial services and insurance management, for a limited transition period. As of March 31, 2009, all such services had terminated with the exception of office services. The agreement for office services will continue for as long as the Company leases office space from Man Group.
| NOTE 2: | SUMMARY OF SIGNIFICANT ACCOUNTING POLICIES |
Use of estimates
The preparation of consolidated and combined financial statements in conformity with U.S. GAAP requires management to make estimates and assumptions that affect the reported amounts of assets and liabilities and disclosure of contingent assets and liabilities at the date of the consolidated and combined financial statements, and the reported amounts of revenues and expenses during the reported period. Actual results could differ from those estimates. The nature of the Company’s business is such that the results of any interim period may not be indicative of the results to be expected for a full year.
Cash and cash equivalents
Cash and cash equivalents are comprised of cash and short-term highly liquid investments with original maturities of three months or less, other than those used for trading or margin purposes. The carrying amount of such cash equivalents approximates their fair value due to the short-term nature of these instruments.
Restricted cash and securities segregated under federal and other regulations
Certain subsidiaries are obligated by rules mandated by their primary regulators, including the SEC and CFTC in the U.S. and the FSA in the U.K., to segregate or set aside cash or qualified securities to satisfy regulations, promulgated to protect customer assets. Also included within Restricted cash and segregated securities are fixed cash deposits of $61,148 and $48,630 as of March 31, 2010 and 2009, respectively, which are held as margin for the issuance of bank guarantees to satisfy local exchange requirements for day-to-day clearing. In addition, many of the subsidiaries are members of clearing organizations at which cash or securities are deposited as required to conduct day-to-day clearance activities. At March 31, 2010 and 2009, the Company was in compliance with its segregation requirements.
Securities purchased under agreements to resell and securities sold under agreements to repurchase
Transactions involving purchases of securities under agreements to resell (“resale agreements”) or sales of securities under agreements to repurchase (“repurchase agreements”) are generally treated as collateralized financing transactions. Certain of the Company’s resale and repurchase agreements are recorded at their contractual amounts plus accrued interest.
99
Table of Contents
MF GLOBAL HOLDINGS LTD.
NOTES TO CONSOLIDATED AND COMBINED FINANCIAL STATEMENTS
(Dollars in thousands, except per share data)
The resulting interest income and expense for these arrangements are generally included in Interest income and Interest expense in the consolidated and combined statements of operations.
Certain of the Company’s resale and repurchase agreements are carried at fair value as a result of the Company’s fair value election. The Company elected the fair value option for those resale and repurchase agreements that were entered into on or after April 1, 2009, and that do not settle overnight or do not have an open settlement date or that are not accounted for as purchase and sale agreements (such as repo-to-maturity transactions). The Company has elected the fair value option for these instruments to more accurately reflect market and economic events in its earnings and to mitigate a potential imbalance in earnings caused by using different measurement attributes (i.e. fair value versus carrying value) for certain assets and liabilities. Changes in the fair value of these transactions are recorded in Principal transactions in the consolidated statement of operations.
Resale and repurchase transactions are presented on a net-by-counterparty basis when the requirements of the Accounting Standards Codification (“ASC”) are satisfied.
It is the general policy of the Company to take possession of securities with a market value equal to or in excess of the principal amount loaned plus the accrued interest thereon in order to collateralize resale agreements. Similarly, the Company is generally required to provide securities to counterparties to collateralize repurchase agreements. The Company’s agreements with counterparties generally contain contractual provisions allowing for additional collateral to be obtained, or excess collateral returned. The collateral is marked to market daily and the Company may require counterparties to deposit additional collateral or return collateral pledged, when deemed appropriate.
From time-to-time, the Company enters into securities financing transactions that mature on the same date as the underlying collateral. The Company accounts for these transactions in accordance with the accounting standard for transfers and servicing. Such transactions are treated as a sale of financial assets and a forward repurchase commitment, or conversely as a purchase of financial assets and a forward resale commitment. The forward repurchase and resale commitments are accounted for as derivatives under the accounting standard for derivatives and hedging.
Securities borrowed and securities loaned
Certain of the Company’s securities borrowed and securities loaned transactions are accounted for as collateralized financing transactions and are recorded at the amount of cash collateral advanced or received. Securities borrowed transactions facilitate the settlement process and require the Company to deposit cash or other collateral with the lender. In these transactions, the Company receives cash or other collateral in an amount generally in excess of the market value of the applicable securities borrowed and loaned. The Company monitors the market value of securities borrowed or loaned on a daily basis, with additional collateral obtained or refunded as necessary. Consistent with Securities purchased under agreements to resell, from time-to-time, the Company enters into securities financing transactions that mature on the same date as the underlying collateral. The Company accounts for these transactions in accordance with the accounting standard for transfers and servicing. Such transactions are treated as a sale of financial assets and a forward repurchase commitment, or conversely as a purchase of financial assets and a forward resale commitment.
The Company elected to record at fair value securities borrowed and securities loaned transactions that are entered into on or after July 1, 2009 that have a specific termination date beyond the business day following the trade date. Changes in the fair value of these transactions are recorded in Principal transactions in the consolidated statement of operations.
Collateral
The Company enters into collateralized financing transactions and matched book positions principally through the use of repurchase agreements and securities lending agreements. In these transactions, the Company receives cash or securities in exchange for other securities, including U.S. government and federal agency obligations, corporate debt and other debt obligations, and equities. The Company records assets it has pledged as collateral in collateralized borrowings and other arrangements on the consolidated balance sheets when the Company is the debtor as defined in accordance with the accounting standard for transfers and servicing.
The Company obtains securities as collateral principally through the use of resale agreements, securities borrowing agreements, customer margin loans and other collateralized financing activities to facilitate its matched book arrangements,
100
Table of Contents
MF GLOBAL HOLDINGS LTD.
NOTES TO CONSOLIDATED AND COMBINED FINANCIAL STATEMENTS
(Dollars in thousands, except per share data)
inventory positions, customer needs and settlement requirements. In many cases, the Company is permitted to sell or repledge securities held as collateral. These securities may be used to collateralize repurchase agreements, to enter into securities lending agreements or to cover short positions. As of March 31, 2010 and 2009, the fair value of securities received as collateral by the Company, excluding collateral received under resale agreements, that it was permitted to sell or repledge was $9,523,608 and $9,693,486, respectively. The Company sold or repledged securities aggregating $5,860,051 and $7,396,382, respectively. Counterparties have the right to sell or repledge these securities. See Note 5 for a description of the collateral received and pledged in connection with agreements to resell or repurchase securities.
Held-to-maturity securities
Held-to-maturity securities primarily consist of U.S. government treasury securities, agency debentures and corporate obligations. The Company accounts for held-to-maturity securities with the accounting standard for investments in debt and equity securities and classifies securities as held-to-maturity that are owned by its non broker-dealer subsidiaries, where it has the positive intent and the ability to hold the securities until maturity. These securities are carried on an amortized cost basis on the consolidated balance sheet in Securities owned or Restricted cash and segregated securities. The Company designates these securities as held-to-maturity at the time of purchase and re-evaluates the designation at each balance sheet date. Held-to-maturity securities are reviewed at least quarterly for impairment.
Securities owned and securities sold, not yet purchased
Stocks, government and corporate bonds, futures, options and foreign currency transactions are reported in the consolidated and combined financial statements on a trade date basis. Securities owned and securities sold, not yet purchased are stated at fair value, unless designated as held-to-maturity. Realized and unrealized gains and losses are reflected in Principal transactions or Gains on exchange seats and shares on the consolidated and combined statements of operations. Fair values are based on quoted market prices.
Securities sold, not yet purchased, represent obligations of the Company to deliver the specified security at the contracted price and, thereby, create a liability to purchase the security in the market at prevailing prices. The Company’s liability for securities to be delivered is measured at their fair value as of the date of the consolidated and combined financial statements. However, these transactions result in off-balance sheet risk, as the Company’s ultimate cost to satisfy the delivery of the securities sold, not yet purchased, may exceed the amount reflected in the consolidated balance sheets.
Shares in exchanges held by the Company that are not required for trading rights are recorded at fair market value, taking into account any restrictions. Unrealized gains and losses arising from these assets are reported separately in the consolidated and combined statements of operations as Gains on exchange seats and shares.
Receivables from and payables to customers
These balances pertain primarily to margin and open contractual commitments related to customers’ futures, foreign currency forwards and securities transactions. Receivables from and payables to customers include gains and losses on open futures, options and forward contracts and amounts due on cash and margin transactions.
Securities owned by customers are held as collateral for receivables. Customer securities transactions are recorded on a trade date basis. Securities owned by customers, including those that collateralize margin or other similar transactions, are not reflected in the consolidated balance sheets. The Company generally nets receivables and payables related to its customers’ futures, foreign currency forwards and securities transactions on a counterparty basis pursuant to master netting or customer agreements. It is the Company’s policy to settle these transactions on a net basis with its counterparties.
Receivables from and payables to brokers, dealers and clearing organizations
Receivables from brokers, dealers and clearing organizations include amounts receivable for securities not delivered by the Company to the purchaser by the settlement date (“fails to deliver”) and margin deposits. Payables to brokers, dealers and clearing organizations include amounts payable for securities not received by the Company from the seller by the settlement date (“fails to receive”). Receivables and payables to brokers, dealers and clearing organizations also include amounts related to net payables and receivables from unsettled trades.
101
Table of Contents
MF GLOBAL HOLDINGS LTD.
NOTES TO CONSOLIDATED AND COMBINED FINANCIAL STATEMENTS
(Dollars in thousands, except per share data)
Memberships in exchanges, at cost
Memberships in exchanges represent both an ownership interest and the right to conduct business on the exchange. Exchange memberships of the Company’s broker-dealer and Futures Commission Merchant subsidiaries, representing the right to conduct business, are recorded at cost and tested at least annually for impairment or more frequently if events or circumstances indicate a possible impairment. In the years ended March 31, 2010 and 2009, there were no impairment charges for memberships in exchanges. In the year ended March 31, 2008, recorded impairment charges for memberships in exchanges were not material.
Furniture, equipment and leasehold improvements
Furniture and equipment are stated at cost, net of accumulated depreciation. Furniture and equipment are depreciated over their estimated useful lives of 3 to 5 years on a straight-line basis. Leasehold improvements are amortized on a straight-line basis over the lesser of the economic useful life of the improvement or the term of the related leases, which range from 2 to 10 years. The total depreciation expense for all furniture, equipment and leasehold improvements for the years ended March 31, 2010, 2009 and 2008 was $23,747, $23,658 and $21,544, respectively.
The Company reviews the carrying value of its furniture, equipment, or leasehold improvements for impairment whenever events or changes in circumstances indicate that the carrying amounts may not be recoverable. The impairment is measured as the amount by which the carrying value exceeds the fair value of the asset as determined by an estimate of undiscounted cash flows. There were no impairment charges for furniture, equipment, and leasehold improvements recorded in the years ended March 31, 2010 and 2008. In the year ended March 31, 2009, recorded impairment charges were not material.
Goodwill
Goodwill represents the excess of the purchase price of a business acquisition over the fair value of the net assets acquired. Goodwill is not amortized and the Company’s single reporting unit is tested at least annually for impairment as of March 31, 2010. An assessment of goodwill for potential impairment is performed in two steps. Step 1 of the analysis is used to identify the impairment and involves determining and comparing the fair value of the Company with its carrying value, or equity. If the fair value of the Company exceeds its carrying value, goodwill is not impaired. Step 2 of the analysis compares the fair value of the Company to the aggregated fair values of its individual assets, liabilities, and identified intangibles, to calculate the amount of impairment, if any. See Note 3 for further information.
Intangible assets, net
Intangible assets represent the cash paid in a business combination for customer relationships, technology assets, and trade names. The Company amortizes finite-lived intangible assets over their estimated useful lives on a straight-line basis, which range from 4 to 14 years, unless the economic benefits of the intangible are otherwise impaired. The Company did not have any indefinite lived intangible assets at March 31, 2010 and 2009. Intangible assets are reviewed at least annually for impairment or whenever events or changes in circumstances indicate that the carrying amounts may not be recoverable. See Note 3 for further information.
Noncontrolling interests
On April 1, 2009, the Company adopted a new accounting standard which requires the Company to present noncontrolling interests (previously referred to as minority interests) as a separate component of total equity on the Company’s consolidated balance sheet. The adoption of this standard required retrospective application to the Company’s historical financial statements. See Note 1 for further details. The Company consolidates the results and financial position of entities it controls, but does not wholly own. As of March 31, 2010, the Company owned 70.2% of MF Global Sify Securities India Private Limited, 75.0% of MF Global Financial Services India Private Limited and 73.2% of MF Global Futures Trust Co. Ltd. During the year ended March 31, 2009 the Company purchased the remaining 9.0% of MF Global Securities Ltd it did not previously own, following the exercise of a put option held by the minority shareholder. At March 31, 2010 and 2009, noncontrolling interests recorded in the consolidated balance sheets were $15,966 and $12,773, respectively.
102
Table of Contents
MF GLOBAL HOLDINGS LTD.
NOTES TO CONSOLIDATED AND COMBINED FINANCIAL STATEMENTS
(Dollars in thousands, except per share data)
Derivative instruments and hedging activities
Derivative financial instruments involve varying degrees of off-balance sheet market risk. Changes in foreign exchange rates may result in cash settlements which exceed the amounts recognized on the consolidated balance sheets. The counterparties to the Company’s forward foreign exchange contracts include a number of major international financial institutions. The Company could be exposed to loss in the event of non-performance by these counterparties. However, credit ratings and concentrations of risk to these financial institutions are monitored on a continuous basis. See Note 19 for further information.
During the year ended March 31, 2008, the Company entered into interest rate forward contracts, in the anticipation of issuing new debt, which would serve to eliminate the variability of cash flows due to changes in the U.S. Treasury interest rate. The interest rate forward contracts fixed the interest rate to be applied on the first ten forecasted semi-annual interest payments associated with the Company’s planned issuance of debt. The changes in fair value of these interest rate forward contracts were designated and qualified as cash flow hedges with the prescribed guidance under the accounting standard for derivatives and hedging, and were recorded in other comprehensive income/(loss) within Equity. The Company tested hedge effectiveness quarterly, on both a prospective and retrospective basis, using the dollar-offset method. Ineffectiveness of the hedge or termination of the hedged transaction required amounts to be reclassified from other comprehensive income/(loss). During the year ended March 31, 2008, changes in capital markets and other events impacted the Company’s prospective issuance of debt and caused the Company to review its capital plan. As this capital plan did not exactly match the original plan in place when the Company originally entered into the interest rate forward contracts, the Company was not able to maintain hedge accounting, and as such recognized a loss from the interest rate forward contracts of $51,407, in Principal transactions in the consolidated statement of operations during the year ended March 31, 2008. All amounts recorded in other comprehensive income/(loss) related to this hedge accounting were reclassified to Principal transactions in the consolidated statement of operations.
Employee benefits
The Company’s employees participate in various pension and savings benefit plans. The Company does not operate any material post-employment and post-retirement benefit plans. The Company uses various actuarial methods and assumptions to determine the pension benefit costs and obligations, including the discount rate used to determine the present value of future benefits and expected long-term rate of return on plan assets. The Company sponsors a defined benefit plan for a select group of U.K. employees which is closed to new participants.
The Company also sponsors a defined contribution plan for its U.S. employees, the MF Global Holdings USA Inc. Employees’ Savings and Investment Plan, whereby the Company contributes 50% of a participant’s contribution per year, subject to certain maximum thresholds, as defined by the plan. These contributions were $4,070, $3,682, and $3,993, for the years ending March 31, 2010, 2009 and 2008, respectively.
The Company’s non-U.S. employees are covered by non-U.S. defined contribution, savings, and benefit plans. Employer contributions to these plans are determined based on criteria specific to the individual plans. The largest of these non-U.S. plans are a defined benefit plan and defined contribution plan sponsored by the Company. For the years ended March 31, 2010, 2009 and 2008 the Company’s contributions to the defined benefit and defined contribution plans sponsored by Man Group were $62, $113, and $4,621, respectively. The Company’s contributions to the Company’s other non-U.S. savings and defined benefit plans were $14,479, $11,954, and $7,949 for the years ending March 31, 2010, 2009 and 2008, respectively.
Income taxes
The income tax provision is reflected in the consolidated and combined statements of operations. The income tax provision is calculated using the asset and liability method. Under this method, deferred income taxes are provided for differences between the carrying value of assets and liabilities for financial reporting and income tax purposes, and are measured using the enacted tax rates that will be in effect when these differences are expected to reverse. A valuation allowance is provided for deferred tax assets when it is more likely than not (likelihood of greater than 50%) that the benefits of net deductible temporary differences and net operating loss carryforwards will not be realized.
Tax positions are recognized only when it is more likely than not, based on technical merits, that the position will be sustained upon examination. Tax positions that meet the more likely than not threshold are measured using a probability
103
Table of Contents
MF GLOBAL HOLDINGS LTD.
NOTES TO CONSOLIDATED AND COMBINED FINANCIAL STATEMENTS
(Dollars in thousands, except per share data)
weighted approach as the largest amount of tax benefit that has a greater than 50% likelihood of being realized. A liability associated with an unrecognized tax benefit is classified as a long-term liability, except for the amount for which a cash payment is anticipated within one year.
The Company has classified deferred tax assets within other assets, and deferred tax liabilities and accrued taxes payable within accrued expenses and other liabilities on the consolidated balance sheets.
Allowance for doubtful accounts
The Company’s allowance for doubtful accounts is based upon management’s continuing review and evaluation of factors such as collateral value, aging and the financial condition of the customers. The allowance is assessed to reflect the best estimate of probable losses due to client defaults that have been incurred as of the balance sheet date. Any changes are included in the current period operating results. In circumstances where a specific customer’s inability to meet its financial obligation is known, the Company records a specific provision against accounts receivable to reduce the receivable to the amount it reasonably believes will be collected. The bad debt expense recognized for the years ended March 31, 2010, 2009 and 2008 are $9,730, $19,654 and $150,392, respectively. The bad debt expense recorded in the year ended March 31, 2008 was mainly related to an unauthorized trading incident, as discussed further in Note 15.
Stock-based compensation
The Company measures the cost of employee services received for stock based compensation based on the grant-date fair value of the award. That cost is recognized over the period during which an employee is required to provide service in exchange for the award.
Revenue recognition
Commissions
Commissions are recorded on a trade-date basis as customer transactions occur. Fees are charged at various rates based on the products traded and the method of trade. Commissions consist of fees charged for executing trades on an agency basis for counterparties that have clearing accounts with other brokerage institutions and also consist of transaction fees earned (1) by both executing and clearing transactions for customers and (2) by providing clearing services where the trade is executed by another brokerage firm and then routed to the Company. Commissions are presented net of rebates earned by customers based on the volume of transactions they execute and clear. Commissions do not include “markups” earned from executing customer trades on a matched principal basis, which are recognized under principal transactions revenue.
Principal transactions
Principal transactions include revenues from both matched principal brokerage activities and proprietary securities transactions. Revenues from matched principal brokerage activities are recorded on the trade date. For these activities, commission is not separately billed to customers; instead a commission equivalent is included in the transaction revenues following execution of the transaction on behalf of customers. Principal transactions also includes unrealized gains or losses on equity swaps and contracts for differences (“CFDs”) together with the unrealized gains and losses on the related matching equity hedges that are entered into on a matched-principal basis. Additionally, the Company records the total return of equity swaps entered into as part of a matched equity hedge in Principal transactions.
Proprietary securities transactions are recorded on the trade date. Profits and losses arising from all securities and commodities transactions entered into for the account and risk of the Company are recorded on a trade date basis, including to a lesser extent from derivatives transactions executed for the Company’s own account to hedge foreign currency exposure as well as the ineffectiveness and termination of hedged transactions with respect to the Company’s interest rate exposure. The Company does not separately amortize purchase premiums and discounts associated with proprietary securities transactions, as these are a component of the recorded fair value. Changes in the fair value of such securities are recorded as unrealized gains and losses within Principal transactions in the consolidated and combined statements of operations. Contractual inter-
104
Table of Contents
MF GLOBAL HOLDINGS LTD.
NOTES TO CONSOLIDATED AND COMBINED FINANCIAL STATEMENTS
(Dollars in thousands, except per share data)
est expense earned and incurred on these transactions is included in Interest income and Interest expense in the consolidated and combined statements of operations.
Interest
Interest is recognized on an accrual basis and includes amounts receivable on customer funds, company funds, debt instruments such as agency securities and collateralized financing arrangements. Interest income related to repurchase agreements, securities borrowed and collateralized financing arrangements are recognized over the life of the transaction. Interest income and expense for resale and repurchase agreement transactions are presented net in the consolidated and combined statements of operations pursuant to accounting guidelines. Interest income and expense also includes dividends received and paid on long and short equity instruments.
Other
Other revenues consist of revenues the Company earned from other normal business operations that are not otherwise included elsewhere. These include fees from clients and other counterparties for certain ancillary services provided by the Company, such as the use of trading systems and other professional staff services and support. This would also include insurance proceeds, which are not recorded until received.
Transaction-based expenses
Transaction-based expenses are variable expenses directly incurred in conjunction with the generation of revenues, and consist of execution and clearing fees and sales commissions.
Execution and clearing fees
Execution and clearing fees reflect the expenses of executing, clearing and settling trades on behalf of customers. These fees are paid to third parties, specifically clearing brokers, exchanges and clearing-houses, and regulatory bodies. Execution and clearing fees are recognized on a trade date basis. Execution and clearing fees also reflect losses due to trading errors for the years ended March 31, 2010, 2009 and 2008 of $6,877, $8,635 and $15,885, respectively.
Sales commissions
Sales commissions consist of payments to introducing brokers that are deemed third parties.
Gains on exchange seats and shares
Gains on exchange seats and shares consist of (1) realized gains on sales of exchange seats and shares, (2) unrealized gains and losses arising from fair value movements on the exchange shares held by the Company but not required for clearing transactions and (3) dividend income earned on all exchange memberships held by the Company.
Fair value measurements
The Company carries a significant portion of its assets and liabilities at fair value. These assets and liabilities consist of financial instruments, including cash and derivative products, and primarily represent the Company’s investment, trading, financing and customer facilitation activities. Financial instruments are recorded in the financial statements on a trade-date basis and they include related accrued interests or dividends. Changes in the fair value of financial instruments are recognized in earnings within Principal transactions in the consolidated and combined statements of operations.
The Company adopted the provisions under ASC 820, Fair Value Measurements and Disclosures (“ASC 820”) as of April 1, 2008. Fair value is defined as the price that would be received to sell an asset or paid to transfer a liability in an orderly transaction between market participants at the measurement date, or an “exit” price. The Company marks its financial instruments based on quoted market prices, where applicable. Based on market convention the Company marks its financial instruments based on product class which is generally bid or mid price. If listed prices or quotes are not available, the Company
105
Table of Contents
MF GLOBAL HOLDINGS LTD.
NOTES TO CONSOLIDATED AND COMBINED FINANCIAL STATEMENTS
(Dollars in thousands, except per share data)
determines fair value based on comparable market transactions, executable broker quotes, or independent pricing sources with reasonable levels of price transparency. Fair value measurements are not adjusted for transaction costs.
Credit risk is a component of fair value and represents the loss the Company would incur if a counterparty or an issuer of securities or other instruments the Company holds fails to perform under its contractual obligations to the Company, or upon a deterioration in the credit quality of third parties whose securities or other instruments, including OTC derivatives, the Company holds. To reduce the Company’s credit exposures in its operating activities, the Company generally enters into agreements with its counterparties that permit it to offset receivables and payables with such counterparties and obtain margin and/or collateral from the counterparty on an upfront and ongoing basis. The Company monitors and manages its credit exposures daily. The Company considers the impact of counterparty credit risk in the valuation of its assets and its own credit risk in the valuation of its liabilities that are presented at fair value.
Financial instruments are categorized into a three-level valuation hierarchy for disclosure of fair value measurements, as further discussed in Note 19. The hierarchy gives the highest priority to unadjusted quoted prices in active markets for identical assets or liabilities (Level 1 measurements) and the lowest priority to unobservable inputs (Level 3 measurements). A market is active if there are sufficient transactions on an ongoing basis to provide current pricing information for the asset or liability, pricing information is released publicly, and price quotations do not vary substantially either over time or among market makers. Observable inputs reflect the assumptions market participants would use in pricing the asset or liability based on market data obtained from sources independent of the reporting entity. The fair value hierarchy is based on the observability of inputs in the valuation of an asset or liability at the measurement date. In determining the appropriate fair value hierarchy levels, the Company performs a detailed analysis of its assets and liabilities. At each reporting period, all assets and liabilities for which the fair value measurement is based on significant unobservable inputs are classified as Level 3. The three levels are described as follows:
Level 1— Unadjusted quoted prices in active markets that are accessible at the measurement date for identical, unrestricted assets or liabilities. Level 1 consists of financial instruments whose fair values are determined using quoted market prices.
Level 2—Quoted prices for identical or similar assets or liabilities in markets that are less active, that is, markets in which there are few transactions for the asset or liability that are observable for substantially the full term. Included in Level 2 are those financial instruments for which fair values are estimated using models or other valuation methodologies. These models are primarily industry-standard models utilizing various observable inputs, including time value, yield curve, volatility factors, observable current market and contractual prices for the underlying financial instruments, as well as other relevant economic measures.
Level 3—Prices or valuation techniques that require inputs that are both significant to the fair value measurement and unobservable (i.e., supported by little or no market activity). Level 3 is comprised of financial instruments whose fair value is estimated using internally developed models or methodologies utilizing significant inputs that are not readily observable from objective sources.
Legal reserves
In the ordinary course of business, the Company has been named as a defendant in legal and regulatory proceedings. The Company estimates the potential losses that may arise out of legal and regulatory proceedings and recognizes liabilities for such contingencies to the extent that such losses are probable and the amount of the loss can be reasonably estimated. Legal professional fees are accrued as incurred.
Equity
Prior to the Reorganization and Separation, the Company’s financial statements were prepared on a combined basis, and as such, the Company’s equity reflects an aggregation of accumulated earnings, accumulated comprehensive income/loss, and foreign currency translation adjustments. For periods after the Reorganization and Separation, equity and its components have been presented on a consolidated basis from the date of the Reorganization and Separation.
106
Table of Contents
MF GLOBAL HOLDINGS LTD.
NOTES TO CONSOLIDATED AND COMBINED FINANCIAL STATEMENTS
(Dollars in thousands, except per share data)
The Company has 1,000,000,000 shares authorized at $1.00 par value per share of which 121,698,729 and 120,723,046 were issued and outstanding at March 31, 2010 and 2009. This excludes restricted shares issued that are subject to forfeiture of 4,255 and 237,665 for March 31, 2010 and 2009 respectively.
The Company accounts for treasury stock under the par value method. Under this method, the excess of the cost of treasury stock over its par value is recorded in additional paid-in capital.
Termination costs
The Company records a liability for a cost associated with an exit or disposal activity, as measured initially at its fair value, in the period in which the liability is incurred. During the year ended March 31, 2009, the Company recorded $10,952 related to the reorganization of its offices in France and Canada. During the year ended March 31, 2010, an additional $566 was recorded of which $183 was recorded in Employee compensation and benefits (excluding non-recurring IPO awards), $308 in Occupancy and equipment and $75 in Depreciation and amortization in the consolidated statement of operations. Of this March 31, 2010 total amount, $147 related to employee severance and $419 related to contract termination and other costs. As of March 31, 2009, $8,377 was accrued and a majority of the balance was paid during fiscal 2010. At March 31, 2010, the Company had a remaining accrual of $1,792 substantially all of which will be paid out within one year.
Foreign currency translation
The functional currency is the currency of the primary economic environment in which cash is generated and expended. This is generally the local currency for the Company’s non-U.S. operations, except for certain entities in the U.K. and Singapore. The assets and liabilities of foreign operations are translated into U.S. dollars at the spot exchange rates prevailing at the close of business on the reporting date. Revenue and expenses of the foreign operations are translated into U.S. dollars at average exchange rates during the period. Gains or losses on the translation of financial statements of the Company’s non-U.S. subsidiaries, where the functional currency is other than the U.S. dollar, are included in equity on the consolidated balance sheets. The impact of translating monetary assets and liabilities to the reporting currency as well as transaction gains and losses are recorded in General and other expenses in the consolidated and combined statements of operations. For the years ended March 31, 2010, 2009 and 2008 net foreign currency translation (losses)/gains recorded in General and other expenses were ($15,635), $12,614 and $3,817, respectively.
Earnings per share
The Company computes earnings per share in accordance with the applicable accounting standards, which discuss the accounting for earnings per share and participating securities and the two-class method. The Company’s Series A Preferred Stock is classified as participating securities whereby the holder participates in undistributed earnings with common shareholders.
Recently issued accounting pronouncements
In February 2010, the Financial Accounting Standards Board (“FASB”) issued Accounting Standards Update (“ASU”) No. 2010-10, Consolidation—Amendments for Certain Investment Funds (“ASU No. 2010-10”). ASU No. 2010-10 indefinitely defers the effective date of the updated VIE accounting guidance for certain investment funds. To qualify for the deferral, the investment fund needs to meet certain attributes of an investment company, does not have explicit or implicit obligations to fund losses of the entity and is not a securitization entity, an asset-backed financing entity, or an entity formerly considered a qualifying special-purpose entity. ASU No. 2010-10 will be effective for the Company in the first quarter of fiscal 2011. The Company is currently assessing the impact to its consolidated financial statements.
In January 2010, the FASB issued ASU No. 2010-06, Fair Value Measurements and Disclosures (“ASU No. 2010-06”). The guidance in ASU No. 2010-06 provides amendments to ASC 820 that requires a reporting entity to disclose separately the amounts of significant transfers in and out of Level 1 and Level 2 fair value measurements and describe the reasons for the transfers. In addition, with regards to Level 3 assets, ASU No. 2010-06 now requires that a reporting entity should present separately information about purchases, sales, issuances and settlements on a gross basis in the reconciliation for fair value measurements using significant unobservable inputs (Level 3). The Company adopted the new disclosures and clarifications
107
Table of Contents
MF GLOBAL HOLDINGS LTD.
NOTES TO CONSOLIDATED AND COMBINED FINANCIAL STATEMENTS
(Dollars in thousands, except per share data)
of existing disclosures in the fourth quarter of fiscal 2010. The Company will adopt the disclosures about purchases, sales, issuances, and settlements in the roll-forward of activity in Level 3 fair value measurements in the first quarter of fiscal 2012.
In September 2009, the FASB issued ASU No. 2009-12, Investments in Certain Entities That Calculate Net Asset Value per Share (or Its Equivalent) (“ASU No. 2009-12”). The guidance in ASU No. 2009-12 amends certain sections in ASC 820 which discusses accounting for fair value measurements and disclosures. The amendments permit, as a practical expedient, a reporting entity to measure the fair value of an investment that is within the scope of the amendments on the basis of the net asset value per share of the investment (or its equivalent) if the net asset value is calculated in a manner consistent with U.S. GAAP for investment companies as of the reporting entity’s measurement date. The amendments also require disclosures by major category of investment to be determined on the basis of the nature and risks of the investment. The Company adopted ASU No. 2009-12 in the third quarter of fiscal 2010 with no material impact to its consolidated financial statements.
In August 2009, the FASB issued ASU No. 2009-05, Measuring Liabilities at Fair Value (“ASU No. 2009-05”). ASU No. 2009-05 provides amendments to ASC 820, for the fair value measurement of liabilities. It requires a reporting entity to measure the fair value of a liability using certain valuation techniques when a quoted price in an active market for the identical liability is not available. A reporting entity is not required to include a separate input or adjustment relating to the existence of a restriction that prevents the transfer of a liability when fair valuing that liability. The amendments in ASU No. 2009-05 also clarify the hierarchy of the fair value measurements to be used for a quoted price in an active market for the identical liability at the measurement date as well as for the quoted price for the identical liability when traded as an asset in an active market when no adjustments to the quoted price of the asset are required. The Company adopted ASU No. 2009-05 in the third quarter of fiscal 2010 and there was no material impact to its consolidated financial statements upon adoption.
In June 2009, the FASB issued Statements of Financial Accounting Standards (“SFAS”) No. 168, The FASB Accounting Standards Codification and the Hierarchy of Generally Accepted Accounting Principles—a replacement of FASB Statement No. 162, which was superseded by ASC 105. In September 2009, the FASB also issued ASU No. 2009-01, Topic 105—Generally Accepted Accounting Principles—amendments based on—Statement of Financial Accounting Standards No. 168—The FASB Accounting Standards Codification and the Hierarchy of Generally Accepted Accounting Principles (“ASU No. 2009-01”). ASC 105 and ASU No. 2009-01 established the FASB Accounting Standards Codification as the single source of authoritative U.S. GAAP recognized by the FASB to be applied by non-governmental entities. Rules and interpretive releases of the SEC under authority of federal securities laws are also sources of authoritative GAAP for SEC registrants. On the effective date, the Codification superseded all then-existing, non-SEC accounting and reporting standards. All other non-grandfathered, non-SEC accounting literature not included in ASC 105 and ASU No. 2009-01 became non-authoritative. ASC 105 and ASU No. 2009-01 are effective for financial statements issued for interim and annual periods ending after September 15, 2009. The Company adopted ASC 105 and ASU No. 2009-01 in the second quarter of fiscal 2010 and made reference to accounting and reporting standards in its consolidated and combined financial statements in accordance with ASC 105 and ASU No. 2009-01 upon adoption.
In June 2009, the FASB issued SFAS No. 167, Amendments to FASB Interpretation No. 46(R) which was codified and superseded by ASU 2009-17 (“ASU No. 2009-17”) in December 2009. ASU No. 2009-17 requires an enterprise to determine the primary beneficiary (or “consolidator”) of a variable-interest entity (“VIE”) based on whether the entity (1) has the power to direct matters that most significantly impact the activities of the VIE, and (2) has the obligation to absorb losses or the right to receive benefits of the VIE that could potentially be significant to the VIE. ASU No. 2009-17 changes the consideration of kick-out rights in determining if an entity is a VIE which may cause certain additional entities to now be considered VIEs. On January 27, 2010, the FASB agreed to finalize ASU Amendments to Statement 167 for Certain Investment Funds to indefinitely defer consolidation requirements for a reporting enterprise’s interest in certain entities and for certain money market mutual funds under ASU No. 2009-17. The ASU will also amend guidance that addresses whether fee arrangements represent a variable interest for all decision-makers and service-providers. ASU No. 2009-17 will be effective for the Company in the first quarter of fiscal 2011. The Company does not expect a material impact on its consolidated financial statements upon adoption.
In June 2009, the FASB issued SFAS No. 166, Accounting for Transfers of Financial Assets—an amendment of FASB Statement No. 140 which was codified and superseded by ASU No. 2009-16 (“ASU No. 2009-16”) in December 2009. ASU
108
Table of Contents
MF GLOBAL HOLDINGS LTD.
NOTES TO CONSOLIDATED AND COMBINED FINANCIAL STATEMENTS
(Dollars in thousands, except per share data)
No. 2009-16 aims to improve the visibility of off-balance sheet vehicles currently exempt from consolidation and addresses practical issues involving the accounting for transfers of financial assets as sales or secured borrowings. ASU No. 2009-16 also introduces the concept of a “participating interest,” which will limit the circumstances where the transfer of a portion of a financial asset will qualify as a sale, assuming all other derecognition criteria are met. Furthermore, it clarifies and amends the derecognition criteria for determining whether a transfer qualifies for sale accounting. ASU No. 2009-16 is effective as of the beginning of an entity’s first annual reporting period beginning after November 15, 2009. The Company will adopt ASU No. 2009-16 in the first quarter of fiscal year 2011 and does not expect a material impact on its consolidated financial statements upon adoption.
In June 2008, the FASB issued FASB Staff Position No. EITF 03-6-1, Determining Whether Instruments Granted in Share-Based Payment Transactions Are Participating Securities, which was superseded by ASC 260-10-45 (“ASC 260-10-45”). The guidance in ASC 260-10-45 applies to the calculation of earnings per share for share-based payment awards with rights to dividends or dividend equivalents. It clarifies that unvested share-based payment awards that contain nonforfeitable rights to dividends or dividend equivalents (whether paid or unpaid) are participating securities and shall be included in the computation of earnings per share pursuant to the two-class method. ASC 260-10-45 is effective for financial statements issued for fiscal years beginning after December 15, 2008. The Company adopted ASC 260-10-45 in the first quarter of fiscal 2010 with no material impact to its consolidated financial statements.
In May 2008, the FASB issued Staff Position No. APB 14-1, Accounting for Convertible Debt Instruments That May Be Settled in Cash upon Conversion (Including Partial Cash Settlement), which was superseded by ASC 470-20. ASC 470-20 specifies that issuers of convertible debt instruments that may be settled in cash upon conversion should separately account for the liability and equity components in a manner that will reflect the entity’s nonconvertible debt borrowing rate when interest cost is recognized in subsequent periods. The Company adopted ASC 470-20 in the first quarter of fiscal 2010. See Note 1 for further details on the impact of adoption.
In December 2007, the FASB issued SFAS No. 160, Noncontrolling Interests in Consolidated Financial Statements—An Amendment of ARB No. 51, which was superseded by certain sections in ASC 810. ASC 810 establishes accounting and reporting standards for the noncontrolling interest in a subsidiary and for the deconsolidation of a subsidiary. The Company adopted the guidance in the first quarter of fiscal 2010. See Note 1 for further details on the impact of adoption.
| NOTE 3: | GOODWILL AND INTANGIBLE ASSETS |
There were no acquisitions during the years ended March 31, 2010 and 2009.
During fiscal 2010 and 2009, earn-out payments of $3,364 and $6,653, respectively, were made relating to prior acquisitions, which are accounted for as additional purchase consideration. As of March 31, 2010 and 2009, the Company had one remaining arrangement that could result in contingent, or “earn-out”, payments. These payments are based on earnings in future years, subject to maximum and minimum amounts. If the minimum earn-out is not reached at the end of 5 years (to fiscal 2012), the Company’s obligation to pay the earn-out can extend for up to 10 years (to fiscal 2017), subject to a remaining maximum of approximately $70,000.
Goodwill represents the excess of the purchase price of a business combination over the fair value of the net assets acquired. Goodwill is not amortized and the Company’s single reporting unit is tested at least annually for impairment or when there is an interim triggering event. An assessment of goodwill for potential impairment is performed in two steps. Step 1 of the analysis is used to identify the impairment and involves determining and comparing the fair value of the Company with its carrying value, or equity. If the fair value of the Company exceeds its carrying value, goodwill is not impaired. Step 2 of the analysis compares the fair value of the Company to the aggregated fair values of its individual assets, liabilities and identified intangibles, to calculate the amount of impairment, if any.
In performing Step 1 of the analysis, the Company compared its net book value to its estimated fair value. In determining the estimated fair value, the Company performed a discounted cash flow analysis using management’s current business plans, which factored in current market conditions including contract and product volumes and pricing as the basis for expected future cash flows for the first five years and a 1% growth rate for the cash flows thereafter. Management used a
109
Table of Contents
MF GLOBAL HOLDINGS LTD.
NOTES TO CONSOLIDATED AND COMBINED FINANCIAL STATEMENTS
(Dollars in thousands, except per share data)
weighted average cost of capital (“WACC”) of 12.1% as its discount rate in this analysis. The WACC was derived from market participant data and estimates of the fair value and yield of the Company’s debt, preferred stock, and equity as of the testing date. The WACC represents the yield of the Company’s financial instruments as currently stated. A discounted cash flow model involves the subjective selection and interpretation of data inputs and, given market conditions at March 31, 2010, there was a very limited amount of observable market data inputs available when determining the model.
Based on the results of Step 1 of the analysis, the Company determined its goodwill was impaired, as the fair value derived from the discounted cash flow model was less than the Company’s book value at March 31, 2010 and 2009. Then, based on the results of Step 2 of the analysis, the Company determined that its market capitalization and the computed fair value from Step 1 of the analysis was less than the estimated fair value of the Company’s balance sheet and therefore recorded a charge of $3,364 and $76,821 for the years ended March 31, 2010 and 2009, respectively, to write-off the entire amount of the Company’s goodwill. As discussed, the Company has an earn-out arrangement that could result in additional goodwill being recorded in future periods. The Company will continue to assess its goodwill annually or whenever events or changes in circumstances indicate that an interim assessment is necessary.
The summary of the Company’s goodwill is as follows:
| Balance as of March 31, 2008 |
$ | 74,145 | ||
| Additions |
6,653 | |||
| Impairment |
(76,821 | ) | ||
| Foreign currency translation |
(3,977 | ) | ||
| Balance as of March 31, 2009 |
$ | — | ||
| Additions |
3,364 | |||
| Impairment |
(3,364 | ) | ||
| Balance as of March 31, 2010 |
$ | — | ||
Intangible assets, subject to amortization as of March 31, 2010 and 2009 are as follows:
| MARCH 31, | ||||||||
| 2010 | 2009 | |||||||
| Customer relationships |
||||||||
| Gross carrying amount |
$ | 259,943 | $ | 257,775 | ||||
| Accumulated amortization |
(193,157 | ) | (116,234 | ) | ||||
| Net carrying amount |
66,786 | 141,541 | ||||||
| Technology assets |
||||||||
| Gross carrying amount |
32,114 | 31,388 | ||||||
| Accumulated amortization |
(27,101 | ) | (22,933 | ) | ||||
| Net carrying amount |
5,013 | 8,455 | ||||||
| Trade names |
||||||||
| Gross carrying amount |
2,934 | 2,827 | ||||||
| Accumulated amortization |
(1,374 | ) | (1,135 | ) | ||||
| Net carrying amount |
1,560 | 1,692 | ||||||
| Total |
$ | 73,359 | $ | 151,688 | ||||
Intangible assets represent the cash paid in a business combination for customer relationships, technology assets, and trade names. Intangible assets are reviewed at least annually for impairment or whenever events or changes in circumstances indicate that the carrying amounts may not be recoverable. During the fourth quarter of fiscal 2010, the Company identified triggering events that required an impairment analysis to be performed related to certain customer relationship intangible assets. This analysis mainly related to the customer relationships acquired from Refco several years ago. Due to the decrease
110
Table of Contents
MF GLOBAL HOLDINGS LTD.
NOTES TO CONSOLIDATED AND COMBINED FINANCIAL STATEMENTS
(Dollars in thousands, except per share data)
in expected cash flows from certain long-lived intangible assets related to higher customer attrition and lower velocity as originally estimated in the purchase accounting model, the Company concluded that such assets were not fully recoverable.
In performing this analysis, the Company compared the net book value of these customer relationship intangible assets to their estimated fair value. In determining the estimated fair value, the Company performed a discounted cash flow analysis using management’s current business plans, which factored in current market conditions including volumes and interest rates as the basis for expected future cash flows related to the customer relationships. In this analysis, management used estimated growth and attrition rates applicable to the respective markets of the customer relationships, and a discount rate of 12.7%.
As a result of all impairment analysis performed during the fourth quarter of fiscal 2010, the Company recorded an impairment charge of $50,615 related to customer relationships. The Company also recorded an impairment charge of $5,207 at March 31, 2009 and there was no impairment of intangible assets identified for the year ended March 31, 2008.
During the year ended March 31, 2010 and 2009, the total impairment charge of $53,980 and $82,028, respectively, was recorded in Impairment of intangible assets and goodwill in the Company’s consolidated statement of operations. The amortization included in Depreciation and amortization for the year ended March 31, 2010, 2009 and 2008 was $31,343, $34,183 and $33,276, respectively. The amortization expense for the remaining intangible assets for the next five fiscal years is approximately $18,336, $12,995, $12,431, $10,471 and $7,448, respectively.
| NOTE 4: | RECEIVABLES FROM AND PAYABLES TO CUSTOMERS |
Receivables from and payables to customers, net of allowances, are as follows:
| MARCH 31, | ||||||||||||
| 2010 | 2009 | |||||||||||
| Receivables from customers |
Payables to customers |
Receivables from customers |
Payables to customers | |||||||||
| Futures transactions |
$ | 202,652 | 10,905,593 | $ | 276,385 | $ | 10,869,884 | |||||
| Foreign currency and other OTC derivative transactions |
31,808 | 638,254 | 61,043 | 651,759 | ||||||||
| Securities transactions |
43,329 | 445,303 | 65,471 | 242,609 | ||||||||
| Other |
14,321 | 8,702 | 12,633 | 2,138 | ||||||||
| Total |
$ | 292,110 | $ | 11,997,852 | $ | 415,532 | $ | 11,766,390 | ||||
| NOTE 5: | COLLATERALIZED FINANCING TRANSACTIONS |
The Company’s policy is to take possession of securities purchased under resale agreements, which consist largely of securities issued by the U.S. government and federal agencies. The Company retains the right to re-pledge collateral received in collateralized financing transactions. As of March 31, 2010, the market value of collateral received under resale agreements was $68,958,618, of which $199,599 was deposited as margin with clearing organizations. As of March 31, 2009, the market value of collateral received under resale agreements was $53,321,790, of which $837,359 was deposited as margin with clearing organizations. The collateral is valued daily and the Company may require counterparties to deposit additional collateral or return collateral pledged, as appropriate. As of March 31, 2010 and 2009, the market value of collateral pledged under repurchase agreements was $75,606,222 and $58,662,562, respectively. As of March 31, 2010 and 2009, there were no amounts at risk under repurchase agreements or resale agreements with a counterparty greater than 10% of Equity.
Resale and repurchase transactions are presented on a net-by-counterparty basis when certain requirements related to the offsetting of amounts related to certain repurchase and resale agreements are satisfied. In addition, the Company entered into certain of these agreements that are accounted for as sales and purchases and de-recognized related assets and liabilities from the consolidated balance sheets. At March 31, 2010, securities purchased under agreements to resell and securities sold under agreements to repurchase of $1,199,842 and $5,702,980, respectively, at contract value, were derecognized. At March 31, 2009, this consisted of securities purchased under agreements to resell and securities sold under agreements to repurchase of $1,944,417 and $11,393,006, respectively, at contract value.
111
Table of Contents
MF GLOBAL HOLDINGS LTD.
NOTES TO CONSOLIDATED AND COMBINED FINANCIAL STATEMENTS
(Dollars in thousands, except per share data)
At March 31, 2010, certain of the Company’s resale and repurchase agreements are carried at fair value as a result of the Company’s fair value election. The Company elected the fair value option for those resale and repurchase agreements that were entered into on or after April 1, 2009, and that do not settle overnight or do not have an open settlement date or that are not accounted for as purchase and sale agreements (such as repo-to-maturity transactions). The Company has elected the fair value option for these instruments to more accurately reflect market and economic events in its earnings and to mitigate a potential imbalance in earnings caused by using different measurement attributes (i.e. fair value versus carrying value) for certain assets and liabilities. At March 31, 2010, the fair value of these resale and repurchase agreements was $14,825,760
and $9,281,426, respectively. Changes in the fair value of these transactions are recorded in Principal transactions in the consolidated statement of operations. During the year ended March 31, 2010, the amount of gains and losses related to resale and repurchase agreements was $2,600 and $2,080, respectively.
The Company has not specifically elected the fair value option for certain resale and repurchase agreements that are settled on an overnight or demand basis as these are carried at contract value, which approximates fair value.
The carrying values of the securities sold under repurchase transactions, including accrued interest, by maturity date are:
| MARCH 31, 2010 | ||||||||||||||||||
| Demand | Overnight | Less than 30 days | 30 to 90 days | After 90 days | Total | |||||||||||||
| Security type |
||||||||||||||||||
| U.S. Government |
$ | 1,334,376 | $ | 15,649,717 | $ | 815,274 | $ | 637,552 | $ | 1,239,413 | $ | 19,676,332 | ||||||
| U.S. Corporations |
93,216 | 43,086 | — | — | — | 136,302 | ||||||||||||
| Foreign Governments |
103,141 | 3,242,366 | 4,878,894 | 105,521 | 897,943 | 9,227,865 | ||||||||||||
| Foreign Corporations |
39,244 | — | — | — | — | 39,244 | ||||||||||||
| Total |
$ | 1,569,977 | $ | 18,935,169 | $ | 5,694,168 | $ | 743,073 | $ | 2,137,356 | $ | 29,079,743 | ||||||
| MARCH 31, 2009 | ||||||||||||||||||
| Demand | Overnight | Less than 30 days | 30 to 90 days | After 90 days | Total | |||||||||||||
| Security type |
||||||||||||||||||
| U.S. Government |
$ | 282,108 | $ | 10,170,909 | $ | 57,487 | $ | 876,992 | $ | 280,288 | $ | 11,667,784 | ||||||
| U.S. Corporations |
2,344 | — | — | — | — | 2,344 | ||||||||||||
| Foreign Governments |
17,164 | 1,774,401 | 662,841 | 1,829 | — | 2,456,235 | ||||||||||||
| Foreign Corporations |
10,282 | — | 135,053 | — | — | 145,335 | ||||||||||||
| Total |
$ | 311,898 | $ | 11,945,310 | $ | 855,381 | $ | 878,821 | $ | 280,288 | $ | 14,271,698 | ||||||
Securities borrowed and securities loaned transactions are accounted for as collateralized financing transactions. These transactions facilitate the settlement process and may require the Company to deposit cash or other collateral with the lender.
The Company elected to record at fair value securities borrowed and securities loaned transactions that are entered into on or after July 1, 2009 that have a specific termination date beyond the business day following the trade date. At March 31, 2010, the fair value of these securities borrowed agreements was $1,004,017. Changes in the fair value of these transactions are recorded in Principal transactions in the consolidated statement of operations. During the year ended March 31, 2010, the net amount of losses related to securities borrowed agreements was $10. For transactions not elected for fair value measurement, the amount of cash collateral advanced or received is recorded on the consolidated balance sheets.
112
Table of Contents
MF GLOBAL HOLDINGS LTD.
NOTES TO CONSOLIDATED AND COMBINED FINANCIAL STATEMENTS
(Dollars in thousands, except per share data)
| NOTE 6: | RECEIVABLES FROM AND PAYABLES TO BROKERS, DEALERS AND CLEARING ORGANIZATIONS |
Receivables from and payables to brokers, dealers and clearing organizations consist of the following:
| MARCH 31, | ||||||||||||
| 2010 | 2009 | |||||||||||
| Receivables | Payables | Receivables | Payables | |||||||||
| Securities failed to deliver/receive |
$ | 418,994 | $ | 403,959 | $ | 531,270 | $ | 518,814 | ||||
| Due from/to clearing brokers |
1,056,664 | 2,699 | 529,542 | 93,056 | ||||||||
| Due from/to clearing organizations |
1,100,520 | 58,364 | 1,297,902 | 314,681 | ||||||||
| Fees and commissions |
934 | 55,289 | 1,034 | 58,892 | ||||||||
| Unsettled trades and other |
740,677 | 1,720,420 | 113,593 | 91,936 | ||||||||
| Total |
$ | 3,317,789 | $ | 2,240,731 | $ | 2,473,341 | $ | 1,077,379 | ||||
| NOTE 7: | SECURITIES OWNED AND SECURITIES SOLD, NOT YET PURCHASED AND SEGREGATED SECURITIES |
Securities Owned and Securities Sold, Not Yet Purchased
Securities owned and securities sold, not yet purchased include securities carried at fair value as well as certain marketable securities classified as held-to-maturity securities. Securities owned and securities sold, not yet purchased, which are held at fair value, consist of the following:
| MARCH 31, | ||||||||||||
| 2 010 | 2009 | |||||||||||
| Securities Owned | Securities Sold, Not Yet Purchased |
Securities Owned | Securities Sold, Not Yet Purchased | |||||||||
| U.S. government securities and federal agency obligations |
$ | 3,903,235 | $ | 3,493,000 | $ | 3,195,431 | $ | 2,757,372 | ||||
| Corporate debt securities |
207,165 | 162,586 | 224,958 | — | ||||||||
| Foreign government bonds |
1,117,693 | 543,359 | 7,953 | — | ||||||||
| Equities |
418,586 | 201,558 | 153,538 | 124,209 | ||||||||
| Shares held due to demutualization of exchanges |
14,034 | — | 14,367 | — | ||||||||
| Other |
12,810 | 946 | 9,661 | 3,010 | ||||||||
| Total |
$ | 5,673,523 | $ | 4,401,449 | $ | 3,605,908 | $ | 2,884,591 | ||||
U.S. government securities and federal agency obligations owned by the Company and deposited as margin with clearing organizations totaled $0 and $149,442, respectively as of March 31, 2010 and 2009.
Segregated Securities
At March 31, 2010 and 2009, the Company had segregated securities of $7,587,632 and $7,969,127, respectively, within Restricted cash and segregated securities. These amounts include securities purchased under agreements to resell that are subject to the segregation requirements of the CFTC and totaled $4,280,140 and $4,998,887 at March 31, 2010 and 2009, respectively, of which $1,115,806 and $0 are at fair value as a result of the Company’s fair value election, at March 31, 2010 and 2009, respectively.
113
Table of Contents
MF GLOBAL HOLDINGS LTD.
NOTES TO CONSOLIDATED AND COMBINED FINANCIAL STATEMENTS
(Dollars in thousands, except per share data)
Held-to-Maturity Securities
The Company has purchased certain securities for investment purposes and has the positive intent and ability to hold these securities to maturity. The Company has classified these securities as held-to-maturity securities and reported them on an amortized cost basis within Securities owned and Restricted cash and segregated securities on the consolidated balance sheet. At March 31, 2010, none of the held-to-maturity securities were impaired. The Company did not have any held-to-maturity securities in the year ended March 31, 2009.
The following table summarizes the carrying value, fair value and unrealized gains and losses of the held-to-maturity securities by type of security at March 31, 2010:
| Securities Owned | |||||||||||||
| Carrying Value | Fair Value | Gross Unrealized Gain |
Gross Unrealized Loss |
||||||||||
| Corporate debt securities |
$ | 10,100 | $ | 10,262 | $ | 162 | $ | — | |||||
| Debt securities issued by the U.S. government and federal agencies |
4,636,516 | 4,634,731 | 731 | (2,516 | ) | ||||||||
| Total |
$ | 4,646,616 | $ | 4,644,993 | $ | 893 | $ | (2,516 | ) | ||||
| Segregated Securities | |||||||||||||
| Carrying Value | Fair Value | Gross Unrealized Gain |
Gross Unrealized Loss |
||||||||||
| Corporate debt securities |
$ | 71,139 | $ | 72,028 | $ | 889 | $ | — | |||||
| Debt securities issued by the U.S. government and federal agencies |
2,888,574 | 2,891,805 | 3,679 | (448 | ) | ||||||||
| Total |
$ | 2,959,713 | $ | 2,963,833 | $ | 4,568 | $ | (448 | ) | ||||
| NOTE 8: | FURNITURE, EQUIPMENT, AND LEASEHOLD IMPROVEMENTS |
A summary of furniture, equipment, and leasehold improvements is as follows:
| MARCH 31, | ||||||
| 2010 | 2009 | |||||
| Leasehold improvements |
$ | 56,969 | $ | 52,079 | ||
| Equipment |
77,627 | 66,461 | ||||
| Furniture and fixtures |
37,538 | 35,230 | ||||
| Computer software |
39,135 | 22,501 | ||||
| Total cost |
211,268 | 176,271 | ||||
| Less: accumulated depreciation and amortization |
138,306 | 113,554 | ||||
| Cost, net of accumulated depreciation and amortization |
$ | 72,961 | $ | 62,717 | ||
114
Table of Contents
MF GLOBAL HOLDINGS LTD.
NOTES TO CONSOLIDATED AND COMBINED FINANCIAL STATEMENTS
(Dollars in thousands, except per share data)
| NOTE 9: | BORROWINGS |
Short term borrowings consist of the following:
| MARCH 31, | ||||||
| 2010 | 2009 | |||||
| Other short-term borrowings |
$ | 142,500 | $ | 142,500 | ||
| Bank overdrafts |
367 | 6,335 | ||||
| Total |
$ | 142,867 | $ | 148,835 | ||
Long-term borrowings consist of:
| MARCH 31, | ||||||
| 2010 | 2009 | |||||
| 9.00% Convertible Notes due 2038 |
$ | 199,389 | $ | 198,007 | ||
| Two-year term facility |
— | 240,000 | ||||
| Other long-term borrowings |
300,000 | 500,000 | ||||
| Total |
$ | 499,389 | $ | 938,007 | ||
Liquidity Facility
In the year ended March 31, 2008, the Company entered into a $1,500,000 five-year unsecured committed revolving credit facility (the “liquidity facility”) with a syndicate of banks. Borrowings under this liquidity facility bear interest at a rate per annum equal to either, at the Company’s option, (1) a designated fluctuating base rate or (2) a designated fluctuating alternative base rate equal to seven-day or one-, two-, three-or six-month LIBOR plus a margin of 0.40% per annum, at the Company’s current senior unsecured non-credit enhanced rating from Standard & Poor’s and Moody’s. The Company pays a facility fee of 10 basis points per annum. In the event the Company’s credit ratings are downgraded in the future, the terms of the liquidity facility would increase this fee to 12.5 basis points per annum. In addition, the Company paid an annual administration fee of $75 in connection with the liquidity facility. The liquidity facility contains financial and other customary covenants. In general terms, and subject to certain exceptions, the Company has agreed to maintain a consolidated tangible net worth of not less than $620,000 (plus 50% of the proceeds of certain equity offerings and 25% of the Company’s consolidated positive net income for each completed fiscal year), and the Company has agreed not to incur indebtedness through the Company’s subsidiaries exceeding 10% of the Company’s equity less goodwill and intangible assets, incur liens on its assets, merge or consolidate with (or dispose of substantially all of the Company’s assets to) any person, engage in material new businesses, engage in transactions with affiliates except on arm’s-length terms or fail to satisfy any regulatory net capital or financial resources requirement or comply with applicable laws or regulations. If the Company fails to pay any amount when due under the facility or to comply with its other requirements, if the Company fails to pay any amount when due on other material debt (defined as $50,000 or more in principal) or other material debt is accelerated in whole or in part by the lenders, or upon certain events of liquidation or bankruptcy, an event of default will occur under the facility. Upon an event of default, all outstanding borrowings, together with all accrued interest, fees and other obligations, under the facility will become due and the Company will not be permitted to make any further borrowings under the facility. In June 2008, the Company borrowed $350,000 under the liquidity facility and used the proceeds to pay down $350,000 under the 364-day unsecured revolving credit facility (the “bridge facility”). In connection with this drawdown and the Two-Year Term Facility (discussed below), the Company agreed to increase the interest rate margin by 1.10% per annum on the first $500,000 outstanding under the liquidity facility. On January 16, 2009, the Company’s agreed interest rate increased to 1.50% per annum on the outstanding balance, and the liquidity facility interest also increased to a margin of 0.40%, due to a downgrade in the Company’s credit ratings. In the event the Company’s credit ratings are further downgraded beyond a certain level, the rate on
115
Table of Contents
MF GLOBAL HOLDINGS LTD.
NOTES TO CONSOLIDATED AND COMBINED FINANCIAL STATEMENTS
(Dollars in thousands, except per share data)
the $500,000 outstanding will increase to a maximum of 1.85% and the rate on other outstanding amounts will increase to a maximum of 0.525%. On December 16, 2009, the Company repaid $200,000 of the outstanding balance on its liquidity facility with excess and available cash. As of March 31, 2010 and 2009, $442,500 and $642,500, respectively, was outstanding under the liquidity facility with the remainder available to the Company as a committed facility. The Company intends to keep $300,000 of the amount outstanding at March 31, 2010 under the liquidity facility as long term debt and as part of its capital structure, unless the Company replaces some or all of these borrowings with other long-term debt. In October 2008, Lehman Commercial Paper Inc., one of the participating banks with a total commitment amounting to $75,000 under the liquidity facility filed for bankruptcy, and accordingly, the Company believes Lehman Commercial Paper Inc. will not fund the balance of its loan commitment, which is $60,000.
On July 24, 2009, the liquidity facility was amended to enable the Company, to move its jurisdiction of incorporation at an appropriate time to the U.S. from Bermuda. The Company paid a one-time fee of approximately $800.
At March 31, 2010, the Company was in compliance with its covenants under the liquidity facility.
Convertible Senior Notes
On June 25, 2008, the Company completed the issuance and sale of $150,000 aggregate principal amount of its 9.00% Convertible Senior Notes due 2038 (the “Convertible Notes”). The Convertible Notes bear interest at a rate of 9.00% per year, payable semi-annually in arrears on June 15 and December 15 of each year. The Convertible Notes mature on June 20, 2038. Holders may convert the Convertible Notes at their option at any time prior to the maturity date. Upon conversion, the Company will pay or deliver, as the case may be, cash, common stock or a combination thereof at the Company’s election. The initial conversion rate for the Convertible Notes is 95.6938 shares of common stock per $1 principal amount of Convertible Notes, equivalent to an initial conversion price of approximately $10.45 per share of common stock. The conversion rate will be subject to adjustment in certain events. The Company may redeem the Convertible Notes, in whole or in part, for cash at any time on or after July 1, 2013 at a price equal to 100% of the principal amount to be redeemed plus accrued and unpaid interest. Holders may require the Company to repurchase all or a portion of their Convertible Notes for cash on July 1, 2013, July 1, 2018, July 1, 2023, July 1, 2028 and July 1, 2033 at a price equal to 100% of the principal amount of Convertible Notes to be repurchased plus accrued and unpaid interest.
In connection with the issuance of the Convertible Notes, the Company also granted the initial purchasers of the Convertible Notes an option to purchase up to an additional $60,000 aggregate principal amount of the Convertible Notes. On August 7, 2008, the initial purchasers exercised the option to purchase an additional $60,000 of the Convertible Notes. The Convertible Notes mature in 2038, subject to redemption at the Company’s option after five years and a right of holders to require repurchase every five years beginning five years after issue. The proceeds from the additional $60,000 Convertible Notes were used to pay down a portion of the Two-Year Term Facility.
On March 26, 2009, the Company completed its cash tender offer to purchase its $210,000 Convertible Notes at a purchase price equal to $0.64 per $1.00 of the principal amount. The Company validly repurchased $5,000 in aggregate principal amount of the Convertible Notes. The Company paid $3,326 in cash including accrued interest and related transaction costs. Additionally, the Company expensed $589 in unamortized costs. This resulted in a net gain of $1,539 on the early extinguishment of debt, which was recorded in other revenue in the consolidated statements of operations for the year-ended March 31, 2009.
On April 1, 2009 the Company adopted a new accounting standard, which required retrospective application to the Company’s financial statements for the fiscal year ending March 31, 2009 and interim periods within such fiscal year. This standard requires the issuer of certain convertible debt instruments that may be settled in cash (or other assets) on conversion to separately account for the liability (debt) and equity (conversion option) components of the instrument in a manner that reflects the issuer’s non-convertible debt borrowing rate. The Company’s Convertible Notes are impacted by this new accounting standard, and as a result this adoption was retrospectively applied to its consolidated financial statements from the issuance date of the Convertible Notes in June 2008. The Company retrospectively recorded a debt discount and a component of equity representing the value of the conversion option. The discount is being amortized over the expected five-year life of the Convertible Notes, resulting in a non-cash increase to interest expense in historical and future periods. See Note 1 for further
116
Table of Contents
MF GLOBAL HOLDINGS LTD.
NOTES TO CONSOLIDATED AND COMBINED FINANCIAL STATEMENTS
(Dollars in thousands, except per share data)
details. As of March 31, 2010, the Convertible Notes have a remaining outstanding aggregate principal balance of $205,000 and debt discount of $5,611, both of which are recorded in Long-term borrowings on the consolidated balance sheet.
On July 18, 2008, in connection with the issuance of the Series A Preferred Stock (as defined below), the Company entered into a replacement capital covenant, whereby the Company agreed for the benefit of certain of its debtholders identified therein, including initially the holders of the Company’s Convertible Notes, that it would not redeem or repurchase the Series A Preferred Stock on or before July 18, 2018 except from the proceeds of the issuance of certain qualified equity and/or equity-related securities and pursuant to the other terms and conditions set forth in the replacement capital covenant. As of the date of this report, the Company’s only debt that receives the benefit of its obligations under the replacement capital covenant is the Company’s Convertible Notes.
Two-Year Term Facility
On July 18, 2008, the Company entered into a credit agreement with several banks that provided for a two-year, $300,000 unsecured term loan facility (the “Two-Year Term Facility”). On April 16, 2009, the Company paid the remaining outstanding balance of $240,000 on the Two-Year Term Facility ahead of its maturity date of July 16, 2010 thus terminating all remaining obligations under the Two-Year Term Facility. In connection with the repayment of the Two-Year Term Facility, the Company recorded a loss on extinguishment of debt of $9,682 related to the accelerated amortization of debt issuance costs.
| NOTE 10: | STOCK-BASED COMPENSATION PLANS |
Stock-based compensation issued by MF Global
In connection with the IPO, the Company established the 2007 Long-term Incentive Plan (“LTIP”) which provides for equity compensation awards in the form of stock options, stock appreciation rights, restricted stock, restricted stock units, performance awards, cash-based awards and other awards to eligible employees, consultants, directors, and other individuals who provide services to the Company, each as determined by the Compensation Committee of the Board of Directors. As of March 31, 2010, the LTIP provides for the issuance of up to 24.2 million shares.
The Company issued restricted stock units, stock options, and restricted stock under the LTIP. Stock options vest in equal installments over three years, and vested awards can be exercised, subject to continued employment, within seven years from the date of grant. Stock options have an exercise price, equal to the price per share of common stock at the grant date. Restricted stock units vest ratably or in full after three years, subject to continued employment or meeting certain retirement eligibility criteria. Restricted stock awards were issued to employees at the IPO, which vested in full on the first anniversary of the IPO, subject to continued employment. Restricted stock units and restricted stock issued at the IPO are defined as non-recurring IPO awards and are presented in Employee compensation related to non-recurring IPO awards within the consolidated and combined statement of operations.
The Company has elected to expand its use of stock-based awards as payment for employees’ incentive compensation, thereby further aligning employees with the interests of shareholders. Accordingly, during the year ended March 31, 2010, management opted to increase the percentage of compensation paid in three-year vesting stock awards and reduced the cash portion of discretionary bonus expense.
Stock Option Exchange
In October 2009, the Company initiated a tender offer that enabled eligible employees to exchange options that were granted to them at the time of the Company’s IPO for a lower number of restricted stock units. The exchange program was designed so that the fair market value of the new restricted stock units would equal the approximate fair market value of the options exchanged, and as such there was no incremental compensation expense incurred in connection with the exchange. The offering period closed on November 10, 2009, and in connection with the tender offer 3,301,162 options were tendered and exchanged for 284,455 restricted stock units at an exchange rate of 11.6:1. The new restricted stock units will vest in equal annual installments over a three year period, with the remaining unamortized stock compensation expense related to the exchanged options spread out over three years.
117
Table of Contents
MF GLOBAL HOLDINGS LTD.
NOTES TO CONSOLIDATED AND COMBINED FINANCIAL STATEMENTS
(Dollars in thousands, except per share data)
Compensation expense for the stock-based compensation plans has been measured in accordance with ASC 718. Net income for the years ended March 31, 2010, 2009 and 2008 includes the following related to the Company’s stock-based compensation arrangements:
| YEAR ENDED MARCH 31, | |||||||||
| 2010 | 2009 | 2008 | |||||||
| Compensation costs |
|||||||||
| Employee compensation and benefits (excluding IPO awards) |
$ | 32,971 | $ | 35,404 | $ | 29,683 | |||
| Employee compensation related to non-recurring IPO awards |
31,827 | 44,819 | 59,131 | ||||||
| Total |
$ | 64,798 | $ | 80,223 | $ | 88,814 | |||
| Income tax benefits |
$ | 14,907 | $ | 25,206 | $ | 30,765 | |||
The Company has no pool of windfall tax benefits. The Company has deferred tax assets recorded on its consolidated balance sheets related to stock compensation awards issued in connection with the IPO. Due to declines in the Company’s stock price, these may not equal the tax benefit ultimately realized at the date of delivery of these awards, as the deferred tax assets are based on the stock awards’ grant date fair value and any shortfall will result in a charge to the income statement.
The fair value of each stock option is estimated on the date of grant using a Black-Scholes option valuation model that uses the following assumptions:
Expected Volatility: Due to the lack of historical data for the Company’s own stock, the Company based its expected volatility on a representative peer group that took into account the following criteria: industry, market capitalization, stage of life cycle and capital structure.
Expected Term: Expected term represents the period of time that options granted are expected to be outstanding. The Company elected to use the ‘simplified’ calculation method, which is to be used for companies that lack extensive historical data. The mid-point between the vesting date and the contractual expiration date is used as the expected term under this method.
Expected Dividend Yield: The Company has not paid and does not expect to pay dividends in the future. Accordingly, the assumed dividend yield is zero.
Risk Free Interest Rate: The risk-free rate is determined using the implied yield currently available on zero-coupon U.S. government bonds with a term consistent with the expected term on the date of grant.
| YEAR ENDED MARCH 31, | |||||||||
| 2010 | 2009 | 2008 | |||||||
| Expected volatility |
54.8 | % | 43.7 | % | 32.0 | % | |||
| Risk free interest rate |
2.8 | % | 3.1 | % | 4.9 | % | |||
| Expected dividend yield |
0 | % | 0 | % | 0 | % | |||
| Expected term |
4.5 years | 4.5 years | 4.5 years | ||||||
118
Table of Contents
MF GLOBAL HOLDINGS LTD.
NOTES TO CONSOLIDATED AND COMBINED FINANCIAL STATEMENTS
(Dollars in thousands, except per share data)
The following tables summarize activity for the Company’s plans for year ended March 31, 2010:
| Options | Weighted- Average Exercise Price (per share) |
Weighted- Average Remaining Contractual Term (in years) |
Aggregate Intrinsic Value | ||||||||
| Stock options outstanding as of April 1, 2009 |
10,133,869 | $ | 25.27 | 5.5 | $ | 598 | |||||
| Granted |
1,439,255 | 5.99 | |||||||||
| Options exchanged in connection with the stock option exchange program |
(3,301,162 | ) | 30.00 | ||||||||
| Forfeited and cancelled |
(1,152,460 | ) | 21.93 | ||||||||
| Stock options outstanding as of March 31, 2010 |
7,119,502 | 19.72 | 5.0 | 4,697 | |||||||
| Stock options expected to vest as of March 31, 2010 |
6,924,119 | 19.99 | 5.0 | 4,395 | |||||||
| Stock options exercisable at March 31, 2010 |
3,282,656 | $ | 25.95 | 4.5 | $ | 571 | |||||
During the years ended March 31, 2009 and 2008, 2,703,695 and 11,483,309 options, respectively, were granted and 3,453,134 and 600,001 options, respectively, were forfeited or cancelled. The weighted-average grant-date fair value of options granted during the years ended March 31, 2010, 2009 and 2008 was $2.83, $4.29 and $10.45, respectively. No options were exercised during the years ended March 31, 2010, 2009 and 2008.
| Restricted Stock Units | |||||||
| Awards | Weighted- Average Grant Date Fair Value (per award) | ||||||
| Nonvested as of April 1, 2009 |
6,930,294 | $ | 22.16 | ||||
| Granted |
2,207,361 | 6.03 | |||||
| Granted in connection with the stock option exchange program |
284,455 | 10.45 | |||||
| Exercised |
(703,662 | ) | 19.09 | ||||
| Forfeited |
(324,192 | ) | 28.88 | ||||
| Nonvested as of March 31, 2010 |
8,394,256 | $ | 17.42 | ||||
| Total unrecognized compensation expense remaining |
$ | 29,616 | |||||
| Weighted-average years expected to be recognized over |
1.6 | ||||||
119
Table of Contents
MF GLOBAL HOLDINGS LTD.
NOTES TO CONSOLIDATED AND COMBINED FINANCIAL STATEMENTS
(Dollars in thousands, except per share data)
During the years ended March 31, 2009 and 2008, 1,033,361 and 7,562,370 restricted stock units were granted, respectively, with a weighted average grant date fair value of $11.55 and $30.01, respectively, and 799,672 and 117,268 restricted stock units were forfeited, respectively. During the year ended March 31, 2009, 748,497 shares of stock were issued from the vesting of restricted share units. The total fair value of restricted stock units exercised during the years ended March 31, 2010 and 2009 was $13,433 and $18,795, respectively. No shares were issued from vesting of restricted share units during the year ended March 31, 2008.
| Restricted Stock | |||||||
| Awards | Weighted- Average Grant Date Fair Value (per award) | ||||||
| Nonvested as of April 1, 2009 |
270,958 | $ | 23.34 | ||||
| Granted |
70,420 | 6.63 | |||||
| Vested |
(89,288 | ) | 6.72 | ||||
| Forfeited |
(9,370 | ) | 6.67 | ||||
| Nonvested as of March 31, 2010 |
242,720 | $ | 25.25 | ||||
| Total unrecognized compensation expense remaining |
$ | 1,065 | |||||
| Weighted-average years expected to be recognized over |
0.5 | ||||||
During the years ended March 31, 2009 and 2008, 113,869 and 441,710 shares of stock were granted, respectively, with a weighted average grant date fair value of $6.70 and $29.30, respectively, and 27,766 and 20,175 shares of stock were forfeited, respectively. During the year ended March 31, 2009, 236,680 shares of stock vested. The total fair value of restricted stock vested during the years ended March 31, 2010 and 2009 was $600 and $5,931, respectively. No shares of stock vested during the year ended March 31, 2008.
The Company has employee stock purchase plans in the U.S. and U.K. to provide employees with an opportunity to purchase shares from the Company at a discount and to pay for these purchases through payroll deductions. In the U.S., participants can withhold 1-15% of their eligible compensation; however, no participant can purchase more than 500 shares or total shares exceeding $8 in fair market value. As of March 31, 2010 and 2009, 110,658 and 167,799 shares of stock, respectively, were awarded from this plan at a price of $1.97 and $1.73 per share of stock, respectively. In the U.K., participants can withhold up to £0.25 per month over 3 to 5 years to purchase shares at a 20% discount from the price on the date of grant. As of March 31, 2010 and 2009, no shares were awarded from this plan. These plans are accounted for as compensatory under ASC 718.
Stock-based compensation issued by Man Group
Historically, certain of the Company’s employees were granted awards under several stock-based incentive plans established by Man Group and approved by Man Group’s Remuneration Committee. At the IPO, employees that held these awards were deemed to have terminated employment with Man Group as ‘good leavers’ and outstanding awards were treated in accordance with plan guidelines. The Company did not assume or convert Man Group awards into LTIP awards or into common stock of the Company. The information presented below for the year ended March 31, 2008 includes activity through the date of the IPO and relates only to employees of the Company. Subsequent to the IPO, expense on awards exercised related to these plans are being incurred by Man Group.
Net income for the year ended March 31, 2008 includes $22,764 of compensation costs and $8,088 of income tax benefits related to Man Group’s stock-based compensation arrangements through July 18, 2007. Of the total charge recorded in the year ended March 31, 2008, $14,579 related to the vesting of Man Group plc awards at the IPO under the plan terms. All of these compensation costs have been recorded in Employee compensation and benefits (excluding non-recurring IPO awards) within the consolidated and combined statements of operations. Certain stock-based compensation awards have been classified as liabilities.
120
Table of Contents
MF GLOBAL HOLDINGS LTD.
NOTES TO CONSOLIDATED AND COMBINED FINANCIAL STATEMENTS
(Dollars in thousands, except per share data)
Executive Share Option Plan
Executive share option awards are stock option awards granted to selected senior employees and directors, where the ability to exercise the stock option depends on Man Group’s achievement of a financial target. The financial target is based on the retail price index, plus a margin, and on Man Group’s earnings per share, as defined by the plan. Man Group’s financial target is measured over three consecutive years, as defined by the plan. Executive share option awards are granted at the market value of Man Group stock on the date of grant, vest over three years, and lapse if the financial target is not achieved after three years. When exercised, the holder receives Man Group shares in exchange for paying cash consideration equal to the option price.
At the IPO, all outstanding executive share option awards became vested and exercisable to the extent the applicable performance criteria were achieved by Man Group as of March 31, 2007, and any options with respect to which the performance criteria were not achieved were forfeited. To the extent vested, outstanding Man Group options are exercisable for 12 months after the IPO.
During the year ended March 31, 2008, Man Group issued no stock option awards to employees of the Company. The total intrinsic value of stock options exercised during the year ended March 31, 2008 was $1,973. During the year ended March 31, 2008, there were 215,760 stock options exercised with a $1,973 impact on cash flows from operations and financing activities.
The Company estimates the fair value of options granted under the Employee Stock Purchase Plans using the Black-Scholes option-pricing model and uses a binomial lattice option-pricing model to estimate the fair value of Executive Share Option Plan awards. These pricing models require the input of assumptions related to exercise behavior and a price volatility assumption for the underlying stock. Changes in the assumptions can materially affect the estimate of fair value and results of operations could be materially impacted.
The assumptions used for the year ended March 31, 2008 were as follows:
Expected Volatility: The expected volatility factor used to estimate the fair value of stock options awarded is based on the historical volatility of Man Group’s common stock over a period consistent with the expected term of the option and on the implied volatility of market-traded options on Man Group’s common stock, together with other factors.
Expected Dividend Yield: The dividend yield assumptions are based on an analysis of Man Group’s average historical dividend yield prior to each award date, together with other factors.
Risk Free Interest Rate: The risk-free rate is determined using the implied yield currently available on zero-coupon U.S. and U.K. government bonds (where applicable) with a term consistent with the expected option life.
The grant date fair value of each option grant has been estimated with the following weighted-average assumptions:
| YEAR ENDED | |||
| 2008 | |||
| Expected volatility |
30 | % | |
| Risk free interest rate—Executive Share Option Plan |
4.8 | % | |
| Risk free interest rate—Employee Stock Purchase Plan |
5 | % | |
| Expected dividend yield |
2.5 | % | |
| Expected term—Executive Share Option Plan |
8.5 years | ||
| Expected term—Employee Stock Purchase Plan |
3.4 years | ||
The binomial lattice option-pricing model used to value the Executive Share Option Plan contains a model for early exercise behavior. The output of the model can be used to derive the expected term of the options granted.
121
Table of Contents
MF GLOBAL HOLDINGS LTD.
NOTES TO CONSOLIDATED AND COMBINED FINANCIAL STATEMENTS
(Dollars in thousands, except per share data)
Performance Share Plan
Performance share awards, granted to selected senior employees and executive directors, are stock-based awards in which the number of shares ultimately received by the participant depends on Man Group’s achievement of a financial target. The financial target is based on Man Group’s average return on equity measured over three consecutive years, as defined by the plan. Participants are awarded shares in the plan by Man Group’s Remuneration Committee. Participants can also purchase Man Group shares using their cash bonus or by taking out a non-interest bearing loan with Man Group to further invest in the plan. Based on the shares awarded and shares purchased for further investment in the plan, participants are entitled to receive matching shares of Man Group stock if the financial target is met. All shares that are awarded through the plan vest over three to four years, but lapse if the financial target is not met for the three year measurement period. The amount of Man Group stock matched to shares in the plan ranges from 0% to 100%, depending on the degree Man Group achieved the financial target.
At the IPO, all outstanding performance share awards were allocated to participants on a pro-rata basis (based on service during the three-year performance period) and the remaining share awards were forfeited. As a result of the IPO, the holding periods applicable to shares purchased by employees lapsed and became freely tradable, subject to certain restrictions. Underlying Man Group shares will be delivered subject to the achievement of certain performance criteria.
During the year ended March 31, 2008 no shares were purchased by participants for additional investment in the plan and Man Group issued no performance share awards to employees of the Company.
Co-Investment Plan
The Co-Investment plan allows selected senior employees to use a portion of their cash bonus to purchase Man Group stock for investment within the plan. Participants can also purchase shares by taking out a non-interest bearing loan with Man Group to further invest in the plan. Shares held as investment within the plan for at least three years are matched by four shares of Man Group stock. Participants vest into the matching Man Group shares after one additional year. The plan limits the total value that can be received by a participant at 100% of their cash bonus, including both their original investment in the plan and the matching shares of Man Group stock.
As a result of the IPO, the holding periods applicable to shares purchased by employees lapsed and became freely tradable, subject to certain restrictions. Outstanding matching shares awarded to employees vested on a pro-rata basis as of the IPO, and were exercisable for nine months after the IPO. The remaining matching shares have been forfeited.
During the year ended March 31, 2008, no shares were purchased by participants for additional investment in the plan and Man Group issued no matching share awards to employees of the Company.
Employee Stock Purchase Plans
In accordance with local tax regulations in the U.K. and U.S., Man Group sponsors two employee stock purchase plans, which allow all employees to invest funds within the plan, that contain an option to purchase shares of Man Group stock at a discount, subject to certain terms and conditions. Participants in the U.K. can invest in the plan over 3 or 5 years, after which they are eligible to purchase shares at a 20% discount from the market value of Man Group stock when the investment in the plan was originally made. In the U.S., participants can invest in the plan for two years, after which they are eligible to purchase shares at a 15% discount from the market value of Man Group stock when the investment in the plan was originally made. In the U.S. plan, once vested, participants have the option of receiving cash or shares of Man Group stock within one year. If Man Group stock is selected, participants are required to hold the shares for one additional year.
In connection with the IPO, U.S. employees continued to be eligible to participate in the plan until June 30, 2007, at which time certain of their purchase rights accelerated and were exercised. U.K. employees continued to be eligible to participate in this plan for nine months after the IPO and shares purchased under the plan became freely transferable. During the year ended March 31, 2008 the Company issued 270,949 shares under the employee stock purchase plan at an average option price of $9.43 per share.
122
Table of Contents
MF GLOBAL HOLDINGS LTD.
NOTES TO CONSOLIDATED AND COMBINED FINANCIAL STATEMENTS
(Dollars in thousands, except per share data)
| NOTE 11: | INCOME TAXES |
The tax results of the Company’s U.S. operations are included in the consolidated and combined income tax returns of MF Global Holdings USA Inc. The tax results of the Company’s foreign operations are included in the tax returns of the respective jurisdictions in which the Company conducts business. The income tax provision is reflected in the Company’s consolidated and combined statements of operations.
The components of (loss)/ income before provision for income taxes, equity in earnings and minority interests are as follows:
| YEAR ENDED MARCH 31, | ||||||||||||
| 2010 | 2009 | 2008 | ||||||||||
| U.S. |
$ | (141,976 | ) | $ | 56,259 | $ | (209,420 | ) | ||||
| International |
(53,436 | ) | (46,310 | ) | 213,019 | |||||||
| Total |
$ | (195,412 | ) | $ | 9,949 | $ | 3,599 | |||||
The (benefit)/ provision for income taxes consists of:
| YEAR ENDED MARCH 31, | ||||||||||||
| 2010 | 2009 | 2008 | ||||||||||
| Current: |
||||||||||||
| U.S. |
$ | (27,728 | ) | $ | 35,927 | $ | (480 | ) | ||||
| International |
5,507 | 13,939 | 92,166 | |||||||||
| (22,221 | ) | 49,866 | 91,686 | |||||||||
| Deferred: |
||||||||||||
| U.S. |
(25,618 | ) | (2,010 | ) | (231 | ) | ||||||
| International |
(8,504 | ) | (5,979 | ) | (24,868 | ) | ||||||
| (34,122 | ) | (7,989 | ) | (25,099 | ) | |||||||
| Total |
$ | (56,343 | ) | $ | 41,877 | $ | 66,587 | |||||
123
Table of Contents
MF GLOBAL HOLDINGS LTD.
NOTES TO CONSOLIDATED AND COMBINED FINANCIAL STATEMENTS
(Dollars in thousands, except per share data)
The reconciliation of income tax (benefit)/expense before equity earnings and minority interest expense as reflected in the consolidated and combined statements of operations to the expected tax (benefit)/expense by applying the U.S. federal statutory income tax rate is as follows:
| YEAR ENDED MARCH 31, | ||||||||||||
| 2010 | 2009 | 2008 | ||||||||||
| (Loss)/income before provision for income taxes |
$ | (195,412 | ) | $ | 9,949 | $ | 3,599 | |||||
| Federal income tax (benefit)/expense at 35% |
(68,394 | ) | 3,639 | 1,260 | ||||||||
| State taxes |
(3,200 | ) | 4,559 | (12,565 | ) | |||||||
| Tax on the Spin-off |
— | — | 75,714 | |||||||||
| Non-taxable UK gains on disposition to Man Group |
— | — | (13,131 | ) | ||||||||
| Nondeductible operating expenditures |
4,506 | 5,316 | 8,710 | |||||||||
| Nondeductible goodwill and intangible assets |
4 | 20,647 | — | |||||||||
| Effect of lower overseas tax rates |
(1,737 | ) | (14,832 | ) | (25,815 | ) | ||||||
| Uncertain tax liabilities relating to operations |
3,468 | 3,597 | 12,698 | |||||||||
| Adjustments in respect of prior periods |
(3,456 | ) | 3,912 | 3,016 | ||||||||
| Impact of Domestication |
(5,196 | ) | — | — | ||||||||
| Stock-based compensation |
6,542 | 5,474 | — | |||||||||
| IPO-related costs |
— | — | 11,143 | |||||||||
| Valuation allowance change |
9,506 | 6,895 | 207 | |||||||||
| Withholding tax expense |
830 | 1,643 | 1,920 | |||||||||
| Other, net |
784 | 1,027 | 3,430 | |||||||||
| (Benefit)/provision for income taxes |
$ | (56,343 | ) | $ | 41,877 | $ | 66,587 | |||||
| Effective tax rate |
28.8 | % | 420.9 | % | 1,850.2 | % | ||||||
124
Table of Contents
MF GLOBAL HOLDINGS LTD.
NOTES TO CONSOLIDATED AND COMBINED FINANCIAL STATEMENTS
(Dollars in thousands, except per share data)
Deferred income tax assets and liabilities reflect the tax effect of temporary differences between the carrying amount of assets and liabilities for financial reporting purposes and the amounts used for the same items for income tax reporting purposes. The components of deferred tax assets and liabilities consist of the following items:
| MARCH 31, | ||||||||
| 2010 | 2009 | |||||||
| Deferred tax assets |
||||||||
| Net operating loss carry forwards |
$ | 28,163 | $ | 22,782 | ||||
| Depreciation |
12,711 | 9,638 | ||||||
| Stock-based compensation |
60,810 | 51,245 | ||||||
| Deferred compensation |
857 | 2,169 | ||||||
| Intangible assets |
48,171 | 24,592 | ||||||
| State asset |
— | 1,802 | ||||||
| Accrued rent |
2,026 | — | ||||||
| Professional fees |
3,263 | 4,610 | ||||||
| Bad debts |
2,746 | 1,915 | ||||||
| Equity investee |
— | 11,931 | ||||||
| Bonus accrual |
12,241 | — | ||||||
| Other, net |
726 | 2,972 | ||||||
| Total deferred tax assets |
171,714 | 133,656 | ||||||
| Valuation allowance |
(19,724 | ) | (14,430 | ) | ||||
| Deferred tax assets, net of valuation allowance |
151,990 | 119,226 | ||||||
| Deferred tax liabilities |
||||||||
| Intangible liabilities |
(8,166 | ) | (11,169 | ) | ||||
| Exchange membership seats |
(2,216 | ) | (1,964 | ) | ||||
| Unrealized loss |
(19,207 | ) | (26,586 | ) | ||||
| Equity investee |
(4,456 | ) | — | |||||
| Total deferred tax liabilities |
(34,045 | ) | (39,719 | ) | ||||
| Net deferred tax assets/liabilities |
$ | 117,945 | $ | 79,507 | ||||
At March 31, 2010, the Company had approximately $98,657 of net operating loss carry forwards in certain non-U.S. jurisdictions. A valuation allowance has been provided against $51,284 of these losses. Net operating losses of $77,623 have an indefinite carryforward life. Net operating losses of $18,570 will expire beginning 2026. The remaining carryforward of $2,464 will expire within the next seven years if not utilized.
As of March 31, 2010, the Company earned income that was excluded from taxable income in certain states. Additionally, the state net operating loss decreased from $318,135 as of March 31, 2009 to $252,017 as of March 31, 2010 due to utilization in fiscal year 2009. The remaining loss carry forwards will expire in future years beginning in 2019 through 2030. A valuation allowance has been provided against $155,757 of those losses on the basis that recovery is uncertain. The deferred tax assets relating to all net operating loss carry forwards and related valuation allowances are reflected, without offset, above.
The total valuation allowance for deferred tax assets of $19,724 and $14,430 at March 31, 2010 and March 31, 2009, respectively, relates principally to uncertainty of the utilization of tax loss carryforwards in various jurisdictions. The valuation allowance was calculated in accordance with US GAAP rules, which requires that a valuation allowance be established or maintained when it is “more likely than not” that all or a portion of deferred tax assets will not be realized.
Except for taxes on earnings that have been currently distributed, no additional provision has been made for taxes that would be payable on the remittance of undistributed earnings of subsidiaries or for unrecognized deferred tax liabilities for
125
Table of Contents
MF GLOBAL HOLDINGS LTD.
NOTES TO CONSOLIDATED AND COMBINED FINANCIAL STATEMENTS
(Dollars in thousands, except per share data)
temporary differences related to investments in subsidiaries. The Company expects such investments to be essentially permanent in duration, and the undistributed earnings to be permanently reinvested. A liability could arise if the Company’s intention to permanently reinvest such earnings were to change and amounts are distributed by such subsidiaries, or if such subsidiaries are disposed. It is not practicable to estimate the additional income taxes related to permanent reinvested earnings or the basis differences related to investments in subsidiaries.
Uncertain tax positions
The Company adopted US GAAP guidance in accounting for uncertain tax positions as of April 1, 2007. This guidance clarifies the criteria that must be met prior to recognition of the financial statement benefit of a position taken in a tax return.
As of adoption, the Company had gross unrecognized tax benefits of $4,740, $990 of which was recognized as a change in opening retained earnings. For the year ended March 31, 2010, the Company had gross unrecognized tax benefits of $21,950. The Company recognizes accrued interest and penalties related to unrecognized tax benefits in income tax expense. The Company had approximately $6,683 accrued for the estimated interest and penalties on unrecognized tax benefits at March 31, 2010.
The total balance of gross unrecognized tax benefits of $21,950 would, if recognized, affect the Company’s effective income tax rate in future periods. It is expected that unrecognized tax benefits will decrease in the next twelve months by approximately $8,841 as a result of expiring statutes of limitations or settlements. The Company does not expect this change to have a significant impact on the results of operations or financial position of the Company.
A reconciliation of the beginning and ending amount of unrecognized tax benefits is as follows:
| MARCH 31, | ||||||||||||
| 2010 | 2009 | 2008 | ||||||||||
| Beginning balance |
$ | 27,755 | $ | 26,078 | $ | 4,740 | ||||||
| Additions based on tax positions taken during prior periods |
4,762 | 1,571 | 2,265 | |||||||||
| Reductions based on tax positions taken during prior periods |
(12,755 | ) | (11,418 | ) | (1,030 | ) | ||||||
| Additions based on tax positions taken during the current period |
3,125 | 15,829 | 20,103 | |||||||||
| Reductions based on tax positions taken during the current period |
— | (3,100 | ) | — | ||||||||
| Reductions related to the lapse of statutes of limitations |
(937 | ) | (1,205 | ) | — | |||||||
| Ending balance |
$ | 21,950 | $ | 27,755 | $ | 26,078 | ||||||
In many cases the Company’s uncertain tax positions are related to tax years that remain subject to examination by the relevant taxable authorities. The following table summarizes these open tax years by jurisdiction with major uncertain tax positions:
| OPEN TAX YEAR | ||||
| Examination in progress |
Earliest year subject to examination | |||
| Jurisdiction |
||||
| United States |
None | 2007 | ||
| United Kingdom |
None | 2008 | ||
| NOTE 12: | EARNINGS PER SHARE |
The Company computes earnings per share in accordance with the applicable accounting standards, which discuss the accounting for earnings per share and participating securities and the two-class method. The Company’s Series A Preferred Stock is classified as participating securities whereby the holder participates in undistributed earnings with common shareholders.
126
Table of Contents
MF GLOBAL HOLDINGS LTD.
NOTES TO CONSOLIDATED AND COMBINED FINANCIAL STATEMENTS
(Dollars in thousands, except per share data)
The numerator for Basic EPS is net income attributable to MF Global Holdings Ltd., reduced by an allocation of earnings between common shareholders and the Series A Preferred Shareholder, based on their respective rights to receive dividends on the Company’s common stock as well as any undeclared dividends for the Series A Preferred Stock where the shareholder has a cumulative right to dividends. This is then reduced by dividends declared for the Series B Preferred Stock. The denominator for Basic EPS is the weighted average number of shares of common stock outstanding. If dilutive, the numerator for Diluted EPS is net income attributable to MF Global Holdings Ltd. after adjusting for the interest expense recorded on the Convertible Notes, net of tax. The denominator for Diluted EPS is the weighted average number of shares of common stock outstanding with the potential effect of stock awards outstanding, calculated as Convertible Notes, Series A and Series B Preferred Stock, if dilutive, in accordance with the if-converted method.
The Company uses the treasury stock method to reflect the potentially dilutive effect of the unvested restricted stock and unexercised stock options. In calculating the number of shares of dilutive stock outstanding, the shares of common stock underlying unvested restricted stock is assumed to have been delivered on the grant date. The assumed proceeds from the assumed vesting and delivery were calculated as the sum of (a) the amount of compensation cost attributed to future services and not yet recognized as of March 31, 2010 and (b) the amount of tax benefit, if any, that was credited to additional paid-in capital assuming vesting and delivery of the restricted stock. The tax benefit is the amount resulting from a tax deduction, if any, for compensation in excess of compensation expense recognized for financial statement reporting purposes.
The computation of earnings per share is as follows:
| YEAR ENDED MARCH 31, | ||||||||||||
| 2010 | 2009 | 2008 | ||||||||||
| Basic and diluted earnings per share: |
||||||||||||
| Numerator: |
||||||||||||
| Net loss attributable to MF Global Holdings Ltd. |
$ | (136,969 | ) | $ | (49,058 | ) | $ | (69,542 | ) | |||
| Less: Dividends declared for Series A Preferred Stock |
(16,088 | ) | (9,250 | ) | — | |||||||
| Cumulative and participating dividends |
— | (2,033 | ) | — | ||||||||
| Dividends declared on Series B Preferred Stock |
(14,625 | ) | (9,344 | ) | — | |||||||
| Net loss applicable to common shareholders |
$ | (167,682 | ) | $ | (69,685 | ) | $ | (69,542 | ) | |||
| Denominator: |
||||||||||||
| Basic and Diluted weighted average shares of common stock outstanding |
123,222,780 | 121,183,447 | 115,027,797 | |||||||||
| Basic and Diluted loss per share |
$ | (1.36 | ) | $ | (0.58 | ) | $ | (0.60 | ) | |||
The weighted average number of shares of common stock outstanding for periods prior to the Reorganization and Separation is calculated using the shares of common stock outstanding immediately following the Reorganization and Separation.
127
Table of Contents
MF GLOBAL HOLDINGS LTD.
NOTES TO CONSOLIDATED AND COMBINED FINANCIAL STATEMENTS
(Dollars in thousands, except per share data)
Diluted loss per share is the same as basic loss per share for all periods presented as the impact of outstanding stock awards, Convertible Notes, and Series A and Series B Preferred Stock is anti-dilutive. The Convertible Notes, and Series A and Series B Preferred Stock are weighted based on the period outstanding during the respective period presented. The following table presents the potential stock excluded from the computation of diluted earnings per share because the effect would have been anti-dilutive:
| YEAR ENDED MARCH 31, | ||||||
| 2010 | 2009 | 2008 | ||||
| Restricted stock units and restricted stock |
8,719,849 | 7,386,903 | 7,460,621 | |||
| Stock options |
7,119,502 | 10,133,869 | 10,883,308 | |||
| 9.0% Convertible Notes |
19,617,225 | 14,599,200 | — | |||
| Series B Preferred Stock |
14,354,067 | 10,972,013 | — | |||
| Series A Preferred Stock |
12,000,000 | 8,416,438 | — | |||
| Total |
61,810,643 | 51,508,423 | 18,343,929 | |||
| NOTE 13: | REGULATORY REQUIREMENTS |
One of the Company’s subsidiaries is registered as a futures commission merchant and broker-dealer and others are registered as local equivalents and accordingly are subject to the capital rules of the SEC, CFTC, and FSA, principal exchanges of which they are members, and other local regulatory bodies, as applicable.
The Company’s U.S. operating subsidiary, MF Global Inc. (“MFGI”), is required to maintain minimum net capital equal to the greater of the amount required by the SEC or CFTC, as defined. At March 31, 2010, the Company had net capital, as defined, of $577,020, which was $189,097 in excess of the minimum capital required to be maintained.
The Company is subject to certain notifications and other provisions of the net capital rules of the SEC regarding advances to affiliates, repayments of subordinated liabilities, dividend payments and other equity withdrawals. At March 31, 2010, the Company was in compliance with all of these provisions.
In accordance with the rules of the FSA in the U.K., the Company’s FSA-regulated subsidiary must comply with financial resources requirements, which since January 1, 2008, is subject to the requirements of the European Union’s Capital Requirements Directive. The capital held is intended to absorb unexpected losses and a minimum requirement is calculated in accordance with a standard regulatory formula that addresses the exposure to counterparty credit risk, position/market risk, foreign exchange risk, operational risk and concentration risk. Counterparty risk is calculated as a percentage of unpaid customer margin for exchange traded business and an exposure calculation for off-exchange business. Position risk is calculated by applying percentages to positions based on the underlying instrument and maturity. However, for the purposes of prudential supervision, the Company as a consolidated group is not subject to the consolidated regulatory capital requirements under the current European Union’s Capital Requirements Directive.
At March 31, 2010, the Company’s FSA-regulated subsidiary had financial resources in total, as defined, of $534,974, resource requirements of $239,251, and excess financial resources of $295,723. The Company is currently in discussion with the FSA regarding future capital requirements.
The Company is also subject to the requirements of other regulatory bodies and exchanges of which it is a member in other international locations in which it conducts business. The Company was in compliance with all of these requirements at March 31, 2010 and 2009.
128
Table of Contents
MF GLOBAL HOLDINGS LTD.
NOTES TO CONSOLIDATED AND COMBINED FINANCIAL STATEMENTS
(Dollars in thousands, except per share data)
| NOTE 14: | FINANCIAL INSTRUMENTS WITH OFF-BALANCE SHEET RISK, CONCENTRATIONS OF CREDIT RISK, AND OTHER RELATED RISKS |
The Company is exposed to a wide variety of risks, which are inherent in its business and activities. Management reviews the industry, competition, and regulations on a continuous basis to identify, assess, monitor, and manage each type of risk. Overall risk is governed by executive management, however business managers are held accountable for risks assumed within their areas of responsibility and for executing the risk management policy set by executive management. From an overall business perspective, the Company is exposed to several types of risk including: (1) volume or margin pressure that could be brought about by a general decline in volumes in the markets and products in which it offers execution and clearing services, (2) margin pressure due to market conditions, (3) diminishing client franchise due to either disintermediation by exchange or other competitors applying innovations in technology, and (4) macro-economic changes such as a fall in interest rates that would reduce the income earned on balances held on behalf of customers. Long-term exposure to any of these risks could affect not only financial performance, but also the Company’s reputation.
The Company is exposed to market risks arising from changes in equity prices, foreign currency exchange rates and interest rates. The Company seeks to mitigate market risk by employing hedging strategies that correlate rate, price and spread movements of securities owned and related financing and hedging activities. In its day to day business activities, the Company is engaged in various trading, brokerage and investing activities with counterparties, which primarily include broker-dealers, banks and other financial institutions. In the event counterparties do not fulfill their obligations, the Company may be exposed to risk of default.
Market Risk
The Company’s market risks include interest rate risk, currency rate risk, equity price risk, and commodity price risk.
Interest rate risk arises from the possibility that changes in interest rates will affect the value of financial instruments that the Company holds. The Company is exposed to interest rate risk on various forms of debt that the Company owes; client cash and margin balances and positions carried in fixed income securities, equity securities, options and futures. To manage the assets and liabilities of the Company and related interest obligations, the Company invests in various financial instruments in accordance with the Company’s internal investment policy. Any changes in interest rates can adversely change the Company’s interest income relative to the Company’s interest expenses. See note 2 for further information.
Currency risk arises from the possibility that fluctuations in foreign exchange rates will impact the value of financial instruments and the value of the Company’s assets located outside of the U.S. The Company is exposed to foreign exchange rates because the Company must keep part of its assets and liabilities in foreign currencies to meet operational, regulatory and other obligations of its non-U.S. operations.
Equity price risk arises from the possibility that equity security prices will fluctuate, affecting the value of equity securities and other instruments that derive their value from a particular stock, a defined basket of stocks, or a stock index. The Company is subject to equity price risk primarily in securities owned and securities sold, not yet purchased. The Company attempts to limit such risks by diversifying its portfolio across many different options, futures and underlying securities and avoiding concentrations of positions based on the same underlying security.
Commodity price risk arises from the possibility that commodity prices will fluctuate affecting the value of instruments directly or indirectly linked to the price of the underlying commodity. The Company is directly exposed to commodity prices through its transactions in the metals and energy markets.
While the Company generally executes transactions on a matched principal basis, it has market risk exposure (reflected in the Value at Risk measure in Item 7A) associated with limited interest rate, foreign exchange, equity and commodity positions taken for the Company’s own account to support and facilitate client orders as well as relative value positions taken by the business.
129
Table of Contents
MF GLOBAL HOLDINGS LTD.
NOTES TO CONSOLIDATED AND COMBINED FINANCIAL STATEMENTS
(Dollars in thousands, except per share data)
Credit Risk
Credit risk is the possibility that the Company may suffer a loss from the failure of clients or counterparties to meet their financial obligations, in a timely manner. The Company acts as both an agent and principal in providing execution and clearing services, for listed and OTC transactions, which exposes us to credit risk.
The Company’s default risks include both pre-settlement and settlement risk. Pre-settlement risk is the possibility that should a counterparty default on its obligations, the Company could incur a loss when it covers the resulting open position because the market price has moved against the Company. Settlement risk is the possibility that the Company may pay or release assets to a counterparty and fail to receive the settlement in turn. Many of these exposures are subject to netting agreements which reduce the net exposure to the Company. Limits for counterparty exposures are based on the creditworthiness of the counterparty and are subject to formal lines of approval. The credit risk is diversified between customers and counterparties across a wide range of markets.
For execution-only clients, the Company’s principal credit risk arises from the potential failure of clients to pay commissions. The Company is also exposed to the risk that a clearing broker may refuse to accept the client’s trade, which would require the Company to assume the positions and the resulting market risk. In such cases, the positions are reconciled with the broker and liquidated. For cleared customers that transact on a margin basis, the principal credit risk arises from the Company paying variation margin to the exchanges before receiving it from customers. Most customers are required to cover initial and variation margin with cash and are required to pay any margin deficits within 24 hours.
The Company mitigates the risk on its cleared margin business by requiring the initial margin to be paid by customers as a deposit before they can commence trading. The Company also uses software to test the adequacy of initial margins and, where appropriate, sets margin requirements at higher levels than those requested by the exchanges to minimize credit risk. Most customers are required to cover initial and variation margins with cash. Client activity levels are monitored daily to ensure credit exposures are maintained in accordance with agreed risk limits. Daily and, if required, intra-day margin calls are made on clients to reflect market movements affecting client positions. Financial analysis is performed to evaluate the effect of potential market movements on customer positions and may result in customers being asked to reduce positions. The Company generally reserves the right to liquidate any customer position immediately in the event of a failure to meet a margin call.
The Company is also exposed to the risk of default by counterparties with respect to positions with counterparties. These are mainly exchanges, clearing-houses and highly rated and internationally recognized banks.
In most markets the Company acts as an intermediary, resulting in limited market risk to the Company. The exceptions are intra-day positions in foreign exchange, fixed income, metals and energy markets where the Company acts as principal and there may be time delays between opening and closing a position. The Company may also maintain small positions overnight in these markets.
In line with market practices, the Company also provides unsecured credit lines to some customers for initial and variation margin. The Company’s exposure to credit risk associated with its trading and other activities is also measured on an individual counterparty basis, as well as by groups of counterparties that share similar attributes. Credit lines to customers are subject to formal review and approval. Concentrations of credit risk can be affected by changes in political, industry, or economic factors. To reduce the potential for risk concentration, credit limits are established and monitored in light of changing counterparty and market conditions.
In the normal course of business, the Company’s customer activities include the execution, settlement, and financing of various customer securities transactions that are loaned or borrowed. These activities may expose the Company to off-balance sheet risk in the event the customer or other broker is unable to fulfill its contracted obligations and the Company has to purchase or sell the financial instrument underlying the contract at a loss. The risk of default depends on the creditworthiness of the counterparty or issuer of the instrument. The Company controls this risk by monitoring the market value of securities pledged, by requiring adjustments of collateral levels in the event of excess market exposure, and by establishing limits for such activities that are monitored daily.
In addition, the Company has sold securities that it does not currently own and will therefore be obligated to purchase such securities at a future date. The Company has recorded these obligations in the consolidated and combined financial
130
Table of Contents
MF GLOBAL HOLDINGS LTD.
NOTES TO CONSOLIDATED AND COMBINED FINANCIAL STATEMENTS
(Dollars in thousands, except per share data)
statements at March 31, 2010, at the fair values of the related securities and will incur a loss if the fair value of the securities increases subsequent to March 31, 2010.
Operational Risk
Operational risk is defined as the risk of loss or other adverse consequence arising from inadequate or failed internal processes, people and systems or from external events. Consistent with the Company’s competitors, its operations are exposed to a broad number of these types of risks which could have significant impact on the Company’s business. To mitigate operational risks, the Operational Risk Department ensures the application of a globally consistent operational risk management framework. The framework includes firm-wide policies, standards and processes for risk identification, assessment, mitigation and reporting in order to create a more transparent and accountable operational risk environment.
Operational Risk is inherent in each of the Company’s businesses, support and control activities; therefore, the primary day-to-day responsibility for managing operational risk rests with these areas. Each area has established processes, systems and controls to manage operational risk and is responsible for reporting incidents, issues, and control and performance metrics. These reports are then summarized for senior management and governance committees. Additionally, the Company considers the inherent operational risk in new products, systems, and business activities as they are developed or modified.
As a diversified financial services firm, the Company also relies on an extensive technology platform that includes the utilization of vendor services and software as well as internally developed applications. The Company seeks to mitigate its technology exposures through the implementation of standard controls, contractual agreements, and performance monitoring. More broadly, the Company has an on-going business continuity management program designed to enable the organization to recover and restore business activities in the event of a disaster or other business disruption.
As deemed prudent, the Company mitigates the financial effect of certain operational risk events through insurance coverage and may hold economic capital to absorb potential losses.
| NOTE 15: | COMMITMENTS AND CONTINGENCIES |
Leases
The Company has operating lease arrangements with unaffiliated parties for the use of certain office facilities, equipment and computer hardware. Certain leases contain provisions for escalation. At March 31, 2010, future minimum rental payments under non-cancellable leases for office premises are as follows:
| Minimum rental payments |
|||
| 2011 |
$ | 33,013 | |
| 2012 |
20,976 | ||
| 2013 |
19,764 | ||
| 2014 |
23,062 | ||
| 2015 |
23,089 | ||
| 2016 and thereafter |
137,206 | ||
| Total |
$ | 257,110 | |
In the years ended March 31, 2010, 2009, and 2008, the Company incurred $29,128, $32,159, and $29,326 of rent expense, respectively. The Company also has operating lease agreements with Man Group.
Legal
Set forth below are the potentially material litigations and regulatory proceedings to which the Company is a party or in which the Company is involved.
131
Table of Contents
MF GLOBAL HOLDINGS LTD.
NOTES TO CONSOLIDATED AND COMBINED FINANCIAL STATEMENTS
(Dollars in thousands, except per share data)
Unauthorized Trading Incident of February 26/27, 2008
One of the Company’s brokers, Evan Dooley, trading for his own account out of a Memphis, Tennessee branch office through one of the Company’s front end order entry systems, Order Express, put on a significant wheat futures position during the late evening of February 26, 2008 and early morning of February 27, 2008. The positions were liquidated at a loss of $141,045 on February 27, 2008. The trades were unauthorized and because the broker had no apparent means of paying for the trades, the Company, as a clearing member of the exchange, was required to pay the $141,045 shortfall (the “Dooley Trading Incident”). The exchange and regulators were immediately notified, the broker was promptly terminated, and a public announcement of the loss was made by the Company the next day. As a result of the Dooley Trading Incident:
| • | Class Action Suits. The Company, Man Group, certain of its current and former officers and directors, and certain underwriters for the IPO have been named as defendants in five actions filed in the United States District Court for the Southern District of New York. These actions, which purport to be brought as class actions on behalf of purchasers of MF Global stock between the date of the IPO and February 28, 2008, seek to hold defendants liable under §§ 11, 12 and 15 of the Securities Act of 1933 for alleged misrepresentations and omissions related to the Company’s risk management and monitoring practices and procedures. The five purported shareholder class actions have been consolidated for all purposes into a single action. The Company made a motion to dismiss which has been granted, with plaintiff having a right to replead and/or appeal the dismissal. Plaintiffs made a motion to replead by filing an amended complaint, which was denied. Plaintiffs have appealed. Because the motion to dismiss was made before discovery, the litigation is in its early stages, and in the event plaintiffs successfully appeal the Company believes it has meritorious defenses. Therefore, no provision for losses has been recorded in connection with this matter. |
| • | The U.S. Attorney’s Office, Chicago Examination. The U.S. Attorney’s Office in Chicago, Illinois examined Mr. Dooley and the unauthorized trades. The Company has been cooperating with the U.S. Attorney’s Office, which has informed the Company that it is not a target of their investigation. In late April 2010, the U.S. Attorney’s Office indicted Mr. Dooley for wire fraud and violating the Commodities Exchange Act’s speculative position limits. |
| • | Commodity Futures Trading Commission Proceeding. Immediately after the Dooley Trading Incident, the CFTC, in coordination with the Chicago Mercantile Exchange (“CME”), began an investigation relating to the circumstances of the Dooley Trading Incident. During the course of that investigation, the Company established an accrual of $10,000 to cover possible civil monetary penalties in any potential CFTC action relating to the Dooley Trading Incident and the two other matters referred to below under the captions “CFTC Potential Action” and “CFTC Natural Gas Price Information Investigation” (collectively, the “CFTC Proceedings”). The three separate matters comprising the CFTC Proceedings (together with a fourth non-material matter) were settled in a single comprehensive Order (the “CFTC Settlement”). Under the CFTC Settlement, the Company, without admitting or denying any of the allegations made by the CFTC against it, accepted charges of lack of supervision in each of the matters, agreed to pay an aggregate civil monetary penalty of $10,000 and agreed to a cease and desist order. In addition, the Company agreed to specific undertakings related to its supervisory procedures and practices, as well as to engage an independent outside firm (Promontory Financial Group) to review and assess the implementation of the undertakings and certain recommendations previously made by Promontory Financial Group to, and accepted by, it. |
| • | CME Proceedings. At the same time as the CFTC Settlement, without admitting or denying the allegations made by the CME relating to the Dooley Trading Incident, the Company settled a CME Administrative Proceeding by paying a fine of $495 and agreeing to certain undertakings essentially coextensive with the CFTC undertakings referred to in the CFTC Settlement. The Company had previously established an accrual of $495 to cover any potential fines in the CME proceeding. |
| • | Retention of Consultants. The Company’s Nominating and Corporate Governance Committee, composed of certain independent Board members, hired two consultants to help advise them and, through them, the Company, on matters relating to the Dooley Trading Incident. FTI Consultants advised on technology-related matters and Promontory Financial Group advised on policies and procedures in the risk aspects of the Company’s business. |
| • | Insurance Claim. The Company filed a claim under its Fidelity Bond Insurance (the “Bond”), which provides coverage for wrongful or fraudulent acts of employees, seeking indemnification for this loss. After months of investigation, the |
132
Table of Contents
MF GLOBAL HOLDINGS LTD.
NOTES TO CONSOLIDATED AND COMBINED FINANCIAL STATEMENTS
(Dollars in thousands, except per share data)
| Company’s Bond insurers have denied payment of this claim based on certain definitions and exclusions to coverage in the Bond. They have also initiated an action against the Company in the Supreme Court of the State of New York seeking a declaration that there is no coverage for this loss under the Bond. The Company believes the insurers’ position to be in error and has filed a counterclaim in order to seek to enforce its right to payment in court. |
CFTC Potential Action
In May 2007, the Company’s U.S. operating subsidiary, MFGI, formerly known as Man Financial Inc, and two of its individual employees received what is commonly referred to as a “Wells notice” from the staff of the Division of Enforcement of the CFTC. The notice relates to two trades that the Company executed in 2004 for a customer and reported to NYMEX. This matter was settled under the terms of the CFTC Settlement referred to above under “Unauthorized Trading Incident of February 26/27, 2008—Commodity Futures Trading Commission Proceeding”.
CFTC Natural Gas Price Information Investigation
The Company has been cooperating in an investigation conducted by the U.S. Attorney’s Office in the Southern District of New York, which has brought an indictment in a related matter, and by a New York County Grand Jury. The CFTC and the SEC have also been involved in the investigation and each has brought cases in related matters. The investigation centers around trading by a market making energy trader at Bank of Montreal (“BMO”) who allegedly mismarked his book. One of the Company’s brokers did business with the BMO trader and used bid and offer prices for forward OTC trades the BMO trader sent to him as a basis for prices which the Company’s broker disseminated to its customers, including BMO, as price indications that reflected a consensus. The Company has been told that neither the Company nor its broker is a target of the Grand Jury investigation. This matter was settled under the terms of the CFTC Settlement referred to above under “Unauthorized Trading Incident of February 26/27, 2008—Commodity Futures Trading Commission Proceeding”.
Bank of Montreal (“BMO”)
On August 28, 2009, BMO instituted suit against the Company and its former broker, Joseph Saab (as well as a firm named Optionable, Inc. and five of its principals or employees), in the United States District Court for the Southern District of New York. In its complaint, BMO asserts various claims against all defendants for their alleged misrepresentation of price quotes to BMO’s Market Risk Department (“MRD”) as independent quotes when defendants knew, or should have known, that David Lee, BMO’s trader, created the quotes which, in circular fashion, were passed on to BMO through the Company’s broker, thereby enabling Lee substantially to overvalue his book at BMO. BMO further alleges that the Company and Saab knew that Lee was fraudulently misrepresenting prices in his options natural gas book and aided and abetted his ability to do so by the Company’s actions in sending price indications to the MRD of BMO, and substantially assisted Lee’s breach of his fiduciary duties to BMO as its employee. The facts underlying this action also relate to the investigation described above in “CFTC Natural Gas Price Information Investigation”. The Complaint seeks to hold all defendants jointly and severally liable and, although it does not specify an exact damage claim, it claims CAD 680,000 (approximately $669,700) as a pre-tax loss for BMO in its natural gas trading, and claims that it would not have paid brokerage commissions to the Company (and Optionable, Inc.), would not have continued Lee and his supervisor as employees at substantial salaries and bonuses, and would not have incurred substantial legal costs and expenses to deal with the Lee mispricing. The Company made a motion to dismiss the complaint which is pending before the court. This litigation is in its very earliest stages. No provision for losses has been recorded in connection with this matter.
Parabola/Tangent
In December 2006, Parabola/Tangent filed a claim in the Commercial Court in London against the Company and one of its brokers alleging alternatively fraudulent and negligent misrepresentation and breach of fiduciary duty in connection with execution-only accounts that were active in the Company’s London office between July 2001 and February 2002. The claimants sought £3,200 (approximately $5,300) in damages and speculative claims, including claims for lost profits, of up to an
133
Table of Contents
MF GLOBAL HOLDINGS LTD.
NOTES TO CONSOLIDATED AND COMBINED FINANCIAL STATEMENTS
(Dollars in thousands, except per share data)
additional £28,000 (approximately $46,100). A trial began in March 2009. In May 2009 a judgment was rendered in favor of the plaintiff and against the Company in the amount of £19,290 plus interest and costs. The Company has appealed this judgment. An expense of $8,000 was recorded in the three months ended March 31, 2009 in connection with this litigation, based on the judgment rendered, after adjusting for insurance proceeds of $23,500. In May 2010 the Court of Appeals denied the Company’s appeal and affirmed the judgment rendered by commercial court. The Company is considering its options for further appeal to the Supreme Court.
Eagletech Communications Inc., et al. v. Citigroup, Inc. et al.
The Company’s U.S. operating subsidiary, MFGI, formerly known as Man Financial Inc, was named as a co-defendant in an action filed in Florida State Court by Eagletech Communications Inc. (“Eagletech”) and three of its alleged shareholders against 21 defendants, including banks, broker-dealers and clearing brokers, as well as “100 John Doe defendants or their nominee entities”. The complaint alleges that the defendants engaged in a criminal conspiracy designed to manipulate the publicly traded share price of Eagletech stock. Plaintiffs seek unspecified compensatory and special damages, alleging that “Man Group PLC d/b/a Man Financial Inc” participated in the conspiracy by acting as a clearing broker for a broker-dealer that traded in Eagletech stock. The complaint asserts claims under RICO, the Florida Securities and Investor Protection Act, the Florida Civil Remedies for Criminal Practices Act and a related negligence claim. On May 9, 2007, defendants filed a notice removing the State Court action to Federal Court pursuant to 28 U.S.C. § 1441(a). On October 2, 2007, Plaintiffs filed a first amended complaint in the Federal Court action asserting additional claims against Man Financial Inc under Florida common law, including civil conspiracy, conversion and trespass to chattels. On February 26, 2008, the financial institution defendants, including MF Global Inc., filed a motion to dismiss seeking dismissal of all claims asserted in the amended complaint on the ground that the claims are barred by the Private Securities Litigation Reform Act (“PSLRA”) and preempted by the federal securities laws. On June 27, 2008, the Court partially granted the motion, holding that the federal RICO claims are barred by the PSLRA and dismissing the RICO claims with prejudice. The Court declined to exercise supplemental jurisdiction over the state law claims and remanded those claims to the Florida State Court. On July 25, 2008, plaintiffs filed a notice of appeal of the Court’s June 27, 2008 decision to the United States Court of Appeals for the Eleventh Circuit but subsequently withdrew its appeal. The Company is unsure of whether plaintiffs will pursue the State Court action. Since the case is in its earliest stages, it is difficult to determine exposure, if any. The Company intends to vigorously defend this matter. No provision for losses has been recorded in connection with this litigation.
Amacker v. Renaissance Asset Management Fund et. al.
In December 2007, the Company, along with four other futures commission merchants (“FCMs”), were named as defendants in an action filed in the United States District Court in Corpus Christi, Texas by 47 individuals who were investors in a commodity pool (RAM I LLC) operated by Renaissance Asset Management LLC. The complaint alleges that the Company and the other defendants violated the Commodity Exchange Act and alleges claims of negligence, common law fraud, violation of a Texas statute relating to securities fraud and breach of fiduciary duty for allegedly failing to conduct due diligence on the commodity pool operator and commodity trading advisor, having accepted executed trades directed by the commodity trading advisor, which was engaged in a fraudulent scheme with respect to the commodity pool, and having permitted the improper allocation of trades among accounts. The plaintiffs claim damages of $32,000, plus exemplary damages, from all defendants. All of the FCM defendants moved to dismiss the complaint for failure to state a claim upon which relief may be granted. Following an initial pre-trial conference, the court granted plaintiffs leave to file an amended complaint. On May 9, 2008, plaintiffs filed an amended complaint in which plaintiffs abandoned all claims except a claim alleging that the FCM defendants aided and abetted violations of the Commodity Exchange Act. Plaintiffs now seek $17,000 in claimed damages plus exemplary damages from all defendants. The Company filed a motion to dismiss the amended complaint which was granted by the court and appealed by the plaintiffs. The case is at its earliest stages so it is not possible to determine the Company’s exposure, if any. In any event, the Company intends to vigorously defend this matter. No provision for losses has been recorded in connection with this litigation.
134
Table of Contents
MF GLOBAL HOLDINGS LTD.
NOTES TO CONSOLIDATED AND COMBINED FINANCIAL STATEMENTS
(Dollars in thousands, except per share data)
Leaderguard Matter
Proceedings had been instituted against the Company’s U.K. subsidiary by the liquidator of Leaderguard Spot Forex Limited (“LSF”), a Mauritius based investment firm that became insolvent in March 2005. The Company’s U.K. subsidiary (originally through GNI Limited and then Man Financial Limited) provided foreign exchange broking services to two companies in the Leaderguard group between 2001 and 2005. The claim alleged, inter alia, that the Company was complicit in assisting the directors of various Leaderguard group companies to breach fiduciary duties owed by such directors to their companies and that the Company knowingly benefited from assets received in breach of such fiduciary duties. The claim further alleged the Company is liable to account for funds lost through transactions executed by such directors with its U.K. company which are alleged to amount to $18,000. The Leaderguard liquidator dismissed the action on July 17, 2009. No provision for losses was recorded in connection with this matter.
Class Action Suit
The Company and certain of the Company’s executive officers and directors had been named as defendants in an action filed in the United States District Court for the Southern District of New York. This action, which purported to be brought as a class action on behalf of purchasers of MF Global stock between March 17, 2008 and June 20, 2008, sought to hold defendants liable under §§ 10 and 20 of the Securities Exchange Act of 1934 for alleged misrepresentations and omissions related to the Company’s financial results and projections and capital structure. The Company filed a motion to dismiss which the court granted, with prejudice.
Voiran Trading Limited
On December 29, 2008, the Company received a letter before action from solicitors on behalf of Voiran Trading Limited (“Voiran”) which has now brought an LME arbitration proceeding. The letter and arbitration proceeding alleges that the Company’s U.K. affiliate was grossly negligent in advice it gave to Voiran between April 2005 and April 2006 in relation to certain copper futures contracts and claims $37,600 in damages. This litigation is in its very earliest stages. No provision for losses has been recorded in connection with this matter.
Sentinel Bankruptcy
The Liquidation Trustee (“Trustee”) for Sentinel Management Group, Inc. (“Sentinel”) sued MFGI in June 2009 on the theory that the Company’s withdrawal of $50,200 within 90 days of the filing of Sentinel’s bankruptcy petition on August 17, 2007 is a voidable preference under Section 547 of the Bankruptcy Code and, therefore, recoverable by the Trustee, along with interest and costs. The Company believes there are substantial defenses available to it and it intends to resist the Trustee’s attempt to recover those funds from the Company. In addition, to the extent the Trustee recovered any funds from the Company, it would be able to assert an offsetting claim in that amount against the assets available in Sentinel’s bankruptcy case. The matter is in its early stages and litigation has just commenced. No provision for losses has been recorded in connection with this claim.
Agape World
In May 2009, investors in a venture set up by Nicholas Cosmo sued Bank of America and the Company, among others, in the United States District Court for the Eastern District of New York, alleging that the Company, among others, aided and abetted Cosmo and related entities in a Ponzi scheme in which investors lost $400,000. The Company has made a motion to dismiss which has been granted with prejudice. The litigation is in its earliest stages. The Company believes it has meritorious defenses and intends to vigorously defend this matter. No provision for losses has been recorded in connection with this matter.
135
Table of Contents
MF GLOBAL HOLDINGS LTD.
NOTES TO CONSOLIDATED AND COMBINED FINANCIAL STATEMENTS
(Dollars in thousands, except per share data)
Phidippides Capital Management/Mark Trimble
In the late spring of 2009, the Company was sued in Oklahoma State Court by customers who were substantial investors with Mark Trimble and/or Phidippides Capital Management. Trimble and Phidippides may have been engaged in a Ponzi scheme. Plaintiffs allege that the Company “materially aided and abetted” Trimble’s and Phidippides’ violations of the anti-fraud provisions of the Oklahoma securities laws and they are seeking damages “in excess of” $10 each. The Company made a motion to dismiss which was granted by the court. Plaintiffs have appealed. The Company believes it has meritorious defenses and intends to vigorously defend this matter. No provision for losses has been recorded in connection with this matter.
Man Group Receivable
In late April 2009, the Company formally requested that Man Group (its largest shareholder at the time and former parent company) make a payment of $29,779 that Man Group owes to the Company in connection with the recapitalization of its balance sheet at the time of the IPO in fiscal 2008. Man Group has demanded arbitration and the Company has agreed to an arbitration by the London Court of International Arbitration (“LCIA”). As a result of this unresolved claim, the Company recorded a receivable of $29,779 in equity. If the Company prevails in its claim, the Company would expect to restore its equity by the amount it receives from Man Group (if any) and, if the Company is not successful, it would expect to write off the receivable to additional paid in capital and not to increase its equity. The reduction in equity does not affect amounts reported in the Company’s earnings, its income statement or its cash position for any prior period and the Company does not expect the resolution of the claim, whether favorable to the Company or not, to affect its earnings or its income statement for the current or any future period, although any amounts the Company recovers would increase its cash position. This matter has been set for hearing and the Company intends to pursue the claim vigorously.
Morgan Fuel/Bottini Brothers
MFGI and MF Global Market Services LLC (“Market Services”) are currently involved in litigation with a former customer of Market Services, Morgan Fuel & Heating Co., Inc. (“Morgan Fuel”) and its principals, Anthony Bottini, Jr., Brian Bottini and Mark Bottini (the “Bottinis”). The litigations arise out of trading losses incurred by Morgan Fuel in over-the-counter derivative swap transactions, which were unconditionally guaranteed by the Bottini principals.
| • | MF Global Market Services LLC v. Anthony Bottini, Jr., Brian Bottini and Mark Bottini, FINRA No. 08-03673. On October 6, 2008, Market Services commenced an arbitration against the Bottinis before the Financial Industry Regulatory Authority (“FINRA”) to recover $8,300, which is the amount of the debt owed to Market Services by Morgan Fuel after the liquidation of the swap transactions. Each of the Bottinis executed a guaranty in favor of Market Services personally and unconditionally guaranteeing payment of the obligations of Morgan Fuel upon written demand by Market Services. Market Services asserted a claim of breach of contract based upon the Bottinis’ failure to honor the guarantees. |
| • | Morgan Fuel v. MFGI and Market Services, FINRA No. 08-03879. On October 21, 2008, Morgan Fuel commenced a separate arbitration proceeding before FINRA against MFGI and Market Services. Morgan Fuel claims that MFGI and Market Services caused Morgan Fuel to incur approximately $14,200 in trading losses. Morgan Fuel seeks recovery of $5,900 in margin payments that it allegedly made to Market Services and a declaration that it has no responsibility to pay Market Services for the remaining $8,300 in trading losses. Morgan Fuel contends that MFGI and Market Services should not have allowed Morgan Fuel to enter into, or maintain, the swap transactions. The Supreme Court of New York for the County of New York had temporarily stayed the arbitration commenced by Morgan Fuel on the ground that there was no agreement to arbitrate. The motion for a permanent stay was denied and the Company appealed that decision. The Appellate Division, First Department reversed the order of the Supreme Court of New York and granted the petition to permanently stay the arbitration of Morgan Fuel’s claims. Morgan Fuel is seeking leave to appeal this decision to the Court of Appeals. |
| • | The Bottinis asserted a third-party claim against Morgan Fuel, which in turn asserted a fourth-party claim against MFGI, Market Services and Steven Bellino (a former MFGI employee) in the arbitration proceeding commenced by Market Serv- |
136
Table of Contents
MF GLOBAL HOLDINGS LTD.
NOTES TO CONSOLIDATED AND COMBINED FINANCIAL STATEMENTS
(Dollars in thousands, except per share data)
| ices. A motion to stay the fourth-party claim had also been denied by the court and the Company had appealed that decision as well. The Appellate Division, First Department reversed the order of the Supreme Court of New York and granted the petition to permanently stay this claim. Morgan Fuel is seeking leave to appeal this decision to the Court of Appeals. |
It is difficult at this stage to determine exposure, if any. In any event, the Company intends to pursue its arbitration vigorously. No provision for losses has been recorded in connection with this matter.
Other
In addition to the matters discussed above, from time to time the Company is party to litigation and regulatory proceedings that arise in the ordinary course of its business. Aside from those matters discussed above, the Company does not believe that it is party to any pending or threatened litigation or regulatory proceedings that, individually or in the aggregate, would in the opinion of management have a material adverse effect on the Company’s business, results of operations, financial condition or cash flows.
U.K. Bonus Tax
In December 2009, the U.K. government introduced legislation which would impose a 50% charge on certain discretionary bonus payments in excess of £25, made between December 9, 2009 and April 5, 2010 to U.K. employees within the financial services industry. As of March 31, 2010, this law had not been enacted and no accrual had been made with respect to this item in the Company’s financial statements. This law was enacted in April 2010. The Company continues to monitor the guidance from, and to work with, the U.K. authorities to analyze the potential application of this law on bonuses paid to its U.K. employees. At this time, the Company is still evaluating the impact the laws will have on its financial results and are holding discussions with U.K. Inland Revenue. The Company estimates that the potential liability will be in the range of $5,000 to $20,000, will be accrued during the Company’s first quarter of fiscal 2011 and paid during its second quarter of fiscal 2011.
Guarantees
The Company is required to disclose representations and warranties which it enters into and which may provide general indemnifications to others. As of March 31, 2010 and 2009, the Company has guaranteed loans to certain individuals for their purchase of exchange seats. In these arrangements, the Company can sell the exchange seats to cover amounts outstanding. As of March 31, 2010 and 2009 the Company has not recorded a guarantee liability, as the fair value of the exchange seats exceeds any potential loss on these loans.
Additionally, in its normal course of business, the Company may enter into contracts that contain such representations and warranties. The Company’s maximum exposure under these arrangements is unknown, as this would involve future claims that may be made against the Company that have not yet occurred. However, based on its experience, the Company expects the risk of loss to be remote. The Company is a member of various exchanges and clearing organizations. Under the standard membership agreement, members are required to guarantee collectively the performance of other members. Under the agreements, if another member becomes unable to satisfy its obligations to the clearing house, other members would be required to meet shortfalls. The Company’s liability under these arrangements is not quantifiable and could exceed the cash and securities they have posted as collateral. However, the Company believes that the potential for the Company to be required to make payments under these arrangements is remote, and accordingly, no liability has been recorded.
Other Commitments
Certain clearing-houses, clearing banks, and clearing firms used by the Company are given a security interest in certain assets of the Company held by those clearing organizations. These assets may be applied to satisfy the obligations of the Company to the respective clearing organizations.
137
Table of Contents
MF GLOBAL HOLDINGS LTD.
NOTES TO CONSOLIDATED AND COMBINED FINANCIAL STATEMENTS
(Dollars in thousands, except per share data)
Lines of Credit
The Company has a $1,500,000 five-year unsecured committed revolving liquidity facility. See Note 9 for further information. The Company also has uncommitted credit agreements with financial institutions, in the form of trading relationships, which facilitate execution, settlement, and clearing flow on a day-to-day basis for the Company’s clients, as well as provide evidence, as required, of liquidity to the exchanges on which it conducts business. As of March 31, 2010 and 2009, the Company had $6,200 and $22,000 of issued letters of credit, respectively.
| NOTE 16: | SEGMENT AND GEOGRAPHIC INFORMATION |
The Company has one reportable business segment, as defined by the accounting standard for disclosures about segments of an enterprise and related information. This standard requires a public enterprise to report financial information on a basis consistent with that used by management to allocate resources and assess performance. The Company is operated and managed by its chief operating decision maker on an integrated basis as a single operating segment.
Each region’s contribution to the consolidated and combined amounts is as follows:
| YEAR ENDED MARCH 31, | |||||||||
| 2010 | 2009 | 2008 | |||||||
| Revenues, net of interest and transaction-based expenses: |
|||||||||
| North America |
$ | 535,719 | $ | 787,176 | $ | 718,638 | |||
| Europe |
337,788 | 479,603 | 715,403 | ||||||
| Rest of World |
141,512 | 159,887 | 202,218 | ||||||
| Total |
$ | 1,015,019 | $ | 1,426,666 | $ | 1,636,259 | |||
| Long-lived assets: |
|||||||||
| North America |
$ | 54,342 | $ | 43,428 | $ | 34,779 | |||
| Europe |
11,422 | 13,143 | 11,336 | ||||||
| Rest of World |
7,197 | 6,146 | 8,796 | ||||||
| Total |
$ | 72,961 | $ | 62,717 | $ | 54,911 | |||
Revenues, net of interest and transaction-based expenses are attributed to geographic areas based on the location of the relevant legal entities. Rest of the world comprises primarily the Asia/Pacific region. No single customer accounted for greater than 10% of total revenues in the years ended March 31, 2010, 2009 and 2008. Revenues, net of interest and transaction-based expenses by product have not been provided as this information is impracticable to obtain.
| NOTE 17: | RELATED PARTY TRANSACTIONS |
Subsequent to the IPO, Man Group held approximately 18.6% of the Company’s outstanding common stock. During the three months ended September 30, 2009, Man Group sold, pursuant to a variable forward sale agreement, its remaining investment of approximately 18.4% of the Company’s outstanding common stock as of that date and, as such, transactions between Man Group and the Company after September 30, 2009 are no longer separately disclosed as related party transactions. Income and expense transactions between Man Group and the Company are disclosed below as related party transactions for the relevant months in the year ended March 31, 2010 and for the years ended March 31, 2009 and 2008. The Company clears transactions on behalf of certain managed investment funds which are related parties of Man Group. The Company earned commission revenues by executing and clearing brokerage transactions for these investment funds as well as incurred net interest expense. The related party revenues, net of interest and transaction-based expenses, do not reflect the interest income earned from third parties from the reinvestment of related party fund balances by the Company.
138
Table of Contents
MF GLOBAL HOLDINGS LTD.
NOTES TO CONSOLIDATED AND COMBINED FINANCIAL STATEMENTS
(Dollars in thousands, except per share data)
Employee compensation and benefits consists of amounts allocated by Man Group for shared services, as well as expenses related to the various plans sponsored by Man Group, in which the Company’s employees participated prior to July 18, 2007. Included in this, are expenses relating to stock-based compensation plans of $22,764 in the year ended March 31, 2008. Expenses of $4,521 for the year ended March 31, 2008 were charged related to benefit plans. There were no such charges in the years ended March 31, 2010 and 2009.
Revenues earned from and expenses incurred with Man Group for the years ended March 31, 2010, 2009, and 2008 are summarized as follows:
| YEAR ENDED MARCH 31, | |||||||||||
| 2010 | 2009 | 2008 | |||||||||
| Revenues |
|||||||||||
| Commissions |
$ | 11,617 | $ | 14,648 | $ | 23,320 | |||||
| Interest income |
291 | 1,407 | 357 | ||||||||
| Total revenues |
11,908 | 16,055 | 23,677 | ||||||||
| Less: Interest expense |
301 | 21,811 | 58,118 | ||||||||
| Revenues, net of interest and transaction-based expenses |
11,607 | (5,756 | ) | (34,441 | ) | ||||||
| Expenses |
|||||||||||
| Employee compensation and benefits |
109 | 1,147 | 29,475 | ||||||||
| Communications and technology |
877 | 1,345 | 2,895 | ||||||||
| Occupancy and equipment costs |
2,508 | 8,143 | 7,011 | ||||||||
| Professional fees |
2 | 3,364 | 2,818 | ||||||||
| General and other |
1,555 | 3,899 | 1,122 | ||||||||
| Total non-interest expenses |
5,051 | 17,898 | 43,321 | ||||||||
| Interest on borrowings |
— | — | 5,353 | ||||||||
| Gains on exchange seats and shares |
— | — | 97,907 | ||||||||
| Total, net |
$ | 6,556 | $ | (23,654 | ) | $ | 14,792 | ||||
The Company leases office space from and subleases office space to Man Group. In connection with the leasing of office space from Man Group, the Company receives certain office services that will continue for the duration of the lease.
In connection with the IPO, the Company entered into several transitional services agreements with Man Group pursuant to which Man Group agreed to continue to provide the Company with administrative support for certain corporate functions, such as corporate-level coordination and support services related to the Company’s regulatory capital activities, tax administration, corporate secretarial services and insurance management, for a limited transitional period. As of March 31, 2009, all such services had terminated with the exception of office services. The service agreement for office services will continue for as long as the Company leases office space from Man Group.
The Company is party to a master separation agreement with Man Group, which was executed in connection with the IPO and which governs the principal terms of the separation of the Company’s business from Man Group. The master separation agreement and other agreements contain important provisions regarding the Company’s relationship with Man Group following the completion of the IPO, including provisions relating to non-competition and non-solicitation, access, and confidentiality. Further, Man Group agreed to indemnify the Company against certain litigation and tax matters and the Company has agreed to pass certain windfall benefits to Man Group. During the year ended March 31, 2010, the Company recorded a $900 payable to Man Group within equity in relation to the tax agreements entered into in connection with the separation of the Company’s business from Man Group. During the year ended March 31, 2009, Man Group paid the Company $3,200 related to the tax agreements recognized in equity. The Company also received $62,128 in insurance proceeds from Man Group related to the PAAF matter under the legal indemnity agreement.
139
Table of Contents
MF GLOBAL HOLDINGS LTD.
NOTES TO CONSOLIDATED AND COMBINED FINANCIAL STATEMENTS
(Dollars in thousands, except per share data)
As of March 31, 2009 and 2008, the Company held receivables balances with Man Group of $95 and $716, and payables balances of $1,602 and $12,921, respectively. The Company has noted that an additional payment of $29,779 is due to the Company from Man Group in connection with the recapitalization at the time of the IPO in fiscal 2008. As a result of this unresolved claim, the Company recorded a receivable of $29,779 in equity. The Company has made the request, Man Group has demanded arbitration, and the Company has agreed to an arbitration by the LCIA. If the claim is successful, the Company would expect to restore equity by the amount received from Man Group (if any), and if the claim is not successful the Company would expect to write off the receivable to additional paid in capital and not to increase equity. The reduction in equity does not affect amounts reported in the Company’s earnings, income statement or cash position for any prior period.
The Company had subordinated borrowings from Man Group during fiscal 2008. For the year ended March 31, 2008, interest expense incurred on subordinated borrowings was approximately $5,353.
| NOTE 18: | CONVERTIBLE PREFERRED STOCK |
Non-Cumulative Convertible Preferred Stock, Series B
On June 25, 2008, the Company completed the issuance and sale of $150,000 in aggregate liquidation preference of its 9.75% Non-Cumulative Convertible Preferred Stock, Series B (the “Series B Preferred Stock”). The Company pays dividends on the Series B Preferred Stock, when, as and if declared by its board of directors, quarterly in arrears at a rate of 9.75% per year, payable on February 15, May 15, August 15 and November 15, commencing on August 15, 2008. Dividends on the Series B Preferred Stock are not cumulative and may be paid in cash, common stock or both.
The Series B Preferred Stock is convertible, at the holder’s option, at any time, initially into 9.5694 shares of common stock based on an initial conversion price of approximately $10.45 per share, subject to specified adjustments. The conversion rate will also be adjusted upon the occurrence of certain make-whole acquisition transactions and other events. On or after July 1, 2018, if the closing price of the Company’s common stock exceeds 250% of the then-prevailing conversion price for 20 trading days during any consecutive 30 trading day period, the Company may, at its option, cause the Series B Preferred Stock to be automatically converted into common stock at the then-prevailing conversion price. There is no beneficial conversion feature to be recognized at the issuance date of the Series B Preferred Stock, however, given certain conditions, a beneficial conversion feature could be recognized in the future.
The Series B Preferred Stock ranks junior to the Company’s indebtedness and senior to the common stock. Upon liquidation of the Company, holders of Series B Preferred Stock are entitled to receive a liquidation amount of $100 per share plus declared dividends prior to any distribution to holders of Common Stock. The Company used the net proceeds from the sale of the Series B Preferred Stock to repay a portion of the Company’s bridge facility.
Cumulative Convertible Preferred Stock, Series A
On July 18, 2008, the Company completed the issuance and sale of $150,000 in aggregate liquidation preference of its Cumulative Convertible Preferred Stock, Series A (the “Series A Preferred Stock”) to J.C. Flowers II L.P. (“J.C. Flowers”). The Company used the net proceeds from the sale of the Series A Preferred Stock to repay a portion of the Company’s bridge facility pursuant to its capital plan. Pursuant to certain previously disclosed adjustment provisions of its Investment Agreement with J.C. Flowers and as a result of its completed private offerings of Series B Preferred Stock and Convertible Notes, the Company paid J.C. Flowers approximately $36,300 in cash and reset the annual dividend rate on the Series A Preferred Stock, from 6.0% to 10.725%. In July 2008, the Company also paid J.C. Flowers its $4,500 fee in cash in connection with the backstop facility provided by J.C. Flowers under the Investment Agreement. The Series A Preferred Stock ranks senior to the Company’s common stock with respect to dividend rights and rights upon liquidation of the Company.
Under the terms of the Investment Agreement, J.C. Flowers agreed to purchase a minimum of 1,500 shares, for an aggregate value of $150,000 and up to a maximum of 3,000 shares, for an aggregate value of $300,000, of a newly authorized series of the Company’s convertible preferred stock, designated as 6.0% Cumulative Convertible Preferred Stock, Series A at a stated offer price which was 100% of their liquidation amount or preference, i.e. $100 per share. The Series A
140
Table of Contents
MF GLOBAL HOLDINGS LTD.
NOTES TO CONSOLIDATED AND COMBINED FINANCIAL STATEMENTS
(Dollars in thousands, except per share data)
Preferred Stock is convertible any time, at the option of the holder, into eight shares of the Company’s common stock, representing an initial conversion price of $12.50 per share.
Subject to certain exceptions, J.C. Flowers may not beneficially own 20% or more of the Company’s outstanding common stock for a period of three years after the closing. Immediately prior to signing the definitive agreement with J.C. Flowers, the Company also amended its shareholder rights plan to exclude J.C. Flowers (including any affiliate of J.C. Flowers), after the first time it becomes the beneficial owner of 15% or more of the Company’s common stock, and until such time as either it falls below the threshold or becomes the owner of 20% or more of the Company’s common stock, from the provision that triggers the shareholder rights plan when any person acquires 15% or more of the Company’s issued and outstanding common stock without approval of its board of directors.
The conversion rate and the conversion price are subject to adjustments in certain circumstances. Dividends on the Series A Preferred Stock are cumulative at the rate of 10.725% per annum, payable in cash or common stock, at the Company’s option, and holders will participate in common stock dividends, if any. Dividends are payable if, as and when determined by the Company’s board of directors, but if not paid they accumulate and dividends accrue on the arrearage at the same annual rate. Accumulated dividends on the Series A Preferred Stock become payable in full upon any conversion or any liquidation of the Company. The Company will not be permitted to pay any dividends on or to repurchase shares of its common stock during any period when dividends on the Series A Preferred Stock are in arrears. Holders will have the right to vote with holders of the common stock on an “as-converted” basis. The Company may require the holders to convert the stock at any time after May 15, 2013 when the closing price of the common stock exceeds 125% of the conversion price for a specified period. In connection with the investment, J.C. Flowers was granted the right to appoint a director to the Company’s Board of Directors. Pursuant to this right, on July 29, 2008, the Company appointed David I. Schamis to its board. In addition, if the Company fails to pay dividends on the Series A Preferred Stock for six quarterly periods, whether or not consecutive, the Series A preferred shareholders will have the right as a class to elect two additional directors to the Company’s board. See Note 9 for a discussion of the replacement capital covenant entered into in connection with the issuance of the Series A Preferred Stock.
On April 28, 2009, July 31, 2009, October 30, 2009 and January 29, 2010, the Company’s Board of Directors declared a quarterly dividend on the Series A Preferred Stock and Series B Preferred Stock in amounts of $4,022 and $3,656, respectively, in each period. These dividends had a record date of May 1, 2009, August 5, 2009, November 5, 2009 and February 5, 2010 and were paid on May 14, 2009, August 17, 2009, November 13, 2009 and February 16, 2010, respectively.
| NOTE 19: | FAIR VALUE MEASUREMENTS AND DERIVATIVE ACTIVITY |
Fair Value
The Company follows the fair value accounting standard which defines fair value, establishes a framework for measuring fair value, establishes a fair value hierarchy based on the quality of inputs used to measure fair value and enhances disclosure requirements for fair value measurements. The Company utilizes valuation techniques that maximize the use of observable inputs and minimize the use of unobservable inputs. The Company has applied this standard to all financial instruments that are required to be reported at fair value.
This standard also requires the Company to consider its own credit spreads when measuring the fair value of liabilities, including OTC derivative contracts. The Company has considered the impact of counterparty credit risk in the valuation of its assets and its own credit spreads when measuring the fair value of liabilities, including derivatives.
Securities owned, Securities sold, not yet purchased, certain Securities purchased under agreements to resell, certain Securities Sold under agreements to repurchase, certain Securities borrowed and derivative transactions are carried at fair value. The following is a description of the valuation techniques the Company applies to the major categories of assets and liabilities that are measured at fair value on a recurring basis.
| • | U.S. Treasury securities are marked from composites of end-of-day quoted prices. Accordingly, these securities are generally categorized in Level 1 of the fair value hierarchy. |
| • | The fair value of foreign government obligations is determined using quoted market prices or executable broker or dealer quotes, where observable. These securities are generally categorized in Level 1 of the fair value hierarchy. |
141
Table of Contents
MF GLOBAL HOLDINGS LTD.
NOTES TO CONSOLIDATED AND COMBINED FINANCIAL STATEMENTS
(Dollars in thousands, except per share data)
| • | Equities include mostly exchange-traded corporate equity securities and are valued based on quoted market prices. Accordingly, these securities are categorized in Level 1 of the fair value hierarchy. |
| • | Exchange-traded or listed derivative contracts the Company carries are actively traded and valued based on the quoted market prices. Accordingly, they are categorized in Level 1 of the fair value hierarchy. |
| • | U.S. Agency debentures are generally valued based on the composites of end-of-day trade prices or executable broker or dealer quotes, if applicable. Otherwise, they are priced from independent pricing sources. U.S. agency debentures are generally categorized in Level 2 of the fair value hierarchy. |
| • | Mortgage-backed securities primarily consist of U.S. government mortgage pass-throughs, liquid private-label residential mortgage-backed securities and collateralized mortgage obligations. They are generally priced from independent pricing sources and categorized in Level 2 of the fair value hierarchy. |
| • | Corporate debt securities consist primarily of U.S. corporate bonds. The fair value of corporate bonds is estimated using recently executed transactions or market quoted prices, where observable. Independent pricing sources are also used for valuation. Corporate bonds are generally categorized in Level 2 of the fair value hierarchy. |
| • | Most of the Company’s OTC derivative contracts are traded in liquid markets and include forward, swap and option contracts related to commodity prices, equity prices, foreign currencies and interest rates. The Company values these contracts based on pricing models which require a variety of pricing inputs. The pricing models used by the Company are industry-standard models for the types of derivative contracts and model selection does not require significant judgment. Pricing inputs are normally observable and they include contractual terms, market prices, yield curves, credit curves and volatility measures. Accordingly, these OTC derivative contracts are categorized in Level 2 of the fair value hierarchy. |
| • | Certain resale and repurchase agreements and securities borrowed and loaned are carried at fair value under the fair value option. These transactions are generally valued based on inputs with reasonable price transparency and are therefore generally categorized in Level 2 of the fair value hierarchy. |
| • | Shares held due to demutualization of exchanges are priced based on the latest market data available, typically the most recent bids or transactions completed. Given the limited trading activity for these instruments, these securities are categorized as Level 3 of the fair value hierarchy. |
142
Table of Contents
MF GLOBAL HOLDINGS LTD.
NOTES TO CONSOLIDATED AND COMBINED FINANCIAL STATEMENTS
(Dollars in thousands, except per share data)
The following tables summarize the Company’s financial assets and liabilities as of March 31, 2010 and 2009, by level within the fair value hierarchy.
| Level 1 | Level 2 | Level 3 | Impact of Netting and Collateral (1) |
Total as of March 31, 2010 | ||||||||||||
| Assets |
||||||||||||||||
| Securities owned |
||||||||||||||||
| U.S. government securities and federal agency debentures |
$ | 2,195,306 | $ | 1,647,723 | — | — | $ | 3,843,029 | ||||||||
| U.S. government mortgage backed securities |
— | 407,985 | — | — | 407,985 | |||||||||||
| Private label mortgage backed securities |
— | 1,584 | — | — | 1,584 | |||||||||||
| Asset backed securities |
— | 448 | — | — | 448 | |||||||||||
| Corporate debt securities |
— | 205,133 | — | — | 205,133 | |||||||||||
| Foreign government bonds |
1,117,693 | — | — | — | 1,117,693 | |||||||||||
| Equities |
418,586 | — | — | — | 418,586 | |||||||||||
| Shares held due to demutualization of exchanges |
— | — | 14,034 | — | 14,034 | |||||||||||
| Other |
1,110 | 11,700 | — | — | 12,810 | |||||||||||
| Total securities owned (4) |
$ | 3,732,695 | $ | 2,274,573 | $ | 14,034 | $ | — | $ | 6,021,302 | ||||||
| Derivative Assets |
||||||||||||||||
| Futures transactions |
$ | 3,549,003 | $ | — | $ | — | $ | (1,925,278 | ) | $ | 1,623,725 | |||||
| Foreign currency and other OTC derivative transactions |
61,972 | 1,057,190 | — | (1,036,079 | ) | 83,083 | ||||||||||
| Total derivative assets (2) |
3,610,975 | 1,057,190 | — | (2,961,357 | ) | 1,706,808 | ||||||||||
| Securities borrowed (5) (7) |
— | 1,008,534 | — | — | 1,008,534 | |||||||||||
| Securities purchased under agreements to resell (5) (6) |
— | 40,955,248 | — | (25,013,682 | ) | 15,941,566 | ||||||||||
| Total assets at fair value |
$ | 7,343,670 | $ | 45,295,545 | $ | 14,034 | $ | (27,975,039 | ) | $ | 24,678,210 | |||||
| Liabilities |
||||||||||||||||
| Securities sold, not yet purchased |
||||||||||||||||
| U.S. government securities and federal agency debentures |
$ | 2,017,197 | $ | 1,105,240 | $ | — | $ | — | $ | 3,122,437 | ||||||
| U.S. government mortgage backed securities |
— | 370,563 | — | — | 370,563 | |||||||||||
| Corporate debt securities |
— | 162,586 | — | — | 162,586 | |||||||||||
| Foreign government bonds |
543,359 | — | — | — | 543,359 | |||||||||||
| Equities |
201,558 | — | — | — | 201,558 | |||||||||||
| Other |
946 | — | — | — | 946 | |||||||||||
| Total securities sold, not yet purchased |
$ | 2,763,060 | $ | 1,638,389 | $ | — | $ | — | $ | 4,401,449 | ||||||
| Derivative liabilities |
||||||||||||||||
| Futures transactions |
$ | 3,556,612 | $ | — | $ | — | $ | 566,804 | $ | 4,123,416 | ||||||
| Foreign currency and other OTC derivative transactions |
63,908 | 1,055,513 | — | (451,090 | ) | 668,331 | ||||||||||
| Total derivative liabilities (3) |
3,620,520 | 1,055,513 | — | 115,714 | 4,791,747 | |||||||||||
| Securities sold under agreements to repurchase (5) |
— | 34,295,108 | — | (25,013,682 | ) | 9,281,426 | ||||||||||
| Total liabilities at fair value |
$ | 6,383,580 | $ | 36,989,010 | $ | — | $ | (24,897,968 | ) | $ | 18,474,622 | |||||
143
Table of Contents
MF GLOBAL HOLDINGS LTD.
NOTES TO CONSOLIDATED AND COMBINED FINANCIAL STATEMENTS
(Dollars in thousands, except per share data)
| (1) | Represents cash collateral and the impact of netting across the levels of the fair value hierarchy. Netting among positions classified within the same level is included in that level. |
| (2) | Reflects derivative assets within Receivables from customers and Receivables from brokers, dealers and clearing organizations. Excludes $1,898,574 within Receivables from customers and Receivables from brokers, dealers and clearing organizations which are accounted for at other than fair value and $4,517 of interest receivable in securities borrowed. Excludes $3,506 which is recorded in Securities owned. |
| (3) | Reflects derivative liabilities within Payables to customers and Payables to brokers, dealers and clearing organizations. Excludes $9,446,836 within Payables to customers and Payables to brokers, dealers and clearing organizations which are accounted for at other than fair value. Excludes $946 which is recorded in Securities sold, not yet purchased. |
| (4) | Includes $347,779 of Securities owned which are held in segregation. These securities have been classified within Restricted cash and segregated securities in the Consolidated Balance Sheet. |
| (5) | Excludes Securities borrowed, Securities purchased under agreements to resell and Securities sold under agreements to repurchase, which are held at contract value. |
| (6) | Includes $1,115,806 of Securities purchased under agreements to resell which are held in segregation. These securities have been classified within Restricted cash and segregated securities. |
| (7) | Includes $4,517 of interest receivable which is recorded in Receivables from brokers, dealers and clearing organizations. |
| Level 1 | Level 2 | Level 3 | Impact of Netting and Collateral (1) |
Total as of March 31, 2009 | ||||||||||||
| Assets |
||||||||||||||||
| Securities owned |
||||||||||||||||
| U.S. government securities and federal agency obligations |
$ | 2,131,812 | $ | 4,033,860 | $ | — | $ | — | $ | 6,165,672 | ||||||
| Corporate debt securities |
— | 224,958 | — | — | 224,958 | |||||||||||
| Foreign government bonds |
7,953 | — | — | — | 7,953 | |||||||||||
| Equities |
153,538 | — | — | — | 153,538 | |||||||||||
| Shares held due to demutualization of exchanges |
— | — | 14,367 | — | 14,367 | |||||||||||
| Other |
3,743 | 5,918 | — | — | 9,661 | |||||||||||
| Total securities owned (4) |
$ | 2,297,046 | $ | 4,264,736 | $ | 14,367 | $ | — | $ | 6,576,149 | ||||||
| Derivative Assets |
||||||||||||||||
| Futures transactions |
$ | 3,888,513 | $ | — | $ | — | $ | (2,475,932 | ) | $ | 1,412,581 | |||||
| Foreign currency and other OTC derivative transactions |
112,274 | 3,818,546 | — | (3,828,839 | ) | 101,981 | ||||||||||
| Total derivative assets (2) |
4,000,787 | 3,818,546 | — | (6,304,771 | ) | 1,514,562 | ||||||||||
| Total assets at fair value |
$ | 6,297,833 | $ | 8,083,282 | $ | 14,367 | $ | (6,304,771 | ) | $ | 8,090,711 | |||||
| Liabilities |
||||||||||||||||
| Securities sold, not yet purchased |
||||||||||||||||
| U.S. government securities and federal agency obligations |
$ | 1,535,795 | $ | 1,221,577 | $ | — | $ | — | $ | 2,757,372 | ||||||
| Equities |
124,209 | — | — | — | 124,209 | |||||||||||
| Other |
2,276 | 734 | — | — | 3,010 | |||||||||||
| Total securities sold, not yet purchased |
1,662,280 | 1,222,311 | — | — | 2,884,591 | |||||||||||
| Derivative liabilities |
||||||||||||||||
| Futures transactions |
$ | 3,913,972 | $ | — | $ | — | $ | (525,921 | ) | $ | 3,388,051 | |||||
| Foreign currency and other OTC derivative transactions |
132,067 | 3,900,869 | — | (3,388,355 | ) | 644,581 | ||||||||||
| Total derivative liabilities (3) |
4,046,039 | 3,900,869 | — | (3,914,276 | ) | 4,032,632 | ||||||||||
| Total liabilities at fair value |
$ | 5,708,319 | $ | 5,123,180 | $ | — | $ | (3,914,276 | ) | $ | 6,917,223 | |||||
144
Table of Contents
MF GLOBAL HOLDINGS LTD.
NOTES TO CONSOLIDATED AND COMBINED FINANCIAL STATEMENTS
(Dollars in thousands, except per share data)
| (1) | Represents cash collateral and the impact of netting across the levels of the fair value hierarchy. Netting among positions classified within the same level is included in that level. |
| (2) | Reflects derivative assets within Receivables from customers and Receivables from brokers, dealers and clearing organizations. Excludes $1,374,311 within Receivables from customers and Receivables from brokers, dealers and clearing organizations which are accounted for at other than fair value. Excludes $4,964 which is recorded in Securities owned. |
| (3) | Reflects derivative liabilities within Payables to customers and Payables to brokers, dealers and clearing organizations. Excludes $8,811,137 within Payables to customers and Payables to brokers, dealers and clearing organizations which are accounted for at other than fair value. Excludes $3,009 which is recorded in Securities sold, not yet purchased. |
| (4) | Includes $2,970,240 of Securities owned which are held in segregation. These securities have been classified within Restricted cash and segregated securities in the Consolidated Balance Sheet. |
Changes in unrealized gains and losses relating to assets or liabilities still held at the end of the period are reported in Principal transactions revenues in the consolidated and combined statements of operations. The risks or volatility associated with the transactions that make up this amount are often offset or reduced by certain hedging strategies associated with products within a different level in the fair value hierarchy (either Level 1 or Level 2). The Company generally maintains a matched book, which means positions with one counterparty are generally offset with opposite transactions with other counterparties. These hedging transactions and the associated underlying financial instruments are often classified in different levels in the fair value hierarchy.
For the year ended March 31, 2010, the Company did not have significant transfers into and out of Level 1 and Level 2 in the fair value hierarchy.
The table below provides a reconciliation of the beginning and ending balances for the major classes of assets and liabilities measured at fair value using significant unobservable inputs (Level 3). The table reflects gains and losses during the periods for all financial assets and liabilities categorized as Level 3 as of the years ended March 31, 2010 and 2009. The net unrealized losses reflected in Level 3 should be considered in the context of the factors discussed below.
| • | A derivative contract with Level 1 and/or Level 2 inputs is classified as a Level 3 financial instrument in its entirety if it has at least one significant Level 3 input. |
| • | If there is one significant Level 3 input, the entire gain or loss from adjusting only observable inputs (i.e., Level 1 and Level 2) is still classified as Level 3. |
| • | Gains or losses that have been reported in Level 3 resulting from changes in Level 1 or Level 2 inputs are frequently offset by gains or losses attributable to instruments classified in Level 1 or Level 2 or by cash instruments reported in Level 3 of the fair value hierarchy. |
Fair Value Measurements Using Significant Unobservable Inputs (Level 3)
| YEAR ENDED MARCH 31, | ||||||||
| 2010 | 2009 | |||||||
| Beginning balance |
$ | 14,367 | $ | (42,543 | ) | |||
| Total realized and unrealized losses |
(282 | ) | (1,748 | ) | ||||
| Purchases, sales and settlements, net |
59 | 62,255 | ||||||
| Transfers out of Level 3 |
(170 | ) | (3,597 | ) | ||||
| Foreign currency translation |
60 | — | ||||||
| Balance, end of period |
$ | 14,034 | $ | 14,367 | ||||
The balance at March 31, 2010 and 2009 respectively is comprised of shares held due to the demutualization of exchanges. Total realized and unrealized gains or losses represent the total gains and losses recorded for the Level 3 assets
145
Table of Contents
MF GLOBAL HOLDINGS LTD.
NOTES TO CONSOLIDATED AND COMBINED FINANCIAL STATEMENTS
(Dollars in thousands, except per share data)
and liabilities and are reported in Gains on exchange seats and shares in the consolidated and combined statements of operations. Changes in the fair value hierarchy for a specific financial asset or financial liability may result in transfers in the hierarchy level.
The fair value of long-term borrowings at March 31, 2010 and 2009 was $531,800 and $824,400, respectively. The fair value of long-term debt was determined by reference to the March 31, 2010 market values of comparably rated debt instruments.
Derivative Activity
The Company provides trade execution and clearing services for exchange-traded and over-the-counter derivative products. In connection with these trading activities, the Company may use derivative instruments to facilitate client transactions on a matched-principal basis. The Company may enter into derivative transactions generally in response to or in anticipation of client demand, primarily to facilitate the execution of existing client orders or in the expectation that future client orders will become available to fill the other side of the transaction. The Company may enter into derivatives or other financial instruments to generally offset the exposure from client transactions. The Company may also use derivative instruments to hedge its own corporate exposure to changes in foreign currency and interest rate risks and to manage its liquid corporate assets. In accordance with the accounting standard for derivatives and hedging, the Company currently does not apply hedge accounting to its derivative activities.
The Company recognizes all of its derivative contracts as either assets or liabilities in the consolidated balance sheets at fair value, which are reflected net of cash paid or received pursuant to credit support arrangements with counterparties and reported on a net-by-counterparty basis under legally enforceable netting agreements. These derivative assets and liabilities are included in Receivables from and Payables to customers, Receivables from and Payables to broker dealers and clearing organizations, Securities owned and Securities sold, not yet purchased. Changes in the fair value of all derivative instruments are recognized in Principal transactions in the consolidated and combined statements of operations.
The following table summarizes the fair value of the Company’s derivative contracts by major type on a gross basis as of March 31, 2010 and 2009.
| MARCH 31, 2010 | |||||||||||||||||||||||
| Derivative Assets (1) | Derivative Liabilities (2) | Number of Contracts (3) | |||||||||||||||||||||
| Level 1 | Level 2 | Level 3 | Total | Level 1 | Level 2 | Level 3 | Total | ||||||||||||||||
| (in thousands, except number of contracts) | |||||||||||||||||||||||
| Derivative contracts |
|||||||||||||||||||||||
| Interest rate |
$ | 1,135 | 4,345 | — | 5,480 | $ | 545 | 8,915 | — | 9,460 | 30,542 | ||||||||||||
| Foreign exchange rate |
61,008 | 407,503 | — | 468,511 | 61,220 | 386,916 | — | 448,136 | 5,394,601 | ||||||||||||||
| Equity |
6,081 | 74,463 | — | 80,544 | 6,201 | 69,651 | — | 75,852 | 1,002,329,264 | ||||||||||||||
| Commodity |
3,543,858 | 573,278 | — | 4,117,136 | 3,553,501 | 590,030 | — | 4,143,531 | 848,042 | ||||||||||||||
| Total fair value of derivative contracts |
$ | 4,671,671 | $ | 4,676,979 | |||||||||||||||||||
| Impact of netting and collateral |
2,961,357 | (115,714 | ) | ||||||||||||||||||||
| Total fair value |
$ | 1,710,314 | $ | 4,792,693 | |||||||||||||||||||
146
Table of Contents
MF GLOBAL HOLDINGS LTD.
NOTES TO CONSOLIDATED AND COMBINED FINANCIAL STATEMENTS
(Dollars in thousands, except per share data)
| MARCH 31, 2009 | ||||||||||||||||||||||
| Derivative Assets (1) | Derivative Liabilities (2) | Number of Contracts (3) | ||||||||||||||||||||
| Level 1 | Level 2 | Level 3 | Total | Level 1 | Level 2 | Level 3 | Total | |||||||||||||||
| (in thousands, except number of contracts) | ||||||||||||||||||||||
| Derivative contracts |
||||||||||||||||||||||
| Interest rate |
$ | 50 | 502 | — | 552 | $ | 49 | 734 | — | 783 | 405,875 | |||||||||||
| Foreign exchange rate |
112,267 | 358,530 | — | 470,797 | 132,060 | 368,863 | — | 500,923 | 2,751,635 | |||||||||||||
| Equity |
427 | 40,761 | — | 41,188 | 9 | 94,969 | — | 94,978 | 416,101,028 | |||||||||||||
| Commodity |
3,891,786 | 3,419,974 | — | 7,311,760 | 3,916,197 | 3,437,036 | — | 7,353,233 | 822,458 | |||||||||||||
| Total fair value of derivative contracts |
$ | 7,824,297 | $ | 7,949,917 | ||||||||||||||||||
| Impact of netting and collateral |
6,304,771 | 3,914,276 | ||||||||||||||||||||
| Total fair value |
$ | 1,519,526 | $ | 4,035,641 | ||||||||||||||||||
| (1) | Reflects derivative assets within Securities owned, Receivables from customers and Receivables from brokers, dealers and clearing organizations. Excludes non-derivatives included in Securities owned and Receivables from customers and Receivables from brokers, dealers, and clearing organizations. |
| (2) | Reflects derivative liabilities within Securities sold, not yet purchased, Payables to customers and Payables to brokers, dealers and clearing organizations. Excludes non-derivative Securities sold, not yet purchased and Payables to customers and Payables to brokers, dealers, and clearing organizations which are accounted for at other than fair value. |
| (3) | Contract equivalent is determined using industry standards and equivalent contracts in the futures market. OTC contract equivalents are determined by dividing OTC notionals by associated contract notionals. For minor currencies for which no futures contracts are traded, contract equivalents are determined to be equal to the USD notional divided by $1,000, which is consistent with other minor currency futures contracts. |
The Company’s volumes of exchange traded futures and options executed and/ or cleared, where the unrealized gain or loss is settled daily, and there is no receivable or payable associated with the contract, was 1,667,915,439 and 1,830,244,823 contracts for fiscal 2010 and 2009, respectively. These contracts are primarily cleared through commodity clearing corporations.
The table below summarizes the gains or losses relating to the Company’s trading activities as reported in Principal transactions in the consolidated statements of operations for the years ended March 31, 2010 and 2009.
| YEAR ENDED MARCH 31, | ||||||
| Type of Instrument |
2010 | 2009 | ||||
| Fixed Income/ Interest rate |
$ | 15,366 | $ | 57,767 | ||
| Foreign exchange |
60,357 | 92,587 | ||||
| Equity |
83,001 | 34,279 | ||||
| Commodity |
58,509 | 93,609 | ||||
| Other |
8,209 | 9,410 | ||||
| Total |
$ | 225,442 | $ | 287,652 | ||
Certain of the Company’s derivative trading agreements contain provisions requiring the Company to post collateral according to the Company’s long-term credit ratings. These terms are pursuant to bilateral agreements with certain counterparties, and could require immediate payment or ongoing overnight collateralization on derivative instruments in net liability positions. As of
147
Table of Contents
MF GLOBAL HOLDINGS LTD.
NOTES TO CONSOLIDATED AND COMBINED FINANCIAL STATEMENTS
(Dollars in thousands, except per share data)
March 31, 2010, the aggregate fair value of derivative agreements with credit-risk-related contingent features that were in a net liability position was $23,413, for which the Company has posted collateral of $29,861 in accordance with arrangements. If the Company’s long term credit rating had a one-notch or two-notch reduction as of March 31, 2010, the amount of additional collateral that could be called by counterparties for these derivative agreements would be approximately $3,162. As of March 31, 2009, the aggregate fair value of derivative agreements with credit-risk-related contingent features that were in a net liability position was $79,292, for which the Company has posted collateral of $37,809 in the normal course of business. If the Company’s long term credit rating had a one-notch or two-notch reduction as of March 31, 2009, the amount of additional collateral that could be called by counterparties for these derivative agreements would be approximately $39,281 or $42,985, respectively.
| NOTE 20: | SELECTED QUARTERLY FINANCIAL DATA (UNAUDITED) |
| THREE MONTHS ENDED |
YEARS ENDED | |||||||||||||||||
| JUNE 30, |
SEPTEMBER 30, | DECEMBER 31, | MARCH 31, | MARCH 31, | ||||||||||||||
| 2008 |
2009 | 2008 | 2009 | 2008 | 2009 | 2009 | 2010 | 2009 | 2010 | |||||||||
| (in thousands, except per share data) | ||||||||||||||||||
| Revenues, net of interest and transaction-based expenses: | ||||||||||||||||||
| $ 374,654 | $ 271,518 | $ 372,888 | $ 252,042 | $ 422,021 | $ 251,004 | $ 257,103 | $ 240,455 | $ 1,426,666 | $ 1,015,019 | |||||||||
| Net (loss)/income attributable to MF Global Holdings Ltd: | ||||||||||||||||||
| 14,391 | (25,152) | 9,411 | (8,333) | 38,730 | (14,618) | (111,590) | (88,866) | (49,058) | (136,969) | |||||||||
| Basic (loss)/ earnings per share: | ||||||||||||||||||
| $ 0.12 | $ (0.27) | $ 0.03 | $ (0.13) | $ 0.23 | $ (0.18) | $ (0.98) | $ (0.78) | $ (0.58) | $ (1.36) | |||||||||
| NOTE 21: | SUBSEQUENT EVENTS |
In April 2010, the Company completed a strategic assessment of its cost base and, in connection with such assessment; the Company intends to reduce its workforce by 10% to 15% in an effort to reduce operating costs. The Company is currently developing a plan to implement these reductions, which it expects to complete by the end of the Company’s first quarter of fiscal 2011. The Company expects to incur certain restructuring charges but it is unable at this time to estimate the amount of those charges.
On April 28, 2010, the Company’s Board of Directors declared a quarterly dividend on the Series A Preferred Stock and Series B Preferred Stock in an aggregate amount of $4,022 and $3,656, respectively. These dividends have a record date of May 3, 2010 and payment date of May 14, 2010.
On May 13, 2010, the Company received notice from Mr. Laurence O’Connell that he was resigning from the Company as Managing Director of Asia Pacific. Immediately following Mr. O’Connell’s resignation, Mr. Karel Harbour was appointed as interim Managing Director of Asia Pacific. Mr. Harbour will also continue in his current role as the Company’s Chief Operating Officer. Consistent with Mr. O’Connell’s employment arrangement, Mr. O’Connell will make himself available to the Company as necessary through July 19, 2010. The Company will continue to pay Mr. O’Connell’s base salary and benefits through December 31, 2010 and will facilitate his repatriation. Mr. O’Connell will not receive any other separation payments.
148
Table of Contents
| ITEM 9. | CHANGES IN AND DISAGREEMENTS WITH ACCOUNTANTS ON ACCOUNTING AND FINANCIAL DISCLOSURE |
Not applicable.
| ITEM 9A. | CONTROLS AND PROCEDURES |
We maintain “disclosure controls and procedures,” as such term is defined in Rules 13a-15(e) and 15d-15(e) under the Securities Exchange Act of 1934 (the “Exchange Act”), that are designed to ensure that information required to be disclosed by us in reports that we file or submit under the Exchange Act is recorded, processed, summarized and reported within the time periods specified in Securities and Exchange Commission rules and forms, and that such information is accumulated and communicated to our management, including our Chief Executive Officer and Chief Financial Officer, as appropriate, to allow timely decisions regarding required disclosure. In designing disclosure controls and procedures, our management necessarily was required to apply its judgment in evaluating the cost-benefit relationship of possible disclosure controls and procedures. The design of any disclosure controls and procedures also is based in part upon certain assumptions about the likelihood of future events, and there can be no assurance that any design will succeed in achieving its stated goals under all potential future conditions.
Our management, including our Chief Executive Officer and Chief Financial Officer, evaluated the effectiveness of our disclosure controls and procedures pursuant to Rule 13a-15 under the Exchange Act as of the end of the period covered by this report. Based on that evaluation, our Chief Executive Officer and Chief Financial Officer have concluded that, as of the end of the period covered by this annual report, our disclosure controls and procedures (as defined in Rule 13a-15(e) under the Exchange Act) are effective to ensure that information we are required to disclose in reports that we file or submit under the Exchange Act is recorded, processed, summarized and reported within the time periods specified in Securities and Exchange Commission rules and forms, and that such information is accumulated and communicated to our management, including our Chief Executive Officer and Chief Financial Officer, as appropriate, to allow timely decisions regarding required disclosure. In addition, no change in our internal control over financial reporting (as defined in Rule 13a-15(f) under the Exchange Act) occurred during the fourth quarter of our fiscal year ended March 31, 2010 that has materially affected, or is reasonably likely to materially affect, our internal control over financial reporting.
| ITEM 9B. | OTHER INFORMATION |
On May 27, 2010, the Board of Directors voted to amend the Company’s stockholder rights plan (sometimes called a “poison pill”) to provide that the plan will expire on June 1, 2010 rather than on July 24, 2010, the expiration date previously in effect. Upon expiration, the common stock purchase rights issued under the plan will also expire and cease to be of any further effect.
149
Table of Contents
PART III
| ITEM 10. | DIRECTORS, EXECUTIVE OFFICERS AND CORPORATE GOVERNANCE |
Directors of MF Global Holdings Ltd.
Information relating to our directors and corporate governance, including our audit committee and audit committee financial experts and the procedures by which shareholders can recommend director nominees, will be described in our Definitive Proxy Statement for our 2010 Annual Meeting of Shareholders to be held on August 12, 2010, which will be filed within 120 days of the end of our fiscal year ended March 31, 2010 (the “2010 Proxy Statement”), and is incorporated herein by reference. Information relating to our executive officers is, pursuant to Instruction 3 of Item 401(b) of Regulation S-K and General Instruction G(3) of Form 10-K, set forth at Part I, Item 4A of this Annual Report on Form 10-K under the caption “Executive Officers of MF Global”.
Section 16(a) of the Exchange Act requires our directors and executive officers, and persons who own more than 10% of a registered class of our equity securities, to file reports of ownership of, and transactions in, our equity securities with the SEC. Such directors, executive officers and 10% stockholders are also required to furnish us with copies of all Section 16(a) reports they file.
Based on a review of the copies of reports we received, and on written representations from our reporting persons, we believe that all Section 16(a) filing requirements applicable to our directors, executive officers and 10% stockholders were complied with in fiscal 2010.
| ITEM 11. | EXECUTIVE COMPENSATION |
Information relating to our executive officer and director compensation will be in the 2010 Proxy Statement and is incorporated herein by reference.
| ITEM 12. | SECURITY OWNERSHIP OF CERTAIN BENEFICIAL OWNERS AND MANAGEMENT AND RELATED STOCKHOLDER MATTERS |
Information relating to security ownership of certain beneficial owners of our common stock and information relating to security ownership of our management will be in the 2010 Proxy Statement and is incorporated herein by reference.
Equity Compensation Plan Information
The following table sets forth information regarding the outstanding options and restricted stock units on our common shares as of March 31, 2010:
| (a) | (b) | (c) | |||||||
| Plan Category |
Number of Securities to be issued upon exercise of outstanding options, warrants and rights |
Weighted Average exercise price of outstanding options, warrants and rights |
Number of securities remaining available for future issuance under equity compensation plans (excluding securities reflected in column (a)) |
||||||
| Equity Compensation Plans approved by security holders |
|||||||||
| Amended and Restated 2007 Long Term Incentive Plan |
15,513,758 | (1)(2) | $ | 19.72 | 6,918,732 | (3) | |||
| Employee Stock Purchase Plan (including subplans) |
N/A | N/A | 477,959 | ||||||
| Equity Compensation Plans not approved by security holders |
— | — | — | ||||||
| Total |
15,513,758 | $ | 19.72 | 7,396,691 | |||||
| (1) | Of these 15,756,498 securities outstanding, there are 8,394,256 restricted stock units outstanding and stock options to purchase 7,119,502 shares of Common Stock outstanding. The weighted-average exercise price in column (b) does not include the restricted stock units. The weighted average grant date fair value of unvested restricted share units is $17.42. |
150
Table of Contents
| (2) | Subject to adjustment, the Amended and Restated 2007 Long Term Incentive Plan authorized up to 24 million shares of Common Stock to be issued in connection with grants of awards. Beginning in calendar year 2009, the aggregate number of shares of Common Stock subject to the Amended and Restated 2007 Long Term Incentive Plan is increased on the first day of each fiscal year during its term by the excess of (a) 20% of the aggregate number of shares of Common Stock outstanding on the last day of the immediately preceding fiscal year over (b) the aggregate number of shares of Common Stock covered by the Amended and Restated 2007 Long Term Incentive Plan as of such date (unless the Compensation Committee determines to increase the number of shares subject to the Amended and Restated 2007 Long Term Incentive Plan by a lesser amount). During fiscal 2010, the number of shares available under the 2007 LTIP increased by 1,486,022 shares due to forfeitures/cancellations relating to terminations, by 3,016,707 shares as a result of a stock option exchange program implemented in fiscal 2010 |
| (3) | Shares available for issuance under the Amended and Restated 2007 Long Term Incentive Plan may be subject to awards of stock options, stock appreciation rights, restricted stock units, restricted stock and performance and other stock-based awards, as determined by the Compensation Committee in its discretion. The amount shown does not include shares proposed for issuance under the 2010 LTIP. |
| ITEM 13. | CERTAIN RELATIONSHIPS AND RELATED TRANSACTIONS AND DIRECTOR INDEPENDENCE |
Information regarding certain relationships and related transactions and director independence will be in the 2010 Proxy Statement and is incorporated herein by reference.
| ITEM 14. | PRINCIPAL ACCOUNTANT FEES AND SERVICES |
Information regarding principal accountant fees and services, as well as audit committee pre-approval policies and procedures, will be in the 2010 Proxy Statement and is incorporated herein by reference.
151
Table of Contents
PART IV
| ITEM 15. | EXHIBITS AND FINANCIAL STATEMENT SCHEDULES |
| (a) | Financial Statements |
INDEX TO FINANCIAL STATEMENT OF MF GLOBAL HOLDINGS LTD.
| (b) | Financial Statement Schedules. Schedules not listed above have been omitted because the information to be set forth therein is not material, not applicable or is shown in the financial statements or notes thereto. |
| (c) | The following exhibits are filed herewith or incorporated herein by reference unless otherwise indicated: |
152
Table of Contents
| Exhibit |
Description | |
| 3.1 | Certificate of Incorporation of MF Global Holdings Ltd. (incorporated by reference to Exhibit 3.1 of MF Global’s Current Report on Form 8-K12G3, filed on January 5, 2010). | |
| 3.2 | By-Laws of MF Global Holdings Ltd. (incorporated by reference to Exhibit 3.2 of MF Global’s Current Report on Form 8-K12G3, filed on January 5, 2010). | |
| 4.1 | Form of Stock Certificate (incorporated by reference to Exhibit 4.1 of MF Global’s Current Report on Form 8-K12G3, filed on January 5, 2010). | |
| 4.2 | Form of Rights Agreement between MF Global Ltd. and Computershare Trust Company, N.A., as Rights Agent.* | |
| 4.3 | Amendment No. 1 to the Rights Agreement between MF Global Ltd. and Computershare Trust Company, N.A., as Rights Agent, dated May 20, 2008 (incorporated by reference to Exhibit 4.5 of MF Global’s Annual Report on Form 10-K, filed on June 13, 2008). | |
| 4.4 | Amendment No. 2 to the Rights Agreement between MF Global Ltd. and Computershare Trust Company, N.A., as Rights Agent, dated as of January 4, 2010 (incorporated by reference to Exhibit 4.3 of MF Global’s Current Report on Form 8-K12G3, filed on January 5, 2010). | |
| 4.5 | Amendment No. 3 to the Rights Agreement between MF Global Holdings Ltd. and Computershare Trust Company, N.A., as Rights Agent, dated as of May 28, 2010. | |
| 4.6 | Form of Registration Rights Agreement by and between MF Global Ltd and J.C. Flowers II L.P. (incorporated by reference to Exhibit 4.6 of MF Global’s Annual Report on Form 10-K, filed on June 13, 2008). | |
| 4.7 | Indenture, between MF Global Ltd. and Deutsche Bank Trust Company Americas, as Trustee, Dated as of June 25, 2008, with respect to 9.00% Convertible Senior Notes due 2038 (incorporated by reference to Exhibit 4.1 of MF Global’s Current Report on Form 8-K, filed on June 26, 2008). | |
| 4.8 | First Supplemental Indenture dated as of January 4, 2010, between MF Global Holdings Ltd., a Delaware corporation, and Deutsche Bank Trust Company Americas, as Trustee (incorporated by reference to Exhibit 4.2 of MF Global’s Current Report on Form 8-K12G3, filed on January 5, 2010). | |
| 10.1 | Form of Executive Officer Employment Agreement with MF Global Ltd.* | |
| 10.2 | Terms Schedule to Employment Agreement of Thomas M. Harte with MF Global Ltd., dated May 29, 2007, by and between Man Group plc and Thomas M. Harte.* | |
| 10.3 | Amended and Restated MF Global Ltd. 2007 Long Term Incentive Plan (incorporated by reference to Exhibit 10.3 of MF Global’s Quarterly Report on Form 10-Q, filed on February 11, 2009). | |
| 10.4 | Amendment No. 1 to the MF Global Ltd. Amended and Restated 2007 Long Term Incentive Plan, effective as of January 4, 2010 (incorporated by reference to Exhibit 4.5 of MF Global’s Post-effective Amendment No. 1 to Registration Statement on Form S-8 (File No. 333-144697) filed on January 25, 2010). | |
| 10.5 | Form of Share Option Award Agreement (Employee Version).** | |
| 10.6 | Form of Share Option Award Agreement (Selected Executives Version).** | |
| 10.7 | Form of Restricted Share Unit Award Agreement (Employee Version).** | |
| 10.8 | Form of Restricted Share Unit Award Agreement (Selected Executives Version).** | |
| 10.9 | MF Global Ltd. Employee Stock Purchase Plan.** | |
| 10.10 | Amendment No. 1 to the MF Global Ltd. Employee Stock Purchase Plan, effective as of January 4, 2010 (incorporated by reference to Exhibit 4.5 of MF Global’s Post-effective Amendment No. 1 to Registration Statement on Form S-8, filed on January 25, 2010 (File No. 333-144697)). | |
153
Table of Contents
| Exhibit |
Description | |
| 10.11 | MF Global Ltd. Approval Savings-Related Share Option Plan.** | |
| 10.12 | $1,500,000,000 Liquidity Facility, dated as of June 15, 2007, among MF Global Finance USA Inc., MF Global Ltd. and the lenders named therein.* | |
| 10.13 | Form of Non-Executive Chairman Restricted Share Award Agreement.* | |
| 10.14 | Letter from MF Global to Alison J. Carnwath, dated July 5, 2007.* | |
| 10.15 | Form of Assignment and Assumption of Employment Agreement by and between MF Global Ltd. and Man Group plc.* | |
| 10.16 | Form of Non-Employee Director Restricted Share Award Agreement.* | |
| 10.17 | Lease, dated December 31, 2007, between NY-717 Fifth Avenue, L.L.C., as landlord and MF Global Holdings USA Inc., as tenant (incorporated by reference to Exhibit 10.46 of MF Global’s Annual Report on Form 10-K, filed on June 13, 2008). | |
| 10.18 | Guarantee, dated December 31, 2007, by MF Global Ltd. made in favor of NY-717 Fifth Avenue, L.L.C. (incorporated by reference to Exhibit 10.47 of MF Global’s Annual Report on Form 10-K, filed on June 13, 2008). | |
| 10.19 | Investment Agreement, dated May 20, 2008, between MF Global Limited and J.C. Flowers II L.P. (incorporated by reference to Exhibit 10.48 of MF Global’s Annual Report on Form 10-K, filed on June 13, 2008). | |
| 10.20 | Services Agreement, dated as of April 27, 1994, by and between GNI Limited and Karel Frederick Harbour (incorporated by reference to Exhibit 10.1 of MF Global’s Quarterly Report on Form 10-Q, filed on February 11, 2009). | |
| 10.21 | Employment Agreement between MF Global Ltd. and Laurie R. Ferber, dated May 15, 2009 (incorporated by reference to Exhibit 10.1 of MF Global’s Quarterly Report on Form 10-Q, filed on August 7, 2009). | |
| 10.22 | First Amendment, dated as of July 24, 2009, to that certain 5-Year Revolving Credit Facility, dated as of June 14, 2007 by and among MF Global Finance USA Inc., MF Global Finance Europe Limited, MF Global Ltd., the several banks and other financial institutions parties thereto, Citibank N.A., as syndication agent, JPMorgan Chase Bank, N.A., as administrative agent, and the parties named as documentation agents thereto (incorporated by reference to Exhibit 10.2 of MF Global’s Quarterly Report on Form 10-Q, filed on August 7, 2009). | |
| 10.23 | Form of Share Option Award Agreement (incorporated by reference to Exhibit 10.3 of MF Global’s Quarterly Report on Form 10-Q, filed on August 7, 2009). | |
| 10.24 | Form of Restricted Share Unit Award Agreement (Cliff Vesting) (incorporated by reference to Exhibit 10.4 of MF Global’s Quarterly Report on Form 10-Q, filed on August 7, 2009). | |
| 10.25 | Form of Restricted Share Unit Award Agreement (Ratable Vesting) (incorporated by reference to Exhibit 10.5 of MF Global’s Quarterly Report on Form 10-Q, filed on August 7, 2009). | |
| 10.26 | Amended and Restated Employment Agreement between MF Global Ltd. and J. Randy MacDonald, dated September 28, 2009 (incorporated by reference to Exhibit 10.1 of MF Global’s Current Report on Form 8-K, filed on October 5, 2009). | |
| 10.27 | Resignation Letter from Laurence O’Connell to MF Global Holdings Ltd., dated May 14, 2010. | |
| 10.28 | Form of Restricted Share Unit Award Agreement (Share Option Exchange) (Incorporated by reference to Exhibit 99.(A) (I)(IV) MF Global’s Tender Offer Statement in Schedule TO, filed on October 7, 2009). | |
| 10.29 | Amended and Restated Employment Agreement between MF Global Ltd. and Thomas Connolly, dated August 12, 2009 (incorporated by reference to Exhibit 10.2 of MF Global’s Quarterly Report on Form 10-Q, filed on November 6, 2009). | |
154
Table of Contents
| Exhibit |
Description | |
| 10.30 | Amended and Restated Employment Agreement between MF Global Ltd. and Michael Roseman, dated August 21, 2009 (incorporated by reference to Exhibit 10.3 of MF Global’s Quarterly Report on Form 10-Q, filed on November 6, 2009). | |
| 10.31 | Letter Agreement, dated July 18, 2008, relating to $1,500,000,000 Liquidity Facility (incorporated by reference to Exhibit 10.4 of MF Global’s Quarterly Report on Form 10-Q, filed on November 6, 2009). | |
| 10.32 | Amended and restated employment agreement between MF Global Ltd. and James Rowsell, dated September 22, 2009 (incorporated by reference to Exhibit 10.1 of MF Global’s Quarterly Report on Form 10-Q, filed on February 5, 2010). | |
| 10.33 | Transfer Agreement, dated as of February 3, 2010, between MF Global Holdings Ltd., JCF MFG Holdco LLC and J.C. Flowers II L.P. (incorporated by reference to Exhibit 10.2 of MF Global’s Quarterly Report on Form 10-Q, filed on February 5, 2010). | |
| 10.34 | Employment Agreement between MF Global Holdings Ltd. and Jon S. Corzine, dated March 23, 2010 (incorporated by reference to Exhibit 10.1 of MF Global’s Current Report on Form 8-K, filed on March 23, 2010). | |
| 10.35 | Letter Agreement between Jon S. Corzine Contract and J.C. Flowers & Co. LLC, dated March 23, 2010 (incorporated by reference to Exhibit 10.2 of MF Global’s Current Report on Form 8-K, filed on March 23, 2010). | |
| 10.36 | Share Option Award Agreement between MF Global Holdings Ltd. and Jon S. Corzine, dated as of April 7, 2010. | |
| 10.37 | Capital Replacement Covenant (incorporated by reference to Exhibit 1.1 of MF Global’s Current Report on Form 8-K, filed on July 18, 2008). | |
| 10.38 | Form of Trademark Agreement by and between Man Group plc and MF Global Ltd.* | |
| 10.39 | Deed relating to the Recapitalization of MF Global Ltd., dated as of July 9, 2007, by and between Man Group plc and MF Global Ltd.* | |
| 10.40 | Settlement Agreement, dated October 23, 2008, between MF Global Ltd. and Man Group Plc with certain insurance companies (incorporated by reference to Exhibit 10.1 of MF Global’s Current Report on Form 8-K, filed on October 29, 2008). | |
| 10.41 | Sublease, dated as of March 1, 2010, between Swiss re Financial Services Corporation and MF Global Inc. | |
| 10.42 | Form of Agreement of Lease, dated as of March , 2010, between Park Avenue Plaza Owner LLC and MF Global Inc. | |
| 12.1 | Computation of Ratio of Earnings to Fixed Charges and Preferred Dividends. | |
| 21.1 | List of Subsidiaries. | |
| 23.1 | Consent of PricewaterhouseCoopers LLP. | |
| 24.1 | Power of Attorney (included in the signature page hereto). | |
| 31.1 | Certification of Jon S. Corzine, Chief Executive Officer, pursuant to Section 302 of the Sarbanes—Oxley Act of 2002. | |
| 31.2 | Certification of Jon S. Corzine, Chief Executive Officer, pursuant to Section 906 of the Sarbanes—Oxley Act of 2002, 18 U.S.C. Section 1350. | |
| 32.1 | Certification of John R. MacDonald, Chief Financial Officer, pursuant to Section 302 of the Sarbanes—Oxley Act of 2002. | |
| 32.2 | Certification of John R. MacDonald, Chief Financial Officer, pursuant to Section 906 of the Sarbanes—Oxley Act of 2002, 18 U.S.C. Section 1350. | |
| * | Incorporated by reference to MF Global’s Registration Statement on Form F-1 (File No. 333-143395) filed on May 31, 2007, relating to MF Global’s initial public offering of its common shares, as amended. |
| ** | Incorporated by reference to MF Global’s Quarterly Report on Form 10-Q filed on November 13, 2007. |
155
Table of Contents
Pursuant to the requirements of Section 13 or 15(d) of the Securities Exchange Act of 1934, the Registrant has duly caused this report to be signed on its behalf by the undersigned, thereunto duly authorized.
| MF Global Holdings Ltd. | ||||||||
| Date: |
May 27, 2010 |
By: | /s/ JON S. CORZINE | |||||
| Name : Jon S. Corzine | ||||||||
| Title : Chief Executive Officer | ||||||||
KNOW ALL PERSONS BY THESE PRESENTS, that each person whose signature appears below constitutes and appoints Jon S. Corzine, J. Randy MacDonald and Henri J. Steenkamp, and each of them his or her true and lawful attorneys-in-fact and agents, each with full power of substitution and resubstitution, for him or her and in his or her name, place and stead, in any and all capacities, to sign any and all amendments to this Annual Report on Form 10-K for the fiscal year ended March 31, 2010, and to file the same, with all exhibits thereto and other documents in connection therewith, with the Securities and Exchange Commission hereby ratifying and confirming all that said attorneys-in-fact and agents, or any of them or their substitute or substitutes, may lawfully do or cause to be done by virtue hereof.
Pursuant to the requirements of the Securities Exchange Act of 1934, this Report has been signed below by the following persons on behalf of the Registrant and in the capacities and on the dates indicated.
| Signature |
Position |
Date | ||
| /S/ JON S. CORZINE Jon S. Corzine |
Chief Executive Officer and Director | May 27, 2010 | ||
| /S/ J. RANDY MACDONALD J. Randy MacDonald |
Chief Financial Officer | May 27, 2010 | ||
| /S/ HENRI J. STEENKAMP Henri J. Steenkamp |
Chief Accounting Officer (Principal Accounting Officer) |
May 27, 2010 | ||
| /S/ DAVID P. BOLGER David P. Bolger |
Director | May 27, 2010 | ||
| /S/ ALISON J. CARNWATH Alison J. Carnwath |
Director | May 27, 2010 | ||
| /S/ EILEEN S. FUSCO Eileen S. Fusco |
Director | May 27, 2010 | ||
| /S/ DAVID GELBER David Gelber |
Director | May 27, 2010 | ||
| /S/ MARTIN GLYNN Martin Glynn |
Director | May 27, 2010 | ||
| /S/ EDWARD L. GOLDBERG Edward L. Goldberg |
Director | May 27, 2010 | ||
| /S/ DAVID I. SCHAMIS David I. Schamis |
Director | May 27, 2010 | ||
| /S/ ROBERT S. SLOAN Robert S. Sloan |
Director | May 27, 2010 | ||
156