Attached files
| file | filename |
|---|---|
| 8-K - FORM 8-K - PUBLIC SERVICE ELECTRIC & GAS CO | d8k.htm |
 PSEG
Public
Service
Enterprise
Group
Capital Research High Yield Conference
New York, New York
May 25, 2010
Exhibit 99 |
 2
Forward-Looking Statement
Readers are cautioned that statements contained in this presentation about our and our
subsidiaries' future performance, including future revenues, earnings, strategies,
prospects and all other statements that are not purely historical, are
forward-looking statements for purposes of the safe harbor provisions under The Private Securities
Litigation Reform Act of 1995. Although we believe that our expectations are based on
reasonable assumptions, we can give no assurance they will be achieved. The results or
events predicted in these statements may differ materially from actual results or
events. Factors which could cause results or events to differ from current expectations include,
but are not limited to:
•
Adverse changes in energy industry, law, policies and regulation, including market
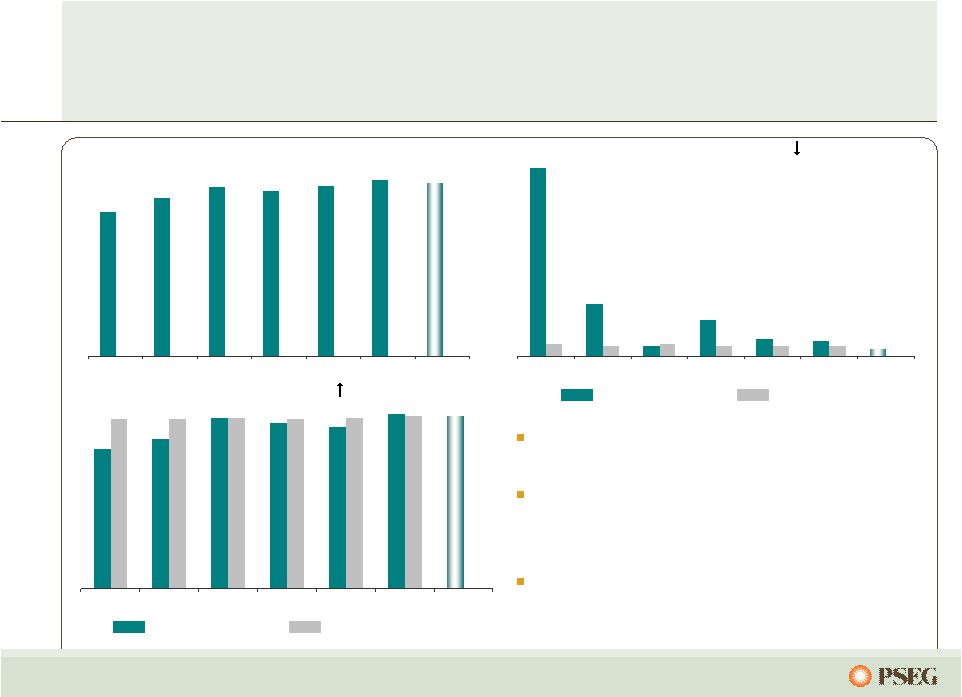
structures and rules, and reliability standards. •
Any inability of our transmission and distribution businesses to obtain adequate and
timely rate relief and regulatory approvals from federal and state regulators.
•
Changes in federal and state environmental regulations that could increase our costs or
limit operations of our generating units. •
Changes in nuclear regulation and/or developments in the nuclear power industry
generally, that could limit operations of our nuclear generating units.
•
Actions
or
activities
at
one
of
our
nuclear
units
located
on
a
multi-unit
site
that
might
adversely
affect
our
ability
to
continue
to
operate
that
unit
or
other
units
at
the
same
site.
•
Any inability to balance our energy obligations, available supply and trading
risks. •
Any deterioration in our credit quality.
•
Availability of capital and credit at commercially reasonable terms and our ability to
meet cash needs. •
Any
inability
to
realize
anticipated
tax
benefits
or
retain
tax
credits.
•
Changes
in
the
cost
of
or
interruption
in
the
supply
of
fuel
and
other
commodities
necessary
to
the
operation
of
our
generating
units.
•
Delays or unforeseen cost escalations in our construction and development
activities. •
Increase in competition in energy markets in which we compete.
•
Adverse performance of our decommissioning and defined benefit plan trust fund
investments, and changes in discount rates and funding requirements.
•
Changes in technology and increased customer conservation.
For further information, please refer to our Annual Report on Form 10-K, including
Item 1A. Risk Factors, and subsequent reports on Form 10-Q and Form 8-K filed with the
Securities and Exchange Commission. These documents address in further detail our
business, industry issues and other factors that could cause actual results to differ
materially from those indicated in this presentation. In addition, any
forward-looking statements included herein represent our estimates only as of today and should not be
relied upon as representing our estimates as of any subsequent date. While we may elect
to update forward-looking statements from time to time, we specifically disclaim any
obligation to do so, even if our internal estimates change, unless otherwise required
by applicable securities laws. |
 3
GAAP Disclaimer
PSEG presents Operating Earnings in addition to its Net Income reported in
accordance with accounting principles generally accepted in the United States
(GAAP). Operating Earnings is a non-GAAP financial measure that differs from Net
Income because it excludes the impact of the sale of certain non-core
domestic and international assets and material impairments and
lease-transaction-related charges. PSEG presents Operating Earnings
because management believes that it is appropriate for investors to consider
results excluding these items in addition to
the results reported in accordance with GAAP. PSEG believes that
the non-GAAP
financial measure of Operating Earnings provides a consistent and comparable
measure of performance of its businesses to help shareholders understand
performance trends. This information is not
intended to be viewed as an alternative
to GAAP information. The last two slides in this presentation include a list of items
excluded from Net Income to reconcile to Operating Earnings, with a reference to
that slide included on each of the slides where the non-GAAP information
appears. |
 PSEG
–
Defining
the
Future
Ralph Izzo
Chairman, President and Chief Executive Officer
Caroline Dorsa
Executive Vice President and Chief Financial Officer |
 5
PSEG:
the
right
mix
for
the
opportunities of today and tomorrow
PSE&G positioned
to meet NJ’s
energy policy and
economic growth
objectives
with $5.3 billion
investment program.
Electric & Gas Delivery
and Transmission
PSEG Power’s
low-cost baseload
nuclear and
coal fleet
is geographically well
positioned and
environmentally
responsible.
Regional Wholesale Energy
PSEG Energy Holdings
positioned to pursue
attractive renewable
generation opportunities:
•
Solar
•
Offshore wind
•
Compressed Air Energy
Storage (CAES)
Renewable Investments |
 6
A successful track record…
…
provides the confidence to capitalize on the opportunities of tomorrow.
PSEG Power resumed independent control of nuclear fleet, produced record levels of
generation and achieved top quartile performance; fossil fleet retrofitted to
meet more stringent environmental requirements.
PSE&G consistently recognized for reliability; investment programs expanded to
meet NJ’s goals for economic growth and clean energy.
Business focus improved; balance sheet strengthened; Holdings’
financial risk lessened with
sale of international investments, termination of offshore leases
Operational and financial focus has allowed PSEG to meet/exceed earnings objectives in
each of the past three years.
History of returning cash to shareholders through common dividend.
2007
2008
2009 |
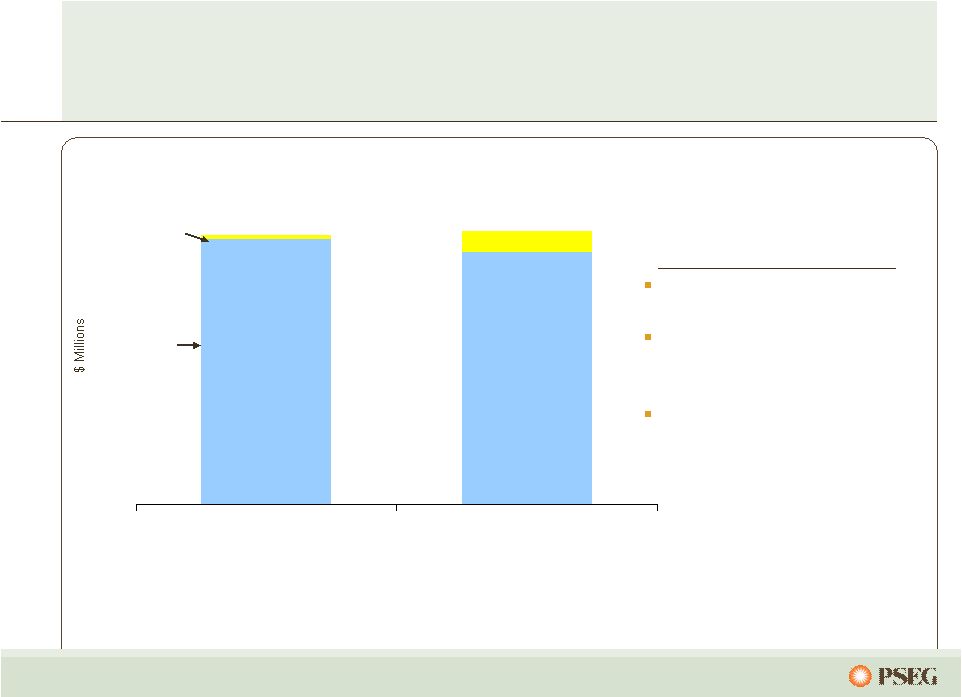
    7
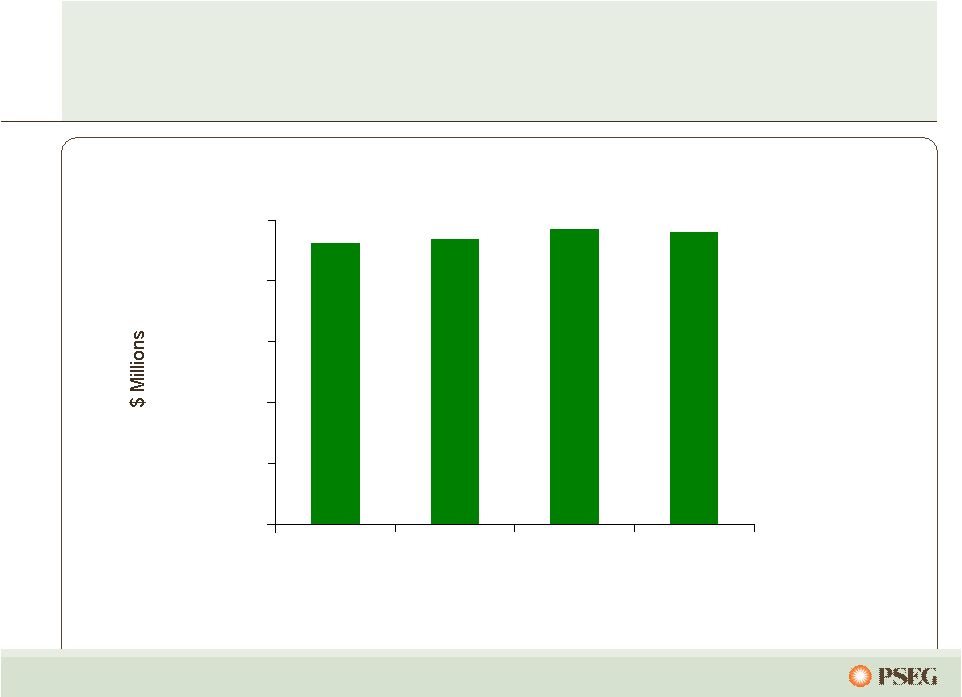
Earnings growth achieved…
…
through higher energy market pricing, increased production and lower
costs.
$2.68
$3.03
$3.12
2007 Operating Earnings*
2008 Operating Earnings*
2009 Operating Earnings*
* See page 64 for Items excluded from Income from Continuing Operations to
reconcile to Operating Earnings. |
       8
Tomorrow’s energy market will reward…
…an operationally efficient, environmentally responsible,
integrated generation, transmission and distribution business.
Higher margins driven by
environmentally
responsible &
operationally flexible
energy supply
Superior operations =
customer satisfaction
+ higher value
Business driven by the
need to address
environmental issues
and stable pricing
Infrastructure
investment to
support reliability +
improve performance |
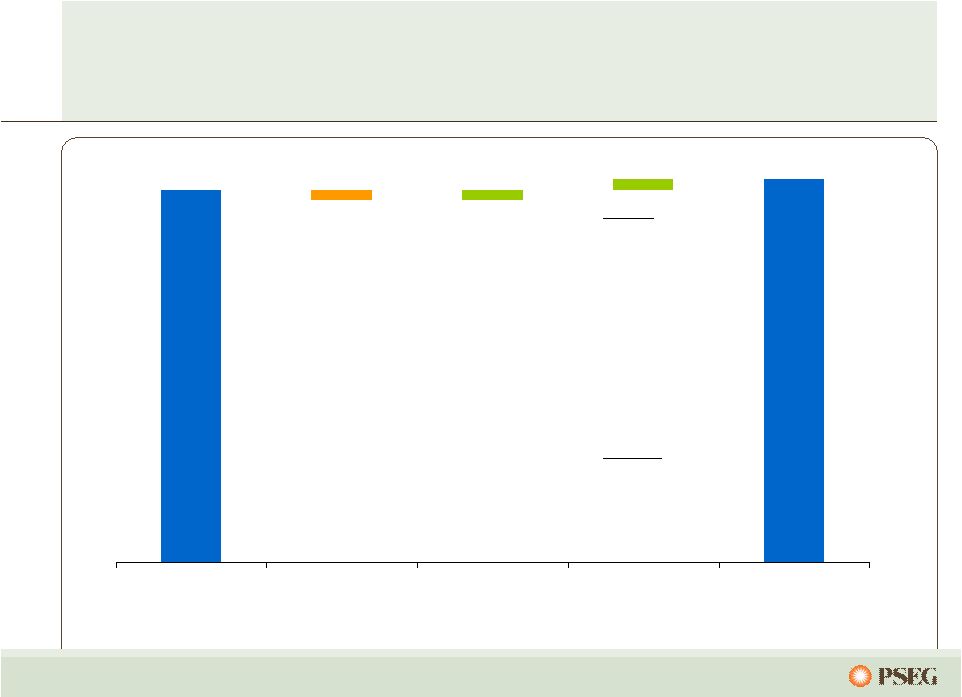
   9
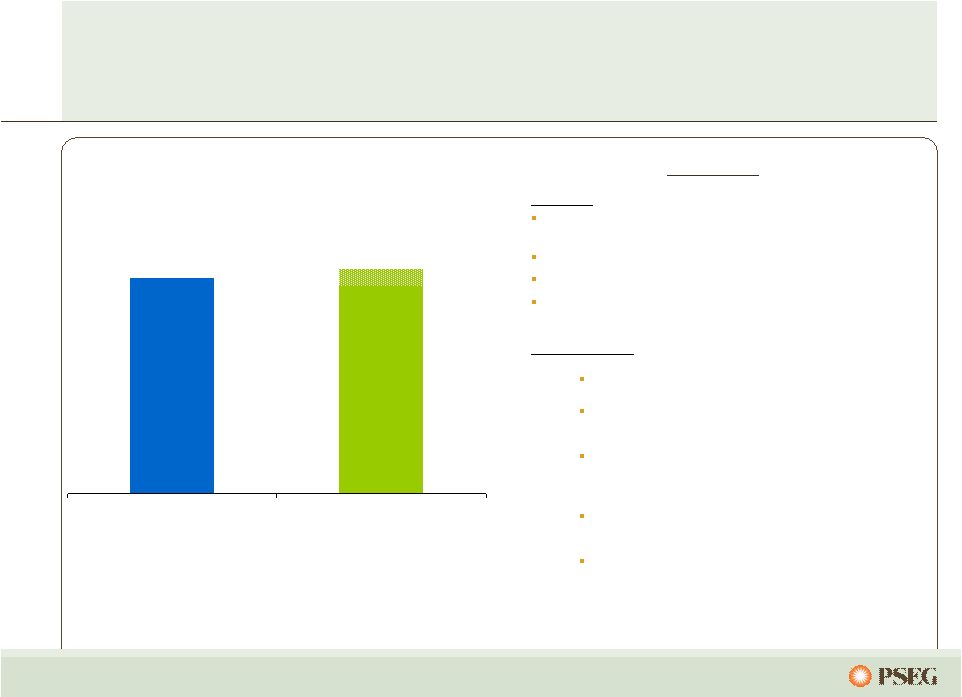
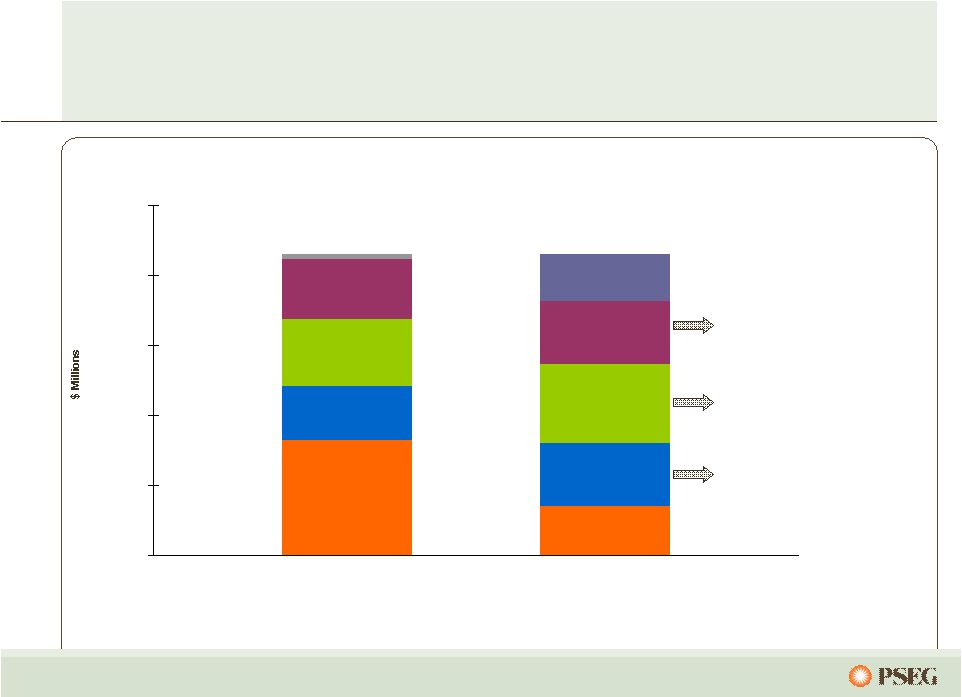
Investment programs, hedge profile
and cost control support 2010 outlook
$3.12
$3.00 - $3.25
2009 Operating Earnings*
2010 Guidance
* See page 64 for Items excluded from Income from Continuing Operations to
reconcile to Operating Earnings. |
 10
$0.84
0.01
(0.01)
(0.01)
(0.10)
$0.95
0.00
0.25
0.50
0.75
1.00
PSEG EPS Reconciliation –
Q1 2010 versus
Q1 2009
Q1 2010
operating
earnings*
Q1 2009
operating
earnings*
Interest
Higher volume
offset by lower
prices (0.05)
BGSS and trading
(0.04)
O&M (0.02)
Increase in
effective tax rate
related to new
healthcare
legislation (0.02)
Depreciation,
interest and other
0.03
PSEG Power
Weather (0.02)
O&M (0.02)
Electric margin
0.01
Transmission
margin 0.01
Other 0.01
PSE&G
PSEG Energy
Holdings
Enterprise
Lower project
earnings and
lower gains
on lease sales
* See page 65 for Items excluded from Income from Continuing Operations to
reconcile to Operating Earnings. |
 11
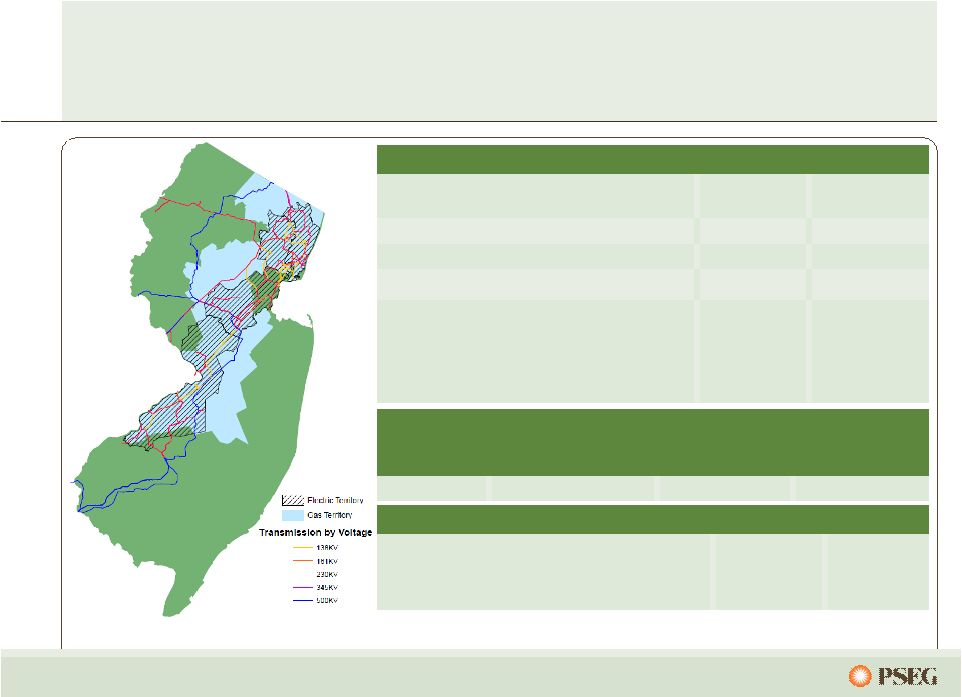
PSE&G is the largest utility in New Jersey providing
electric, gas and transmission services,…
…and delivering renewable and energy efficiency solutions for customers.
*
Actual
** Weather normalized = estimated annual growth per year over forecast
period
*** Lifetime GWh + Lifetime Dtherms
converted to GWh
60%
31%
Residential
36%
58%
Commercial
0.4%**
0.4% -
1.3%**
Projected
Annual
Load
Growth
(2009
–
2012)
Sales Mix
3,500 M Therms
41,961 GWh
Electric Sales and Gas Sold and Transported
(0.4%)*
(0.6%)*
Historical
Annual
Load
Growth
(2005
-
2009)
4%
11%
Industrial
1.7 Million
3.2%
Gas
2.1 Million
3.0%
Customers
Growth
(2004 –
2009)
Electric
0.5%*
Historical Annual
Peak Load Growth
2005-2009
1,442
Network Circuit Miles
Key Statistics
Transmission
2.1%**
Projected PJM
Peak Load Growth
2009-2012
13,512 GWh
230 GWh
Energy Efficiency Initiative (lifetime equivalent)***
80 MW
1 MW
Solar 4 All
11.6 MW
2009
Renewables
and Energy Efficiency
Solar Loan
81 MW
Total |
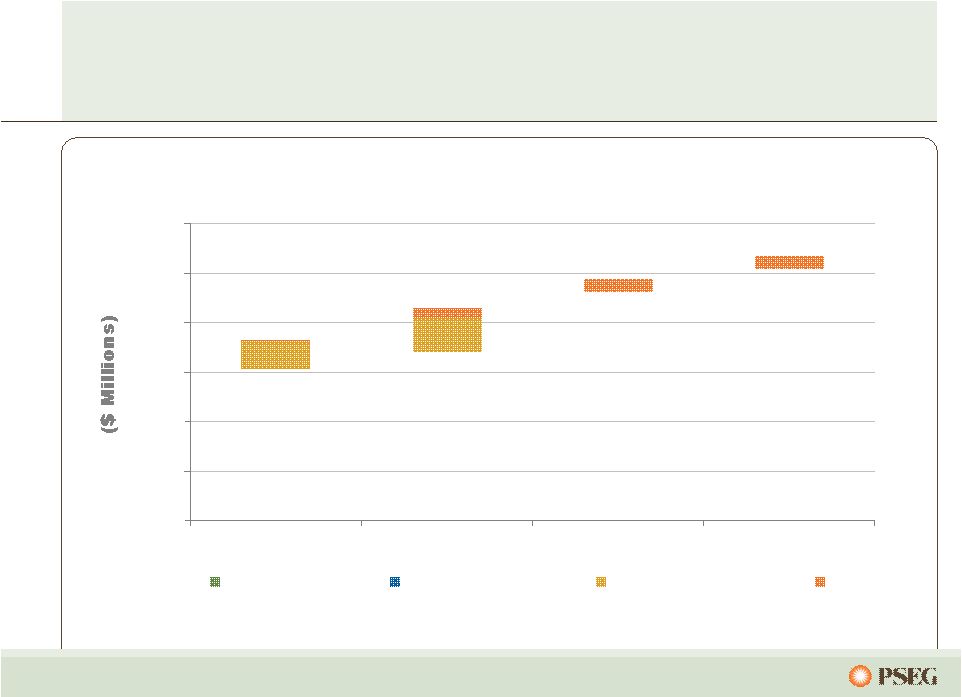                               12
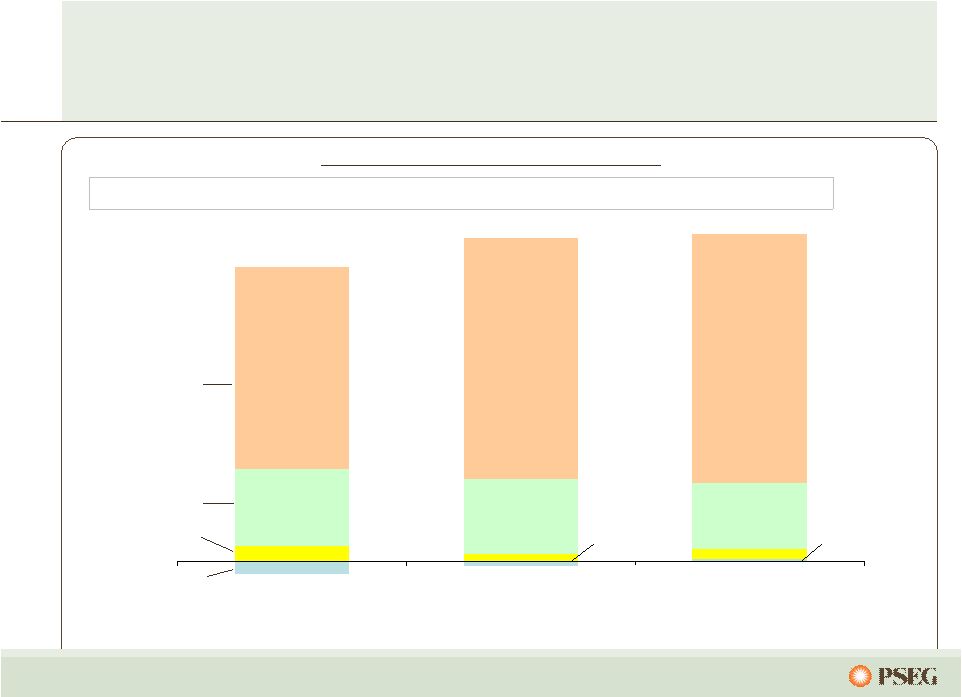
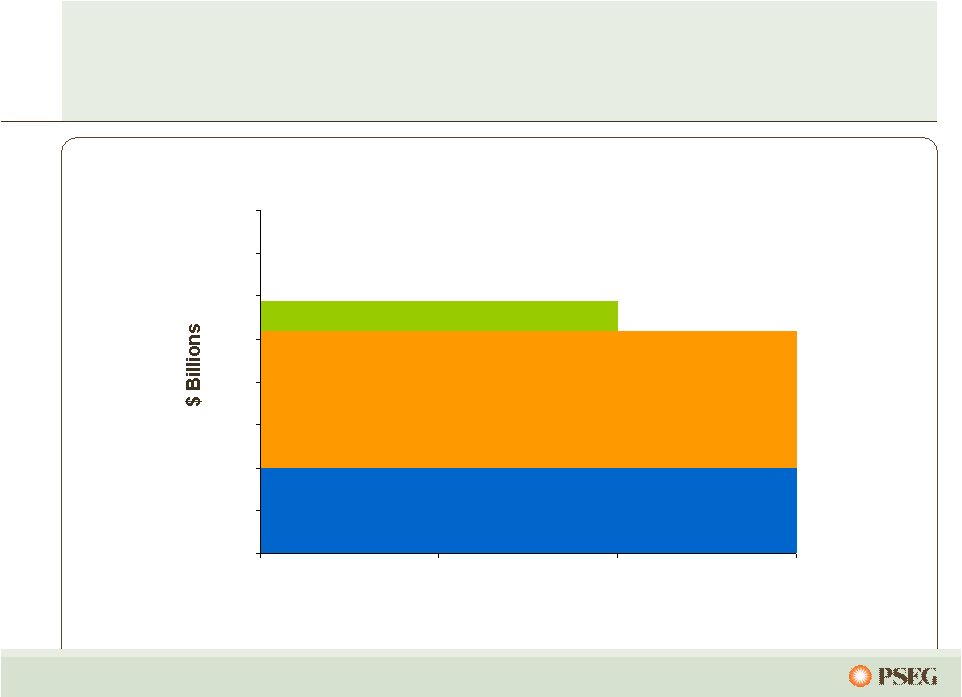
PSE&G’s investment program provides opportunity
for 14% annualized growth in rate base
PSE&G Rate Base
0
2,000
4,000
6,000
8,000
10,000
12,000
2009
2010
2011
2012
Gas Distribution
Electric Distribution
Electric Transmission
EMP |
 13
Projects to NY
Neptune HVDC project (685
MW) Sayreville to Long Island
Linden VFT project (330 MW)
Linden to Staten Island
Bergen O66 project (670 MW*)
Bergen to ConEd's
West 49th
St
Bergen U2-100 project (800
MW**) connecting Bergen to
NY
Projects to NJ
PSE&G’s evaluation of
the proposed backbone
Transmission projects:
Susquehanna -
Roseland
Branchburg-
Roseland-Hudson
As a result NJ will need new generation, DSM or additional transmission
imports.
Total Import
Capability
~ 2,000 MW
Total Export
Capability
~ 2,500 MW
2010-2020 NJ Summer Peak
Growth Rate = 1.6%
Sources: Imports: PSE&G Estimates; Exports: PJM 2009 RTEP; Load
Growth: PJM 2010 Load Forecast Report NJ’s load is expected to grow
3,450MW by 2020, with net imports decreasing ~500MW.
* Project has firm contract for 320MW
** Project in queue –
no firm contracts |
 14
Low-cost portfolio
Regional focus in competitive, liquid
markets
Assets favorably located near
customers/load centers
Many units east of PJM constraints
Southern NEPOOL/ Connecticut
Texas assets –
low cost combined cycle
Market knowledge and experience to
maximize the value of our assets
…
with low cost plants, in good locations, within solid markets.
Power’s
assets
drive value in a dynamic environment…
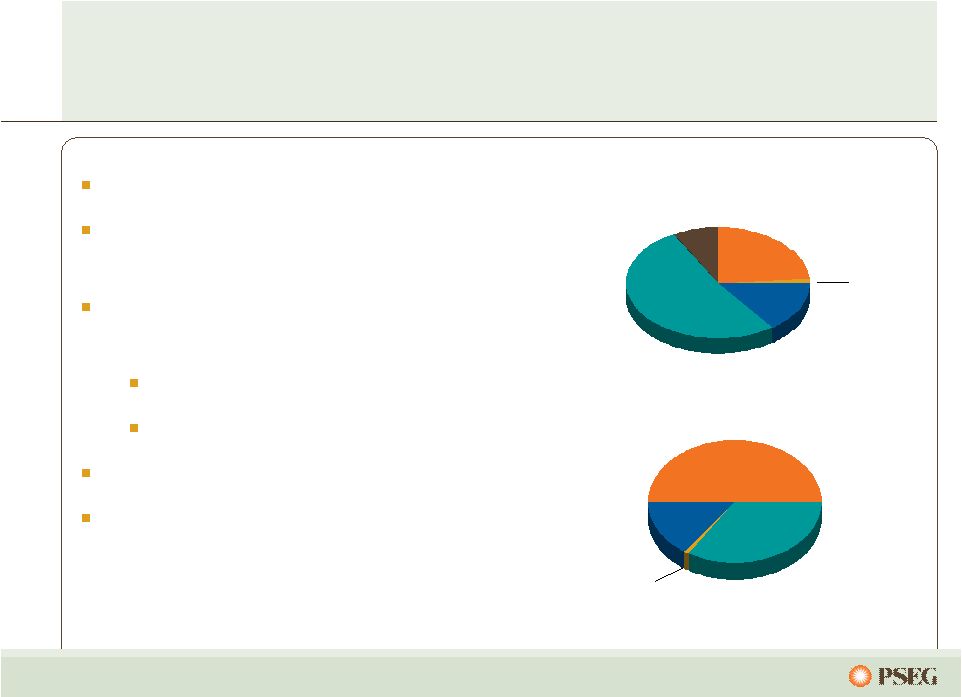
15%
52%
8%
Fuel Diversity
Coal
Gas
Oil
Nuclear
Pumped
Storage
1%
Energy Produced
(Twelve months ended December 31, 2009)
Total GWh: 59,808
51%
15%
34%
Pumped Storage
& Oil <1%
Nuclear
Coal
Gas
Total MW: 15,548
24%
8% |
 15
…
while maintaining optionality under a variety of conditions.
Power’s PJM assets along the dispatch
curve enables us to optimize profitability…
X
X
Ancillary Revenue
X
X
X
X
Capacity Revenue
X
X
Energy Revenue
X
X
Dual Fuel
Peaking units
Baseload units
Load following units
Illustrative
Salem
Hope
Creek
Keystone
Conemaugh
Hudson 2
Linden 1,2
Burlington 8-9-11
Edison 1-2-3
Essex 10-11-12
Bergen 1
Sewaren 1-4
Hudson 1
Mercer1, 2
Bergen 2
Sewaren 6
Mercer 3
Kearny 10-11
Linden 5-8 / Essex 9
Burlington 12 / Kearny 12
Peach
Bottom
Nuclear
Coal
Combined Cycle
Steam
Peaking
Yards
Creek
National Park
Salem 3
Bergen 3 |
 16
0
50
100
150
200
250
Source: EPA, EIA (2006 and
2007) and PSEG Projection
Power’s coal assets will have completed
many environmental upgrades by 2010…
…resulting in dramatically lower emissions.
0
2
4
6
8
10
12
14
0
10
20
30
40
50
60
PSEG Projected NOX Emission Rate for 2011
versus 2008 400 U.S. Coal Plants
Conemaugh
Hudson
Bridgeport
Mercer Keystone
NOx
Keystone
Bridgeport
Conemaugh
Hudson Mercer
SO
2
PSEG Projected SO2 Emission Rate for 2011
versus 2008 400 U.S. Coal Plants
Keystone
Conemaugh
Bridgeport
Mercer
Mercury
PSEG Projected HG Emission Rate for 2011
versus 2008 400 U.S. Coal Plants
Hudson |
 …with sites in the eastern part of PJM.
Reliability
Pricing
Model
–
locational
value
of Power’s generating fleet recognized…
With nearly 1/3 of its capacity in PS North and nearly 2/3 of its capacity in MAAC
and EMAAC, Power’s assets in congested locations received higher
pricing in the 2013/2014 RPM Auction. PJM Capacity Available to Receive Auction Pricing
0
2,000
4,000
6,000
8,000
10,000
12,000
09/10
10/11
11/12
12/13
13/14
•
Locational value of Power’s
fleet recognized
•
Bid for 90MW of new
capacity accepted for
2013/2014; in-service
June 2013
•
On schedule to complete
178MW of previously cleared
peaking capacity by June 2012
$27.73
$16.46
$110.00
$174.29
$102.04
Rest of Pool
$245.00
$185.00
PSEG North Zone
$245.00
PSEG
$133.37
$139.73
2012 / 2013
$226.15
$245.00
2013/2014
$110.00
$174.29
$191.32
MAAC
$110.00
$174.29
$191.32
Eastern MAAC
2011 / 2012
2010 / 2011
2009 / 2010
$/MW-day
PJM Zones |
 18
0%
25%
50%
75%
100%
2010
2011
2012
$0
$10
$20
$30
$40
$50
$60
$70
$80
$90
0%
25%
50%
75%
100%
2010
2011
2012
$0
$50
$100
$150
Power’s hedging program provides near-
term stability from market volatility…
…
while remaining open to long-term market forces.
Estimated EPS impact of
$10/MWh PJM West around the
clock price change* (~$2/mmbtu
gas change)
Contracted Capacity
Price
(right
scale)
* As of March 31, 2010 Assuming normal market commodity correlation and
demand **
Excludes Texas – No capacity market
Power has
contracted for a
considerable
percentage of its
future output
over the next two
years at
attractive prices.
The pricing for
most of Power’s
capacity has been
fixed through May
2013, with the
completion of
auctions in PJM
and NE.
% sold
(left
scale)
$0.30 -
$0.60
$0.10 -
$0.30
$0.05 -
$0.10
Contracted Energy
Price
(right
scale)
% sold
(left
scale)
**
* |
 19
Sources
Uses
PSEG’s
internally generated cash flow
enables Power…
…
to strengthen its long term balance sheet; support the
shareholder dividend; and, allows PSE&G to retain earnings for
growth.
Sources
Uses
Cash
from Ops
Net Debt
Redemption
Investment
Dividends
to Parent
for payment
to
shareholders
Power
2009–2012 Sources and Uses
Cash from
Ops*
Net Debt
Issuance
Intercompany
Capital
Contribution
Investment
PSE&G
2009-2012 Sources and Uses
* Cash from Operations adjusts for securitization principal repayments ~
$0.8B |
 20
PSEG is advantaged…
…
with a strong balance sheet and cash flow to pursue
an investment program that seizes the opportunities of tomorrow.
Right Assets,
Right Markets
Operational
Flexibility
Environmental
Infrastructure
Improvements
2010
Integrated business model with assets located close to
load centers
Dispatch flexibility of operating assets and trading
capability supports margins in full-requirements markets
Environmentally responsible; pursuing investments in
renewables; nuclear uprates
Investments to improve reliability and functionality of grid
|
 21
PSEG value proposition
PSEG provides investors with a balanced portfolio of assets within a
shifting landscape for energy.
PSEG’s
focus on operational excellence and O&M control will yield
benefits now, and over the long-term.
PSEG’s
capital commitments are focused on improving reliability and
service quality at attractive risk-adjusted returns.
PSEG’s
strong balance sheet and cash flow support a capital program
that will benefit shareholders through ongoing support of dividends and
opportunity for future growth. |
 Appendix |
 23
Q1 Operating Earnings by Subsidiary
$ 482
(4)
11
123
$ 352
2009
$ 425
3
7
117
$ 298
2010
Operating Earnings
Earnings per Share
--
0.01
Enterprise
$ 0.95
$ 0.84
Operating Earnings*
0.02
0.01
PSEG Energy Holdings
0.24
0.23
PSE&G
$ 0.69
$ 0.59
PSEG Power
2009
2010
$ millions (except EPS)
Quarter ended March 31
* See page 65 for Items excluded from Income from Continuing Operations to
reconcile to Operating Earnings. |
 24
PSEG Power –
Gross Margin Performance
$0
$25
$50
$75
2010
2009
$63
$55
Quarter ended March 31
Power’s gross margin affected by lower pricing and customer migration which
offset 7% increase in production.
Combined cycle gas units maintained strong contribution to operations.
No change versus year ago; higher prices
offset decline in generation.
$18
Texas
Regional Performance
$12
$27
$748
Q1 Gross
Margin ($M)
Q1 Performance
Region
Increase in generation supported margin.
New York
Contribution to margin hurt by lower prices.
New
England
Q1 contribution to gross margin ($M)
declined 5.0% versus year ago; decline in
price and migration offset increase in
production.
PJM
PSEG Power Gross Margin ($/MWh)*
* Excludes Texas
Increase in generation was predominantly from combined cycle and
coal with continued strong nuclear. |
 PSEG
Power |
 26
Our nuclear performance has improved…
11.1
3.1
0.6
2.1
1.0
0.9
0.4
0.7
0.6
0.7
0.6
0.6
0.6
2004
2005
2006
2007
2008
2009
2010 Target
25
27
29
28
29
30
30
2004
2005
2006
2007
2008
2009
2010 Target
79.0
85.0
97.0
94.0
91.7
99.0
98.0
96
96
97
96
97
98
2004
2005
2006
2007
2008
2009
2010 Target
Salem station set a new generation record.
Highest combined Salem and Hope Creek
Nuclear site output in Power’s history
Top quartile INPO Index
…
as we maintain our drive for excellence.
Nuclear Generation Output*
(000’s GWh)
Forced
Loss
Rate
(
)
(%)
INPO
Index
(
)
NJ Units
1st
Quartile
NJ Units
1st
Quartile
* Total PS share nuclear generation |
 27
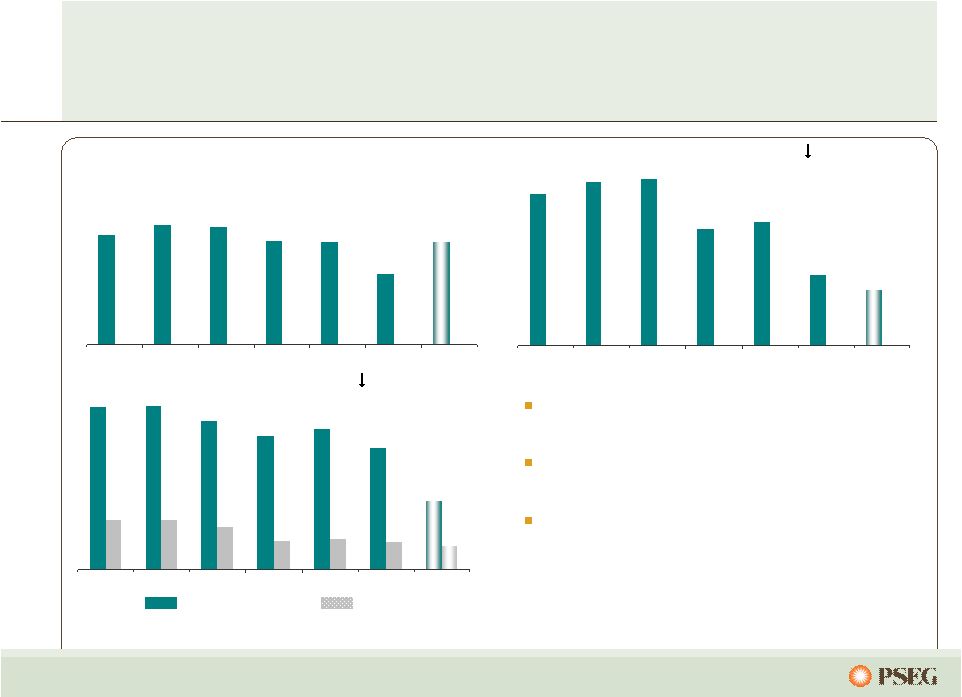
Power’s coal fleet has shown improvement…
14
15
15
13
13
9
13
2004
2005
2006
2007
2008
2009
2010 Target
10.3
11.1
11.3
7.9
8.4
4.8
3.8
2004
2005
2006
2007
2008
2009
2010 Target
1.11
1.12
1.01
0.91
0.96
0.83
0.47
0.34
0.34
0.29
0.20
0.21
0.19
0.16
2004
2005
2006
2007
2008
2009
2010 Target
Market conditions reduced output in 2009
Operational results greatly improved
Environmental footprint improved
…
and back-end technology investments will prepare us for the future.
Output
(000’s GWh)
Forced
Outage
Rate
(
)
(% EFORD)
SO
2
and
NOx
Rates
(
)
(lb/mmbtu)
SO2
NOx |
 28
Power’s combined cycle fleet is creating
value…
5
4
8
10
20
20
18
2004
2005
2006
2007
2008*
2009*
2010
Target*
3.4
7
3.4
2.5
1.8
1.5
0.8
2004
2005
2006
2007
2008*
2009*
2010
Target*
8079
7847
7928
7768
7587
7507
7452
2004
2005
2006
2007
2008*
2009*
2010
Target*
Output
(000’s GWh)
Forced
Outage
Rate
(
)
(% EFORD)
Period
Heat
Rate
(
)
(mmbtu/KWh)
Highest output ever in 2009
Approaching top quartile forced outage rate
Benefiting from heat rate improvement
program
…
benefiting from operating enhancements and market dynamics.
* Includes Texas |
 29
Our peaking fleet rounds out a diverse
generation portfolio…
13
17
23
19
13
14
12
2004
2005
2006
2007
2008
2009
2010 Target
85
86
76
77
91
92
94
2004
2005
2006
2007
2008
2009
2010 Target
Peaking start success provides
opportunities in ancillary and real time
markets
Peaking adds flexibility in serving load
and managing needs of a diverse market
environment
…
and provides ability to follow load during periods of high demand.
%
Start
Success
(
)
Forced
Outage
Rate
(
)
(% EFORD)
Equivalent
Availability
(
)
(%)
99.7
96.5
98.6
97.0
98.9
99.3
99.7
2004
2005
2006
2007
2008
2009
2010 Target |
 30
Stringent environmental challenges are on the
horizon, with potentially broad industry impacts…
High
High
Regional
High
High
Industry Impact
Emission restrictions net favorable to Power
Carbon
Controls on coal units done or under way
Power’s relative position very strong
NOx, SO
2
, Hg
(CAIR)
Peaking fleet replacement strategy
Upwind
states
anticipated
to
increase
NOx
stringency
Ozone air quality standards
(HEDD)
EPA required to perform cost-benefit analysis
Issue widely shared across industry
Potential capital spend exposure
Once-through cooling water
(316(b))
Power uses dry fly ash systems
Ash has been tested as non-hazardous
Coal ash regulation
Power’s Positioning
Issue
…but Power’s clean fleet is very competitively positioned for success.
|
 31
Power’s portfolio is well positioned…
Baghouse*
Scrubber
2010
SCR
Mercer
(NJ)
Baghouse
2010*
Scrubber
2010
SCR
2010
Hudson
(NJ)
Mercury/
Particulate
SO
2
NOx
Description
Current Regulations and Compliance Measures
Baghouse*
Ultra-low
Sulfur Coal
Low Nox
Burners
Bridgeport
(CT)
Scrubber
(Hg MACT Compliant)
Scrubber
(Hg MACT
Compliant)
Scrubber
Scrubber
SCR
2014
SCR
Conemaugh
(PA)
Keystone
(PA)
…to meet current regulatory requirements.
Capital Spend Planned
No Additional Capital Spend Planned
* Hg MACT compliant with baghouse |
      32
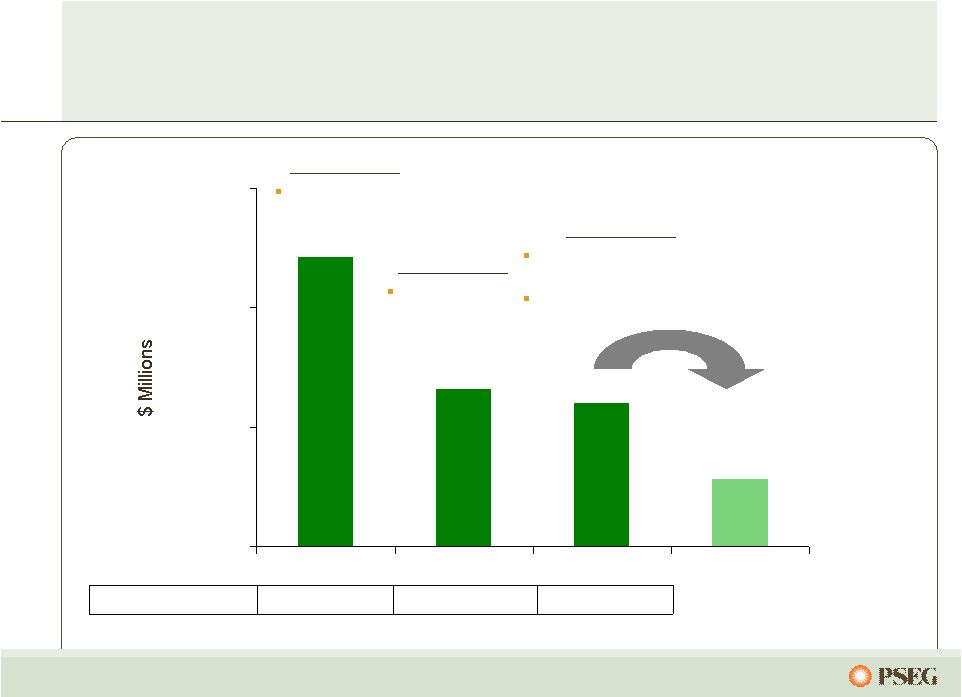
$0
$100
$200
$300
$400
$500
$600
$700
$800
2010
2011
2012
Maintenance
Growth
Environmental
Power’s
projected capital spending will decline
considerably…
…as we complete significant
environmental back-end technology projects in 2010.
PSEG Power Capital Spending |
 33
Nuclear’s
operational excellence
program will create value for years to come…
RGGI
18
30
40 to 60
3,662
2009
None
21
25
40
3,484
2004
Progress toward
National Program
CO2
Program
19
O&M
(non-fuel)
$/MWh
30
Output (000 GWh)
60
License Life
3,694
Capacity (MW)
2012E
Description
…as our efforts continue to pursue a potential new unit.
|
 34
Fossil’s operational excellence program…
12,125
11,211
26,789
Emissions
NOx
Tons
37,863
15
447
30
11,886
2009*
80,287
16
349
21
11,123
2004
12,137
Emissions
SO2
Tons
14
O&M
(non-fuel)
$/MWh
211
Capital ($ Millions)
32
Output (000 GWh)
11,589
Capacity (MW)
2012E*
Description
…is expected to result in higher output at a lower cost.
* Includes Texas |
   35
$0
$100
$200
$300
$400
$500
$600
$700
$0
$10
$20
$30
$40
CO2
Price
($/ton)
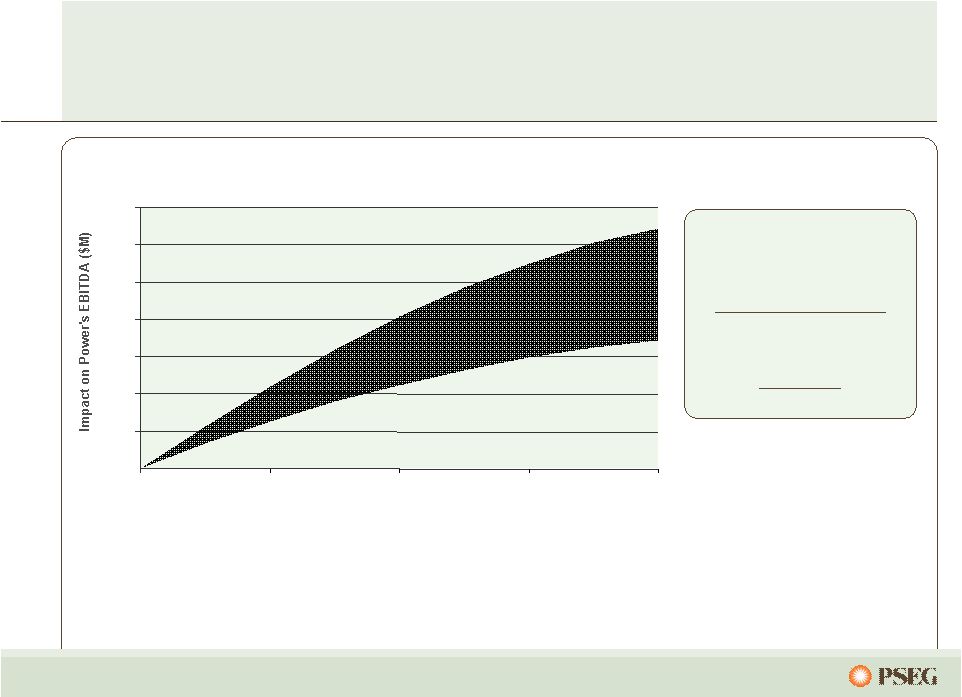
While the prospects for a
cap and trade program may be delayed…
…Power remains well positioned to capture value if implemented.
CO
2
$/Ton Impact on PJM Prices and Power’s EBITDA
The impact on electric prices moderates at higher CO2
prices as:
•
the fleet dispatch changes, and
•
the CO2
intensity of the grid goes down.
Illustration at $20 CO
2
:
(2008 Data)
62 TWh
x ~ $11 to $14/MWh
~ $680 –
$870 M revenue
23M tons
x $20/ton
~ $460 M expense |
 36
Full Requirements Component
Increase in Capacity Markets/RPM
Growing Renewable Energy Requirements
Component for Market Risk
Through Power’s
participation in each of the BGS auctions…
Market Perspective –
BGS Auction Results
…
we have developed an expertise in serving full-requirements contracts.
2003
2004
2005
2006
2007
2008
2009
2010
3 Year Average
Round the
Clock PJM
West Forward
Energy Price
$55.59
Capacity
Load shape
Transmission
Congestion
Ancillary services
Risk premium
Green
$33 -
$34
$36 -
$37
$44 -
$46
$67 -
$70
$58 -
$60
$68 -
$71
$56 -
$58
$48 -
$50
~ $21
$55.05
~ $18
$65.41
~ $21
$102.51
~ $32
$98.88
~ $41
$111.50
~ $43
$103.72
~ $47
$95.77
~ $47
Note: BGS prices reflect PSE&G Zone |
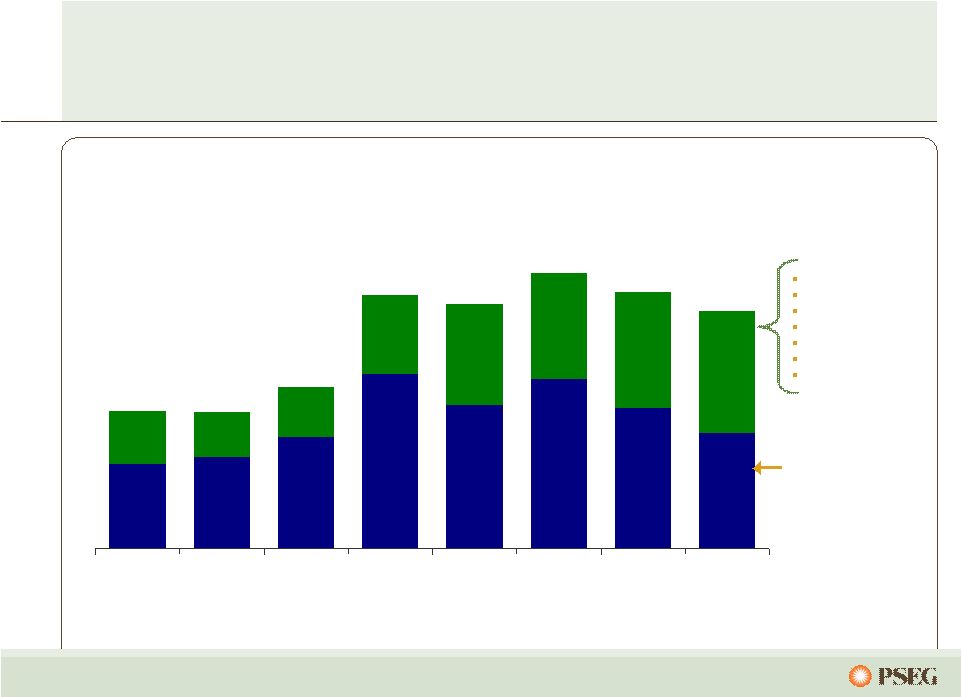
 37
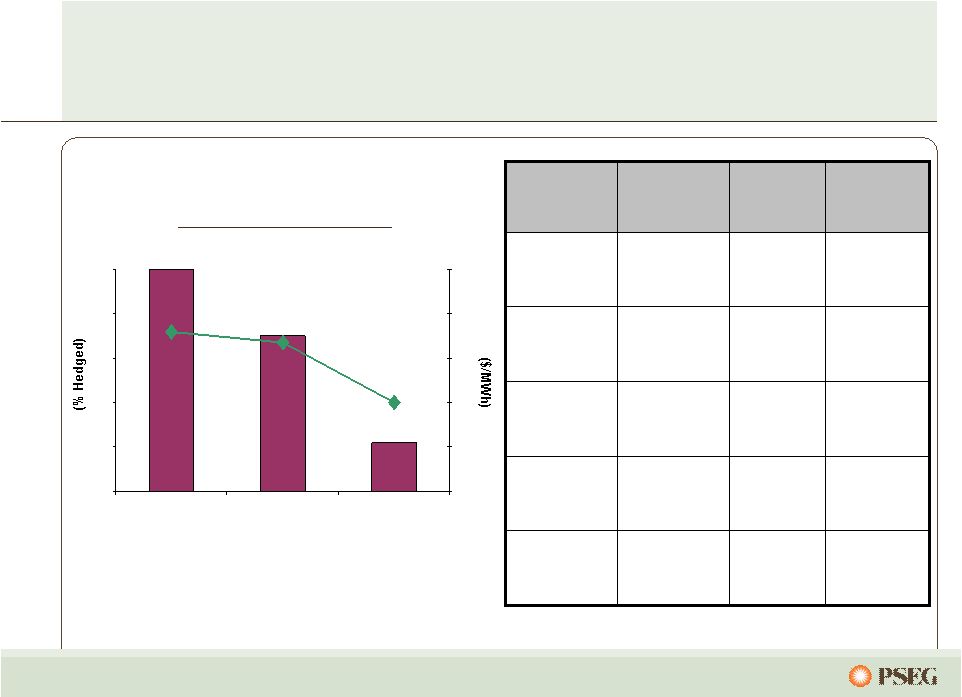
The result of Power’s hedging strategy is a
portfolio of contracted output…
…
which dampens the impact of market volatility on earnings in the near term.
Power’s
anticipated
nuclear and coal
output is
contracted over
the next few
years:
2010: 100%
2011: 66%
2012: 26%
As of March 31, 2010
Total Fleet RTC Average MW
-
1,000
2,000
3,000
4,000
5,000
6,000
7,000
8,000
9,000
Nuclear / Pumped Storage
Coal
Combined Cycle (CC)
Steam and Peakers
Other Load Contracts + Hedges
Existing BGS, Other Load Contracts, Hedges + Future BGS
Existing BGS, Other Load Contracts, and Hedges
2010
2011
2012 |
 38
$0
$20
$40
$60
$80
$100
2004
2005
2006
2007
2008
2009
2010 Fwd
2011 Fwd
2012 Fwd
2013 Fwd
The effect of our multi-year hedging/forward
sales strategy…
…creates a realized price that is a blend of prior and future pricing.
PJM West
PS Zone vs PJM West Basis
2010
Realized Price
*Forward prices as of April 2010
*
Power’s hedging strategy enables current
year prices to be derived from contracts
secured over the prior 2 -
3 years.
The fixed pricing of the BGS Auction has
the effect of realizing forward prices up to
three years ahead in the current year. |
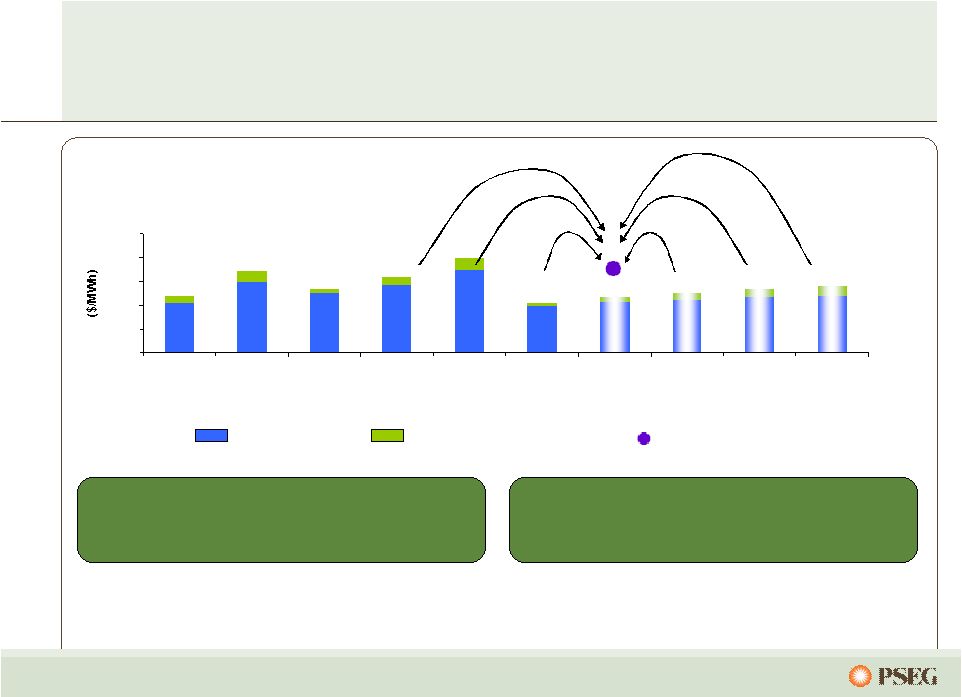
 39
Power’s coal hedging reflects 2010 supply
matched with 2010 sales…
…
while maintaining flexibility on supply post BET installation.
0%
20%
40%
60%
80%
100%
2010
2011
2012
$0
$10
$20
$30
$40
$50
Contracted Coal
Mid $20’s
To
High $20’s
Mid $20’s
To
High $20’s
Mid $40’s
To
Low $40’s
Mid $40’s
To
Low $40’s
High $40’s
To
Mid $40’s
Indicative
Pricing
($/MWh)
Prices lower,
moderating
Northern
Appalachian
Conemaugh
Prices lower,
moderating
Northern
Appalachian
Keystone
More limited
segment of
coal market
Metallurgical
CAPP/NAPP
Mercer
Flexibility after
BET in 2010
Adaro (2010)
CAPP/NAPP
(2011+)
Hudson
Higher price,
lower BTU,
enviro
coal
Adaro
Bridgeport
Harbor
Comments
Coal Type
Station
% Hedged
(left scale)
$/MWh
(right
scale) |
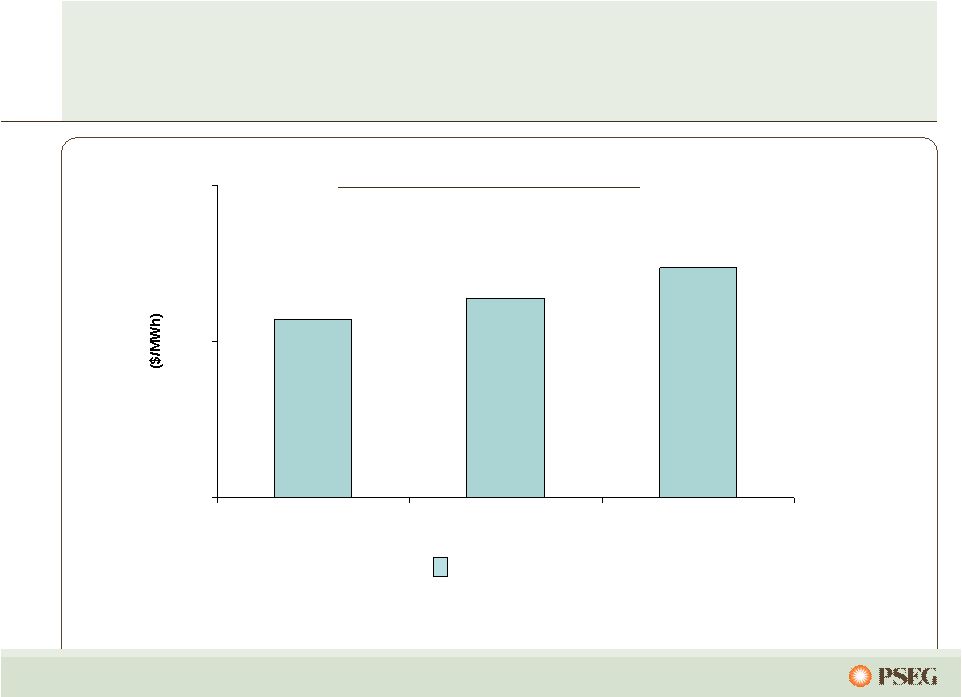 40
$0
$5
$10
2010
2011
2012
Anticipated Nuclear Fuel Cost
Power has hedged its nuclear fuel
needs through 2012…
…
with increased costs over that time horizon.
Hedged |
 41
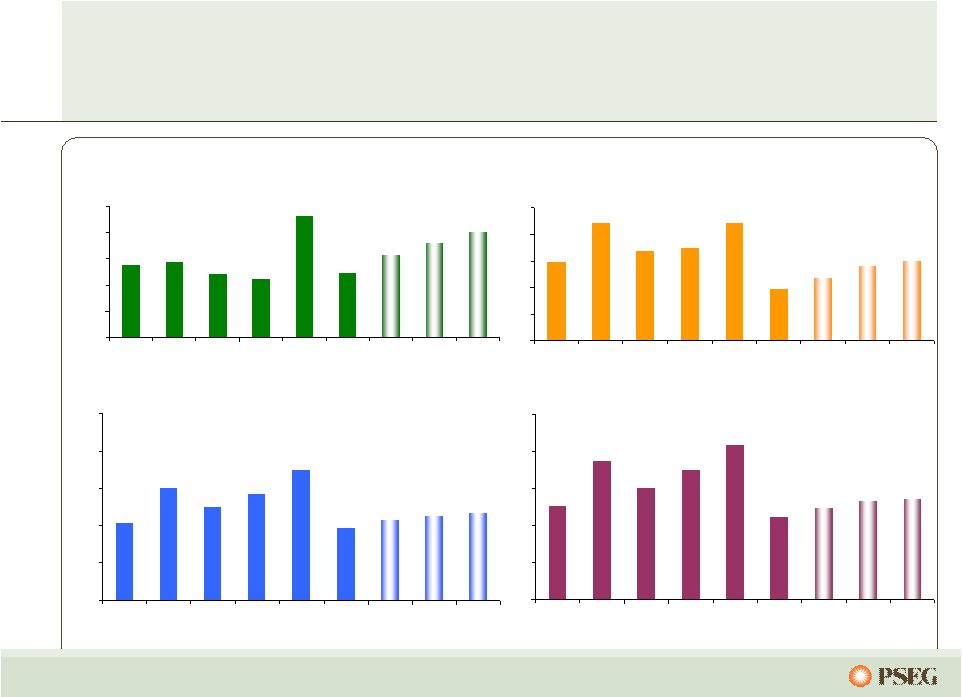
$0
$20
$40
$60
$80
$100
2004
2005
2006
2007
2008
2009
2010
Fwd *
2011
Fwd
2012
Fwd
$0
$20
$40
$60
$80
$100
2004
2005
2006
2007
2008
2009
2010
Fwd *
2011
Fwd
2012
Fwd
$0
$20
$40
$60
$80
$100
2004
2005
2006
2007
2008
2009
2010
Fwd *
2011
Fwd
2012
Fwd
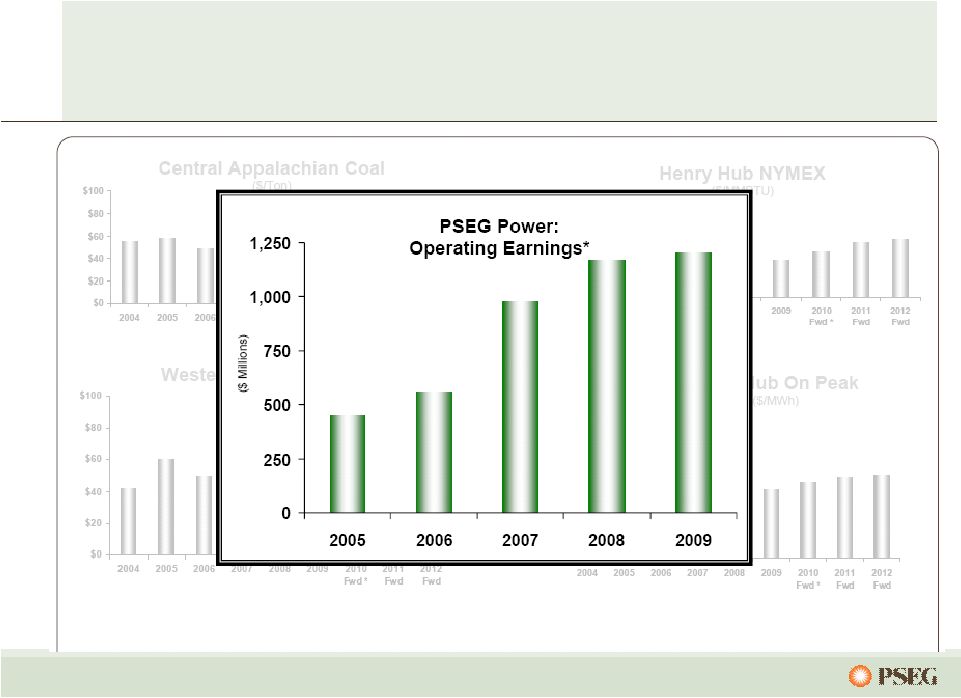
Commodity prices have been volatile…
Henry Hub NYMEX
($/MMBTU)
West Hub On Peak
($/MWh)
Central Appalachian Coal
($/Ton)
$0
$2
$4
$6
$8
$10
2004
2005
2006
2007
2008
2009
2010
Fwd *
2011
Fwd
2012
Fwd
*Forward prices as of April 2010
Western Hub RTC
($/MWh) |
 42
*See page 64 for Items excluded from Income from Continuing Operations to
reconcile to Operating Earnings Commodity prices have been
volatile… …
but Power’s diverse asset portfolio and hedging strategy has
mitigated the effects, providing strong results. |
 43
-$10
$0
$10
$20
$30
$40
$50
2005
2006
2007
2008
2009
2010
2011
2012
$0
$10
$20
$30
$40
$50
$60
$70
2005
2006
2007
2008
2009
2010
2011
2012
Annual Average
Historical Monthly
Forecast
Note: Forward prices as of April 2010
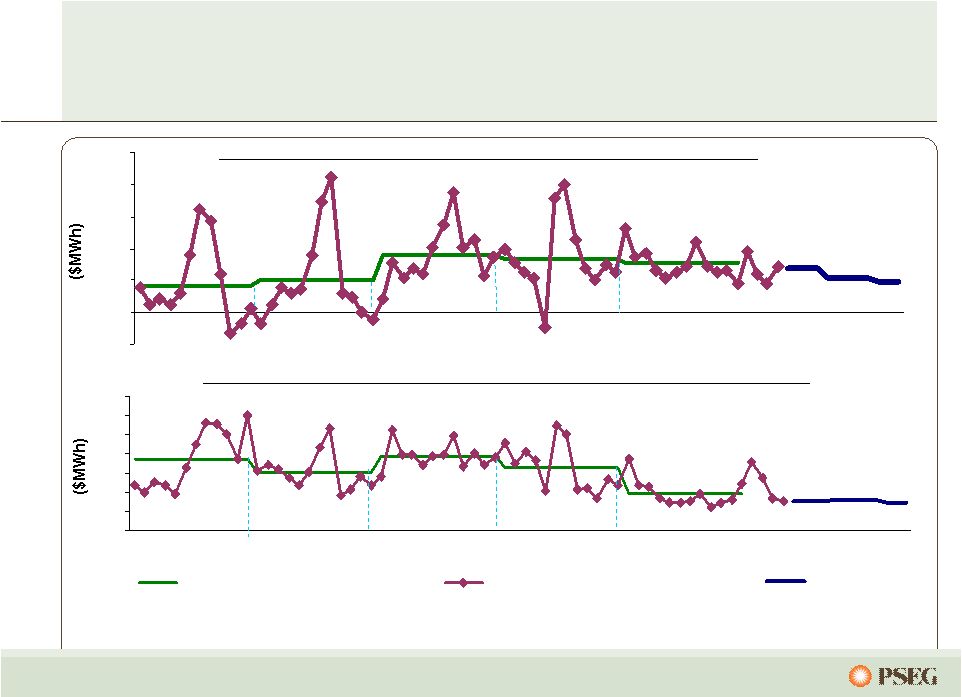
Forward spark spreads and dark spreads
are showing some moderation…
PJM Western Hub Spark Spread (On-Peak –
Henry Hub x 7.5 Heat Rate)
PJM Western Hub Dark Spread (RTC –
Central Appalachian Coal x 10 Heat Rate)
…
and are expected to remain highly influenced by gas prices.
|
 PSE&G |
 45
Filed:
May 29, 2009
12/09 Update:
January 29, 2010
Test Year:
2009
* Modified in February for 11.25% ROE from 11.5% ROE; ALJ recommendation due May
30, 2010. New Jersey Electric & Gas Rate Case
51.2%
Equity
Ratio
Includes tracking mechanisms for capital expenditures and pension costs
11.25%*
Return on Equity
$64.4 million
$139.8 million
Increase
$2.3 billion
$3.8 billion
Rate Base
Request as of the 03/10 update
Electric
Request
Gas |
 46
2009: Success in meeting State’s energy and
economic development goals…
…with reasonable contemporaneous returns.
514
180
694
April 2009
NJ Capital Infrastructure Stimulus
30
17
47
December 2008
Carbon Abatement
64
1
65
July 2009
Demand Response
143
-
143
November 2009
Solar Loan II
$62
$43
$105
April 2008
Solar Loan I
$1,501
$258
$1,759
Total
185
5
190
July 2009
Economic Energy Efficiency
Stimulus
503
12
515
July 2009
Solar 4 All
Remaining
Spending
Thru 2009
Total
Amount
Approval
Date
($ Millions) |
 47
Branchburg
Branchburg
Roseland
Roseland
Hopatcong
Hopatcong
Hudson
Hudson
Transmission investment recovery…
Future Transmission project spending will be influenced by
PJM evaluation, potentially adding $1.5B in additional
projects over 2010 –
2015.
Various
$300
14 69kV Reliability projects thru 2012
Various
$200
20 Approved RTEP projects thru 2012
125 bps
2013**
$1,100
Branchburg-Roseland-Hudson
125 bps
2012-2013
$750
Susquehanna-Roseland
Incentive
In-Service
Spending
($ Millions)
…is supported by formula rate treatment and CWIP in rate base*.
* Approval of CWIP for 500kV backbone
projects.
**PJM
has
specified
a
June
2013
in-service
date
for
this
project,
though
PJM
has
publicly
indicated
that
the
in-service
date
may
be
delayed
and
that
alternatives
to
the
project
are
being
considered.
Transmission Projects
Future Projects |
 48
The national average ratio for electric bills to
disposable income is 3.4%*, …
0
2
4
6
8
10
12
14
16
18
20
PSE&G 2009
Regional Average
PSE&G 2012E
Clauses and Other
Delivery
BGS
Based on tariff rates in effect in June 2009
…while PSE&G’s typical electric bill is 2.6% of disposable
income in New Jersey.
Electricity
(500kWh/month bill)
BGS
Delivery
Clauses
and
Other
18.1
Gas
(100 therm/month bill)
1.45
BGS****
Delivery **
20.1
* Source Moody’s Industry Outlook –
July 2009
** Includes base rate increases
*** Other includes NJ stimulus filing ,Solar 4 All and Solar I & II, EEE,
and Demand Response **** Assumes BGS/BGSS pricing remains constant
0.0
0.2
0.4
0.6
0.8
1.0
1.2
1.4
1.6
1.8
PSE&G 2009
Regional Average
PSE&G 2012E
Clauses and Other
Delivery
BGSS
Delivery
BGSS
BGSS****
Delivery **
Clauses
and
Other***
1.62
1.40
18.7
Clauses
and
Other***
Clauses
and
Other |
 PSEG
Energy Holdings |
 50
PSEG Energy Holdings…
PSEG Global
International assets sold*
Texas generating assets (2 –
1,000MW CCGTs) transferred to PSEG Power
Small remaining investment in domestic traditional generation joint venture
assets
PSEG Resources
Tax exposure reduced by $740 million through fourteen LILO/SILO lease
terminations,
including
Nuon
termination
in
January
2010
Maximizing value and minimizing risk for traditional leases and real estate
Long-term debt reduced by $1 billion over 2008 and 2009
Redemption of $642 million of Energy Holdings recourse debt
$368 million eliminated through bond exchange
$127 million of debt remaining
…
has streamlined its businesses and reduced its risk.
* Nominal investment in Venezuela remaining |
 51
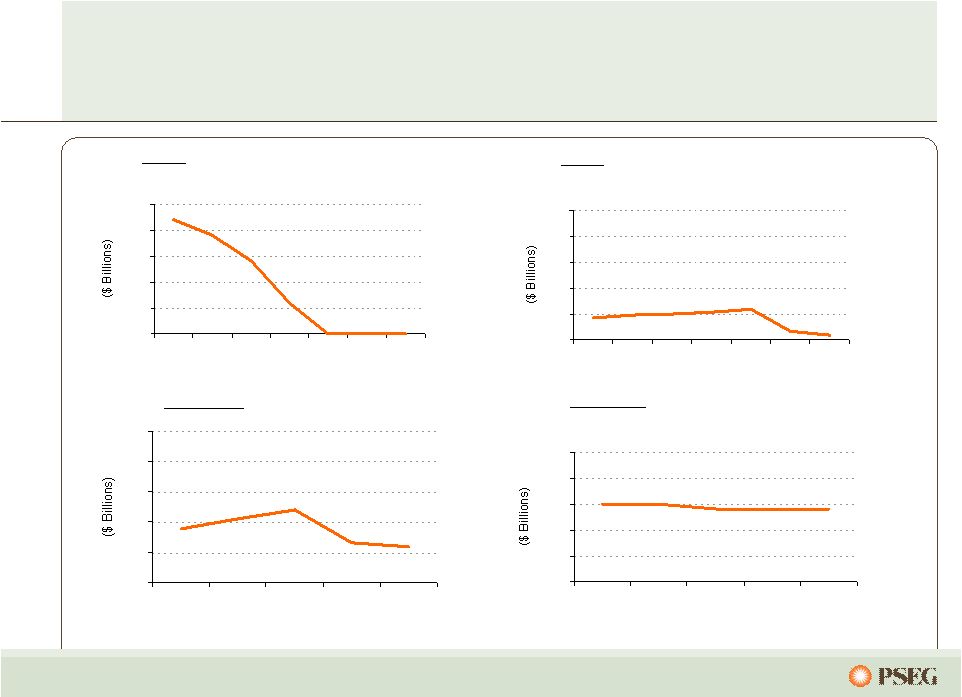
Ongoing portfolio management continues…
Global - International Asset Investment
0.0
0.5
1.0
1.5
2.0
2.5
2004
2005
2006
2007
2008
2009
2010
Est
Resources - Traditional Leases, Real
Estate and Other Investments
0.0
0.5
1.0
1.5
2.0
2.5
2006
2007
2008
2009
2010
Est
…
with opportunistic asset monetization as appropriate.
Global- Domestic Generation Investment
0.0
0.5
1.0
1.5
2.0
2.5
2004
2005
2006
2007
2008
2009
2010
Est
Resources - LILO/SILO Exposure *
0.0
0.5
1.0
1.5
2.0
2.5
2006
2007
2008
2009
Mar-10
* Does not include IRS deposits of $ 320M |
 52
PSEG Energy Holdings is focused on
renewable energy opportunities
Complementing PSEG portfolio by increasing earnings base
with structured, low risk investments
Disciplined evaluation of favorable markets for renewables
Transaction structure and partnerships designed to mitigate risk
Expand geographic and regulatory diversity
Attractive and predictable returns
Pursuing renewable strategy through three primary vehicles
Solar Source LLC
Energy Storage and Power LLC
Garden State Offshore Energy LLC |
 PSEG
|
 54
$(0.12)
$0.14
$0.74
$1.92
$0.02
$(0.05)
$0.09
$0.07
$0.63
$0.71
$2.38
$2.30
2007
2008
2009
$3.12*
We have met or exceeded our earnings
objectives …
…
and expect 2010 earnings to remain strong.
Holdings
PSE&G
Power
Parent
Earnings per Share by Subsidiary
$2.68*
*See page 64
for Items excluded from Income from Continuing Operations to reconcile to
Operating Earnings $3.00 -
$3.25
$2.80 -
$3.05
$2.30 -
$2.50
Guidance Range
$3.03* |
 55
$2,091
$1,993
$163
$30
2008
2009
Sustainability Plan
Non-pension
O&M
Expense
(1)
Pension
Expense
Manage Staffing Levels
Control General and
Administrative Expenses
Capture Productivity
Gains
(1)
Excludes O&M related to PSE&G clauses
We have successfully managed our O&M …
…
through benchmarking efforts and operational excellence.
$2,121M
$2,156M |
 56
Earnings were strong in 2009…
…benefiting from pricing, cost control and risk mitigation.
$3.12
$3.03
2008*
PSE&G
Power
Holdings /
Enterprise
2009*
($0.08)
$0.08
$0.09
Interest 0.03
Debt Exchange
Premium Eliminated
in Consolidation
0.04
Recontracting
and Lower Fuel
Expense 0.04
BGSS and
Wholesale Power
Trading 0.01
O&M 0.02
Interest 0.03
Depreciation and
Other (0.02)
Margin –
Gas,
Electric,
Transmission
and Appliance
Service 0.04
Weather (0.01)
O&M (0.06)
Depreciation
(0.03)
Taxes (0.03)
Interest 0.01
2009 Lease Sales
0.13
Lease Income
(0.04)
Effective Tax Rate
and Other (0.03)
Debt Exchange
Premium
Eliminated in
Consolidation
(0.04)
Holdings:
Enterprise:
*See page 64
for Items excluded from Income from Continuing Operations to reconcile to
Operating Earnings |
 57
Cash Exposure Net
of $320M of IRS
Deposits
12/31/08
12/31/09
3/31/10
4
5
17
# of LILO/SILO Leases
2009 Activities
Terminated 12
LILO / SILO
leases
2010 Activities
Terminated 1 lease in
January
Pursue additional lease
termination opportunities
2008 Activities
Terminated 1
LILO / SILO lease
Exposure to our potential lease tax
liability…
…was reduced with aggressive asset management.
$660
~$1,200
~$280
~$600
$-
$500
$1,000
$1,500 |
 58
$1,000
$1,250
$1,500
$1,750
$2,000
$2,250
2009
2010
2011
2012
PSEG Consolidated O&M
(1)
C.A.G.R. (’09 –’12) = 0.7%
(1)
Excludes O&M related to PSE&G clauses
Aggressive employee management of our
O&M, including 2010 wage freeze …
…and improving pension expense, will result in modest O&M growth.
|
 59
2009 Operating Earnings*
2010 Guidance
Rigorous cost controls, hedging strategy
and improved utility capital recovery…
…help mitigate the risk of weak prices in 2010.
$3.12
$3.00 -
$3.25
PSE&G:
Network Transmission Service (NTS) revenue increase for
2010 from 2009 ~ $0.03 EPS
2009 earned ROE = 8.3%
1% change in Distribution earned ROE in 2010 ~ $0.07 EPS
1% change in load in 2010 ~ $0.02 EPS
PSEG Power:
Revenue/Margin
Nuclear output fully contracted
Dark
Spread
change
of
$5/MWh
at
market
–
impact
of
$0.02-$0.04/share
Spark
Spread
change
of
$5/MWh
at
market
–
impact
of $0.04-$0.08/share
Operations
1%
change
in
nuclear
capacity
factor
–
impact
of
$0.01-$0.02/share
O&M
1%
change
–
impact
of
~$0.01/share
Drivers
*See page 64
for Items excluded from Income from Continuing Operations to reconcile to
Operating Earnings |
 60
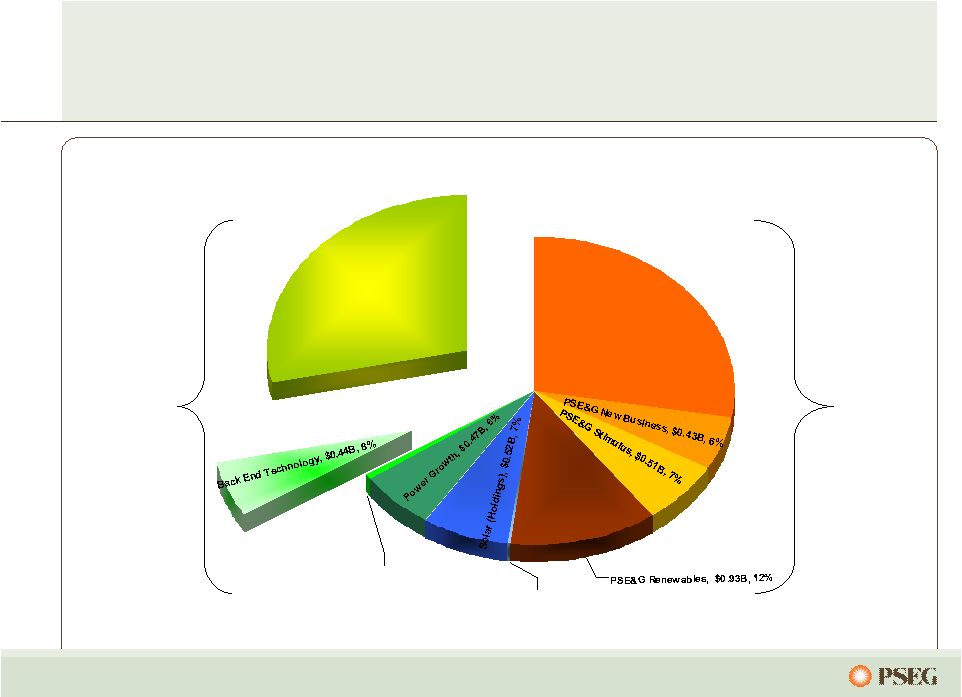
PSEG is shifting emphasis to growth
investments…
…to meet the requirements of the evolving energy markets.
Maintenance /
Regulatory
Investments
$2.5B
Growth
Investments
$5.2B
Capital Spending by Category
Total 2010-2012 Capital: $7.7 Billion
Wind (Holdings), $0.02B, 0%
New Nuclear, $0.05B, 1%
Transmission, $2.14B, 27%
Core Investment, $2.18B, 28% |
 61
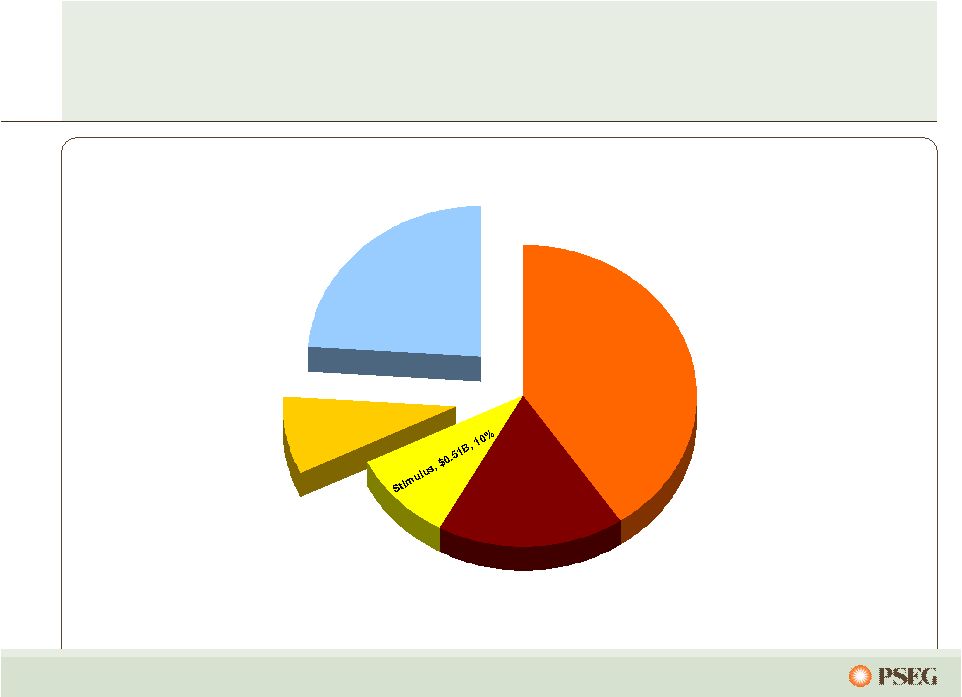
PSE&G’s
capital spending is focused on
growth…
…with a substantial portion allowed to earn reasonable
contemporaneous returns.
PSE&G Capital Spending by Category
Total 2010-2012 Capital: $5.3 Billion
New Business,
$0.43B, 8%
Renewables, $0.93B,
18%
Transmission,
$2.14B, 40%
Core Investment,
$1.26B, 24% |
 62
$0
$1,000
$2,000
$3,000
$4,000
$5,000
Sources
Uses
In 2009, we had substantial cash
generation …
PSEG Consolidated
2009 Sources and Uses
Power Cash
from Ops
Shareholder
Dividend
Gross Lease
Proceeds
PSE&G
Investment
…which was applied toward improving our financial profile.
Debt
Redemptions
Lease Termination
Taxes & IRS Deposit
Debt
Issuances
PSE&G Cash
from Ops(1)
Power
Investment
(1)
PSE&G Cash from Operations adjusts for securitization principal repayments of
~ $190M Regulated investment
Eliminated Parent Long-term
debt and minimized Holdings’
debt
Reduced Tax Risk |
 63
With our current facilities, PSEG/Power will
have at least $2.6 billion
of credit capacity
through 2012 ...
Non-PSE&G Credit Capacity
...and we will continue to ensure adequate liquidity.
$0.0
$0.5
$1.0
$1.5
$2.0
$2.5
$3.0
$3.5
$4.0
2010
2011
2012
Power Syndicated Facility - 1.60B
Expires 12/2012
Power 2-Year Facility - 0.35B
Expires 7/2011
PSEG Syndicated Facility - 1.00B
Expires 12/2012 |
 64
Items Excluded from Income from Continuing
Operations to Reconcile to Operating Earnings
Please see Page 3 for an explanation of PSEG’s use of Operating Earnings as a
non-GAAP financial measure and how it differs from Net Income.
Pro-forma Adjustments, net of tax
2009
2008
2007
2006
2005
Earnings Impact ($ Millions)
Gain (Loss) on Nuclear Decommissioning Trust (NDT)
Fund Related Activity
9
$
(71)
$
12
$
11
40
Gain (Loss) on Mark-to-Market (MTM)
(25)
16
10
28
(9)
Lease Transaction Reserves
-
(490)
-
-
-
Net Reversal of Lease Transaction Reserves
29
-
-
-
-
Asset Sales and Impairments
-
(13)
(32)
(178)
-
Premium on Bond Redemption
-
(1)
(28)
(7)
(6)
Merger-related Costs
-
-
-
(8)
(32)
Total Pro-forma adjustments
13
$
(559)
$
(38)
$
(154)
$
(7)
$
Fully Diluted Average Shares Outstanding (in Millions)
507
508
509
505
489
Per Share Impact (Diluted)
Gain (Loss) on Nuclear Decommissioning Trust (NDT)
Fund Related Activity
0.02
$
(0.14)
$
0.02
$
0.02
$
0.08
$
Gain (Loss) on Mark-to-Market (MTM)
(0.05)
0.03
0.02
0.06
(0.02)
Lease Transaction Reserves
-
(0.96)
-
-
-
Net Reversal of Lease Transaction Reserves
0.05
-
-
-
-
Asset Impairments
-
(0.03)
(0.06)
(0.35)
-
Premium on Bond Redemption
-
-
(0.06)
(0.01)
(0.01)
Merger-related Costs
-
-
-
(0.02)
(0.07)
Total Pro-forma adjustments
0.02
$
(1.10)
$
(0.08)
$
(0.30)
$
(0.02)
$
PUBLIC SERVICE ENTERPRISE GROUP INCORPORATED
For the Twelve Months Ended
December 31,
Reconciling Items Excluded from Continuing Operations to Compute Operating Earnings
(Unaudited) |
 65
Items Excluded from Income from Continuing
Operations to Reconcile to Operating Earnings
Pro-forma Adjustments, net of tax
2010
2009
Earnings Impact ($ Millions)
Gain (Loss) on Nuclear Decommissioning Trust (NDT) Fund Related Activity
10
$
(23)
$
Gain (Loss) on Mark-to-Market (MTM)
56
(15)
Total Pro-forma adjustments
66
$
(38)
$
Fully Diluted Average Shares Outstanding (in Millions)
507
507
Per Share Impact (Diluted)
Gain (Loss) on NDT Fund Related Activity
0.02
$
(0.04)
$
Gain (Loss) on MTM
0.11
(0.03)
Total Pro-forma adjustments
0.13
$
(0.07)
$
(a) Income from Continuing Operations for the three months ended March 31, 2010 and 2009 is equal to
Net Income. For the Three Months Ended
March 31,
PUBLIC SERVICE ENTERPRISE GROUP INCORPORATED
Reconciling Items Excluded from Continuing Operations
(a)
to Compute Operating Earnings
(Unaudited)
Please see Page 3 for an explanation of PSEG’s use of Operating Earnings as a
non-GAAP financial measure and how it differs from Net Income.
|