Attached files
| file | filename |
|---|---|
| EX-21.1 - AVX CORPORATION EXHIBIT 21.1 - AVX Corp | exhibit211.htm |
| EX-31.2 - AVX CORPORATION EXHIBIT 31.2 - AVX Corp | exhibit312.htm |
| EX-24.1 - AVX CORPORATION EXHIBIT 24.1 - AVX Corp | exhibit241.htm |
| EX-31.1 - AVX COPORATION EXHIBIT 31.1 - AVX Corp | exhibit311.htm |
| EX-10.16 - AVX CORPORATION EXHIBIT 10.16 - AVX Corp | exhibit1016.htm |
| EX-10.15 - AVX CORPORATION EXHIBIT 10.15 - AVX Corp | exhibit1015.htm |
| EX-23.1 - AVX CORPORATION EXHIBIT 23.1 - AVX Corp | exhibit231.htm |
| EX-32.1 - AVX CORPORATION EXHIBIT 32.1 - AVX Corp | exhibit321.htm |
UNITED
STATES
SECURITIES
AND EXCHANGE COMMISSION
WASHINGTON,
D.C. 20549
FORM
10-K
|
|
[X]
ANNUAL REPORT PURSUANT TO SECTION 13 OR 15(d) OF THE SECURITIES EXCHANGE
ACT OF 1934
|
|
|
For the fiscal year
ended March
31,
2010
|
|
|
[ ]
TRANSITION REPORT PURSUANT TO SECTION 13 OR 15(d) OF THE SECURITIES
EXCHANGE ACT OF 1934
|
|
|
For
the transition period from _________
to__________
|
|
|
Commission
File Number: 1-7201
|

(Exact
name of registrant as specified in its charter)
|
Delaware
|
33-0379007 | |
|
(State
or other jurisdiction of incorporation or organization)
|
(I.R.S. employer identification number) | |
|
1
AVX Boulevard Fountain Inn, South Carolina
|
29644 | |
|
(Address
of principal executive offices)
|
(Zip Code) | |
| (864) 967-2150 | ||
| (Registrant's telephone number, including area code) | ||
| Securities registered Pursuant to Section 12(b) of the Act: | ||
|
Title
of each class
|
Name of each exchange on which registered | |
|
Common
Stock, $.01 par value per share
|
New York Stock Exchange | |
| Securities registered pursuant to Section 12(g) of the Act: None | ||
Indicate by check mark if
the registrant is a well-known seasoned issuer, as defined in Rule 405 of the
Securities Act. Yes [ X
] No [ ]
Indicate
by check mark if the registrant is not required to file reports pursuant to
Section 13 or Section 15(d) of the Securities Act. Yes
[ ] No [X]
Indicate
by check mark whether the registrant (1) has filed all reports required to be
filed by Section 13 or 15(d) of the Securities Exchange Act of 1934 during the
preceding 12 months (or for such shorter period that the registrant was required
to file such reports), and (2) has been subject to such filing requirements for
the past 90 days. Yes [ X ] No
[ ]
Indicate
by check mark whether the registrant has submitted electronically and posted on
its corporate Web site, if any, every Interactive Data File required to be
submitted and posted pursuant to Rule 405 of Regulation S-T during the preceding
12 months (or for such shorter period that the registrant was required to submit
and post such files). Yes
[ ] No
[ ]
Indicate
by check mark if disclosure of delinquent filers pursuant to Item 405 of
Regulation S-K is not contained herein, and will not be contained, to the best
of registrant's knowledge, in definitive proxy or information statements
incorporated by reference in Part III of this Form 10-K or any amendment to this
Form 10-K. [ ]
Indicate
by check mark whether the registrant is a large accelerated filer, an
accelerated filer, or a non-accelerated filer or a smaller reporting company.
See the definitions of “large accelerated filer”, “accelerated filer” and
“smaller reporting company” in Rule 12b-2 of the Exchange Act.
|
Large
accelerated filer
|
[ ]
|
Accelerated
filer
|
[X]
|
|
|
Non-accelerated
filer
|
[ ]
|
(Do
not check if a smaller reporting company)
|
Smaller
reporting company
|
[ ]
|
Indicate
by check mark whether the registrant is a shell company (as defined in Rule
12b-2 of the Exchange Act). Yes
[ ] No [X]
Based on
the closing sales price of $11.93 on September 30, 2009, the last business day
of the registrant's most recently completed second fiscal quarter, the aggregate
market value of the common stock held by non-affiliates of the registrant as of
that date was $577,942,312.
As of May
3, 2010, there were 170,128,986 shares of the registrant’s common stock, par
value $.01 per share, outstanding.
DOCUMENTS
INCORPORATED BY REFERENCE
Portions
of the registrant’s definitive proxy statement for the 2010 Annual Meeting of
Stockholders, which will be filed within 120 days of March 31, 2010, are
incorporated by reference into Part III.
TABLE
OF CONTENTS
|
Part
I
|
Page
|
|
|
Item
1.
|
Business. . . . . . . . . . . . . . . . . . . .
. . . . . . . . . . . . . . . . . . . . . . . . . . . . . . . . . . . . .
. . . . . . .
|
3
|
|
Item
1A.
|
Risk Factors. . . . . . . . . . . . . . . . . .
. . . . . . . . . . . . . . . . . . . . . . . . . . . . . . . . . . . . .
. . . . . .
|
12
|
|
Item
1B.
|
Unresolved Staff Comments . . . . . . . . . .
. . . . . . . . . . . . . . . . . . . . . . . . . . . . . . . . . . . . .
. .
|
17
|
|
Item
2.
|
Properties . . . . . . . . . . . . . . . . . .
. . . . . . . . . . . . . . . . . . . . . . . . . . . . . . . . . . . . .
. . . . . . . .
|
18
|
|
Item
3.
|
Legal Proceedings. . . . . . . . . . . . . . . . .
. . . . . . . . . . . . . . . . . . . . . . . . . . . . . . . . . . . . .
. . .
|
19
|
|
Item
4.
|
Removed and Reserved . . . . . . . . . . . . . .
. . . . . . . . . . . . . . . . . . . . . . . . . .
|
19
|
|
Part
II
|
||
|
Item
5.
|
and Issuer Purchases of Equity Securities. . . . .
. . . . . . . . . . . . . . . . . . . . . . . . . . . . . . . . . . .
|
20
|
|
Item
6.
|
Selected Financial Data. . . . . . . . . . . .
. . . . . . . . . . . . . . . . . . . . . . . . . . . . . . . . . . . . .
. . . .
|
23
|
|
Item
7.
|
24
|
|
|
Item
7A.
|
Quantitative and Qualitative Disclosures About Market
Risk. . . . . . . . . . . . . . . . . . . . . . . . . .
|
36
|
|
Item
8.
|
Financial Statements and Supplementary Data. .
. . . . . . . . . . . . . . . . . . . . . . . . . . . . . . . . . .
.
|
37
|
|
Item
9.
|
37
|
|
|
Item
9A.
|
Controls and Procedures . . . . . . . . . . . .
. . . . . . . . . . . . . . . . . . . . . . . . . . . . . . . . . . . . .
. . .
|
37
|
|
Item
9B.
|
Other Information. . . . . . . . . . . . . . . . .
. . . . . . . . . . . . . . . . . . . . . . . . . . . . . . . . . . . . .
. . . .
|
38
|
|
Part
III
|
||
|
Item
10.
|
Directors, Executive Officers and Corporate
Governance . . . . . . . . . . . . . . . . . . . . . . . . . . .
.
|
38
|
|
Item
11.
|
Executive Compensation. . . . . . . . . . . . . . .
. . . . . . . . . . . . . . . . . . . . . . . . . . . . . . . . . . . . .
.
|
39
|
|
Item
12.
|
Related Stockholder Matters . . . . . . . . . . .
. . . . . . . . . . . . . . . . . . . . . . . . . . . . . . . . . . . . .
.
|
39
|
|
Item
13.
|
Certain Relationships and Related Transactions, and
Director Independence . . . . . . . . . . . . . .
|
39
|
|
Item
14.
|
Principal Accounting Fees and Services . . . . . .
. . . . . . . . . . . . . . . . . . . . . . . . . . . . . . . . . . .
|
39
|
|
Part
IV
|
||
|
Item
15.
|
Exhibits and Financial Statement Schedules. . .
. . . . . . . . . . . . . . . . . . . . . . . . . . . . . . . . . . . .
|
40
|
|
Signatures. . . . . . . . . . . . . . . . . . . . .
. . . . . . . . . . . . . . . . . . . . . . . . . . . . . . . . . . . . .
. . . . . . . . . . . . . . . .
|
42
|
|
Cautionary
Statement Pursuant to Safe Harbor Provisions of the Private
Securities
Litigation
Reform Act of 1995
The
following discussion and analysis should be read in conjunction with the
consolidated financial statements, including the notes thereto, appearing
elsewhere herein. Statements in this Annual Report on Form 10-K that
reflect projections or expectations of future financial or economic performance
of AVX Corporation, and statements of the Company's plans and objectives for
future operations, including those contained in "Business", “Risk Factors”,
"Management's Discussion and Analysis of Financial Condition and Results of
Operations", and "Quantitative and Qualitative Disclosures about Market Risk",
or relating to the Company's outlook for fiscal 2011 overall volume and pricing
trends, end market demands, cost reduction strategies and their anticipated
results, and expectations for research, development and capital expenditures,
are "forward-looking" statements within the meaning of Section 27A of the
Securities Act of 1933, as amended, and Section 21E of the Securities Exchange
Act of 1934, as amended. Words such as "expects", "anticipates",
"approximates", "believes", "estimates", "intends" and "hopes" and variations of
such words and similar expressions are intended to identify such forward-looking
statements. No assurance can be given that actual results or events
will not differ materially from those projected, estimated, assumed or
anticipated in any such forward-looking statements. Important factors
that could result in such differences, in addition to the other factors noted
with such forward-looking statements and in “Risk Factors” in this Annual Report
on Form 10-K, include: general economic conditions in the Company's
market, including inflation, recession, interest rates and other economic
factors; casualty to or other disruption of the Company's facilities and
equipment; potential environmental liabilities; and other factors that generally
affect the business of manufacturing and supplying electronic components and
related products. AVX Corporation does not undertake to update or revise any
forward-looking statement contained in this Annual Report on Form 10-K to
reflect new events or circumstances unless and to the extent required by
applicable law.
-2-
PART
I
|
Item 1.
|
Business
|
General
AVX
Corporation (together with its consolidated subsidiaries, "AVX" or the
"Company") is a leading worldwide manufacturer and supplier of a broad line of
passive electronic components and related products. Virtually all
types of electronic devices use our passive component products to store, filter
or regulate electric energy.
Our
passive electronic component products include ceramic and tantalum capacitors,
film capacitors, varistors, filters and other components manufactured in our
facilities throughout the world and passive components manufactured by Kyocera
Corporation of Japan ("Kyocera"), a public company and our majority stockholder
which owns approximately 72% of our outstanding common stock. We also
manufacture and sell electronic connectors and inter-connect systems and
distribute and sell certain electronic connectors manufactured by
Kyocera.
We are
organized by product line with five main product groups. Our
reportable segments are based on the types of products from which we generate
revenues. We have three reportable segments: Passive
Components, Kyocera Electronic Devices ("KED Resale") and
Connectors. The product groups of Ceramic Components, Advanced
Components and Tantalum Components have been aggregated into the Passive
Component reportable segment. Segment revenue and profit information
is presented in Note 15 to the consolidated financial statements. The
Passive Components segment consists primarily of surface mount and leaded
ceramic capacitors, RF thick and thin film components, tantalum capacitors, film
capacitors, ceramic and film power capacitors, super capacitors, EMI filters,
thick and thin film packages, varistors, thermistors, inductors and resistive
products. The KED Resale segment consists primarily of ceramic
capacitors, frequency control devices, SAW devices, sensor products, RF modules,
actuators, acoustic devices and connectors produced by Kyocera, and resold by
AVX. The Connectors segment consists primarily of AVX Interconnect
(formerly Elco) automotive, telecom and memory connectors manufactured by
AVX. In addition, we have a corporate administration group consisting
of finance and administrative activities and a separate research and development
group.
Our
customers are multi-national original equipment manufacturers, or OEMs,
independent electronic component distributors and electronic manufacturing
service providers, or EMSs. We market our products through our own
direct sales force and independent manufacturers' representatives, based upon
market characteristics and demands. We coordinate our sales,
marketing and manufacturing organizations by strategic customer account and
globally by region.
We sell
our products to customers in a broad array of industries, such as
telecommunications, information technology hardware, automotive electronics,
medical devices and instrumentation, industrial instrumentation, defense and
aerospace electronic systems and consumer electronics.
Our
principal strategic advantages include:
Creating Technology
Leadership. We have research and
development locations in the United States, United Kingdom, Czech Republic,
France and Israel. We have developed numerous new products during fiscal
2010 and won several awards that recognize our technology leadership. These new
products add to the broad product line we offer to our customers. Due
to our broad product offering, none of our products individually represent a
material portion of our revenues. Our scientists are working to
develop product solutions to the challenges facing our customers as consumers
and business demand more advanced electronic solutions to manage their everyday
lives and businesses. Our engineers are continually working to
enhance our manufacturing processes to improve capability, capacity and yield,
while continuing to reduce manufacturing costs.
Providing a Broad
Product Line. We believe that the
breadth and quality of our product line and our ability to quickly respond to
our customers' design and delivery requirements make us the provider of choice
for our multi-national customer base. We differentiate ourselves by
providing our customers with a substantially complete passive component
solution. We market five families of products: ceramic products,
tantalum products, advanced products, Kyocera manufactured passive products and
connector devices. This broad array allows our customers to
streamline their purchasing and supply organization.
-3-
Maintaining the
Lowest Cost, Highest Quality Manufacturing Organization. We have invested
approximately $144 million over the past three fiscal years to upgrade and
enhance our worldwide manufacturing capabilities, with respect to the
manufacture of ceramic, tantalum and advanced components as well as connector
devices. In order to continually reduce the cost of production, our
strategy has included the transfer to and expansion of manufacturing operations
in countries such as China, El Salvador, Malaysia, Mexico and the Czech
Republic.
Globally
Coordinating our Marketing and Manufacturing Facilities. We believe that our
global presence is an important competitive advantage as it allows us to provide
quality products on a timely basis to our multi-national
customers. We provide enhanced services and responsiveness to our
customers by maintaining significant manufacturing operations in locations where
we market the majority of our products. Our 19 manufacturing
facilities are located in 10 different countries around the world. As
our customers continue to expand their global production capabilities, we are
ideally situated to meet their design and supply requirements.
Products
We offer
an extensive line of passive components designed to provide our customers with
"one-stop shopping" for substantially all of their passive component
needs. Passive components do not require power to
operate. These components adjust and regulate voltage and current,
store energy and filter frequencies. Sales of Passive Components
represented approximately 62% of our net sales in fiscal 2010. KDP
and KKC Resale represented approximately 26%, and Connectors, including KEC
Resale Connectors, represented approximately 12% of our net sales in fiscal
2010. The table below presents revenues for fiscal 2008, 2009 and
2010 by product group. Financial information concerning our Passive
Components, KED Resale, Connectors and Research and Development segments is set
forth in Note 15 to the consolidated financial statements elsewhere
herein.
|
Years
Ended March 31,
|
||||||||||||
|
Sales
revenue (in thousands)
|
2008
|
2009
|
2010
|
|||||||||
|
Ceramic
Components
|
$ | 211,759 | $ | 165,740 | $ | 155,059 | ||||||
|
Tantalum
Components
|
312,761 | 268,326 | 280,991 | |||||||||
|
Advanced
Components
|
433,646 | 434,039 | 369,811 | |||||||||
|
Total
Passive Components
|
958,166 | 868,105 | 805,861 | |||||||||
|
KDP
and KKC Resale
|
468,186 | 354,258 | 338,701 | |||||||||
|
KEC
Resale Connectors
|
86,531 | 76,209 | 73,973 | |||||||||
|
Total
KED Resale
|
554,717 | 430,467 | 412,674 | |||||||||
|
Connectors
|
106,392 | 91,041 | 86,431 | |||||||||
|
Total
Revenue
|
$ | 1,619,275 | $ | 1,389,613 | $ | 1,304,966 | ||||||
Passive
Components
We
manufacture a full line of multi-layered ceramic and solid tantalum capacitors
in many different sizes and configurations. Our strategic focus on
the growing use of passive components is reflected in our investment of
approximately $129.4 million in facilities and equipment used to manufacture
passive components during the past three fiscal years. We believe
that sales of passive components will continue to be among the most rapidly
growing in the worldwide capacitor market because technological advances have
been constantly expanding the number and type of applications for these
products.
Tantalum
and ceramic capacitors are commonly used in conjunction with integrated circuits
and are best suited for applications requiring low to medium capacitance
values. Capacitance is the measure of the capacitor's ability to
store electric energy. Generally, ceramic capacitors are more
cost-effective at lower capacitance values, and tantalum capacitors are more
cost-effective at medium capacitance values. The net sales of tantalum and
ceramic capacitors accounted for approximately 54% of our passive component net
sales in fiscal 2010.
We also
offer a line of advanced passive component products to fill the special needs of
our customers. Our family of passive components also includes film
capacitors, high energy/voltage power capacitors and varistors. Our
advanced products engineers work with some customers' in-house technical staffs
to design, produce, and manufacture customized products to meet the
specifications of particular applications. The manufacture of custom
products permits us, through our research and development activities, to make
technological advances, provide customers with design solutions to fit their
needs, gain a marketing inroad with the customer with respect to our complete
product line, and, in some cases, develop products that can be sold to
additional customers in the future. Sales of advanced products
accounted for approximately 46% of passive component net sales in fiscal
2010.
-4-
KED
Resale
We have a
non-exclusive license to distribute and sell certain Kyocera manufactured
electronic component and connector products to certain customers and in certain
territories outside of Japan. Our distribution and sale of certain
Kyocera products broadens our range of products and further facilitates our
ability to offer "one-stop shopping" for our customers' electronic components
needs. The Kyocera KDP and KKC electronic components we sell include
ceramic capacitors, RF modules, frequency control devices, SAW devices, sensor
products, actuators, and acoustic devices. Resale product sales also
include connectors manufactured by Kyocera. Sales of these products accounted
for approximately 32% of net sales in fiscal 2010.
Connectors
We
manufacture and sell high-quality electronic connectors and inter-connect
systems for use in the telecommunications, information technology hardware,
automotive electronics, medical device, defense and aerospace
industries. Our product lines include a variety of industry-standard
connectors as well as products designed specifically for our customers' unique
applications. We produce fine pitch connectors used in portable
devices such as smart phones, other cell phones, notebook computers, GPS, and
other hand held devices. In addition, we offer specialty connectors
designed to address customer specific applications across a wide range of
products and end markets. An expanding portion of the electronics market
for AVX connectors over the past three years is the automotive market with
applications throughout a vehicle including engine control, transmission
control, audio, brakes, and the quickly evolving stability and safety control
system. We have invested approximately $11.2 million in facilities and equipment
over the past three years as we continue to focus on new product development and
enhance our production capabilities for our Connector business. Approximately
46% of combined manufactured and resale connector net sales in fiscal 2010
consisted of connectors manufactured by Kyocera.
Marketing,
Sales and Distribution
We place
a high priority on solving customers' electronic component design challenges and
responding to their needs. To better serve our customers we
frequently designate teams consisting of marketing, research and development and
manufacturing personnel to work with customers to design and manufacture
products to suit their specific requirements. Costs related to these
activities are expensed as incurred.
Approximately
31%, 24% and 45% of our net sales for fiscal 2010 were generated at our
locations in the Americas, Europe and Asia, respectively. Financial
information for these geographic regions is set forth in Note 15 to our
consolidated financial statements elsewhere herein. A discussion of
risks associated with our foreign operations can be found in “Risk Factors”
herein.
Our
products are marketed worldwide by our own dedicated direct sales personnel that
serve our major OEM and EMS customers. We also have a large network of
independent electronic component distributors and independent manufacturers'
representatives who sell our products throughout the world. We have regional
sales and design application personnel in strategic locations to provide
technical and sales support for independent manufacturers' representatives and
independent electronic component distributors. We believe that this
combination of sales channels provides a high level of market penetration and
efficient coverage of our customers on a cost-effective basis.
Our
products are used in a wide variety of applications by numerous
customers. Our products are sold directly to OEMs, EMSs and through
manufacturing representatives and independent electronic component
distributors. In order to maximize our sales opportunities, our
engineering and sales teams maintain close relationships with OEM, EMS and
electronic component distributor customers. Our largest customers
vary from year to year, and no customer has a long-term commitment to purchase
our products. No single customer has accounted for more than 10% of
net sales in the fiscal years ended March 31, 2008, 2009 and
2010. Because we are a supplier to several significant
manufacturers in the broad based electronic devices industries and because of
the cyclical nature of these industries, the significance of any one customer
can vary from one period to the next.
We also
have qualified products under various specifications approved and monitored by
the United States Defense Electronic Supply Center (DSCC) and European Space
Agency (ESA), and approved under certain foreign military
specifications.
-5-
Typically,
independent electronic component distributors handle a wide variety of products
and fill orders for many customers. The sales terms under
non-exclusive agreements with independent electronic component distributors may
vary by distributor, and by geographic region. In the United States,
Europe and Asia, such agreements may include stock rotation and ship-from-stock
and debit (“ship and debit”) programs. Stock rotation is a program
whereby distributors are allowed to return for credit qualified inventory,
semi-annually, equal to a certain percentage, primarily limited to 5%, of the
previous six months net sales. In the United States, we may use a
ship and debit program under which pricing adjustments may be granted by us to
assist distributors in meeting competitive prices in the marketplace on sales to
their end customers. Ship and debit programs require a request from the
distributor for a pricing adjustment for a specific part for a sale to the
distributor’s end customer from the distributor’s stock. In addition,
certain agreements with distributors may include special incentive discounts
based on amount of product ordered or shipped. Our agreements with independent
electronic component distributors generally also require that we repurchase
qualified inventory from the distributor in the event that we terminate the
distributor agreement or discontinue a product offering.
We had a
backlog of orders of approximately $252 million at March 31, 2008, $159 million
at March 31, 2009 and $292 million at March 31, 2010. Firm orders,
primarily with delivery dates within six months of order placement, are included
in backlog. Many of our customers encounter uncertain and changing
demand for their products. Customer provided forecasts of product
usage are not included in backlog. If demand falls below customers’
forecasts, or if customers do not effectively control their inventory, they may
cancel or reschedule their shipments that are included in our backlog, in many
instances without any penalty. Backlog fluctuates from year to year
due, in part, to changes in customer inventory levels, changes to consignment
inventory arrangements, order patterns and product delivery lead times in the
industry. Accordingly, the backlog outstanding at any time is not necessarily
indicative of the level of business to be expected in any ensuing period since
many orders are placed and delivered within the same period. In
addition, the increased use of vendor managed inventory and similar consignment
type arrangements tend to limit the significance of backlog as orders from these
arrangements are not typically reflected in backlog.
Research,
Development and Engineering
Our
emphasis on research and development is evidenced by the fact that most of our
manufactured products and manufacturing processes have been designed and
developed by our own engineers and scientists. A 60,000 square-foot
facility in Myrtle Beach, South Carolina is dedicated to research and
development and provides centralized coordination of our global research and
development efforts. We also maintain research and development staffs
at other facilities located in the United States, United Kingdom, Czech
Republic, Israel and France.
Our
research and development effort and also operational level engineering effort
place a priority on the design and development of innovative products and
manufacturing processes and engineering advances in existing product lines and
manufacturing operations. Other areas of emphasis include material
synthesis and the integration of passive components for applications requiring
reduced size and lower manufacturing costs associated with board
assembly. Research, development and engineering expenditures were
approximately $35 million, $31 million and $25 million during fiscal 2008, 2009
and 2010, respectively. The level of such spending can fluctuate as
new products are transferred to full scale production and process enhancements
are implemented.
We own
United States patents as well as corresponding patents in various other
countries, and also have patent applications pending, although patents are not
in the aggregate material to the successful operation of our
business. For discussion regarding our license arrangement with
Kyocera, see "Management's Discussion and Analysis of Financial Condition and
Results of Operations – Relationship with Kyocera and Related
Transactions."
Raw
Materials
Although
most materials incorporated in our products are available from a number of
sources, certain materials (particularly tantalum from Australia and China and
palladium from Russia and South Africa) are available only from a relatively
limited number of suppliers. We have informed our suppliers of
tantalum materials not to use material sourced from the Democratic Republic of
Congo due to environmental, wildlife and humanitarian concerns, and to our
knowledge we have not used any material from that location.
The costs
of our products are influenced by a wide variety of raw materials, including
tantalum and other metals such as platinum, palladium, silver, nickel, gold and
copper used in our manufacturing processes. The cost of these
materials is subject to price fluctuation and many have risen significantly
during the past few years. In general, increases in the cost of raw
materials may be offset by selling price increases, productivity improvement and
cost savings programs, but that is not always the case.
-6-
We are a
major consumer of the world’s annual production of tantalum. Tantalum
powder and wire are principal materials used in the manufacture of tantalum
capacitor products. These materials are purchased from suppliers in
various parts of the world at prices that are subject to periodic adjustment and
variations in the market. The tantalum required to manufacture our
products has generally been available in sufficient quantity. The limited number
of tantalum material suppliers that process tantalum ore into capacitor grade
tantalum powder has led to higher prices during periods of increased
demand.
Competition
Markets
for our products are highly competitive. We encounter aggressive and
able competition in our various product lines from both domestic and foreign
manufacturers. Competitive factors in the markets include product
quality and reliability, breadth of product line, customer service,
technological innovation, global production presence, timely delivery and
price. We believe we are competitively positioned on each of these
factors. The breadth of our product offering enables us to strengthen our
market position by providing customers with one of the broadest selections of
passive electronic components and connector products available from any one
source. Our major competitors for passive electronic components are
Murata Manufacturing Company Ltd, TDK Corporation, KEMET Corporation, NEC
Corporation, EPCOS AG, Yageo Corporation, Taiyo Yuden Co. Ltd., Samsung
Electro-Mechanics and Vishay Intertechnology, Inc. Our major
competitors for certain electronic connector products are Tyco Electronics,
Molex Incorporated and Erni Electronics. There are many other
companies that produce products in the markets in which we compete.
Employees
As of
March 31, 2010, we employed approximately 10,600 full-time
employees. Approximately 1,800 of these employees are employed in the
United States. Of the employees located in the United States,
approximately 500 are covered by collective-bargaining
arrangements. In addition, some foreign employees are members of
trade and government-affiliated unions. Our relationship with our
employee union groups is generally good. However, no assurance can be
given that, in response to changing economic conditions and the Company’s
actions, labor unrest or strikes will not occur.
Environmental
Matters
We are
subject to federal, state and local laws and regulations concerning the
environment in the United States and to the environmental laws and regulations
of the other countries in which we operate. These regulations include
limitations on discharges into air and water; remediation requirements; chemical
use and handling restrictions; pollution control requirements; waste
minimization considerations; and hazardous materials transportation, treatment
and disposal restrictions. If we fail to comply with any of the
applicable environmental regulations we may be subject to fines, suspension of
production, alteration of our manufacturing processes, sales limitations, and
criminal and civil liabilities. Existing or future regulations could
require us to procure expensive pollution abatement or remediation equipment, to
modify product designs or to incur expenses to comply with environmental
regulations. Any failure to control the use, disposal or storage, or
adequately restrict the discharge of hazardous substances could subject us to
future liabilities and could have a material adverse effect on our
business. Based on our periodic reviews of the operating policies and
practices at all of our facilities, we believe that our operations are currently
in substantial compliance, in all material respects, with all applicable
environmental laws and regulations and that the cost of continuing compliance
will not have a material effect on our financial condition or results of
operations.
We have
been identified by the United States Environmental Protection Agency ("EPA"),
state governmental agencies or other private parties as a potentially
responsible party ("PRP") under the Comprehensive Environmental Response,
Compensation and Liability Act ("CERCLA") or equivalent state or local laws for
clean-up and response costs associated with seven sites at which remediation is
required. Because CERCLA has been construed to authorize joint and
several liability, the EPA could seek to recover all clean-up costs from any one
of the PRPs at a site despite the involvement of other PRPs. At two
of the seven sites, financially responsible PRPs other than AVX also are, or
have been, involved in site investigation and clean-up activities. We
believe that any liability resulting from these sites will be apportioned
between AVX and other PRPs.
-7-
To
resolve our liability at each of the sites at which we have been named a PRP by
the EPA, we have entered into various administrative orders and consent decrees
with federal and state regulatory agencies governing the timing and nature of
investigation and remediation. We have paid, or reserved for, all
reasonably estimable amounts required under the terms of these orders and
decrees corresponding to our apportioned share of the liabilities. As
is customary, the orders and decrees regarding sites where the PRPs are not
themselves implementing the chosen remedy contain provisions allowing the EPA to
reopen the agreement and seek additional amounts from settling PRPs in the event
that certain contingencies occur, such as the discovery of significant new
information about site conditions during clean-up or substantial cost overruns
for the chosen remedy. The existence of these reopener provisions,
combined with the difficulties of reliably estimating clean-up costs and the
joint and several nature of CERCLA liability, makes it difficult to predict the
ultimate liability at any site with certainty.
In July
2007, we received oral notification from the EPA, and in December 2007, written
notification from the U.S. Department of Justice indicating that the United
States is preparing to exercise the reopener provision under a 1991 consent
decree relating to the environmental conditions at, and remediation of, New
Bedford Harbor in the Commonwealth of Massachusetts. In 1991, in
connection with that consent decree, we paid $66.0 million, plus interest,
toward the environmental conditions at, and remediation of, the harbor in
settlement with the EPA and the Commonwealth of Massachusetts, subject to
reopener provisions, including a reopener if certain remediation costs for the
site exceed $130.5 million. The EPA has indicated that remediation
costs through December 6, 2007 (which remediation is ongoing) are approximately
$318.5 million. We have not yet completed an investigation of the monies spent
or available defenses in light of the notification. We have also not yet
determined whether or to what extent other parties may bear responsibility for
these costs. On April 1, 2008, the EPA indicated that the future work
to be performed at the harbor is expected to exceed hundreds of millions of
dollars under current estimates. We anticipate further discussions
with the U.S. Department of Justice, the EPA, and the Commonwealth of
Massachusetts. We are investigating the claim as well as potential defenses and
other actions, including the engagement of environmental engineering consultants
to study and analyze documentation made, or to be made, available by the EPA
with respect to the site. The potential impact of this matter on our
financial position, results of operations and cash flows cannot be determined at
this time.
On June
2, 2006, we received a “Confirmation of Potential Liability; Demand and Notice
of Decision Not to Use Special Notice Procedures” dated May 31, 2006 from the
EPA with regard to $1.6 million (subsequently modified to $0.9 million) of past
costs, as well as future costs for environmental remediation, related to the
purported release of hazardous substances at an abandoned facility referred to
as the “Aerovox Facility” (the “Facility”), located at 740 Belleville Avenue,
New Bedford, Massachusetts. Aerovox Corporation, a predecessor of AVX, sold this
Facility to an unrelated third party in 1973. A subsequent unrelated owner,
Aerovox Inc., the last manufacturer to own and operate in the Facility, filed
for bankruptcy in 2001 and abandoned the Facility. We have had
numerous meetings with the EPA, the Massachusetts Department of Environmental
Protection and the City of New Bedford regarding the potential environmental
remediation of the Facility and the assignment of responsibility among the
parties. Tentative agreements between EPA, the Commonwealth of
Massachusetts, the City of New Bedford, and AVX are now in place setting forth
the nature of the remedy, the allocation of financial responsibility, and the
schedule for remediation. Based on our own estimate of remediation costs, we
have accrued $18.2 million in the quarter ended March 31, 2009 (which amount is
included in the $19.7 million reserved as of March 31, 2010 for potential CERCLA
liability as discussed below) as an estimate of our potential liability related
to performance of certain environmental remediation actions at the
Facility. This accrual assumes the anticipated performance of certain
remedial actions by the other parties. Our accrual represents the estimate of
our costs to remediate; however, until all public comment periods have expired
and EPA has reviewed such comments, the agreements are finalized, and the
remediation is complete, we can not be certain there will be no additional
costs.
Recently,
AVX was named as a third party defendant in a case filed in Massachusetts
Superior Court captioned DaRosa v. City of New
Bedford. This case relates to a former disposal site in the
City of New Bedford located at Parker Street. The City asserts that
AVX, inter alia, contributed to that site. We intend to defend
vigorously the claims that have been asserted in this lawsuit. At this early
stage of the litigation, there has not been a determination as to responsible
parties or the amount, if any, of damages. Accordingly, the potential impact of
the case on our financial position, results of operations, and cash flows cannot
be determined at this time.
-8-
In September 2007, we
received notice from Horry Land Company, the owner of property adjacent to our
South Carolina factory, that Horry Land Company’s property value had been
negatively impacted by alleged migration of certain pollutants from our property
and demanding $5.4 million in compensatory damages, exclusive of costs that have
not been determined. We investigated the allegations and determined
that the demanded payment was not justified and that issues of liability, among
other issues, exist under environmental laws. As a result, in October
2007, we filed a declaratory judgment action in United States District Court for
the District of South Carolina under the CERCLA and the Federal Declaratory
Judgment Act, seeking a declaration that the Company is not liable for the
property damages claimed by Horry Land Company and for a determination and
allocation of past and future environmental response costs. Horry
Land Company has asserted its claims in this suit and it is now proceeding. In
addition, two other suits have been filed against the Company relating to the
same contamination. One suit was filed in the South Carolina State Court on
November 27, 2007 by certain individuals seeking certification as a class action
which has not yet been determined. The other suit is a commercial
suit filed on January 16, 2008, currently pending in South Carolina State Court,
by John H. Nance and JDS Development of Myrtle Beach, Inc. AVX has also sought
to join the United States Air Force as a potentially responsible
party. We intend to defend vigorously the claims that have been
asserted in the three related lawsuits. At this early stage of the litigation,
there has not been a determination as to responsible parties or the amount, if
any, of damages. With respect to the related environmental assessment, we are in
the process of a feasibility study to evaluate possible remedies and at this
stage have not been able to determine what measures may have to be undertaken or
the likely costs of any such measures. Accordingly, the potential impact of
either the lawsuits or the remediation on our financial position, results of
operations, and cash flows cannot be determined at this time.
We currently have reserved
approximately $19.7 million at March 31, 2010 related to these
matters. Except for the matters discussed above, while no assurance
can be given, we do not believe that any additional costs to be incurred by AVX
at any of the sites will have a material adverse effect on our financial
condition, results of operations or cash flows.
We also
operate on sites that may have potential future environmental issues as a result
of activities at sites during AVX’s long history of manufacturing operations or
prior to the start of operations by AVX. Even though we may have
rights of indemnity for such environmental matters at certain sites, regulatory
agencies in those jurisdictions may require us to address such
issues. Once it becomes probable that we will incur costs in
connection with remediation of a site and such costs can be reasonably
estimated, we establish reserves or adjust our reserves for our projected share
of these costs. A separate account receivable is recorded for any
indemnified costs.
We are
not involved in any pending or threatened proceedings that would require
curtailment of our operations. We continually expend funds to ensure
that our facilities comply with applicable environmental
regulations. While we believe that we are in material compliance with
applicable environmental laws, we cannot accurately predict future developments
and do not necessarily have knowledge of all past occurrences on sites that we
currently occupy. More stringent environmental regulations may be
enacted in the future, and we cannot determine the modifications, if any, in our
operations that any such future regulations might require, or the cost of
compliance with such regulations. Moreover, the risk of environmental
liability and remediation costs is inherent in the nature of our business and,
therefore, there can be no assurance that material environmental costs,
including remediation costs, will not arise in the future.
Company
Information and Website
We file
annual, quarterly, and current reports, proxy statements, and other documents
with the Securities and Exchange Commission ("SEC") under the Securities
Exchange Act of 1934 (the “Exchange Act”). The public may read and
copy any materials that we file with the SEC at the SEC's Public Reference Room
at 100 F Street, NE, Washington, DC 20549. The public may obtain
information on the operation of the Public Reference Room by calling the SEC at
1-800-SEC-0330. Also, the SEC maintains an Internet website that
contains reports, proxy and information statements, and other information
regarding issuers, including us, that file electronically with the
SEC. The public can obtain any documents that we file with the SEC at
http://www.sec.gov.
In
addition, our Company website can be found on the Internet at
www.avx.com. Copies of each of our filings with the SEC on Form 10-K,
Form 10-Q and Form 8-K, and all amendments to those reports, can be viewed and
downloaded free of charge as soon as reasonably practicable after the reports
and amendments are electronically filed with or furnished to the
SEC. To view the reports from our website, go to “Corporate
Information”, then “Investor Relations”, then “Financial Reports”.
-9-
The
following corporate governance related documents are also available free on our
website:
|
·
|
Code
of Business Conduct and Ethics
|
|
·
|
Code
of Business Conduct and Ethics Supplement Applicable to the Chief
Executive Officer, Chief Financial Officer, Controllers and Financial
Managers
|
|
·
|
Corporate
Governance Guidelines
|
|
·
|
Audit
Committee Charter
|
|
·
|
Contact
the Board – Whistleblower and Ethics Hotline
Procedures
|
To review
these documents, go to our website, click on “Corporate Information”, then on
“Corporate Governance”.
Executive
Officers of the Registrant
Our
executive officers are elected annually by our Board of Directors or, in some
cases, appointed in accordance with our bylaws and each officer holds office
until the next annual election of officers or until a successor has been duly
elected and qualified, or until the officer's death or resignation, or until the
officer has otherwise been removed in accordance with our bylaws. The
following table provides certain information regarding the executive officers of
the Company as of March 31, 2010:
|
Name
|
Age
|
Position
|
||
|
John
S.
Gilbertson
|
66
|
Chief
Executive Officer and President
|
||
|
C.
Marshall
Jackson
|
61
|
Executive
Vice President of Sales and Marketing
|
||
|
Peter
Venuto
|
57
|
Vice
President of Sales
|
||
|
Carl
L.
Eggerding
|
60
|
Vice
President, Chief Technology Officer
|
||
|
Kurt
P.
Cummings
|
54
|
Vice
President, Chief Financial Officer, Treasurer and
Secretary
|
||
|
Keith
Thomas
|
56
|
Vice
President, President of Kyocera Electronic Devices
|
||
|
Peter
Collis
|
58
|
Vice
President of Tantalum Products
|
||
|
John
Sarvis
|
60
|
Vice
President of Ceramic Products
|
||
|
John
Lawing
|
59
|
Vice
President of Advanced Products
|
-10-
John
S. Gilbertson
Chief
Executive Officer since 2001. President since 1997. Chief
Operating Officer from 1994 until 2001 and a member of the Board since
1990. Executive Vice President from 1992 to 1997, Senior Vice
President from 1990 to 1992 and employed by the Company since
1981. Managing Director of Kyocera since 1999. Director of
Kyocera since 1995. Member of the Board of Directors of Kyocera
International, Inc., a United States subsidiary of Kyocera, since
2001.
C.
Marshall Jackson
Executive
Vice President of Sales and Marketing since 2000. Senior Vice
President of Sales and Marketing from 1994 to 2000. Vice President of
Sales and Marketing from 1990 to 1994. Various sales, marketing and
operational positions with the Company since 1969.
Peter
Venuto
Vice
President of Sales since 2009. Vice President of North American and European
Sales from 2004 to 2009. Vice President of North American Sales from 2001 to
2004. Divisional Vice President of Strategic Accounts from 1998 until
2000. Director of Strategic Accounts from 1990 until
1997. Director of Business Development from 1987 until
1989. Employed by the Company since 1987.
Carl
L. Eggerding
Vice
President, Chief Technology Officer since 2000. Vice President of
Technology from 1997 to 2000. Employed by the Company since
1996. Prior to 1996, employed by IBM as Director of Development for
Organic Packaging Technology.
Kurt
P. Cummings
Vice
President, Chief Financial Officer, and Treasurer since
2000. Secretary since 1997. Corporate Controller from 1992
to 2000. Prior to 1992, Partner with Deloitte & Touche
LLP.
Keith
Thomas
Vice
President since 2001. President of Kyocera Electronic Devices since
2004. Vice President of Kyocera Developed Products from 2001 to
2004. Divisional Vice President of Kyocera Developed Products from
1992 until 2001. Employed by the Company since 1980.
Peter
Collis
Vice
President of Tantalum Products since 2001. Plant Manager of Paignton
facility from 1998 to 2001. Engineering Manager from 1997 to
1998. Plant Manager of Lanskroun facility from 1996 to
1997. Employed by the Company since 1968.
John
Sarvis
Vice
President of Ceramic Products since 2005. Divisional Vice President – Ceramics
Division from 1998 to 2005. Prior to 1998, held various Marketing and
Operational positions. Employed by the Company since 1973.
John
Lawing
Vice
President of Advanced Products since 2005. Divisional Vice President of Advanced
Products from 2002 to 2005 and Divisional Vice President of Leaded Products from
1997 to 2002. Prior to 1997, held positions in Engineering, Technical,
Operational and Plant management. Employed by the Company since
1981.
-11-
|
Item 1A.
|
Risk
Factors
|
From time
to time, information provided by us, including, but not limited to statements in
this report, or other statements made by or on our behalf, may contain
“forward-looking” information within the meaning of the Private Securities
Litigation Reform Act of 1995. Such statements involve a number of
risks, uncertainties and contingencies, many of which are beyond our control,
which may cause actual results, performance or achievements to differ materially
from those anticipated.
Our
businesses routinely encounter and address risks, some of which will cause our
future results to be different – sometimes materially different – than we
presently anticipate. Discussion about the important operational
risks that our businesses encounter can also be found in “Management’s
Discussion and Analysis of Financial Condition and Results of Operations”
included elsewhere in this Form 10-K. We wish to caution the reader
that the following important risk factors, and those factors described elsewhere
in this report or other documents that we file or furnish to the Securities and
Exchange Commission, could cause our actual results to differ materially from
those stated in forward-looking statements contained in this document and
elsewhere. Below, we have described our current view of certain
important strategic risks. These risks are not presented in order of
importance or probability of occurrence. Our reactions to material
future developments as well as our competitors’ reactions to those developments
will impact our future results.
We
operate in a cyclical business which could result in significant fluctuations in
demand for our products
Cyclical
changes in our customers’ businesses have resulted in, and may in the future
result in, significant fluctuations in demand for our products, our unit costs
and our profitability. Most of our customers are in cyclical
industries. Their requirements for passive components and connectors
fluctuate significantly as a result of changes in general economic conditions
and other factors. During periods of increasing demand they typically
seek to increase their inventory of our products to avoid production
bottlenecks. When demand for their products peaks and begins to
decline, as has happened in the past, they tend to reduce or cancel orders for
our products while they use up accumulated stocks. Business cycles
vary somewhat in different geographical regions and customer
industries. Significant fluctuations in sales of our products impact
our unit manufacturing costs and impact our profitability by making it more
difficult for us to predict our production, raw materials and shipping
needs. Changes in demand mix, needed technologies and end-use markets
may adversely affect our ability to match our products, inventory and capacity
to meet customer demand and could adversely affect our operating results and
financial condition. We are also vulnerable to general economic
events or trends beyond our control, and our sales and profits may suffer in
periods of weak demand.
We
must consistently reduce costs to remain competitive and to combat downward
price trends
To remain
competitive and to combat the impact of potential downward price trends we must
consistently reduce the total costs of our products. Our industry is
intensely competitive, and prices for existing products tend to decrease over
their life cycle. To remain competitive, we must achieve continuous
cost reductions through process and material improvements. We
must also be in a position to minimize our customers’ inventory financing costs
and to meet their other goals for supply chain management. In
addition, as a result of our efforts to streamline manufacturing, logistics
operations and enhance operations in low cost labor markets in response to the
current economic downturn and reduced needs of the electronic components market,
we have incurred restructuring costs in the fiscal year ended March 31, 2010. In
addition, we expect to incur additional restructuring costs during the next
fiscal year as we continue to respond to global market
conditions. The amount of restructuring is difficult to predict in
today’s volatile economy as we develop actions in response to anticipated market
conditions and product demand. If we are unsuccessful in implementing
our restructuring and other cost reduction plans, we may experience disruptions
in our operations and higher ongoing costs, which may adversely affect our
business, financial condition and operating results.
We
attempt to improve profitability by operating in countries in which
manufacturing costs are lower; but the shift of operations to these regions may
entail considerable expense
Our
strategy is aimed at achieving significant production cost savings through the
transfer to and expansion of manufacturing operations in countries with lower
productions costs, such as the Czech Republic, Malaysia, Mexico, China and El
Salvador. During this process, we may experience under-utilization of certain
plants and factories in higher-cost regions and capacity constraints in plants
and factories located in lower-cost regions. This under-utilization
may result initially in production inefficiencies and higher costs. These costs
also include those associated with compensation in connection with work force
reductions and plant closings in the higher-cost regions, and start-up expenses,
equipment relocation costs, manufacturing and construction delays, and increased
depreciation costs in connection with the initiation or expansion of production
in lower-cost regions. In addition, as we implement transfers of
certain of our operations we may experience strikes or other types of unrest as
a result of lay-offs or termination of our employees in higher-cost
countries.
-12-
Due to
our global operations, we are subject to many laws governing international
relations (including but not limited to the Foreign Corrupt Practices Act and
the U.S. Export Administration Act), which prohibit improper payments to
government officials and restrict where and how we can do business, what
information or products we can supply to certain countries, and what information
we can provide to a non-U.S. government. Although we have procedures
and policies in place that should mitigate the risk of violations of these laws,
there is no guarantee that they will be sufficiently effective. If
and when we acquire new businesses we may not be able to ensure that the
pre-existing controls and procedures meant to prevent violations of the rules
and laws were effective and we may not be able to implement effective controls
and procedures to prevent violations quickly enough when integrating newly
acquired businesses.
We
encounter competition in substantially all areas of our business
We
compete primarily on the basis of engineering, product quality, price, customer
service, and delivery time. Competitors include large, diversified
companies, some of which have substantial assets and financial resources, as
well as medium to small companies. There can be no assurance that
additional competitors will not enter into our existing markets, nor can there
be any assurance that we will be able to compete successfully against existing
or new competition.
We
must continue to develop innovative products to remain competitive
Most of
the fundamental technologies used in the passive components industry have been
available for a long time. The market is nonetheless typified by
rapid changes in product designs and technological advantages allowing for
better performance and/or lower cost. New applications are frequently found for
existing technologies, and new technologies occasionally replace existing
technologies for some applications or open up new business opportunities in
other areas of application. Successful innovation is critical for
maintaining profitability in the face of potential erosion of selling prices for
existing products. To combat downward selling price pressure for our
products and to meet market requirements, we must continue to develop innovative
products and production techniques. Sustaining and improving our
profitability depends a great deal on our ability to develop new products
quickly and successfully to customer specifications. Non-customized commodity
products are especially vulnerable to price pressure, but customized products
have also experienced price pressure in recent years. We have
traditionally combated downward pricing trends in part by offering products with
new technologies or applications that offer our customers advantages over older
products. We also seek to maintain profitability by developing
products to our customers’ specifications that are not readily available from
competitors. Developing and marketing these products requires
start-up costs that may not be recouped if those new products or production
techniques are not successful. There are numerous risks inherent in
this process, including the risks that we will be unable to anticipate the
direction of technological change or that we will be unable to develop and
market new products and applications in a timely fashion to satisfy customer
demands. If this occurs, we could lose customers and experience
adverse effects on our results of operations.
Our
operating results are sensitive to raw material availability, quality and
cost
Many of
our products require the use of raw materials that are available from only a
limited number of regions around the world, are available from only a limited
number of suppliers or may be subject to significant fluctuations in market
prices. Our results of operations may be adversely affected if we
have difficulty obtaining these raw materials, our key suppliers experience
financial difficulties, the quality of available raw materials deteriorates, or
there are significant price increases for these raw materials. For
example, the prices for tantalum, platinum, silver, nickel, gold, copper and
palladium, raw materials that we use in the manufacture of our products, are
subject to fluctuation and have risen significantly in the past. Our inability
to recover costs through increased sales prices could have an adverse impact on
our results of operations. For periods in which the prices for these
raw materials rise, we may be unable to pass on the increased cost to our
customers which would result in decreased margins for the products in which they
are used. For periods in which margins are declining, we may be
required, as has occurred in the past, to write down our inventory carrying cost
of these raw materials. Depending on the extent of the difference
between market price and our carrying cost, the write-down could have an adverse
effect on our results of operations.
-13-
From time
to time there have been short-term market shortages of raw
materials. While these shortages have not historically adversely
affected our ability to increase production of products, they have historically
resulted in higher raw material costs for us. There can be no
assurance that any of these market shortages in the future would not adversely
affect our ability to increase production, particularly during periods of
growing demand for our products.
Our
sales to distribution sales channel customers may fluctuate
Selling
products to our customers in the electronic component distribution sales channel
has associated risks, including, without limitation, that sales can be
negatively impacted on a short-term basis as a result of changes in distributor
inventory levels; these changes may be unrelated to the purchasing trends by the
end customer. In the past, we have gone through cycles of inventory
correction as distributors increase or decrease their supply chain inventories
based upon their anticipated market needs and economic conditions.
Our
backlog is subject to customer cancellation
We
generally do not obtain firm, long-term purchase commitments from our
customers. Uncertain economic and geopolitical conditions have
resulted in, and may continue to result in some of our customers delaying the
delivery of products that we manufacture for them and placing purchase orders
for lower volumes of products than previously anticipated. Many of
the orders that comprise our backlog may be canceled by our customers without
penalty. Our customers may on occasion order components from multiple
sources to ensure timely delivery when delivery lead times are particularly
long. They may cancel orders when business is weak and inventories
are excessive, a situation that we have experienced during periods of economic
slowdown. Therefore, we cannot be certain that the amount of our
backlog does not exceed the level of orders that will ultimately be
delivered. Our results of operations could be adversely impacted if
customers cancel a material portion of orders in our backlog.
Our
growth strategy may include growth through acquisitions, which may involve
significant risks
We may,
from time to time, make strategic acquisitions of other companies or businesses
as we believe such acquisitions can help to position us to take advantage of
growth opportunities. Such acquisitions could introduce significant
risks and uncertainties, including risks related to integrating the acquired
businesses and achieving benefits from the acquisitions. More particularly,
risks and uncertainties of an acquisition strategy could include: (1)
difficulties in integrating newly-acquired businesses and operations in an
efficient and effective manner; (2) challenges in achieving strategic
objectives, cost savings and other benefits from acquisitions; (3) risk that our
markets do not evolve as anticipated and that the technologies acquired do not
prove to be those needed to be successful in those markets; (4) potential loss
of key employees of the acquired businesses; (5) risk of diverting the attention
of senior management from our operations; (6) risks of entering new markets in
which we have limited experience; (7) risks associated with integrating
financial reporting and internal control systems; (8) difficulties in expanding
information technology systems and other business processes to accommodate the
acquired businesses; and (9) future impairments of goodwill and other intangible
assets of an acquired business.
Changes
in our environmental liability and compliance obligations may adversely impact
our operations
Our
manufacturing operations, products and/or product packaging are subject to
environmental laws and regulations governing air emissions, wastewater
discharges, the handling, disposal and remediation of hazardous substances,
wastes and certain chemicals used or generated in our manufacturing process,
employee health and safety, labeling or other notifications with respect to the
content or other aspects of our processes, products or packaging, restrictions
on the use of certain materials in or on design aspects of our products or
product packaging, and responsibility for disposal of products or product
packaging. We also operate on sites that may have potential future
environmental issues as a result of activities at sites during the long history
of manufacturing operations of AVX or its corporate predecessor, or prior to the
start of operations by AVX. Even though we may have rights of
indemnity for such environmental matters at certain sites, regulatory agencies
in those jurisdictions may require us to address such issues. We establish
reserves for specifically identified potential environmental liabilities when
the liabilities are probable and can be reasonably
estimated. Nevertheless, there can be no assurance we will not be
obligated to address environmental matters that could have an adverse impact on
our operations. In addition, more stringent environmental regulations
may be enacted in the future, and we cannot presently determine the
modifications, if any, in our operations that any such future regulations might
require, or the cost of compliance with these regulations. In order
to resolve liabilities at various sites, we have entered into various
administrative orders and consent decrees, some of which may be, under certain
conditions, reopened or subject to renegotiation. See “Environmental Matters” in
Item 1 elsewhere in this Form 10-K for additional information.
-14-
Changes
in environmental compliance obligations of critical suppliers may adversely
impact our operations
We use
significant amounts of electrical energy and processed ores in its production
process. The Kyoto Protocol is an international agreement that
purports to set binding targets for signatory industrialized countries for
reducing greenhouse gas emissions. Further, a number of governments or
governmental bodies have introduced or are contemplating legislative and
regulatory change in response to the potential impacts of climate change
including pending U.S. legislation that if enacted, would limit and reduce
greenhouse gas emissions through a “cap and trade” system of allowances and
credits, among other provisions. There is also current and emerging
regulation in other countries in which we or our customers operate, such as the
mandatory renewable energy target in Australia. Any significant, sustained
increase in energy costs could result in increases in our capital expenditures,
operating expenses, and costs of important raw materials resulting in an adverse
effect on our results of operations and financial condition.
The
potential physical impacts of climate change on the company’s operations are
highly uncertain, and will be particular to the geographic circumstances. These
effects may adversely impact the cost, production and financial performance of
our operations.
Our
results may be negatively affected by foreign currency exchange
rates
We
conduct business in several international currencies through our worldwide
operations, and as a result, are subject to foreign exchange exposure due to
changes in exchange rates of the various currencies. Volatility in exchange
rates can positively or negatively affect our sales, gross margins and retained
earnings. In order to minimize the effects of movements in currency exchange
rates, we enter into forward exchange contracts to hedge external and
intercompany foreign currency transactions. In addition, we attempt to minimize
currency exposure risk by producing our products in the same country or region
in which the products are sold, thereby generating revenues and incurring
expenses in the same currency. There can be no assurance that our approach will
be successful, especially in the event of a significant and sudden decline in
the value of any of the international currencies of our worldwide operations. We
do not engage in purchasing forward exchange contracts for speculative
purposes.
Our
operating results may be adversely affected by foreign operations
We have
significant international operations and our operating results and financial
condition could be adversely affected by economic, political, health, regulatory
and other factors existing in foreign countries in which we
operate. International manufacturing and sales are subject to
inherent risks, including production disruption by employee union or works
council actions, changes in local economic or political conditions, the
imposition of currency exchange restrictions, unexpected changes in regulatory
environments, potentially adverse tax consequences and the exchange rate risk
discussed above. Further, we have operations, suppliers, and customers in
countries that are in the Pacific Basin which may be more susceptible to certain
natural disasters including earthquake, tsunami and typhoon. Although
we have operations around the world, a significant natural event could disrupt
supply or production or significantly affect the market for some or all of our
products. There can be no assurance that these factors will not have
an adverse impact on our production capabilities or otherwise adversely affect
our business and operating results.
We
receive government grants from some countries in which we operate. These grants
are intended to promote employment and are generally conditioned on the
recipient maintaining certain employment levels. To the extent the number of
employees falls below the prescribed employment levels, we could be required to
refund all or a portion of the grants received.
Our
products are subject to stringent specifications and operating
tolerances
All of
our products are built to specifications and tested by us for adherence to such
specifications before shipment to customers. We warrant that our products will
meet such specifications. In the past, we have not incurred significant warranty
claims. However, we have seen an increasing trend for claims related to end
market product application failures or end-user recall or damage claims related
to product defects which could result in future claims that have an adverse
impact on our results of operations.
-15-
Fluctuations
in the market values of our investment portfolio could adversely affect our
financial condition and operating results
Although
we have not recognized any material losses related to our cash equivalents,
short-term investments, available for sale securities, or long-term investments,
future declines in the market values of such investments could have an adverse
effect on our financial condition and operating results. Given the global nature
of our business, we have investments both domestically and internationally.
Additionally, a portion of our overall investment portfolio includes investments
in the financial sector. If the issuers of such investments default on their
obligations or their credit ratings are negatively impacted by liquidity, credit
deterioration or losses, financial results, or other factors, the value of our
cash equivalents, short-term investments, available for sale securities and
long-term investments could decline and have an adverse effect on our financial
condition and operating results. In addition, our
ability to find investments that are both safe and liquid and that provide a
reasonable return may be impaired. This could result in lower
interest income and/or higher other-than-temporary impairments.
|
|
Credit
risk on our accounts receivable could adversely affect our financial
condition and operating results
|
Our
outstanding trade receivables are not covered by collateral or credit insurance.
While we have procedures to monitor and limit exposure to credit risk on our
trade receivables, there can be no assurance such procedures will effectively
limit our credit risk and avoid losses, which could have an adverse effect on
our financial condition and operating results.
|
|
Counterparty
non-performance to derivative transactions could adversely affect our
financial condition and operating
results
|
We
evaluate the credit qualities of potential counterparties to derivative
transactions and only enter into agreements with those deemed to have minimal
credit risk at the time the agreements are executed. Our foreign exchange hedge
portfolio is diversified across several credit line banks. We carefully monitor
the amount of exposure we have with any given bank. We also periodically monitor
changes to counterparty credit quality as well as our concentration of credit
exposure to individual counterparties. We do not hold or issue derivative
financial instruments for trading or speculative purposes. A credit crisis could
have an impact on our hedging contracts if our counterparties are forced to file
for bankruptcy or are otherwise unable to perform their obligations. If we are
required to terminate hedging contracts prior to their scheduled settlement
dates, we may be required to recognize losses. In some cases, we have master
netting agreements that help reduce the risk of counterparty
exposures.
|
|
Returns
on pension and retirement plan assets and interest rate changes could
affect our earnings in future
periods
|
The
funding position of our pension plans is impacted by the performance of the
financial markets, particularly the equity markets, and the discount rate used
to calculate our pension obligations for funding and expense
purposes. Recent significant declines in the financial markets have
negatively impacted the value of the assets in our defined benefit pension
plans. In addition, lower bond yields may reduce our discount rates,
resulting in increased pension contributions and expense.
Funding
obligations are determined under government regulations and measured each year
based on the value of the assets and liabilities on a specific
date. If the financial markets do not provide the long-term returns
that are expected, we could be required to make larger
contributions. The equity markets can be, and recently have been,
very volatile, and therefore our estimate of future contribution requirements
can change in relatively short periods of time. In a low interest
rate environment, the likelihood of higher contributions in the future
increases.
We
may not generate sufficient future taxable income, which may require additional
deferred tax assets valuation allowances
As part
of the process of preparing our consolidated financial statements, we are
required to estimate our tax assets and liabilities in each of the jurisdictions
in which we operate. This process involves management estimating the
actual current tax exposure together with assessing temporary differences
resulting from different treatment of items for tax and accounting
purposes. These differences result in deferred tax assets and
liabilities that are included within our consolidated balance
sheets. We assess the likelihood that our deferred tax assets will be
recoverable as a result of future taxable income and, to the extent we believe
that recovery is not likely, we establish a valuation
allowance.
-16-
We have
recorded valuation allowances due to uncertainties related to our ability to
realize some of our deferred tax assets, primarily consisting of certain net
operating losses carried forward before they expire. The valuation
allowance is based on our estimates of future taxable income over the periods
that our deferred tax assets will be recoverable.
We also
record a provision for certain international, federal and state tax
contingencies based on the likelihood of obligation, when needed. In
the normal course of business, we are subject to challenges from U.S. and
non-U.S. tax authorities regarding the amount of taxes due. These
challenges may result in adjustments of the timing or amount of taxable income
or deductions or the allocation of income among tax
jurisdictions. Further, during the ordinary course of business, other
changing facts and circumstances may impact our ability to utilize tax benefits
as well as the estimated taxes to be paid in future periods. In the
event that actual results differ from our estimates, we may need to adjust tax
accounts and related payments, which could materially impact our financial
condition and results of operations.
If we are
unable to generate sufficient future taxable income in certain jurisdictions, or
if there is a significant change in the actual tax rates or the time period
within which the underlying temporary differences become taxable or deductable,
we could be required to increase our valuation allowances against our deferred
tax assets resulting in an increase in our effective tax rate and an adverse
impact on future operating results.
Liquidity
requirements could necessitate transfers of existing cash balances between our
subsidiaries which may be subject to restrictions or cause unfavorable tax or
earnings consequences
A
significant portion of our cash and investment securities are held by
international subsidiaries. While we intend to use a significant
amount of the cash held overseas to fund our international operations and
growth, if we encounter a significant need for liquidity domestically or at a
particular location that we cannot fulfill through other internal or external
sources, we may experience unfavorable tax and earnings consequences due to cash
transfers. These adverse consequences would occur, for example, if
the transfer of cash into the United States is taxed and no offsetting foreign
tax credit is available to offset the U.S. tax liability, resulting in lower
earnings.
Changes
in general economic conditions and other factors beyond our control may
adversely impact our business
The
following factors beyond our control could adversely impact our
business:
|
·
|
A
global economic slowdown in any one, or all, of our
markets.
|
|
·
|
Rapid
escalation of the cost of regulatory compliance and
litigation.
|
|
·
|
Unexpected
government policies and regulations affecting us or our significant
customers’ sales or production
facilities.
|
|
·
|
Unforeseen
regional conflicts or actions, including but not limited to armed conflict
and trade wars that could impact our, or our customers’ production
capabilities.
|
|
·
|
Unforeseen
interruptions to our business with our significant customers and suppliers
resulting from but not limited to, strikes, financial instabilities,
computer malfunctions, environmental disruptions or inventory
excesses.
|
We
operate in a continually changing business environment and new factors emerge
from time to time. Other unknown and unpredictable factors also could have
either adverse or positive effects on our future results of operations or
financial condition.
|
Item 1B.
|
Unresolved
Staff Comments
|
Not
applicable
-17-
|
Item 2.
|
Properties
|
Our fixed
assets include certain plants and warehouses and a substantial quantity of
machinery and equipment, most of which is general purpose machinery and
equipment using tools and fixtures and in many instances have automatic control
features and special adaptations. Our plants, warehouses, machinery
and equipment are in good operating condition and are well maintained.
Substantially all of our facilities are in regular use. We consider
the present level of fixed assets along with planned capital expenditures as
suitable and adequate for our operations in the current business
environment. Our capital expenditures for plant and equipment were
$70.9 million in fiscal 2008, $44.2 million in fiscal 2009 and $28.9 million in
fiscal 2010.
We
believe that our facilities are suitable and adequate for the business conducted
therein and are being appropriately utilized for their intended purposes.
Utilization of the facilities varies based on demand for the
products. We continuously review our anticipated requirements for
facilities and, based on that review, may from time to time acquire or lease
additional facilities and/or dispose of existing facilities.
We
conduct manufacturing operations throughout the world. Most of our
operations are certified to the ISO 9000 quality standard, a set of fundamental
quality system standards developed by the International Organization for
Standardization. Some of our facilities are also qualified and
registered under the more stringent QS 9000, a comprehensive quality system for
continuous improvement developed by the U.S. automotive industry.
Virtually
all of our manufacturing, research and development and warehousing facilities
could at any time be involved in the manufacturing, sale or distribution of
passive components (PC) and connector products (CP). The following is
a list of our facilities, their approximate square footage, whether they are
leased or owned and a description of their use.
|
Location
|
Approximate
Square
Footage
|
Type
of Interest
|
Description
of
Use
|
||
|
UNITED
STATES
|
|||||
|
Fountain
Inn, SC
|
300,000
|
Owned
|
Headquarters/Manufacturing
|
||
|
Myrtle
Beach, SC
|
500,000
|
Owned
|
Manufacturing/Research
— PC — CP
|
||
|
Myrtle
Beach, SC
|
69,000
|
Owned
|
Office/Warehouse
— PC — CP
|
||
|
Olean,
NY
|
113,000
|
Owned
|
Manufacturing
— PC
|
||
|
Jacksonville,
FL
|
100,000
|
Owned
|
Manufacturing
— PC
|
||
|
Huntington
Station, NY
|
94,000
|
Owned
|
Manufacturing/Research—
PC
|
||
|
Biddeford,
ME
|
72,000
|
Owned
|
Manufacturing
— PC
|
||
|
Conway,
SC
|
71,000
|
Owned
|
Manufacturing/Office
— PC
|
||
|
Atlanta,
GA
|
49,000
|
Leased
|
Office/Warehouse
— PC — CP
|
||
|
Sun
Valley, CA
|
25,000
|
Leased
|
Manufacturing
— PC
|
||
|
Colorado
Springs, CO
|
15,000
|
Owned
|
Manufacturing
— PC
|
||
|
NON
U.S.
|
|||||
|
Tianjin,
China
|
520,000
|
Owned
|
Manufacturing
— PC
|
||
|
San
Salvador, El Salvador
|
420,000
|
Owned
|
Manufacturing
— PC
|
||
|
Saint-Apollinaire,
France
|
322,000
|
Leased
|
Manufacturing/Research
— PC
|
||
|
Lanskroun,
Czech Republic
|
490,000
|
Owned
|
Manufacturing/Warehouse/Research
— PC
|
||
|
Lanskroun,
Czech Republic
|
47,000
|
Leased
|
Manufacturing/Warehouse
— PC
|
||
|
Uherske
Hradiste, Czech Republic
|
276,000
|
Owned
|
Manufacturing
— PC — CP
|
||
|
Uherske
Hradiste, Czech Republic
|
39,000
|
Leased
|
Warehouse
— PC
|
||
|
Uherske
Hradiste, Czech Republic
|
26,000
|
Leased
|
Manufacturing
— CP
|
||
|
Penang,
Malaysia
|
190,000
|
Owned
|
Manufacturing
— PC
|
||
|
Coleraine,
N. Ireland
|
185,000
|
Owned
|
Manufacturing/Research
— PC
|
||
|
Betzdorf,
Germany
|
115,000
|
Owned
|
Manufacturing
— CP
|
||
|
Juarez,
Mexico
|
109,000
|
Owned
|
Manufacturing
— PC — CP
|
||
|
Jerusalem,
Israel
|
88,000
|
Leased
|
Manufacturing/Research
— PC
|
||
|
Hong
Kong
|
30,000
|
Owned
|
Warehouse/Office
— PC — CP
|
||
In
addition to the foregoing, we own and lease a number of sales offices throughout
the world. In the opinion of management, our properties and equipment
generally are in good operating condition and are adequate for our present
needs. We do not anticipate difficulty in renewing existing leases as
they expire or in finding alternative facilities.
-18-
|
Item 3.
|
Legal
Proceedings
|
In
September 2007, we received notice from Horry Land Company, the owner of
property adjacent to our South Carolina factory, that Horry Land Company’s
property value had been negatively impacted by alleged migration of certain
pollutants from our property and demanding $5.4 million in compensatory damages,
exclusive of costs that have not been determined. We investigated the
allegations and determined that the demanded payment was not justified and that
issues of liability, among other issues, exist under environmental
laws. As a result, in October 2007, we filed a declaratory judgment
action in United States District Court for the District of South Carolina under
the CERCLA and the Federal Declaratory Judgment Act, seeking a declaration that
the Company is not liable for the property damages claimed by Horry Land Company
and for a determination and allocation of past and future environmental response
costs. Horry Land Company has asserted its claims in this suit and it
is now proceeding. In addition, two other suits have been filed against the
Company relating to the same contamination. One suit was filed in the South
Carolina State Court on November 27, 2007 by certain individuals seeking
certification as a class action which has not yet been
determined. The other suit is a commercial suit filed on January 16,
2008, currently pending in South Carolina State Court, by John H. Nance and JDS
Development of Myrtle Beach, Inc. AVX has also sought to join the United States
Air Force as a potentially responsible party. We intend to
defend vigorously the claims that have been asserted in the three related
lawsuits. At this early stage of the litigation, there has not been a
determination as to responsible parties or the amount, if any, of damages. With
respect to the related environmental assessment, we are in the process of a
feasibility study to evaluate possible remedies and at this stage have not been
able to determine what measures may have to be undertaken or the likely costs of
any such measures. Accordingly, the potential impact of either the lawsuits or
the remediation on our financial position, results of operations, and cash flows
cannot be determined at this time.
Recently,
AVX was named as a third party defendant in a case filed in Massachusetts
Superior Court captioned DaRosa v. City of New
Bedford. This case relates to a former disposal site in the
City of New Bedford located at Parker Street. The City asserts that
AVX contributed to that site. We intend to defend vigorously the
claims that have been asserted in this lawsuit. At this early stage of the
litigation, there has not been a determination as to responsible parties or the
amount, if any, of damages. Accordingly, the potential impact of the case on our
financial position, results of operations, and cash flows cannot be determined
at this time
See “Environmental Matters” in Item 1
elsewhere in this Form 10-K for a discussion of our involvement as a PRP at
certain environmental clean-up sites.
We are
involved in disputes, warranty and legal proceedings arising in the normal
course of business. While we cannot predict the outcome of these proceedings, we
believe, based upon a review with legal counsel, that none of these proceedings
will have a material impact on our financial position, results of operations, or
cash flows. However, we cannot be certain if the eventual outcome and any
adverse result in these or other matters that may arise from time to time may
harm our financial position, results of operations, or cash flows.
|
Item 4.
|
Removed
and Reserved
|
-19-
PART
II
|
Item 5.
|
Market
for the Registrant's Common Equity, Related Stockholder Matters and Issuer
Purchases of Equity Securities
|
Market
for Common Stock
Our
common stock is listed on the New York Stock Exchange and trades under the
symbol "AVX". At May 3, 2010, there were approximately 258 holders of
record of the Company's common stock. In addition, there were
numerous beneficial holders of the common stock, representing persons whose
stock is held in nominee or "street name" accounts through
brokers. The following table presents the high and low sale prices
for our common stock on the New York Stock Exchange and the dividends declared
per common share for each quarter for the fiscal years ended March 31, 2010 and
March 31, 2009. On May 5, 2010, our Board of Directors declared a
$0.045 dividend per share of common stock with respect to the quarter ended
March 31, 2010. Future dividends, if any, will be determined by the
Company’s Board of Directors and may depend on the Company's future
profitability and anticipated operating cash requirements.
|
Common
Stock Price Range
|
Dividends
Declared
|
|||||||||||||||||||||||
|
2009
|
2010
|
Per
Share
|
||||||||||||||||||||||
|
High
|
Low
|
High
|
Low
|
2009
|
2010
|
|||||||||||||||||||
|
First
Quarter
|
$ | 13.79 | $ | 11.22 | $ | 10.63 | 9.01 | $ | 0.0400 | $ | 0.0400 | |||||||||||||
|
Second
Quarter
|
11.82 | 9.71 | 12.44 | 9.54 | 0.0400 | 0.0400 | ||||||||||||||||||
|
Third
Quarter
|
10.37 | 7.10 | 12.95 | 11.04 | 0.0400 | 0.0400 | ||||||||||||||||||
|
Fourth
Quarter
|
9.63 | 7.32 | 14.42 | 11.66 | 0.0400 | 0.0450 | ||||||||||||||||||
The name,
address and phone number of our stock transfer agent and registrar
is:
The American Stock Transfer and Trust
Company
59 Maiden Lane, Plaza
Level
New York, New York 10038
1-800-937-5449
-20-
Stock
Performance Graph
The
following chart shows, from the end of fiscal year 2005 to the end of fiscal
year 2010, changes in the value of $100 invested in each of the Company’s common
stock, Standard & Poor’s 500 Composite Index and a peer group consisting of
three companies whose businesses are representative of our business
segments. The companies in the peer group are: Kemet Corporation,
Vishay Intertechnology, Inc. and EPCOS AG.
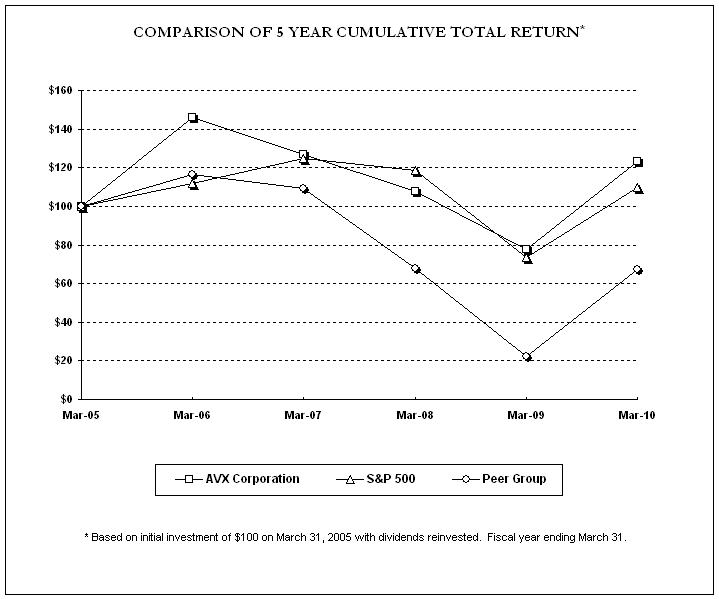
Cumulative
Total Return
|
3/31/05
|
3/31/06
|
3/31/07
|
3/31/08
|
3/31/09
|
3/31/10
|
|||||||||||||||||||
|
AVX
-NYSE
|
$ | 100 | $ | 146 | $ | 127 | $ | 108 | $ | 78 | $ | 123 | ||||||||||||
|
S
& P 500
|
$ | 100 | $ | 112 | $ | 125 | $ | 119 | $ | 73 | $ | 110 | ||||||||||||
|
Peer
Group
|
$ | 100 | $ | 117 | $ | 109 | $ | 68 | $ | 22 | $ | 67 | ||||||||||||
-21-
Purchases
of Equity Securities by the Issuer
The
following table provides information regarding purchases by the Company, during
the fourth quarter ended March 31, 2010, of equity securities that are
registered pursuant to Section 12 of the Exchange Act:
|
Period
|
Total
Number of Shares Purchased (1) (2)
|
Average
Price Paid Per Share
|
Total
Number of Shares Purchased as Part of Publicly Announced Plans or Programs
(1)
(2)
|
Maximum
Number of Shares that may yet be Purchased Under the Plans or Programs
(1)
(2)
|
||||||||||||
|
1/1/10
- 1/31/10
|
- | $ | - | - | 7,745,302 | |||||||||||
|
2/1/10
- 2/28/10
|
163,390 | 12.22 | 163,390 | 7,581,912 | ||||||||||||
|
3/1/10
- 3/31/10
|
19,253 | 12.78 | 19,253 | 7,562,659 | ||||||||||||
|
Total
|
182,643 | $ | 12.28 | 182,643 | 7,562,659 | |||||||||||
|
(1)
|
On
October 19, 2005, the Board of Directors of the Company authorized the
repurchase of 5,000,000 shares of our common stock from time to time in
the open market. The repurchased shares are held as treasury
stock and are available for general corporate
purposes.
|
|
(2)
|
On
October 17, 2007, the Board of Directors of the Company authorized the
repurchase of an additional 5,000,000 shares of our common stock from time
to time in the open market. The repurchased shares are held as
treasury stock and are available for general corporate
purposes.
|
-22-
|
Item 6.
|
Selected
Financial Data
|
The
following table sets forth selected consolidated financial data for AVX for the
five fiscal years ended March 31, 2010. The selected consolidated
financial data for the five fiscal years ended March 31, 2010 are derived from
AVX's audited consolidated financial statements. The consolidated
financial data set forth below should be read in conjunction with AVX's
consolidated financial statements and the notes thereto and "Management's
Discussion and Analysis of Financial Condition and Results of Operations"
included elsewhere in this Form 10-K.
Selected
Financial Data
(in thousands, except per share
data)
|
2006
|
2007
|
2008
|
2009
|
2010
|
||||||||||||||||
|
Operating
Results Data:
|
||||||||||||||||||||
|
Net
sales
|
$ | 1,333,208 | $ | 1,498,495 | $ | 1,619,275 | $ | 1,389,613 | $ | 1,304,966 | ||||||||||
|
Cost
of sales
|
1,125,917 | 1,201,337 | 1,328,491 | 1,158,196 | 1,027,368 | |||||||||||||||
|
Vendor
settlement
|
- | - | - | - | (5,000 | ) | ||||||||||||||
|
Restructuring
charges
|
- | - | 2,421 | 15,123 | 4,397 | |||||||||||||||
|
Gross
profit
|
207,291 | 297,158 | 288,363 | 216,294 | 278,201 | |||||||||||||||
|
Selling,
general and administrative expenses
|
111,110 | 116,482 | 126,848 | 121,897 | 108,527 | |||||||||||||||
|
Environmental
charge
|
- | - | - | 18,200 | - | |||||||||||||||
|
Restructuring
charges
|
- | - | - | 3,504 | 2,509 | |||||||||||||||
|
In-process
research and development charge
|
- | - | 390 | - | - | |||||||||||||||
|
Other
operating income
|
- | - | - | (4,051 | ) | (3,519 | ) | |||||||||||||
|
Profit
from operations
|
96,181 | 180,676 | 161,125 | 76,744 | 170,684 | |||||||||||||||
|
Interest
income
|
22,999 | 40,033 | 43,226 | 21,112 | 7,120 | |||||||||||||||
|
Interest
expense
|
(1,454 | ) | - | (456 | ) | (139 | ) | (111 | ) | |||||||||||
|
Other,
net
|
1,894 | (3,143 | ) | (530 | ) | (578 | ) | (1,336 | ) | |||||||||||
|
Income
before income taxes
|
119,620 | 217,566 | 203,365 | 97,139 | 176,357 | |||||||||||||||
|
Provision
for income taxes
|
37,868 | 63,701 | 53,892 | 16,293 | 33,499 | |||||||||||||||
|
Net
income
|
$ | 81,752 | $ | 153,865 | $ | 149,473 | $ | 80,846 | $ | 142,858 | ||||||||||
|
Income
per share:
|
||||||||||||||||||||
|
Basic
|
$ | 0.47 | $ | 0.89 | $ | 0.87 | $ | 0.47 | $ | 0.84 | ||||||||||
|
Diluted
|
$ | 0.47 | $ | 0.89 | $ | 0.87 | $ | 0.47 | $ | 0.84 | ||||||||||
|
Weighted
average common shares outstanding:
|
||||||||||||||||||||
|
Basic
|
172,532 | 172,047 | 171,487 | 170,616 | 170,247 | |||||||||||||||
|
Diluted
|
173,053 | 172,751 | 172,065 | 170,689 | 170,274 | |||||||||||||||
|
Cash
dividends declared per common share
|
$ | 0.15 | $ | 0.15 | $ | 0.16 | $ | 0.16 | $ | 0.16 | ||||||||||
|
As
of March 31,
|
2006 | 2007 | 2008 | 2009 | 2010 | |||||||||||||||
|
Balance
Sheet Data:
|
||||||||||||||||||||
|
Working
capital
|
$ | 1,032,742 | $ | 1,214,035 | $ | 1,156,689 | $ | 983,102 | $ | 1,123,085 | ||||||||||
|
Total
assets
|
1,675,208 | 1,899,536 | 2,109,078 | 1,872,529 | 2,051,492 | |||||||||||||||
|
Stockholders'
equity
|
1,448,109 | 1,635,279 | 1,829,351 | 1,669,753 | 1,801,007 | |||||||||||||||
|
Years
Ended March 31,
|
2006 | 2007 | 2008 | 2009 | 2010 | |||||||||||||||
|
Other
Data:
|
||||||||||||||||||||
|
Capital
expenditures
|
$ | 41,328 | $ | 51,881 | $ | 70,886 | $ | 44,205 | $ | 28,888 | ||||||||||
|
Research,
development and engineering expenses
|
30,904 | 29,397 | 35,465 | 31,477 | 24,667 | |||||||||||||||
-23-
|
Item 7.
|
Management's
Discussion and Analysis of Financial Condition and Results of
Operations
|
Overview
AVX
Corporation is a leading worldwide manufacturer and supplier of a broad line of
passive electronic components and interconnect products. Electronic
components and connector products manufactured by AVX are used in virtually all
types of electronic products, including those in consumer electronics,
telecommunications, automotive military/aerospace, medical, computer and
industrial markets. The Company has five main product groups: Ceramic
Components, Tantalum Components, Advanced Components, Connectors and Kyocera
Electronic Devices. These product lines are organized into three
reportable segments: Passive Components, Connectors and KED Resale.
Consolidated
revenues for the fiscal year ended March 31, 2010 were $1,305.0 million with net
income of $142.9 million compared to consolidated revenues of $1,389.6 million
with net income of $80.8 million for the fiscal year ended March 31, 2009.
During fiscal 2010, we saw increasing demand throughout the year as the overall
global economy showed increasing signs of recovery from the financial crisis
that began during the second half of fiscal 2009 and continued into early fiscal
2010. Sales and net income improved sequentially each quarter during fiscal
2010. Despite signs of improving global economic conditions, supply chain
inventory levels remained lean during most of the fiscal year and have only
recently shown signs of a replenishment cycle. Overall sales prices
for our commodity component products remained relatively flat during the fiscal
year as increasing demand helped to moderate typical pricing declines. We
continue to proactively take actions to manage our production output and tightly
control our cost structure.
Despite a
challenging global economic environment, our financial position remained strong
and we delivered positive operating cash flows. In fiscal 2010, we
generated operating cash flows of $200.4 million. We use cash
generated from operations to fund capital expenditures and working capital,
repurchase shares of our common stock, which are held as treasury stock, and pay
dividends. We have $913.8 million of cash, cash equivalents and securities
investments and no debt as of March 31, 2010.
We remain
committed to investing in new products and improvements to our production
processes as well as continued investment in research, development and
engineering in order to provide our customers with new generations of passive
component and connector product solutions. We are currently producing more
sophisticated electronic component parts necessitated by the breadth and
increase in functionality of the electronic devices that are manufactured by our
customers. As a result, we have continued our focus on value-added
advanced products and connectors to serve this expanding market. We are also
focused on controlling and reducing costs to accommodate market
forces. We do this by investing in automated manufacturing
technologies, enhancing manufacturing materials and efficiencies and
rationalizing our production capabilities around the world. We
believe that this philosophy will enable us to adapt quickly and benefit when
market conditions improve and provide shareholder value.
In
addition, we may, from time to time, consider strategic acquisitions of other
companies or businesses in order to expand our product offerings or otherwise
improve our market position. We evaluate potential acquisitions in order to
position ourselves to take advantage of profitable growth
opportunities.
Outlook
Near-Term:
We expect
that fiscal 2011 will be another challenging year in spite of the recent rebound
in consumer and industrial market demand resulting in improving global demand
for our electronic component products. Near-term results for us will depend on
the impact of the overall global economic conditions and its impact on
telecommunications, information technology hardware, automotive, consumer
electronics and other electronic markets. Looking ahead, visibility
is low and forecasting is a challenge in this uncertain and volatile
market. We expect to see typical pricing pressure in the markets we
serve as electronic component product supply comes more in balance with
demand. In response to anticipated market conditions, we expect to
continue to focus on cost management and product line rationalization to
maximize earnings potential. We also continue to focus on process
improvements and enhanced production capabilities in conjunction with our focus
on the sales of value-added electronic components to support today’s advanced
electronic devices. If current signs of economic recovery do not
materialize, the overall impact on our customers as well as end user demand for
electronic products could have a significant adverse impact on our near-term
results.
-24-
Long-Term:
Although
there is uncertainty in the near-term market as a result of the current economic
conditions, we continue to see opportunities for long-term growth and
profitability improvement due to: (a) a projected increase in the long-term
worldwide demand for electronic devices, which require electronic components
such as the ones we sell, (b) cost reductions and improvements in our production
processes and (c) opportunities for growth in our Advanced Component and
Connector product lines due to advances in component design and our production
capabilities. We have fostered our financial health and the strength
of our balance sheet. We remain confident that our strategies will
enable our continued long-term success.
Results
of Operations
Year
Ended March 31, 2010 compared to Year Ended March 31, 2009
Net sales
for the fiscal year ended March 31, 2010 were $1,305.0 million compared to
$1,389.6 million for the fiscal year ended March 31, 2009.
The table
below represents product group revenues for the fiscal years ended March 31,
2008, 2009 and 2010.
|
Years
Ended March 31,
|
||||||||||||
|
Sales
revenue (in thousands)
|
2008
|
2009
|
2010
|
|||||||||
|
Ceramic
Components
|
$ | 211,759 | $ | 165,740 | $ | 155,059 | ||||||
|
Tantalum
Components
|
312,761 | 268,326 | 280,991 | |||||||||
|
Advanced
Components
|
433,646 | 434,039 | 369,811 | |||||||||
|
Total
Passive Components
|
958,166 | 868,105 | 805,861 | |||||||||
|
KDP
and KKC Resale
|
468,186 | 354,258 | 338,701 | |||||||||
|
KEC
Resale Connectors
|
86,531 | 76,209 | 73,973 | |||||||||
|
Total
KED Resale
|
554,717 | 430,467 | 412,674 | |||||||||
|
Connectors
|
106,392 | 91,041 | 86,431 | |||||||||
|
Total
Revenue
|
$ | 1,619,275 | $ | 1,389,613 | $ | 1,304,966 | ||||||
Passive
Component sales were $805.9 million for the fiscal year ended March 31, 2010
compared to $868.1 million during the fiscal year ended March 31,
2009. The sales decrease in Passive Components reflects the overall
decline in global markets particularly during the first half of the year
resulting from the financial crisis as both consumers and manufacturers reduced
spending. Lower demand particularly in the consumer electronics, telecom,
industrial equipment and automotive markets was partially offset by improving
medical and military markets. Lower revenues from Advanced Components reflect
the lower demand primarily in the semiconductor and medical equipment businesses
resulting from the current economic conditions. The decrease in sales
of Ceramic Components reflects a decrease in the volume of unit sales, a higher
mix of commodity priced components and a moderate decrease in average selling
prices. The increase in sales of Tantalum Components is the result of
increased demand for these components as customers increased purchases in
response to the improved economic conditions during the second half of the
fiscal year as well as improved medical and military activity.
KDP and
KKC Resale sales were $338.7 million for the fiscal year ended March 31, 2010
compared to $354.3 million during the fiscal year ended March 31,
2009. When compared to fiscal 2009, the decrease during fiscal 2010
is primarily attributable to a decrease in KDP unit sales volume due to lower
end user demand, particularly in the telecommunications market, resulting from
the uncertainty in global economic conditions.
Total
Connector sales, including AVX manufactured and KEC Resale Connectors, were
$160.4 million in the fiscal year ended March 31, 2010 compared to $167.3
million during the fiscal year ended March 31, 2009. This decrease was primarily
attributable to a decrease in the telecommunications based product sectors as a
result of the adverse economy, particularly in the first half of the fiscal
year. This decrease was slightly offset by increases in sales volume related to
production demand for automotive electronics when compared to the prior
year.
-25-
Our sales
to independent electronic distributors represented 39% of total net sales for
the fiscal year ended March 31, 2010, compared to 36% for fiscal year ended
March 31, 2009. This increase is primarily attributable to improved global
economic conditions during the second half of the fiscal
year. However, in spite of the improving global economy, our
distributor customers have remained cautious and have been limiting their intake
of inventory and maintained lower inventory levels. Our sales to distributor
customers involve specific ship and debit and stock rotation programs for which
sales allowances are recorded as reductions in sales. Such allowance
charges were $29.5 million, or 5.5% of gross sales to distributor customers, for
the fiscal year ended March 31, 2010 and $38.5 million, or 7.2% of gross sales
to distributor customers, for the fiscal year ended March 31, 2009. Applications
under such programs for fiscal years ended March 31, 2010 and 2009 were
approximately $ 29.7 million and $ 39.1 million, respectively.
Geographically,
compared to the fiscal year ended March 31, 2009, sales for the fiscal year
ended March 31, 2010 decreased 8.8% in Europe, 6.8% in the Americas and 4.2% in
Asia, reflective of lower demand for products due to the decline of the global
market during the financial crisis. The movement of the U.S. dollar against
certain foreign currencies resulted in a favorable impact on sales for the year
ended March 31, 2010 of approximately $11.2 million when compared to the prior
year.
Gross
profit in the fiscal year ended March 31, 2010 increased to 21.3 % of sales or
$278.2 million compared to a gross profit margin of 15.6% of sales or $216.3
million in the fiscal year ended March 31, 2009. This increase is
primarily a result of the sale of higher margin value added products, our
disciplined cost management and the realization of benefits from previously
initiated restructuring actions. During the fiscal year ended March 31, 2010 we
incurred restructuring charges of $4.4 million related to headcount reductions
and other charges including those related to facility closures as we continued
to realign production capabilities and reduce operating costs to support current
business levels compared to $15.1 million of restructuring charges during fiscal
year ended March 31, 2009. We also recorded a $5.0 million reduction in cost of
sales related to a vendor settlement during the fiscal year ended March 31,
2010. During the fiscal year ended March 31, 2010, lower production volumes and
higher material costs were partially offset by our continued efforts to increase
production efficiency, lower operating costs and pursue increased capacity for
the production of value added products. In addition, there was a negative impact
on costs due to currency movement of the U.S. dollar against certain foreign
currencies of approximately $8.4 million when compared to the prior year
partially offset by lower depreciation expense in the fiscal year ended March
31, 2010 which was $7.3 million lower than in the previous fiscal year primarily
as a result of lower levels of capital spending.
Selling,
general and administrative expenses for the fiscal year ended March 31, 2010
were $108.5 million, or 8.3% of net sales, compared to $121.9 million, or 8.8%
of net sales, for the fiscal year ended March 31, 2009. The decrease
in selling, general and administrative expenses was primarily due to lower
selling expenses resulting from lower sales and savings resulting from effective
cost control measures and the realization of benefits from previous
restructuring actions. During the fiscal years ended March 31, 2010
and 2009, we recorded $2.5 million and $3.5 million of restructuring charges,
respectively, primarily related to headcount reductions to reduce ongoing
selling, general and administrative expenses.
Research,
development and engineering expenditures, which encompass the personnel and
related expenses devoted to developing new products and maintaining existing
products, processes and technical innovations, were approximately $31.5 million
and $24.7 million in fiscal 2009 and 2010, respectively, as overall spending was
reduced in response to the weak overall global economic
conditions. Research and development costs included therein decreased
in fiscal 2010 to $6.8 million compared to $11.7 million in fiscal 2009 as
certain projects transferred into full scale production. Engineering
expenses decreased $2.0 million to $17.8 million in fiscal 2010 compared to
$19.8 million in fiscal 2009.
Profit
from operations for the fiscal year ended March 31, 2010 increased $94.0 million
to $170.7 million compared to $76.7 million for the fiscal year ended March 31,
2009. This increase is a result of the factors discussed above. In addition,
gains of $3.6 and $4.0 million resulting from the sale of excess corporate
assets are included in other operating income for the fiscal years ended March
31, 2010 and 2009, respectively. During the fiscal year ended March
31, 2009 we recognized an $18.2 million environmental charge as an estimate of
our potential liability related to the performance of certain environmental
remediation actions at an abandoned facility in New Bedford, Massachusetts. See
Note 12 to our consolidated financial statements elsewhere herein for further
discussion related to this environmental charge.
-26-
Other
income decreased $14.7 million to $5.7 million in fiscal 2010 compared to $20.4
million in fiscal 2009. This decrease is attributable to a decrease in interest
income of approximately $14.0 million resulting from lower return rates on
investment balances in addition to higher net foreign currency losses when
compared to the prior fiscal year. Included in other income are impairment
charges related to the decline in market value of certain available-for-sale
securities of $0.4 million and $4.2 million for the fiscal years ended March 31,
2010 and 2009, respectively.
The
effective tax rate for the fiscal year ended March 31, 2010 was 19.0% compared
to an effective tax rate of 16.8% for the fiscal year ended March 31, 2009. The
increase in rate was due to higher pre-tax income in higher tax rate
jurisdictions partially offset by reduction of $16.6 million of deferred tax
liabilities resulting from certain of our foreign branch losses taken as
deductions for U.S. income tax purposes no longer being subject to the U.S.
income tax recapture regulations. This compares to a reduction of $8.5 million
of such deferred tax liabilities no longer being subject to the U.S. income tax
recapture regulations during the fiscal year ended March 31, 2009. We estimate a
further reduction in deferred tax liabilities of $3.6 million during the fiscal
year ending March 31, 2011 as the recapture period related to foreign branch
losses deducted in certain prior years expires.
As a
result of the factors discussed above, net income for the fiscal year ended
March 31, 2010 was $142.8 million compared to $80.8 million for the fiscal year
ended March 31, 2009.
Year
Ended March 31, 2009 Compared to Year Ended March 31, 2008
Net sales
for the fiscal year ended March 31, 2009 were $1,389.6 million compared to
$1,619.3 million for the fiscal year ended March 31, 2008.
In fiscal
2009, the demand for electronic components declined as end user demand was
impacted by the overall decline in world markets. Compared to the
prior year, Passive Components sales decreased $90.1 million, or 9.4%, to $868.1
million, KDP and KKC Resale sales decreased $113.9 million, or 24.3%, to $354.3
million and total Connector sales, including KEC Resale connectors, decreased
$25.6 million, or 13.2%, to $167.3 million.
Passive
Component sales were $868.1 million for the fiscal year ended March 31, 2009
compared to $958.2 million during the fiscal year ended March 31,
2008. The sales decrease in Passive Components reflects the overall
decline in global markets resulting from the current economic uncertainty as
both consumers and manufacturers reduced spending. Lower demand in the consumer
electronics and automotive markets was partially offset by increases in the
medical and military markets. Additionally, revenues were favorably impacted by
the Company’s strategy to focus on a higher mix of value-added products from our
Advanced Components group and the effects of including ATC sales since its
acquisition in September 2007. The decrease in sales of Ceramic Components
reflects a decrease in the volume of unit sales, a higher mix of commodity
priced components and a moderate decrease in average selling prices reflective
of the downturn in the economy. The decrease in sales of Tantalum
Components is the result of lower sales unit volume due to a decrease in demand
for these components as customers reduced inventory levels in response to the
overall decline in economic conditions during the fiscal year or changed product
designs.
KDP and
KKC Resale sales were $354.3 million for the fiscal year ended March 31, 2009
compared to $468.2 million during the fiscal year ended March 31,
2008. When compared to fiscal 2008, the decrease during fiscal 2009
is primarily attributable to a decrease in unit sales volume in the Asian region
due to lower end user demand, particularly in the telecommunications market,
resulting from the uncertainty in global economic conditions.
Total
Connector sales, including AVX manufactured and KEC Resale Connectors, were $
167.3 million in the fiscal year ended March 31, 2009 compared to $ 192.9
million during the fiscal year ended March 31, 2008. This decrease was primarily
attributable to a decrease in the automotive and consumer products sectors as a
result of the adverse economy, particularly in the last half of the fiscal year.
This decrease was slightly offset by increases in sales volume related to
production demand for certain smart phone devices when compared to the prior
year.
Our sales
to independent electronic distributors represented 35.9% of total net sales for
the fiscal year ended March 31, 2009, compared to 41.0% for fiscal year ended
March 31, 2008. Our distributor customers have been limiting their intake of
inventory and maintaining lower inventory levels in this uncertain demand
environment. Our sales to distributor customers involve specific ship and debit
and stock rotation programs for which sales allowances are recorded as
reductions in sales. Such allowance charges were $38.5 million, or
7.2% of gross sales to distributor customers, for the fiscal year ended March
31, 2009 and $43.0 million, or 6.1% of gross sales to distributor customers, for
the fiscal year ended March 31, 2008. Applications under such programs for
fiscal years ended March 31, 2009 and 2008 were approximately $ 39.1 million and
$ 42.0 million, respectively.
-27-
Geographically,
compared to the fiscal year ended March 31, 2008, sales for the fiscal year
ended March 31, 2009 decreased 11.2% in Europe and 0.7% in the Americas.
Decreases in these regions were reflective of lower demand for product due to
the decline of the global market, partially offset by an increase in the sales
of Advanced Components products related to the addition of ATC in September of
2007. In addition, there was lower demand in Asia, where sales for the fiscal
year ended March 31, 2009 decreased 22.9% compared to the prior year driven by
declines in the consumer market. In addition, the movement of the U.S. dollar
against certain foreign currencies resulted in a favorable impact on sales for
the year ended March 31, 2009 of approximately $19.5 when compared to the prior
year.
Gross
profit in the fiscal year ended March 31, 2009 was 15.6% of sales or $ 216.3
million compared to a gross profit margin of 17.8% or $288.4 million in the
fiscal year ended March 31, 2008. This decrease is attributable to
several factors including the factors discussed above relating to lower sales
coupled with lower production volumes and the increased cost of raw materials
and utilities. We incurred restructuring charges of $15.1 million related to
headcount reductions and other charges including those related to facility
closures as we continue to realign production capabilities and reduce operating
costs. We recorded $2.4 million of restructuring costs during fiscal year 2008.
During the fiscal year ended March 31, 2009, lower end user demand and higher
costs were partially offset by our continued efforts to increase production
efficiency, lower operating costs and pursue increased capacity for the
production of value added products. In addition, there was a negative impact on
costs due to currency movement of the U.S. dollar against certain foreign
currencies resulting in an unfavorable impact of approximately $34.4 million
when compared to the prior year. Also, compared to the fiscal year ended March
31, 2008, depreciation and amortization expense in the fiscal year ended March
31, 2009 was $10.7 million higher primarily as a result of the acquisition of
ATC.
Selling,
general and administrative expenses for the fiscal year ended March 31, 2009
were $121.9 million, or 8.8% of net sales, compared to $126.8 million, or 7.8%
of net sales, for the fiscal year ended March 31, 2008. The decrease
in selling, general and administrative expenses was primarily due to lower sales
and savings as a result of headcount reductions and other cost control measures
starting in fiscal 2008 and continuing throughout fiscal 2009. During
the fiscal year ended March 31, 2009, we recorded $3.5 million of restructuring
charges primarily related to headcount reductions to reduce ongoing selling,
general and administrative expenses.
Research,
development and engineering expenditures, which encompass the personnel and
related expenses devoted to developing new and maintaining existing products,
processes and technical innovations, were approximately $35.5 million and $31.5
million in fiscal 2008 and 2009, respectively. Research and
development costs included therein decreased slightly in fiscal 2009 to $11.7
million compared to $12.5 million in fiscal 2008. Engineering
expenses decreased $3.2 million to $19.8 million in fiscal 2009 compared to
$23.0 million in fiscal 2008.
Profit
from operations for the fiscal year ended March 31, 2009 was $76.7 million
compared to $161.1 million for the fiscal year ended March 31, 2008. This
decrease is a result of the above factors, and the recognition of an $18.2
million environmental charge as an estimate of our potential liability related
to the performance of certain environmental remediation actions at an abandoned
facility in New Bedford, Massachusetts. See Note 12 to our consolidated
financial statements elsewhere herein for further discussion related to this
environmental charge. The overall decrease was partially offset by a gain of
$4.0 million related to the sale of corporate assets during the fiscal
year.
Other
income decreased $21.8 million to $20.4 million in fiscal 2009 compared to $42.2
million in fiscal 2008. This decrease is due to lower interest income resulting
from lower cash and securities investment balances and lower interest rates
during the fiscal year and $4.2 million of impairment charges related to the
decline in market value of certain available-for-sale securities. This decrease
was partially offset by net currency exchange gains during the fiscal
year.
The
effective tax rate for the fiscal year ended March 31, 2009 was 16.8% compared
to an effective tax rate of 26.5% for the fiscal year ended March 31, 2008. The
provision for income taxes in the fiscal year ended March 31, 2009 was favorably
impacted by $3.7 million of reinvestment allowances associated with operations
in Malaysia and by a reduction of $8.5 million of deferred tax liabilities
resulting from certain of our foreign branch losses taken as deductions for U.S.
income tax purposes no longer being subject to the U.S. income tax recapture
regulations. In March 2007, the Internal Revenue Service enacted a change in the
tax regulations that reduced the U.S. income tax recapture period from 15 to 5
years. As a result, the income tax provision was favorably impacted by $8.5
million and $8.1 million of recapture that expired during the fiscal years ended
March 31, 2009 and 2008, respectively. In addition, the effective tax
rate for the fiscal year ended March 31, 2009 benefited from higher income being
generated in certain lower tax rate jurisdictions when compared to the prior
year.
As a
result of the factors discussed above, net income for the fiscal year ended
March 31, 2009 was $80.8 million compared to $149.5 million for the fiscal year
ended March 31, 2008.
-28-
Financial
Condition
Liquidity
and Capital Resources
Our
liquidity needs arise primarily from working capital requirements, dividends,
capital expenditures and acquisitions. Historically, the Company has
satisfied its liquidity requirements through funds from operations and
investment income from cash and investments in securities. As of
March 31, 2010, we had a current ratio of 6.8 to 1, $913.8 million of cash, cash
equivalents and investments in securities, $1,801.0 million of stockholders'
equity and no debt.
Net cash
from operating activities was $200.5 million for the fiscal year ended March 31,
2010, compared to $65.0 million for the fiscal year ended March 31, 2009 and
$181.9 million for the fiscal year ended March 31, 2008. The increase
in fiscal 2010 is primarily the result of higher earnings and a reduction in net
working capital.
Purchases
of property and equipment were $28.9 million in fiscal 2010, $44.2 million in
fiscal 2009 and $70.9 million in fiscal 2008. Expenditures primarily related to
expanding the production capabilities of the passive component and connector
product lines, expanding production capacity in lower cost regions, as well as
the implementation of improved manufacturing processes. The decline in capital
spending compared to the prior year is reflective of the overall decline in
demand for electronic component products. We continue to make strategic capital
investments in our advanced and specialty passive component and connector
products and expect to incur capital expenditures of approximately $40 million
in fiscal 2011. The actual amount of capital expenditures will depend
upon the outlook for end market demand.
Our
funding is internally generated through operations and investment income from
cash and investments in securities. We have assessed the condition of the
current global credit market on our current business and believe that based on
the financial condition of the Company as of March 31, 2010, that cash on hand
and cash expected to be generated from operating activities and investment
income from cash and investments in securities will be sufficient to satisfy the
Company's anticipated financing needs for working capital, capital expenditures,
environmental clean-up costs, research, development and engineering expenses and
any dividend payments or stock repurchases to be made during the upcoming year.
While changes in customer demand have an impact on our future cash requirements,
changes in those requirements are mitigated by our ability to adjust
manufacturing capabilities to meet increases or decreases in customer
demand. Additionally, we do not anticipate any significant changes in
our ability to generate or meet our liquidity needs in the
long-term.
In fiscal
2008, 2009 and 2010, dividends of $27.5 million, $27.3 million and $27.2
million, respectively, were paid to stockholders.
On
October 19, 2005, the Board of Directors of the Company authorized the
repurchase of 5,000,000 shares of our common stock. On October 17, 2007, the
Board of Directors of the Company authorized the repurchase of an additional
5,000,000 shares of our common stock. As of March 31, 2010, there
were 7,562,659 shares that may yet be repurchased under this
program.
We
purchased 1,179,100 shares at a cost of $17.1 million during fiscal 2008,
1,123,672 shares at a cost of $11.4 million during fiscal 2009 and 321,969
shares at a cost of $3.7 million during fiscal 2010. The repurchased
shares are held as treasury stock and are available for general corporate
purposes.
At March
31, 2010, we had contractual obligations for the acquisition or construction of
plant and equipment aggregating approximately $5.6 million.
We make
contributions to our U.S. and international defined benefit plans as required
under various pension funding regulations. We made contributions of
$7.8 million to our defined benefit plans during the year ended March 31, 2010
and estimate that we will make contributions of approximately $8.4 million
during the fiscal year ending March 31, 2011. We have unfunded
actuarially computed pension liabilities of approximately $32.5 million related
to these defined benefit pension plans as of March 31, 2010.
-29-
We are a
lessee under long-term operating leases primarily for office space, plant and
equipment. Future minimum lease commitments under non-cancelable operating
leases as of March 31, 2010, were approximately $19.8 million.
From time
to time we enter into delivery contracts with selected suppliers for certain
metals used in our production processes. The delivery contracts
represent routine purchase orders for delivery within three months and payment
is due upon receipt.
We are
involved in disputes, warranty and legal proceedings arising in the normal
course of business. While we cannot predict the outcome of these proceedings, we
believe, based upon a review with legal counsel, that none of these proceedings
will have a material impact on our financial position, results of operations, or
cash flows. However, we cannot be certain if the eventual outcome and any
adverse result in these or other matters that may arise from time to time may
harm our financial position, results of operations, or cash flows.
On June
2, 2006, we received a “Confirmation of Potential Liability; Demand and Notice
of Decision Not to Use Special Notice Procedures” dated May 31, 2006 from the
EPA with regard to $1.6 million (subsequently modified to $0.9 million) of past
costs, as well as future costs for environmental remediation, related to the
purported release of hazardous substances at an abandoned facility referred to
as the “Aerovox Facility” (the “Facility”), located at 740 Belleville Avenue,
New Bedford, Massachusetts. Aerovox Corporation, a predecessor of AVX, sold this
Facility to an unrelated third party in 1973. A subsequent unrelated owner,
Aerovox Inc., the last manufacturer to own and operate in the Facility, filed
for bankruptcy in 2001 and abandoned the Facility. We have had
numerous meetings with the EPA, the Massachusetts Department of Environmental
Protection and the City of New Bedford regarding the potential environmental
remediation of the Facility and the assignment of responsibility among the
parties. Tentative agreements between EPA, the Commonwealth of
Massachusetts, the City of New Bedford, and AVX are now in place setting forth
the nature of the remedy, the allocation of financial responsibility, and the
schedule for remediation. Based on our own estimate of remediation costs, we
have accrued $18.2 million in the quarter ended March 31, 2009 (which amount is
included in the $19.7 million reserved as of March 31, 2010 for potential CERCLA
liability as discussed below) as an estimate of our potential liability related
to performance of certain environmental remediation actions at the
Facility. This accrual assumes the anticipated performance of certain
remedial actions by the other parties. Our accrual represents the estimate of
our costs to remediate; however, until all public comment periods have expired
and EPA has reviewed such comments, the agreements are finalized, and the
remediation is complete, we can not be certain there will be no additional
costs.
We have
been named as a potentially responsible party in state and federal
administrative proceedings seeking contribution for costs associated with the
correction and remediation of environmental conditions at various waste disposal
and operating sites. In addition, we operate on sites that may have
potential future environmental issues as a result of activities at sites during
AVX’s long history of manufacturing operations or prior to the start of
operations by AVX. Even though we may have rights of indemnity for
such environmental matters at certain sites, regulatory agencies in those
jurisdictions may require us to address such issues. Once it becomes
probable that we will incur costs in connection with remediation of a site and
such costs can be reasonably estimated, we establish reserves or adjust our
reserves for our projected share of these costs. A separate account
receivable is recorded for any indemnified costs. Our environmental reserves are
not discounted and do reflect any possible future insurance recoveries, which
are not expected to be significant, but do reflect a reasonable estimate of cost
sharing at multiple party sites or indemnification or our liability by a third
party.
We
currently have environmental reserves for current remediation, compliance and
legal costs totaling $19.7 million at March 31, 2010.
-30-
Disclosures
about Contractual Obligations and Commitments
The
Company has the following contractual obligations and commitments as of March
31, 2010 as noted below.
|
FY
2012 -
|
FY
2014 -
|
|||||||||||||||||||
|
Contractual
Obligations (in thousands)
|
Total
|
FY
2011
|
FY
2013
|
FY
2015
|
Thereafter
|
|||||||||||||||
|
Operating
Leases
|
$ | 19,764 | $ | 6,555 | $ | 7,980 | $ | 3,574 | $ | 1,655 | ||||||||||
|
Plant
and Equipment
|
$ | 5,608 | $ | 3,094 | $ | 2,514 | $ | - | $ | - | ||||||||||
As
discussed in Note 9 to our consolidated financial statements elsewhere herein,
the amount of unrecognized tax benefits recorded in the Company’s balance sheet
at March 31, 2010 was $12.6 million. The Company is unable to reasonably
estimate in which future periods these amounts will be ultimately
settled.
During
the fiscal year ended March 31, 2010, we made contributions of $5.8 million to
Company sponsored retirement savings plans. Our contributions are
partially based on employee contributions as a percentage of their
salaries. Certain contributions by the Company are discretionary and
are determined by the Board of Directors each year. We expect that
our contributions for the year ending March 31, 2011 will be approximately the
same as in fiscal 2010.
During
the fiscal year ended March 31, 2010, we made contributions of $1.9 million to
our U.S. defined benefit plans and $5.9 million to our international defined
benefit plans. These contributions are based on a percentage of
pensionable wages or to satisfy funding requirements. We expect that
our contributions for the fiscal year ending March 31, 2011 will be
approximately $1.1 million for our U.S. defined benefit plans and $7.3 million
for our international defined benefit plans.
From time
to time we enter into delivery contracts with selected suppliers for certain
metals used in our production processes. The delivery contracts
represent routine purchase orders for delivery within three months and payment
is due upon receipt. As of March 31, 2010, we had no significant
outstanding purchase commitments.
Critical
Accounting Policies and Estimates
"Management's
Discussion and Analysis of Financial Condition and Results of Operations" is
based upon our consolidated financial statements and the notes thereto, which
have been prepared in accordance with generally accepted accounting principles
in the United States. The preparation of these financial statements
requires management to make estimates, judgments and assumptions that affect the
reported amounts of assets and liabilities and the disclosure of contingent
assets and liabilities at the date of the financial statements and the reported
amounts of revenues and expenses during the reported periods. On an
ongoing basis, management evaluates its estimates and judgments, including those
related to revenue recognition, warranties, inventories, pensions, income taxes
and contingencies. Management bases its estimates, judgments and
assumptions on historical experience and on various other factors that are
believed to be reasonable under the circumstances, the results of which form the
basis for making judgments about the carrying values of assets and liabilities
that are not readily apparent from other sources. While our estimates
and assumptions are based on our knowledge of current events and actions we may
undertake in the future, there can be no assurance that actual results will not
differ from these estimates and assumptions. On an ongoing basis, we
evaluate our accounting policies and disclosure practices. In
management's opinion, the critical accounting policies and estimates, as defined
below, are more complex in nature and require a higher degree of judgment than
the remainder of our accounting policies described in Note 1 to our consolidated
financial statements elsewhere herein.
-31-
Revenue
Recognition
All of
our products are built to specification and tested by us for adherence to such
specification before shipment to customers. We ship products to
customers based upon firm orders. Shipping and handling costs are
included in cost of sales. We recognize revenue when the sales
process is complete. This occurs when products are shipped to the
customer in accordance with the terms of an agreement of sale, there is a fixed
or determinable selling price, title and risk of loss have been transferred and
collectability is reasonably assured. Estimates used in determining
sales allowance programs described below are subject to the volatilities of the
market place. This includes, but is not limited to, changes in
economic conditions, pricing changes, product demand, inventory levels in the
supply chain, the effects of technological change, and other variables that
might result in changes to our estimates. Accordingly, there can be
no assurance that actual results will not differ from those
estimates.
Returns
Sales
revenue and cost of sales reported in the income statement are reduced to
reflect estimated returns. We record an estimated sales allowance for
returns at the time of sale based on using historical trends, current pricing
and volume information, other market specific information and input from sales,
marketing and other key management. The amount accrued reflects the
return of value of the customer’s inventory. These procedures require
the exercise of significant judgments. We believe that these
procedures enable us to make reliable estimates of future
returns. Our actual results approximate our
estimates. When the product is returned and verified, the customer is
given credit against their accounts receivable.
Distribution
Programs
A portion
of our sales are to independent electronic component distributors which are
subject to various distributor sales programs. We report provisions
for distributor allowances in connection with such sales programs as a reduction
in revenue and report distributor allowances in the balance sheet as a reduction
in accounts receivable. For the distribution programs described below, we do not
track the individual units that we record against specific products sold from
distributor inventories, which would allow us to directly compare revenue
reduction for credits recorded during any period with credits ultimately awarded
in respect of products sold during that period. Nevertheless, we believe that we
have an adequate basis to assess the reasonableness and reliability of our
estimates for each program.
Distributor
Stock Rotation Program
Stock
rotation is a program whereby distributors are allowed to return for credit
qualified inventory, semi-annually, equal to a certain percentage, primarily
limited to 5% of the previous six months net sales. We record an
estimated sales allowance for stock rotation at the time of sale based on a
percentage of distributor sales using historical trends, current pricing and
volume information, other market specific information and input from sales,
marketing and other key management. These procedures require the
exercise of significant judgment. We believe that these procedures
enable us to make reliable estimates of future returns under the stock rotation
program. Our actual results approximate our
estimates. When the product is returned and verified, the distributor
is given credit against their accounts receivable.
Distributor
Ship-from-Stock and Debit Program
Ship-from-Stock
and Debit ("ship and debit") is a program designed to assist distributor
customers in meeting competitive prices in the marketplace on sales to their end
customers. Ship and debit programs require a request from the
distributor for a pricing adjustment for a specific part for a sale to the
distributor’s end customer from the distributor’s stock. Ship and
debit authorizations may cover current and future distributor activity for a
specific part for sale to their customer. At the time we record sales
to the distributors, we provide an allowance for the estimated future
distributor activity related to such sales since it is probable that such sales
to distributors will result in ship and debit activity. We record an
estimated sales allowance based on sales during the period, credits issued to
distributors, distributor inventory levels, historical trends, market
conditions, pricing trends we see in our direct sales activity with original
equipment manufacturers and other customers, and input from sales, marketing and
other key management. These procedures require the exercise of
significant judgment. We believe that these procedures enable us to
make reliable estimates of future credits under the ship and debit
program. Our actual results approximate our estimates. At
the time the distributor ships the part from stock, the distributor debits us
for the authorized pricing adjustment.
-32-
Special
Incentive Programs
We may
offer special incentive discounts based on amount of product ordered or
shipped. At the time we record sales under these agreements, we
provide an allowance for the discounts on the sales for which the customer is
eligible to take. The customer then debits us for the authorized discount
amount.
Warranty
All of
our products are built to specifications and tested by us for adherence to such
specifications before shipment to customers. We warrant that our
products will meet such specifications. We accrue for product
warranties when it is probable that customers will make claims under warranties
relating to products that have been sold and a reasonable estimate of costs can
be made. The amount accrued represents the direct costs of
replacement and other potential costs resulting from product not meeting
specifications above and beyond the return value of the customer’s affected
product purchases. Historically valid warranty claims, which are a
result of products not meeting specifications, have been immaterial to our
results of operations. However, there is no guarantee that warranty
claims in the future will not increase, or be material to results of operations,
as a result of manufacturing defects, end market product application failures or
end user recall or damage claims.
Inventories
We
determine the cost of raw materials, work in process and finished goods
inventories by the first-in, first-out ("FIFO") method. Inventory
costs include material, labor and manufacturing overhead. Inventories
are valued at the lower of cost or market (realizable value). We
value inventory at its market value where there is evidence that the utility of
goods will be less than cost and that such write-down should occur in the
current period. Accordingly, at the end of each period, we evaluate
our inventory and adjust to net realizable value the carrying value and excess
quantities. We review and adjust the carrying value of our
inventories based on historical usage, customer forecasts received from the
marketing and sales personnel, customer backlog, certain date code restrictions,
technology changes, demand increases and decreases, market directional shifts,
and obsolescence and aging.
Income
Taxes
As part
of the process of preparing our consolidated financial statements, we are
required to estimate our tax assets and liabilities in each of the jurisdictions
in which we operate. This process involves management estimating the
actual current tax exposure together with assessing temporary differences
resulting from different treatment of items for tax and accounting
purposes. These differences result in deferred tax assets and
liabilities that are included within our consolidated balance
sheets. We assess the likelihood that our deferred tax assets will be
recoverable as a result of future taxable income and, to the extent we believe
that recovery is not likely, we establish a valuation allowance.
We have
recorded valuation allowances due to uncertainties related to our ability to
realize some of our deferred tax assets, primarily consisting of certain net
operating losses carried forward before they expire. The valuation
allowance is based on our estimates of future taxable income over the periods
that our deferred tax assets will be recoverable.
We also
record a provision for certain international, federal and state tax
contingencies based on the likelihood of obligation, when needed. In
the normal course of business, we are subject to challenges from U.S. and
non-U.S. tax authorities regarding the amount of taxes due. These
challenges may result in adjustments of the timing or amount of taxable income
or deductions or the allocation of income among tax
jurisdictions. Further, during the ordinary course of business, other
changing facts and circumstances may impact our ability to utilize tax benefits
as well as the estimated taxes to be paid in future periods. We
believe that any potential tax exposures have been sufficiently provided for in
the consolidated financial statements. In the event that actual
results differ from these estimates, we may need to adjust tax accounts and
related payments, which could materially impact our financial condition and
results of operations.
We
account for uncertainty in income taxes recognized in our financial
statements. We recognize in our financial statements, the impact of a
tax position, if that position is “more likely than not” of being sustained on
audit, based on the technical merits of the position. Accruals for
estimated interest and penalties are recorded as a component of interest
expense.
We record
deferred tax liabilities for temporary differences associated with deductions
for foreign branch losses claimed by the Company in our U.S. income tax returns,
as these deductions are subject to recapture provisions in the U.S. income tax
code. When the recapture period expires for these deductions, the tax
benefit is recognized in the income tax provision.
-33-
Pension
Assumptions
Pension
benefit obligations and the related effects on operations are calculated using
actuarial models. Two critical assumptions, discount rate and
expected rate of return on plan assets, are important elements of plan expense
and/or liability measurement. We evaluate these assumptions at least
annually. The discount rate enables us to state expected future cash
flows at a present value on the measurement date. To determine the
discount rate, we apply the expected cash flows from each individual pension
plan to specific yield curves at the plan’s measurement date and determine a
level equivalent yield that may be unique to each plan. A lower
discount rate increases the present value of benefit obligations and increases
pension expense. To determine the expected long-term rate of return
on pension plan assets, we consider the current and expected asset allocations,
as well as historical and expected returns on various categories of plan
assets. Other assumptions involve demographic factors such as
retirement, mortality and turnover. These assumptions are evaluated
periodically and are updated to reflect our experience. Actual
results in any given year will often differ from actuarial assumptions because
of economic and other factors. In such cases, the differences between
actual results and actuarial assumptions are amortized over future
periods.
Environmental
Matters
We are
subject to federal, state and local laws and regulations concerning the
environment in the United States and to the environmental laws and regulations
of the other countries in which we operate. Based on our periodic
review of the operating policies and practices at all of our facilities, we
believe that our operations are currently in substantial compliance, in all
material respects, with all applicable environmental laws and
regulations. Regarding sites identified by the EPA at which
remediation is required, our ultimate liability in connection with environmental
claims will depend on many factors, including our volumetric share of
non-environmentally safe waste, the total cost of remediation and the financial
viability of other companies having liability. Additionally, we
operate on sites that may have potential future environmental issues as a result
of activities at sites during the long history of manufacturing operations by
AVX or its corporate predecessor or prior to the start of operations by
AVX. Even though we may have rights of indemnity for such
environmental matters at certain sites, regulatory agencies in those
jurisdictions may require us to address such issues. Once it becomes
probable that we will incur costs in connection with remediation of a site and
such costs can be reasonably estimated, we establish reserves or adjust our
reserves for our projected share of these costs. Our environmental
reserves are not discounted and do not reflect any possible future insurance
recoveries, which are not expected to be significant, but do reflect a
reasonable estimate of cost sharing at multiple party sites or indemnification
of our liability by a third party.
Recent
Accounting Pronouncements
In April
2008, new guidance was issued related to the determination of the useful lives
of intangible assets, which amends the factors that should be considered in
developing renewal or extension assumptions used to determine the useful life of
an intangible asset is effective for financial statements issued for fiscal
years beginning after December 15, 2008 and interim periods within those
years. The adoption of this guidance did not affect the consolidated financial
position, results of operations or cash flows of the Company.
In
December 2008, new guidance was issued related to employers’ disclosures about
postretirement benefit plan assets requires that information about plan assets
be disclosed, on an annual basis, based on fair value disclosure requirements.
The Company was required to separate plan assets into the three fair value
hierarchy levels and provide a roll forward of the changes in fair value of plan
assets classified as Level 3. The requirements related to the disclosures about
plan assets were effective for fiscal years ending after December 15, 2009.
Since the requirements are only additional disclosures concerning plan assets,
the adoption of this guidance did not affect the consolidated financial
position, results of operations or cash flows of the Company.
-34-
In April
2009, new guidance issued was intended to provide application guidance and
revise the disclosures regarding fair value measurements and impairments of
securities. The requirements are summarized as follows:
|
·
|
Determining Fair Value
When the Volume and Level of Activity for the Asset or Liability Have
Significantly Decreased and Identifying Transactions That Are Not
Orderly. This addresses the determination of fair values when there
is no active market or where the price inputs represent distressed sales.
It also reaffirms the view in previous guidance that the objective of fair
value measurement is to reflect an asset’s sale price in an orderly
transaction at the date of the financial
statements.
|
|
·
|
Interim Disclosures
about Fair Value of Financial Instruments. This enhances
consistency in financial reporting by increasing the frequency of fair
value disclosures to a quarterly instead of annual basis for any financial
instruments that are not currently reflected on the balance sheet at fair
value.
|
|
·
|
Recognition and
Presentation of Other-Than-Temporary Impairments. This amends the
other-than-temporary impairment guidance for debt securities and
presentation and disclosure requirements of other-than-temporary
impairments of debt and equity
securities.
|
This
guidance is effective for fiscal years and interim reporting periods ending
after June 15, 2009. The adoption of this guidance did not have a material
impact on the consolidated financial position, results of operations or cash
flows of the Company.
In June
2009, new guidance was issued that requires companies to recognize in the
financial statements the effects of subsequent events that provide additional
evidence about conditions that existed at the date of the balance sheet,
including the estimates inherent in the process of preparing financial
statements. An entity shall disclose the date through which subsequent events
have been evaluated, as well as whether that date is the date the financial
statements were issued. Companies are not permitted to recognize subsequent
events that provide evidence about conditions that did not exist at the date of
the balance sheet but arose after the balance sheet date and before financial
statements are issued. Some non-recognized subsequent events must be disclosed
to keep the financial statements from being misleading. For such events a
company must disclose the nature of the event, an estimate of its financial
effect, or a statement that such an estimate cannot be made. This guidance
applies prospectively for interim or annual financial periods ending after
June 15, 2009. The adoption of this guidance did not affect the
consolidated financial position, results of operations or cash flows of the
Company.
In June
2009, new guidance was issued that established the “Financial Accounting
Standards Board Accounting Standards Codification” (“Codification”) as the
single source of authoritative nongovernmental U.S. GAAP which was launched on
July 1, 2009. The Codification does not change current U.S. GAAP, but is
intended to simplify user access to all authoritative U.S. GAAP by providing all
the authoritative literature related to a particular topic in one place. All
existing accounting standard documents will be superseded and all other
accounting literature not included in the Codification will be considered
non-authoritative. Rules and interpretive releases of the Securities and
Exchange Commission (SEC) under authority of federal securities laws are also
sources of authoritative GAAP for SEC registrants. The Codification is effective
for interim and annual periods ending after September 15, 2009 and did not have
an impact on the Company’s financial condition, results of operations or cash
flows.
Relationship
with Kyocera and Related Transactions
Kyocera
is the majority stockholder of AVX. As of May 3, 2010, Kyocera owned
beneficially and of record 121,800,000 shares of common stock, representing
approximately 72% of our outstanding shares.
From
January 1990 through August 15, 1995, AVX was wholly owned by
Kyocera. On August 15, 1995, Kyocera sold 22.9%, or 39,300,000 shares
of AVX's common stock, and AVX sold an additional 4,400,000 shares of common
stock, in a public offering. In February 2000, Kyocera sold an
additional 10,500,000 shares of its AVX common stock.
Our
business includes transactions with Kyocera. Such transactions involve the
purchase of resale inventories, raw materials, supplies, and equipment, the sale
of products for resale, raw materials, supplies and equipment, the payment of
dividends, subcontracting activities and commissions. See Note 14 to
our consolidated financial statements elsewhere herein for more information on
the related party transactions.
-35-
One
principal strategic advantage for AVX is its ability to produce a broad product
offering to its customers. The inclusion of products manufactured by
Kyocera in that product offering is a significant component of this
advantage. In addition, the exchange of information with Kyocera
relating to the development and manufacture of multi-layer ceramic capacitors
and various other ceramic products benefits AVX. An adverse change in
our relationship with Kyocera could have a negative impact on our results of
operations. AVX and Kyocera have executed several agreements which
govern the foregoing transactions and which are described below.
The
Special Advisory Committee of our Board, comprised of our independent directors
(currently Messrs. Stach, DeCenzo, and Christiansen), reviews and approves any
significant agreements between AVX and Kyocera and any significant transactions
between AVX and Kyocera not covered by such agreements. The committee is also
responsible for reviewing and approving any agreements and transactions between
AVX and any other related party that are or may be within the scope of
applicable rules, regulations and guidance of the New York Stock Exchange and
Item 404 of Regulation S-K, if they arise. The Special Advisory Committee
operates under a written charter which sets forth the policies and procedures
for such approvals. In approving any such agreement or transaction pursuant to
those procedures, the Special Advisory Committee must determine that, in its
judgment, the terms thereof are equivalent to those to which an independent
unrelated party would agree at arm’s-length or are otherwise in the best
interests of the Company and its stockholders generally. Each of the
agreements described below contains provisions requiring that the terms of any
transaction under such agreement be equivalent to those to which an independent
unrelated party would agree at arm's-length.
Products Supply and Distribution
Agreement. Pursuant to the Products Supply and Distribution
Agreement (the "Distribution Agreement") (i) AVX will act as the non-exclusive
distributor of certain Kyocera-manufactured products to certain customers in
certain territories outside of Japan and (ii) Kyocera will act as the
non-exclusive distributor of certain AVX-manufactured products within
Japan. The Distribution Agreement has a term of one year, with
automatic one-year renewals, subject to the right of termination by either party
at the end of the then current term upon at least three months prior written
notice.
Disclosure and Option to License
Agreement. Pursuant to the Disclosure and Option to License
Agreement (the "License Agreement"), AVX and Kyocera exchange confidential
information relating to the development and manufacture of multi-layered ceramic
capacitors and various other ceramic products, as well as the license of
technologies in certain circumstances. The License Agreement has a
term of one year with automatic one-year renewals, subject to the right of
termination by either party at the end of the then current term upon at least
six months prior written notice.
Materials Supply
Agreement. Pursuant to the Materials Supply Agreement (the
"Supply Agreement"), AVX and Kyocera will from time to time supply the other
party with certain raw and semi-processed materials used in the manufacture of
capacitors and other electronic components. The Supply Agreement has
a term of one year, with automatic one-year renewals, subject to the right of
termination by either party at the end of the then current term upon at least
six months prior written notice.
Machinery and Equipment Purchase
Agreement. Pursuant to the Machinery and Equipment Purchase
Agreement (the "Machinery Purchase Agreement"), AVX and Kyocera will, from time
to time, design and manufacture for the other party certain equipment and
machinery of a proprietary and confidential nature used in the manufacture of
capacitors and other electronic components. The Machinery Purchase
Agreement has a term of one year, with automatic one-year renewals, subject to
the right of termination by either party at the end of the then current term
upon at least six months prior written notice.
|
Item 7A.
|
Quantitative
and Qualitative Disclosures About Market
Risk
|
Foreign
Currency
We are
exposed to foreign currency exchange risk with respect to our sales, profits and
assets and liabilities denominated in currencies other than the U.S. dollar.
Although we use financial instruments to hedge certain foreign currency risks,
we are not fully protected against foreign currency fluctuations and our
reported results of operations could be affected by changes in foreign currency
exchange rates. International revenues and expenses transacted by our foreign
subsidiaries may be denominated in local currency. See Note 13 to the
consolidated financial statements elsewhere herein for further discussion of
derivative financial instruments.
-36-
For
fiscal 2010, our exposure to foreign currency exchange risk was estimated using
a sensitivity analysis, which illustrates a hypothetical change in the average
foreign currency exchange rates used during the year. Actual changes in foreign
currency exchange rates may differ from this hypothetical change. Based on a
hypothetical increase or decrease of 10% in the exchange rates, assuming no
hedging against foreign currency rate changes, we would have incurred a foreign
currency gain or loss of approximately $17.1 million in fiscal
2010.
Materials
We are at
risk to fluctuations in prices for commodities used to manufacture our products,
primarily tantalum, palladium, platinum, silver, nickel, gold and copper. Prices
for many of these metals have fluctuated significantly during the past
year.
Tantalum
powder and wire are principal materials used in the manufacture of tantalum
capacitor products. These materials may be purchased under contracts
with suppliers from various parts of the world at prices that are subject to
periodic adjustment and variations in the market. The tantalum
required to manufacture our products has generally been available in sufficient
quantity. The limited number of tantalum material suppliers has led
to higher prices during periods of increased demand.
|
Item 8.
|
Financial
Statements and Supplementary Data
|
The
following consolidated financial statements of the Company and its subsidiaries,
together with the Report of Independent Registered Public Accounting Firm
thereon, are presented beginning on page 43 of this report:
|
Page
|
|
|
43
|
|
|
44
|
|
|
45
|
|
|
46
|
|
|
47
|
|
|
77
|
All
financial statement schedules are omitted because of the absence of the
conditions under which they are required or because the information required is
shown in the consolidated financial statements or notes thereto.
|
Item 9.
|
Changes
in and Disagreements with Accountants on Accounting and Financial
Disclosure
|
|
|
None.
|
||
|
Item 9A.
|
Controls
and Procedures
|
|
Disclosure
Controls and Procedures
The
Company maintains disclosure controls and procedures (as defined in
Rule 13a-15(e) and 15d-15(e) under the Securities Exchange Act of 1934, as
amended (“the Exchange Act”)), that are designed to ensure that information
required to be disclosed in the Company’s reports under the Exchange Act is
recorded, processed, summarized and reported within the time periods specified
in the SEC’s rules and forms, and that such information is accumulated and
communicated to management, including the Company’s Chief Executive Officer
(“CEO”) and Chief Financial Officer (“CFO”), as appropriate, to allow timely
decisions regarding required disclosure.
In
connection with the preparation of this Annual Report on Form 10-K, as of
March 31, 2010, an evaluation was performed under the supervision and with
the participation of the Company’s management, including the CEO and CFO, of the
effectiveness of the Company’s disclosure controls and
procedures. Based on the evaluation, the Company’s CEO and CFO
concluded that the Company’s disclosure controls and procedures were effective
as of March 31, 2010 to ensure that information required to be disclosed by the
Company in the reports that it files or submits under the Exchange Act is
recorded, processed, summarized and reported, within the time periods specified
in the SEC’s rules and forms and is accumulated and communicated to the
Company’s management, including the CEO and CFO, or persons performing similar
functions, as appropriate to allow timely decisions regarding required
disclosures.
-37-
Management’s
Report on Internal Control over Financial Reporting
The
management of the Company is responsible for establishing and maintaining
adequate internal control over financial reporting. Internal control
over financial reporting is defined in Rules 13a-15(f) and 15d-15(f)
promulgated under the Exchange Act as a process designed by, or under the
supervision of, the Company’s principal executive and principal financial
officers and effected by the Company’s Board of Directors, management and other
personnel, to provide reasonable assurance regarding the reliability of
financial reporting and the preparation of financial statements for external
purposes in accordance with generally accepted accounting principles and
includes those policies and procedures that (i) pertain to the maintenance of
records that in reasonable detail accurately and fairly reflect the transactions
and dispositions of the assets of the Company; (ii) provide
reasonable assurance that transactions are recorded as necessary to permit
preparation of financial statements in accordance with generally accepted
accounting principles, and that receipts and expenditures of the Company are
being made only in accordance with authorizations of management and directors of
the Company; and (iii) provide reasonable assurance regarding
prevention or timely detection of unauthorized acquisition, use or disposition
of the Company’s assets that could have a material effect on the financial
statements.
Because
of its inherent limitations, internal control over financial reporting may not
prevent or detect misstatements. Also, projections of any evaluation
of effectiveness to future periods are subject to the risk that controls may
become inadequate because of changes in conditions, or that the degree of
compliance with the policies or procedures may deteriorate.
The
Company’s management assessed the effectiveness of the Company’s internal
control over financial reporting as of March 31, 2010. In making its
assessment, the Company’s management used the criteria set forth by the
Committee of Sponsoring Organizations of the Treadway Commission in Internal Control-Integrated
Framework. Based on the results of this assessment,
management, including the CEO and CFO, has concluded that the Company’s internal
control over financial reporting was effective as of the end of its fiscal year
ended March 31, 2010.
PricewaterhouseCoopers
LLP, our independent registered public accounting firm, has issued an
attestation report on the Company’s internal control over financial reporting as
of March 31, 2010, as stated in their report which appears in this Form
10-K.
Changes
in Internal Control over Financial Reporting
There
were no changes in our internal control over financial reporting that occurred
during our most recently completed fiscal quarter that have materially affected,
or are reasonably likely to materially affect, our internal control over
financial reporting.
|
Item 9B.
|
Other
Information
|
None.
PART
III
|
Item 10.
|
Directors,
Executive Officers and Corporate
Governance
|
Information
required by this item with respect to our directors, the committees of the Board
of Directors, corporate governance and compliance by our directors, executive
officers and certain beneficial owners of our common stock with Section 16(a) of
the Exchange Act is provided by incorporation by reference to information under
the captions entitled "Proposal I Election of Directors", "Board of Directors –
Governance", "Board of Directors – Meetings Held and Committees" and "Section
16(a) Beneficial Ownership Reporting Compliance" in the Company's definitive
proxy statement for the 2010 Annual Meeting of Stockholders (the "Proxy
Statement") and perhaps elsewhere therein. Information required by
this item relating to our executive officers also appears in Item 1 of Part I of
this Form 10-K under the caption "Executive Officers of the
Registrant".
-38-
Code
of Business Conduct and Ethics
As
discussed above in “Company Information and Website” in Item 1 of Part I of this
Annual Report on Form 10-K, our Code of Business Conduct and Ethics and the Code
of Business Conduct and Ethic Supplement Applicable to the Chief Executive
Officer, Chief Financial Officer, Controllers and Financial Managers have been
posted on our website. We will post on our website any amendments to, or waivers
from, a provision of the Code of Business Conduct and Ethics or the Supplement
Applicable to the Chief Executive Officer, Chief Financial Officer, Controllers
and Financial Managers that applies to our principal executive officer,
principal financial officer, principal accounting officer or controller or
persons performing similar functions, and that relates to any of the following:
(i) honest and ethical conduct, including the ethical handling of actual or
apparent conflicts of interest between personal and professional relationships;
(ii) full, fair, accurate, timely, and understandable disclosure in reports and
documents that we file with, or submit to, the SEC and in other public
communications made by us; (iii) compliance with applicable governmental laws,
rules and regulations; (iv) the prompt internal reporting of violations of the
code to an appropriate person or persons identified in the code; or (v)
accountability for adherence to the code.
|
Item 11.
|
Executive
Compensation
|
The
information required by this item is provided by incorporation by reference to
information under the captions entitled “Director Compensation”,
“Compensation Committee Interlocks and Insider Participation”, “Compensation
Committee and Equity Compensation Committee Report”, “Compensation Discussion
and Analysis”, and “Executive Compensation” in the Proxy Statement and perhaps
elsewhere therein.
|
Item 12.
|
Security
Ownership of Certain Beneficial Owners and Management and Related
Stockholder Matters
|
The
information required by this item is provided by incorporation by reference to
information under the captions entitled "Ownership of Securities by Directors,
Director Nominees and Executive Officers", "Security Ownership of Certain
Beneficial Owners" and "Equity Compensation Plan Information" in the Proxy
Statement and perhaps elsewhere therein.
|
Item 13.
|
Certain
Relationships and Related Transactions, and Director
Independence
|
The
information required by this item is provided by incorporation by reference to
information under the caption "Relationship with Kyocera and Related Party
Transactions" and “Board of Directors – Governance” in the Proxy Statement and
perhaps elsewhere therein.
|
Item 14.
|
Principal
Accounting Fees and Services
|
The
information required by this item is provided by incorporation by reference to
information under the caption entitled "Report of the Audit Committee –
Principal Independent Registered Public Accounting Firm Fees" in the Proxy
Statement and perhaps elsewhere therein.
-39-
PART
IV
|
Item 15.
|
Exhibits
and Financial Statement Schedules
|
|
(a)
|
Financial
Statements and Financial Statement Schedules - See Index to Consolidated
Financial Statements at Item 8 of this report.
|
|
|
(b)
|
Exhibits:
|
|
|
As
indicated below, certain of the exhibits to this report are hereby
incorporated by reference from other documents on file with the Securities
and Exchange Commission with which they are filed.
|
||
|
3.1
|
Restated
Certificate of Incorporation (incorporated by reference to Exhibit 3.1 to
Registration Statement on Form S-1 (File No. 33-94310) of the Company (the
"Form S-1")).
|
|
|
3.2
|
By-laws
of AVX Corporation as Amended and Restated March 30, 2009 (incorporated by
reference to Exhibit 3.2 of the Current Report on Form 8-K filed with the
Securities and Exchange Commission on March 31, 2009).
|
|
|
*10.1
|
Amended
AVX Corporation 1995 Stock Option Plan as amended through October 24, 2000
(incorporated by reference to Exhibit 10.11 to the Quarterly Report on
Form 10-Q of the Company for the quarter ended December 31,
2000).
|
|
|
*10.2
|
Amended
Non-Employee Directors' Stock Option Plan as amended through February 4,
2003 (incorporated by reference to Exhibit 10.1 to the Quarterly Report on
Form 10-Q of the Company for the quarter ended December 31,
2002).
|
|
|
10.3
|
Products
Supply and Distribution Agreement by and between Kyocera Corporation and
AVX Corporation (incorporated by reference to Exhibit 10.4 to the Annual
Report on Form 10-K of the Company for the year ended March 31,
2000).
|
|
|
*10.4
|
AVX
Nonqualified Supplemental Retirement Plan Amended and Restated effective
January 1, 2008 (the AVX Corporation SERP was merged into this plan
effective January 1, 2005).
|
|
|
*10.5
|
Deferred
Compensation Plan for Eligible Board Members (incorporated by reference to
Exhibit 10.2 to the Quarterly Report on Form 10-Q of the Company for the
quarter ended December 31, 2002).
|
|
|
*10.6
|
Employment
Agreement between AVX Corporation and John S. Gilbertson dated December
19, 2008 (incorporated by reference to Exhibit 10.10 to the Quarterly
Report on Form 10-Q of the Company for the quarter ended December 31,
2008).
|
|
|
*10.7
|
AVX
Corporation 2004 Stock Option Plan as amended through July 23, 2008
(incorporated by reference to Exhibit 10.11 to the Annual Report on Form
10-K of the Company for the year ended March 31, 2004).
|
|
|
*10.8
|
AVX
Corporation 2004 Non-Employee Directors' Stock Option Plan as amended
through July 28, 2008 (incorporated by reference to Exhibit 10.12 to the
Annual Report on Form 10-K of the Company for the year ended March 31,
2004).
|
|
|
*10.9
|
Form
of Notice of Grant of Stock Options and Option Agreement for awards
pursuant to AVX Corporation 2004 Stock Option Plan and AVX Corporation
2004 Non-Employee Directors’ Stock Option Plan (incorporated by reference
to Exhibit 10.1 to the Quarterly Report on Form 10-Q of the Company for
the quarterly period ended June 30, 2005).
|
|
|
*10.10
|
AVX
Corporation Management Incentive Plan (incorporated by reference to
Exhibit 10.1 to the Quarterly Report on Form 10-Q of the Company for the
quarter ended June 30, 2009).
|
|
|
10.11
|
Machinery
and Equipment Purchase Agreement by and between Kyocera Corporation and
AVX Corporation (incorporated by reference to Exhibit 10.14 to the Annual
Report on Form 10-K of the Company for the year ended March 31,
2005).
|
|
|
10.12
|
Materials
Supply Agreement by and between Kyocera Corporation and AVX Corporation
(incorporated by reference to Exhibit 10.15 to the Annual Report on Form
10-K of the Company for the year ended March 31, 2005).
|
-40-
|
10.13
|
Agreement
and Plan of Merger, dated as of June 15, 2007, by and among AVX
Corporation, Admiral Byrd Acquisition Sub, Inc. and American Technical
Ceramics Corp. (incorporated by reference to Exhibit 2 to the Schedule 13D
filed by the Company with the Securities and Exchange Commission on June
25, 2007).
|
|
|
10.14
|
Disclosure
and Option to License Agreement effective as of April 1, 2008 by and
between Kyocera Corporation and AVX Corporation. (incorporated by
reference to Exhibit 10.1 to the Current Report on Form 8-K of the Company
filed with the Securities and Exchange Commission on March 25,
2008).
|
|
|
10.15
|
|
|
|
10.16
|
|
|
|
21.1
|
|
|
|
23.1
|
|
|
|
24.1
|
|
|
|
31.1
|
|
|
|
31.2
|
|
|
|
32.1
|
|
|
|
*
Agreement relates to executive
compensation.
|
||
-41-
SIGNATURES
Pursuant
to the requirements of Section 13 or 15(d) of the Securities Exchange Act of
1934, the registrant has duly caused this report to be signed on its behalf by
the undersigned, thereunto duly authorized.
|
AVX
Corporation
|
|
by: /s/ Kurt P. Cummings
|
|
KURT
P. CUMMINGS
|
|
Vice
President, Chief Financial Officer, Treasurer and
Secretary
|
|
Dated: May
20, 2010
|
Pursuant
to the requirements of the Securities Exchange Act of 1934, this report has been
signed below by the following persons on behalf of the registrant and in the
capacities and on the dates indicated.
|
Signature
|
Title
|
Date
|
|
|
*
|
|||
|
Kazuo
Inamori
|
Chairman
Emeritus of the Board
|
May
20, 2010
|
|
|
*
|
|||
|
John
S. Gilbertson
|
Chairman
of the Board, Chief Executive Officer and President
|
May
20, 2010
|
|
|
*
|
|||
|
Donald
B. Christiansen
|
Director
|
May
20, 2010
|
|
|
*
|
|||
|
Kensuke
Itoh
|
Director
|
May
20, 2010
|
|
|
*
|
|||
|
Makoto
Kawamura
|
Director
|
May
20, 2010
|
|
|
*
|
|||
|
Rodney
N. Lanthorne
|
Director
|
May
20, 2010
|
|
|
*
|
|||
|
Joseph
Stach
|
Director
|
May
20, 2010
|
|
|
*
|
|||
|
David
DeCenzo
|
Director
|
May
20, 2010
|
|
|
*
|
|||
|
Tetsuo
Kuba
|
Director
|
May
20, 2010
|
|
|
*
|
|||
|
Tatsumi
Maeda
|
Director
|
May
20, 2010
|
|
|
*
by: /s/ Kurt P.
Cummings
|
|||
|
KURT
P. CUMMINGS, Attorney-in-Fact for each of the persons
indicated
|
|||
-42-
Consolidated
Balance Sheets
(in
thousands, except per share data)
|
March
31,
|
||||||||
|
Assets
|
2009
|
2010
|
||||||
|
Current
assets:
|
||||||||
|
Cash
and cash equivalents
|
$ | 522,709 | $ | 415,974 | ||||
|
Short-term
investments in securities
|
- | 262,709 | ||||||
|
Available-for-sale
securities
|
24,014 | 9,767 | ||||||
|
Accounts
receivable - trade, net
|
141,525 | 187,958 | ||||||
|
Accounts
receivable - affiliates
|
2,190 | 8,025 | ||||||
|
Inventories
|
365,003 | 357,105 | ||||||
|
Deferred
income taxes
|
35,016 | 34,663 | ||||||
|
Prepaid
and other
|
42,047 | 40,157 | ||||||
|
Total
current assets
|
1,132,504 | 1,316,358 | ||||||
|
Long-term
investments in securities
|
199,192 | 219,993 | ||||||
|
Long-term
available-for-sale securities
|
16,565 | 5,339 | ||||||
|
Property
and equipment:
|
||||||||
|
Land
|
25,705 | 28,990 | ||||||
|
Buildings
and improvements
|
301,007 | 310,226 | ||||||
|
Machinery
and equipment
|
1,125,159 | 1,091,052 | ||||||
|
Construction
in progress
|
15,651 | 19,404 | ||||||
| 1,467,522 | 1,449,672 | |||||||
|
Accumulated
depreciation
|
(1,204,135 | ) | (1,202,643 | ) | ||||
| 263,387 | 247,029 | |||||||
|
Goodwill
|
162,263 | 162,401 | ||||||
|
Intangible
assets - net
|
90,586 | 87,011 | ||||||
|
Deferred
income taxes - non-current
|
- | 5,167 | ||||||
|
Other
assets
|
8,032 | 8,194 | ||||||
|
Total
Assets
|
$ | 1,872,529 | $ | 2,051,492 | ||||
|
Liabilities
and Stockholders' Equity
|
||||||||
|
Current
liabilities:
|
||||||||
|
Accounts
payable - trade
|
$ | 25,294 | $ | 37,151 | ||||
|
Accounts
payable - affiliates
|
38,681 | 67,270 | ||||||
|
Income
taxes payable
|
2,928 | 3,532 | ||||||
|
Accrued
payroll and benefits
|
39,227 | 42,110 | ||||||
|
Accrued
expenses
|
43,272 | 43,210 | ||||||
|
Total
current liabilities
|
149,402 | 193,273 | ||||||
|
Pensions
|
30,335 | 32,015 | ||||||
|
Other
liabilities
|
23,039 | 25,197 | ||||||
|
Total
non-current liabilities
|
53,374 | 57,212 | ||||||
|
Total
Liabilities
|
202,776 | 250,485 | ||||||
|
Commitments
and contingencies (Note 12)
|
||||||||
|
Stockholders'
Equity:
|
||||||||
|
Preferred
stock, par value $.01 per share:
Authorized, 20,000
shares; None issued and outstanding
|
- | - | ||||||
|
Common stock, par
value $.01 per share:
Authorized, 300,000 shares;
issued, 176,368 shares; outstanding, 170,384
|
1,764 | 1,764 | ||||||
|
and 170,074 shares
for 2009 and 2010, respectively
|
||||||||
|
Additional
paid-in capital
|
343,275 | 345,305 | ||||||
|
Retained
earnings
|
1,402,202 | 1,517,818 | ||||||
|
Accumulated
other comprehensive income
|
64 | 17,257 | ||||||
|
Treasury
stock, at cost,
|
(77,552 | ) | (81,137 | ) | ||||
|
5,984
and 6,295 shares for 2009 and 2010, respectively
|
||||||||
|
Total
Stockholders' Equity
|
1,669,753 | 1,801,007 | ||||||
|
Total
Liabilities and Stockholders' Equity
|
$ | 1,872,529 | $ | 2,051,492 | ||||
See
accompanying notes to consolidated financial statements.
-43-
AVX
Corporation and Subsidiaries
Consolidated
Statements of Operations
(in
thousands, except per share data)
|
Years
Ended March 31,
|
2008
|
2009
|
2010
|
|||||||||
|
Net
sales
|
$ | 1,619,275 | $ | 1,389,613 | $ | 1,304,966 | ||||||
|
Cost
of sales
|
1,328,491 | 1,158,196 | 1,027,368 | |||||||||
|
Vendor
settlement
|
- | - | (5,000 | ) | ||||||||
|
Restructuring
charges
|
2,421 | 15,123 | 4,397 | |||||||||
|
Gross
profit
|
288,363 | 216,294 | 278,201 | |||||||||
|
Selling,
general and administrative expenses
|
126,848 | 121,897 | 108,527 | |||||||||
|
Environmental
charge
|
- | 18,200 | - | |||||||||
|
Restructuring
charges
|
- | 3,504 | 2,509 | |||||||||
|
In-process
research and development charge
|
390 | - | - | |||||||||
|
Other
operating income
|
- | (4,051 | ) | (3,519 | ) | |||||||
|
Profit
from operations
|
161,125 | 76,744 | 170,684 | |||||||||
|
Other
income (expense):
|
||||||||||||
|
Interest
income
|
43,226 | 21,112 | 7,120 | |||||||||
|
Interest
expense
|
(456 | ) | (139 | ) | (111 | ) | ||||||
|
Other,
net
|
(530 | ) | (578 | ) | (1,336 | ) | ||||||
|
Income
before income taxes
|
203,365 | 97,139 | 176,357 | |||||||||
|
Provision
for income taxes
|
53,892 | 16,293 | 33,499 | |||||||||
|
Net
income
|
$ | 149,473 | $ | 80,846 | $ | 142,858 | ||||||
|
Income
per share:
|
||||||||||||
|
Basic
|
$ | 0.87 | $ | 0.47 | $ | 0.84 | ||||||
|
Diluted
|
$ | 0.87 | $ | 0.47 | $ | 0.84 | ||||||
|
Weighted
average common shares outstanding:
|
||||||||||||
|
Basic
|
171,487 | 170,616 | 170,247 | |||||||||
|
Diluted
|
172,065 | 170,689 | 170,274 | |||||||||
See
accompanying notes to consolidated financial statements.
-44-
AVX Corporation and Subsidiaries
Consolidated
Statements of Stockholders' Equity
(in
thousands, except per share data)
| Accumulated | ||||||||||||||||||||||||||||||||
| Common Stock | Additional | Other | ||||||||||||||||||||||||||||||
| Number | Treasury | Paid-In | Retained | Comprehensive | Comprehensive | |||||||||||||||||||||||||||
| Of Shares | Amount | Stock | Capital | Earnings | Income | Total | Income | |||||||||||||||||||||||||
|
Balance,
March 31, 2007
|
171,674 | $ | 1,764 | $ | (62,491 | ) | $ | 340,911 | $ | 1,226,283 | $ | 128,812 | $ | 1,635,279 | $ | 222,945 | ||||||||||||||||
|
Net
income
|
149,473 | 149,473 | 149,473 | |||||||||||||||||||||||||||||
|
Other
comprehensive
|
||||||||||||||||||||||||||||||||
|
income
|
78,538 | 78,538 | 78,538 | |||||||||||||||||||||||||||||
|
Dividends
of $0.15
|
||||||||||||||||||||||||||||||||
|
per
share
|
(27,466 | ) | (27,466 | ) | ||||||||||||||||||||||||||||
|
Stock-based
|
||||||||||||||||||||||||||||||||
|
compensation
expense
|
2,749 | 2,749 | ||||||||||||||||||||||||||||||
|
Adoption
of new
|
||||||||||||||||||||||||||||||||
|
income
tax guidance
|
1,059 | 1,059 | ||||||||||||||||||||||||||||||
|
Stock
option activity
|
571 | 7,677 | (1,811 | ) | 5,866 | |||||||||||||||||||||||||||
|
Tax
benefit of stock
|
||||||||||||||||||||||||||||||||
|
option
exercises
|
994 | 994 | ||||||||||||||||||||||||||||||
|
Treasury
stock purchased
|
(1,179 | ) | (17,141 | ) | (17,141 | ) | ||||||||||||||||||||||||||
|
Balance,
March 31, 2008
|
171,066 | $ | 1,764 | $ | (71,955 | ) | $ | 342,843 | $ | 1,349,349 | $ | 207,350 | $ | 1,829,351 | $ | 228,011 | ||||||||||||||||
|
Net
income
|
80,846 | 80,846 | 80,846 | |||||||||||||||||||||||||||||
|
Other
comprehensive
|
||||||||||||||||||||||||||||||||
|
loss
|
(207,286 | ) | (207,286 | ) | (207,286 | ) | ||||||||||||||||||||||||||
|
Dividends
of $0.16
|
||||||||||||||||||||||||||||||||
|
per
share
|
(27,316 | ) | (27,316 | ) | ||||||||||||||||||||||||||||
|
Stock-based
|
||||||||||||||||||||||||||||||||
|
compensation
expense
|
2,488 | 2,488 | ||||||||||||||||||||||||||||||
|
Adoption
of new
|
||||||||||||||||||||||||||||||||
|
benefit
plan guidance
|
(677 | ) | (677 | ) | ||||||||||||||||||||||||||||
|
Stock
option activity
|
442 | 5,825 | (2,296 | ) | 3,529 | |||||||||||||||||||||||||||
|
Tax
benefit of stock
|
||||||||||||||||||||||||||||||||
|
option
exercises
|
240 | 240 | ||||||||||||||||||||||||||||||
|
Treasury
stock purchased
|
(1,124 | ) | (11,422 | ) | (11,422 | ) | ||||||||||||||||||||||||||
|
Balance,
March 31, 2009
|
170,384 | $ | 1,764 | $ | (77,552 | ) | $ | 343,275 | $ | 1,402,202 | $ | 64 | $ | 1,669,753 | $ | (126,440 | ) | |||||||||||||||
|
Net
income
|
142,858 | 142,858 | 142,858 | |||||||||||||||||||||||||||||
|
Other
comprehensive
|
||||||||||||||||||||||||||||||||
|
income
|
17,193 | 17,193 | 17,193 | |||||||||||||||||||||||||||||
|
Dividends
of $0.16
|
||||||||||||||||||||||||||||||||
|
per
share
|
(27,242 | ) | (27,242 | ) | ||||||||||||||||||||||||||||
|
Stock-based
|
||||||||||||||||||||||||||||||||
|
compensation
expense
|
2,040 | 2,040 | ||||||||||||||||||||||||||||||
|
Stock
option activity
|
12 | 151 | (18 | ) | 133 | |||||||||||||||||||||||||||
|
Tax
benefit of stock
|
||||||||||||||||||||||||||||||||
|
option
exercises
|
8 | 8 | ||||||||||||||||||||||||||||||
|
Treasury
stock purchased
|
(322 | ) | (3,736 | ) | (3,736 | ) | ||||||||||||||||||||||||||
|
Balance,
March 31, 2010
|
170,074 | $ | 1,764 | $ | (81,137 | ) | $ | 345,305 | $ | 1,517,818 | $ | 17,257 | $ | 1,801,007 | $ | 160,051 | ||||||||||||||||
See accompanying notes to consolidated
financial statements.
-45-
AVX Corporation and Subsidiaries
|
Consolidated
Statements of Cash Flows
|
(in
thousands)
|
Years
Ended March 31,
|
2008
|
2009
|
2010
|
|||||||||||
|
Operating
Activities:
|
||||||||||||||
|
Net
income
|
$ | 149,473 | $ | 80,846 | $ | 142,858 | ||||||||
|
Adjustment
to reconcile net income to net cash from operating
activities:
|
||||||||||||||
|
Depreciation
and amortization
|
55,546 | 66,198 | 58,173 | |||||||||||
|
In-process
research and development charge
|
390 | - | - | |||||||||||
|
Stock-based
compensation expense
|
2,749 | 2,488 | 2,040 | |||||||||||
|
Deferred
income taxes
|
(460 | ) | (9,483 | ) | (8,419 | ) | ||||||||
|
Loss
on pro rata distribution of available-for-sale securities
|
980 | - | - | |||||||||||
|
(Gain)
Loss on available-for-sale securities
|
(1,748 | ) | 4,216 | 362 | ||||||||||
|
Gain
on sale of property, plant & equipment, net of
retirements
|
(189 | ) | (2,847 | ) | (2,546 | ) | ||||||||
|
Changes
in operating assets and liabilities:
|
||||||||||||||
|
Accounts
receivable
|
6,320 | 44,648 | (47,462 | ) | ||||||||||
|
Inventories
|
(23,363 | ) | 7,668 | 14,788 | ||||||||||
|
Accounts
payable and accrued expenses
|
5,968 | (125,109 | ) | 25,868 | ||||||||||
|
Income
taxes payable (receivable)
|
(3,506 | ) | (20,124 | ) | 16,390 | |||||||||
|
Other
assets
|
5,313 | (1,153 | ) | (10,156 | ) | |||||||||
|
Other
liabilities
|
(15,610 | ) | 17,643 | 8,558 | ||||||||||
|
Net
cash provided by (used in) operating activities
|
181,863 | 64,991 | 200,454 | |||||||||||
|
Investing
Activities:
|
||||||||||||||
|
Purchases
of property and equipment
|
(70,886 | ) | (44,205 | ) | (28,888 | ) | ||||||||
|
Purchase
of business, net of cash acquired
|
(226,107 | ) | - | - | ||||||||||
|
Pro
rata distribution of available-for-sale securities
|
(114,705 | ) | - | - | ||||||||||
|
Sales
and redemptions of available-for-sale securities
|
26,461 | 42,447 | 29,006 | |||||||||||
|
Purchases
of investment securities
|
(159,000 | ) | (309,193 | ) | (943,231 | ) | ||||||||
|
Sales
and redemptions of investment securities
|
284,000 | 269,000 | 659,523 | |||||||||||
|
Proceeds
from property, plant & equipment dispositions
|
2,261 | 6,106 | 6,050 | |||||||||||
|
Contingent
consideration for a prior acquisition
|
- | (6,677 | ) | (63 | ) | |||||||||
|
Other
investing activities
|
- | 202 | (870 | ) | ||||||||||
|
Net
cash provided by (used in) investing activities
|
(257,976 | ) | (42,320 | ) | (278,473 | ) | ||||||||
|
Financing
Activities:
|
||||||||||||||
|
Repayment
of debt
|
(5,367 | ) | - | - | ||||||||||
|
Dividends
paid
|
(27,466 | ) | (27,316 | ) | (27,242 | ) | ||||||||
|
Purchase
of treasury stock
|
(17,141 | ) | (11,422 | ) | (3,736 | ) | ||||||||
|
Proceeds
from exercise of stock options
|
5,866 | 3,529 | 133 | |||||||||||
|
Excess
tax benefit from stock-based payment arrangements
|
994 | 240 | 8 | |||||||||||
|
Other
financing activities
|
- | - | 1,732 | |||||||||||
|
Net
cash provided by (used in) financing activities
|
(43,114 | ) |
-
|
(34,969 | ) |
-
|
(29,105 | ) | ||||||
|
Effect
of exchange rate on cash
|
3,709 | (33,857 | ) | 389 | ||||||||||
|
Increase
(decrease) in cash and cash equivalents
|
(115,518 | ) | (46,155 | ) | (106,735 | ) | ||||||||
|
Cash
and cash equivalents at beginning of period
|
684,382 | 568,864 | 522,709 | |||||||||||
|
Cash
and cash equivalents at end of period
|
$ | 568,864 | $ | 522,709 | $ | 415,974 | ||||||||
|
See accompanying notes to
consolidated financial
statements.
|
-46-
AVX Corporation and Subsidiaries
Notes
to Consolidated Financial Statements
(in
thousands, except per share data)
|
1.
|
Summary of Significant Accounting
Policies:
|
General:
AVX
Corporation is a leading worldwide manufacturer and supplier of a broad line of
passive electronic components and interconnect products. The
consolidated financial statements of AVX Corporation and its subsidiaries (the
"Company" or "AVX") include the accounts of the Company and its
subsidiaries. All significant intercompany transactions and accounts
have been eliminated.
From
January 1990 through August 15, 1995, the Company was wholly owned by Kyocera
Corporation ("Kyocera"). As of March 31, 2010, Kyocera owned
approximately 72% of the Company's outstanding shares of common
stock.
Use
of Estimates:
The
consolidated financial statements are prepared on the basis of generally
accepted accounting principles. The preparation of these financial
statements requires management to make estimates and judgments that affect the
reported amounts of assets and liabilities and the disclosure of contingent
assets and liabilities at the date of the financial statements and the reported
amounts of revenues and expenses during the reported
periods. Management bases its estimates and judgments on historical
experience and on various other factors that are believed to be reasonable under
the circumstances, the results of which form the basis for making judgments
about the carrying values of assets and liabilities that are not readily
apparent from other sources. There can be no assurance that actual
results will not differ from those estimates. On an ongoing basis,
the Company evaluates its accounting policies and disclosure
practices.
Cash
Equivalents and Investments in Securities:
The
Company considers all highly liquid investments purchased with an original
maturity of three months or less to be cash equivalents. During the
preparation of the Company’s fiscal 2010 financial statements, the Company
determined that certain time deposits with original maturities of greater than
three months when purchased had been misclassified as cash and cash equivalents
in prior years’ financial statements. The Company has determined the impact of
this misclassification to be immaterial to prior balance sheets and statements
of cash flows. There was no impact on the consolidated statements of
operations. The Company corrected the classification of these time deposits by
increasing short term investments and decreasing cash and cash equivalents by
$120,872 in the Consolidated Balance Sheet at March 31, 2010. The Consolidated
Statement of Cash Flows for the year ended March 31, 2010 includes an additional
$120,872 of purchases of investments, which represents the cumulative net amount
of prior year purchases and redemptions of these investments not previously
reflected in the statement ($26,840 in fiscal 2009, $79,328 in fiscal 2008 and
$14,704 in years prior to fiscal 2008).
The
Company’s long-term and short-term investment securities are accounted for as
held-to-maturity securities and are carried at amortized cost. The Company has
the ability and intent to hold these investments until maturity. All income
generated from the held-to-maturity securities investments are recorded as
interest income.
On
December 20, 2007, the Company received a pro rata distribution of the
underlying securities that had previously been held in a money market investment
account previously included in cash and cash equivalents in the Company’s
Consolidated Balance Sheet. The securities are classified as
available-for-sale and are either current or long-term assets based on their
underlying expected cash flows and are being recorded at fair market value. Any
unrealized holding gains and losses resulting from these securities are
reported, net of tax, as a separate component of shareholders' equity until
realized. Realized gains and losses and declines in value judged to be other
than temporary, if any, are included in the Company’s results of
operations.
-47-
Inventories:
The
Company determines the cost of raw materials, work in process and finished goods
inventories by the first-in, first-out ("FIFO") method. Inventory
costs include material, labor and manufacturing overhead. Inventories
are valued at the lower of cost or market (realizable value) and are valued at
its market value where there is evidence that the utility of goods will be less
than cost and that such write-down should occur in the current
period. Accordingly, at the end of each period, the Company evaluates
its inventory and adjusts to net realizable value. The Company
reviews and adjusts the carrying value of its inventories based on historical
usage, customer forecasts received from the marketing and sales personnel,
customer backlog, certain date code restrictions, technology changes, demand
increases and decreases, market directional shifts, and obsolescence and
aging.
Property
and Equipment:
Property
and equipment are recorded at cost. Machinery and equipment are
generally depreciated on the double-declining balance
method. Buildings are depreciated on the straight-line
method. The estimated useful lives used for computing depreciation
are as follows: buildings and improvements – 10 to 31.5 years, and machinery and
equipment – 3 to 10 years. Depreciation expense was $53,542, $61,738
and $53,798 for the fiscal years ended March 31, 2008, 2009 and 2010,
respectively.
The
Company reviews long-lived assets for impairment whenever events or changes in
circumstances indicate that the carrying amount of any such assets may not be
recoverable. If the sum of the undiscounted cash flows is less than
the carrying value of the related assets, the Company recognizes an impairment
loss, measured as the amount by which the carrying value exceeds the fair value
of the assets.
The cost
of maintenance and repairs is charged to expense as incurred. Upon
disposal or retirement, the cost and accumulated depreciation of assets are
eliminated from the respective accounts. Any gain or loss is
reflected in the Company's results of operations.
Goodwill
and Acquired Intangible Assets:
The
Company does not amortize goodwill and indefinite-lived intangible assets, but
tests these assets for impairment at least annually or whenever conditions
indicate that such impairment could exist. The carrying value of goodwill and
indefinite-lived intangible assets are evaluated in relation to the operating
performance and estimated future discounted cash flows of the related reporting
unit. If the sum of the discounted cash flows (excluding interest) is
less than the carrying value of the related assets, the Company recognizes an
impairment loss, measured as the amount by which the carrying value exceeds the
fair value of the assets. The estimate of cash flow is based upon,
among other things, certain assumptions about expected future operating
performance. The Company's annual goodwill and indefinite-lived
intangible assets impairment analysis indicated that there was no related
impairment for the fiscal years ended March 31, 2008, 2009 or 2010.
The
Company has determined that certain intangible assets have finite useful lives.
These assets are being amortized on a straight-line basis over their estimated
useful lives. Amortization expense was $4,460 and $4,375 for the
fiscal years ended March 31, 2009 and March 31, 2010, respectively.
Pension
Assumptions:
Pension
benefit obligations and the related effects on operations are calculated using
actuarial models. Two critical assumptions, discount rate and
expected rate of return on plan assets, are important elements of plan expense
and/or liability measurement. The Company evaluates these assumptions
at least annually. The discount rate enables the Company to state
expected future cash flows at a present value on the measurement date. To
determine the discount rate, the Company applies the expected cash flows from
each individual pension plan to specific yield curves at the plan’s measurement
date and determines a level equivalent yield unique to each plan. A lower
discount rate increases the present value of benefit obligations and increases
pension expense. To determine the expected long-term rate of return
on pension plan assets, the Company considers the current and expected asset
allocations, as well as historical and expected returns on various categories of
plan assets. Other assumptions involve demographic factors such as
retirement, mortality and turnover. These assumptions are evaluated
at least annually and are updated to reflect the Company's
experience. Actual results in any given year will often differ from
actuarial assumptions because of economic and other factors. In such
cases, the differences between actual results and actuarial assumptions are
amortized over future periods.
-48-
Income
Taxes:
As part
of the process of preparing the consolidated financial statements, the Company
is required to estimate its tax assets and liabilities in each of the
jurisdictions in which it operates. This process involves management
estimating the actual current tax exposure together with assessing temporary
differences resulting from different treatment of items for tax and accounting
purposes. These differences result in deferred tax assets and
liabilities that are included within the consolidated balance
sheets. The Company assesses the likelihood that its deferred tax
assets will be recoverable as a result of future taxable income and, to the
extent management believes that recovery is not likely, the Company establishes
a valuation allowance.
The
Company has recorded valuation allowances due to uncertainties related to its
ability to realize some of its deferred tax assets, primarily consisting of
certain net operating losses carried forward before they expire. The
valuation allowance is based on the Company’s estimates of future taxable income
over the periods that its deferred tax assets will be recoverable.
The
Company also records a provision for certain international, federal and state
tax contingencies based on the likelihood of obligation, when needed. In the
normal course of business, the Company is subject to challenges from U.S. and
non-U.S. tax authorities regarding the amount of taxes due. These
challenges may result in adjustments of the timing or amount of taxable income
or deductions or the allocation of income among tax jurisdictions. Further,
during the ordinary course of business, other changing facts and circumstances
may impact the Company's ability to utilize tax benefits as well as the
estimated taxes to be paid in future periods. Management believes that any
potential tax exposures have been sufficiently provided for in the consolidated
financial statements. In the event that actual results differ from these
estimates, the Company may need to adjust tax accounts and related payments,
which could materially impact its financial condition and results of
operations.
In June
2006, new guidance was issued which addressed accounting for the uncertainty in
income taxes. The guidance clarified when tax benefits should be
recognized in the financial statements and provided criteria for measurement of
a tax position taken or expected to be taken in a tax return. The
Company recognizes the impact of a tax position, if that position is “more
likely than not” of being sustained on audit, based on the technical merits of
the position. The Company adopted the guidance effective April 1, 2007. Accruals
for estimated interest and penalties are recorded as a component of interest
expense.
The
Company records deferred tax liabilities for temporary differences associated
with deductions for foreign branch losses claimed by the Company in its U.S.
income tax returns, as these deductions are subject to recapture provisions in
the U.S. income tax code. When the recapture period expires for these
deductions, the tax benefit is recognized in the income tax provision.
Foreign
Currency Activity:
Assets
and liabilities of foreign subsidiaries, where functional currencies are their
local currencies, are translated into U.S. dollars at the exchange rate in
effect at the balance sheet date. Operating accounts are translated
at an average rate of exchange for the respective accounting
periods. Translation adjustments result from the process of
translating foreign currency financial statements into U.S. dollars and are
reported separately as a component of accumulated other comprehensive
income. Transaction gains and losses reflected in the functional
currencies are charged to income at the time of the transaction.
As a
result of certain restructuring activities, including the movement of certain
manufacturing operations out of the United Kingdom, the Company reassessed the
functional currency designation of certain U.K. subsidiaries and determined that
a change in functional currency designation of certain U.K. operations was
appropriate. This change in functional currency from the British
Pound to the U.S. dollar was effective April 1, 2009. The change
resulted in the translation amounts recorded for these operations to the
consolidated accumulated other comprehensive income account through March 31,
2009 to remain unchanged indefinitely and will otherwise not have a material
impact on the consolidated financial position, results of operations or cash
flows of the Company.
Derivative
Financial Instruments:
Derivative
instruments are reported on the consolidated balance sheets at their fair
values. The accounting for changes in fair value depends upon the
purpose of the derivative instrument and whether it is designated and qualifies
for hedge accounting. For instruments designated as hedges,
unrealized gains or losses are reported in other comprehensive income and when
realized, are reported in the Company’s results of operations. Any
contracts that do not qualify as hedges, for accounting purposes, are marked to
market with the resulting gains and losses recognized in other income or
expense.
-49-
The
Company uses financial instruments such as forward exchange contracts to hedge a
portion, but not all, of its firm commitments denominated in foreign
currencies. The purpose of the Company's foreign currency management
is to minimize the effect of exchange rate changes on actual cash flows from
foreign currency denominated transactions. See Note 13 for further discussion of
derivative financial instruments.
Revenue
Recognition and Accounts Receivable:
All
products are built to specification and tested by AVX for adherence to such
specification before shipment to customers. The Company ships
products to customers based upon firm orders. Shipping and handling
costs are included in cost of sales. The Company recognizes revenue
when the sales process is complete. This occurs when products are
shipped to the customer in accordance with the terms of an agreement of sale,
there is a fixed or determinable selling price, title and risk of loss have been
transferred and collectability is reasonably assured. Estimates used
in determining sales allowance programs described below are subject to the
volatilities of the market place. This includes, but is not limited
to, changes in economic conditions, pricing changes, product demand, inventory
levels in the supply chain, the effects of technological change, and other
variables that might result in changes to the Company’s
estimates. Accordingly, there can be no assurance that actual results
will not differ from those estimates.
Accounts
Receivable
The
Company maintains an allowance for doubtful accounts for estimated losses
resulting from the inability of its customers to make required payments. The
allowance is determined through an analysis of the aging of accounts receivable
and assessments of risk that are based on historical trends and an evaluation of
the impact of current and projected economic conditions. The Company evaluates
the past-due status of its trade receivables based on contractual terms of sale.
If the financial condition of the Company’s customers were to deteriorate,
resulting in an impairment of their ability to make payments, additional
allowances may be required.
Returns
Sales
revenue and cost of sales reported in the income statement are reduced to
reflect estimated returns. The Company records an estimated sales
allowance for returns at the time of sale based on using historical trends,
current pricing and volume information, other market specific information and
input from sales, marketing and other key management. The amount
accrued reflects the return of value of the customer’s
inventory. These procedures require the exercise of significant
judgments. The Company believes that these procedures enable it to
make reliable estimates of future returns. The Company’s actual
results approximate its estimates. When the product is returned and
verified, the customer is given credit against their accounts
receivable.
Distribution
Programs
A portion
of the Company’s sales are to independent electronic component distributor
customers, which are subject to various distributor sales
programs. The Company reports provisions for distributor allowances
in connection with such sales programs as a reduction in revenue and reports
distributor allowances in the balance sheet as a reduction in accounts
receivable. For the distribution programs described below, the
Company does not track the individual units that are recorded against specific
products sold from distributor inventories, which would allow it to directly
compare revenue reduction for credits recorded during any period with credits
ultimately awarded in respect of products sold during that
period. Nevertheless, management believes that the Company has an
adequate basis to assess the reasonableness and reliability of its estimates for
each program.
Distributor
Stock Rotation Program
Stock
rotation is a program whereby distributor customers are allowed to return for
credit qualified inventory, semi-annually, equal to a certain percentage,
primarily limited to 5% of the previous six months net sales. The
Company records an estimated sales allowance for stock rotation at the time of
sale based on a percentage of distributor sales using historical trends, current
pricing and volume information, other market specific information and input from
sales, marketing and other key management. These procedures require
the exercise of significant judgments. The Company believes that
these procedures enable it to make reliable estimates of future returns under
the stock rotation program. The Company’s actual results approximate
its estimates. When the product is returned and verified, the
distributor is given credit against their accounts receivable.
-50-
Distributor
Ship-from-Stock and Debit Program
Ship-from-Stock
and Debit ("ship and debit") is a program designed to assist distributor
customers in meeting competitive prices in the marketplace on sales to their end
customers. Ship and debit programs require a request from the
distributor for a pricing adjustment for a specific part for a sale to the
distributor’s end customer from the distributor’s stock. Ship and
debit authorizations may cover current and future distributor activity for a
specific part for sale to their customer. At the time the Company
records sales to the distributors, it provides an allowance for the estimated
future distributor activity related to such sales since it is probable that such
sales to distributors will result in ship and debit activity. The
Company records an estimated sales allowance based on sales during the period,
credits issued to distributors, distributor inventory levels, historical trends,
market conditions, pricing trends the Company sees in its direct sales activity
with original equipment manufacturers and other customers, and input from sales,
marketing and other key management. These procedures require the
exercise of significant judgments. The Company believes that these
procedures enable it to make reliable estimates of future credits under the ship
and debit program. The Company’s actual results approximate its
estimates. At the time the distributor ships the part from stock, the
distributor debits the Company for the authorized pricing
adjustment.
Special
Incentive Programs
The
Company may offer special incentive discounts based on amount of product ordered
or shipped. At the time the Company records sales under these
agreements, it provides an allowance for the discounts on the sales for which
the customer is eligible to take. The customer then debits the Company for the
authorized discount amount.
Warranty:
All of
the Company’s products are built to specifications and tested by the Company for
adherence to such specifications before shipment to customers. The
Company warrants that its products will meet such specifications. The
Company accrues for product warranties when it is probable that customers will
make claims under warranties relating to products that have been sold and a
reasonable estimate of costs can be made. The amount accrued
represents the direct costs of replacement and other potential costs resulting
from product not meeting specifications above and beyond the return value of the
customer’s affected product purchases. Historically valid warranty
claims, which are a result of products not meeting specifications, have been
immaterial to the Company’s results of operations. However, there is
no guarantee that warranty claims in the future will not increase, or be
material to results of operations, as a result of manufacturing defects, end
market product application failures or end user recall or damage
claims.
Grants:
The
Company receives employment and research grants from various non-U.S.
governmental agencies, which are recognized in its results of operations in the
period in which the related expenditures are incurred. Capital grants
for the acquisition of equipment are recorded as reductions of the related
equipment cost and reduce future depreciation expense. The grants are
generally subject to certain conditions and non-compliance with such conditions
could result in repayment of grants.
Research,
Development and Engineering:
Research,
development and engineering expenditures are expensed when incurred. Research
and development expenses are included in selling, general and administrative
expenses and are $12,450, $11,703, and $6,831 for the fiscal years ended March
31, 2008, 2009, and 2010, respectively. Engineering expenses are included in
cost of sales and selling, general, and administrative expenses as
follows:
|
Years
Ended March 31,
|
||||||||||||
|
2008
|
2009
|
2010
|
||||||||||
|
Engineering
expense:
|
||||||||||||
|
Cost
of sales
|
$ | 20,619 | $ | 17,283 | $ | 17,200 | ||||||
|
Selling
general and administrative expense
|
2,396 | 2,491 | 636 | |||||||||
|
Total
engineering expense
|
$ | 23,015 | $ | 19,774 | $ | 17,836 | ||||||
-51-
Stock-Based
Compensation:
The
Company recognizes the compensation cost resulting from all share-based payment
transactions in the financial statements. The amount of compensation
cost is measured based on the grant-date fair value for the share-based payment
issued. The Company's policy is to grant stock options with an
exercise price equal to the Company’s stock price on the date of
grant. Compensation cost is recognized over the vesting period of the
award.
The
Company uses the modified prospective method to account for employee stock
options granted prior to the adoption of new guidance on April 1,
2006. Under this method, the fair value of previously granted but
unvested equity awards is recognized as compensation expense in the financial
statements.
The
Company uses the Black-Scholes option pricing model to determine the fair value
of its options at grant date. See Note 11 for assumptions
used.
Treasury
Stock:
In April
2001, October 2005 and October 2007, the Company's Board of Directors approved
stock repurchase authorizations whereby up to 15,000 shares of common stock
could be purchased from time to time at the discretion of
management. Accordingly, 1,179 shares were purchased during the
fiscal year ended March 31, 2008, 1,124 shares were purchased during the fiscal
year ended March 31, 2009 and 322 shares were purchased during the fiscal year
ended March 31, 2010. The Company purchased 183 shares of common
stock during the fourth quarter of the fiscal year ended March 31,
2010. As of March 31, 2010, the Company had in treasury 6,295 common
shares at a cost of $81,137. There are 7,563 shares that may yet be
purchased under this program.
Commitments
and Contingencies:
Liabilities
for loss contingencies are recorded when it is probable that a liability has
been incurred and the amount can be reasonably estimated.
New
Accounting Standards:
In April
of 2008, new guidance was issued by related to the determination of the useful
lives of intangible assets, which amends the factors that should be considered
in developing renewal or extension assumptions used to determine the useful life
of an intangible asset is effective for financial statements issued for fiscal
years beginning after December 15, 2008 and interim periods within those
years. The adoption of this guidance did not affect the consolidated financial
position, results of operations or cash flows of the Company.
In
December 2008, new guidance was issued related to employers’ disclosures about
postretirement benefit plan assets requires that information about plan assets
be disclosed, on an annual basis, based on fair value disclosure requirements.
The Company is required to separate plan assets into the three fair value
hierarchy levels and provide a roll forward of the changes in fair value of plan
assets classified as Level 3. The requirements related to the disclosures about
plan assets were effective for fiscal years ending after December 15, 2009.
Since the requirements are only additional disclosures concerning plan assets,
the adoption of this guidance did not affect the consolidated financial
position, results of operations or cash flows of the Company.
-52-
In April
2009, new guidance issued is intended to provide application guidance and revise
the disclosures regarding fair value measurements and impairments of securities.
The requirements are summarized as follows:
|
·
|
Determining Fair Value
When the Volume and Level of Activity for the Asset or Liability Have
Significantly Decreased and Identifying Transactions That Are Not
Orderly. This addresses the determination of fair values when there
is no active market or where the price inputs represent distressed sales.
It also reaffirms the view in previous guidance that the objective of fair
value measurement is to reflect an asset’s sale price in an orderly
transaction at the date of the financial
statements.
|
|
·
|
Interim Disclosures
about Fair Value of Financial Instruments. This enhances
consistency in financial reporting by increasing the frequency of fair
value disclosures to a quarterly instead of annual basis for any financial
instruments that are not currently reflected on the balance sheet at fair
value.
|
|
·
|
Recognition and
Presentation of Other-Than-Temporary Impairments. This amends the
other-than-temporary impairment guidance for debt securities and
presentation and disclosure requirements of other-than-temporary
impairments of debt and equity
securities.
|
This
guidance is effective for fiscal years and interim reporting periods ending
after June 15, 2009. The adoption of this guidance did not have a material
impact on the consolidated financial position, results of operations or cash
flows of the Company.
In June
2009, new guidance was issued to establish the “Financial Accounting Standards
Codification” (“Codification”) as the single source of authoritative
nongovernmental U.S. GAAP which was launched on July 1, 2009. The Codification
does not change current U.S. GAAP, but is intended to simplify user access to
all authoritative U.S. GAAP by providing all the authoritative literature
related to a particular topic in one place. All existing accounting standard
documents will be superseded and all other accounting literature not included in
the Codification will be considered non-authoritative. Rules and interpretive
releases of the Securities and Exchange Commission (SEC) under authority of
federal securities laws are also sources of authoritative GAAP for SEC
registrants. The Codification is effective for interim and annual periods ending
after September 15, 2009 and did not have an impact on the Company’s financial
condition, results of operations or cash flows.
|
2.
|
Earnings Per
Share:
|
Basic
earnings per share are computed by dividing net earnings by the weighted average
number of shares of common stock outstanding for the period. Diluted
earnings per share are computed by dividing net earnings by the sum of (a) the
weighted average number of shares of common stock outstanding during the period
and (b) the dilutive effect of potential common stock equivalents during the
period. Stock options are the only common stock equivalents currently
used by the Company and are computed using the treasury stock
method.
The table
below represents the basic and diluted weighted average number of shares of
common stock and potential common stock equivalents outstanding for the years
ended March 31, 2008, 2009 and 2010:
|
2008
|
2009
|
2010
|
||||||||||
|
Net
Income
|
$ | 149,473 | $ | 80,846 | $ | 142,858 | ||||||
|
Computation
of Basic EPS:
|
||||||||||||
|
Weighted
Average Shares Outstanding used in Computing Basic EPS
|
171,487 | 170,616 | 170,247 | |||||||||
|
Basic
earnings per share
|
$ | 0.87 | $ | 0.47 | $ | 0.84 | ||||||
|
Computation
of Diluted EPS:
|
||||||||||||
|
Weighted
Average Shares Outstanding
|
171,487 | 170,616 | 170,247 | |||||||||
|
Effect
of stock options
|
578 | 73 | 27 | |||||||||
|
Shares
used in Computing Diluted EPS (1)
|
172,065 | 170,689 | 170,274 | |||||||||
|
Diluted
Income per share
|
$ | 0.87 | $ | 0.47 | $ | 0.84 | ||||||
(1) Common stock equivalents, not included in the computation of diluted earnings per share because the impact would have been anti dilutive, were 3,615 shares, 7,595 shares and 6,240 shares for the fiscal years ended March 31, 2008, 2009 and 2010, respectively.
-53-
|
3.
|
Comprehensive
Income:
|
Comprehensive
income includes the following components:
|
Years
Ended March 31,
|
||||||||||||
|
2008
|
2009
|
2010
|
||||||||||
|
Net
income
|
$ | 149,473 | $ | 80,846 | $ | 142,858 | ||||||
|
Other
comprehensive income (loss):
|
||||||||||||
|
Pension
liability and other savings plan liability adjustment
|
6,677 | (4,882 | ) | (2,215 | ) | |||||||
|
Foreign
currency translation adjustment
|
70,909 | (196,686 | ) | 16,564 | ||||||||
|
Foreign
currency cash flow hedges
|
2,041 | (3,954 | ) | 314 | ||||||||
|
Unrealized
gain (loss) on available-for-sale securities
|
(1,089 | ) | (1,764 | ) | 2,530 | |||||||
|
Comprehensive
income (loss)
|
$ | 228,011 | $ | (126,440 | ) | $ | 160,051 | |||||
The
accumulated balance of comprehensive income is as follows:
|
Years
Ended March 31,
|
||||||||||||
|
2008
|
2009
|
2010
|
||||||||||
|
Pension
liability and other savings plan liability adjustment
|
$ | (22,291 | ) | $ | (27,173 | ) | $ | (29,388 | ) | |||
|
Foreign
currency translation adjustment
|
227,838 | 31,152 | 47,716 | |||||||||
|
Foreign
currency cash flow hedges
|
2,892 | (1,062 | ) | (748 | ) | |||||||
|
Unrealized
loss on available-for-sale securities
|
(1,089 | ) | (2,853 | ) | (323 | ) | ||||||
|
Balance
at end of period
|
$ | 207,350 | $ | 64 | $ | 17,257 | ||||||
|
4.
|
Fair
Value:
|
Fair
Value Hierarchy:
The fair
value framework requires the categorization of assets and liabilities into three
levels based upon the assumptions (inputs) used to value the assets or
liabilities. Level 1 provides the most reliable measure of fair value, whereas
Level 3 generally requires significant management judgment. The three levels are
defined as follows:
|
§
|
Level 1: Unadjusted
quoted prices in active markets for identical assets and
liabilities.
|
|
§
|
Level 2: Observable
inputs other than those included in Level 1. For example, quoted prices
for similar assets or liabilities in active markets or quoted prices for
identical assets or liabilities in inactive
markets.
|
|
§
|
Level 3: Unobservable
inputs reflecting management’s own assumptions about the inputs used in
pricing the asset or liability.
|
|
Based
on
|
||||||||||||||||
|
Fair
Value at March 31, 2009
|
Quoted
prices in active markets (Level 1)
|
Other
observable inputs
(Level
2)
|
Unobservable
inputs
(Level
3)
|
|||||||||||||
|
Assets
measured at fair value on a recurring basis:
|
||||||||||||||||
|
Available-for-sale
investment securities - short-term
|
$ | 24,014 | $ | - | $ | 19,813 | $ | 4,201 | ||||||||
|
Available-for-sale
investment securities - long-term
|
16,565 | - | 13,668 | 2,897 | ||||||||||||
|
Assets
held in the non-qualified deferred compensation program(1)
|
7,265 | 7,265 | - | - | ||||||||||||
|
Total
|
$ | 47,844 | $ | 7,265 | $ | 33,481 | $ | 7,098 | ||||||||
-54-
|
Based
on
|
||||||||||||||||
|
Fair
Value at March 31, 2009
|
Quoted
prices in active markets
(Level
1)
|
Other
observable inputs
(Level
2)
|
Unobservable
inputs
(Level
3)
|
|||||||||||||
|
Liabilities
measured at fair value on a recurring basis:
|
||||||||||||||||
|
Obligation
related to assets held in the non-qualified deferred
compensation
program(1)
|
$ | 7,265 | $ | 7,265 | $ | - | $ | - | ||||||||
|
Foreign
currency derivatives(2)
|
1,025 | - | 1,025 | - | ||||||||||||
|
Total
|
$ | 8,290 | $ | 7,265 | $ | 1,025 | $ | - | ||||||||
|
Based
on
|
||||||||||||||||
|
Fair
Value at March 31, 2010
|
Quoted
prices in active markets
(Level
1)
|
Other
observable inputs
(Level
2)
|
Unobservable
inputs
(Level
3)
|
|||||||||||||
|
Assets
measured at fair value on a recurring basis:
|
||||||||||||||||
|
Available-for-sale
investment securities - short-term
|
$ | 9,767 | $ | 3 | $ | 9,537 | $ | 227 | ||||||||
|
Available-for-sale
investment securities - long-term
|
5,340 | 5,216 | 124 | |||||||||||||
|
Assets
held in the non-qualified deferred compensation program(1)
|
9,400 | 9,400 | ||||||||||||||
|
Total
|
$ | 24,507 | $ | 9,403 | $ | 14,753 | $ | 351 | ||||||||
|
Based
on
|
||||||||||||||||
|
Fair
Value at March 31, 2010
|
Quoted
prices in active markets
(Level
1)
|
Other
observable inputs
(Level
2)
|
Unobservable
inputs
(Level
3)
|
|||||||||||||
|
Liabilities
measured at fair value on a recurring basis:
|
||||||||||||||||
|
Obligation
related to assets held in the non-qualified deferred
compensation
program(1)
|
$ | 9,400 | $ | 9,400 | ||||||||||||
|
Foreign
currency derivatives(2)
|
919 | 919 | ||||||||||||||
|
Total
|
$ | 10,319 | $ | 9,400 | $ | 919 | $ | - | ||||||||
(1) The
market value of the assets held in the trust for the non-qualified deferred
compensation program is included as an asset and a liability of the Company as
the trust’s assets are available to the Company’s general creditors in the event
of the Company’s insolvency.
(2)
Foreign
currency derivatives in the form of forward contracts are included in accrued
expenses in the March 31, 2009 and 2010 consolidated balance sheets. Unrealized
gains and losses on derivatives classified as cash flow hedges are recorded in
other comprehensive income. Realized gains and losses on derivatives classified
as cash flow hedges and gains and losses on derivatives not designated as hedges
are recorded in other income (expense).
-55-
The
following table presents additional information about Level 3 assets measured at
fair value on a recurring basis for the fiscal years ended March 31, 2009 and
March 31, 2010.
|
Available-for-sale
marketable securities
|
||||||||
|
Year
Ended March 31,
|
||||||||
|
2009
|
2010
|
|||||||
|
Balance,
beginning of period
|
$ | 14,364 | $ | 7,098 | ||||
|
Net
realized and unrealized gains (losses) included in
earnings
|
(2,672 | ) | (323 | ) | ||||
|
Net
unrealized gains (losses) included in comprehensive income
|
(1,342 | ) | 756 | |||||
|
Purchases,
issuances and settlements
|
(8,490 | ) | (4,465 | ) | ||||
|
Transfers
in and/or out of Level 3, net
|
5,238 | (2,715 | ) | |||||
|
Balance,
end of period
|
$ | 7,098 | $ | 351 | ||||
Valuation
Techniques:
The
following describes valuation techniques used to appropriately value the
Company’s available-for-sale securities and derivatives.
Investment
Securities
Assets
valued using Level 1 inputs in the table above represent assets from the
Company’s non-qualified deferred compensation program. The funds in the
non-qualified deferred compensation program are valued based on the number of
shares in the funds using a price per share traded in an active
market.
Assets
valued using Level 2 inputs in the table above represent a portfolio including
certificate of deposits, foreign bonds, corporate bonds, asset backed
obligations and mortgage-backed securities. Valuation inputs used include
benchmark yields, reported trades, broker and dealer quotes, issuer spreads,
two-sided markets, benchmark securities, bids, offers and reference
data.
Assets
valued using Level 3 inputs in the table above represent a portfolio including
corporate bonds, asset backed obligations and mortgage-backed securities.
Unobservable inputs for valuation are management’s assessments based on a third
party pricing vendor using valuation inputs described above for Level 2,
adjusted based on the best economic and industry information available in the
circumstances.
Investments
are considered to be impaired when a decline in fair value is judged to be
other-than-temporary. If the cost of an investment exceeds its fair value, among
other factors, we evaluated general market conditions, the duration and extent
to which the fair value is less than cost, and our intent and ability to hold
the investment. Once a decline in fair value is determined to be
other-than-temporary, an impairment charge is recorded and a new cost basis in
the investment is established.
Derivatives
The
Company primarily uses forward contracts, with maturities generally less than
four months, designated as cash flow hedges to protect against the foreign
currency exchange rate risks inherent in its forecasted transactions related to
purchase commitments and sales, denominated in various currencies. The Company
also uses derivatives not designated as hedging instruments to hedge foreign
currency balance sheet exposures. These derivatives are used to offset currency
changes in the fair value of the hedged assets and liabilities. Fair values for
all of the Company’s derivative financial instruments are valued by adjusting
the market spot rate by forward points, based on the date of the contract. The
spot rates and forward points used are an average rate from an actively traded
market. At March 31, 2009 and 2010, all of the Company’s forward contracts have
been designated as Level 2 measurements.
-56-
|
5.
|
Restructuring
Activities:
|
The
Company recorded restructuring charges of $18,627 and $6,914 for the fiscal
years ended March 31, 2009 and 2010, respectively. The restructuring charges
recorded in fiscal year 2009, included $16,545 for employee separations covering
approximately 2,540 production, technical, administrative, sales and support
employees in all geographic regions, and $2,082 relating to the consolidation of
passive component manufacturing and warehousing operations. These costs included
the write-down to net realizable value of equipment and
inventories. For the fiscal year ended March 31, 2010, restructuring
costs included $5,964 for employee separations covering an additional reduction
in force of approximately 322 production, technical, administrative, sales and
support employees across all geographic regions as well as the cost related to
reduction in force initiatives throughout the year. Restructuring
costs of $950 related to the consolidation of passive component
manufacturing. As of March 31, 2010, there is $1,871 remaining
in restructuring accruals that is expected to be paid by the end of fiscal
2011.
Activity
related to restructuring charges is as follows:
|
Asset
|
Other
|
|||||||||||||||
|
$(000's)
|
Workforce
|
Impairment
|
Facility
|
|||||||||||||
|
Reductions
|
Write-down
|
Closure
Costs
|
Total
|
|||||||||||||
|
Balance
at March 31, 2008
|
$ | - | $ | - | $ | - | $ | - | ||||||||
|
Charges
|
16,545 | 1,005 | 1,077 | 18,627 | ||||||||||||
|
Utilization
/ Payments
|
(11,538 | ) | (1,005 | ) | (945 | ) | (13,488 | ) | ||||||||
|
Foreign
Currency Translation
|
(191 | ) | - | (8 | ) | (199 | ) | |||||||||
|
Balance
at March 31, 2009
|
$ | 4,816 | $ | - | $ | 124 | $ | 4,940 | ||||||||
|
Charges
|
5,964 | 447 | 503 | 6,914 | ||||||||||||
|
Utilization
/ Payments / Adjustments
|
(9,247 | ) | (447 | ) | (354 | ) | (10,048 | ) | ||||||||
|
Foreign
Currency Translation
|
33 | - | 32 | 65 | ||||||||||||
|
Balance
at March 31, 2010
|
$ | 1,566 | $ | - | $ | 305 | $ | 1,871 | ||||||||
|
6.
|
Accounts
Receivable:
|
|
Accounts
receivable at March 31 consisted of:
|
2009
|
2010
|
||||||
|
Trade
|
$ | 161,563 | $ | 207,166 | ||||
|
Less:
|
||||||||
|
Allowances
for doubtful accounts
|
947 | 563 | ||||||
|
Ship
from stock and debit and stock rotation
|
12,169 | 11,964 | ||||||
|
Sales
returns and discounts
|
6,922 | 6,681 | ||||||
|
Total
allowances
|
20,038 | 19,208 | ||||||
| $ | 141,525 | $ | 187,958 | |||||
-57-
Charges
related to allowances for doubtful accounts are charged to selling, general and
administrative expenses. Charges related to sales returns and
discounts and distributor sales programs are reported as deductions from
revenue.
|
2008
|
2009
|
2010
|
||||||||||
|
Allowances
for doubtful accounts:
|
||||||||||||
|
Beginning
Balance
|
$ | 1,705 | $ | 1,303 | $ | 947 | ||||||
|
Charges
|
(402 | ) | (276 | ) | (196 | ) | ||||||
|
Applications
|
(15 | ) | (47 | ) | (199 | ) | ||||||
|
Translation
and other
|
15 | (33 | ) | 11 | ||||||||
|
Ending
Balance
|
$ | 1,303 | $ | 947 | $ | 563 | ||||||
|
Ship
from stock and debit and stock rotation:
|
||||||||||||
|
Beginning
Balance
|
$ | 11,918 | $ | 12,941 | $ | 12,169 | ||||||
|
Charges
|
42,979 | 38,459 | 29,544 | |||||||||
|
Applications
|
(41,977 | ) | (39,096 | ) | (29,749 | ) | ||||||
|
Translation
and other
|
21 | (135 | ) | 0 | ||||||||
|
Ending
Balance
|
$ | 12,941 | $ | 12,169 | $ | 11,964 | ||||||
|
Sales
returns and discounts:
|
||||||||||||
|
Beginning
Balance
|
$ | 9,140 | $ | 9,253 | $ | 6,922 | ||||||
|
Charges
|
28,080 | 21,156 | 17,790 | |||||||||
|
Applications
|
(28,022 | ) | (22,698 | ) | (18,030 | ) | ||||||
|
Translation
and other
|
55 | (789 | ) | (1 | ) | |||||||
|
Ending
Balance
|
$ | 9,253 | $ | 6,922 | $ | 6,681 | ||||||
|
7.
|
Inventories:
|
|
Inventories
at March 31 consisted of:
|
2009
|
2010
|
||||||
|
Finished
goods
|
$ | 106,688 | $ | 92,180 | ||||
|
Work
in process
|
78,498 | 85,740 | ||||||
|
Raw
materials and supplies
|
179,817 | 179,185 | ||||||
| $ | 365,003 | $ | 357,105 | |||||
|
8.
|
Financial
Instruments and Investments in
Securities:
|
The
Company's financial instruments that are exposed to concentrations of credit
risk consist primarily of cash and cash equivalents, securities investments and
trade accounts receivable. The Company places its cash and cash
equivalents with high credit quality institutions. At times, such
investments may be in excess of the Federal Deposit Insurance Corporation
insurance limit. Concentrations of credit risk with respect to trade
accounts receivable are limited due to the large number of entities comprising
the Company's customer base and their dispersion across many different
industries and countries. As of March 31, 2010, the Company believes that
its credit risk exposure is not significant.
At March
31, 2009 and 2010 investments in debt securities and time deposits held by the
Company were classified either as available-for-sale or
held-to-maturity.
-58-
Available-for-sale
investments are recorded at fair value. On December 20, 2007, the Company
received a pro rata distribution of the underlying securities that had
previously been held in a money market investment account previously included in
cash and cash equivalents in the Company’s Consolidated Balance Sheet. These
securities are being accounted for as available-for-sale
securities. The securities are classified as either current or
long-term assets based on their underlying expected cash flows and are being
recorded at fair market value. Any unrealized holding gains and losses resulting
from these securities are reported, net of tax as a separate component of
shareholders' equity until realized. Realized gains and losses and
declines in value judged to be other than temporary, if any, are included in the
results of operations and are determined by specific identification of
securities. At the time of the pro rata distribution, a loss of $980
was charged to the results of operations for the difference between the
Company’s cost basis in the money market investment account and the
fair value of the underlying securities. During the fiscal year ended March 31,
2010, the Company has recorded other-than-temporary impairment charges of $362
to earnings and net gains of $2,530 to other comprehensive income related to
these securities. See Notes 3 and 4 for additional disclosures related to these
available-for-sale securities.
Investments
in held-to-maturity securities, recorded at amortized cost were as follows at
March 31:
|
2009
|
||||||||||||||||
|
Cost
|
Gross
Unrealized Gains
|
Gross
Unrealized Losses
|
Estimated
Fair Value
|
|||||||||||||
|
Long-term
investments:
|
||||||||||||||||
|
U.S.
government and agency securities
|
$ | 199,192 | $ | 175 | $ | (758 | ) | $ | 198,609 | |||||||
| $ | 199,192 | $ | 175 | $ | (758 | ) | $ | 198,609 | ||||||||
|
2010
|
||||||||||||||||
|
Cost
|
Gross
Unrealized Gains
|
Gross
Unrealized Losses
|
Estimated
Fair Value
|
|||||||||||||
|
Short-term
investments:
|
||||||||||||||||
|
U.S.
government and agency securities
|
$ | 40,000 | $ | 247 | $ | (25 | ) | $ | 40,222 | |||||||
|
Time
deposits
|
222,709 | - | - | 222,709 | ||||||||||||
|
Long-term
investments:
|
||||||||||||||||
|
U.S.
government and agency securities
|
219,993 | 131 | (468 | ) | 219,656 | |||||||||||
| $ | 482,702 | $ | 378 | $ | (493 | ) | $ | 482,587 | ||||||||
The
amortized cost and estimated fair value of held-to-maturity investments at March
31, 2010, by contractual maturity, are shown below. Actual maturities
may differ from contractual maturities because issuers may have the right to
call or prepay obligations without call or prepayment penalties.
|
Held-to-Maturity
|
||||||||
|
Amortized
Cost
|
Estimated
Fair Value
|
|||||||
|
Due
in one year or less
|
$ | 262,709 | $ | 262,931 | ||||
|
Due
after one year through five years
|
219,993 | 219,656 | ||||||
|
Total
|
$ | 482,702 | $ | 482,587 | ||||
-59-
|
9.
|
Income
Taxes:
|
For
financial reporting purposes, income before income taxes includes the following
components:
|
Years
Ended March 31,
|
2008
|
2009
|
2010
|
|||||||||
|
Domestic
|
$ | 68,893 | $ | 48,080 | $ | 56,826 | ||||||
|
Foreign
|
134,472 | 49,059 | 119,531 | |||||||||
| $ | 203,365 | $ | 97,139 | $ | 176,357 | |||||||
The
provision for income taxes consisted of:
|
Years
Ended March 31,
|
2008
|
2009
|
2010
|
|||||||||
|
Current:
|
||||||||||||
|
Federal/State
|
$ | 32,342 | $ | 18,254 | $ | 30,647 | ||||||
|
Foreign
|
22,010 | 7,522 | 11,271 | |||||||||
| 54,352 | 25,776 | 41,918 | ||||||||||
|
Deferred:
|
||||||||||||
|
Federal/State
|
(8,354 | ) | (6,837 | ) | (21,211 | ) | ||||||
|
Foreign
|
7,894 | (2,646 | ) | 12,792 | ||||||||
| (460 | ) | (9,483 | ) | (8,419 | ) | |||||||
| $ | 53,892 | $ | 16,293 | $ | 33,499 | |||||||
Deferred
taxes reflect the net tax effects of temporary differences between the carrying
amounts of assets and liabilities for financial reporting purposes and the
amounts used for income tax purposes. Significant components of the
Company's deferred tax assets and liabilities are as follows:
|
March
31,
|
2009
|
2010
|
||||||||||||||
|
Current:
|
Assets
|
Liabilities
|
Assets
|
Liabilities
|
||||||||||||
|
Sales
and receivable allowances
|
$ | 9,006 | $ | - | $ | 8,432 | $ | - | ||||||||
|
Inventory
reserves
|
10,302 | - | 8,850 | - | ||||||||||||
|
Accrued
expenses and other
|
20,295 | 10 | 22,509 | 105 | ||||||||||||
|
Sub
total
|
39,603 | 10 | 39,791 | 105 | ||||||||||||
|
Less
valuation allowances
|
(4,577 | ) | - | (5,023 | ) | - | ||||||||||
|
Total
Current
|
$ | 35,026 | $ | 10 | $ | 34,768 | $ | 105 | ||||||||
|
March
31,
|
2009
|
2010
|
||||||||||||||
|
Non-current:
|
Assets
|
Liabilities
|
Assets
|
Liabilities
|
||||||||||||
|
Tax
over book depreciation / amortization
|
$ | 15,814 | $ | 26,637 | $ | 19,521 | $ | 24,351 | ||||||||
|
Deduction
of foreign branch losses
|
- | 30,578 | - | 14,789 | ||||||||||||
|
Pension
obligations
|
12,237 | - | 12,156 | - | ||||||||||||
|
Other,
net
|
5,566 | 4,137 | 6,369 | 5,965 | ||||||||||||
|
Net
operating loss and tax credit carry forwards
|
103,254 | - | 86,132 | - | ||||||||||||
|
Sub
total
|
136,871 | 61,352 | 124,178 | 45,105 | ||||||||||||
|
Less
valuation allowances
|
(78,144 | ) | - | (73,906 | ) | - | ||||||||||
|
Total
Non-current
|
$ | 58,727 | $ | 61,352 | $ | 50,272 | $ | 45,105 | ||||||||
-60-
Reconciliation
between the U.S. Federal statutory income tax rate and the Company's effective
rate for income tax is as follows:
|
Years
Ended March 31,
|
|||||
|
2008
|
2009
|
2010
|
|||
|
U.S.
Federal statutory rate
|
35.0%
|
35.0%
|
35.0%
|
||
|
Increase
(decrease) in tax rate resulting from:
|
|||||
|
State
income taxes, net of federal benefit
|
1.0
|
1.3
|
0.9
|
||
|
Effect
of foreign operations
|
(8.6)
|
(8.5)
|
(8.1)
|
||
|
Change
in valuation allowance
|
0.4
|
0.3
|
(2.2)
|
||
|
Reinvestment
Allowances
|
-
|
(3.8)
|
0.0
|
||
|
Foreign
branch losses not subject to recapture
|
(3.9)
|
(8.7)
|
(9.4)
|
||
|
Other,
net
|
2.6
|
1.2
|
2.8
|
||
|
Effective
tax rate
|
26.5%
|
16.8%
|
19.0%
|
||
At March
31, 2010, certain of the Company's foreign subsidiaries in Brazil, China,
France, Germany, Israel, Taiwan and United Kingdom had tax net operating loss
carry forwards totaling approximately $249,629 of which most had no expiration
date. There is a greater likelihood of not realizing the future tax
benefits of these net operating losses and other deductible temporary
differences in Brazil, France, China and Taiwan since these losses and other
deductible temporary differences must be used to offset future taxable income of
those subsidiaries, which cannot be assured, and are not available to offset
taxable income of other subsidiaries located in those
countries. Accordingly, the Company has recorded valuation allowances
related to the net deferred tax assets in these
jurisdictions. Valuation allowances increased $251 and decreased
$4,033 during the years ended March 31, 2009 and 2010, respectively, as a result
of changes in the net operating losses of the subsidiaries in the countries
mentioned above.
The
Company has recorded deferred tax liabilities of $30,578 and $14,789 at March
31, 2009 and 2010, respectively, for temporary differences associated with
deductions for foreign branch losses claimed by the Company in its U.S. income
tax returns that are subject to U.S. recapture regulations.
The
provision for income taxes in the current fiscal year was favorably impacted by
a reduction of $16,625 of deferred tax liabilities resulting from certain of the
Company’s foreign branch losses taken as deductions for U.S. income tax purposes
no longer being subject to the U.S. income tax recapture regulations. In March
2007, the Internal Revenue Service enacted a change in the tax regulations that
reduced the U.S. income tax recapture period from 15 years to 5
years. The Company estimates a further reduction in deferred tax
liabilities of $3,582 and $3,201 over the next two fiscal years, respectively,
as the recapture period related to foreign branch losses deducted in certain
prior years expires.
At the
present time, the Company expects that cash and profits generated by foreign
subsidiaries will continue to be reinvested indefinitely. The Company
does not provide for U.S. taxes on the undistributed earnings of foreign
subsidiaries which are considered to be reinvested indefinitely. The
amount of U.S. taxes on such undistributed earnings as of March 31, 2009 and
2010 would have been $115,194 and $126,974, respectively.
Income
taxes paid totaled $58,167, $51,169 and $31,181 during the years ended March 31,
2008, 2009 and 2010, respectively.
In June
2006, new guidance was issued which addressed accounting for the uncertainty in
income taxes. The guidance clarified when tax benefits should be
recognized in the financial statements and provided criteria for measurement of
a tax position taken or expected to be taken in a tax return. The
Company recognizes the impact of a tax position, if that position is “more
likely than not” of being sustained on audit, based on the technical merits of
the position. The Company adopted the guidance effective April 1, 2007. Accruals
for estimated interest and penalties are recorded as a component of interest
expense.
The
Company does not expect that the balances with respect to its uncertain tax
positions will significantly increase or decrease within the next 12
months. For its more significant locations, the Company is subject to
income tax examinations for the year 2003 and for the years 2007 and forward in
the United States, 2007 and forward in Singapore, 2004 and forward in Hong Kong,
and 2004 and forward in the United Kingdom.
-61-
A
reconciliation of the beginning and ending balance for liabilities associated
with unrecognized tax benefit is as follows:
|
Balance
at April 1, 2007
|
$ | 4,503 | ||
|
Additions
for tax positions of prior years
|
432 | |||
|
Reductions
for tax positions of prior years
|
(428 | ) | ||
|
Balance
at March 31, 2008
|
$ | 4,507 | ||
|
Additions
for tax positions of prior years
|
2,375 | |||
|
Reductions
for tax positions of prior years
|
(1,781 | ) | ||
|
Balance
at March 31, 2009
|
$ | 5,101 | ||
|
Additions
for tax positions of prior years
|
7,554 | |||
|
Reductions
for tax positions of prior years
|
(50 | ) | ||
|
Balance
at March 31, 2010
|
$ | 12,605 |
The
Company recognizes interest and penalties related to unrecognized tax benefits
in interest expense. As of March 31, 2009 and 2010, the Company had
accrued interest and penalties related to unrecognized tax benefits of $431 and
$534, respectively. During the year ended March 31, 2009 and 2010, the Company
recognized $139 and $103, respectively, in interest and penalties.
The
amount of unrecognized tax benefits recorded on the Company’s balance sheet that
if recognized would affect the effective tax rate, is approximately $5,101 and
$12,605 at March 31, 2009 and 2010, respectively. This amount
excludes the accrual for estimated interest and penalties discussed
above.
|
10.
|
Employee
Retirement Plans:
|
Pension
Plans:
The
Company sponsors various defined benefit pension plans covering certain
employees. Pension benefits provided to certain U.S. employees
covered under collective bargaining agreements are based on a flat benefit
formula. Effective December 31, 1995, the Company froze benefit
accruals under its domestic non-contributory defined benefit pension plan for a
significant portion of the employees covered under collective bargaining
agreements. The Company's pension plans for certain international
employees provide for benefits based on a percentage of final
pay. The Company's funding policy is to contribute amounts sufficient
to meet minimum funding requirements as set forth in employee benefit and tax
laws.
The
Company recognizes the overfunded or underfunded status of its defined benefit
postretirement plans as an asset or liability in its statement of financial
position and to recognize changes in that funded status in the year in which the
changes occur through comprehensive income. The Company’s adjustment to its
pension liability due to the change in the funded status of its plans was to
increase recorded pension liabilities by $4,471 during the fiscal year ended
March 31, 2009, and to increase recorded pension liabilities by $1,696 during
the fiscal year ended March 31, 2010.
As of
March 31, 2009, the Company changed the measurement date for all plans from
December 31 to March 31. As a result of the adoption of the new guidance on
April 1, 2008, the Company recognized adjustments of $680 and $278 to beginning
retained earnings and to other comprehensive income, respectively.
-62-
The
change in the benefit obligation and plan assets of the U.S. and international
defined benefit plans for 2009 and 2010 were as follows:
|
Years
Ended March 31,
|
||||||||||||||||
|
U.S.
Plans
|
International
Plans
|
|||||||||||||||
|
2009
|
2010
|
2009
|
2010
|
|||||||||||||
|
Change
in benefit obligation:
|
||||||||||||||||
|
Benefit
obligation at beginning of year
|
$ | 29,244 | $ | 26,895 | $ | 135,522 | $ | 87,834 | ||||||||
|
Service
cost
|
554 | 383 | 862 | 463 | ||||||||||||
|
Interest
cost
|
2,257 | 1,839 | 6,916 | 5,902 | ||||||||||||
|
Plan
participants' contributions
|
- | - | 409 | 265 | ||||||||||||
|
Actuarial
gain/(loss)
|
(2,967 | ) | 4,114 | (13,235 | ) | 22,459 | ||||||||||
|
Benefits
paid
|
(2,193 | ) | (1,891 | ) | (5,374 | ) | (5,732 | ) | ||||||||
|
Curtailment
|
- | - | - | (547 | ) | |||||||||||
|
Foreign
currency exchange rate changes
|
- | - | (37,266 | ) | 3,671 | |||||||||||
|
Benefit
obligation at end of year
|
$ | 26,895 | $ | 31,340 | $ | 87,834 | $ | 114,315 | ||||||||
|
Change
in plan assets:
|
||||||||||||||||
|
Fair
value of plan assets at beginning of year
|
$ | 27,691 | $ | 19,939 | $ | 110,755 | $ | 63,999 | ||||||||
|
Actual
return on assets
|
(6,330 | ) | 6,957 | (15,475 | ) | 19,019 | ||||||||||
|
Employer
contributions
|
771 | 1,867 | 5,132 | 5,903 | ||||||||||||
|
Plan
participants' contributions
|
- | - | 409 | 265 | ||||||||||||
|
Benefits
paid
|
(2,193 | ) | (1,891 | ) | (5,374 | ) | (5,732 | ) | ||||||||
|
Foreign
currency exchange rate changes
|
- | - | (31,448 | ) | 2,842 | |||||||||||
|
Fair
value of plan assets at end of year
|
19,939 | 26,872 | 63,999 | 86,296 | ||||||||||||
|
Funded
status
|
$ | (6,956 | ) | $ | (4,468 | ) | $ | (23,835 | ) | $ | (28,019 | ) | ||||
The
accumulated benefit obligation at March 31, 2009 and 2010 was $113,041 and
$144,720, respectively.
At March
31, 2010, the accumulated benefit obligation exceeds the fair value of the
assets for all of the U.S. and international defined benefit plans.
The
Company's assumptions used in determining the pension assets and liabilities
were as follows:
|
March
31,
|
||||
|
2009
|
2010
|
|||
|
Assumptions:
|
||||
|
Discount
rates
|
6.00
- 7.25%
|
5.05
- 5.75%
|
||
|
Increase
in compensation
|
4.00%
|
4.25%
|
||
The
following table shows changes in accumulated comprehensive income, excluding the
effect of income taxes, related to amounts recognized in other comprehensive
income during fiscal 2010 and amounts reclassified to the statement of
operations as a component of net periodic pension cost during fiscal
2010.
|
Years
Ended March 31,
|
||||||||||||||||
|
U.S.
Plans
|
International
Plans
|
|||||||||||||||
|
2009
|
2010
|
2009
|
2010
|
|||||||||||||
|
Beginning
balance
|
$ | 4,741 | $ | 10,409 | $ | 26,459 | $ | 26,760 | ||||||||
|
Net
(gain) loss incurred during the year
|
5,885 | (1,333 | ) | 8,417 | 8,059 | |||||||||||
|
Amortization
of net loss
|
(196 | ) | (581 | ) | (814 | ) | (1,448 | ) | ||||||||
|
Amortization
of prior service cost
|
(21 | ) | (10 | ) | - | - | ||||||||||
|
Exchange
|
- | - | (7,302 | ) | 464 | |||||||||||
| $ | 10,409 | $ | 8,485 | $ | 26,760 | $ | 33,835 | |||||||||
-63-
Amounts
that have not yet been recognized as components of net periodic pension cost (as
a component of accumulated comprehensive income at March 31, 2010) are as
follows:
|
Years
Ended March 31,
|
||||||||||||||||
|
U.S.
Plans
|
International
Plans
|
|||||||||||||||
|
2009 (1)
|
2010
(2)
|
2009 (1)
|
2010
(2)
|
|||||||||||||
|
Unrecognized
net actuarial loss
|
$ | 6,482 | $ | 5,294 | $ | 19,267 | $ | 24,361 | ||||||||
|
Unamortized
prior service cost
|
24 | 9 | - | - | ||||||||||||
| $ | 6,506 | $ | 5,303 | $ | 19,267 | $ | 24,361 | |||||||||
(1)
Amounts in the above table as of March 31, 2009 are net of $3,903 and $7,493 of
tax benefit for the U.S. Plans and for the International Plans,
respectively.
(2)
Amounts in the above table as of March 31, 2010 are net of $3,182 and $9,474 tax
benefit for the U.S. Plans and for the International Plans,
respectively.
The March
31, 2010 balance of unrecognized net actuarial losses expected to be amortized
in fiscal 2011 is $471 for the U.S. Plans and $1,648 for the International
Plans, respectively. The March 31, 2010 balance of unamortized prior
service cost expected to be amortized in fiscal 2011 is $10 for the U.S.
Plans.
Net
pension cost related to these pension plans includes the following
components:
|
Years
Ended March 31,
|
||||||||||||
|
2008
|
2009
|
2010
|
||||||||||
|
Service
cost
|
$ | 2,164 | $ | 1,263 | $ | 876 | ||||||
|
Interest
cost
|
8,387 | 8,390 | 8,119 | |||||||||
|
Expected
return on plan assets
|
(8,458 | ) | (8,196 | ) | (6,130 | ) | ||||||
|
Amortization
of prior service cost
|
42 | 16 | 10 | |||||||||
|
Recognized
actuarial loss
|
1,800 | 971 | 2,029 | |||||||||
|
Net
periodic pension cost
|
$ | 3,935 | $ | 2,444 | $ | 4,904 | ||||||
The
Company's assumptions used in determining the net periodic pension expense were
as follows:
|
March
31,
|
||||||
|
2008
|
2009
|
2010
|
||||
|
Assumptions:
|
||||||
|
Discount
rates
|
4.50-5.80%
|
5.50-6.25%
|
5.20
- 7.25%
|
|||
|
Increase
in compensation
|
3.90%
|
3.90%
|
4.00%
|
|||
|
Expected
long-term rate of return on plan assets
|
6.60-7.50%
|
6.60-7.50%
|
6.50
- 7.50%
|
|||
The
pension expense is calculated based upon a number of actuarial assumptions
established annually for each plan year, detailed in the table above including
discount rate, rate of increase in future compensation levels and expected
long-term rate of return on plan assets. To determine the discount rate, the
Company applies the expected cash flows from each individual pension plan to
specific yield curves at the plan’s measurement date and determines a level
equivalent yield that may be unique to each plan. On that basis, the range of
discount rates increased 1% from March 31, 2009 to March 31,
2010.
-64-
The fair
value of pension assets at March 31, 2010 was determined using:
|
Based
on
|
||||||||||||||||
|
Fair
Value at March 31, 2010
|
Quoted
prices in active markets
(Level
1)
|
Other
observable inputs
(Level
2)
|
Unobservable
inputs
(Level
3)
|
|||||||||||||
|
Assets
measured at fair value on a recurring basis:
|
||||||||||||||||
|
U.S.
Defined Benefit Plan Assets:
|
||||||||||||||||
|
Pooled
Separate Accounts
|
$ | 25,456 | $ | - | $ | 25,456 | $ | - | ||||||||
|
Guaranteed
Deposit Account
|
1,404 | - | 1,404 | - | ||||||||||||
|
International
Defined Benefit Plan Assets:
|
||||||||||||||||
|
Cash
|
507 | 507 | - | - | ||||||||||||
|
Pooled
Separate Accounts
|
85,324 | - | 85,324 | - | ||||||||||||
|
Total
|
$ | 112,691 | $ | 507 | $ | 112,184 | $ | - | ||||||||
Assets
valued using Level 1 inputs in the table above are cash.
Assets
valued using Level 2 inputs in the table above are investments held in pooled
separate accounts and a guaranteed deposit account. See discussion in
the “Valuation of Investment” section below.
Valuation
of Investments
The
investments are held in Pooled Separate Accounts and a Guaranteed Deposit
Account. Investments held in the Pooled Separate Accounts are based on
the fair value of the underlying securities within the fund, which represent the
net asset value, a practical expedient to fair value, of the units held by the
pension plan at year-end. Those assets held in the Guaranteed
Deposit Account are valued at the contract value of the account which
approximates fair value. The contract value represents contributions
plus accumulated interest at the contract rate, less benefits paid to
participants, contract administration fees and other direct
expenses.
The
expected long-term rate of return on plan assets assumption is based upon actual
historical returns and future expectations for returns for each asset
class. These expected results were adjusted for payment of reasonable
expenses from plan assets. The Company's long-term strategy is for
target allocation of 40% equity and 60% fixed income for its U.S. defined
benefit plans and 60% equity and 40% fixed income for its international defined
benefit plans.
The
Company's pension plans' weighted average asset allocations at March 31, 2009
and 2010, by asset category are as follows:
|
March
31, 2009
|
March
31, 2010
|
|||||||
|
Asset
Category
|
U.S.
Plans
|
International
Plans
|
U.S.
Plans
|
International
Plans
|
||||
|
Equity
securities
|
49%
|
50%
|
53%
|
50%
|
||||
|
Debt
securities
|
45%
|
50%
|
42%
|
50%
|
||||
|
Other
|
6%
|
0%
|
5%
|
0%
|
||||
|
Total
|
100%
|
100%
|
100%
|
100%
|
||||
-65-
The
Company makes contributions to its defined benefit plans as required under
various pension funding regulations. Accordingly, the Company expects
to make contributions of approximately $7,282 to the international plans and
$1,133 to the U.S. plans in fiscal 2011 based on current actuarial
computations.
Estimated
future benefit payments are as follows:
|
Years
ended March 31,
|
U.S.
Plans
|
International
Plans
|
||||
|
2011
|
$ | 1,549 | $ | 4,279 | ||
|
2012
|
1,567 | 4,536 | ||||
|
2013
|
1,680 | 4,808 | ||||
|
2014
|
1,763 | 5,097 | ||||
|
2015
|
1,887 | 5,386 | ||||
| 2016-2020 | 10,366 | 32,211 | ||||
Savings
Plans:
The
Company sponsors retirement savings plans, which allow eligible employees to
defer part of their annual compensation. Certain contributions by the
Company are discretionary and are determined by the Company's Board of Directors
each year. The Company's contributions to the savings plans in the
United States and Europe for the fiscal years ended March 31, 2008, 2009 and
2010 were approximately $6,406, $6,537 and $5,836, respectively.
In
addition, the Company sponsors a nonqualified deferred compensation program,
which permits certain employees to annually elect to defer a portion of their
compensation until retirement. A portion of the deferral is subject
to a matching contribution by the Company. The employees select among
various investment alternatives, which are the same as available under the
retirement savings plans, with the investments held in a separate
trust. The value of the participant's balance fluctuates based on the
performance of the investments. The market value of the trust at
March 31, 2009 and 2010 of $7,265 and $9,400, respectively, is included as an
asset and a liability of the Company in the accompanying balance sheet because
the trust’s assets are available to the Company's general creditors in the event
of the Company's insolvency.
|
11.
|
Stock
Based Compensation:
|
The
Company has four fixed stock option plans. Under the 1995 Stock
Option Plan, as amended, the Company could grant options to employees for the
purchase of up to an aggregate of 9,300 shares of common stock. Under
the Non-Employee Directors' Stock Option Plan, as amended, the Company could
grant options for the purchase of up to an aggregate of 650 shares of common
stock. No awards were made under these two plans after August 1,
2005. Under the 2004 Stock Option Plan, as amended, the Company may
grant options to employees for the purchase of up to an aggregate of 10,000
shares of common stock. Under the 2004 Non-Employee Directors' Stock
Option Plan, as amended, the Company may grant options for the purchase of up to
an aggregate of 1,000 shares of common stock. Under all plans, the
exercise price of each option shall not be less than the market price of the
Company's stock on the date of grant and an option's maximum term is 10
years. Options granted under the 1995 Stock Option Plan and the 2004
Stock Option Plan vest as to 25% annually and options granted under the
Non-Employee Directors' Stock Option Plan and the 2004 Non-Employee Directors'
Stock Option Plan vest as to one third annually. Requisite service
periods related to all plans begin on the grant date. The number of
shares of common stock available for future issuance under all of the plans,
consisting of options available to be granted and options currently outstanding,
was 13,846 as of March 31, 2010.
-66-
Activity
under the Company’s stock option plans is summarized as follows:
|
Number
of Shares
|
Average
Price (a)
|
Average
Life (years) (b)
|
Aggregated
Intrinsic Value (c)
|
|||||||||||||
|
Outstanding
at March 31, 2009
|
4,450 | $ | 16.31 | |||||||||||||
|
Options
granted
|
530 | 9.71 | ||||||||||||||
|
Options
exercised
|
(12 | ) | 11.33 | $ | 23 | |||||||||||
|
Options
cancelled/forfeited
|
(90 | ) | 16.13 | |||||||||||||
|
Outstanding
at March 31, 2010
|
4,878 | $ | 15.61 | 4.67 | $ | - | ||||||||||
|
Exercisable
at March 31, 2010
|
3,623 | $ | 16.60 | 3.45 | $ | - | ||||||||||
|
(a)
|
Weighted-average
exercise price
|
|
(b)
|
Weighted-average
contractual life remaining
|
|
(c)
|
Options
outstanding and exercisable at March 31, 2010 have a negative aggregated
intrinsic value
|
The total
aggregate intrinsic value of options exercised is $3,291, $875 and $23 for
fiscal years ended March 31, 2008, 2009 and 2010, respectively.
Unvested
share activity under the Company’s stock options plans for March 31, 2010 is
summarized as follows:
|
Number
of Shares
|
Weighted
Average Grant-Date Fair Value
|
|||||||
|
Unvested
balance at March 31, 2009
|
1,245 | $ | 4.69 | |||||
|
Options
granted
|
530 | 2.18 | ||||||
|
Options
forfeited
|
(22 | ) | 4.35 | |||||
|
Options
vested
|
(498 | ) | 5.53 | |||||
|
Unvested
balance at March 31, 2010
|
1,255 | $ | 2.65 | |||||
The total
unrecognized compensation costs related to unvested awards expected to be
recognized over the vesting period, approximately four years, was $3,242 and
$2,270 as of March 31, 2009 and 2010, respectively. The total aggregate fair
value of options vested is $3,084, $4,681 and $2,752 for fiscal years ended
March 31, 2008, 2009 and 2010, respectively.
The
weighted average estimated fair value of the Company’s stock options granted at
grant date market prices was $5.63, $3.48 and $2.18 per option during fiscal
years ended March 31, 2008, 2009 and 2010, respectively. The
condensed consolidated statement of operations includes $1,710, net of $330 of
tax benefit, in stock-based compensation expense for fiscal 2010.
The
Company’s weighted average fair value is estimated at the date of grant using a
Black-Scholes-Merton option-pricing model. The Company estimated
volatility by considering the Company’s historical stock
volatility. The Company calculated the dividend yield based on
historical dividends paid. The Company has estimated forfeitures in
determining the weighted average fair value calculation. The
forfeiture rate used for the fiscal year ended March 31, 2010 was
6.8%. The following are significant weighted average assumptions used
for estimating the fair value of options issued under the Company’s stock option
plans:
|
2008
|
2009
|
2010
|
||||
|
Grants
|
Grants
|
Grants
|
||||
|
Expected
life (years)
|
5
|
5
|
5
|
|||
|
Interest
rate
|
4.53%
|
3.22%
|
2.41%
|
|||
|
Volatility
|
32.51%
|
28.46%
|
26.60%
|
|||
|
Dividend
yield
|
0.88%
|
1.24%
|
1.65%
|
-67-
Options
exercised under the Company’s stock option plans are issued from the Company’s
treasury shares. As of March 31, 2010, the Company has 7,563 shares
that may yet be purchased under repurchase programs authorized by the Board of
Directors. The Company purchased 1,124 shares at a cost of $11,422
during fiscal 2009 and 322 shares at a cost of $3,736 during fiscal 2010 which
are held as treasury stock and available for general corporate
purposes.
|
12.
|
Commitments
and Contingencies:
|
The
Company is a lessee under long-term operating leases primarily for office space,
plant and equipment. Future minimum lease commitments under
non-cancelable operating leases as of March 31, 2010, were as
follows:
|
Years
ended March 31,
|
||||
|
2011
|
$ | 6,555 | ||
|
2012
|
4,744 | |||
|
2013
|
3,236 | |||
|
2014
|
2,763 | |||
|
2015
|
811 | |||
|
Thereafter
|
1,655 | |||
Rental
expense for operating leases was $9,055, $9,341 and $7,412 for the fiscal years
ended March 31, 2008, 2009 and 2010, respectively.
The
Company is involved in disputes, warranty, and legal proceedings arising in the
normal course of business. While the Company cannot predict the
outcome of these disputes and proceedings, management believes, based upon a
review with legal counsel, that none of these proceedings will have a material
impact on our financial position, results of operations, or cash flows. However,
the Company cannot be certain of the eventual outcome and any adverse results in
these or other matters that may arise from time to time may harm its financial
position, results of operations, or cash flows.
From time
to time the Company enters into delivery contracts with selected suppliers for
certain metals used in our production processes. The delivery
contracts represent routine purchase orders for delivery within three months and
payment is due upon receipt. As of March 31, 2010, the Company had no
significant outstanding purchase commitments.
On
October 19, 2009, the Company and Cabot Corporation announced the favorable
resolution of all outstanding litigation between the parties relating to the
supply of tantalum by Cabot to AVX. As a result, the Company recorded
a $5,000 reduction to cost of sales during the quarter ended December 31,
2009.
The
Company has been identified by the United States Environmental Protection Agency
("EPA"), state governmental agencies or other private parties as a potentially
responsible party ("PRP") under the Comprehensive Environmental Response,
Compensation and Liability Act ("CERCLA") or equivalent state or local laws for
clean-up and response costs associated with seven sites at which remediation is
required. Because CERCLA has been construed to authorize joint and
several liability, the EPA could seek to recover all clean-up costs from any one
of the PRPs at a site despite the involvement of other PRPs. At two
of the seven sites, financially responsible PRPs other than AVX also are, or
have been, involved in site investigation and clean-up
activities. The Company believes that any liability resulting from
these sites will be apportioned between AVX and other PRPs.
To
resolve the Company’s liability at each of the sites at which it has been named
a PRP, the Company has entered into various administrative orders and consent
decrees with federal and state regulatory agencies governing the timing and
nature of investigation and remediation. The Company has paid, or
reserved for, all estimated amounts required under the terms of these orders and
decrees corresponding to its apportioned share of the liabilities. As
is customary, the orders and decrees regarding sites where the PRPs are not
themselves implementing the chosen remedy contain provisions allowing the EPA to
reopen the agreement and seek additional amounts from settling PRPs in the event
that certain contingencies occur, such as the discovery of significant new
information about site conditions during clean-up or substantial cost overruns
for the chosen remedy. The existence of these reopener provisions,
combined with the difficulties of reliably estimating clean-up costs and the
joint and several nature of CERCLA liability, makes it difficult to predict the
ultimate liability at any site with certainty.
-68-
In July
2007, the Company received oral notification from the EPA, and in December 2007,
written notification from the U.S. Department of Justice indicating that the
United States is preparing to exercise the reopener provision under a 1991
consent decree relating to the environmental conditions at, and remediation of,
New Bedford Harbor in the Commonwealth of Massachusetts. In 1991, in
connection with that consent decree, the Company paid $66,000, plus interest,
toward the environmental conditions at, and remediation of, the harbor in
settlement with the EPA and the Commonwealth of Massachusetts, subject to
reopener provisions, including a reopener if certain remediation costs for the
site exceed $130,500. The EPA has indicated that remediation costs
through December 6, 2007 (which remediation is ongoing) are approximately
$318,500. The Company has not yet completed an investigation of the monies spent
or available defenses in light of the notification. The Company has also not yet
determined whether or to what extent other parties may bear responsibility for
these costs. On April 1, 2008, the EPA indicated that the future work
to be performed at the harbor is expected to exceed hundreds of millions of
dollars under current estimates. The Company anticipates further
discussions with the U.S. Department of Justice, the EPA, and the Commonwealth
of Massachusetts. The Company is investigating the claim as well as potential
defenses and other actions, including the engagement of environmental
engineering consultants to study and analyze documentation to be made available
by the EPA with respect to the site. The potential impact of this
matter on the Company’s financial position, results of operations and cash flows
cannot be determined at this time.
On June
2, 2006, the Company received a “Confirmation of Potential Liability; Demand and
Notice of Decision Not to Use Special Notice Procedures” dated May 31, 2006 from
the EPA with regard to $1,600 (subsequently reduced to $900) of past costs, as
well as future costs for environmental remediation, related to the purported
release of hazardous substances at an abandoned facility referred to as the
“Aerovox Facility” (the “Facility”), located at 740 Belleville Avenue, New
Bedford, Massachusetts. Aerovox Corporation, a predecessor of AVX, sold this
Facility to an unrelated third party in 1973. A subsequent unrelated owner,
Aerovox Inc., the last manufacturer to own and operate in the Facility, filed
for bankruptcy in 2001 and abandoned the Facility. The Company
has had numerous meetings with the EPA, the Massachusetts Department of
Environmental Protection and the City of New Bedford regarding the potential
environmental remediation of the Facility and the assignment of responsibility
among the parties. A tentative agreement between EPA, the City of New
Bedford, and AVX is now in place setting forth the nature of the remedy, the
allocation of financial responsibility, and the schedule for
remediation. However, based on such ongoing discussions and draft
document exchanges regarding remediation alternatives and having performed our
own estimates of remediation costs, the Company accrued $18,200 in the quarter
ended March 31, 2009 (which amount is included in the $19,698 reserved as of
March 31, 2010 for potential CERCLA liability as disclosed below) as an estimate
of the potential liability related to performance of certain environmental
remediation actions at the Facility. This accrual assumes the
anticipated performance of certain remedial actions by the other parties. The
accrual represents the estimate of the Company’s costs to remediate; however,
until all parties agree and remediation is complete, the Company can not be
certain there will be no additional costs.
Recently,
AVX was named as a third party defendant in a case filed in Massachusetts
Superior Court captioned DaRosa v. City of New
Bedford. This case relates to a former disposal site in the
City of New Bedford located at Parker Street. The City asserts that
AVX, inter alia, contributed to that site. We intend to defend
vigorously the claims that have been asserted in this lawsuit. At this early
stage of the litigation, there has not been a determination as to responsible
parties or the amount, if any, of damages. Accordingly, the potential impact of
the case on our financial position, results of operations, and cash flows cannot
be determined at this time.
-69-
In
September 2007, the Company received notice from Horry Land Company, the owner
of property adjacent to the Company’s South Carolina factory, that Horry Land
Company’s property value had been negatively impacted by alleged migration of
certain pollutants from the Company’s property and demanding $5,400 in
compensatory damages, exclusive of costs that have not been
determined. The Company investigated the allegations and determined
that the demanded payment was not justified and that issues of liability, among
other issues, exist under environmental laws. As a result, in October
2007, the Company filed a declaratory judgment action in United States District
Court for the District of South Carolina under the CERCLA and the Federal
Declaratory Judgment Act, seeking a declaration that the Company is not liable
for the property damages claimed by Horry Land Company and for a determination
and allocation of past and future environmental response costs. Horry
Land Company has asserted its claims in this suit and it is now proceeding. In
addition, two other suits have been filed against the Company relating to the
same contamination. One suit was filed in the South Carolina State Court on
November 27, 2007 by certain individuals seeking certification as a class action
which has not yet been determined. The other suit is a commercial
suit filed on January 16, 2008 in South Carolina State Court by John H. Nance
and JDS Development of Myrtle Beach, Inc. Both of these suits are pending in
South Carolina state court. AVX has also sought to join the United
States Air Force as a potentially responsible party. The Company intends to
defend vigorously the claims that have been asserted in the three related
lawsuits. At this early stage of the litigation, there has not been a
determination as to responsible parties or the amount, if any, of damages. With
respect to the related environmental assessment, the Company is in the process
of a feasibility study to evaluate possible remedies and at this stage have not
been able to determine what measures may have to be undertaken or the likely
costs of any such measures. Accordingly, the potential impact of either the
lawsuits or the remediation on the Company’s financial position, results of
operations, and cash flows cannot be determined at this time.
The Company currently has reserved approximately $19,698 at March
31, 2010 and $19,879 at March 31, 2009 related to these
matters. Except for the matters discussed above, while no assurance
can be given, the Company does not believe that any additional costs to be
incurred by AVX at any of the sites will have a material adverse effect on its
financial condition, results of operations or cash flows.
The
Company also operates on sites that may have potential future environmental
issues as a result of activities at sites during AVX’s long history of
manufacturing operations or prior to the start of operations by
AVX. Even though the Company may have rights of indemnity for such
environmental matters at certain sites, regulatory agencies in those
jurisdictions may require the Company to address such issues. Once it
becomes probable that the Company will incur costs in connection with
remediation of a site and such costs can be reasonably estimated, the Company
establishes reserves or adjusts reserves for the projected share of these
costs. A separate account receivable is recorded for any indemnified
costs.
The
Company has an employment agreement with its Chief Executive Officer which
provides for salary continuance equivalent to his most recent base salary as a
full-time employee during a two-year advisory period upon retirement from the
Company.
|
13.
|
Derivative
Financial Instruments:
|
The
Company is exposed to foreign currency exchange rate fluctuations in the normal
course of business. The Company uses derivative instruments (forward
contracts) to hedge certain foreign currency exposures as part of the risk
management strategy. The objective is to offset gains and losses
resulting from these exposures with gains and losses on the forward contracts
used to hedge them, thereby reducing volatility of earnings or protecting fair
values of assets and liabilities. The Company does not enter into any
trading or speculative positions with regard to derivative
instruments.
The
Company primarily uses forward contracts, with maturities less than four months,
designated as cash flow hedges to protect against the foreign currency exchange
rate risks inherent in its forecasted transactions related to purchase
commitments and sales, denominated in various currencies. These
derivative instruments are designated and qualify as cash flow
hedges.
-70-
The
effectiveness of the cash flow hedges is determined by comparing the cumulative
change in the fair value of the hedge contract with the cumulative change in the
fair value of the hedged transaction, both of which are based on forward rates.
The effective portion of the gain or loss on these cash flow hedges is initially
recorded in accumulated other comprehensive income as a separate component of
stockholders' equity. Once the hedged transaction is recognized, the
gain or loss is recognized in the Company’s statement of operations. At March
31, 2009 and 2010, respectively, the Company had the following forward contracts
that were entered into to hedge against the volatility of foreign currency
exchange rates for certain forecasted sales and purchases.
March 31, 2009
|
Fair
Value of Derivative Instruments
|
||||||||||
|
Asset
Derivatives
|
Liability
Derivatives
|
|||||||||
|
Balance
|
Balance
|
|||||||||
|
Sheet
|
Fair
|
Sheet
|
Fair
|
|||||||
|
Caption
|
Value
|
Caption
|
Value
|
|||||||
|
Foreign
exchange contracts
|
Prepaid
and other
|
$ | 1,355 |
Accrued
expenses
|
$ | 2,701 | ||||
March 31,
2010
|
Fair
Value of Derivative Instruments
|
||||||||||
|
Asset
Derivatives
|
Liability
Derivatives
|
|||||||||
|
Balance
|
Balance
|
|||||||||
|
Sheet
|
Fair
|
Sheet
|
Fair
|
|||||||
|
Caption
|
Value
|
Caption
|
Value
|
|||||||
|
Foreign
exchange contracts
|
Prepaid
and other
|
$ | 856 |
Accrued
expenses
|
$ | 1,795 | ||||
For these
derivatives designated as hedging instruments, during fiscal 2009 and 2010, a
net pretax loss of $9,120 and a pretax gain of $3,555, respectively, was
recognized in other comprehensive income. In addition, during fiscal 2009 and
2010 a net pretax gain of $13,685 and $3,914, respectively, was reclassified
from accumulated other comprehensive income into cost of sales (for hedging
purchases), and a net pre tax loss of $21,102 and $521, respectively, was
reclassified from accumulated other comprehensive income into sales (for hedging
sales) in the accompanying Statement of Operations. In addition, as a result of
not realizing the forecasted sales purchases volume related to some forward
contracts at the time of their maturity, during fiscal 2009 and 2010, the
Company recognized a net pretax gain of $3,290 and a pretax loss of $245,
respectively, related to ineffective hedge contracts in other expense in the
accompanying Statement of Operations. During fiscal 2008, 2009 or 2010, other
than the ineffective contracts previously discussed, the Company did not
discontinue any cash flow hedges for which it was probable that a forecasted
transaction would not occur.
Derivatives
not designated as hedging instruments consist primarily of forwards used to
hedge foreign currency balance sheet exposures representing hedging instruments
used to offset foreign currency changes in the fair values of the underlying
assets and liabilities. The gains and losses on these foreign currency forward
contracts are recognized in other income and expense in the same period as the
remeasurement gain and loss of the related foreign currency denominated assets
and liabilities and thus naturally offset these gains and losses. At March 31,
2009 and 2010, the Company had the following forward contracts that were entered
into to hedge against these exposures.
-71-
March 31,
2009
|
Fair
Value of Derivative Instruments
|
||||||||||
|
Asset
Derivatives
|
Liability
Derivatives
|
|||||||||
|
Balance
|
Balance
|
|||||||||
|
Sheet
|
Fair
|
Sheet
|
Fair
|
|||||||
|
Caption
|
Value
|
Caption
|
Value
|
|||||||
|
Foreign
exchange contracts
|
Prepaid
and other
|
$ | 518 |
Accrued
expenses
|
$ | 1,232 | ||||
March 31,
2010
|
Fair
Value of Derivative Instruments
|
||||||||||
|
Asset
Derivatives
|
Liability
Derivatives
|
|||||||||
|
Balance
|
Balance
|
|||||||||
|
Sheet
|
Fair
|
Sheet
|
Fair
|
|||||||
|
Caption
|
Value
|
Caption
|
Value
|
|||||||
|
Foreign
exchange contracts
|
Prepaid
and other
|
$ | 61 |
Accrued
expenses
|
$ | 41 | ||||
For these
derivatives not designated as hedging instruments during fiscal 2009 and 2010, a
loss of $72,146 and a gain of $408, respectively, was recognized in other
expense which substantially offset the approximately $75,000 in exchange gains
and $1,100 in exchange losses, respectively, that was recognized in other income
in the accompanying Statement of Operations.
At March
31, 2009 and 2010, the Company had outstanding foreign exchange contracts with
notional amounts totaling $332,351 and $219,687, respectively.
|
14.
|
Transactions
With Affiliate:
|
The
Company's business includes certain transactions with its parent company,
Kyocera, that are governed by agreements between the parties that define the
sales terms, including pricing for the products. The nature and amounts of
transactions with Kyocera are included in the table below.
|
Years
Ended March 31,
|
||||||||||||
|
2008
|
2009
|
2010
|
||||||||||
|
Sales:
|
||||||||||||
|
Product
and equipment sales to affiliates
|
$ | 30,755 | $ | 16,790 | $ | 26,985 | ||||||
|
Subcontracting
activities
|
1,080 | 287 | - | |||||||||
|
Purchases:
|
||||||||||||
|
Purchases
of resale inventories, raw materials,
supplies,
equipment and services
|
517,185 | 389,639 | 287,531 | |||||||||
|
Other:
|
||||||||||||
|
Dividends
paid
|
19,488 | 19,488 | 19,488 | |||||||||
-72-
|
15.
|
Segment
and Geographic Information:
|
The
Company's operating segments are based on the types of products from which the
Company generates revenues. The Company is organized into a product line
organization with five main product groups and three reportable segments:
Passive Components, KED Resale and Connectors. The product groups of
Ceramic, Advanced and Tantalum have been aggregated into the Passive Component
reportable segment in accordance with the aggregation criteria and quantitative
thresholds. The aggregation criteria consist of similar economic
characteristics, products and services, production processes, customer classes
and distribution channels. The Passive Components segment consists
primarily of surface mount and leaded ceramic capacitors, RF thick and thin film
components, tantalum capacitors, film capacitors, ceramic and film power
capacitors, super capacitors, EMI filters, thick and thin film packages,
varistors, thermistors, inductors and resistive products. The KED
Resale segment consists primarily of ceramic capacitors, frequency control
devices, SAW devices, sensor products, RF modules, actuators, acoustic devices
and connectors produced by Kyocera, and resold by AVX. The Connectors
segment consists primarily of Elco automotive, telecom and memory connectors
manufactured by AVX. Sales and operating results from these
reportable segments are shown in the tables below. In addition, the
Company has a corporate administration group consisting of finance and
administrative activities and a separate Research and Development
group.
The
Company evaluates performance of its segments based upon sales and operating
profit. There are no intersegment revenues. The Company
allocates the costs of shared resources between segments based on each segment's
usage of the shared resources. Cash, accounts receivable, investments
in securities and certain other assets, which are centrally managed, are not
readily allocable to operating segments.
The
tables below present information about reported segments for the years ended
March 31,
|
Sales
revenue (in thousands)
|
2008
|
2009
|
2010
|
|||||||||
|
Ceramic
Components
|
$ | 211,759 | $ | 165,740 | $ | 155,059 | ||||||
|
Tantalum
Components
|
312,761 | 268,326 | 280,991 | |||||||||
|
Advanced
Components
|
433,646 | 434,039 | 369,811 | |||||||||
|
Total
Passive Components
|
958,166 | 868,105 | 805,861 | |||||||||
|
KDP
and KKC Resale
|
468,186 | 354,258 | 338,701 | |||||||||
|
KEC
Resale Connectors
|
86,531 | 76,209 | 73,973 | |||||||||
|
Total
KED Resale
|
554,717 | 430,467 | 412,674 | |||||||||
|
Connectors
|
106,392 | 91,041 | 86,431 | |||||||||
|
Total
Revenue
|
$ | 1,619,275 | $ | 1,389,613 | $ | 1,304,966 | ||||||
|
2008
|
2009
|
2010
|
||||||||||
|
Operating
profit:
|
||||||||||||
|
Passive
components
|
$ | 154,816 | $ | 110,428 | $ | 175,790 | ||||||
|
KED
Resale
|
41,750 | 20,242 | 26,453 | |||||||||
|
Connectors
|
8,809 | 3,602 | 9,167 | |||||||||
|
Research
& development
|
(12,450 | ) | (11,703 | ) | (6,831 | ) | ||||||
|
Corporate
administration
|
(31,800 | ) | (45,825 | ) | (33,895 | ) | ||||||
|
Total
|
$ | 161,125 | $ | 76,744 | $ | 170,684 | ||||||
|
2008
|
2009
|
2010
|
||||||||||
|
Depreciation
and amortization:
|
||||||||||||
|
Passive
components
|
$ | 45,052 | $ | 54,262 | $ | 47,774 | ||||||
|
KED
Resale
|
742 | 809 | 453 | |||||||||
|
Connectors
|
5,964 | 5,363 | 4,397 | |||||||||
|
Research
& development
|
759 | 1,083 | 761 | |||||||||
|
Corporate
administration
|
3,029 | 4,681 | 4,788 | |||||||||
|
Total
|
$ | 55,546 | $ | 66,198 | $ | 58,173 | ||||||
-73-
|
2008
|
2009
|
2010
|
||||||||||
|
Assets:
|
||||||||||||
|
Passive
components
|
$ | 755,897 | $ | 639,993 | $ | 525,631 | ||||||
|
KED
Resale
|
48,024 | 33,299 | 38,264 | |||||||||
|
Connectors
|
55,928 | 48,808 | 39,512 | |||||||||
|
Research
& development
|
6,797 | 6,965 | 5,136 | |||||||||
|
Cash,
A/R and S/T and L/T investments
|
1,019,081 | 906,195 | 1,196,777 | |||||||||
|
Goodwill
- Passive components
|
148,736 | 151,985 | 152,124 | |||||||||
|
Goodwill
- Connectors
|
10,277 | 10,277 | 10,277 | |||||||||
|
Corporate
administration
|
64,338 | 75,007 | 83,771 | |||||||||
|
Total
|
$ | 2,109,078 | $ | 1,872,529 | $ | 2,051,492 | ||||||
|
2008
|
2009
|
2010
|
||||||||||
|
Capital
expenditures:
|
||||||||||||
|
Passive
components
|
$ | 64,178 | $ | 38,284 | $ | 26,986 | ||||||
|
KED
Resale
|
65 | 408 | 98 | |||||||||
|
Connectors
|
5,524 | 4,011 | 1,669 | |||||||||
|
Research
& development
|
1,040 | 1,347 | 89 | |||||||||
|
Corporate
administration
|
79 | 155 | 46 | |||||||||
|
Total
|
$ | 70,886 | $ | 44,205 | $ | 28,888 | ||||||
No single
customer has accounted for more than 10% of net sales in the fiscal years ended
March 31, 2008, 2009 or 2010.
The
following geographic data is based upon net sales generated by operations
located within that geographic area and long lived assets based upon physical
location.
|
Years
Ended March 31,
|
||||||||||||
|
2008
|
2009
|
2010
|
||||||||||
|
Net
sales:
|
||||||||||||
|
Americas
|
$ | 435,484 | $ | 432,549 | $ | 403,348 | ||||||
|
Europe
|
382,137 | 339,277 | 309,486 | |||||||||
|
Asia
|
801,654 | 617,787 | 592,132 | |||||||||
|
Total
|
$ | 1,619,275 | $ | 1,389,613 | $ | 1,304,966 | ||||||
|
Property,
plant and equipment, net:
|
||||||||||||
|
Americas
|
$ | 134,199 | $ | 126,246 | $ | 122,312 | ||||||
|
Europe
|
145,956 | 100,394 | 92,924 | |||||||||
|
Asia
|
36,417 | 36,747 | 31,793 | |||||||||
|
Total
|
$ | 316,572 | $ | 263,387 | $ | 247,029 | ||||||
|
16.
|
Acquisition:
|
On
September 25, 2007, the Company acquired by merger all of the outstanding
capital stock of American Technical Ceramics Corp. (“ATC’) in exchange for
$234,091, in cash, including related acquisition costs. ATC designs, develops,
manufactures and markets electronic components, including ceramic multilayer
capacitors and custom thin film circuits. ATC's products are used in a broad
range of commercial and military applications, including wireless
infrastructure, fiber optics, medical electronics, semiconductor manufacturing
equipment and satellite equipment. ATC has manufacturing facilities, research
and development and sales offices in New York, manufacturing facilities in
Florida, and sales offices in Sweden and China.
-74-
The
Company has used the purchase method of accounting to record the
acquisition. In accordance with the purchase method, the purchase
price is allocated to the assets acquired and liabilities assumed based on their
estimated fair values with the excess being allocated to goodwill. As
of September 30, 2007, the allocation of the purchase price was prepared based
on preliminary estimates of fair values. The initial estimated purchase price
allocation was revised as of March 31, 2008 resulting in an increase to goodwill
of $7,691 as reflected in the table below. The results of operations for ATC are
included in the accompanying Consolidated Statement of Operations since the
acquisition date.
|
Assets
and Liabilities Acquired
|
||||
|
Accounts
receivable
|
$ | 12,818 | ||
|
Inventory
|
29,360 | |||
|
Other
current assets and liabilities
|
11,517 | |||
|
Working
capital
|
$ | 53,695 | ||
|
Property
and equipment
|
31,825 | |||
|
Intangible
assets
|
97,440 | |||
|
Long-term
debt
|
(4,803 | ) | ||
|
Deferred
taxes
|
(29,213 | ) | ||
|
Total
identified assets and liabilities
|
$ | 148,944 | ||
|
Purchase
price
|
$ | 234,091 | ||
|
Goodwill
|
$ | 85,147 | ||
|
March
31, 2009
|
March
31, 2010
|
|||||||||||||||
|
Gross
Carrying Amount
|
Accumulated
Amortization
|
Gross
Carrying Amount
|
Accumulated
Amortization
|
|||||||||||||
|
Amortized
intangible assets
|
||||||||||||||||
|
Customer
relationships
|
$ | 51,000 | $ | (4,249 | ) | $ | 51,000 | $ | (7,082 | ) | ||||||
|
Developed
technology and other
|
12,050 | (2,215 | ) | 12,050 | (3,690 | ) | ||||||||||
|
Total
|
$ | 63,050 | $ | (6,464 | ) | $ | 63,050 | $ | (10,772 | ) | ||||||
Estimated
amortization expense for the next five years is as follows:
|
Years
ended March 31,
|
Estimated
Amortization Expense
|
|||
|
2011
|
$ | 4,299 | ||
|
2012
|
4,291 | |||
|
2013
|
4,291 | |||
|
2014
|
4,083 | |||
|
2015
|
3,553 | |||
|
Gross
Carrying Amount
|
||||||||
|
March
31, 2009
|
March
31, 2010
|
|||||||
|
Unamortized
intangible assets
|
||||||||
|
Trade
name and trademarks
|
$ | 34,000 | $ | 34,000 | ||||
|
Total
|
$ | 34,000 | $ | 34,000 | ||||
For the
Company’s segment reporting, ATC is reported in the Advanced Component product
group in the Passive Component segment. Goodwill associated with the acquisition
has been allocated to the Passive Component reporting unit.
-75-
|
17.
|
Summary
of Quarterly Financial Information
(Unaudited):
|
Quarterly
financial information for the fiscal years ended March 31, 2009 and 2010 is as
follows:
|
First
Quarter
|
Second
Quarter
|
|||||||||||||||
|
2009
|
2010
|
2009
|
2010
|
|||||||||||||
|
Net
sales
|
$ | 396,889 | $ | 292,040 | $ | 400,280 | $ | 310,522 | ||||||||
|
Gross
profit
|
62,152 | 54,142 | 63,473 | 64,736 | ||||||||||||
|
Net
income
|
31,005 | 24,280 | 27,791 | 31,642 | ||||||||||||
|
Basic
earnings per share
|
0.18 | 0.14 | 0.16 | 0.19 | ||||||||||||
|
Diluted
earnings per share
|
0.18 | 0.14 | 0.16 | 0.19 | ||||||||||||
|
Third
Quarter
|
Fourth
Quarter
|
|||||||||||||||
| 2009 | 2010 | 2009 | 2010 | |||||||||||||
|
Net
sales
|
$ | 320,617 | $ | 334,958 | $ | 271,827 | $ | 367,446 | ||||||||
|
Gross
profit
|
52,981 | 76,094 | 37,688 | 83,229 | ||||||||||||
|
Net
income
|
23,864 | 40,426 | (1,814 | ) | 46,510 | |||||||||||
|
Basic
earnings per share
|
0.14 | 0.24 | (0.01 | ) | 0.27 | |||||||||||
|
Diluted
earnings per share
|
0.14 | 0.24 | (0.01 | ) | 0.27 | |||||||||||
Results
for the quarter ended March 31, 2010 include restructuring charges of $2,423 and
a gain on the sale of corporate assets of $549.
|
18.
|
Subsequent
Events:
|
On May 5,
2010, the Board of Directors of the Company declared a $0.045 dividend per share
of common stock with respect to the quarter ended March 31, 2010, payable on
June 15, 2010. The dividend will be paid to stockholders of record on
June 4, 2010 and will be disbursed on June 11, 2010.
-76-
Report of Independent Registered Public Accounting
Firm
To the
Board of Directors and Stockholders of AVX Corporation
In our
opinion, the accompanying consolidated balance sheets and the related
consolidated statements of operations, stockholders' equity and cash flows
present fairly, in all material respects, the financial position of AVX
Corporation and its subsidiaries at March 31, 2010 and March 31, 2009, and the
results of their operations and their cash flows for each of the three years in
the period ended March 31, 2010 in conformity with accounting principles
generally accepted in the United States of America. Also in our
opinion, the Company maintained, in all material respects, effective internal
control over financial reporting as of March 31, 2010, based on criteria
established in Internal
Control - Integrated Framework issued by the Committee of Sponsoring
Organizations of the Treadway Commission (COSO). The Company's
management is responsible for these financial statements, for maintaining
effective internal control over financial reporting and for its assessment of
the effectiveness of internal control over financial reporting, included in
Management's Report on Internal Control over Financial Reporting appearing under
Item 9A. Our responsibility is to express opinions on these financial
statements and on the Company's internal control over financial reporting based
on our integrated audits. We conducted our audits in accordance with
the standards of the Public Company Accounting Oversight Board (United
States). Those standards require that we plan and perform the audits
to obtain reasonable assurance about whether the financial statements are free
of material misstatement and whether effective internal control over financial
reporting was maintained in all material respects. Our audits of the
financial statements included examining, on a test basis, evidence supporting
the amounts and disclosures in the financial statements, assessing the
accounting principles used and significant estimates made by management, and
evaluating the overall financial statement presentation. Our audit of
internal control over financial reporting included obtaining an understanding of
internal control over financial reporting, assessing the risk that a material
weakness exists, and testing and evaluating the design and operating
effectiveness of internal control based on the assessed risk. Our
audits also included performing such other procedures as we considered necessary
in the circumstances. We believe that our audits provide a reasonable basis for
our opinions.
A
company’s internal control over financial reporting is a process designed to
provide reasonable assurance regarding the reliability of financial reporting
and the preparation of financial statements for external purposes in accordance
with generally accepted accounting principles. A company’s internal
control over financial reporting includes those policies and procedures that
(i) pertain to the maintenance of records that, in reasonable detail,
accurately and fairly reflect the transactions and dispositions of the assets of
the company; (ii) provide reasonable assurance that transactions are
recorded as necessary to permit preparation of financial statements in
accordance with generally accepted accounting principles, and that receipts and
expenditures of the company are being made only in accordance with
authorizations of management and directors of the company; and
(iii) provide reasonable assurance regarding prevention or timely detection
of unauthorized acquisition, use, or disposition of the company’s assets that
could have a material effect on the financial statements.
Because
of its inherent limitations, internal control over financial reporting may not
prevent or detect misstatements. Also, projections of any evaluation
of effectiveness to future periods are subject to the risk that controls may
become inadequate because of changes in conditions, or that the degree of
compliance with the policies or procedures may deteriorate.

PricewaterhouseCoopers LLP
Atlanta,
Georgia
May 20,
2010
-77-