Attached files
| file | filename |
|---|---|
| EX-23.1 - CONSENT OF INDEPENDENT REGISTERED PUBLIC ACCOUNTING FIRM - Vitamin Shoppe, Inc. | dex231.htm |
| EX-5.1 - OPINION OF KIRKLAND & ELLIS LLP - Vitamin Shoppe, Inc. | dex51.htm |
Table of Contents
As filed with the Securities and Exchange Commission on May 18, 2010
Registration No. 333-166718
UNITED STATES
SECURITIES AND EXCHANGE COMMISSION
Washington, D.C. 20549
Amendment No. 1
to
FORM S-1
REGISTRATION STATEMENT
UNDER THE SECURITIES ACT OF 1933
VITAMIN SHOPPE, INC.
(Exact name of registrant as specified in its charter)
| Delaware | 5400 | 11-3664322 | ||
| (State or Other Jurisdiction of Incorporation or Organization) |
(Primary Standard Industrial Classification Code Number) |
(I.R.S. Employer Identification No.) |
2101 91st Street
North Bergen, New Jersey 07047
Telephone: (201) 868-5959
(Address, including zip code, and telephone number, including area code, of registrant’s principal executive offices)
James M. Sander, Esq.
Vitamin Shoppe, Inc.
Vice President, General Counsel and Secretary
2101 91st Street
North Bergen, New Jersey 07047
Telephone: (201) 868-5959
(Name, address, including zip code, and telephone number, including area code, of agent for service)
Copies of all communications, including communications sent to agent for service, should be sent to:
| Christian O. Nagler, Esq. Kirkland & Ellis LLP 601 Lexington Avenue New York, NY 10022 Tel: (212) 446-4800 Fax: (212) 446-4900 |
Marc D. Jaffe, Esq. Ian D. Schuman, Esq. Latham & Watkins LLP 885 Third Avenue, Suite 1000 New York, NY 10022-4802 Tel: (212) 906-1200 Fax: (212) 751-4864 |
Approximate date of commencement of proposed sale to the public: As soon as practicable after the effective date of this Registration Statement.
If any of the securities being registered on this Form are to be offered on a delayed or continuous basis pursuant to Rule 415 under the Securities Act of 1933, check the following box: ¨
If this Form is filed to registered additional securities for an offering pursuant to Rule 462(b) under the Securities Act, please check the following box and list the Securities Act registration statement number of the earlier effective registration statement for the same offering. ¨
If this Form is a post-effective amendment filed pursuant to Rule 462(c) under the Securities Act, check the following box and list the Securities act registration statement number of the earlier effective registration statement for the same offering. ¨
If this Form is a post-effective amendment filed pursuant to Rule 462(d) under the Securities Act, check the following box and list the Securities Act registration statement number of the earlier effective registration statement for the same offering. ¨
Indicate by check mark whether the registrant is a large accelerated filer, an accelerated filer, a non-accelerated filer, or a smaller reporting company. See definitions of “large accelerated filer,” “accelerated filer,” and “smaller reporting company” in Rule 12b-2 of the Exchange Act. (Check one):
| ¨Large accelerated filer | ¨Accelerated filer | xNon-accelerated filer (Do not check if smaller reporting company) |
¨Smaller reporting company |
CALCULATION OF REGISTRATION FEE
| Title of Each Class of Securities to be Registered |
Amount to be Registered (1) |
Proposed Maximum Offering Price Per Share |
Proposed Maximum Aggregate Offering Price (2) |
Amount of Registration Fee (3) | ||||
| Common stock, par value $0.01 per share |
7,171,768 |
$23.40 |
$167,819,372 |
$11,965.53 | ||||
| (1) | Includes 935,448 shares of common stock issuable upon exercise of an option to purchase additional shares granted to the underwriters. |
| (2) | Estimated solely for the purpose of calculating the registration fee pursuant to Rule 457(c) under the Securities Act of 1933, as amended, based on the average of the high and low prices for the registrant’s common stock on May 11, 2010. |
| (3) | $10,607 was previously paid on May 10, 2010. The difference of $1,358.53 is being submitted herewith. |
The registrant hereby amends this Registration Statement on such date or dates as may be necessary to delay its effective date until the registrant shall file a further amendment which specifically states that this Registration Statement shall thereafter become effective in accordance with Section 8(a) of the Securities Act of 1933 or until this Registration Statement shall become effective on such date as the Commission, acting pursuant to said Section 8(a), may determine.
Table of Contents
The information in this prospectus is not complete and may be changed. The selling stockholders may not sell these securities until the registration statement filed with the Securities and Exchange Commission is effective. This prospectus is not an offer to sell these securities, and neither we nor the selling stockholders are soliciting an offer to buy these securities in any state where the offer or sale is not permitted.
Subject to Completion, Dated May 18, 2010
PROSPECTUS
6,236,320 Shares

Vitamin Shoppe, Inc.
Common Stock
The selling stockholders identified in this prospectus, including our principal stockholder and certain members of our management, are offering up to 6,236,320 shares of common stock of Vitamin Shoppe, Inc. and will receive all of the proceeds from the offering. We will not receive any proceeds from the offering. See “Principal and Selling Stockholders.”
Our common stock is listed and currently traded on the NYSE under the symbol “VSI.” On May 17, 2010 the last reported sale price of our common stock was $25.14 per share.
| Per Share | Total | |||||
| Public offering price |
$ | $ | ||||
| Underwriting discounts and commissions |
$ | $ | ||||
| Proceeds to the Selling Stockholders, before expenses |
$ | $ | ||||
The selling stockholders have granted the underwriters a 30-day option to purchase up to an additional 935,448 shares from them at the public offering price less the underwriting discounts and commissions.
Investing in our common stock involves a high degree of risk. See “Risk factors” beginning on page 8.
Neither the Securities and Exchange Commission nor any state securities commission has approved or disapproved of these securities or passed on the adequacy or accuracy of this prospectus. Any representation to the contrary is a criminal offense.
The underwriters expect to deliver the shares on or about 2010.
Joint Book-Running Managers
| J.P.Morgan | BofA Merrill Lynch | Barclays Capital |
Co-Managers
| Stifel Nicolaus | Baird | Piper Jaffray |
The date of this prospectus is , 2010
Table of Contents

Table of Contents
| 1 | ||
| 6 | ||
| 8 | ||
| 14 | ||
| 15 | ||
| 15 | ||
| 15 | ||
| 15 | ||
| 16 | ||
| 17 | ||
| Management’s Discussion and Analysis of Financial Condition and Results of Operations |
20 | |
| 41 | ||
| 56 | ||
| 61 | ||
| 79 | ||
| 81 | ||
| 83 | ||
| 88 | ||
| 90 | ||
| 93 | ||
| 100 | ||
| 100 | ||
| 100 | ||
| F-1 |
You should rely only on the information contained in this prospectus, any free writing prospectus prepared by us or information to which we have referred you. We have not, the selling stockholders have not, and the underwriters have not, authorized any other person to provide you with different information. If anyone provides you with different or inconsistent information, you should not rely on it. We are not, the selling stockholders are not, and the underwriters are not, making an offer to sell, or soliciting an offer to buy, these securities in any jurisdiction where such offer, sale or solicitation is not permitted. You should assume that the information appearing in this prospectus and any free writing prospectus prepared by us is accurate only as of its respective date. Our business, financial condition, results of operations and prospects may have changed since such date.
Table of Contents
This summary highlights material information regarding the offering contained elsewhere in this prospectus, but may not contain all of the information that may be important to you. As used herein, the “Company,” “we,” “us” and “our” refer to “Vitamin Shoppe, Inc.” References to “VMS” mean vitamins, minerals, herbs, supplements, sports nutrition and other health and wellness products. You should read this entire prospectus, including the sections entitled “Risk Factors,” “Management’s Discussion and Analysis of Financial Condition and Results of Operations” and the financial statements and related notes thereto, before deciding whether to invest in our common stock.
Overview
We are a leading specialty retailer and direct marketer of vitamins, minerals, herbs, supplements, sports nutrition and other health and wellness products. For each of the past five years, we have been the fastest growing national VMS specialty retailer while maintaining our position as the second largest in retail sales in our industry. We market over 700 different nationally recognized brands as well as our proprietary Vitamin Shoppe, BodyTech and MD Select brands. We believe we offer the greatest variety of products among VMS retailers with approximately 8,000 stock keeping units (“SKUs”) offered in our typical store and an additional 12,000 SKUs available through our Internet and other direct sales channels. We target the dedicated, well-informed VMS consumer and differentiate ourselves by providing high quality products at competitive prices in an educational and high-touch customer service environment. We believe our extensive product offerings, together with our well-known brand name and emphasis on product education and customer service, help us bond with our target customer and serve as a foundation for strong customer loyalty.
We sell our products through two business segments: retail and direct. In our retail segment, we have leveraged our successful store economic model by opening a total of 169 new stores from the beginning of fiscal year 2006 through fiscal year 2009. As of April 27, 2010, we operated 457 stores in 37 states and the District of Columbia, located in high-traffic regional retail centers. In our direct segment, we sell our products directly to consumers through our websites, primarily www.vitaminshoppe.com, and our catalog. Our websites and our catalog complement our in-store experience by extending our retail product offerings and by enabling us to access customers outside our retail markets and those who prefer to shop online.
We have grown our net sales from $486.0 million in fiscal year 2006 to $674.5 million in fiscal year 2009, representing a compound annual growth rate (“CAGR”) of 11.5%. We have achieved positive comparable store sales for 16 consecutive years (prior to which we did not track comparable store sales) and have grown our retail sales from $407.5 million in 2006 to $596.3 million in 2009, representing a CAGR of 13.5%. We believe our industry performs well through economic cycles, and we have generated comparable store sales increases of 5.2% and 6.2% in 2009 and 2008, respectively, and 6.2% and 5.1% for the three months ended March 27, 2010 and March 28, 2009, respectively.
Industry
According to the Nutrition Business Journal (“NBJ”), sales of nutritional supplements in the United States in 2008 were approximately $25.2 billion, representing a 4.9% CAGR between 2001 and 2008. The NBJ forecasts 4.5% average annual growth for U.S. nutritional supplement sales through 2014. We believe that one of the primary trends driving the industry is consumption by the over-50 demographic, including Baby Boomers (those born between 1946 and 1964), who seek to improve their health and wellness and treat and prevent disease and illness. According to the U.S. Census, the total U.S. population of people 50 and older is expected to increase to 115 million people in 2018 from 94 million people in 2008, representing a CAGR of 2.1%, which is more than twice the overall population growth rate.
1
Table of Contents
According to the NBJ, growth in the U.S. nutritional supplement industry is expected to be led by the specialty supplements and sports nutrition product categories. Based on NBJ forecasts, from 2009 to 2014, the U.S. specialty supplements product category is expected to grow approximately 38% faster than the overall industry, and the sports nutrition product category is expected to grow approximately 29% faster than the overall industry. Our sales are concentrated in these fastest-growing categories. Grouped in a manner consistent with NBJ’s data, the specialty supplements and sports nutrition product categories represented 26.9% and 29.1%, respectively, of our fiscal 2009 net sales.
Competitive Strengths
We believe we are well positioned to capitalize on the favorable VMS industry dynamics as a result of the following competitive strengths:
Most Extensive Product Selection, Including a Strong Assortment of Proprietary Brands. We believe we have the most complete and authoritative merchandise assortment and market the broadest product selection in the VMS industry, with over 20,000 competitively priced SKUs from a combination of over 700 different nationally recognized brands and our proprietary brands. Our proprietary brand merchandise accounted for approximately 25% of our net sales in fiscal 2009, and provides our customers the opportunity to purchase VMS products at a great value while affording us higher gross margins.
Value-Added Customer Service. We believe we offer the highest degree of customer service in the VMS retail industry, aided by the deep product knowledge of our experienced store associates. We place a strong emphasis on employee training and customer service and view our sales associates as health and wellness information stewards who educate our customers while assisting them with their product selections.
Highly Refined Real Estate Strategy. We apply demanding criteria to our retail site selection. We locate our stores exclusively in attractive stand-alone locations or endcap (corner) positions in retail centers. We believe that the location and visibility of our real estate is our single most effective and efficient customer acquisition strategy.
Attractive, Loyal Customer Base. We have a large and growing base of loyal customers who proactively manage their long-term health and wellness through the use of supplements. Our no-fee Healthy Awards Program promotes brand loyalty among our customers and allows our customers to earn points redeemable for future purchases, approximately 74% of which are redeemed annually.
Multi-Channel Retailer. We are a multi-channel retailer, distributing products through our retail stores, our websites and our catalog, enabling us to access customers outside our retail markets and those who prefer to shop online. This business model affords us multiple touch points with our customers, which allows us to gather data and communicate with them in person, through our call center and via the web.
Experienced Management Team with Proven Track Record. We have assembled a management team across a broad range of disciplines with extensive experience in building leading national specialty retailers.
For additional information, see the section of this prospectus entitled “Business—Competitive Strengths.”
2
Table of Contents
Growth Strategies
We plan to execute several strategies in the future to promote our revenue growth, capture market share and drive operating income growth, including:
Expand Our Store Base. We believe we have a highly attractive economic model for our new stores. We plan to continue to expand our store base over the next five years, which we believe will complement the maturation of the 169 stores we have opened since January 1, 2006. Based upon our operating experience and research conducted by The Buxton Company, we are confident that the U.S. VMS market can support over 900 Vitamin Shoppe stores operating under our current format.
Grow Our Loyal Customer Base. We plan to continue to grow our loyal customer base by enhancing our marketing initiatives and leveraging our direct business.
Continue to Improve Store Productivity. We plan to generate higher sales productivity through refined merchandising and pricing initiatives.
Continue to Invest in Education and Knowledge of Our Employees. We believe we provide the most comprehensive training program in the VMS industry and that our sales associates’ ability to provide greater, value-added assistance to our customers helps us deliver a differentiated retail experience.
For additional information, see the section of this prospectus entitled “Business—Growth Strategies.”
Risk Factors
An investment in our common stock is subject to a number of risks and uncertainties. Before investing in our common stock, you should carefully consider the following, as well as the more detailed discussion of risk factors and other information included in this prospectus:
| • | unfavorable publicity or consumer perception of our products and any similar products distributed by other companies could cause fluctuations in our operating results and could have a material adverse effect on our reputation, resulting in decreased sales; |
| • | our substantial indebtedness could adversely affect our financial health; |
| • | we may incur material product liability claims, which could increase our costs and adversely affect our reputation, sales and operating income; |
| • | we may not be able to obtain insurance coverage in the future at current rates or at all; and |
| • | compliance with new and existing governmental regulations could increase our costs significantly and adversely affect our operating income. |
Recent Developments
On March 30, 2010, we entered into a three year agreement with a West Coast third party logistics facility to service our stores in the western United States.
On April 21, 2010, we announced our intention to redeem $25.0 million of our Second Priority Senior Secured Floating Rate Notes due 2012 (the “Notes”), which will be financed with borrowings under our 2009 Revolving Credit Facility. The redemption will be consummated by May 21, 2010, and will result in approximately $1.0 million (pre-tax) savings in interest expense on an annual basis, as well as a charge of approximately $0.6 million (pre-tax) to loss on extinguishment of debt, as a result of certain write-offs related to the redemption, during the second quarter of the 2010 fiscal year.
3
Table of Contents
On April 21, 2010, we amended our revolving credit facility (as amended, the “2009 Revolving Credit Facility”), increasing the maximum credit limit by $20.0 million to $70.0 million. In addition, in connection with the aforementioned West Coast facility agreement, the 2009 Revolving Credit Facility was amended to accommodate the allocation of our inventory between our New Jersey distribution center and the West Coast logistics facility.
During the first quarter of 2010, the Company’s comparable store sales increased 6.2% over the prior year. This favorable trend has continued in the second quarter of 2010, as comparable store sales increases for the first seven weeks of the second quarter of 2010 have exceeded the comparable store sales increases for the first quarter of 2010. Our results for the first seven weeks of the second quarter are preliminary and subject to change. Our results for the first seven weeks of the second quarter are not necessarily indicative of the results that may be expected for the entire fiscal second quarter.
Investment by Irving Place Capital Partners II, L.P.
We were acquired in November 2002 by Irving Place Capital Partners II, L.P. (formerly Bear Stearns Merchant Banking Partners II, L.P.) and its affiliates and other investors. Following this offering Irving Place Capital Partners II, L.P. and certain of its affiliates, which we refer to collectively as “IPC,” will own approximately 35.9% of our common stock, or 32.5% if the underwriters’ option to purchase additional shares is fully exercised.
Our Corporate Structure
Our current corporate structure is as follows: Vitamin Shoppe, Inc., the issuer of the common stock offered hereby, owns all of the common stock of Vitamin Shoppe Industries Inc. Vitamin Shoppe, Inc. has no operations of its own. All of our operating assets are held by Vitamin Shoppe Industries Inc. and its direct wholly owned subsidiary, VS Direct Inc. (“Direct”). Prior to the completion of our initial public offering in November 2009, and the renaming of VS Holdings, Inc. to Vitamin Shoppe, Inc., VS Holdings, Inc. was a direct wholly owned subsidiary of VS Parent, Inc., our former parent company. During October 2009 VS Parent, Inc. was merged into VS Holdings, Inc. with VS Holdings, Inc. being the surviving corporation (the “Merger”). The Merger resulted in an approximate 1.8611-for-one split of our common stock. In addition, the warrants and common stock issued by VS Parent, Inc. became warrants and common stock of VS Holdings, Inc. and the preferred stock of VS Parent, Inc. converted into preferred stock of VS Holdings, Inc., which transferred all participating rights (accumulated dividends in arrears) to VS Holdings, Inc. Subsequent to the forgoing, VS Holdings, Inc. was renamed “Vitamin Shoppe, Inc.” We refer to these transactions as our “2009 Corporate Reorganization.”
Corporate and Other Information
Our executive offices are located at 2101 91st Street, North Bergen, New Jersey 07047, and our telephone number is (201) 868-5959. Our principal website address is www.vitaminshoppe.com. Information contained on any of our websites does not constitute part of this prospectus.
The Vitamin Shoppe and BodyTech are some of our registered trademarks. Other brand names or trademarks appearing in this prospectus are the property of their respective owners. Solely for convenience, our trademarks and tradenames referred to in this prospectus are without the ® symbol, but such references are not intended to indicate, in any way, that we will not assert, to the fullest extent under applicable law, our rights or the right of the applicable licensors to these trademarks and tradenames.
Some of the market and industry data and other statistical information used throughout this prospectus are based on independent industry publications including the 2009 Supplement Business Report issue of the NBJ, government publications, reports by market research firms or other published independent sources. Some data are also based on our good faith estimates, which are derived from our review of internal surveys, as well as the independent sources referred to above. The industry forecasts and projections are based on industry surveys and management’s experience in the industry, and we cannot give you any assurance that any of the projected results will be achieved.
4
Table of Contents
The Offering
| Common stock offered by the selling stockholders |
6,236,320 shares |
| Use of proceeds |
The selling stockholders will receive all of the proceeds from this offering, and we will not receive any proceeds from the sale of shares in this offering. The selling stockholders include members of our management and certain of our other equity holders. Irving Place Capital Partners II, L.P., is our principal stockholder and is a selling stockholder in this offering. See “Principal and Selling Stockholders.” |
| Dividends |
We do not anticipate paying any cash dividends in the foreseeable future. |
| Risk Factors |
See “Risk Factors” beginning on page 8 for a discussion of some of the factors you should carefully consider before deciding to invest in shares of our common stock. |
| Conflict of Interest |
Under FINRA Rule 2720, we are considered an affiliate of J.P. Morgan Securities Inc. because J.P. Morgan Securities Inc. has an economic interest in approximately 21% of our common stock outstanding as of April 30, 2010. See “Underwriting—Conflict of Interest.” Certain affiliates of J.P. Morgan Securities, Inc. will receive a portion of the proceeds of this offering. See “Principal and Selling Stockholders.” |
| New York Stock Exchange symbol |
“VSI.” |
5
Table of Contents
Summary Consolidated Financial Data
The following table sets forth summary consolidated financial data for Vitamin Shoppe, Inc. as of the dates and for the periods indicated. Our fiscal years end on the last Saturday in December. The statement of operations data for the fifty-two weeks ended December 26, 2009 (“Fiscal 2009”), fifty-two weeks ended December 27, 2008 (“Fiscal 2008”), and the fifty-two weeks ended December 29, 2007 (“Fiscal 2007”), have been derived from our audited consolidated financial statements and notes thereto included in this prospectus. The statement of operations data for the three months ended March 27, 2010, and for the three months ended March 28, 2009, and the balance sheet data as of March 27, 2010, have been derived from our unaudited condensed consolidated financial statements included in this prospectus, which, in our opinion, contain adjustments which are of a normal recurring nature and which we consider necessary to present fairly our financial position and results of operations at such dates and for such periods. Results for the three months ended March 27, 2010, are not necessarily indicative of the results that may be expected for the entire fiscal year.
The summary consolidated financial data below should be read in conjunction with “Management’s Discussion and Analysis of Financial Condition and Results of Operations,” “Use of Proceeds” and our financial statements and notes thereto included in this prospectus.
| Three Months Ended | Year Ended | |||||||||||||||||||
| March 27, 2010 |
March 28, 2009 |
December 26, 2009 |
December 27, 2008 |
December 29, 2007 |
||||||||||||||||
| (data presented in thousands, except for share and per share data) | ||||||||||||||||||||
| Statement of Operations Data: |
||||||||||||||||||||
| Net sales |
$ | 191,613 | $ | 172,555 | $ | 674,495 | $ | 601,540 | $ | 537,872 | ||||||||||
| Cost of goods sold |
126,599 | 115,543 | 457,573 | 405,659 | 360,346 | |||||||||||||||
| Gross profit |
65,014 | 57,012 | 216,922 | 195,881 | 177,526 | |||||||||||||||
| Selling, general and administrative expenses |
46,942 | 43,941 | 173,144 | 158,713 | 143,544 | |||||||||||||||
| Related party expenses |
— | 370 | 2,446 | 1,523 | 1,365 | |||||||||||||||
| Income from operations |
18,072 | 12,701 | 41,332 | 35,645 | 32,617 | |||||||||||||||
| Extinguishment of debt and other (1) |
552 | — | 2,016 | — | — | |||||||||||||||
| Interest expense, net |
2,927 | 5,007 | 18,636 | 21,137 | 22,045 | |||||||||||||||
| Income before provision for income taxes |
14,593 | 7,694 | 20,680 | 14,508 | 10,572 | |||||||||||||||
| Provision for income taxes |
5,867 | 3,132 | 8,014 | 6,341 | 3,792 | |||||||||||||||
| Net income |
8,726 | 4,562 | 12,666 | 8,167 | 6,780 | |||||||||||||||
| Preferred stock dividends in arrears |
— | 2,577 | 7,692 | 9,279 | 9,105 | |||||||||||||||
| Net income (loss) available to common stockholders |
$ | 8,726 | $ | 1,985 | $ | 4,974 | $ | (1,112 | ) | $ | (2,325 | ) | ||||||||
| Weighted average shares outstanding: |
||||||||||||||||||||
| Basic |
26,692,983 | 14,175,906 | 16,238,338 | 14,175,906 | 14,175,906 | |||||||||||||||
| Diluted |
27,708,463 | 15,969,484 | 17,748,371 | 14,175,906 | 14,175,906 | |||||||||||||||
| Net income (loss) per share: |
||||||||||||||||||||
| Basic |
$ | 0.33 | $ | 0.14 | $ | 0.31 | $ | (0.08 | ) | $ | (0.16 | ) | ||||||||
| Diluted |
$ | 0.31 | $ | 0.12 | $ | 0.28 | $ | (0.08 | ) | $ | (0.16 | ) | ||||||||
| Other Operating Data: |
||||||||||||||||||||
| Average net sales per comparable store |
$ | 389 | $ | 405 | $ | 1,424 | $ | 1,458 | $ | 1,437 | ||||||||||
| Comparable store sales growth (2) |
6.2 | % | 5.1 | % | 5.2 | % | 6.2 | % | 6.2 | % | ||||||||||
| Average square footage per store |
3.7 | 3.7 | 3.7 | 3.7 | 3.7 | |||||||||||||||
6
Table of Contents
| (1) | For the first fiscal quarter of 2010, extinguishment of debt includes $0.3 million for the write-off of the related portion of deferred financing fees and a portion of the unrecognized loss on our terminated interest rate swap of $0.2 million, related to the redemption of a portion of our Notes during January 2010. For Fiscal 2009 extinguishment of debt includes $0.4 million for the premium on the repurchase of a portion of our Notes, along with the write-off of the related portions of deferred financing fees and a portion of the unrecognized loss of our terminated interest rate swap of $0.7 million and $0.6 million, respectively, as well as a $0.3 million write-off of deferred financing fees related to the repayment of our former revolving credit facility which was terminated in September 2009. |
| (2) | A store is included in comparable store sales after 410 days of operation. |
7
Table of Contents
Any investment in our common stock involves a high degree of risk. You should carefully consider the following information about these risks, together with the other information contained in this prospectus, before buying shares of our common stock.
Risks Relating to Our Business and Industry
Unfavorable publicity or consumer perception of our products and any similar products distributed by other companies could cause fluctuations in our operating results and could have a material adverse effect on our reputation, resulting in decreased sales.
We are highly dependent upon consumer perception regarding the safety and quality of our products, as well as similar products distributed by other companies. Consumer perception of products can be significantly influenced by adverse publicity in the form of published scientific research, national media attention or other publicity, whether or not accurate, that associates consumption of our products or any other similar products with illness or other adverse effects, or questions the benefits of our or similar products or that claims that any such products are ineffective. A product may be received favorably, resulting in high sales associated with that product that may not be sustainable as consumer preferences change. Future scientific research or publicity could be unfavorable to our industry or any of our particular products and may not be consistent with earlier favorable research or publicity. Such research or publicity could have a material adverse effect on our ability to generate sales. For example, sales of some of our products, such as those containing Ephedra, were initially strong, but decreased as a result of negative publicity and an ultimate ban by the Food and Drug Administration (“FDA”). As a result of the above factors, our operations may fluctuate significantly from quarter-to-quarter and year to year.
Our substantial indebtedness could adversely affect our financial health.
As of March 27, 2010, we had $120.1 million of outstanding indebtedness (excluding capital leases). Our substantial indebtedness could have important consequences to you. For example, it could:
| • | make it more difficult for us to satisfy our obligations with respect to our indebtedness; |
| • | increase our vulnerability to general adverse economic, industry and competitive conditions; |
| • | require us to dedicate a substantial portion of our cash flow from operations to payments on our indebtedness, thereby reducing the availability of our cash flow to fund working capital, capital expenditures, research and development efforts and other general corporate purposes; |
| • | limit our flexibility in planning for, or reacting to, changes in our business and the industry in which we operate; |
| • | place us at a competitive disadvantage compared to our competitors that have less debt; and |
| • | limit our ability to borrow additional funds. |
Additionally, despite our current indebtedness levels, the agreements governing our outstanding debt upon consummation of the offering would allow us to incur substantially more debt. This could further exacerbate the risks associated with our substantial leverage.
We may incur material product liability claims, which could increase our costs and adversely affect our reputation, sales and operating income.
As a retailer and direct marketer of products designed for human consumption, we are subject to product liability claims if the use of our products is alleged to have resulted in injury or include inadequate instructions for use or inadequate warnings concerning possible side effects and interactions with other substances. Most of
8
Table of Contents
our products are vitamins, minerals, herbs and other ingredients that are classified as foods or dietary supplements and are not subject to pre-market regulatory approval in the United States. Our products could contain contaminated substances, and some of our products contain ingredients that do not have long histories of human consumption. Previously unknown adverse reactions resulting from human consumption of these ingredients could occur. While we attempt to manage these risks by obtaining indemnification agreements and insurance, our insurance policies may not be sufficient or available and/or third parties may not satisfy their commitments to us. A product liability claim against us could result in increased costs and could adversely affect our reputation with our customers, which in turn could adversely affect our financial performance. See “Business—Legal Proceedings.”
We may not be able to obtain insurance coverage in the future at current rates.
Our current insurance program is consistent with both our past level of coverage and our risk management policies. While we believe we will be able to obtain product liability insurance in the future, because of increased selectivity by insurance providers we may only be able to obtain such insurance at increased rates and/or with reduced coverage levels which could reduce our income from operations.
Compliance with new and existing governmental regulations could increase our costs significantly and adversely affect our operating income.
The processing, formulation, manufacturing, packaging, labeling, advertising and distribution of our products are subject to federal laws and regulation by one or more federal agencies, including the FDA, Federal Trade Commission (“FTC”), the Department of Agriculture (“DOA”) and the Environmental Protection Agency (“EPA”). These activities are also regulated by various state, local and international laws and agencies of the states and localities in which our products are sold. Regulations may prevent or delay the introduction, or require the reformulation, of our products, which could result in lost sales and increased costs to us. The FDA may not accept the evidence of safety for any new ingredients that we may want to market, may determine that a particular product or product ingredient presents an unacceptable health risk, may determine that a particular statement of nutritional support on our products, or that we want to use on our products, is an unacceptable drug claim or an unauthorized version of a food “health claim,” or the FDA or the FTC may determine that particular claims are not adequately supported by available scientific evidence. Any such regulatory determination would prevent us from marketing particular products or using certain statements on our products which could adversely affect our sales of those products. The FDA also could require us to remove a particular product from the market. For example, in April 2004, the FDA banned the sale of products containing Ephedra. We stopped selling Ephedra-based products in June 2003. Sales of products containing Ephedra amounted to approximately $10.9 million, or 4% of our net sales, in 2002. Any recall or removal of products we sell could result in additional costs to us and the loss of future sales from any products that we are required to remove from the market. Any such product recalls or removals could also lead to liability and substantial costs. Delayed product introduction, product recalls or similar issues as a result of governmental regulation may arise from time to time, which may have a material adverse effect on our sales and operating results.
In addition, from time to time, Congress, the FDA, the FTC or other federal, state, local or foreign legislative and regulatory authorities may impose additional laws or regulations that apply to us, repeal laws or regulations that we consider favorable to us or impose more stringent interpretations of current laws or regulations. We are not able to predict the nature of such future laws, regulations, repeals or interpretations or to predict the effect additional governmental regulation, when and if it occurs, would have on our business in the future. Such developments could require reformulation of certain products to meet new standards, recalls or discontinuance of certain products not able to be reformulated, additional record-keeping requirements, increased documentation of the properties of certain products, additional or different labeling, additional scientific substantiation, adverse event reporting or other new requirements. Any such developments could increase our costs significantly and could have a material adverse effect on our business, financial condition and results of operations. For example, legislation has been passed by Congress to, among other things, impose substantial new
9
Table of Contents
regulatory requirements for dietary supplements, including adverse event reporting, and post-market surveillance requirements, which could raise our costs and negatively impact our business. In addition, the FDA has adopted rules on good manufacturing practices (“GMP”) in manufacturing, packaging, or holding dietary ingredients and dietary supplements, which apply to the products we distribute. These regulations will require dietary supplements to be prepared, packaged and held in compliance with stricter rules, and require quality control provisions similar to those in the drug GMP regulations. We or our third-party manufacturers may not be able to comply with the new rules without incurring additional expenses, which could be significant. See “Business—Government Regulation.”
We rely on contract manufacturers to produce all of the Vitamin Shoppe and BodyTech branded products we sell. Disruptions in our contract manufacturers’ systems or losses of manufacturing certifications could adversely affect our sales and customer relationships.
Our contract manufacturers produce 100% of our Vitamin Shoppe and BodyTech branded products. Any significant disruption in those operations for any reason, such as regulatory requirements and loss of certifications, power interruptions, fires, hurricanes, war or threats of terrorism could adversely affect our sales and customer relationships.
Increase in the price and shortage of supply of key raw materials could adversely affect our business.
Our products are composed of certain key raw materials. If the prices of these raw materials were to increase significantly, it could result in a significant increase to us in the prices our contract manufacturers and third-party manufacturers charge us for our Vitamin Shoppe and BodyTech branded products and third-party products. Raw material prices may increase in the future and we may not be able to pass on such increases to our customers. A significant increase in the price of raw materials that cannot be passed on to customers could have a material adverse effect on our results of operations and financial condition. In addition, if we no longer are able to obtain products from one or more of our suppliers on terms reasonable to us or at all, our revenues could suffer. We purchased approximately 6% of our total merchandise from Nature’s Value during Fiscal 2009, one of the suppliers of our Vitamin Shoppe and BodyTech branded products. Events such as the threat of terrorist attacks or war, or the perceived threat thereof, may also have a significant impact on raw material prices and transportation costs for our products. In addition, the interruption in supply of certain key raw materials essential to the manufacturing of our products, may have an adverse impact on our supplier’s ability to provide us with the necessary products needed to maintain our customer relationships and an adequate level of sales.
We rely on a single warehouse and distribution facility to distribute all of the products we sell. Disruptions to our warehouse and distribution facility could adversely affect our business.
Our warehouse and distribution operations are currently concentrated in a single location adjacent to our corporate headquarters in New Jersey. Any significant disruption in our distribution center operations for any reason, such as a flood, fire or hurricane, could adversely affect our product distributions and sales until such time as we are able to secure an alternative distribution method. In addition, the west coast distribution facility, which we expect to add to our operations during the second half of Fiscal 2010, will not sufficiently meet our distribution requirements in the event of a major disruption to our primary facility.
Our new store base, or any stores opened in the future, may not achieve sales and operating levels consistent with our mature store base on a timely basis or at all. In addition, our growth strategy includes the addition of a significant number of new stores each year. We may not be able to successfully implement this strategy on a timely basis or at all, and our business could be adversely affected if we are unable to successfully negotiate favorable lease terms.
Since the beginning of 2006 through Fiscal 2009, we have opened 169 new stores in existing and new markets. Historically, our new stores have reached sales that are consistent with our mature stores over the course of a three to four year period. New stores opened since the beginning of 2006, or any new stores to be opened in the future, may not achieve sales and operating levels consistent with our mature store base in this time frame or
10
Table of Contents
at all. The failure of our new store base to achieve sales and operating levels consistent with our mature store base on a timely basis will have an adverse effect on our financial condition and operating results. As of April 27, 2010, we leased 457 stores along with our corporate headquarters and distribution facility. The store leases are generally for a term of ten years and we have options to extend most leases for a minimum of five years. Our business, financial condition, and operating results could be adversely affected if we are unable to continue to negotiate acceptable lease and renewal terms.
In addition, our growth continues to depend, in part, on our ability to open and operate new stores successfully. The success of this strategy depends upon, among other things, the identification of suitable sites for store locations, the negotiation of acceptable lease terms, the hiring, training and retention of competent sales personnel, and the effective management of inventory to meet the needs of new and existing stores on a timely basis. Our proposed expansion will also place increased demands on our operational, managerial and administrative resources. These increased demands could cause us to operate our business less effectively, which in turn could cause deterioration in the financial performance of our existing stores. Further, our new store openings may result in reduced net sales volumes in the direct channel, as well as in our existing stores in those markets. We expect to fund our expansion through cash flow from operations and, if necessary, by borrowings under our 2009 Revolving Credit Facility. If we experience a decline in performance, we may slow or discontinue store openings. If we fail to successfully implement these strategies, our financial condition and operating results may be adversely affected.
If we fail to protect our brand name, competitors may adopt tradenames that dilute the value of our brand name.
We may be unable or unwilling to strictly enforce our trademark in each jurisdiction in which we do business. In addition, because of the differences in foreign trademark laws concerning proprietary rights, our trademarks may not receive the same degree of protection in foreign countries as they do in the United States. Also, we may not always be able to successfully enforce our trademarks against competitors, or against challenges by others. Our failure to successfully protect our trademarks could diminish the value and efficacy of our past and future marketing efforts, and could cause customer confusion and potentially adversely affect our sales and profitability. Moreover, we may be subject to intellectual property litigation and infringement claims, which could cause us to incur significant expenses or prevent us from selling or using some aspect of our products.
Our ability to continue to access credit on the terms previously obtained for the funding of our operations and capital projects may be limited due to the deterioration of the credit markets.
The credit markets and the financial services industry continue to experience a period of significant disruption characterized by the bankruptcy, failure, collapse or sale of various financial institutions, increased volatility in securities prices, severely diminished liquidity and credit availability and a significant level of intervention from the United States and other governments. Continued concerns about the systemic impact of potential long-term or widespread recession, energy costs, geopolitical issues, the availability and cost of credit, the global commercial and residential real estate markets and related mortgage markets and reduced consumer confidence have contributed to increased market volatility and diminished expectations for most developed and emerging economies. As a result of these market conditions, the cost and availability of credit has been and may continue to be adversely affected by illiquid credit markets and wider credit spreads.
Due to current economic conditions, we cannot be certain that funding for our capital and operating needs on a long term basis will be available from our existing financial institutions and the credit markets if needed, and if available, to the extent required, and on acceptable terms. Our 2009 Revolving Credit Facility matures in September 2013, which we feel should cover our foreseeable liquidity needs. However, if we cannot obtain sufficient funding when needed, or on acceptable terms, we may be unable to continue our current rate of growth and store expansion, which may have an adverse effect on our revenues and results of operations.
11
Table of Contents
Recent legislation regarding healthcare may adversely impact our results of operations
We currently provide medical and dental insurance benefits to substantially all of our full-time employees. The Patient Protection and Affordable Care Act, signed into law in March 2010, may cause the cost of providing medical insurance to our employees to increase. We may not be able to pass these costs on to our customers, which could have an adverse impact on our results of operations and cash flows.
Risks Relating to the Shares and this Offering
Shares eligible for future sale may cause the market price of our common stock to decline, even if our business is doing well.
Sales of substantial amounts of our common stock in the public market after this offering, or the perception that these sales may occur, could adversely affect the price of our common stock and could impair our ability to raise capital through the sale of additional equity securities. Our amended and restated certificate of incorporation authorizes us to issue 400,000,000 shares of common stock and we have 27,047,234 shares of common stock issued and outstanding as of April 30, 2010. As of April 30, 2010, there were a total of 3,439,710 options outstanding, of which 2,665,074 were vested and 41,563 were available for grant under the Amended and Restated 2006 Stock Option Plan of Vitamin Shoppe, Inc. (the “2006 Plan”). In addition, 137,051 shares of restricted stock and 350,223 options were outstanding and 897,223 shares were available for grant under the Vitamin Shoppe 2009 Equity Incentive Plan (the “2009 Plan”), and 200,000 shares were issuable under the 2010 Employee Stock Purchase Plan (“ESPP”) as of April 30, 2010. Upon completion of this offering, approximately 10.2 million shares of our common stock will be subject to lock-up agreements with the underwriters, restricting the sale of such shares for 90 days after the date of this prospectus (subject to extension). These lock-up agreements are subject to a number of exceptions and holders may be released from these agreements without prior notice at the discretion of underwriters. See “Shares Eligible for Future Sale.” Some of our stockholders are entitled, subject to limited exceptions, to demand registration rights with respect to the registration of shares under the Securities Act of 1933, as amended (the “Securities Act”). By exercising their registration rights, and selling a large number of shares, these holders could cause the price of our common stock to decline. An estimated 10.3 million shares of common stock will be entitled to demand registration rights 90 days after completion of this offering (subject to extension).
Our stock price may continue to be volatile or may decline regardless of our operating performance, and you may not be able to resell your shares at or above the price at which you purchase them.
The initial public offering of our common stock was completed in November 2009 at a price of $17.00 per share. There has been a public market for our common stock for only a short period of time. An active, liquid and orderly market for our common stock may not be sustained, which could depress the trading price of our common stock. An inactive market may also impair our ability to raise capital to continue to fund operations by selling shares. In addition, the market price of our common stock may fluctuate significantly in response to a number of factors, most of which we cannot control.
Approximately 35.9% of our voting power will be controlled by one principal stockholder whose interests may conflict with those of our other stockholders.
Upon completion of this offering, affiliates of IPC will hold approximately 35.9% of our voting power. As a result of their ownership, IPC will continue to have significant influence in the consideration of all matters requiring the approval of our stockholders and/or our board of directors. This influence may also have the effect of delaying or preventing a change in control of our company or discouraging others from making tender offers for our shares, which could prevent stockholders from receiving a premium for their shares.
12
Table of Contents
Our amended and restated certificate of incorporation provides that IPC and its affiliates are not required to offer corporate opportunities of which they become aware to us and could therefore offer such opportunities instead to other companies including portfolio companies of IPC.
In addition, pursuant to a securityholders agreement between us, IPC and certain of our other stockholders, for so long as IPC owns at least 25% of our outstanding capital stock, the other stockholders party thereto will vote to elect to our board of directors three representatives designated by IPC. See “Certain Relationships and Related Party Transactions—Securityholders Agreement.” Our certificate of incorporation also provides that for so long as IPC owns at least 33 1/3% of the votes entitled to be cast by our then-outstanding common stock, we will not, among other things, enter into certain significant transactions without the prior consent of IPC. See “Description of Capital Stock—Provisions Relating to Control by IPC.”
We do not currently intend to pay dividends on our common stock, and as a result, your only opportunity to achieve a return on your investment is if the price of our common stock appreciates.
We have not declared or paid any cash dividends on our common stock and we do not expect to declare or pay any cash dividends on our common stock in the foreseeable future. In addition, our senior credit facility may limit our ability to declare and pay cash dividends on our common stock. For more information, see “Dividend Policy.” As a result, your only opportunity to achieve a return on your investment in us will be if the market price of our common stock appreciates and you sell your shares at a profit. The market price for our common stock after this offering might never exceed the price that you pay for our common stock in this offering.
Certain provisions of our corporate governing documents and Delaware law could discourage, delay, or prevent a merger or acquisition at a premium price.
Certain provisions of our organizational documents and Delaware law could discourage potential acquisition proposals, delay or prevent a change in control of our company, or limit the price that investors may be willing to pay in the future for shares of our common stock. For example, our certificate of incorporation and by-laws permit us to issue, without any further vote or action by the stockholders, up to 250,000,000 shares of preferred stock in one or more series and, with respect to each series, to fix the number of shares constituting the series and the designation of the series, the voting powers (if any) of the shares of the series, and the preferences and relative, participating, optional, and other special rights, if any, and any qualifications, limitations, or restrictions of the shares of the series. See “Description of Capital Stock—Antitakeover Effects of Provisions of the Certificate of Incorporation and Bylaws” and “—Antitakeover Legislation.”
13
Table of Contents
SPECIAL NOTE REGARDING FORWARD-LOOKING STATEMENTS
This prospectus contains statements that do not directly or exclusively relate to historical facts. As a general matter, forward-looking statements are those focused upon anticipated events or trends and expectations and beliefs relating to matters that are not historical in nature. The words “believe,” “expect,” “plan,” “intend,” “estimate” or “anticipate” and similar expressions, as well as future or conditional verbs such as “will,” “should,” “would,” and “could,” often identify forward-looking statements. Such forward-looking statements are subject to uncertainties and factors relating to our operations and business environment, any of which are difficult to predict and many of which are beyond our control. These uncertainties and factors could cause actual results to differ materially from those matters expressed in or implied by such forward-looking statements.
The following uncertainties and factors, among others (including those set forth under “Risk Factors”), could affect future performance and cause actual results to differ materially from those expressed in or implied by forward-looking statements:
| • | unfavorable publicity or consumer perception of our products; |
| • | the impact of our substantial indebtedness on our financial health; |
| • | our continued ability to effectively manage and defend litigation matters pending, or asserted in the future, against us, including product liability claims; |
| • | our ability to obtain insurance coverage at current rates or at all; |
| • | compliance with government regulations; |
| • | our ability to maintain and to enter into key purchasing, supply and outsourcing relationships; |
| • | changes in our raw material costs; |
| • | increases in fuel prices; |
| • | disruptions to our warehouse and distribution facility; |
| • | the ability of our new store base to achieve sales and operating levels consistent with our mature store base; |
| • | pricing of our products; |
| • | the maturation of our stores opened since 2006; |
| • | our ability to protect our brand name; |
| • | our ability to renew our current leases and enter into new leases on terms acceptable to us; |
| • | the successful implementation of other strategic initiatives, including, without limitation, opening new stores and improving the functionality of our websites; and |
| • | our ability to continue to access credit on terms previously obtained for the funding of our operations and capital projects. |
14
Table of Contents
The selling stockholders will receive all of the proceeds from this offering. We will not receive any proceeds from the sale of shares of our common stock in this offering. We will pay the expenses, other than underwriting discounts and commissions, associated with the sale of shares by the selling stockholders. However, the underwriters have agreed to reimburse us for certain of our expenses in connection with this offering. The selling stockholders include our principal stockholder, IPC and members of management. Certain affiliates of J.P. Morgan Securities, Inc. will receive a portion of the proceeds of this offering. See “Principal and Selling Stockholders.”
We have not declared or paid any cash dividends on our common stock since the acquisition of our company by IPC in November 2002. We currently expect to retain future earnings, if any, for use in the operation and expansion of our business and do not anticipate paying any cash dividends in the foreseeable future. Our ability to pay cash dividends on our common stock is limited by the covenants of our credit facility and may be further restricted by the terms of any of our future debt or preferred securities.
We have only one authorized class of common equity, which is our common stock. As of April 30, 2010, we had 36 holders of record.
Our common stock has been listed on The New York Stock Exchange (“NYSE”) under the symbol “VSI” since our initial public offering completed on November 2, 2009, at $17.00 per share. Prior thereto, there was no public market for our common stock. The following table sets forth the high and low sales prices of our common stock per share, as reported by The NYSE.
| High | Low | |||||
| Fiscal Year Ended December 26, 2009 |
||||||
| November 2, 2009 through December 26, 2009 |
$ | 23.09 | $ | 17.51 | ||
| Fiscal Year Ending December 25, 2010 |
||||||
| 1st Quarter ended March 27, 2010 |
$ | 24.00 | $ | 19.31 | ||
| March 28, 2010 through May 17, 2010 |
$ | 27.71 | $ | 20.92 | ||
15
Table of Contents
The table below sets forth our cash and cash equivalents and capitalization as of March 27, 2010.
The table below should be read in conjunction with our consolidated financial statements and the related notes thereto included elsewhere in this prospectus.
| As of March 27, 2010 |
||||
| Cash and cash equivalents |
$ | 12,162 | ||
| Obligations under capital lease, net of current portion of $1,595 |
$ | 1,953 | ||
| Second Priority Senior Secured Floating Rate Notes |
100,106 | |||
| Total long-term debt (1) |
102,059 | |||
| Common stock: $0.01 par value; 400,000,000 shares authorized and 26,849,710 shares of common stock issued and outstanding on March 27, 2010. |
268 | |||
| Additional paid-in-capital |
212,171 | |||
| Accumulated other comprehensive loss |
(535 | ) | ||
| Retained earnings |
33,332 | |||
| Total stockholders’ equity |
245,236 | |||
| Total capitalization |
$ | 347,295 | ||
| (1) | Total long-term debt excludes debt outstanding under our 2009 Revolving Credit Facility of $20.0 million, which is classified as a current liability on our consolidated balance sheet. |
16
Table of Contents
SELECTED CONSOLIDATED FINANCIAL DATA
Our fiscal years end on the last Saturday in December and are designated by the calendar year in which the fiscal year ends. As used herein, the term “Fiscal” with respect to years 2006, 2007, 2008 and 2009 refers to the 52-week period ending on the last Saturday in December of such year. The term “Fiscal 2005” refers to the 53-week period ended December 31, 2005. With respect to any other year, the term “Fiscal” refers to the 52-week or 53-week period, as applicable, ended on the last Saturday in December of such year. Results for the periods presented represent the results of Vitamin Shoppe, Inc. and its subsidiary.
The following table sets forth selected historical consolidated financial information for the Company for the periods presented. The statement of operations data for Fiscal 2009, Fiscal 2008 and Fiscal 2007 and the balance sheet data as of Fiscal 2009 and Fiscal 2008 have been derived from the audited financial statements included in this prospectus. The balance sheet data as of Fiscal 2007, Fiscal 2006 and Fiscal 2005, and the statements of operations data for Fiscal 2006 and Fiscal 2005, have been derived from our consolidated financial statements which are not included in this prospectus. The statements of operations data for the three months ended March 27, 2010 and for the three months ended March 28, 2009, and the balance sheet data as of March 27, 2010 have been derived from our unaudited condensed consolidated financial statements included in this prospectus, which, in our opinion, contain adjustments which are of a normal recurring nature, which we consider necessary to present fairly our financial position and results of operations at such dates and for such periods. The balance sheet data as of March 28, 2009 has been derived from our unaudited condensed consolidated financial statements which are not included in this prospectus. Results for the three months ended March 27, 2010 are not necessarily indicative of the results that may be expected for the entire fiscal year.
The selected historical consolidated financial data below should be read in conjunction with “Management’s Discussion and Analysis of Financial Condition and Results of Operations” and our financial statements and notes thereto included in this prospectus.
17
Table of Contents
| Three Months Ended | Year Ended | |||||||||||||||||||||||||||
| March 27, 2010 |
March 28, 2009 |
December 26, 2009 |
December 27, 2008 |
December 29, 2007 |
December 30, 2006 |
December 31, 2005 |
||||||||||||||||||||||
| (data presented in thousands, except for share and per share data and number of stores) | ||||||||||||||||||||||||||||
| Statement of Operations Data: |
||||||||||||||||||||||||||||
| Net sales |
$ | 191,613 | $ | 172,555 | $ | 674,495 | $ | 601,540 | $ | 537,872 | $ | 486,026 | $ | 436,463 | ||||||||||||||
| Cost of goods sold |
126,599 | 115,543 | 457,573 | 405,659 | 360,346 | 326,523 | 290,243 | |||||||||||||||||||||
| Gross profit |
65,014 | 57,012 | 216,922 | 195,881 | 177,526 | 159,503 | 146,220 | |||||||||||||||||||||
| Selling, general and administrative expenses |
46,942 | 43,941 | 173,144 | 158,713 | 143,544 | 128,821 | 126,514 | |||||||||||||||||||||
| Related party expenses |
— | 370 | 2,446 | 1,523 | 1,365 | 1,356 | 1,799 | |||||||||||||||||||||
| Income from operations |
18,072 | 12,701 | 41,332 | 35,645 | 32,617 | 29,326 | 17,907 | |||||||||||||||||||||
| Extinguishment of debt and other (1) |
552 | — | 2,016 | — | — | (366 | ) | 11,573 | ||||||||||||||||||||
| Interest expense, net |
2,927 | 5,007 | 18,636 | 21,137 | 22,045 | 21,788 | 19,386 | |||||||||||||||||||||
| Income (loss) before provision (benefit) for income taxes |
14,593 | 7,694 | 20,680 | 14,508 | 10,572 | 7,904 | (13,052 | ) | ||||||||||||||||||||
| Provision (benefit) for income taxes |
5,867 | 3,132 | 8,014 | 6,341 | 3,792 | 3,242 | (5,063 | ) | ||||||||||||||||||||
| Income (loss) before cumulative effect of accounting change |
8,726 | 4,562 | 12,666 | 8,167 | 6,780 | 4,662 | (7,989 | ) | ||||||||||||||||||||
| Cumulative effect of accounting change |
— | — | — | — | — | — | 2,280 | |||||||||||||||||||||
| Net income (loss) |
8,726 | 4,562 | 12,666 | 8,167 | 6,780 | 4,662 | (5,709 | ) | ||||||||||||||||||||
| Preferred stock dividends in arrears |
— | 2,577 | 7,692 | 9,279 | 9,105 | 8,412 | 7,771 | |||||||||||||||||||||
| Net income (loss) available to common stockholders |
$ | 8,726 | $ | 1,985 | $ | 4,974 | $ | (1,112 | ) | $ | (2,325 | ) | $ | (3,750 | ) | $ | (13,480 | ) | ||||||||||
| Weighted average shares outstanding: |
||||||||||||||||||||||||||||
| Basic |
26,692,983 | 14,175,906 | 16,238,338 | 14,175,906 | 14,175,906 | 14,175,906 | 14,175,906 | |||||||||||||||||||||
| Diluted |
27,708,463 | 15,969,484 | 17,748,371 | 14,175,906 | 14,175,906 | 14,175,906 | 14,175,906 | |||||||||||||||||||||
| Net income (loss) per share: |
||||||||||||||||||||||||||||
| Basic |
$ | 0.33 | $ | 0.14 | $ | 0.31 | $ | (0.08 | ) | $ | (0.16 | ) | $ | (0.26 | ) | $ | (0.95 | ) | ||||||||||
| Diluted |
$ | 0.31 | $ | 0.12 | $ | 0.28 | $ | (0.08 | ) | $ | (0.16 | ) | $ | (0.26 | ) | $ | (0.95 | ) | ||||||||||
| Other Financial Data: |
||||||||||||||||||||||||||||
| Depreciation and amortization of fixed and intangible assets |
$ | 5,414 | $ | 5,078 | $ | 21,095 | $ | 17,483 | $ | 14,882 | $ | 13,728 | $ | 13,020 | ||||||||||||||
| Operating Data: |
||||||||||||||||||||||||||||
| Number of stores at end of period |
453 | 418 | 438 | 401 | 341 | 306 | 275 | |||||||||||||||||||||
| Net sales per store (2) |
$ | 373 | $ | 363 | $ | 1,361 | $ | 1,303 | $ | 1,355 | $ | 1,332 | $ | 1,317 | ||||||||||||||
| Comparable store sales growth (3) |
6.2 | % | 5.1 | % | 5.2 | % | 6.2 | % | 6.2 | % | 6.6 | % | 0.1 | % | ||||||||||||||
| Average square footage per store |
3.7 | 3.7 | 3.7 | 3.7 | 3.7 | 3.7 | 3.7 | |||||||||||||||||||||
| Balance Sheet Data: |
||||||||||||||||||||||||||||
| Working capital |
$ | 62,451 | $ | 56,635 | $ | 50,416 | $ | 52,285 | $ | 51,175 | $ | 38,248 | $ | 28,268 | ||||||||||||||
| Total assets |
475,687 | 463,124 | 469,257 | 463,705 | 428,330 | 411,670 | 408,601 | |||||||||||||||||||||
| Total debt, including capital lease obligations |
123,654 | 186,326 | 123,946 | 186,382 | 165,000 | 171,500 | 177,127 | |||||||||||||||||||||
| (1) | For the first fiscal quarter of 2010, extinguishment of debt includes $0.3 million for the write-off of the related portion of deferred financing fees and a portion of the unrecognized loss of our terminated interest rate swap of and $0.2 million, related to the redemption of a portion of our Notes during January 2010. For Fiscal 2009 extinguishment of debt includes $0.4 million for the premium on the repurchase of a portion of our Notes, along with the write-off of the related portions of deferred financing fees and a portion of the unrecognized loss of our terminated interest rate swap of $0.7 million and $0.6 million, respectively, as well as a $0.3 million write-off of deferred financing fees related to the repayment of our former revolving credit facility which was terminated in September 2009. For |
18
Table of Contents
| Fiscal 2005 extinguishment of debt includes $11.1 million of expenses related to the repayment of our previous debt upon our issuance of our Notes (which consists of $7.7 million of original issue discount related to the allocation of value to the warrants and Vitamin Shoppe, Inc. (formerly VS Holdings, Inc.) Preferred Stock and $3.4 million of deferred financing fees from the previous debt), as well as $0.4 million in expense relating to our interest rate swap. |
| (2) | Net sales per store is calculated by dividing retail net sales by the number of stores open at the end of the period. |
| (3) | A store is included in comparable store sales after 410 days of operation. |
19
Table of Contents
MANAGEMENT’S DISCUSSION AND ANALYSIS OF
FINANCIAL CONDITION AND RESULTS OF OPERATIONS
The following Management’s Discussion and Analysis of our Financial Condition and Results of Operations should be read in conjunction with the consolidated financial statements and notes thereto included in this prospectus. The discussion in this section contains forward-looking statements that are based upon current expectations. The forward-looking statements contained herein include, without limitation, statements concerning future revenue sources and concentration, gross profit margins, selling and marketing expenses, research and development expenses, general and administrative expenses, capital resources, additional financings or borrowings and additional losses and are subject to risks and uncertainties including, but not limited to, those discussed below and elsewhere in this prospectus that could cause actual results to differ materially from the results contemplated by these forward-looking statements. We also urge you to carefully review the information set forth in “Special Note Regarding Forward-Looking Statements” and “Risk Factors.”
Overview
We are a leading specialty retailer and direct marketer of vitamins, minerals, herbs, supplements, sports nutrition and other health and wellness products. For each of the past three years, we have been the second largest in retail sales and the fastest growing national VMS specialty retailer. We market over 700 different nationally recognized brands as well as our proprietary Vitamin Shoppe, BodyTech and MD Select brands. We believe we offer the greatest variety of products among VMS retailers with approximately 8,000 SKUs offered in our typical store and an additional 12,000 SKUs available through our Internet and catalog direct sales channels. Our broad product offering enables us to provide our target customers with a selection of products not readily available at other specialty VMS retailers or mass merchants, such as supermarkets and drugstore chains. We target the dedicated, well-informed VMS consumer and differentiate ourselves by providing high quality products at competitive prices in an educational and high-touch customer service environment. We believe our extensive product offering, together with our well-known brand name and emphasis on product education and customer service, help us bond with our target customer and serve as a foundation for strong customer loyalty.
Our company was founded as a single store in New York, New York in 1977. Our Vitamin Shoppe branded products were introduced in 1989. We were acquired in November 2002 by IPC and other investors.
Segment Information
We sell our products through two business segments: retail and direct.
Retail
Since the beginning of Fiscal 2006 through Fiscal 2009, we have leveraged our successful store economic model by opening a total of 169 new stores. Over the past five years, we have expanded our presence in our existing markets as well as entered many new markets such as California, Texas, Michigan and Hawaii. As of March 27, 2010, we operated 453 stores in 37 states and the District of Columbia located in high-traffic regional centers. In the first three months of Fiscal 2010, our retail segment generated net sales of $169.1 million, representing a 11.5% increase over the first three months of Fiscal 2009 retail net sales of $151.6 million. We have achieved positive comparable store sales for 16 consecutive years (prior to which we did not track comparable store sales), including comparable store sales growth of 5.2% and 6.2% in 2009 and 2008, respectively, and 6.2% and 5.1% for the three months ended March 27, 2010 and March 28, 2009, respectively. In Fiscal 2009, our retail segment generated net sales of $596.3 million, representing a 14.1% increase over Fiscal 2008 retail net sales of $522.5 million. From Fiscal 2006 to Fiscal 2009, we have grown our net sales in our retail segment at approximately a 13.5% CAGR. From Fiscal 2006 to Fiscal 2009, we have grown our store base at a 6.4% CAGR.
20
Table of Contents
Direct
We sell our products directly to consumers through our websites, primarily www.vitaminshoppe.com. Our websites and our catalog complement our in-store experience by extending our retail product offerings with an additional 12,000 SKUs that are not available in our stores and enable us to access customers outside our retail markets and those who prefer to shop online. Catalog sales were not material in Fiscal 2009, and are expected to remain immaterial in the future, as customers migrate to our website and stores. In Fiscal 2009 we increased the number of active online customers, defined by shopping frequency and annual dollars spent, by approximately 60,000 to more than 460,000. In the first three months of Fiscal 2010, our direct segment generated net sales of $22.6 million representing a 7.8% increase over the first three months of Fiscal 2009 direct net sales of $20.9 million. In Fiscal 2009, the direct segment generated net sales of $78.2 million representing a 1.0% decrease over Fiscal 2008 direct net sales of $79.0 million.
Trends and Other Factors Affecting Our Business
The VMS industry in the U.S. is highly fragmented, and based on information from the NBJ and public filings with the SEC, no single industry participant accounted for more than 5% of total industry sales in 2008. Retailers of VMS products primarily include specialty retailers and mass merchants, such as drugstores and supermarkets. The specialty retailers typically cater to the more sophisticated VMS customer by focusing on selection and customer service, while the mass merchants generally offer a limited assortment comprised of more mainstream products with less customer care. Specialty retailers comprised the largest segment of the market in 2008, with 37% market share, sales in which are forecasted to grow by 4.7% annually through 2014, according to the NBJ.
According to the NBJ, growth in the U.S. nutritional supplement industry from 2006 through 2008 has been led by specialty supplements, which have grown due to increasing popularity of condition-specific products, including glucosamine / chondroitin (for joint health), homeopathics (for miscellaneous conditions), fish oils (for cardiovascular health), Coenzyme Q10 (CoQ10) (for energy and cardiac health), vitamin D (for bone support through better calcium absorption) and probiotics (for digestive health). Consumers use nutritional supplements to improve their lifestyles, support specific health conditions, and keep themselves feeling younger and more active. According to the NBJ from 2009 to 2014, the U.S. specialty supplement product category is expected to grow at a 5.9% CAGR, or approximately 38% faster than the overall industry. The specialty supplements product category represented 17.9% of the total U.S. nutritional supplement industry in 2008. By way of comparison, specialty supplements, the fastest growing product category in the VMS industry, generated 26.9% of our Fiscal 2009 net sales. We over-index our concentration in specialty supplements to focus on target customers who emphasize health and wellness as part of their lifestyle.
Sports nutrition products represented approximately 10.8% of the total U.S. nutritional supplement industry in 2008. By way of comparison, sports nutrition products, grouped in a manner consistent with NBJ’s data, generated approximately 29.1% of our Fiscal 2009 net sales. We believe our sports nutrition offering emphasizes products such as protein powders which appeal to our customers’ emphasis on health and wellness rather than products taken in conjunction with a body building regimen. From 2009 to 2014, the sports nutrition product category is expected to grow at a 5.5% CAGR, representing the second fastest growing product category in the VMS industry.
We believe that one of the primary trends driving the growth in the industry is the aging U.S. population. The total U.S. population of people 50 and older is expected to increase to 115 million people in 2018 from 94 million people in 2008, a CAGR of 2.1%, which is more than twice the overall population growth rate. The aging Baby Boomer generation comprises a significant and increasing part of the 50 and older population.
Critical Accounting Policies
The preparation of financial statements in conformity with accounting principles generally accepted in the United States of America requires management to make estimates and assumptions that affect the reported amounts of assets and liabilities and disclosure of contingent assets and liabilities at the date of the financial
21
Table of Contents
statements, and the reported amounts of revenue and expenses during the reporting period. Critical accounting policies are those that are the most important portrayal of our financial condition and results of operations, and require our most difficult, subjective and complex judgments as a result of the need to make estimates about the effect of matters that are inherently uncertain. While our significant accounting policies are described in more detail in the notes to our financial statements, our most critical accounting policies, discussed below, pertain to revenue recognition, inventories, impairment of long-lived assets, goodwill and other intangible assets, deferred sales for our Healthy Awards Program, stock-based compensation and income taxes. In applying such policies, we must use some amounts that are based upon our informed judgments and best estimates. Estimates, by their nature, are based on judgments and available information. The estimates that we make are based upon historical factors, current circumstances and the experience and judgment of management. We evaluate our assumptions and estimates on an ongoing basis.
Revenue Recognition
We recognize revenue upon sale of our products when merchandise is sold “over-the-counter” in retail stores or upon delivery to a direct customer, net of sales returns. In addition, we classify all amounts billed to customers that represent shipping fees as sales. To arrive at net sales, gross sales are reduced by deferred sales, actual customer returns, and a provision for estimated future customer returns, which is based on management’s review of historical and current customer returns. The net amounts reserved for sales returns were $0.1 million at both December 26, 2009 and December 27, 2008. Sales taxes collected from customers are presented on a net basis and as such are excluded from revenue.
Inventories
Inventories are stated at the lower of cost or market value. Cost is determined using the moving weighted average method. As applied to inventories, cost means in principle the sum of the applicable expenditures and charges directly or indirectly incurred in bringing the product to its existing condition and location. Finished goods inventory includes costs on freight on internally transferred merchandise, rent for the distribution center and costs associated with our buying department and distribution facility, including payroll which are capitalized into inventory and then expensed as merchandise is sold. In addition, the cost of inventory is reduced by purchase discounts and allowances received from certain of our vendors. We adjust our inventory to reflect situations in which the cost of inventory is not expected to be recovered. We regularly review our inventory, including when a product is close to expiration and not expected to be sold, when a product has reached its expiration date, or when a product is not expected to be saleable. In determining the reserves for these products we consider factors such as the amount of inventory on hand and its remaining shelf life, and current and expected market conditions, including management forecasts and levels of competition. We have evaluated the current level of inventory considering historical trends and other factors, and based on our evaluation, have recorded adjustments to reflect inventory at net realizable value. These adjustments are estimates, which could vary significantly from actual results if future economic conditions, customer demand or competition differ from expectations. These estimates require us to make assessments about the future demand for our products in order to categorize the status of such inventory items as slow moving, obsolete or in excess of need. These future estimates are subject to the ongoing accuracy of management’s forecasts of market conditions, industry trends and competition. We are also subject to volatile changes in specific product demand as a result of unfavorable publicity, government regulation and rapid changes in demand for new and improved products or services. At both December 26, 2009 and December 27, 2008, obsolescence reserves were $1.4 million.
Long-Lived Assets
We evaluate long-lived assets, including fixed assets and intangible assets with finite useful lives, periodically for impairment whenever events or changes in circumstances indicate that the carrying amount of any such asset may not be recoverable. If the sum of our estimated undiscounted future cash flows is less than the carrying value, we recognize an impairment loss, measured as the amount by which the carrying value exceeds
22
Table of Contents
the fair value of the asset. These estimates of cash flow require significant management judgment and certain assumptions about future volume, sales and expense growth rates, devaluation and inflation. As such, these estimates may differ from actual cash flows. For the periods presented, we had no impairments of our long-lived assets.
Goodwill and Other Intangible Assets
On an annual basis, or whenever impairment indicators exist, we perform a valuation of goodwill and indefinite lived intangible assets. In the absence of any impairment indicators, goodwill and other indefinite lived intangible assets are tested in the fourth quarter of each fiscal year. With regards to goodwill, our tests are based on our two reporting units, and utilize the discounted cash flow method, based on our current operating projections. For those intangible assets which have definite lives, we amortize their cost on a straight-line basis over their estimated useful lives which are various periods based on their contractual terms. Judgments regarding the existence of impairment indicators are based on market conditions and operational performance of the business. Future events could cause us to conclude that impairment indicators exist, and therefore that goodwill and other intangible assets are impaired. To the extent that the fair value associated with the goodwill and indefinite-lived intangible assets is less than the recorded value, we would write down the value of the asset to its fair value.
Our impairment test involves calculating the fair value of both our reporting units (our segments) using the discounted cash flow method along with the market multiples method which is used for additional validation of the value calculated. Both of these valuation methods require us to make certain assumptions and estimates regarding certain industry trends and future profitability of our reporting units. It is our policy to conduct goodwill impairment testing from information based on our most current business projections, which include projected future revenues and cash flows. The cash flows utilized in the discounted cash flow analysis are based on five-year financial forecasts developed internally by our management. Cash flows for each unit are discounted using an internally derived weighted average cost of capital which reflects the costs of borrowing for the funding of each unit as well as the risk associated with the units themselves and the industry they perform in. If the carrying amount of a reporting unit exceeds its fair value, we would compare the implied fair value of the reporting unit goodwill with its carrying value. To compute the implied fair value, we would assign the fair value of the reporting unit to all of the assets and liabilities of that unit (including any unrecognized intangible assets) as if the reporting unit had been acquired in a business combination. The excess of the fair value of a reporting unit over the amounts assigned to its assets and liabilities is the implied fair value of goodwill. If the carrying value of the reporting unit goodwill exceeded the implied fair value of the reporting unit goodwill, we would record an impairment loss to write down such goodwill to its implied fair value. The valuation of goodwill and indefinite-lived intangible assets is affected by, among other things, our business plan for the future and estimated results of future operations. Changes in the business plan or operating results that are different than the estimates used to develop the valuation of the assets may impact their valuation.
We have tested our goodwill and indefinite-lived intangibles for impairment in the fourth quarter of each fiscal year presented and concluded there was no impairment relative to such assets. Accordingly, there is no impairment expense recorded in any of the periods presented.
Deferred Sales
Our frequent buyer program allows customers to earn points toward free merchandise based on the volume of purchases. Points are earned each year under our frequent buyer program and are redeemable within the first three months of the following year or they expire. We defer sales as points are earned, which are based on historical redemption data as well as marketing data within the current period, and record a liability for points earned based on the value of points that are expected to be redeemed. Net increases to deferred sales were $1.3 million, $1.8 million and $0.3 million for the years ended December 26, 2009, December 27, 2008 and December 29, 2007, respectively. The balance for the deferred sales liability was $14.4 million and $13.0 million at December 26, 2009 and December 27, 2008, respectively.
23
Table of Contents
Stock-Based Compensation
We account for our stock-based compensation based on fair value recognitions requirements, as defined by the generally accepted accounting principles. Stock-based compensation cost is measured at the grant date based on the fair value of awards and is recognized as expense over the vesting period net of forfeitures. Determining the fair value of stock-based awards at the grant date requires considerable judgment, including estimating expected volatility, expected term and risk-free rate. Our expected volatility is based on the volatility levels over the past 6.25 years and 4.81 years (our expected holding periods), depending on the grant, from the average volatility of similar actively traded companies. The expected holding period of an option is calculated using the simplified method using the vesting term of 4 years and the contractual terms of 10 years, and in certain instances, contractual terms of 7.5 years. The simplified method was chosen as a means to determine our holding period as prior to November 2009 there was no historical option exercise experience as we were privately held. As of December 26, 2009, there is insufficient information due to our being a new publicly owned company. The risk-free interest rate is derived from the average yield for the five and seven year zero-coupon U.S. Treasury Strips. If factors change and we employ different assumptions, stock-based compensation expense may differ significantly from what we have recorded in the past. As a result of our application of fair value recognition requirements, we expect stock-based compensation expense to increase significantly over the next several years.
Amounts charged to expense were $3.0 million, $2.4 million and $1.6 million for stock-based compensation for Fiscal 2009, Fiscal 2008, and Fiscal 2007, respectively. The weighted average fair value for grants for Fiscal 2009, Fiscal 2008, and Fiscal 2007 was $7.70, $7.92, and $7.04, respectively.
Income Taxes
We provide for income taxes using the liability method which provides guidance on recording taxes for financial statement purposes. Deferred income taxes reflect the tax effects of temporary differences between the carrying amounts of assets and liabilities for financial reporting purposes and the amounts used for income tax purposes. We periodically assess the realizability of deferred tax assets and the adequacy of deferred tax liabilities, based on the results of local, state, federal or foreign statutory tax audits or estimates and judgments used.
Realization of deferred tax assets associated with net operating loss and tax credit carryforwards is dependent upon generating sufficient taxable income prior to their expiration in the applicable tax jurisdiction. We periodically review the recoverability of tax assets recorded on our balance sheet, and provide valuation allowances as we deem necessary, to reduce deferred tax assets to the amount that more likely than not will be realized. Deferred tax assets could be reduced in the near term if our estimates of taxable income during the carryforward period are significantly reduced or alternative tax strategies are no longer viable.
Effective December 31, 2006, we adopted the provisions of then newly issued accounting literature, which provides guidance for accounting for uncertainty in income tax positions. Such literature provides guidance for the recognition threshold and measurement attribute for financial statement recognition and measurement of a tax position taken or expected to be taken in a tax return. In accordance with and upon implementation of this guidance, we recognized an adjustment of $2.7 million, increasing our liability for uncertain tax positions and interest, and reducing the December 31, 2006 balance of retained earnings by $0.2 million as well as increasing the balance of goodwill by $1.4 million. See Note 7 to our consolidated financial statements for more information on income taxes.
Prior to Fiscal 2007 and the adoption of accounting for uncertain tax positions, reserves were recorded when management determined that it was probable that a loss would be incurred related to these matters and the amount of the loss was reasonably determinable. Subsequent to the adoption of accounting for uncertainties in tax positions, we recognize the largest amount that is more likely than not to be sustained upon audit by the
24
Table of Contents
relevant taxing authority, the impact of an uncertain income tax position on our income tax return. An uncertain income tax position will not be recognized if it has less than a 50% likelihood of being sustained. The tax positions are analyzed periodically (at least quarterly) and adjustments are made as events occur that warrant adjustments for those positions. We record interest expense and penalties payable to relevant tax authorities as income tax expense.
General Definitions for Operating Results
Net Sales consist of sales, net of sales returns and deferred sales, from comparable stores and non comparable stores, as well as sales made directly to our internet and catalog customers. A store is included in comparable store sales after 410 days of operation.
Cost of goods sold, which excludes depreciation and amortization which is included within Selling, general and administrative expenses, includes the cost of inventory sold, costs of warehousing and distribution and store occupancy costs. Warehousing and distribution costs include freight on internally transferred merchandise, rent for the distribution center and costs associated with our buying department and distribution facility, including payroll, which are capitalized into inventory and then expensed as merchandise is sold. Store occupancy costs include rent, common area maintenance, real estate taxes and utilities.
Gross profit is net sales minus cost of goods sold.
Selling, general and administrative expenses consist of depreciation and amortization of fixed and intangible assets, operating payroll and related benefits, advertising and promotion expense, and other selling, general and administrative expenses.
Related party expenses consist of management fees incurred and paid to IPC Manager II, LLC.
Income from operations consists of gross profit minus selling, general and administrative expenses, and related party expenses.
Extinguishment of debt represents expenses incurred in connection with the redemption or repayment of debt.
Interest income represents income earned from highly liquid investments purchased with an original maturity of three months or less.
Interest expense includes interest on the Notes, amortization of debt discount and amortization of financing costs, and interest on the revolving credit line.
Key Performance Indicators and Statistics
We use a number of key indicators of financial condition and operating results to evaluate the performance of our business, including the following (in thousands):
| Three Months Ended | Year Ended | |||||||||||||||||||
| March 27, 2010 |
March 28, 2009 |
December 26, 2009 |
December 27, 2008 |
December 29, 2007 |
||||||||||||||||
| Net sales |
$ | 191,613 | $ | 172,555 | $ | 674,495 | $ | 601,540 | $ | 537,872 | ||||||||||
| Increase in comparable store net sales |
6.2 | % | 5.1 | % | 5.2 | % | 6.2 | % | 6.2 | % | ||||||||||
| Gross profit as a percent of net sales |
33.9 | % | 33.0 | % | 32.2 | % | 32.6 | % | 33.0 | % | ||||||||||
| Income from operations |
$ | 18,072 | $ | 12,701 | $ | 41,332 | $ | 35,645 | $ | 32,617 | ||||||||||
25
Table of Contents
The following table shows the growth in our network of stores for the three months ended March 27, 2010 and March 28, 2009 and Fiscal 2009, Fiscal 2008 and Fiscal 2007:
| Three Months Ended | Fiscal Year | |||||||||||||
| March 27, 2010 |
March 28, 2009 |
2009 | 2008 | 2007 | ||||||||||
| Stores open at beginning of year |
438 | 401 | 401 | 341 | 306 | |||||||||
| Stores opened |
16 | 17 | 39 | 62 | 36 | |||||||||
| Stores closed |
(1 | ) | — | (2 | ) | (2 | ) | (1 | ) | |||||
| Stores open at end of period |
453 | 418 | 438 | 401 | 341 | |||||||||
Results of Operations
The information presented below is for the three months ended March 27, 2010 and March 28, 2009, which was derived from our unaudited consolidated financial statements and, in the opinion of management, includes all adjustments necessary for a fair presentation of our financial position and operating results for such periods and as of such dates and the fiscal years ended December 26, 2009, December 27, 2008 and December 29, 2007, which was derived from our audited consolidated financial statements. The following table summarizes our results of operations for periods presented as a percentage of net sales:
| Three Months Ended | Year Ended | ||||||||||||||
| March 27, 2010 |
March 28, 2009 |
December 26, 2009 |
December 27, 2008 |
December 29, 2007 |
|||||||||||
| Net sales |
100.0 | % | 100.0 | % | 100.0 | % | 100.0 | % | 100.0 | % | |||||
| Cost of goods sold |
66.1 | % | 67.0 | % | 67.8 | % | 67.4 | % | 67.0 | % | |||||
| Gross profit |
33.9 | % | 33.0 | % | 32.2 | % | 32.6 | % | 33.0 | % | |||||
| Selling, general and administrative expenses |
24.5 | % | 25.5 | % | 25.7 | % | 26.4 | % | 26.7 | % | |||||
| Related party expenses |
0.0 | % | 0.1 | % | 0.4 | % | 0.3 | % | 0.2 | % | |||||
| Income from operations |
9.4 | % | 7.4 | % | 6.1 | % | 5.9 | % | 6.1 | % | |||||
| Loss on extinguishment of debt |
0.3 | % | 0.0 | % | 0.3 | % | 0.0 | % | 0.0 | % | |||||
| Interest expense income |
0.0 | % | 0.0 | % | (0.0 | %) | (0.1 | %) | (0.1 | %) | |||||
| Interest expense |
1.5 | % | 2.9 | % | 2.7 | % | 3.5 | % | 4.2 | % | |||||
| Interest expense, net |
1.5 | % | 2.9 | % | 2.7 | % | 3.4 | % | 4.1 | % | |||||
| Income before provision for income taxes |
7.6 | % | 4.5 | % | 3.1 | % | 2.5 | % | 2.0 | % | |||||
| Provision for income taxes |
3.0 | % | 1.9 | % | 1.2 | % | 1.1 | % | 0.7 | % | |||||
| Net income |
4.6 | % | 2.6 | % | 1.9 | % | 1.4 | % | 1.3 | % | |||||
The net sales results presented for Fiscal 2009, Fiscal 2008 and Fiscal 2007 are each based on a 52-week period. The net sales results presented for the three months ended March 27, 2010 and March 28, 2009, are each based on a 13-week period.
Three Months Ended March 27, 2010 Compared To Three Months Ended March 28, 2009
Net Sales
Net sales increased $19.1 million, or 11.0%, to $191.6 million for the three months ended March 27, 2010 compared to $172.6 million for the three months ended March 28, 2009. The increase was primarily the result of an increase in our comparable store sales, and new sales from our non-comparable stores, as well as an increase in our direct sales.
26
Table of Contents
Retail
Net sales from our retail stores increased $17.4 million, or 11.5%, to $169.1 million for the three months ended March 27, 2010 compared to $151.6 million for the three months ended March 28, 2009. We operated 453 stores as of March 27, 2010 compared to 418 stores as of March 28, 2009. Our overall store sales for the three months ended March 27, 2010 increased due to non-comparable store sales increases of $8.1 million and an increase in comparable store sales of $9.3 million, or 6.2%. Our overall sales increased primarily in the categories of supplements, which increased $3.3 million; vitamins and minerals, which increased $3.4 million; and sports nutrition, which increased $8.7 million.
The supplements category was among our fastest growing categories as we continue to experience significant growth in sales of essential fatty acids, or EFAs, as well as experiencing growth in other products during the quarter, such as CoQ10 and probiotics for digestive health. Sales in our vitamin and minerals category increased at a rate greater than the overall increase in net sales due to the introduction of new special formulations for men and women as well as an increase in sales of Vitamin D. Product sales in the sports nutrition category continues to be among our fastest growing categories and has been so for thirteen consecutive quarters. We expect this trend to continue based on the growth of the fitness-conscious market.
Direct
Net sales to our direct customers increased $1.6 million, or 7.8%, to $22.6 million for the three months ended March 27, 2010 compared to $20.9 million for the three months ended March 28, 2009. The overall increase in our direct sales was due to an increase in our internet sales of approximately $2.4 million which was offset by a decrease in our catalog sales. The increase in web-based sales was largely due to a greater influx of customers gained as a result of an increase in promotional activity through certain of our online store-fronts. We have reduced our catalog circulation and customer prospecting as we believe catalog purchasing in general is declining in popularity as a purchasing medium, especially in the wake of the growth of online shopping. In addition, as we continue to open more stores in new markets, some catalog customers choose to shop at our retail locations.
Cost of Goods Sold
Cost of goods sold, which includes product, warehouse and distribution and occupancy costs, increased $11.1 million, or 9.6%, to $126.6 million for the three months ended March 27, 2010 compared to $115.5 million for the three months ended March 28, 2009. The dollar increase was primarily due to an increase in product sold and occupancy costs for the quarter ended March 27, 2010, as compared to the quarter ended March 28, 2009. Cost of goods sold as a percentage of net sales decreased to 66.1% for the three months ended March 27, 2010, compared to 67.0% for the three months ended March 28, 2009. The decrease of cost of goods sold as a percentage of net sales was due to decreases in product costs of 0.7% as a percentage of net sales, as well as a decrease in occupancy costs of 0.2% as a percentage of net sales. The decrease in product costs as a percentage of net sales was due primarily to a decrease in promotional activity during the three months ended March 27, 2010, as compared to the three months ended March 28, 2009.
Gross Profit
As a result of the foregoing, gross profit increased $8.0 million, or 14.0%, to $65.0 million for the three months ended March 27, 2010 compared to $57.0 million for the three months ended March 28, 2009. Gross profit as a percentage of sales increased to 33.9% for the quarter ended March 27, 2010, compared to 33.0% for the quarter ended March 28, 2009.
Selling, General and Administrative Expenses
Selling, general and administrative expenses, including operating payroll and related benefits, advertising and promotion expense, depreciation and amortization, and other selling, general and administrative expenses, increased $3.0 million, or 6.8%, to $46.9 million for the three months ended March 27, 2010, compared to $43.9
27
Table of Contents
million for the three months ended March 28, 2009. The components of selling, general and administrative expenses are explained below. Selling, general and administrative expenses as a percentage of net sales decreased to 24.5% for the three months ended March 27, 2010, compared to 25.5% for the three months ended March 28, 2009.
Operating payroll and related benefits increased $1.5 million, or 8.9%, to $18.1 million for the three months ended March 27, 2010 compared to $16.6 million for the three months ended March 28, 2009. Operating payroll and related benefits expenses as a percentage of net sales decreased to 9.4% for the three months ended March 27, 2010 compared to 9.6% for the three months ended March 28, 2009. The decrease as a percentage of net sales was primarily due to greater sales per hour for the quarter ended March 27, 2010, as compared to the quarter ended March 28, 2009, due to the maturation of our newer stores.
Advertising and promotion expenses decreased $0.7 million, or 15.5%, to $3.7 million for the three months ended March 27, 2010 compared to $4.4 million for the three months ended March 28, 2009. Advertising and promotion expenses as a percentage of net sales decreased to 1.9% for the three months ended March 27, 2010, compared to 2.5% for the three months ended March 28, 2009. The decrease is primarily due to a reduction in grand opening promotions for our new stores for the three months ended March 27, 2010, as compared to the three months ended March 28, 2009.
Other selling, general and administrative expenses, which includes depreciation and amortization expense, increased $2.2 million, or 9.6%, to $25.2 million for the three months ended March 27, 2010 compared to $23.0 million for the three months ended March 28, 2009. The dollar increase in other selling, general and administrative expenses was due to increases in the following expenses: depreciation and amortization expense of approximately $0.3 million; corporate payroll expenses of $0.8 million; stock-based compensation expense of $0.2 million; credit card fees of $0.3 million; and various general administrative expenses of $0.5 million. Other selling, general and administrative expenses as a percentage of net sales decreased to 13.1% during the three months ended March 27, 2010 compared to 13.3% for the three months ended March 28, 2009. The decrease as a percentage of sales was largely the result of experiencing overall economies of scale with regards to these expenses relative to the increase in sales for the quarter ended March 27, 2010, as compared to the quarter ended March 28, 2009.
Related Party Expenses
There were no related party for the three months ended March 27, 2010. Related party expenses for the three months ended March 28, 2009 were $0.4 million.
Income from Operations
As a result of the foregoing, income from operations increased $5.4 million, or 42.3%, to $18.1 million for the three months ended March 27, 2010 compared to $12.7 million for the three months ended March 28, 2009. Income from operations as a percentage of net sales increased to 9.4% for the three months ended March 27, 2010 compared to 7.4% for the three months ended March 28, 2009.
Retail
Income from operations for the retail segment increased $6.7 million, or 27.1%, to $31.4 million for the three months ended March 27, 2010 compared to $24.7 million for the three months ended March 28, 2009. Income from operations as a percentage of net sales for the retail segment increased to 18.5% for the three months ended March 27, 2010, compared to 16.3% for the three months ended March 28, 2009. The increase as a percentage of sales was primarily due to a 1.0% decrease in product costs as a percentage of sales as a result of a decrease in promotional markdowns during the quarter ended March 27, 2010, as compared to the quarter ended March 28, 2009. In addition, there was a decrease in advertising costs of 0.7% as a percentage of sales, due to a decrease in grand opening promotions during the quarter ended March 27, 2010, as compared to the quarter ended March 28, 2009.
28
Table of Contents
Direct
Income from operations for the direct segment increased $0.1 million, or 2.9%, to $4.5 million for the three months ended March 27, 2010 compared to $4.4 million for the three months ended March 28, 2009. Income from operations as a percentage of net sales for the direct segment decreased to 19.9% for the three months ended March 27, 2010 compared to 20.9% for the three months ended March 28, 2009. The 1.0% decrease in income from operations as a percent of net sales was primarily due to an increase in product costs of 2.0%, as a percent of net sales, due largely to an increase in promotional pricing during the three months ended March 27, 2010, as compared to the three months ended March 28, 2009, offset by a decrease in distribution costs as a percentage of sales of 0.3%, and a decrease in payroll expenses of 0.7% as a percentage of sales during the three months ended March 27, 2010, as compared to the three months ended March 28, 2009. The decrease in distribution costs as a percentage of sales was primarily due to higher picking rates during the three months ended March 27, 2010, as compared to the three months ended March 28, 2009. The decrease in payroll expense as a percentage of sales was primarily attributable to an increase in sales made through certain online store-fronts, which do not require incremental payroll hours from our sales staff.
Corporate Costs
Corporate costs increased by $1.4 million, or 8.8%, to $17.8 million for the three months ended March 27, 2010 compared to $16.3 million for the three months ended March 28, 2009. Corporate costs as a percentage of net sales decreased to 9.3% for the three months ended March 27, 2010 compared to 9.5% for the three months ended March 28, 2009. The dollar increase was primarily due to increases in depreciation and amortization expense of approximately $0.3 million, corporate payroll expenses of $0.8 million, and stock-based compensation expense of $0.2 million during the quarter ended March 27, 2010, as compared to the quarter ended March 28, 2009. The decrease as a percentage of sales was largely the result of experiencing overall economies of scale with regards to these expenses relative to the increase in sales for the quarter ended March 27, 2010, as compared to the quarter ended March 28, 2009.
Loss on extinguishment of debt
Loss on extinguishment of debt of $0.6 million for the quarter ended March 27, 2010, represents the write-off of a portion of the unrecognized loss of our interest rate swap of approximately $0.2 million, as well as the write-off of a portion of deferred financing fees of approximately $0.3 million, related to the redemption of a portion our Notes in January 2010.
Interest Expense, net
Interest expense net, decreased $2.1 million, or 41.5%, to $2.9 million for the three months ended March 27, 2010 compared to $5.0 million for the three months ended March 28, 2009. The decrease in interest expense was primarily due to the decrease in our outstanding Notes as a result of the redemption of $64.9 million in aggregate principal, offset in part by an increase in borrowings from our 2009 Revolving Credit Facility of $20.0 million. In addition, we experienced lower interest rates on our debt during the three months ended March 27, 2010, as compared to the three months ended March 28, 2009.
Provision for Income Taxes
We recognized $5.9 million of income tax expense during the three months ended March 27, 2010 compared with $3.1 million for the three months ended March 28, 2009. The effective tax rate for the three months ended March 27, 2010 was 40.2%, compared to 40.7% for the three months ended March 28, 2009. The effective rate for the current period, as compared to the same period last year, decreased primarily due to certain changes in our blended state income tax rates.
29
Table of Contents
Net Income
As a result of the foregoing, we generated net income of $8.7 million for the three months ended March 27, 2010 compared to $4.6 million for the three months ended March 28, 2009.
Comparison of Fiscal 2009 with Fiscal 2008
Net Sales
Net sales increased $73.0 million, or 12.1%, to $674.5 million for Fiscal 2009 compared to $601.5 million for Fiscal 2008. The increase was the result of an increase in our comparable store sales, as well as sales from our new non-comparable stores.
Retail
Net sales from our retail stores increased $73.7 million, or 14.1%, to $596.3 million for Fiscal 2009 compared to $522.5 million for Fiscal 2008. We operated 438 stores as of December 26, 2009 compared to 401 stores as of December 27, 2008. Our overall store sales increased due to non-comparable store sales of $46.7 million, as well as an increase in comparable store sales growth of $27.0 million, or 5.2% (Comparable store sales include only those stores open more than 410 days and align with Fiscal 2008). Our overall sales increased primarily in the categories of specialty supplements, which increased $16.0 million; vitamins and minerals, which increased $13.0 million; and sports nutrition, which increased $24.0 million. These increases were offset in part by a decrease in our weight management category of $2.5 million, which was largely due to a recall of a non-core product which began in the second fiscal quarter and continued in the third fiscal quarter of 2009.
Product sales in the specialty supplements category were among our fastest growing categories as we continue to experience significant growth in sales of essential fatty acids, or EFAs, as well as experiencing growth in other products during the fiscal year, such as Ubiquinol (CoQ10) and probiotics for digestive health. Sales in our vitamin and minerals category increased at a rate greater than the overall increase in net sales due to the introduction of new special formulations for men and women as well as an increase in sales of Vitamin D. Product sales in the sports nutrition category continues to be among our fastest growing categories and has been so for over three consecutive fiscal years. We expect this trend to continue based on the growth of the fitness-conscious market.
Direct
Net sales to our direct customers decreased $0.8 million, or 1.0%, to $78.2 million for Fiscal 2009 compared to $79.0 million for Fiscal 2008. The $0.8 million decrease in direct sales during Fiscal 2009 was comprised of an increase in our internet sales of $3.4 million, offset by a decrease in our catalog sales. The increase in our web-based sales was primarily due to a greater influx of customers this fiscal year as compared to Fiscal 2008, as a result of our prior web-based marketing initiatives. We have reduced our catalog circulation and catalog customer prospecting as we believe catalog purchasing in general is declining in popularity as a purchasing medium, especially in the wake of the growth of online shopping. In addition, as we continue to open more stores in new markets, some catalog customers choose to shop at our retail locations.
Cost of Goods Sold
Cost of goods sold, which includes product, warehouse and distribution and occupancy costs, increased $51.9 million, or 12.8%, to $457.6 million for Fiscal 2009 compared to $405.7 million for Fiscal 2008. The increase was primarily due to an increase in product costs and occupancy costs for the year ended December 26, 2009, as compared to the year ended December 27, 2008. Cost of goods sold as a percentage of net sales increased to 67.8% for the year ended December 26, 2009, compared to 67.4% for the year ended December 27, 2008. The increase of cost of goods sold as a percentage of net sales was due to increases in both occupancy
30
Table of Contents
costs of 0.5%, primarily attributable to the impact of new (non-comparable) stores commencing operations in the last quarter of Fiscal 2008, and product costs of 0.2% as a percentage of sales, due to the impact of promotional coupons issued during the third quarter of Fiscal 2009. These increases were offset by a decrease in distribution costs of 0.3% as a percentage of sales.
Gross Profit
As a result of the foregoing, gross profit increased $21.0 million, or 10.7%, to $216.9 million for Fiscal 2009 compared to $195.9 million for Fiscal 2008.
Selling, General and Administrative Expenses
Selling, general and administrative expenses, including operating payroll and related benefits, advertising and promotion expense, and other selling, general and administrative expenses, increased $14.4 million, or 9.1%, to $173.1 million during Fiscal 2009, compared to $158.7 million for Fiscal 2008. The components of selling, general and administrative expenses are explained below. Selling, general and administrative expenses as a percentage of net sales for Fiscal 2009 decreased to 25.7% compared to 26.4% for Fiscal 2008.
Operating payroll and related benefits increased $8.1 million, or 13.8%, to $67.2 million for Fiscal 2009 compared to $59.0 million for Fiscal 2008. The increase is due mainly to our increase in retail locations throughout Fiscal 2009. Operating payroll and related benefits expenses as a percentage of net sales increased to 10.0% during Fiscal 2009 compared to 9.8% for Fiscal 2008. The increase as a percentage of sales was due to lower sales per hour for Fiscal 2009, as compared to Fiscal 2008, due to a greater number of new (non-comparable) stores commencing operations in the last quarter of Fiscal 2008, as well increases in health benefits expense experienced during Fiscal 2009.
Advertising and promotion expenses decreased $0.4 million, or 3.3%, to $12.8 million for Fiscal 2009 compared to $13.2 million for Fiscal 2008. Advertising and promotion expenses as a percentage of net sales decreased to 1.9% during Fiscal 2009 compared to 2.2% for Fiscal 2008. The decrease as a percentage of net sales was due primarily to a continued reduction in our catalog advertising and prospecting efforts, as well as a decrease in store grand opening promotions, as we opened 23 fewer stores in Fiscal 2009 as compared to Fiscal 2008.
Other selling, general and administrative expenses, which include depreciation and amortization expense, increased $6.7 million, or 7.8%, to $93.2 million in Fiscal 2009 compared to $86.5 million for Fiscal 2008. The increase was due primarily to an increase in depreciation and amortization of approximately $3.6 million, reflecting our new stores; $3.0 million for corporate payroll expense which was primarily due to an increase in incentive compensation and health care costs during Fiscal 2009; and stock-based compensation expense of approximately $0.7 million, due to additional grants issued in Fiscal 2009. These increases in expense were offset by a $1.2 million decrease in store pre-opening costs due to the decrease in the number of new stores we opened during Fiscal 2009. Other selling, general and administrative expenses as a percentage of net sales decreased to 13.8% during Fiscal 2009 compared to 14.4% for Fiscal 2008. The decrease as a percentage of sales was largely the result of experiencing overall economies of scale with regards to these expenses relative to the increase in sales for Fiscal 2009, as compared to Fiscal 2008.
Related Party Expenses
Related party expenses increased $0.9 million, or 60.6%, to $2.4 million during Fiscal 2009, as compared to $1.5 million for Fiscal 2008. The increase is due to fees driven from increased sales during the first three fiscal quarters of Fiscal 2009 as well as a one time termination fee of our management service agreement paid to IPC Manager II, LLC, of approximately $0.8 million (for a detailed presentation of related party expenses, see Note 11 to our consolidated financial statements). As a result of the termination of the management services agreement, there will be no further related party fees associated with this agreement in future periods.
31
Table of Contents
Income from Operations
As a result of the foregoing, income from operations increased $5.7 million, or 16.0%, to $41.3 million for Fiscal 2009 compared to $35.6 million for Fiscal 2008. Income from operations as a percentage of net sales increased to 6.1% during Fiscal 2009 as compared to 5.9% for Fiscal 2008.
Retail
Income from operations for the retail segment increased $14.1 million, or 17.5%, to $94.5 million for Fiscal 2009 compared to $80.4 million for Fiscal 2008. Income from operations as a percentage of net sales for the retail segment increased to 15.8% for Fiscal 2009 compared to 15.4% for Fiscal 2008. This increase as a percentage of sales is largely due to a decrease in store pre-opening costs of 0.2% as a percent of sales and a decrease in retail store computer equipment of 0.2% as a percent of sales.
Direct
Income from operations for the direct segment increased $0.2 million, or 1.6%, to $15.1 million for Fiscal 2009 compared to $14.9 million for Fiscal 2008. Income from operations as a percentage of net sales for the direct segment increased to 19.3% for Fiscal 2009 compared to 18.8% for Fiscal 2008. This increase as a percentage of net sales was primarily due to a decrease in advertising expense of 1.3% as a percentage of sales, due to the decrease in catalog mailings, offset in part by an increase in product costs of 0.7% as a percentage of sales, due to greater price promotions for our direct products, during Fiscal 2009 as compared to Fiscal 2008.
Corporate Costs
Corporate costs increased $8.6 million, or 14.5%, to $68.3 million during Fiscal 2009 compared to $59.7 million for Fiscal 2008. Corporate costs as a percentage of net sales increased to 10.1% for Fiscal 2009 compared to 9.9% for Fiscal 2008. This dollar increase was due primarily to the increase in depreciation and amortization expense of $3.6 million, reflecting our new stores; an increase in corporate payroll costs of approximately $3.0 million, primarily due to an increase in incentive compensation and health care costs during Fiscal 2009; and an increase in stock compensation expense of $0.7 million, due to additional grants issued in Fiscal 2009.
Loss on extinguishment of debt
Loss on extinguishment of debt was $2.0 million during Fiscal 2009, which included the following: $0.4 million for the premium on the repurchase of approximately $44.9 million of our Notes; the write-off of the related portions of deferred financing fees and a portion of the unrecognized loss of our interest rate swap as a result of the aforementioned repurchase, of $0.7 million and $0.6 million, respectively; and a $0.3 million write-off of deferred financing fees related to the repayment of our former revolving credit facility which was terminated in September 2009.
Interest Income
Interest income decreased $73,000 to $43,000 in Fiscal 2009 compared to $116,000 for Fiscal 2008. The decrease was due to maintaining a lower balance in our interest bearing investment account, as well as experiencing lower interest rates throughout Fiscal 2009 as compared to Fiscal 2008.
Interest Expense
Interest expense decreased $2.6 million, or 12.1%, to $18.7 million in Fiscal 2009 compared to $21.3 million for Fiscal 2008. The decrease was attributable to a decrease in interest rates in Fiscal 2009 compared to Fiscal 2008, as well as lower borrowing rates during Fiscal 2009 as compared to Fiscal 2008. We expect interest expense to be considerably less in future periods than the amounts reported for Fiscal 2009, as a result of the redemption of approximately $64.9 million of our Notes through January 17, 2010.
32
Table of Contents
Provision for Income Taxes
We recognized $8.0 million of income tax expense during Fiscal 2009 compared to $6.3 million in Fiscal 2008. The effective tax rate was 38.8%, compared to 43.7% for Fiscal 2008. The 4.9% decrease in the effective tax rate is primarily due to favorable developments on certain outstanding income tax matters related to previously identified uncertain tax positions during Fiscal 2009, as compared to a net increase in tax expense related to uncertain tax positions in Fiscal 2008.
Net Income
As a result of the foregoing, we generated net income of $12.7 million in Fiscal 2009 compared to net income of $8.2 million in Fiscal 2008.
Comparison of Fiscal 2008 with Fiscal 2007
Net Sales
Net sales increased $63.7 million, or 11.8%, to $601.5 million for Fiscal 2008 compared to $537.9 million for Fiscal 2007. The increase was the result of an increase in our comparable store sales, as well as sales from our new non-comparable stores, and an increase in our direct sales.
Retail
Net sales from our retail stores increased $60.6 million, or 13.1%, to $522.5 million for Fiscal 2008 compared to $462.0 million for Fiscal 2007. We operated 401 stores as of December 27, 2008 compared to 341 stores as of December 29, 2007. Our overall store sales increased due to non-comparable store sales of $32.5 million, as well as an increase in comparable store sales growth of $28.1 million, or 6.2% (Comparable store sales include only those stores open more than 410 days and align with Fiscal 2007). Our overall sales increased primarily in the categories of sports nutrition, which increased $27.2 million, or 22.0%; specialty supplements, which increased $13.0 million, or 11.2%; herbs and homeopathic, which increased $7.9 million, or 9.3%; weight management, which increased $2.7 million, or 9.4%; vitamins category, which increased $7.7 million, or 12.7%, and minerals, which increased $1.8 million, or 12.1%.
The specialty supplements category, which is among the largest selling product categories in our mix, continues to experience significant growth in sales of essential fatty acids, or EFAs, which have been responsible for most of the growth in the supplement category since Fiscal 2006. Given the current trend in EFA consumption, and the growing number of publications and recommendations regarding the heart-health benefits of fish oils (such as by The American Heart Association and US National Institutes of Health), we expect continued strength in sales of EFAs for the next fiscal year. The vitamins category was one of our fastest growing categories in Fiscal 2008, as we experienced significant growth in sales of multi-vitamins, as we released new special formulations this Fiscal year, and in Vitamin D, which we believe was due in part to recent favorable press. Product sales in the sports nutrition category increased at a greater rate than the overall increase in net sales during the Fiscal 2008, and have done so since mid Fiscal 2006. We believe this is due largely to the continued growth in the fitness-conscious market as well as the diversity of new product introductions.
Direct
Net sales to our direct customers increased $3.1 million, or 4.1%, to $79.0 million for Fiscal 2008 compared to $75.9 million for Fiscal 2007. The overall increase in our direct sales was due to an increase in internet sales of $9.8 million in Fiscal 2008, offset by a decrease in our catalog sales. The increase in our web-based sales was primarily due to a greater influx of customers this fiscal year as compared to Fiscal 2007, as a result of our prior web-based marketing initiatives. We have reduced our catalog circulation and catalog customer prospecting as we believe catalog purchasing in general is declining in popularity as a purchasing medium, especially in the wake of the growth of online shopping. In addition, as we continue to open more stores in new markets, some catalog customers choose to shop at our retail locations.
33
Table of Contents
Cost of Goods Sold
Cost of goods sold, which includes product, warehouse and distribution and store occupancy costs, increased $45.3 million, or 12.6%, to $405.7 million for Fiscal 2008 compared to $360.3 million for Fiscal 2007. The increase was primarily due to an increase in product costs and occupancy costs for the year ended December 27, 2008, as compared to the year ended December 29, 2007. Cost of goods sold as a percentage of net sales increased to 67.4% for Fiscal 2008 compared to 67.0% for Fiscal 2007, primarily as a result of an increase in occupancy costs of approximately 5.0% as a percent of sales, which was mainly attributable to the increases in utilities and real estate tax expenses as well as increased rent for our newer store leases during Fiscal 2008. The increase in occupancy costs was offset in part, by a decrease in products costs of 0.2% as a percent of sales during Fiscal 2008, which was primarily the result of a decrease in price promotions and inventory markdowns.
Gross Profit
As a result of the foregoing, gross profit increased $18.4 million, or 10.3%, to $195.9 million for Fiscal 2008 compared to $177.5 million for Fiscal 2007.
Selling, General and Administrative Expenses
Selling, general and administrative expenses, including operating payroll and related benefits, advertising and promotion expense, and other selling, general and administrative expenses, increased $15.2 million, or 10.6%, to $158.7 million during Fiscal 2008, compared to $143.5 million for Fiscal 2007. The components of selling, general and administrative expenses are explained below. Selling, general and administrative expenses as a percentage of net sales for Fiscal 2008 decreased to 26.4% compared to 26.7% for Fiscal 2007.
Operating payroll and related benefits increased $5.6 million, or 10.4%, to $59.0 million for Fiscal 2008 compared to $53.5 million for Fiscal 2007. The increase is due mainly to our increase in retail locations throughout Fiscal 2008. Operating payroll and related benefits expenses as a percentage of net sales decreased to 9.8% during Fiscal 2008 compared to 9.9% for Fiscal 2007. This was largely due to experiencing greater sales per hour during Fiscal 2008.
Advertising and promotion expenses decreased $0.5 million, or 3.9%, to $13.2 million for Fiscal 2008 compared to $13.7 million for Fiscal 2007. Advertising and promotion expenses as a percentage of net sales decreased to 2.2% during Fiscal 2008 compared to 2.6% for Fiscal 2007, as we are reducing our catalog advertising and prospecting efforts.
Other selling, general and administrative expenses, which include depreciation and amortization expense, increased $10.1 million, or 13.3%, to $86.5 million in Fiscal 2008 compared to $76.3 million for Fiscal 2007. The increase was due primarily to an increase in depreciation and amortization of approximately $2.6 million, reflecting our expanding operation and the amortization of the purchased intangible assets in Fiscal 2008; $3.2 million for corporate payroll expense which was primarily due to an increase in corporate staff during Fiscal 2008 to accommodate our growth; various employee related administrative fees of $1.5 million; and stock-based compensation expense of approximately $0.8 million, due to additional grants issued in Fiscal 2008. In addition to the above, credit card fees increased by approximately $0.8 million due to our increased sales during Fiscal 2008, and store pre-opening costs increased $1.2 million due to the increase in the number of new stores we opened during Fiscal 2008, as well as the lead time needed in opening some of these new stores. Other selling, general and administrative expenses as a percentage of net sales increased to 14.4% during Fiscal 2008 compared to 14.3% for Fiscal 2007, due primarily to increases in our corporate infrastructure to accommodate our growing operations.
Related Party Expenses
Related party expenses increased $0.2 million, or 11.6%, to $1.5 million during Fiscal 2008, as compared to $1.4 million for Fiscal 2007 (for a detailed presentation of related party expenses, see Note 11 to our consolidated financial statements).
34
Table of Contents
Income from Operations
As a result of the foregoing, income from operations increased $3.0 million, or 9.3%, to $35.6 million for Fiscal 2008 compared to $32.6 million for Fiscal 2007. Income from operations as a percentage of net sales decreased to 5.9% during Fiscal 2008 as compared to 6.1% for Fiscal 2007.
Retail
Income from operations for the retail segment increased $9.2 million, or 13.0%, to $80.4 million for Fiscal 2008 compared to $71.2 million for Fiscal 2007. Income from operations as a percentage of net sales for the retail segment remained level at 15.4% for Fiscal 2008 compared to 15.4% for Fiscal 2007.
Direct
Income from operations for the direct segment increased $0.9 million, or 6.7%, to $14.9 million for Fiscal 2008 compared to $14.0 million for Fiscal 2007. Income from operations as a percentage of net sales for the direct segment increased to 18.8% for Fiscal 2008 compared to 18.4% for Fiscal 2007. This increase as a percentage of net sales was primarily due to a decrease in advertising expense of 1.1% as a percentage of sales, due to the decrease in catalog mailings, offset by an increase in product costs as a percentage of sales, due to greater price promotions for our direct products, during Fiscal 2008 as compared to Fiscal 2007.
Corporate Costs
Corporate costs increased $7.1 million, or 13.5%, to $59.6 million during Fiscal 2008 compared to $52.5 million for Fiscal 2007. Corporate costs as a percentage of net sales increased to 9.9% for Fiscal 2008 compared to 9.8% for Fiscal 2007. This increase was due primarily to the increase in depreciation and amortization expense of $2.6 million, reflecting our growing operations and asset acquisitions, an increase in corporate payroll costs of approximately $3.2 million, and various employee related administrative fees of approximately $1.5 million which occurred in Fiscal 2008 as compared to Fiscal 2007. This was offset by approximately $0.5 million of deferred offering fees written-off during Fiscal 2007, which did not occur in Fiscal 2008.
Interest Income
Interest income decreased $179,000 to $116,000 in Fiscal 2008 compared to $295,000 for Fiscal 2007. The decrease was due to maintaining a lower balance in our interest bearing investment account, as well as experiencing lower interest rates throughout Fiscal 2008 as compared to Fiscal 2007.
Interest Expense
Interest expense decreased $1.1 million, or 4.9%, to $21.3 million in Fiscal 2008 compared to $22.3 million for Fiscal 2007. The decrease was primarily attributable to a decrease in interest rates in Fiscal 2008 compared to Fiscal 2007.
Provision for Income Taxes
We recognized $6.3 million of income tax expense during Fiscal 2008 compared to $3.8 million in Fiscal 2007. The effective tax rate, which includes items relating to adjustments to our FIN 48 liability as well as certain adjustments related to our state income tax for Fiscal 2008, was 43.6%, compared to 35.8% for Fiscal 2007. The 7.8% increase in the effective tax rate is primarily due to changes in our blended state income tax rate, increases to our FIN 48 liability of 1.3%, as well as a benefit of 2.8% for a discrete item which occurred in Fiscal 2007.
35
Table of Contents
Net Income
As a result of the foregoing, we generated net income of $8.2 million in Fiscal 2008 compared to net income of $6.8 million in Fiscal 2007.
Key Indicators of Liquidity and Capital Resources
The following table sets forth key indicators of our liquidity and capital resources (in thousands):
| As of | |||||||||
| March 27, 2010 |
December 26, 2009 |
December 27, 2008 | |||||||
| Balance Sheet Data: |
|||||||||
| Cash and cash equivalents |
$ | 12,162 | $ | 8,797 | $ | 1,623 | |||
| Working capital |
62,451 | 50,416 | 52,285 | ||||||
| Total assets |
475,687 | 469,257 | 463,705 | ||||||
| Total debt, including capital leases |
123,654 | 123,946 | 186,382 | ||||||
| Three Months Ended | Year Ended | |||||||||||||||||||
| March 27, 2010 |
March 28, 2009 |
December 26, 2009 |
December 27, 2008 |
December 29, 2007 |
||||||||||||||||
| Other Information: |
||||||||||||||||||||
| Depreciation and amortization (1) |
$ | 5,414 | $ | 5,078 | $ | 21,095 | $ | 17,483 | $ | 14,882 | ||||||||||
| Cash Flows Provided By (Used In): |
||||||||||||||||||||
| Operating activities |
$ | 8,178 | $ | 8,830 | $ | 43,434 | $ | 19,588 | $ | 20,618 | ||||||||||
| Investing activities |
(5,408 | ) | (8,377 | ) | (21,281 | ) | (35,389 | ) | (14,092 | ) | ||||||||||
| Financing activities |
595 | (290 | ) | (14,979 | ) | 15,971 | (6,545 | ) | ||||||||||||
| Net increase (decrease) in cash and cash equivalents |
$ | 3,365 | $ | 163 | $ | 7,174 | $ | 170 | $ | (19 | ) | |||||||||
| (1) | Excludes amortization of deferred financing fees. |
Liquidity and Capital Resources
Our primary uses of cash are to fund working capital, operating expenses, debt service and capital expenditures related primarily to the construction of new stores. Historically, we have financed these requirements predominately through internally generated cash flow, supplemented with short-term financing. We believe that the cash generated by operations and cash and cash equivalents, together with the borrowing availability under our 2009 Revolving Credit Facility, will be sufficient to meet our working capital needs for the next twelve months, including investments made and expenses incurred in connection with our store growth plans, systems development and store improvements.
We plan to spend up to $22 million in capital expenditures during Fiscal 2010, of which up to $17 million will be in connection with our store growth and improvement plans with the remainder of up to $5 million being used for all other expenditures. Of the total capital expenditures projected for Fiscal 2010 we have already invested $5.4 million during the three months ended March 27, 2010. We plan on opening approximately 42 stores during Fiscal 2010, of which we have already opened 16 stores as of March 27, 2010. Our working capital requirements for merchandise inventory will continue to increase as we continue to open additional stores. Currently, our practice is to establish an inventory level of $165,000 to $185,000 at cost for each of our stores. Despite the recent challenges obtaining credit from the tightened global credit markets, we feel our 2009 Revolving Credit Facility will provide us with sufficient liquidity through the next fiscal year. Furthermore, we have an additional two years of liquidity as compared to our previous facility which we terminated on
36
Table of Contents
September 25, 2009. Additionally, 30 day payment terms have been extended to us by some of our suppliers allowing us to effectively manage our inventory and working capital. In April 2010, we increased our credit facility by $20.0 million which we intend to use to redeem a portion of our Notes during Fiscal 2010.
We were in compliance with all debt covenants as of March 27, 2010. At March 27, 2010, we had $12.2 million in cash and cash equivalents and $62.5 million in working capital. At December 27, 2009, we had $8.8 million in cash and cash equivalents and $50.4 million in working capital.
During Fiscal 2009 we spent approximately $17.4 million, out of the $21.2 million of total capital expenditures, in connection with our store growth and improvement plans. We opened 39 new stores during Fiscal 2009, relocated one store and closed two stores. Our working capital requirements for merchandise inventory will continue to increase as we continue to open additional stores.
Cash Provided by Operating Activities
Cash provided by operating activities was $8.2 million for the three months ended March 27, 2010, as compared to $8.8 million of cash provided by operating activities for the three months ended March 28, 2009. The $0.7 million decrease in cash flows from operating activities is primarily due to increases in expenditures on our inventory offset in part by an increase in our net income for the three months ended March 27, 2010, as compared to the three months ended March 28, 2009. The increase in changes to our inventory expenditures is largely attributable to the continued efficiency of our inventory management as we continue to achieve a just in time inventory replenishment model, and by an increase in the number of our stores. In the first fiscal quarter of 2009, we reduced our inventory while net sales increased. In the first fiscal quarter of 2010, we increased inventory by 6% while net sales increased 11%.
Cash provided by operating activities was $43.4 million and $19.6 million during Fiscal 2009 and Fiscal 2008, respectively. The $23.8 million increase in cash flows from operating activities is primarily due to an increase in our net income, as well as a decrease in expenditures on inventory, due to effective management of inventory in our stores along with more efficient levels of replenishment; and a decrease in expenditures on our accounts payable during Fiscal 2009, related in part to the decrease in inventory expenditures, as compared to Fiscal 2008. This increase in cash flows from operating activities was offset in part by a $2.6 million cash payment, for the termination of our interest rate swap during September 2009.
Cash provided by operating activities was $19.6 million and $20.6 million during Fiscal 2008 and Fiscal 2007, respectively. This decrease was primarily a result of a decrease in our accounts payable of $19.6 million, to take advantage of favorable payment terms by our suppliers, offset in part by an increase in our net income and a decrease in inventory expenditures in Fiscal 2008 compared to Fiscal 2007.
Cash Used in Investing Activities
Net cash used in investing activities during the three months ended March 27, 2010, was $5.4 million, compared to $8.4 million during the three months ended March 28, 2009. Capital expenditures during the three months ended March 27, 2010, were used for the construction of 16 new stores, and improvements to existing stores, as well as computer equipment related to those stores. During the three months ended March 28, 2009, capital expenditures were used for the construction of 17 new stores, as well as computer equipment related to those stores.
Net cash used in investing activities during Fiscal 2009 and Fiscal 2008 was $21.3 million and $35.4 million, respectively. The decrease in cash used in investing activities of $14.1 million was primarily due to the
37
Table of Contents
opening of 23 more stores during Fiscal 2008 as compared to Fiscal 2009, as well as the acquisition of $3.5 million of intangible assets (as discussed in Note 4 to our Financial Statements) during Fiscal 2008.
Net cash used in investing activities during Fiscal 2008 and Fiscal 2007 was $35.4 million and $14.1 million, respectively. The increase in cash used in investing activities of $21.3 million was primarily due to opening 26 more stores in Fiscal 2008 as compared to Fiscal 2007, as well as the acquisition of $3.5 million of intangible assets (as discussed in Note 4 to our Financial Statements) in the same period.
Cash Provided by (Used in) Financing Activities
Net cash provided by financing activities was $0.6 million for the three months ended March 27, 2010, as compared to net cash used in financing activities of $0.3 million for the three months ended March 28, 2009. The $0.9 million increase in cash provided by financing activities was due primarily to cash received from the exercise of employee stock options during the three months ended March 27, 2010.
Net cash used in financing activities was $15.0 million in Fiscal 2009, compared to net cash provided by financing activities of $16.0 million during Fiscal 2008. The decrease in net cash provided by financing activities was primarily due to net repayments of $17.0 million on our revolving credit facility during Fiscal 2009, compared to net borrowings of $17.0 million from our revolving credit facility during Fiscal 2008.
Net cash provided by financing activities was $16.0 million in Fiscal 2008, compared to $6.5 million of net cash used in financing activities during Fiscal 2007. The increase in net cash provided by financing activities was primarily due to net borrowings of $17.0 million from our revolving credit facility during Fiscal 2008, compared to our paying down a net of $6.5 million on our revolving credit facility during Fiscal 2007.
2005 Senior Notes
On November 7, 2005, we completed our offering of the Notes for $165.0 million. During December 2009, we redeemed approximately $44.9 million of our Notes leaving $120.1 million of the original $165.0 million outstanding at December 26, 2009. In addition, during January 2010 we redeemed an additional $20.0 million of aggregate principle of our Notes, which was financed by borrowings under our 2009 Revolving Credit Facility. On April 21, 2010, we announced our intention to redeem $25.0 million in aggregate principal amount of our Notes using borrowings under our 2009 Revolving Credit Facility, which will be consummated by May 21, 2010.
The indenture governing the Notes restricts the ability of Vitamin Shoppe, Inc. (“VSI”) and Direct to incur additional debt, pay dividends and make distributions, make certain investments, repurchase stock, incur liens, enter into transactions with affiliates, enter into sale and lease back transactions, merge, or consolidate or transfer or sell assets.
Revolving Credit Facilities
On November 15, 2005, we entered into a $50.0 million senior secured revolving credit facility, which was terminated on September 25, 2009, resulting in a loss on extinguishment of debt of approximately $0.3 million. The largest amount borrowed at any given point during the period ended September 25, 2009 was $17.0 million.
2009 Revolving Credit Facility
On September 25, 2009, we entered into the 2009 Revolving Credit Facility and simultaneously terminated our existing credit facility that was entered into on November 15, 2005. We entered into the 2009 Revolving Credit Facility to obtain an additional two years of liquidity beyond the termination date of our previous facility. In doing so, we incurred an incremental borrowing rate of 1% as compared to the former revolving credit facility. The terms of the 2009 Revolving Credit Facility extend through September 2013, and allow us to borrow up to
38
Table of Contents
$50.0 million subject to the terms of the facility. Similar to our previous credit facility, the availability under the 2009 Revolving Credit Facility is subject to a borrowing base calculated on the value of certain accounts receivable from credit card companies as well as the inventory of Industries and Direct. The obligations thereunder are secured by a security interest in substantially all of the assets of VSI, Industries and Direct. Direct and VSI, provided guarantees in respect of our obligations under the 2009 Revolving Credit Facility, and Industries and VSI, have provided guarantees in respect of Direct’s obligations under the 2009 Revolving Credit Facility. The 2009 Revolving Credit Facility provides for affirmative and negative covenants affecting Industries, VSI and Direct. The 2009 Revolving Credit Facility restricts, among other things, our ability to incur indebtedness, create or permit liens on our assets, declare or pay dividends and make certain other restricted payments, consolidate, merge or recapitalize, acquire or sell assets, make certain investments, loans or other advances, enter into transactions with affiliates, change our line of business, and restricts the types of hedging activities we can enter into. The 2009 Revolving Credit Facility has a maturity date of September 2013. However, the 2009 Revolving Credit Facility may terminate at August 15, 2012, if, prior to such date, a significant portion of our Notes has not been redeemed, as, at that date, the facility requires that the sum of all amounts owed under the Notes must be less than the sum of our cash and cash equivalents plus excess availability (as defined under the 2009 Revolving Credit Facility), subject to certain limitations. The largest amount borrowed at any given point during the period ended March 27, 2010 was $20.0 million. The unused available line of credit under the 2009 Revolving Credit Facility at March 27, 2010 was $29.1 million. In addition to the current availability, during April 2010 we amended our 2009 Revolving Credit Facility agreement to increase our availability on the facility by approximately $20.0 million, as we intend to redeem up to $25.0 million of our outstanding Notes during Fiscal 2010. The redemption will result in approximately $1.0 million (pre-tax) savings in interest expense on an annual basis, as well as a charge of approximately $0.6 million (pre-tax) to loss on extinguishment of debt, as a result of certain write-offs related to the redemption, during the second quarter of the 2010 fiscal year. VS Direct Inc. and Vitamin Shoppe, Inc. provided guarantees in respect of our obligations under the 2009 Revolving Credit Facility, and Vitamin Shoppe Industries Inc. and Vitamin Shoppe, Inc. have provided guarantees in respect of VS Direct Inc.’s obligations under the 2009 Revolving Credit Facility.
The borrowings under our 2009 Revolving Credit Facility accrue interest, at our option at the rate per annum announced from time to time by the agent as its “prime rate,” or at a per annum rate equal to 2.50% above the adjusted Eurodollar rate. The weighted average interest rate for the 2009 Revolving Credit Facility from December 26, 2009 through March 27, 2010, was 2.74%. The combined weighted average annual interest rate for both the terminated line of credit and the 2009 Revolving Credit Facility for Fiscal 2009 was 2.51%.
Contractual Obligations and Commercial Commitments
As of March 27, 2010, our lease commitments and contractual obligations are as follows (in thousands):
| Fiscal year ending |
Total | Operating Leases (1) |
Capital Lease Obligation, Including Interest |
Long-Term Debt (2) |
Interest Payments (3) |
2009 Revolving Credit Facility (2) | ||||||||||||
| Remainder of Fiscal 2010 |
$ | 62,364 | $ | 55,179 | $ | 1,349 | $ | — | $ | 5,836 | $ | — | ||||||
| 2011 |
82,200 | 72,777 | 1,642 | — | 7,781 | — | ||||||||||||
| 2012 |
177,642 | 70,204 | 848 | 100,106 | 6,484 | — | ||||||||||||
| 2013 |
83,841 | 63,841 | — | — | — | 20,000 | ||||||||||||
| 2014 |
53,815 | 53,815 | — | — | — | — | ||||||||||||
| Thereafter |
130,224 | 130,224 | — | — | — | — | ||||||||||||
| $ | 590,086 | $ | 446,040 | $ | 3,839 | $ | 100,106 | $ | 20,101 | $ | 20,000 | |||||||
| (1) | The operating leases included in the above table do not include contingent rent based upon sales volume, which represented less than 1% of our minimum lease obligations during the first three months of Fiscal 2010. In addition, the operating leases do not include common area maintenance costs or real estate taxes that are paid to the landlord during the year, which combined represented approximately 17.2% of our minimum lease obligations for the three months ended March 27, 2010. |
39
Table of Contents
| (2) | We intend to redeem $25.0 million of our Notes during the second quarter of Fiscal 2010, primarily funded by our 2009 Revolving Credit Facility. |
| (3) | Interest payments are based upon the prevailing interest rates at March 27, 2010. Interest payments do not include interest expense related to our 2009 Revolving Credit Facility due to its revolving nature. |
We have an aggregate contingent liability of up to $2.5 million related to potential severance payments for six executives as of March 27, 2010 pursuant to their respective employment agreements. We have an aggregate contingent liability of up to $2.3 million related to potential severance payments for nine employees as of March 27, 2010, following a change in control pursuant to their respective employment agreements. These potential severance payments are not reflected in the table above.
Excluded from the above commitments is $4.6 million of long-term liabilities related to uncertain tax positions, due to the uncertainty of the time and nature of resolution.
Off-Balance Sheet Arrangements
We have not created, and are not party to, any special-purpose or off-balance sheet entities for the purpose of raising capital, incurring debt or operating our business. We do not have any off-balance sheet arrangements or relationships with entities that are not consolidated into or disclosed on our financial statements that have or are reasonably likely to have a material current or future effect on our financial condition, changes in financial condition, revenues, expenses, results of operations, liquidity, capital expenditures or capital resources.
Effects of Inflation
We do not believe that our sales or operating results have been materially impacted by inflation during the periods presented in our financial statements. There can be no assurance, however, that our sales or operating results will not be impacted by inflation in the future.
Recent Accounting Pronouncements
We have considered all new accounting pronouncements and have concluded that there are no new pronouncements that may have a material impact on our results of operations, financial condition, or cash flows, based on current information.
Quantitative and Qualitative Disclosures About Market Risk
The Company’s market risks relate primarily to changes in interest rates. Market risk represents the risk of changes in the value of market risk sensitive instruments caused by fluctuations in interest rates and commodity prices. Changes in these factors could cause fluctuations in the results of our operations and cash flows. In the ordinary course of business, we are primarily exposed to interest rate risks. Other than on our Notes, which carry a floating interest rate, we have not used derivative financial instruments in connection with these market risks.
Our 2009 Revolving Credit Facility and the Notes carry floating interest rates that are tied to LIBOR and the prime rate and, therefore, our statements of operations and our cash flows are exposed to changes in interest rates. A one percentage point increase in LIBOR would cause an increase to the interest expense on our Notes of approximately $1.0 million annually. Additionally, a one percentage point increase in LIBOR would cause an increase to our annual interest expense on our 2009 Revolving Credit Facility of $0.2 million based on the outstanding balance as of March 27, 2010.
40
Table of Contents
Overview
We are a leading specialty retailer and direct marketer of vitamins, minerals, herbs, supplements, sports nutrition and other health and wellness products. For each of the past five years, we have been the second largest in retail sales and the fastest growing national VMS specialty retailer. We market over 700 different nationally recognized brands as well as our proprietary Vitamin Shoppe, BodyTech and MD Select brands. We believe we offer the greatest variety of products among VMS retailers with approximately 8,000 SKUs offered in our typical store and an additional 12,000 SKUs available through our Internet and other direct sales channels. Our broad product offering enables us to provide our target customers with a selection of products not readily available at other specialty VMS retailers or mass merchants, such as drugstore chains and supermarkets. We target the dedicated, well-informed VMS consumer and differentiate ourselves by providing high quality products at competitive prices in an educational and high-touch customer service environment. We believe our extensive product offering, together with our well-known brand name and emphasis on product education and customer service, help us bond with our target customer and serve as a foundation for strong customer loyalty.
We sell our products through two business segments: retail and direct. In our retail segment, we have leveraged our successful store economic model by opening a total of 169 new stores from the beginning of Fiscal 2006 through Fiscal 2009. Over the past five years, we have expanded our presence in our existing markets as well as entered many new markets such as California, Texas, Michigan, and Hawaii. As of March 27, 2010 we operated 453 stores in 37 states and the District of Columbia, located in high-traffic regional retail centers.
We also sell our products directly to consumers through our websites, including www.vitaminshoppe.com, www.bodytech.com, and our catalog. Our websites and our catalog complement our in-store experience by extending our retail product offerings with an additional 12,000 SKUs that are not available in our stores and by enabling us to access customers outside our retail markets and those who prefer to shop online. In 2009, we increased the number of active online customers by approximately 68,000 to 528,000.
We have grown our net sales from $486.0 million in Fiscal 2006 to $674.5 million in Fiscal 2009, representing a CAGR of 11.5%. We have achieved positive comparable store sales for 16 consecutive years (prior to which we did not track comparable store sales) and have grown our retail sales from $407.5 million in 2006 to $596.3 million in 2009, representing a CAGR of 13.5%. We believe our industry performs well through economic cycles, including the current economic recession, and we have generated comparable store sales increases of 6.2% and 5.2% in 2008 and 2009, respectively, and 6.2% and 5.1% for the three months ended March 27, 2010 and March 28, 2009, respectively.
Our company was founded as a single store in New York, New York in 1977. Our Vitamin Shoppe branded products were introduced in 1989. We were acquired in November 2002 by IPC and other investors.
Industry
According to the NBJ, sales of nutritional supplements in the United States in 2008 were approximately $25.2 billion representing a 4.9% CAGR between 2001 and 2008. The U.S. nutritional supplement category is comprised of vitamins ($8.5 billion), herbs / botanicals ($4.8 billion), specialty / other ($4.5 billion), meal supplements ($2.6 billion), sports nutrition ($2.7 billion) and minerals ($2.1 billion). The NBJ forecasts 4.5% average annual growth for U.S. nutritional supplement sales through 2014 driven primarily by consumption by the over 50 demographic, including Baby Boomers who seek to improve their health and wellness and treat and prevent disease and illness cost effectively.
The VMS industry in the United States is highly fragmented, and according to NBJ data and public filings with the SEC, no single industry participant accounted for more than 5% of total industry sales in 2008. Retailers of VMS products primarily include specialty retailers and mass merchants, such as supermarkets and
41
Table of Contents
drugstore chains. The specialty retailers typically cater to the more sophisticated VMS customer by focusing on selection and customer service, while the mass merchants generally offer a limited assortment comprised of more mainstream products, with less customer care. Specialty retailers comprised the largest segment of the market in 2008, with 37% market share, which is expected to grow by 4.5% annually through 2014, according to the NBJ.
According to the NBJ, during the last three years, growth in the U.S. nutritional supplement industry has been led by specialty supplements, which have grown due to increasing popularity of condition-specific products, including glucosamine / chondroitin (for joint health), homeopathics (for miscellaneous conditions), essential fatty acids (for cardiovascular health), CoQ10 (for energy and cardiac health), vitamin D (for bone support through better calcium absorption) and acidophilus (for digestive health). Consumers use nutritional supplements to improve their lifestyles, treat specific health conditions, and keep themselves feeling younger and more active. From 2008 to 2014, the U.S. specialty supplement product category is expected to grow at a 5.9% CAGR, or approximately 38% faster than the overall industry. The specialty supplements product category represented 17.9% of the total U.S. nutritional supplement industry in 2008. By way of comparison, specialty supplements generated 26.9% of our Fiscal 2009 net sales. We over-index our concentration in specialty supplements to focus on target customers who emphasize health and wellness as part of their lifestyle.
Sports nutrition products represented approximately 10.8% of the total U.S. nutritional supplement industry in 2008. By way of comparison, sports nutrition products, grouped in a manner consistent with NBJ’s data, generated approximately 29.1% of our Fiscal 2009 net sales. We believe our sports nutrition offering emphasizes products such as protein powders which appeal to our customers’ emphasis on health and wellness rather than products taken in conjunction with a body building regimen. From 2009 to 2014, the sports nutrition product category is expected to grow at a 5.5% CAGR, representing the second fastest growing product category in the VMS industry.
We believe that one of the primary trends driving the growth in the industry is the aging U.S. population. The total U.S. population of people 50 and older is expected to increase to 115 million people in 2018 from 94 million people in 2008, a CAGR of 2.1%, which is more than twice the overall population growth rate. The aging Baby Boomer generation comprises a significant and increasing part of the 50 and older population.
Competitive Strengths
We believe we are well positioned to capitalize on the favorable VMS industry dynamics as a result of the following competitive strengths:
Most Extensive Product Selection Including a Strong Assortment of Proprietary Brands. We believe we have the most complete and authoritative merchandise assortment and market the broadest product selection in the VMS industry with over competitively-priced 20,000 SKUs from a combination of over 700 different nationally recognized brands and our proprietary Vitamin Shoppe, BodyTech and MD Select brands. Our typical store carries approximately 8,000 SKUs, with approximately 12,000 SKUs available through our direct business. We offer high-quality, nationally recognized brands such as Natures Plus®, Solgar®, Country Life®, Nature’s Way®, and Solaray®, and our Vitamin Shoppe proprietary brand. We also carry smaller, more exclusive high end brands such as Optimum®, Garden of Life®, New Chapter®, and Life Extension™. Additionally, we offer hard-to-find doctors’ brands including Cardiovascular Research, Allergy Research, American Biologics and Pioneer.
Included in our broad product assortment is our proprietary brand merchandise sold under the Vitamin Shoppe, BodyTech and MD Select brands. Our selection of approximately 1,100 SKUs of proprietary brand merchandise, which accounted for approximately 25% of our net sales in Fiscal 2009, provides our customers the opportunity to purchase VMS products at great value while affording us higher gross margins. Our MD Select brand offers a premium product with a condition-specific focus while our Vitamin Shoppe brands offer a broad selection with a focus on specialty supplements. Our BodyTech brand is focused on sports nutrition. We are continuing to grow our proprietary merchandise product assortment by increasing our focus on sports nutrition, probiotics and essential fatty acids.
42
Table of Contents
In addition, unlike other VMS specialty retailers, we merchandise our product offering by intended use such as “Heart Wellness” and “Joint Support” rather than by brand. This merchandising approach allows us to address our customers’ desire for health and wellness more fully and efficiently than other specialty VMS retailers and mass merchants, such as supermarkets and drugstore chains, while limiting our dependence on the continued success on any single brand or product. Also, our merchandise assortment and sales are concentrated in the two fastest growing product categories in the VMS industry: specialty supplements and sports nutrition. No single product sub-category accounted for more than 6% of our net sales during Fiscal 2009. Also during Fiscal 2009, no single third-party brand accounted for more than 4% of our net sales.
Value-Added Customer Service. We believe we offer the highest degree of customer service in the VMS retail industry, aided by the deep product knowledge of our store associates, whom we refer to as “health enthusiasts.” We believe customer service is a very important component of a VMS consumer’s shopping experience, particularly for specialty supplement purchases. We staff our stores with highly experienced and knowledgeable associates (many of whom are regular and informed nutritional supplement users) who assist our customers in product selection. We place a strong emphasis on employee training and customer service and view our sales associates as health and wellness information stewards who educate our customers while assisting them with their purchases. We ensure the consistency of our high-quality customer service by training our store associates and management (including the direct customer care team) through Vitamin Shoppe University, a web-based interactive training program which includes online courses on product knowledge, customer service and management skills. Along with Vitamin Shoppe University, we provide our associates with up-to-date news and information on VMS products through proprietary newsletters, proprietary magazines, and daily sales meetings, empowering them to provide more value-added assistance to our customers.
Our stores offer extensive access to VMS information as they are equipped with a computer terminal and web access to www.vitaminshoppe.com, offering our customers health and wellness information as well as access to our complete product line. Our stores also offer “Health Notes” (an Internet-based guide to health and VMS products that also provides information on the interaction of drugs and supplements) and reference materials.
Highly Refined Real Estate Strategy. We apply demanding criteria to our retail site selection. We locate our stores exclusively in attractive stand-alone locations or endcap (corner) positions in retail centers available in the markets in which we compete, rather than in enclosed malls, secondary or tertiary shopping centers. Our stores are situated in highly visible locations generally within a 16 minute travel time of more than 50,000 households with a high auto traffic or pedestrian count. Our stores are not dependent on either shopping mall or general shopping center traffic for our customer traffic. We typically seek both urban and suburban locations in high traffic areas with easy access, ample drive-up parking, optimal visibility from a major roadway and strong impact signage. Management believes that the location and visibility of our real estate is our single most effective and efficient customer acquisition strategy. Our research indicates that 66% of our new customers are attained as a result of seeing one of our stores. Our high profile locations and prominent signage reduce our dependency upon traditional advertising to drive customer traffic and brand awareness, which in turn reduces our need to cluster stores to achieve advertising economies of scale. Our retail store concept has proven successful throughout the country in both suburban and urban areas.
Attractive, Loyal Customer Base. We have a large and growing base of loyal customers who proactively manage their long-term health and wellness through the use of supplements. Many of our customers form relationships with store managers and associates who help educate and guide them through their shopping experience. In addition, our no-fee Healthy Awards Program promotes brand loyalty among our customers and allows our customers to earn points redeemable for future purchases, more than 74% of which are redeemed annually. Our Healthy Awards Program customers accounted for approximately 87% of our overall sales in Fiscal 2009. The number of our top customers, defined by shopping frequency and annual dollars spent, grew approximately 12% to 429,000 in 2009 compared to 383,000 in 2008. These customers spend approximately four times as much as our average customers. We signed up approximately 1.1 million new Healthy Awards members
43
Table of Contents
in our new and existing stores in 2009. The number of active members has grown to approximately 3.7 million currently from 1.0 million in 2002. Our Healthy Awards Program is a valuable tool providing us with marketing and merchandising information on customer buying habits and market trends, as well as demographic information used to select future store locations.
Multi-Channel Retailer. We are a multi-channel retailer, distributing products through our retail stores, our websites and our catalog, enabling us to access customers outside our retail markets and those who prefer to shop online. This business model affords us multiple touch points with our customers, allows us to reach our customers where they prefer to shop and to gather data and communicate with them in person, through our call center and via the web. Our direct business provides data on our customers’ purchasing patterns that we use to enhance our email and direct mail marketing efforts as well as assist in selecting optimal future store locations. We believe this multi-channel approach, and the marketing capabilities made possible through them, have and will continue to allow us to build customer loyalty.
Experienced Management Team with Proven Track Record. We have assembled a management team with extensive experience across a broad range of disciplines in building leading specialty retailers. Richard L. Markee previously served as non-executive Chairman of the board of directors since April 2007 and has served as Chairman and Chief Executive Officer since September 2009. He previously served in various executive capacities at Toys “R” Us, including as President of Babies “R” Us and Vice Chairman of Toys “R” Us, Inc. Mr. Markee also served as interim Chief Executive Officer of Toys “R” Us and its subsidiaries. Anthony N. Truesdale joined as our President and Chief Merchandising Officer in April 2006 after serving as Senior Vice President of Merchandising and Supply Chain Management of Petsmart, Inc. Louis H. Weiss joined as our Vice President, Internet and Catalog Business in December 2006 after serving as President of Gaiam Direct, the direct marketing unit of Gaiam Inc. Michael G. Archbold joined as our Executive Vice President, Chief Operating Officer and Chief Financial Officer in April 2007 after serving as Executive Vice President, Chief Financial and Administrative Officer of Saks Fifth Avenue and Executive Vice President/Chief Financial Officer of AutoZone.
Growth Strategies
We plan to execute several strategies in the future to promote our revenue growth, capture market share and drive operating income growth, including:
Expand Our Store Base. We believe we have a highly attractive economic model for our new stores. We plan to aggressively expand our store base over the next five years, which we believe will complement the maturation of the 169 stores we have opened since January 1, 2006. We opened 39 stores in Fiscal 2009. We plan to open 42 stores in Fiscal 2010 (of which 16 were opened as of March 27, 2010) and increase our store base by approximately 10% annually thereafter. Over the next three years, we plan to locate a substantial majority of our new stores in existing markets or states. Based upon our operating experience and research conducted by The Buxton Company, we are confident that the U.S. VMS market can support over 900 Vitamin Shoppe stores operating under our current format. We also plan to explore store opening opportunities outside the United States in the next five years.
Grow Our Loyal Customer Base. We plan to continue to grow our loyal customer base through more focused marketing initiatives and by leveraging our direct business.
Marketing Initiatives. We have completed extensive research with our no-fee Healthy Awards Program, and we expect this knowledge to help us to enhance the efficacy of our marketing initiatives. Our customers in our Healthy Awards Program accounted for approximately 87% of our total sales in Fiscal 2009, with our top 383,000 customers in this program, defined by shopping frequency and annual dollars spent, spending four times as much as our average customer. In addition, we will continue to utilize our market activation strategies in conjunction with new store openings to accelerate our acquisition of new customers. Through market activation campaigns, we reach out to local businesses, gyms and doctors’ offices to attract new customers. We believe that this strategy helps us activate and retain loyal customers.
44
Table of Contents
Leverage Our Direct Business. We intend to grow our direct business through more sophisticated customer acquisition and marketing efforts to online customers. We continue to invest in technology to enhance our direct business by further personalizing the web experience for our customers at our websites, including www.vitaminshoppe.com. We recently implemented a new web platform that improved our customer tracking capabilities and will provide new features such as creating automatically-generated emails to customers that remind them to replenish their supply based on date of last purchase and building affinities across product groups so that complementary products are automatically recommended to customers based on their current purchase. In addition, we intend to focus our customer acquisition strategy on attracting and retaining more loyal customers who will be drawn to the broad range of products and educational content we plan to provide on our principal website, www.vitaminshoppe.com, as opposed to customers who are only focused on the lowest prices. In so doing, our goal is to create, better serve and retain more loyal customers. By continuing to provide a broad assortment of products with an enhanced sense of community, we expect to continue to grow our loyal customer base.
Continue to Improve Store Productivity. We plan to generate higher sales productivity through refined
merchandising and pricing initiatives. For example, we have implemented a sophisticated replenishment
methodology which we believe will continue to increase our return on inventory investment and improve our in-stock position. We believe that implementing this and other merchandising and pricing strategies will enhance the productivity of our stores. In addition, in the beginning of 2008 we deployed a new store design, which enabled us to decrease our opening store inventory levels and offer enhanced feature areas increasing focus on our specialty products. Due to its success, we plan to continue to implement this design going forward.
Continue to Invest in Education and Knowledge of Our Employees. Investing in associate training and providing employees with opportunities to grow within our company is essential to our growth strategy. We believe we provide the most comprehensive training program in the VMS industry and that our sales associates’ ability to provide greater, value-added assistance to our customers helps us deliver a differentiated retail experience. To this end, we plan to continue to expand upon the scope and content of our training programs, migrate towards an incentive-based “Pay for Knowledge” compensation program and continue to invest in our Product Education Conference, which is one of the largest in the nation, and is attended by all District and Store Managers, where over 200 brands are represented. We utilize a “promote from within” employment culture in order to offer growth opportunities for our employees, reduce turnover, and provide predictable and sustainable human resources for our growth.
Sales Channels
Retail. We believe we operate a unique retail store format in the VMS industry, which has been successful in diverse geographic and demographic markets, ranging from urban locations in New York City to suburban locations in Plantation, Florida and Manhattan Beach, California, as well as to resort locations in Hawaii. Our stores carry a broad selection of VMS products and are staffed with experienced and knowledgeable associates who are able to educate our customers about product features and assist in product selection. We are committed to high quality real estate and target attractive stand-alone locations or end cap (corner) positions in retail centers located in high traffic urban and suburban markets. We have intentionally chosen not to locate our stores in enclosed malls, secondary or tertiary shopping centers.
We operated 453 retail stores in the United States as of March 27, 2010. Since the beginning of 2006, we have aggressively pursued new store growth. From this time through March 27, 2010 we opened 147 new stores, expanding our presence in our existing markets as well as entering many new markets such as California, Texas, Michigan and Hawaii.
We plan to open approximately 42 new stores in Fiscal 2010 (of which 16 were opened as of March 27, 2010). Thereafter, we plan to increase our store base by approximately 10% annually. Over the next three years, we plan to locate a substantial majority of our new stores in existing markets or states. Thereafter, we would
45
Table of Contents
continue to place our new stores predominantly in these areas but be opportunistic with regard to locations in new markets or states. While we have no plans to extend our store base outside the United States today, we do plan to explore store opening opportunities in other territories and countries in North America in the next five years.
Our new retail store operating model, which is based on our historical performance, assumes a target store size of approximately 3,600 square feet that achieves sales per square foot of $230 in the first twelve months. Our target net investment to open a retail store is approximately $230,000, which includes the build-out costs and initial inventory net of payables. The model also reflects target pre-opening expenses of $50,000. This operating model targets a 93% pre-tax cash return on investment at maturity and an average annual pre-tax cash return on investment of greater than 50% over the four-year period. Our operating model also targets a breakeven cash flow contribution in the first year of operations and 16.6% cash flow contribution margin by the fourth year of operation. Our stores typically require four years to mature, generating lower store level sales and store contribution in the initial years than our mature stores.
Direct. Our direct segment consists of our Internet and catalog operations. The direct segment enables us to service customers outside our retail markets and provides us with data that we use to assist us in the selection of future store locations.
Currently, all of our Internet and catalog customers are members of our Healthy Awards Program. As of March 27, 2010, our customer database contained approximately 9.9 million individual customer names, of which 3.7 million were households that placed an Internet or catalog order with us or made a store purchase from us within the previous 12 months.
Since 1998, our principal website located at www.vitaminshoppe.com has allowed our customers to purchase our merchandise over the Internet. Our principal website features our full assortment of SKUs and includes free educational and product information via our Health Notes periodical. We educate prospective and current Vitamin Shoppe online customers regarding product features and assist in product selection. Our principal website also includes marketing and promotional offers such as “Special,” “Sale,” and “New” items, as well as “Compare and Save.” We believe these marketing and promotional programs, which are exclusive to our Internet operations, helps us increase the unit count and dollar volume of the average Internet basket. In Fiscal 2010 and beyond, we expect to continue enhancing our website functionality by introducing more sophisticated community elements to www.vitaminshoppe.com, such as live chat with a Vitamin Shoppe customer service representative and online chat with other loyal Vitamin Shoppe customers.
46
Table of Contents
Properties
The following table reflects our current store count by state:
| State |
Stores Open at March 27, 2010 |
State |
Stores Open at March 27, 2010 | |||
| Alabama |
2 | Minnesota | 3 | |||
| Arizona |
8 | Missouri | 1 | |||
| California |
55 | Nevada | 3 | |||
| Colorado |
8 | New Hampshire | 3 | |||
| Connecticut |
9 | New Jersey | 24 | |||
| Delaware |
2 | New Mexico | 2 | |||
| District of Columbia |
1 | New York | 59 | |||
| Florida |
57 | North Carolina | 13 | |||
| Georgia |
11 | Ohio | 11 | |||
| Hawaii |
5 | Oregon | 4 | |||
| Idaho |
1 | Pennsylvania | 13 | |||
| Illinois |
21 | Rhode Island | 1 | |||
| Indiana |
7 | South Carolina | 7 | |||
| Kansas |
2 | Tennessee | 7 | |||
| Kentucky |
3 | Texas | 38 | |||
| Louisiana |
3 | Vermont | 1 | |||
| Maryland |
13 | Virginia | 21 | |||
| Massachusetts |
12 | Washington | 5 | |||
| Michigan |
11 | Wisconsin | 6 | |||
| Total |
453 | |||||
As of March 27, 2010 we leased the properties for all of our 453 stores. Our typical lease terms are ten years, with one to two five-year renewal options. We do not believe that any individual store property is material to our financial condition or results of operations. Of the leases for our stores, one expires in Fiscal 2010, 15 expire in Fiscal 2011, 29 expire in Fiscal 2012, 61 expire in Fiscal 2013, and the balance expire in Fiscal 2014 or thereafter. We have options to extend most of these leases for a minimum of five years. We opened 39 stores in Fiscal 2009, and executed 37 leases as in Fiscal 2009 for planned store openings throughout the rest of Fiscal 2010 and Fiscal 2011.
In April 2004, we consolidated our existing warehouse and distribution centers and corporate headquarters into a new, leased, 230,000 square-foot state-of-the-art facility. The initial lease term for the facility (which commenced in 2002) is for 15 years, with one five-year renewal option. Our warehouse has the capacity to support 550 retail stores. In addition, we have entered into an agreement with a West Coast third party logistics facility, which we plan to utilize beginning in the latter half of Fiscal 2010, to accommodate the anticipated growth in our store count. The agreement is for a period of three years.
We believe that all of our current facilities are in good condition and are suitable and adequate for our current and reasonably anticipated future needs.
Products
We believe we market the broadest product selection in the VMS industry with over 20,000 SKUs from a combination of over 700 different nationally recognized brands and our proprietary Vitamin Shoppe, BodyTech and MD Select brands. Our typical store carries approximately 8,000 SKUs, with approximately 12,000 SKUs available through our direct business. We offer high-quality, nationally recognized brands such as Twinlab®, Solgar®, Country Life®, Nature’s Way®, and Solaray® and our Vitamin Shoppe proprietary brand. We also carry smaller, more exclusive high end brands such as Optimum®, Garden of Life®, New Chapter®, and Life Extension™. Additionally, we offer hard-to-find doctors’ brands including Cardiovascular Research, Allergy Research, American Biologics and Pioneer.
47
Table of Contents
Included in our broad product assortment is our proprietary brand merchandise sold under the Vitamin Shoppe, BodyTech and MD Select brands through which we offer our customers the opportunity to purchase VMS products at great value while affording us higher gross margins. In Fiscal 2009, sales of our more than 1,300 SKUs of our proprietary brand merchandise accounted for approximately 25% of our net sales. Our MD Select brand offers a premium product with a condition-specific focus while our Vitamin Shoppe brand offers a broad selection with a focus on specialty supplements. Our BodyTech brand is focused on sports nutrition. We are continuing to grow our proprietary merchandise product assortment by increasing our focus on sports nutrition, probiotics and essential fatty acids.
In addition, unlike other VMS specialty retailers, we merchandise our product offering by intended use such as Heart Wellness and Joint Support rather than by brand. This merchandising approach allows us to address our customers’ desire for health and wellness more fully and efficiently than other specialty VMS retailers, supermarkets, drugstore chains and other mass merchants while limiting our dependence on the continued success on any single brand or product. In addition, our merchandise assortment and sales are concentrated in the two fastest growing areas in the supplement business: specialty supplements and sports nutrition. We consider non-core products to be those products which contain stimulant and/or thermogenic ingredients. Today, our non-core products consist of thermogenic products, which account for only 2.7% of net sales during Fiscal 2009. No single product sub-category accounted for more than 6% of our net sales during Fiscal 2009.
Key Product Categories
Our two largest product categories are specialty supplements and sports nutrition. In Fiscal 2009, specialty supplements and sports nutrition represented 18.8% and 24.6% of our total net merchandise sales, respectively.
Specialty Supplements
Specialty supplements help supply higher levels of nutrients than diet alone can provide, help people stay healthy, and support specific conditions and life stages such as childhood, pregnancy, menopause and aging. Categories of specialty supplements include essential fatty acids, probiotics and condition specific formulas. Certain specialty supplements, such as organic greens, psyllium fiber and soy proteins, are taken for added support during various life stages and are intended to supplement vital nutrients absent in an individual’s diet. Super antioxidants, such as Coenzyme Q-10, grapeseed extract and pycnogenol, are taken to address specific conditions. High ORAC (oxygen radical absorptive capacity) fruit concentrates like açai, gogi, mangosteen, pomegranate and blueberry are taken to supplement high levels of natural nutrients not available in modern diets. Other specialty supplement formulas are targeted to support specific organs, biosystems and body functions. For example, we offer Ultimate Memory Aid for brain function, Sleep Naturally for sleeplessness and various enzyme combinations for other support systems. We offer over 5,000 specialty supplement SKUs available in tablets, capsules, vegi-capsules, soft gels, gelcaps, sublingual and liquid forms.
Sports Nutrition
Our sports nutrition consumers include the sports enthusiast, weekend warrior, endurance athlete, marathoner and serious bodybuilder who seek products to help maintain or supplement a healthy lifestyle. These products are used in conjunction with cardiovascular conditioning, weight training and sports activities. Major categories in sports nutrition include protein and weight gain powders, meal replacements, nutrition bars, sport drinks and pre and post-workout supplements to either add energy or enhance recovery after exercise. We offer over 2,000 SKUs in sports nutrition in many convenient forms such as powders, tablets, capsules, soft gels and liquids.
48
Table of Contents
Herbs and Botanicals
Herbs and botanicals offer a natural remedy and are taken to address specific conditions. Certain herbs can be taken to help support specific body systems, including ginkgo to support brain activity and milk thistle to help maintain proper liver function, as well as other less common herbs such as holy basil for stress relief, turmeric for inflammation support and black cohosh for menopause support. Herbal and botanical products include whole herbs, standardized extracts, herbs designed for single remedies, herb combination formulas and teas. With over 7,000 SKUs, a wide range of potency levels and multiple delivery systems, our customers have many choices to fit their individual needs. Our herb products are available in tablets, capsules, vegi-capsules, soft gels, gelcaps, liquids, tea bags and powders.
Vitamins and Minerals
Vitamins and minerals are taken to maintain health, proactively to improve health and in support of specific health conditions. These products help prevent nutrient deficiencies that can occur when diet alone does not provide all the necessary vitamins and minerals our bodies need. The vitamin and mineral product category includes multi-vitamins, which many consider to be a foundation of a healthy regime, lettered vitamins, such as Vitamin A, C, D, E, and B-complex, along with major and trace minerals such as calcium, magnesium, chromium and zinc. With over 4,000 SKUs, a wide range of potency levels and multiple delivery systems, our customers have many choices to fit their individual needs. Our vitamin and mineral products are available in tablets, capsules, vegi-capsules, softgels, gelcaps, liquids and powders.
Other
Our “Other” category represents all other product classifications we stock that do not fit within the previously described categories. These products include natural beauty and personal care, supplements, diet and weight management, as well as green living products which were newly added as of Fiscal 2008. Natural beauty and personal care products offer an alternative to traditional products that often contain synthetic and/or other ingredients that our customers find objectionable. Our customers choose these products over more traditional products because they contain organic and natural ingredients, are produced without the use of pesticides or animal testing and are more closely aligned with the health and wellness goals of our customers. Our wide variety of diet and weight management products range from low calorie bars, drinks and meal replacements to energy tablets, capsules and liquids. Our natural pet products include nutritionally balanced foods and snacks along with condition specific supplements such as glucosamine for joint health. We offer over 2,000 SKUs in our Other category.
Access to New Products and New Product Development
A key component of customer satisfaction is the introduction of new products. Over the last three fiscal years we have introduced over 1,200 new products each year, to provide the latest VMS products to our customers. We identify customer trends through interactions with our customers, attending trade shows, contacting vendors and generally being active within the marketplace. We maintain close relationships with our branded manufacturers, which allows us to be at the forefront of introducing new third-party branded products within the industry. In addition, we maintain a product development group that is staffed with employees who oversee our development of new proprietary products. We plan to develop 50 key products each year under the Vitamin Shoppe brand and controlled labels. We incurred approximately $1.5 million, $1.4 million and $1.6 million of research and development costs for the Fiscal 2009, Fiscal 2008 and Fiscal 2007, respectively.
Healthy Awards Program
Our Healthy Awards Program, which we established over 13 years ago, promotes brand loyalty among our customers and allows our customers to earn points redeemable for future purchases, approximately 74% of which are redeemed per year. Sales to our Healthy Awards Program customers represent approximately 87% of our overall sales. We signed up approximately 1.1 million new members in our new and existing stores in Fiscal
49
Table of Contents
2009. The number of active members has grown to approximately 3.7 million currently from approximately 1.0 million in 2002. Our Healthy Awards Program is a valuable tool providing us with marketing and merchandising information on customer buying habits and market trends, as well as demographic information used to select locations for future stores.
Suppliers and Inventory
We consider numerous factors in supplier selection, including, but not limited to, quality, price, credit terms, and product offerings. As is customary in our industry, we generally do not have long-term contracts with any supplier and most suppliers could discontinue selling to us at any time.
We strive to maintain sufficient inventory to enable us to provide a high level of service to our customers. Inventory, accounts receivable and accounts payable levels, payment terms and return policies are in accordance with standard business procedures. We maintain a distribution center which we use in conjunction with a just-in-time inventory ordering system that we use to replenish our stores based upon customer demand of a given product or products. Our working capital requirements for merchandise inventory will continue to increase as we continue to open additional stores. Currently, our practice is to establish an inventory level of approximately $165,000 to $185,000 in cost for each of our stores, a portion of which is vendor-financed based upon agreed credit terms, with the remainder being purchased in cash. Thirty day payment terms are extended to us by some of our suppliers allowing us to effectively manage our inventory and working capital. We believe that our buying power enables us to receive favorable pricing terms and enhances our ability to obtain high demand merchandise.
Nature’s Value, Inc. is the only supplier from whom we purchased at least 5% of our merchandise during Fiscal 2009, Fiscal 2008 and Fiscal 2007. We purchased approximately 6%, 7%, and 10% of our total merchandise from Nature’s Value, Inc. in Fiscal 2009, Fiscal 2008 and Fiscal 2007, respectively.
Warehouse and Distribution
Our state of the art warehouse facility provides operating space of approximately 180,000 square feet and gives us great control over supervision costs and distribution center related inventory levels. In addition, through a combination of improved technology, processes, controls and layout, we have greatly improved our pick accuracy rates and net inventory accuracy rates. With minor physical changes, systems enhancements and West Coast third party logistics solutions, we believe we have sufficient capacity for the next several years. We currently operate two shifts, seven days a week, and have the ability to expand our schedule and capacity to meet future demand in our facility.
Quality Control
The FDA is the regulatory authority charged with overseeing the products marketed by us and the products found in our stores. The FTC regulates the advertising of the products marketed by us and the products found in our stores.
Our Scientific and Regulatory Affairs (“S&RA”) department reviews all aspects of our Company’s FDA and FTC regulatory processes, ensuring compliance with regulations. We have established processes to review the underlying safety and efficacy of our Vitamin Shoppe and BodyTech branded products. These processes include review of the ingredients’ safety information, product formulation, product form, product labeling, the efficacy and claim support for the product and any marketing materials. All consumer communications that deal with product and health issues must be approved by S&RA prior to being disseminated to the public.
We have standard procedures whereby all potential Vitamin Shoppe contract manufacturers are reviewed and approved before they can supply any of our Vitamin Shoppe or BodyTech branded products. In addition, all potential new products are vetted and approved prior to being accepted into our Vitamin Shoppe or BodyTech branded product line.
50
Table of Contents
Our three primary suppliers for our Vitamin Shoppe and BodyTech branded products are Nature’s Value, Inc., Main Street Ingredients, and Softgel Technology, Inc, which together produce over half of our Vitamin Shoppe and BodyTech branded products. We have long-term relationships with these suppliers of over ten years. There are numerous contract manufacturers in our industry and we do not believe it would be difficult to source our products from other vendors, should all of our three primary suppliers cease providing us with supplies. Our relationships with manufacturers require that all Vitamin Shoppe and BodyTech branded products not be adulterated or misbranded under any provisions of the Federal Food, Drug, and Cosmetic Act (“FDCA”) and the regulations promulgated thereunder. This includes, but is not limited to, compliance with applicable GMP. This means that ingredients in our products must be tested for identity, purity, quality, strength, and composition before being incorporated into our Vitamin Shoppe or BodyTech branded products, and that our final Vitamin Shoppe and BodyTech branded products must again be tested for identity, purity, quality, strength, and composition prior to being released. All of these products require a certificate of analysis, which includes certification to 100% of label claim.
We have established a standard quality control operating procedure that calls for on-site audits of our contract manufacturers’ facilities and processes, and have established an internal team that will audit each of these facilities and work with our contract manufacturers to resolve any noncompliance with dietary supplement GMP regulations. We require that our manufacturers have certificates of analysis (such as for microbe testing and label testing).
Additionally, we have established standard quality control operating procedures to review vendors of third-party products and require them to carry adequate insurance policies to satisfy our standards. We further review each new product proposed to be carried by us to assure the safety of the ingredients. We reject those products that we believe may be unsafe. Our third-party manufacturers and distributors and contract manufacturers deliver finished products to our warehouse and distribution center in New Jersey, which then supplies our retail and direct channels with products.
Competition
The U.S. nutritional supplements retail industry is highly competitive and fragmented. According to the NBJ and public filings with the SEC, no single retailer accounted for more than 5% of total industry sales in 2008. Competition is based primarily on quality, product assortment, price, customer service, marketing support and availability of new products. We compete with publicly and privately owned companies with broad geographical market coverage and product categories. We compete with other specialty and mass market retailers including Vitamin World®, GNC®, Whole Foods®, Costco® and Wal-Mart®, Internet and mail order companies including Puritan’s Pride®, vitacost.com, Bodybuilding.com®, Doctors Trust®, Swanson® and iHerb® in addition to a variety of independent health and vitamin stores.
Insurance and Risk Management
We purchase insurance to cover standard risks in our industry, including policies to cover general and products liability, workers compensation, travel liability, auto liability and other casualty and property risks. Our insurance rates are based on our safety record as well as trends in the insurance industry.
We face an inherent risk of exposure to product liability claims in the event that, among other things, the use of our products results in injury. With respect to product liability coverage, we carry insurance coverage typical of our industry and product lines. Our coverage involves self-insured retentions with primary and excess liability coverage above the retention amount. We have the ability to refer claims to our contract manufacturers, third-party vendors and their respective insurers to pay the costs associated with any claims arising from such contract manufacturers’ or third-party vendors’ products. Our insurance covers any claims that are not adequately covered by a contract manufacturer’s or third-party vendor’s insurance and provides for excess secondary coverage above
51
Table of Contents
the limits provided by our contract manufacturers or third-party vendors. We believe we have obtained a prudent amount of insurance for the insurable risks associated with our business. Our experience is that our insurance costs have increased in the past, and may increase in the future.
Trademarks and Other Intellectual Property
We believe trademark protection is particularly important to the maintenance of the recognized proprietary brand names under which we market our products. We own material trademarks or trade names that we use in conjunction with the sale of our products, including the Vitamin Shoppe, BodyTech and MD Select brand names. We also rely upon trade secrets, know-how, continuing technological innovations and licensing opportunities to develop and maintain our competitive position. We protect our intellectual property rights through a variety of methods including trademark and trade secret laws, as well as confidentiality agreements and proprietary information agreements with vendors, employees, consultants and others who have access to our proprietary information. Protection of our intellectual property often affords us the opportunity to enhance our position in the marketplace by precluding our competitors from using or otherwise exploiting our technology and brands. Our trademark, which is an indefinite lived intangible asset, was $68.8 million at December 26, 2009 and $68.7 million at December 27, 2008.
Employees
As of December 26, 2009, we had a total of 2,045 full-time and 1,313 part-time employees, of whom 2,846 were employed in our retail channel and 512 were employed in corporate, distribution and direct channel support functions. None of our employees belongs to a union or is a party to any collective bargaining or similar agreement. We consider our relationships with our employees to be good.
Environmental
We are subject to numerous federal, state, local and foreign laws and regulations governing our operations, including the handling, transportation and disposal of our products and our non-hazardous and hazardous substances and wastes, as well as emissions and discharges into the environment, including discharges to air, surface water and groundwater. Failure to comply with such laws and regulations could result in costs for corrective action, penalties or the imposition of other liabilities. Changes in environmental laws or the interpretation thereof or the development of new facts could also cause us to incur additional capital and operation expenditures to maintain compliance with environmental laws and regulations. We also are subject to laws and regulations that impose liability and cleanup responsibility for releases of hazardous substances into the environment without regard to fault or knowledge about the condition or action causing the liability. Under certain of these laws and regulations, such liabilities can be imposed for cleanup of previously owned or operated properties. The presence of contamination from such substances or wastes could also adversely affect our ability to utilize our leased properties. Compliance with environmental laws and regulations has not had a material effect upon our earnings or financial position; however, if we violate any environmental obligation, it could have a material adverse effect on our business or financial performance.
Legal Proceedings
Dwight Thompson v. The Vitamin Shoppe and Consolidated Actions. The Company reclassified its California store managers as non-exempt employees in January 2004. On February 25, 2005, plaintiff Dwight Thompson (“Thompson”), a former store manager, filed suit on behalf of himself and other “similarly situated” current and former California store managers and assistant store managers in the Superior Court of the State of California for the County of Orange (“Orange County Superior Court”), alleging causes of action for alleged wage and hour violations, unfair business practices, unfair competition under Cal. Bus. & Prof. Code §§ 17000 et seq. (“UCL”) and penalties under the Labor Code Private Attorneys General Act, Cal. Labor Code §§ 2698 et seq. (“PAGA”) (the “Thompson Action”). Almost one year later, on July 7, 2006, the same group of plaintiffs’
52
Table of Contents
attorneys who were representing Thompson filed another wage and hour lawsuit against The Vitamin Shoppe based on substantively identical allegations in the Orange County Superior Court, entitled Estel v. The Vitamin Shoppe Industries Inc. (Case No. 06CC07852) (the “Estel Action”). Plaintiffs in the Estel Action were already class members in the Thompson Action. In January 2008, the Court consolidated the Thompson and Estel actions. In the consolidated complaint, Plaintiffs assert nine claims for relief against the Company: (1) failure to pay overtime wages; (2) unfair business practices in violation of Cal. Bus. & Prof. Code §§ 17000 et seq.; (3) conversion; (4) failure to provide meal periods; (5) failure to provide rest periods; (6) unfair competition under the UCL; (7) failure to provide itemized wage statements; (8) failure to provide wages and accrued vacation upon termination; and (9) recovery of civil penalties under PAGA. Plaintiffs purport to bring their UCL and PAGA claims as representative actions and the remaining claims as individual claims and on behalf of a class composed of all current and former assistant managers and managers of the Company who were employed on or after April 14, 2006 (the “Amended Thompson Action”). The Company intends to defend the Amended Thompson Action vigorously. As of March 27, 2010, the Company does not believe the financial statement impact of this matter will be material.
California District Attorney’s Letter. On May 17, 2007, the Company received a letter from the Napa County (California) District Attorney alleging that six of the Company’s private label products contain levels of lead that, pursuant to California’s Proposition 65, Cal. Health & Safety Code section 25249.5 et seq., (“Proposition 65”) require the products to bear a warning when sold in California. The letter claims that 12 other public prosecutors in California, including the California Attorney General, “are involved in a joint investigation of dietary supplements containing lead in amounts that expose users to lead in excess of 0.50 micrograms (ug) per day.” The letter demands that the Company immediately cease all sales of these products in California unless it provides a warning to consumers. It also notes that Proposition 65 provides for civil penalties of up to $2,500 per violation per day.
The Company has met with the California Attorney General and certain District Attorneys, and is investigating these allegations and consulting with its third-party suppliers of these products. The Company has withdrawn certain named products from the California market and has provided warnings with respect to other products still available in California pending discussions with the public prosecutors. The Napa County District Attorney has expressed concerns on several occasions as to the method of warning employed by the Company and the completeness of its implementation. The Company has revised its warnings and reviewed its procedures for implementing warnings. The Company has responded to numerous requests for information and has met in person with representatives of the Napa County District Attorney and the California Attorney General to attempt to resolve this matter. As of March 27, 2010, the Company does not believe the financial statement impact of this matter will be material.
The People of the State of California v. 21st Century Healthcare, Inc. On October 22, 2008, a private enforcer named Vicky Hamilton sent over 70 manufacturers and retailers of multivitamin products, including the Company, various Sixty-Day Notices of Violation of Proposition 65, Cal. Health & Safety Code section 25249.5 et seq. alleging that certain products contain lead and lead compounds and were sold in California without a Proposition 65 warning threatening litigation pertaining to two of the Company’s multivitamin products. On December 23, 2008, the California Attorney General and nine California District Attorneys filed a complaint on behalf of the People of the State of California against a number of companies who received notices of violation from Ms. Hamilton, including the Company in Alameda County Superior Court. The action alleges violations of both Proposition 65 and the UCL and supplants the litigation Ms. Hamilton sought to bring against the Company on the claims stated in her Notice of Violation. Penalties under Proposition 65 may be assessed at the maximum rate of $2,500 per violation per day. Penalties under the UCL may be assessed at the same rate and are cumulative to those available under Proposition 65. Injunctive relief and attorneys fees are also available. The Company is investigating these claims and discussing them with the California Attorney General and District Attorneys. At this time it is premature to determine the extent of any potential loss. Accordingly, as of March 27, 2010, the Company has not accrued any liabilities related to this litigation.
53
Table of Contents
J.C. Romero v. ErgoPharm Inc., Proviant Technologies Inc., VS Holdings Inc, d/b/a Vitamin Shoppe, and General Nutrition Centers Inc. On April 27, 2009, plaintiff, a professional baseball player, filed a complaint against us, among others, in Superior Court of New Jersey (Law Division/Camden County). Plaintiff alleges that he purchased from one of our stores and consumed 6-OXO Extreme, which was manufactured by a third party, and in August 2008, allegedly tested positive for a banned substance. Plaintiff served a 50 game suspension imposed by Major League Baseball. The seven count complaint asserts, among other things, claims for negligence, strict liability, misrepresentation, breach of implied warranty and violations of the New Jersey Consumer Fraud Act, and seeks unspecified monetary damages, including lost income during the suspension. The Company denies any and all liability and intends to vigorously defend these claims. Any liabilities that may arise from this matter are not probable or reasonably estimable at this time. Accordingly, as of March 27, 2010, the Company has not accrued any liabilities related to this litigation.
The Company is party to various lawsuits arising from time to time in the normal course of business, many of which are covered by insurance. Except as described above, as of March 27, 2010, the Company was not party to any material legal proceedings. Although the impact of the final resolution of these matters on the Company’s financial condition, results of operations or cash flows is not known, management does not believe that the resolution of these lawsuits will have a material adverse effect on the financial condition, results of operations or liquidity of the Company.
Government Regulation
The formulation, manufacturing, processing, labeling, packaging, advertising and distribution of our products are subject to regulation by several federal agencies, including the FDA, the FTC, the Consumer Product Safety Commission, the DOA and the EPA. These activities are also regulated by various agencies of the states and localities in which our products are sold. Pursuant to the FDCA, the FDA regulates the processing, formulation, safety, manufacture, packaging, labeling and distribution of dietary supplements (including vitamins, minerals, and herbs) and cosmetics. The FTC has jurisdiction to regulate the advertising of these products.
The FDCA has been amended several times with respect to dietary supplements, in particular by the Dietary Supplement Health and Education Act of 1994 (“DSHEA”). DSHEA established a new framework governing the composition, safety, labeling and marketing of dietary supplements. “Dietary supplements” are defined as vitamins, minerals, herbs, other botanicals, amino acids and other dietary substances for human use to supplement the diet, as well as concentrates, metabolites, constituents, extracts or combinations of such dietary ingredients. Generally, under DSHEA, dietary ingredients that were on the market prior to October 15, 1994 may be used in dietary supplements without notifying the FDA. New dietary ingredients (i.e., not marketed in the U.S. prior to October 15, 1994) must be the subject of a new dietary ingredient notification submitted to the FDA unless the ingredient has been “present in the food supply as an article used for food” without being “chemically altered.” A new dietary ingredient notification must be submitted to the FDA at least 75 days before the initial marketing of the new dietary ingredient. There is no certainty that the FDA will accept any particular evidence of safety for any new dietary ingredient. The FDA’s refusal to accept such evidence could prevent the marketing of such dietary ingredients.
DSHEA permits “statements of nutritional support” to be included in labeling for dietary supplements without premarket FDA approval. Such statements must be submitted to the FDA within 30 days of marketing and must bear a label disclosure that “This statement has not been evaluated by the Food and Drug Administration. This product is not intended to diagnose, treat, cure, or prevent any disease.” Such statements may describe how a particular dietary ingredient affects the structure, function or general well-being of the body, or the mechanism of action by which a dietary ingredient may affect body structure, function or well-being, but may not expressly or implicitly represent that a dietary supplement will diagnose, cure, mitigate, treat, or prevent a disease. A company that uses a statement of nutritional support in labeling must possess scientific evidence substantiating that the statement is truthful and not misleading. If the FDA were to determine that a particular
54
Table of Contents
statement of nutritional support was an unacceptable drug claim or an unauthorized version of a disease claim for a food product, or if the FDA were to determine that a particular claim was not adequately supported by existing scientific data or was false or misleading, we would be prevented from using that claim.
In addition, DSHEA provides that so-called “third-party literature,” e.g. a reprint of a peer-reviewed scientific publication linking a particular dietary ingredient with health benefits, may be used “in connection with the sale of a dietary supplement to consumers” without the literature being subject to regulation as labeling. Such literature must not be false or misleading; the literature may not “promote” a particular manufacturer or brand of dietary supplement; and a balanced view of the available scientific information on the subject matter must be presented. If the literature fails to satisfy each of these requirements, we may be prevented from disseminating such literature with our products, and any dissemination could subject our product to regulatory action as an illegal drug. The FDA in June 2007 adopted final regulations setting forth the GMP in manufacturing, packing, or holding dietary ingredients and dietary supplements which apply to the products we distribute and which are enforced by the FDA through its facilities inspection program. These regulations require dietary supplements to be prepared, packaged and held in compliance with strict rules, and require quality control provisions similar to those in the GMP regulations for drugs. We or our third party manufacturers have incurred and continue to incur additional expenses in complying with the new rules.
The FDA has broad authority to enforce the provisions of the FDCA applicable to foods, dietary supplements, and cosmetics including powers to issue a public warning letter to a company, to publicize information about illegal products, to request a recall of illegal products from the market, and to request the Department of Justice to initiate a seizure action, an injunction action, or a criminal prosecution in the United States courts. The regulation of foods, dietary supplements and cosmetics may increase or become more restrictive in the future.
The Dietary Supplement and Nonprescription Drug Consumer Protection Act, enacted in 2006, amended the FDCA to require adverse event reporting and recordkeeping for dietary supplements and certain non-prescription drugs. Other legislation has been introduced in the current Congress that could impose significant obligations on the dietary supplement industry, including, for example, requiring dietary supplement manufacturing, processing, and holding facilities to register with the FDA and providing the FDA with authority to mandate recalls in the event there is reasonable probability of adulteration or misbranding. The precise language of the legislation is currently being negotiated, so we cannot predict with certainty the impact it will have on us. However, the new proposals are expected to impose new requirements that could raise our costs and hinder our business.
The FTC exercises jurisdiction over the advertising of foods, dietary supplements and cosmetics. In recent years, the FTC has instituted numerous enforcement actions against dietary supplement companies for failure to have adequate substantiation for claims made in advertising or for the use of false or misleading advertising claims. As a result of our efforts to comply with applicable statutes and regulations, we have from time to time reformulated, eliminated or relabeled certain of our products and revised certain provisions of our sales and marketing program. The FTC has broad authority to enforce its laws and regulations applicable to foods, dietary supplements and cosmetics, including the ability to institute enforcement actions which often result in consent decrees, injunctions, and the payment of civil penalties by the companies involved. Failure to comply with the FTC’s laws and regulations could impair our ability to market our products.
55
Table of Contents
The following table sets forth information regarding the board of directors (the “Board”) and management of Vitamin Shoppe, Inc. as of April 30, 2010. Executive officers serve at the request of the Board:
| NAME |
AGE | POSITION | ||
| Richard L. Markee |
56 | Chief Executive Officer, Chairman of the Board, Director | ||
| Michael G. Archbold |
49 | Executive Vice President, Chief Operating Officer and Chief Financial Officer | ||
| Anthony N. Truesdale |
47 | President and Chief Merchandising Officer | ||
| Cosmo La Forgia |
55 | Vice President, Finance | ||
| Louis H. Weiss |
41 | Chief Marketing Officer | ||
| James M. Sander |
53 | Vice President, General Counsel and Corporate Secretary | ||
| B. Michael Becker |
65 | Director | ||
| Catherine E. Buggeln |
49 | Director | ||
| John H. Edmondson |
65 | Director | ||
| David H. Edwab |
55 | Director | ||
| John D. Howard |
57 | Director | ||
| Douglas R. Korn |
47 | Director | ||
| Richard L. Perkal |
56 | Director | ||
| Beth M. Pritchard |
63 | Director | ||
| Katherine Savitt-Lennon |
46 | Director |
Richard L. Markee, has served as a director since September 2006, and was non-executive Chairman of the Board and Director of the Board from April 2007 to September 2009. On September 8, 2009, Mr. Markee was appointed as the Company’s Chief Executive Officer and serves as Chairman of the Board and a director of the Board. He previously served as the President of Babies “R” Us since August 2004 and Vice Chairman of Toys “R” Us, Inc. since May 2003 through November 2007. Mr. Markee also served as interim chief executive officer of Toys “R” Us, Inc. and its subsidiaries from July 2005 to February 2006. Mr. Markee served as President of Toys “R” Us U.S. from May 2003 to August 2004. From January 2002 to May 2003, he was Executive Vice President – President – Specialty Businesses and International Operations of Toys “R” Us. Mr. Markee was an Operating Partner of Irving Place Capital Management, L.P., a private equity firm focused on making equity investments in middle-market companies from November 2008 to September 2009. From 2006 to 2008, Mr. Markee was an Operating Partner of Bear Stearns Merchant Banking, the predecessor to Irving Place Capital Management, L.P. He has also been a director of Dorel Industries since November 2008. From June 2005 through July 2006, he served on the board of directors of The Sports Authority, Inc. From October 1999 to January 2002, he served as Executive Vice President – President of Babies “R” Us and the Chairman of Kids “R” Us. As a result of these and other professional experiences, Mr. Markee possesses particular knowledge and experience in marketing/branded consumer products and strategic planning and leadership of complex organizations that strengthen the Board’s collective qualifications, skills and experience.
Anthony N. Truesdale has served as our President and Chief Merchandising Officer since April 2006. Prior to joining us, he was Senior Vice President of Merchandising and Supply Chain Management at Petsmart, Inc., holding various positions of increasing responsibility since January 1999. Before joining Petsmart, Inc., Mr. Truesdale worked for two years at Sainsbury’s in the United Kingdom as the senior manager for produce and for 16 years with various operations and merchandising roles at Shaws Supermarkets in New England.
Michael G. Archbold has served as our Executive Vice President, Chief Operating Officer and Chief Financial Officer since April 2007. Mr. Archbold served as Executive Vice President / Chief Financial and Administrative Officer of Saks Fifth Avenue from 2005 to 2007. From 2002 to 2005 he served as Chief Financial
56
Table of Contents
Officer for AutoZone, originally as Senior Vice President, and later as Executive Vice President. Mr. Archbold currently serves as Lead Independent Director of the Borders Group board of directors. Mr. Archbold is a Certified Public Accountant, and has 20 years of financial experience in the retail industry.
Cosmo La Forgia has served as our Vice President, Finance since September 2004. Mr. La Forgia joined our Company as Corporate Controller in January 2003. Prior to that time, Mr. La Forgia was Divisional Controller for The Home Depot, Inc. from June 1998 to December 2002.
Louis H. Weiss has served as our Vice President, Internet and Catalog Business since December 2006 and was promoted to chief marketing officer in Fiscal 2009. Prior to December 2006, Mr. Weiss served as president for Gaiam Direct, the direct marketing unit of Gaiam Inc., in 2005 and 2006. In 2004 and 2005 he was senior vice president of Good Times Entertainment. In July 2005, Good Times Entertainment filed a petition under Chapter 11 of the Federal Bankruptcy Act and was acquired by Gaiam, Inc. later that year. In 2003 and 2004 Mr. Weiss served as a strategic consultant to various online direct marketing companies. From 2000 through 2003 Mr. Weiss was with Blue Dolphin, Inc. in various executive capacities, and was President thereof at the time he left the company.
James M. Sander has served as our Vice President, General Counsel and Corporate Secretary since November 2008. Prior to joining The Vitamin Shoppe, Mr. Sander was Senior Vice President, General Counsel and Secretary at Sharper Image Corporation from July 2007 to July 2008. Sharper Image Corporation filed for protection under Chapter 11 of the Bankruptcy Code in February 2008. From August 2005 to July 2007, Mr. Sander was in private practice with Holsworth Sander and Associates in Pittsburgh, PA. From October 1988 to August 2005, Mr. Sander was counsel for General Nutrition Companies, Inc. and its subsidiaries, serving as their Vice President, Chief Legal Officer and Corporate Secretary from February 1993, and as their Senior Vice President, Chief Legal Officer and Corporate Secretary from December 2003. Mr. Sander has his Juris Doctor Degree from the Duquesne University School of Law.
B. Michael Becker has served as director since January 2008 and is Chairman of the Audit Committee. Mr. Becker was an Audit Partner for Ernst & Young LLP prior to his retirement in 2006. Mr. Becker was a Senior Consultant on airline risks to Pay Pal, Inc., from August 2008 to November 2009 and from August 2006 to August 2008 had a consulting practice which had an arrangement with Ernst & Young LLP to provide consulting services for two of its clients in the capacity of accounting and audit. Mr. Becker served as an Audit Partner for Ernst & Young LLP since 1979, where he spent the entirety of his career prior to his retirement. Mr. Becker holds an MBA and is an inactive Certified Public Accountant. The Board selected Mr. Becker to serve as a director based on his extensive experience in financial matters. Mr. Becker has experience in auditing and reporting on the financial statements and on internal controls over financial reporting of large publicly held companies, including retail companies.
Catherine E. Buggeln has served as a director since November 2009. Ms. Buggeln currently serves as a director of Stuart Weitzman LLC, Noble Biomaterials, and serves as a director and is a member of the Audit Committee of The Dress Barn, Inc., which is publicly traded. Ms. Buggeln also serves on the Governing Board of the Business Council for Peace. Ms. Buggeln has provided business strategy and brand management consulting services within the past five years. Ms. Buggeln was Senior Vice President, Strategic Planning and Business Development for Coach, Inc. from 2001 to 2004. The Board selected Ms. Buggeln to serve as a director because of her strong background in strategic planning and new business development.
John H. Edmondson has served as a director since April 2006. In addition to our Board, Mr. Edmondson serves on the board of Cabela’s Sporting Goods, and is a member of its audit committee. Mr. Edmondson served as Chief Executive Officer and director of West Marine, Inc., a NASDAQ-listed retail company selling boating supplies and accessories in 38 states, Puerto Rico and Canada, from December 1998 until January 2005. Mr. Edmondson has been pursuing his personal interests since January 2005. The Board selected Mr. Edmondson to serve as a director based on his experience as the former Chief Executive Officer of a multi-store retailer and as a director.
57
Table of Contents
David H. Edwab has served as a director since November 2005. Mr. Edwab has served as an officer and director of Men’s Wearhouse for over 15 years, starting as Vice President of Finance and Director in 1991, serving as Chief Operating Officer from 1993 to 1997, where he was elected President in 1997. In November 2000, Mr. Edwab joined Bear, Stearns & Co. Inc. as a Senior Managing Director, Head of the Retail Group in the Investment Banking Department. At such time, Mr. Edwab resigned as President of Men’s Wearhouse and was then named Vice Chairman of the board of directors. In February 2002, Mr. Edwab re-joined Men’s Wearhouse and continues to serve as Vice Chairman of its board of directors. Mr. Edwab previously served as a Senior Advisor to Bear Stearns Merchant Banking, LLC, an affiliate of Bear Stearns & Co. Inc. and the predecessor to Irving Place Capital Management, L.P., a private equity firm focused on making equity investments in middle-market companies, until April 2008. Mr. Edwab also serves as Vice Chairman of the Zimmer Family Foundation. Mr. Edwab is an inactive Certified Public Accountant and currently serves as a director of New York & Company, Inc. and Men’s Wearhouse, Inc., both of which are publicly traded companies; as well as other privately owned companies. He was previously a partner with Deloitte & Touche. The Board selected Mr. Edwab to serve as a director based on his extensive retail and financial background and his experience having served on the boards of directors of retailers.
John D. Howard has served as a director since November 2002. He is currently the Chief Executive Officer of Irving Place Capital Management, L.P., a private equity firm focused on making equity investments in middle-market companies. From its inception in 1997 until 2008, Mr. Howard was the head of Bear Stearns Merchant Banking, an affiliate of Bear, Stearns & Co. Inc and the predecessor to Irving Place Capital Management, L.P., as well as a Senior Managing Director of Bear, Stearns & Co. Inc. From 1990 to 1997, he was a co-Chief Executive Officer of Vestar Capital Partners, Inc., a private investment firm specializing in management buyouts. Previously he was a Senior Vice President of Wesray Capital Corporation, a private investment firm specializing in leveraged buyouts. Mr. Howard currently serves as a director of Universal Hospital Services, Inc., as well as a director and member of the Corporate Governance Committee and Compensation Committee of New York & Company, Inc., and as a director of Aéropostale, Inc., all of which are publicly traded companies. As a result of these and other professional experiences, Mr. Howard possesses particular knowledge and experience in finance and capital structure, and because of his extensive experience as an investor in the retail industry, each of which strengthen the Board’s collective qualifications, skills and experience.
Douglas R. Korn has served as a director since November 2002, and is Chairman of the Compensation Committee and of the Nomination and Governance Committee. Mr. Korn has been a director of our subsidiaries, Vitamin Shoppe Industries Inc. and VS Direct Inc. since 2002. He is currently a Senior Managing Director of Irving Place Capital Management, L.P., a private equity firm focused on making equity investments in middle-market companies. From 1999 to 2008, Mr. Korn was a Senior Managing Director of Bear, Stearns & Co. Inc. and a Partner and Executive Vice President of Bear Stearns Merchant Banking, an affiliate of Bear, Stearns & Co. Inc and the predecessor to Irving Place Capital Management, L.P. Prior to joining Bear Stearns in January 1999, Mr. Korn was a Managing Director of Eos Partners, L.P., an investment partnership. Mr. Korn previously worked in private equity with Blackstone Group and in investment banking with Morgan Stanley. Mr. Korn is currently a director of several private companies and charitable organizations. As a result of these and other professional experiences, Mr. Korn possesses particular knowledge and experience in finance and capital structure and design and oversight of management compensation plans, each of which strengthen the Board’s collective qualifications, skills and experience.
Richard L. Perkal has served as a director since November 2002, and is our Lead Director. Mr. Perkal has been a director of our subsidiaries, Vitamin Shoppe Industries Inc. and VS Direct Inc. since 2002. Mr. Perkal is currently a Senior Managing Director of Irving Place Capital Management, L.P., a private equity firm focused on making equity investments in middle-market companies. From 2000 to 2008, Mr. Perkal was a Senior Managing Director of Bear, Stearns & Co. Inc. and a Partner of Bear Stearns Merchant Banking, an affiliate of Bear, Stearns & Co. Inc and predecessor to Irving Place Capital Management, L.P. Prior to joining Bear, Stearns & Co. Inc. in 2000, Mr. Perkal was a Senior Partner in the law firm of Kirkland & Ellis LLP where he headed the Washington D.C. corporate transactional practice, primarily focusing on leveraged buyouts and recapitalizations. Mr. Perkal currently serves as a director of New York & Company, Inc., a publicly traded company, as well as
58
Table of Contents
several private companies. As a result of these and other professional experiences, Mr. Perkal possesses particular knowledge and experience in legal/regulatory, finance and capital structure that strengthen the Board’s collective qualifications, skills and experience.
Beth M. Pritchard has served as director since January 2008. Ms. Pritchard served as President and Chief Executive Officer of Dean & Deluca from 2005 to November 2007 and as Vice Chairman of Dean & Deluca from December 2007 to November 2008. Ms. Pritchard joined Dean & Deluca in 2006, having previously served as President and Chief Executive Officer of Organized Living from January 2004 until May 2005, when it filed a reorganization petition under chapter 11 of the Bankruptcy Code and was subsequently liquidated. She also served as President and Chief Executive Officer of Bath & Body Works where she spent 12 years of her career helping to develop it into a specialty retail chain. Ms. Pritchard has served on the board of Borders Group, Inc., and currently serves as a director and member of the Finance and Compensation Committees of Ecolab, Inc., a publicly traded company. The Board selected Ms. Pritchard to serve as a director due to her extensive experience as the Chief Executive Officer of multi-store retailers and her experience having served on the boards of directors of retailers.
Katherine Savitt-Lennon has served as a director since November 2009. Since 2009, Ms. Savitt-Lennon has served as the Chief Executive Officer of Lockerz, LLC. From 2006 to 2009, Ms. Savitt-Lennon served as the Executive Vice President and Chief Marketing Officer of American Eagle Outfitters, Inc. From 2002 to 2006, she served Vice President, Strategic Communications, Content and Initiatives of Amazon.com. Ms. Savitt-Lennon serves on the Advisory Board of Liberty Media, and as a board member of the Carnegie Museum of Art. Ms. Savitt-Lennon is a director of Build-A-Bear Workshop, Inc., a publicly traded company. The Board selected Ms. Savitt-Lennon due to her background in marketing. Additionally, Ms. Savitt-Lennon has an exceptional background in e-commerce combined with new business development both online and brick and mortar.
Term of Directors and Composition of Board of Directors
Our certificate of incorporation authorizes a board of directors consisting of at least three, but no more than fifteen, members, with the number of directors to be fixed from time to time by a resolution of the Board. Our Board currently consists of ten directors, a majority of whom have been declared by our Board to be “independent” as defined under NYSE rules and Rule 10A-3 of the Securities Exchange Act, as amended.
Board Committees
Subsequent to the completion of this offering, we will no longer be a “controlled company” under NYSE rules, and will therefore need to have a fully independent compensation committee and nomination and governance committee within one year of the consummation of this offering. Currently (prior to the completion of this offering) we are classified as a “controlled company,” which under NYSE rules, is defined as more than 50% of the voting power being held by an individual, a group or another company.
Audit Committee. The audit committee of the Board consists of five members. The committee assists the Board in its oversight responsibilities relating to the integrity of our financial statements, the qualifications, independence and performance of our independent auditors, the performance of our internal audit function and the compliance of our company with any reporting and regulatory requirements we may be subject to. Four of the five members of our audit committee (Mr. Edwab, Mr. Edmondson, Mr. Becker and Ms. Buggeln) have been declared by our Board to be “independent” as defined under NYSE rules and Rule 10A-3 of the Securities Exchange Act, as amended. We intend to have a completely independent audit committee within one year of the date of our initial public offering.
Compensation Committee. The compensation committee of the Board is authorized to review our compensation and benefits plans to ensure they meet our corporate objectives, approve the compensation structure of our executive officers and evaluate our executive officers’ performance and advise on salary, bonus
59
Table of Contents
and other incentive and equity compensation. Two of the four members of our compensation committee (Mr. Edwab and Mr. Edmondson) have been declared by our Board to be “independent” as defined under NYSE rules. We intend to have a majority of the members of our compensation committee be independent within ninety days of the consummation of this offering and to have a completely independent compensation committee within one year of the consummation of this offering.
Nomination and Governance Committee. The nomination and governance committee of the Board assists the Board in identifying individuals qualified to become Board members, makes recommendations for nominees for committees and develops, recommends to the Board and reviews our corporate governance principles. Two of the five members of our nomination and governance committee (Ms. Pritchard and Ms. Savitt-Lennon) have been declared by our Board to be “independent” as defined under NYSE rules. We intend to have a majority of the members of our nomination and governance committee be independent within ninety days of the consummation of this offering and to have a completely independent nomination and governance committee within one year of the consummation of this offering.
Compensation Committee Interlocks and Insider Participation
None of our executive officers serves as a member of the compensation committee or board of directors of any other entity that has an executive officer serving as a member of our Board or compensation committee.
60
Table of Contents
COMPENSATION DISCUSSION AND ANALYSIS
Compensation Committee Process
The Compensation Committee of the Board approves all compensation and awards to the top executives of the Company, including the named executive officers included on the Summary Compensation Table. Annually, the Compensation Committee reviews the performance and compensation of the Chief Executive Officer and, subject to the Chief Executive Officer’s employment agreement, establishes the Chief Executive Officer’s compensation for the subsequent year. Additionally, following discussions with the Chief Executive Officer (including the Chief Executive Officer’s recommendations) and, where the Compensation Committee determines that it is appropriate with other advisors, the Compensation Committee establishes the compensation for the Company’s other executive’s for the subsequent year.
The Compensation Committee met three times in 2009 and once in 2008. The Compensation Committee’s charter provides that it will (i) develop, approve, and report to the Board regarding the Company’s overall compensation philosophy and strategy, (ii) establish corporate goals and objectives relevant to Chief Executive Officer compensation, evaluate the Chief Executive Officer’s performance in light of those goals and objectives, and determine and approve the Chief Executive Officer’s compensation level based on this evaluation, (iii) review and approve the compensation structure for the other executive officers and review and approve the Chief Executive Officer’s recommendations with respect to executive officer compensation, (iv) oversee Chief Executive Officer and executive succession planning and development, and (v) make recommendations to the Board with respect to director compensation. In addition to the Compensation Committee members, in the past the Chief Executive Officer, the President and Chief Merchandising Officer, the Chief Financial Officer and Chief Operating Officer, the Corporate Secretary/General Counsel and the Vice President of Human Resources have attended Compensation Committee meetings, and other officers from the Company may be asked to attend from time to time as the Compensation Committee deems appropriate. Other members of the Board have also attended Compensation Committee meetings. The Compensation Committee makes reports to the full Board based on its activities and, for certain activities, such as the granting of options, the Compensation Committee will make recommendations to the full Board for approval.
General Compensation Philosophy, Objectives and Purpose
We work to attract and retain proven, talented, industry executives who we feel will help to put us in the best position for continued growth and to meet the Company’s objectives. We attempt to recruit executives with retail or other experience that we believe is transferable to our business with the expectation that they will share their knowledge to develop and manage a large and successful retail organization. We seek to provide our named executive officers with a compensation package that is competitive for a given position in our industry and geographic region. The purpose of our executive compensation program is to provide incentives for our executives to meet or exceed the Company’s expectations, and to meet specific individualized goals. We believe our compensation objectives are best pursued through a combination of base salary, annual bonus, equity compensation, and other benefits. With the exception of equity, or stock-based compensation, all compensation is paid in cash.
We believe that stock-based compensation provides a means for our executives to obtain a degree of ownership of our Company, and therefore align corporate and individual goals. The issuance of equity compensation have generally not been based on performance, but rather as a component of each officer’s initial compensation offering package (see the narrative below accompanying the Summary Compensation Table for further details), as well as for promotions, further compensation incentives, and retention. Beginning in April 2010, the Compensation Committee has incorporated performance based elements into stock option grants to our executive officers. As cash bonuses are based on both individual and company-wide performance and objectives, we offer a market-competitive base salary for the executive position so as to mitigate the volatility we may experience with regards to overall performance and objectives. It is our philosophy that bonuses are to be used to provide an added incentive to meet additional objectives which exceed ordinary expectations and not as component of salary.
61
Table of Contents
Compensation Benchmarking and the Role of Consultants
Review of External Data
In 2004 we retained the services of an outside compensation consulting firm, Compensation Resources, Inc., to assess the market ranges of total compensation for our executive positions. At the time, market ranges were assessed in determining our executives’ total compensation packages, we targeted a competitive level of the total compensation value of a comprehensive benchmark analysis. Compensation Resources, Inc. utilized fifteen benchmark surveys covering both retail and non-retail positions. Each year following this analysis, the Compensation Committee has reviewed the total compensation package of each named executive officer based upon the recommendations of the Chief Executive Officer and such outside consultants as the Compensation Committee has deemed appropriate. We determined, and continue to believe, that our compensation levels should be competitive in our market and that compensation packages should be aligned with our business goals and objectives. However, we strongly believe in engaging the best talent in critical functions, and this can entail negotiations with individual executives who have significant compensation and/or retention packages in place with other employers. In order to attract such individuals, the Compensation Committee may from time to time determine that it is in the Company’s best interest to negotiate compensation packages that deviate from the general principle of targeting a competitive compensation package, including compensating an executive for bonuses and/or other incentives that the executive may forfeit upon leaving a prior position. Similarly, the Compensation Committee may determine to provide compensation outside of the normal cycle to certain individuals to address retention issues.
In December 2006 the Compensation Committee engaged The Hay Group for the purpose of reviewing the Company’s bonus program (as described below in “Elements of Compensation”). The Hay Group was chosen at that time as they had conducted an annual survey of total compensation in the retail industry covering over 70 companies. In determining whether to recommend any changes to our bonus program, including the percentages of base salary that are used for target bonuses and the percentage breakdown of target bonuses between individual and corporate objectives, the Compensation Committee and the Hay Group considered the results of the Hay Group survey regarding what bonus program structures were common in the retail industry and considered the level of incentive that would be provided to employees by each program feature as compared to its relative cost. Neither the Hay Group nor the Compensation Committee engaged in any benchmarking in their analyses. Based upon the results of their review in December 2006, the Compensation Committee recommended to the Board, and the Board adopted, certain revisions to the Company’s bonus plan which were accepted in Fiscal 2007 and continued through Fiscal 2009. The revisions pertained to the target bonus percentage for our named executive officers who are Vice Presidents, and included a revised payout formula for exceeding or failing to achieve the Company’s target objectives by a pre-defined amount. The revisions were as follows: target EBITDA was divided into a range between a minimum target threshold and a maximum target threshold; the minimum payout percentage of previously defined target EBITDA was revised downward from 100% to 50%, and a payout percentage of 150% was established for the maximum threshold. Based upon a review of the compensation arrangements discussed below, we believe that the value and design of our executive compensation program has adequately addressed our goals and compensation philosophy.
In December 2009, the Compensation Committee considered and approved engaging an outside compensation consultant. In January 2010, the Compensation Committee retained Compensation Resources, Inc. as its outside compensation consultant, to provide advice and recommendations on the amount and form of executive and director compensation. The outside compensation consultant assisted the Compensation Committee by:
| i. | making recommendations regarding executive and director equity compensation (including amounts and forms of compensation, including performance based equity grants to the executive officers) consistent with the Company’s business needs, pay philosophy, market trends and latest legal and regulatory considerations; |
62
Table of Contents
| ii. | providing market data (including compiling the Survey Group, discussed below, and related performance data) as background to decisions regarding Chief Executive Officer and executive senior management base salary, bonus and long term incentives; and |
| iii. | advising the Compensation Committee on industry practices for effectively structuring executive equity arrangements; utilizing time-based and performance-based elements; while representing stockholders’ interests. |
In conducting its assignment, Compensation Resources, Inc. contacted the Company’s management, including the Chairman of the Board and Chief Executive Officer, as well as the General Counsel and the Vice President of Human Resources, to carry out its assignment. However, Compensation Resources reported solely to the Compensation Committee. In connection with the engagement of Compensation Resources, the Compensation Committee approved the fee schedule for compensation consulting fees and services.
Survey Group
Compensation Resources, Inc. compiled survey information in 2010 on a group of consumer product companies to assist the Compensation Committee in comparing the Company’s executive compensation program to programs maintained by those companies. The “Survey Group” comprises 14 consumer products companies that are either competitors of the Company or are specialty retailers of consumer products. In either case, we believe we compete with such companies for talented executives. The Survey Group is made up of the following companies:
Cabelas, Inc.
Coldwater Creek, Inc.
hhgregg Appliances, Inc.
Hibbett Sports, Inc.
Jo-Ann Stores, Inc.
Lululemon Athletica, Inc.
Lumber Liquidators Holdings, Inc.
Perfumania Holdings, Inc.
Petmed Express, Inc.
rue21, Inc.
The Children’s Place Retail Stores, Inc.
Ulta Salon, Cosmetics & Fragrance, Inc.
Under Armour, Inc.
Vitacost, Inc.
Elements of Total Compensation
Components of our executive compensation described below:
Base Salary
Base salary for our executives is determined based on the specific level of the executive, responsibilities of his or her position, and certain benchmarking and labor market factors. Generally, the goal is to achieve a salary that is competitive with the salary for similar positions in similar industries within our Company’s geographic region. We offer what we believe are market-competitive base salaries for executives in similar positions with similar responsibilities at comparable companies in order to mitigate the volatility we may experience with regard to overall Company performance and objectives as the result of not being able to attract or retain talented executive officers. Salaries are reviewed during the annual review process to determine whether any change is appropriate. Any increase in salary for the named executive officers is subject to Compensation Committee approval. In addition, base salaries may be adjusted, on occasion at the Compensation Committee’s discretion, to realign a particular executive’s salary with those prevailing in the market.
63
Table of Contents
Annual Bonus
It is our philosophy that bonuses are to be used to provide an added incentive to meet additional objectives which exceed ordinary expectations. For Fiscal 2006, the target bonuses were 100% of base salary for the Chief Executive Officer, 50% of base salary for the President and Chief Merchandising Officer, and 25% of base salary for the other named executive officers. Based upon the recommendation of the Hay Group, for Fiscal 2007 the target bonus for each other named executive officer was increased to 30% of his base salary. Upon the hiring of the Chief Financial Officer and Chief Operating Officer in 2007, the Compensation Committee determined that the target bonus for this position should be 50% of base salary.
The dollar target necessary for the issuance of cash bonuses to our named executive officers for Fiscal 2009, was a minimum internal EBITDA target of $66.5 million. Internal EBITDA represents net income before provision for income tax, interest income and expense, depreciation and amortization, and deferred rent expense, as well non-cash stock-compensation expense, management fees to IPC Manager II, LLC, and certain other unusual items. For Fiscal 2009, the internal EBITDA target was exceeded and provided for an increased bonus payment of up to 142% of the following target bonus percentages: 50% of base salary for the President and Chief Merchandising Officer, and Chief Financial Officer and Chief Operating Officer, and 30% of base salary for the other named executive officers. With the exception of our current and former Chief Executive Officers, whose annual bonuses are established by the Compensation Committee in a manner consistent with their employment contracts, annual bonuses are determined based on the guidelines provided in our Management Incentive Plan (“MIP”). Pursuant to his employment agreement, our current Chief Executive Officer’s target bonus is 100% of his base salary for the years following Fiscal 2009. Our current Chief Executive Officer’s bonus for Fiscal 2009 differed due to his appointment in September 2009. Executive bonuses for Fiscal 2010 will continue to be based on internal EBITDA and similar methodologies that have been employed in prior years, along with an adjustment for capital employed during the year.
In Fiscal 2009, the Compensation Committee determined that each named executive officer (apart from the current and former Chief Executive Officers), with the exception of the Vice President of Finance, earned a portion of their respective target bonus as described below. The President and Chief Merchandising Officer earned 97.6% of his target bonus resulting in a bonus payment of approximately 70.2% of his base salary; the Chief Financial Officer and Chief Operating Officer earned 96.2% of his target bonus resulting in a bonus payment of approximately 69.3% of his base salary; and the Chief Marketing Officer earned approximately 92% of his target bonus resulting in a bonus payment of approximately 39.6% of his base salary. The Vice President of Finance received a bonus payment of approximately 43% of his base salary. The current and former Chief Executive Officers earned a fixed bonus amount as provided by their respective employment agreements dated September 2009. In Fiscal 2008, the Compensation Committee determined that the former Chief Executive Officer earned 95% of his target bonus and each other named executive officers, except the Vice President and General Manager—Direct, earned 100% of their respective target bonus as described below. This resulted in a bonus payment to the Chief Executive Officer of 95% of his base salary; to each of the President, and Chief Merchandising Officer and the Chief Financial Officer and Chief Operating Officer of 50% of his base salary; and to the Vice President of Finance of 30% of his base salary. The Vice President and General Manager—Direct earned 90% of his target bonus of 30% of his base salary. In Fiscal 2007, the Compensation Committee determined that the former Chief Executive Officer earned 85% of his target bonus and each other named executive officer earned 100% of his target bonus. This resulted in a bonus payment to the Chief Executive Officer of 85% of his base salary; to each of the President and Chief Merchandising Officer and the Chief Financial Officer and Chief Operating Officer of 50% of his base salary; and to the Vice President of Finance of 30% of his base salary. The Vice President and General Manager—Direct received an aggregate bonus payment of 30% of his base salary, consisting of the guaranteed bonus provided for in his employment contract and a portion of the Company’s MIP bonus.
The MIP is a cash-based, pay-for-performance annual incentive plan which was adopted in December 2004. The MIP allows for a range of cash awards based on the participant’s base salary, level of employment, our operating results and individual objectives. Individual objectives are established by the employee’s supervisor
64
Table of Contents
and the Chief Executive Officer. The annual bonus for all participants in the MIP is based upon a combination of Company and individual objectives, subject to the Compensation Committee’s discretion to award lesser amounts to individual executives based upon performance and the recommendation of the Chief Executive Officer. Under the MIP, awards will be calculated and paid after our financial results have been reviewed, at which time the cash awards are processed and paid before March 15 of the following year. In order to maintain the tax deductibility of payments under the MIP in the year accrued, the Compensation Committee has authorized the payment of the bonus based upon unaudited financial data which is discussed by the Chairman of the Compensation Committee with the Company’s outside auditors. The Compensation Committee plans to review the plan periodically, and present any proposed changes to the Board.
The formula below provides an illustration as to how the annual bonus award pursuant to the MIP is calculated.
Annual Compensation x Participant’s Target Bonus x Corporate Multiplier = MIP Award
Annual Compensation
Annual Compensation is the participant’s compensation for the fiscal year for which the bonus is being paid.
Participant’s Target Bonus
Each position has a target bonus, which is a percentage of the individual’s base salary. The target bonus for the Chief Executive Officer was established pursuant to his employment agreement at 100% of his base salary. In 2009, these target objectives were 50% of base salary for both the President and Chief Merchandising Officer, and the Chief Financial Officer and Chief Operating Officer, and 30% of base salary for the other named executive officers. The participant’s target bonus is divided into two components: corporate objectives, which make up 75% of the participant’s target bonus, and individual objectives, which make up 25% of the participant’s target bonus.
The Corporate Objectives
The corporate performance objectives are established each year by the Compensation Committee and Board as part of the budgeting process. Each year, corporate objectives are reviewed by the Compensation Committee and approved by our Board. To date, the corporate objectives have always been financial, although the Compensation Committee may in the future designate objectives that include both financial (objective) criteria and/or subjective criteria. In Fiscal 2004 and prior years, if the target Company performance objective was not satisfied, there was no bonus payout for any eligible participant. As of Fiscal 2005, the MIP was revised so that individuals would be paid a bonus based upon the satisfaction of their individual objectives, even if the corporate objective were not satisfied.
Individual Objectives
The individual component of the bonus is customized to each individual’s position at the Company. In 2006 a named executive officer could satisfy some of his individual performance objectives even if the Company did not satisfy its performance objectives and receive a bonus payment under the MIP. Effective for Fiscal 2007, Fiscal 2008 and Fiscal 2009 the MIP was further revised, and if our Company does not achieve 95% of its Company performance objective, individual performance bonuses will not be paid.
Corporate Multiplier
In Fiscal 2006 and prior, the MIP provided that if the corporate performance objective was exceeded, there would be an increase in the bonus payment, subject to incremental increases. Beginning in Fiscal 2007 and continuing through Fiscal 2009, the bonus payments ranged from 50% to 150% of the participant’s target bonus
65
Table of Contents
based upon the achievement of certain corporate performance objectives. In addition, we also determined that for Fiscal 2007 and subsequent years, if we attain between 95% and 100% of the corporate performance objectives, but if we do not show improvement in the operating (i.e., non-sales) components of our business, there will be no payments under the MIP.
Individual Bonus Plans
On occasion, we have determined that it is desirable to adopt an individualized bonus plan for certain executives in order to entice them to leave alternate employment. We adopted such a plan for Mr. Weiss, our Vice President and General Manager—Direct, which is summarized below under “Employment Agreements” and which is also described in the narrative accompanying the Summary Compensation Table.
Long-term Incentive Compensation
We believe that granting stock options encourages our executives to focus on our Company’s future success. Our company issues grants for stock options under the Amended and Restated 2006 Stock Option Plan and the Vitamin Shoppe 2009 Equity Incentive Plan, which was adopted on September 2, 2009. Our named executive officers and certain outside directors participate in both plans. The number of stock options recipients are granted is based on their position within the Company. In the case of certain named executive officers, the number of options was a negotiated part of their individual employment packages. These grants are summarized in “Grants of Plan Based Awards.” All grants to officers require the approval of our Board.
Other
Perquisites are awarded on a case by case basis based on individual employment agreements. They are determined based on an individual basis and approved by the Compensation Committee and the Board. Compensation components classified as “Other” which are offered to the named executive officers along with all employees of Vitamin Shoppe include a 401(k) plan with a Company match, and Company-paid disability and life insurance.
For Fiscal 2009 we did not have a pension program for our employees.
We adopted a deferred compensation plan in Fiscal 2007 for senior level employees. The authorization for such plan prohibits any Company contributions on behalf of any officer (other than the voluntary election to defer the payment of a portion of such individual’s salary) without further Compensation Committee authorization. During Fiscal 2009, one named executive officer, Anthony N. Truesdale, contributed $48,336 of his annual earnings under that plan. There were no Company contributions authorized during Fiscal 2007, Fiscal 2008 or Fiscal 2009.
Compensation Recovery Policies
As of December 26, 2009, we had no outstanding recoupment arrangements with any of our named executives.
Ownership Guidelines
Share Retention Guidelines
In October 2002, our former Chief Executive Officer, Thomas A. Tolworthy, borrowed $1.5 million on a partial recourse basis from the Company to assist with the purchase of 75,750 shares of the Company’s common stock and 9,343 shares of preferred stock so that Mr. Tolworthy had an aggregate level of ownership appropriate to his position. The note accrued interest at 3.06% and of the $1.5 million borrowed the Company has recourse on $375,000. At the time the Company was organized, Mr. Tolworthy, who was the President and Chief
66
Table of Contents
Operating Officer of the Company during this time, purchased an interest in the equity of the Company. The note and accrued interest was assigned to VS Parent, Inc. (the Company’s former parent company) in June 2006. In July 2008, the Company paid a dividend to VS Parent, Inc., of approximately $562,000. This dividend was used for the redemption of 358 of VS Parent, Inc.’s preferred shares including the associated preferred dividends in arrears held by Mr. Tolworthy). During September 2009, the note along with the accrued interest was extinguished in connection with the appointment of the Company’s new Chief Executive Officer, and 75,497 common shares and 641 preferred shares of VS Parent, Inc., held by the Company’s former Chief Executive Officer were canceled. The above share amounts are stated on a pre-split basis prior to the Merger with the Company’s former parent and the completion of the IPO. To date, we have not established any guidelines that would require any of our named executive officers to own stock in our company.
Insider Trading Policy
Our insider trading policy includes certain periods subject to black-out and other limitations regarding trading of our stock.
Tax Treatment
The Company generally receives a tax deduction for payments to executives under its annual and long-term incentive plans. The Internal Revenue Code limits the income tax deduction that the Company may take for compensation paid to the Chief Executive Officer and the other named executive officers. The limit is $1 million per executive per year. However, performance-based compensation is excluded from the limitation. All compensation of named executive officers in Fiscal 2009 is fully tax deductible by the Company. The Compensation Committee intends that the annual incentive bonus, stock options, performance share awards and restricted stock unit grants will be deductible by the Company.
Compensation Risks
We believe that risks arising from our compensation policies and practices for our employees are not reasonably likely to have a material adverse effect on the Company. In addition, the Compensation Committee believes that the mix and design of the elements of executive compensation do not encourage management to assume excessive risks.
67
Table of Contents
EXECUTIVE OFFICERS
The following table sets forth the name, age and principal position of each of the Company’s executive officers:
| NAME |
AGE | POSITION | ||
| Richard L. Markee |
56 | Chief Executive Officer, Chairman of the Board, Director | ||
| Michael G. Archbold |
49 | Executive Vice President, Chief Operating Officer and Chief Financial Officer | ||
| Anthony N. Truesdale |
47 | President and Chief Merchandising Officer | ||
| Cosmo La Forgia |
55 | Vice President, Finance | ||
| Louis H. Weiss |
41 | Chief Marketing Officer | ||
| James M. Sander |
53 | Vice President, General Counsel and Corporate Secretary |
Richard L. Markee has served as a director since September 2006, and was non-executive Chairman of the Board and Director of the Board from April 2007 to September 2009. On September 8, 2009, Mr. Markee was appointed as the Company’s Chief Executive Officer and serves as Chairman of the Board and a director of the Board. Mr. Markee was appointed to the Nomination and Governance Committee in January 2007. He previously served as the President of Babies “R” Us since August 2004 and Vice Chairman of Toys “R” Us, Inc. since May 2003 through November 2007. Mr. Markee also served as interim chief executive officer of Toys “R” Us, Inc. and its subsidiaries from July 2005 to February 2006. Mr. Markee served as President of Toys “R” Us U.S. from May 2003 to August 2004. From January 2002 to May 2003, he was Executive Vice President—President—Specialty Businesses and International Operations of Toys “R” Us. Mr. Markee was an Operating Partner of Irving Place Capital Management, L.P., a private equity firm focused on making equity investments in middle-market companies from November 2008 to September 2009. From 2006 to 2008, Mr. Markee was an Operating Partner of Bear Stearns Merchant Banking, the predecessor to Irving Place Capital Management, L.P. He has also been a director of Dorel Industries since November 2008. From June 2005 through July 2006, he served on the board of directors of The Sports Authority, Inc. From October 1999 to January 2002, he served as Executive Vice President—President of Babies “R” Us and the Chairman of Kids “R” Us.
Michael G. Archbold has served as our Executive Vice President, Chief Operating Officer and Chief Financial Officer since April 2007. Mr. Archbold served as Executive Vice President / Chief Financial and Administrative Officer of Saks Fifth Avenue from 2005 to 2007. From 2002 to 2005 he served as Chief Financial Officer for AutoZone, originally as Senior Vice President, and later as Executive Vice President. Mr. Archbold currently serves as Lead Independent Director of the Borders Group board of directors. Mr. Archbold is a Certified Public Accountant, and has 20 years of financial experience in the retail industry.
Anthony N. Truesdale has served as our President and Chief Merchandising Officer since April 2006. Prior to joining us, he was Senior Vice President of Merchandising and Supply Chain Management at Petsmart, Inc., holding various positions of increasing responsibility since January 1999. Before joining Petsmart, Inc., Mr. Truesdale worked for two years at Sainsbury’s in the United Kingdom as the Senior Manager for produce and for 16 years with various operations and merchandising roles at Shaws Supermarkets in New England.
Cosmo La Forgia has served as our Vice President, Finance since September 2004. Mr. La Forgia joined us as Corporate Controller in January 2003. Prior to that time, Mr. La Forgia was Divisional Controller for The Home Depot, Inc. from June 1998 to December 2002.
Louis H. Weiss has served as our Vice President, Internet and Catalog Business since December 2006 and was promoted to Chief Marketing Officer in March 2009. Prior to December 2006, Mr. Weiss served as president for Gaiam Direct, the direct marketing unit of Gaiam Inc., in 2005 and 2006. In 2004 and 2005 he was Senior Vice President of Good Times Entertainment. In July 2005, Good Times Entertainment filed a petition under
68
Table of Contents
chapter 11 of the Bankruptcy Code and was acquired by Gaiam, Inc. later that year. In 2003 and 2004 Mr. Weiss served as a strategic consultant to various online direct marketing companies. From 2000 through 2003 Mr. Weiss was with Blue Dolphin, Inc. in various executive capacities, and was President at the time he left the company.
James M. Sander has served as our Vice President, General Counsel and Corporate Secretary since November 2008. Prior to joining the Company, Mr. Sander was Senior Vice President, General Counsel and Secretary at Sharper Image Corporation from July 2007 to July 2008. Sharper Image Corporation filed for protection under chapter 11 of the Bankruptcy Code in February 2008. From August 2005 to July 2007, Mr. Sander was in private practice with Holsworth Sander and Associates in Pittsburgh, PA. From October 1988 to August 2005, Mr. Sander was counsel for General Nutrition Companies, Inc. and its subsidiaries, serving as their Vice President, Chief Legal Officer and Corporate Secretary from February 1993 and as their Senior Vice President, Chief Legal Officer and Corporate Secretary from December 2003. Mr. Sander has his Juris Doctor Degree from the Duquesne University School of Law.
Summary Compensation Table
| Name and Principal Position |
Fiscal Year |
Salary $ | Bonus $ | Stock Awards $ |
Option Awards $ (1) |
Non-Equity Incentive Plan Comp $ |
All Other Compensation $ |
Total $ | ||||||||
| Richard L. Markee (2) |
2007 | — | — | — | — | — | — | — | ||||||||
| Chief Executive Officer |
2008 | — | — | — | — | — | — | — | ||||||||
| 2009 | 192,588 | 300,000 | 1,299,898 | 2,246,501 | — | 75 | 4,039,062 | |||||||||
| Michael G. Archbold (2) |
2007 | 320,192 | 225,000 | — | 3,875,281 | — | 263 | 4,420,736 | ||||||||
| Executive Vice President, | 2008 | 461,245 | 230,623 | — | — | — | 9,276 | 701,144 | ||||||||
| Chief Financial Officer and |
2009 | 472,516 | 321,275 | — | — | — | 18,412 | 812,203 | ||||||||
| Chief Operating Officer |
||||||||||||||||
| Anthony N. Truesdale |
2007 | 471,154 | 235,577 | — | — | — | 11,818 | 718,549 | ||||||||
| President and Chief Merchandising Officer | 2008 | 486,825 | 243,413 | — | — | — | 11,583 | 741,821 | ||||||||
| 2009 | 498,710 | 343,489 | — | — | — | 11,196 | 853,395 | |||||||||
| Cosmo La Forgia |
2007 | 267,661 | 80,160 | — | 11,715 | — | 10,315 | 369,851 | ||||||||
| VP, Finance |
2008 | 273,816 | 82,216 | — | — | — | 10,761 | 366,793 | ||||||||
| 2009 | 280,493 | 118,887 | — | — | — | 10,936 | 410,316 | |||||||||
| Louis H. Weiss |
2007 | 295,385 | 90,000 | — | — | — | 413 | 385,798 | ||||||||
| Chief Marketing Officer | 2008 | 340,385 | 91,904 | — | 324,999 | — | 11,444 | 768,732 | ||||||||
| 2009 | 377,885 | 148,573 | — | — | — | 13,688 | 540,146 | |||||||||
| Thomas A. Tolworthy * |
2007 | 506,214 | 425,000 | — | — | — | 26,335 | 957,549 | ||||||||
| Vice President Business Development | 2008 | 512,404 | 487,011 | — | — | — | 26,366 | 1,025,781 | ||||||||
| 2009 | 465,950 | 300,000 | — | — | — | 9,302 | 775,252 | |||||||||
| * | Mr. Tolworthy served in the capacity of Chief Executive Officer until September 2009. |
| (1) | The value of option awards granted to our named executive officers has been estimated pursuant to the requirements under fair value accounting. The assumptions used for estimating the fair value for those compensatory grants, are outlined in Note 4 to our financial statements, as filed in the Annual Report on Form 10-K on March 17, 2010. The weighted average fair value of our options granted during Fiscal 2009, Fiscal 2008, and Fiscal 2007 calculated pursuant to fair value requirements, was $7.70, $7.92 and $7.04, respectively, after taking into account the approximately 1.8611-for-one retroactive split. See Note 3, “Summary of Significant Accounting Policies— Stock-Based Compensation,” in the notes to our consolidated financial statements for further discussion. |
| (2) | Mr. Archbold’s Fiscal 2007 compensation represents amounts earned commencing in April 2007, his month of hire, through December 2007. Mr. Markee’s Fiscal 2009 compensation represents amounts earned commencing in September 2009, his month of hire, through December 2009. These amounts do not represent a full year’s compensation. |
69
Table of Contents
Perquisites Table
| Mr. Markee | Mr. Archbold | Mr. Truesdale | Mr. La Forgia | Mr. Weiss | Mr. Tolworthy | |||||||||||||||
| Car Allowance |
2007 | $ | — | $ | — | $ | — | $ | — | $ | — | $ | 12,000 | |||||||
| 2008 | — | — | — | — | — | 12,000 | ||||||||||||||
| 2009 | 1,950 | — | — | — | — | 1,800 | ||||||||||||||
| Life Insurance Premiums (1) |
2007 | — | 263 | 450 | 450 | 413 | 450 | |||||||||||||
| 2008 | — | 450 | 450 | 450 | 450 | 450 | ||||||||||||||
| 2009 | 75 | 450 | 450 | 450 | 450 | 450 | ||||||||||||||
| 401(k) Company Contribution |
2007 | — | — | 11,368 | 9,865 | — | 13,885 | |||||||||||||
| 2008 | — | 8,826 | 11,133 | 10,311 | 10,994 | 13,916 | ||||||||||||||
| 2009 | — | 16,012 | 10,746 | 10,486 | 13,238 | 7,052 | ||||||||||||||
| Totals |
2007 | $ | — | $ | 263 | $ | 11,818 | $ | 10,315 | $ | 413 | $ | 26,335 | |||||||
| Totals |
2008 | $ | — | $ | 9,276 | $ | 11,583 | $ | 10,761 | $ | 11,444 | $ | 26,366 | |||||||
| Totals |
2009 | $ | 2,025 | $ | 16,462 | $ | 11,196 | $ | 10,936 | $ | 13,688 | $ | 9,302 | |||||||
| (1) | The amounts shown represent premiums paid by the Company on behalf of the executive. |
Grants of Plan Based Awards
We award equity grants under the Vitamin Shoppe, Inc. 2006 Stock Option Plan, as amended, and the Vitamin Shoppe 2009 Equity Incentive Plan. The plans provide for grants of stock options and restricted common shares to certain directors, officers, consultants and employees of Vitamin Shoppe and its subsidiaries. The plans are administered by the Board. A total of 1,156,553 shares of the Company’s common stock were available for issuance under the plans as of December 26, 2009. As of December 26, 2009, options to purchase 3,868,980 shares of common stock and 90,557 restricted shares were outstanding under the plans. The stock options are generally exercisable at not less than the fair market value on the date of grant. Restricted shares are issued at not less than the fair market value on the date of the award. Generally, both options and restricted shares awarded shall become vested in four equal increments on each of the first, second, third and fourth anniversaries of the grant date. The stock options granted under the plans have a maximum term of 10 years. Vested grants are exercisable 30 days from the date of termination of employment without cause. There are no additional factors affecting ability to exercise other than the general vesting terms.
70
Table of Contents
The following table details the stock option grants to the named executive officers that were outstanding on December 26, 2009:
Grants of Stock Based Awards
| Name |
Grant Date | Number of Option Awards |
Exercise Price of Awards ($/sh) |
Fair Value of Grant ($) | |||||
| Richard L. Markee |
9/8/2009 | 372,218 | 15.11 | 6.35 | |||||
| 9/8/2009 | * | 90,557 | — | 15.11 | |||||
| Michael G. Archbold |
4/16/2007 | 372,218 | 12.79 | 7.19 | |||||
| 4/16/2007 | 93,054 | 13.43 | 7.04 | ||||||
| 4/16/2007 | 93,054 | 16.12 | 6.45 | ||||||
| Anthony N. Truesdale |
4/2/2006 | 364,077 | 6.16 | 3.68 | |||||
| 4/2/2006 | 121,358 | 10.75 | 2.87 | ||||||
| 4/2/2006 | 121,358 | 13.43 | 2.54 | ||||||
| 4/2/2006 | 121,358 | 16.12 | 2.27 | ||||||
| Cosmo La Forgia |
7/1/2003 | 34,270 | 5.37 | — | |||||
| 7/1/2003 | 11,423 | 10.75 | — | ||||||
| 7/1/2003 | 11,423 | 13.43 | — | ||||||
| 7/1/2003 | 11,423 | 16.12 | — | ||||||
| 2/25/2007 | 931 | 10.75 | 4.72 | ||||||
| 2/25/2007 | 931 | 13.43 | 4.23 | ||||||
| 2/25/2007 | 931 | 16.12 | 3.82 | ||||||
| Louis H. Weiss |
12/29/2006 | 44,666 | 7.70 | 4.52 | |||||
| 12/29/2006 | 14,889 | 10.75 | 3.92 | ||||||
| 12/29/2006 | 14,889 | 13.43 | 3.50 | ||||||
| 12/29/2006 | 14,889 | 16.12 | 3.16 | ||||||
| 1/1/2008 | 37,222 | 15.21 | 7.70 | ||||||
| 1/1/2008 | 7,444 | 16.12 | 7.46 | ||||||
| Thomas A. Tolworthy |
11/27/2002 | 380,786 | 5.37 | — | |||||
| 11/27/2002 | 126,928 | 10.75 | — | ||||||
| 11/27/2002 | 126,928 | 13.43 | — | ||||||
| 11/27/2002 | 126,928 | 16.12 | — | ||||||
| * | Restricted stock grant. |
Those grants issued prior to January 2006 were not subject to the provisions of fair value accounting for stock compensation. Consequently, they were valued using the minimum value method for equity share options for pro forma disclosure purposes only, and do not reflect the same fair value they would have had they been valued under the current fair value provisions.
71
Table of Contents
The table below outlines the vesting details for outstanding options held by named executive officers as of December 26, 2009:
Outstanding Equity Awards as of December 26, 2009
| Option Awards | Stock Awards | |||||||||||||||
| Name |
Number of Shares Underlying Unexercised Options Exercisable (#) |
Number of Shares Underlying Unexercised Options Unexercisable (#) |
Option Exercise Price ($) |
Option Expiration Date |
Number of Shares of Stock Not Yet Vested |
Market Value of Shares or Units of Stock Not Yet Vested |
Equity Incentive Awards: Number of Unearned Shares, or Other Rights That Have Not Vested |
Equity Incentive Awards: Market or Payout Value of Unearned Shares, Units, or other Rights Not Vested | ||||||||
| Richard L. Markee |
23,264 | 348,954 | 15.11 | 3/7/2017 | ||||||||||||
| 84,897 | 1,921,219 | |||||||||||||||
| Michael G. Archbold |
232,636 | 139,582 | 12.79 | 4/29/2017 | ||||||||||||
| 58,159 | 34,895 | 13.43 | 4/29/2017 | |||||||||||||
| 58,159 | 34,895 | 16.12 | 4/29/2017 | |||||||||||||
| Anthony N. Truesdale |
295,813 | 68,264 | 6.16 | 4/1/2016 | ||||||||||||
| 98,603 | 22,755 | 10.75 | 4/1/2016 | |||||||||||||
| 98,603 | 22,755 | 13.43 | 4/1/2016 | |||||||||||||
| 98,603 | 22,755 | 16.12 | 4/1/2016 | |||||||||||||
| Cosmo La Forgia |
34,270 | — | 5.37 | 7/1/2013 | ||||||||||||
| 11,423 | — | 10.75 | 7/1/2013 | |||||||||||||
| 11,423 | — | 13.43 | 7/1/2013 | |||||||||||||
| 11,423 | — | 16.12 | 7/1/2013 | |||||||||||||
| 465 | 465 | 10.75 | 2/24/2017 | |||||||||||||
| 465 | 465 | 13.43 | 2/24/2017 | |||||||||||||
| 465 | 465 | 16.12 | 2/24/2017 | |||||||||||||
| Louis H. Weiss |
27,916 | 16,750 | 7.70 | 12/29/2016 | ||||||||||||
| 9,305 | 5,583 | 10.75 | 12/29/2016 | |||||||||||||
| 9,305 | 5,583 | 13.43 | 12/29/2016 | |||||||||||||
| 9,305 | 5,583 | 16.12 | 12/29/2016 | |||||||||||||
| 9,305 | 27,916 | 15.21 | 1/1/2018 | |||||||||||||
| 1,861 | 5,583 | 16.12 | 1/1/2018 | |||||||||||||
| Thomas A. Tolworthy * |
259,318 | — | 5.37 | 11/27/2012 | ||||||||||||
| 86,438 | — | 10.75 | 11/27/2012 | |||||||||||||
| 86,438 | — | 13.43 | 11/27/2012 | |||||||||||||
| 86,438 | — | 16.12 | 11/27/2012 | |||||||||||||
| * | 242,938 options were forfeited in connection with the appointment of Mr. Markee as our Chief Executive Officer. |
Options Exercised and Stock Vested
There were no stock options exercised during Fiscal 2009 by our executives. We grant both stock option and restricted share awards to our executives. There were 5,660 restricted shares vested as of December 26, 2009.
72
Table of Contents
Pension Benefits
We currently do not have a pension program for our employees, officers or directors.
Nonqualified Deferred Compensation
During Fiscal 2007 we adopted a nonqualified deferred compensation plan for senior level employees. The authorization for such plan prohibits any Company contributions on behalf of any officer (other than the voluntary election to defer the payment of a portion of such individual’s salary) without further Compensation Committee authorization. There were no Company contributions authorized during Fiscal 2007, Fiscal 2008, or Fiscal 2009.
Employment Agreements
As of December 26, 2009, all of our named executive officers were employed with us pursuant to written employment agreements.
Richard L. Markee. Mr. Markee’s employment agreement, dated September 9, 2009, is for a term of employment ending December 31, 2011, unless earlier terminated. Pursuant to the agreement, Mr. Markee will earn a base salary of $600,000 per annum. Mr. Markee is eligible for an annual cash bonus award. For the 2009 Fiscal year, Mr. Markee will receive an annual cash bonus of $300,000, payable in calendar year 2010 at the same time annual bonuses are paid to other senior executives of the Company. For each fiscal year thereafter during the term of the employment agreement, Mr. Markee will be eligible for an annual cash bonus, based on a target opportunity of 100% of his base salary, payable at the same time annual bonuses are paid to other senior executives of the Company, based on criteria established by the Compensation Committee at least thirty days after the commencement of the calendar year. Mr. Markee is entitled to participate in any health, disability and life insurance and other employee benefit plans and programs made available by the Company to its senior management employees generally. Mr. Markee will receive a monthly automobile allowance of $1,000 for automobile expenses and reimbursement of legal fees incurred in connection with the negotiation of his employment documents up to a maximum of $10,000. Mr. Markee is entitled to five weeks of vacation time per fiscal year. If Mr. Markee is terminated “with cause” he will be entitled to any vested right of benefits payable under any retirement or pension plan or under any other employee benefit plan of the Company, and all such benefits will continue, in accordance with, and subject to, the terms and conditions of such plans, to be payable in full after such termination. If Mr. Markee is terminated “without cause” or for “good reason” he shall be entitled to his base salary from the date of the termination of his employment through the earlier to occur of (i) the last date of the term of the employment agreement and (ii) the date that is twelve months following his termination. Mr. Markee will also be entitled to the full amount of any unpaid annual cash bonus for any calendar year of the Company prior to the calendar year in which his employment is terminated and for the calendar year in which his employment is terminated, on a pro rata basis, and the Company will continue to pay its share of his health insurance costs for twelve months following his termination.
Thomas A. Tolworthy. Mr. Tolworthy’s amended employment agreement, dated September 8, 2009, provides for “at will” employment and does not have a specified term. The agreement provides for an annual base salary of $300,000. Mr. Tolworthy may be awarded a bonus in the sole discretion of the Company. The agreement provides that upon termination Mr. Tolworthy would qualify for severance under the Company’s severance policies as then in effect, provided that he will receive severance equal to at least three months of an his base salary. If Mr. Tolworthy is terminated for “cause” or resigns from employment within twelve months of the date that he entered into his amended employment agreement, certain of the equity he holds is subject to repurchase for the lesser of the amount Mr. Tolworthy paid for such equity and the fair market value of such equity on the date of repurchase. Pursuant to his employment agreement, Mr. Tolworthy is prohibited from competing with the Company or soliciting its business or employees for the three year period following the termination of his employment.
73
Table of Contents
Anthony N. Truesdale. Mr. Truesdale’s amended employment agreement, dated September 25, 2009, sets forth an initial term ending March 31, 2012 and automatic renewal for up to three successive one-year periods unless either Mr. Truesdale or the Company notifies the other of its intent not to renew the agreement. The agreement provides for an annual base salary and an annual bonus based on achievement of Company performance objectives, as well as a relocation bonus. This relocation bonus had a total value of $157,765 comprising $82,500 for relocation fees and $75,265 for an income tax gross-up. Mr. Truesdale’s agreement provides for severance payments upon termination of his employment without “cause” conditioned upon Mr. Truesdale delivering a general release in favor of the Company. The severance provisions provide that Mr. Truesdale will receive, subject to compliance with certain non-compete, non-solicitation and other obligations, an amount equal to (i) his annual base salary through the earlier of (x) twelve months after the date of termination and (y) the last day of either the initial term or the renewal term, (ii) the full amount of any unpaid bonus in respect of the immediately prior calendar year, (iii) if he has worked for the Company for at least six months during such year, a portion of bonus for the calendar year in which employment is terminated, and (iv) the other benefits provided to him under his employment agreement, until the earlier of (x) twelve months or (y) the time when he becomes eligible for such benefits offered by any subsequent employer. If Mr. Truesdale resigns his employment due to a “change of control” of the Company followed within twelve months by a material adverse change in status, the severance provisions provide that he will receive, subject to compliance with certain non-compete, non-solicitation and other obligations, an amount equal to (i) his annual base salary for twelve months after the date of termination, (ii) the full amount of any unpaid bonus in respect of the immediately prior calendar year, (iii) if he has worked for the Company for at least six months during such year, a portion of the bonus for the calendar year in which employment is terminated, and (iv) the other benefits provided to him under his employment agreement, until the earlier of (x) twelve months or (y) the time when he becomes eligible for such benefits offered by any subsequent employer. The employment agreement provides that if Mr. Truesdale’s employment is terminated due to the Company not renewing either the initial term of employment or any of the one-year extension periods, or upon the expiration of the third one-year extension of the employment term, then Mr. Truesdale will be entitled to receive the same severance he would receive if the Company had terminated him without cause. Mr. Truesdale’s employment contract also provides that in the event that his employment is terminated by the Company without cause (or due to its non-renewal of the employment term as described above), the component of his severance that is determined by reference to continued payment of his base salary will be paid as continued payment of his base salary until the date that is twelve months following Mr. Truesdale’s termination of employment.
Michael G. Archbold. Mr. Archbold’s amended employment agreement, dated September 25, 2009, sets forth a term ending April 15, 2012 and automatic renewal for up to three successive one year periods unless either Mr. Archbold or the Company notifies the other of its intent not to renew the agreement. The agreement provides for an annual base salary and an annual bonus based on achievement of Company performance objectives. Mr. Archbold’s agreement provides for severance payments upon termination of his employment without “cause” conditioned upon Mr. Archbold delivering a general release in favor of the Company. The severance provisions provide that Mr. Archbold will receive, subject to compliance with certain non-compete, non-solicitation and other obligations, an amount equal to (i) his annual base salary through the earlier of (x) twelve months after the date of termination and (y) the last day of either the initial term or the renewal term, (ii) the full amount of any unpaid bonus in respect of the immediately prior calendar year, (iii) if he has worked for the Company for at least six months during such year, a portion of bonus for the calendar year in which employment is terminated, and (iv) the other benefits provided to him under his employment agreement, until the earlier of (x) twelve months or (y) the time when he becomes eligible for such benefits offered by any subsequent employer. If Mr. Archbold resigns his employment due to a “change of control” of the Company followed within twelve months by a material adverse change in status, the severance provisions provide that he will receive, subject to compliance with certain non-compete, non-solicitation and other obligations, an amount equal to (i) his annual base salary for twelve months after the date of termination, (ii) the full amount of any unpaid bonus in respect of the immediately prior calendar year, (iii) if he has worked for the Company for at least six months during such year, a portion of the bonus for the calendar year in which employment is terminated, and (iv) the other benefits provided to him under his employment agreement, until the earlier of (x) twelve months or (y) the
74
Table of Contents
time when he becomes eligible for such benefits offered by any subsequent employer. The amended agreement provides that if the Company terminates Mr. Archbold’s employment due to its not renewing either the initial term of employment or any of the one-year extension periods, or upon the expiration of the third one-year extension of the employment term, then Mr. Archbold will be entitled to receive the same severance he would receive if the Company had terminated him without cause. Mr. Archbold’s employment contract also provides that in the event that his employment is terminated by the Company without cause (or due to its non-renewal of the employment term as described above), the component of his severance that is determined by reference to continued payment of his base salary will be paid as continued payment of his base salary until the date that is twelve months following Mr. Archbold’s termination of employment.
Cosmo La Forgia. Mr. La Forgia’s employment agreement was amended on March 6, 2008. The agreement has a term that expires on June 11, 2010 and sets forth an annual bonus based on achievement of Company and individual performance objectives. Mr. La Forgia’s agreement provides for severance payments upon termination of his employment without “cause” or his resignation due to an adverse change in status conditioned upon Mr. La Forgia delivering a general release in favor of the Company. The severance provisions provide that Mr. La Forgia will receive, subject to compliance with certain non-compete, non-solicitation and other obligations, an amount equal to (i) his annual base salary through the later of (1) twelve months after the date of termination, or through June 11, 2009, whichever is later, and (2) the expiration of the term of the agreement on June 11, 2010, (ii) the full amount of any unpaid bonus in respect of the immediately prior calendar year, (iii) if he has worked for the Company for at least six months during such year, a portion of his bonus for the calendar year in which his employment is terminated, and (iv) the other benefits provided to him under his employment agreement, until the earlier of (x) twelve months or (y) the time when he becomes eligible for such benefits offered by any subsequent employer. If Mr. La Forgia resigns his employment due to a material adverse change in status, the severance provisions provide that he will receive, subject to compliance with certain non-compete, non-solicitation and other obligations, an amount equal to (i) his annual base salary through the later of (A) twelve months after the date of termination or through June 11, 2009, whichever is later, and (B) the expiration of the term of the agreement of June 11, 2010, (ii) the full amount of any unpaid bonus in respect of the immediately prior calendar year, (iii) if he has worked for the Company for at least six months during such year, a portion of the bonus for the calendar year in which employment is terminated, and (iv) the other benefits provided to him under his employment agreement, until the earlier of (x) twelve months or (y) the time when he becomes eligible for such benefits offered by any subsequent employer.
Louis H. Weiss. Mr. Weiss’s employment agreement, dated January 15, 2007, sets forth a three year term and automatic renewal for up to three successive one year periods unless either Mr. Weiss or the Company notifies the other of intent not to renew the agreement. The agreement provides for an annual base salary, with a guaranteed increase of $50,000 after one year of employment, and an annual bonus based on achievement of Company performance objectives, as well as an additional guaranteed bonus for 2007 not subject to the terms of the standard annual performance-based plan. Mr. Weiss is also entitled to an additional bonus equal to 5% of the incremental EBIDTA related to the Company’s Direct business, the amount of which shall be reduced by the additional guaranteed bonus. In addition, Mr. Weiss was granted an additional 24,000 stock options, effective January 1, 2008. Mr. Weiss’s agreement provides for severance payments upon termination of his employment without “cause” conditioned upon Mr. Weiss delivering a general release in favor of the Company. The severance provisions provide that Mr. Weiss will receive, subject to compliance with certain non-compete, non-solicitation and other obligations, an amount equal to (i) his annual base salary through the earlier of (x) twelve months after the date of termination and (y) the last day of either the initial term or the renewal term, (ii) the full amount of any unpaid bonus in respect of the immediately prior calendar year, (iii) if he has worked for the Company for at least six months during such year, a portion of bonus for the calendar year in which employment is terminated, and (iv) the other benefits provided to him under his employment agreement, until the earlier of (x) twelve months or (y) the time when he becomes eligible for such benefits offered by any subsequent employer. If Mr. Weiss resigns his employment due to a material adverse change in status, the severance provisions provide that he will receive, subject to compliance with certain non-compete, non-solicitation and other obligations, an amount equal to (i) his annual base salary for twelve months after the date of termination,
75
Table of Contents
(ii) the full amount of any unpaid bonus in respect of the immediately prior calendar year, (iii) if he has worked for the Company for at least six months during such year, a portion of the bonus for the calendar year in which employment is terminated, and (iv) the other benefits provided to him under his employment agreement, until the earlier of (x) twelve months or (y) the time when he becomes eligible for such benefits offered by any subsequent employer.
Potential Payments Upon Termination or Change in Control
Our Chief Executive Officer, Mr. Markee’s employment agreement provides that if within the twelve-month period following a change in control there is a material adverse change in his functions, duties or responsibilities without his consent and he elects to terminate his employment, the Company is obligated to make severance payments equal to his base salary for up to a year from the date of termination, paid quarterly; to pay any unpaid bonus for the year prior to termination; and to pay a $100,000 bonus payment in the year of termination. The employment agreements for Messrs. Truesdale and Archbold, our President and Chief Merchandising Officer and our Chief Financial Officer and Chief Operating Officer respectively, provide that if within the twelve-month period following a change in control there is a material adverse change in the executive’s functions, duties or responsibilities without the consent of the executive and the executive elects to terminate his employment, we are obligated to make severance payments equal to such executive’s base salary for up to a year from the date of termination, paid weekly; to pay any unpaid bonus earned in the year prior to termination; and to pay a pro-rated portion of annual bonus in the year of termination if the executive worked for six months or longer within that year. The employment agreements of our other named executive officers provide that if there is a material adverse change in the executive’s functions, duties or responsibilities without the consent of the executive and the executive elects to terminate his employment, we are obligated to make severance payments equal to such executive’s base salary for up to a year from the date of termination, paid weekly; to pay any unpaid bonus earned in the year prior to termination; and to pay a pro-rated portion of annual bonus in the year of termination if the executive worked for six months or longer within that year. In addition to cash payments, all named executive officers are eligible for continued participation in all life, health, and disability and similar insurance plans with the same provisions as every Company employee for up to twelve months.
76
Table of Contents
The following table summarizes potential payments upon the termination of each of our named executive officers or in the event of a change in control of the Company.
| (A) | (B) | (C) | (D) | (E) | (F) | (G) | (H) | ||||||||||
| Name |
Benefit |
Before Change in Control Termination for Good reason |
After Change in Control Termination for Good reason |
Voluntary Termination |
Death | Disability | Change in Control | ||||||||||
| Richard L. Markee |
Stock Options (1) | $ | 174,942 | $ | 2,799,079 | cease vesting | $ | 3,284,444 | |||||||||
| Severance Pay (2) | $ | 610,000 | $ | 610,000 | |||||||||||||
| Plan Benefits (3) | $ | — | $ | — | |||||||||||||
| Pro-rate Bonus (4) | $ | 610,000 | $ | 610,000 | |||||||||||||
| Life Insurance coverage (5) | $ | 450 | $ | 450 | |||||||||||||
| Michael G. Archbold |
Stock Options (1) | $ | 3,203,078 | $ | 5,124,925 | cease vesting | $ | 1,270,663 | |||||||||
| Severance Pay (2) | $ | 475,000 | $ | 475,000 | |||||||||||||
| Plan Benefits (3) | $ | 8,664 | $ | 8,664 | |||||||||||||
| Pro-rate Bonus (4) | $ | 237,500 | $ | 237,500 | |||||||||||||
| Life Insurance coverage (5) | $ | 450 | $ | 450 | |||||||||||||
| Anthony N. Truesdale |
Stock Options (1) | $ | 7,591,690 | $ | 9,343,618 | cease vesting | $ | 102,042 | |||||||||
| Severance Pay (2) | $ | 510,000 | $ | 510,000 | |||||||||||||
| Plan Benefits (3) | $ | 8,664 | $ | 8,664 | |||||||||||||
| Pro-rate Bonus (4) | $ | 255,000 | $ | 255,000 | |||||||||||||
| Life Insurance coverage (5) | $ | 450 | $ | 450 | |||||||||||||
| Cosmo La Forgia |
Stock Options (1) | $ | 919,411 | $ | 932,248 | cease vesting | $ | 3,253 | |||||||||
| Severance Pay (2) | $ | 285,000 | $ | 285,000 | |||||||||||||
| Plan Benefits (3) | $ | 8,664 | $ | 8,664 | |||||||||||||
| Pro-rate Bonus (4) | $ | 85,500 | $ | 85,500 | |||||||||||||
| Life Insurance coverage (5) | $ | 450 | $ | 450 | |||||||||||||
| Louis H. Weiss |
Stock Options (1) | $ | 754,691 | $ | 1,402,262 | cease vesting | $ | 247,260 | |||||||||
| Severance Pay (2) | $ | 385,000 | $ | 385,000 | |||||||||||||
| Plan Benefits (3) | $ | 8,664 | $ | 8,664 | |||||||||||||
| Pro-rate Bonus (4) | $ | 115,500 | $ | 115,500 | |||||||||||||
| Life Insurance coverage (5) | $ | 450 | $ | 450 | |||||||||||||
| Thomas A. Tolworthy |
Stock Options (1) | $ | 6,859,908 | $ | 6,859,908 | N/A | N/A | ||||||||||
| Severance Pay (2) | $ | 310,000 | $ | 310,000 | |||||||||||||
| Plan Benefits (3) | $ | 8,664 | $ | 8,664 | |||||||||||||
| Pro-rate Bonus (4) | $ | 93,000 | $ | 93,000 | |||||||||||||
| Life Insurance coverage (5) | $ | 450 | $ | 450 | |||||||||||||
| (1) | In the event of a termination without cause or for good reason, stock options will cease to vest. The amount reflects the value of options vested as of December 26, 2009. In the event of a change of control, options would become fully vested. The amount reflects the value of all outstanding options as of December 26, 2009. |
| (2) | Reflects one year of salary, per the severance terms of each executive’s employment agreement. |
| (3) | If the named executive officer elects COBRA coverage, the Company will pay the same amount for each applicable sub-category of coverage as the Company paid for such sub-category for the named executive officer before their termination for the duration of their severance pay stated above at (2). The Company’s payment obligations include the payment of dependent coverage if the named executive officer maintained dependent coverage prior to termination. |
| (4) | Named executive officers are entitled to pro rata bonus payments, pursuant to their respective employment agreements. |
| (5) | Life insurance coverage provided to the named executive officer prior to termination will be continued at the Company’s expense for one year following the executives’s termination date. |
The foregoing table does not include amounts for any severance payments that would relate to bonuses that can not be determined at this point in time.
We are not obligated to make any cash payment or provide continued benefits to the named executive officers, other than certain vested retirement plans, if their employment is terminated by us for cause or by the executive without cause. In the event of a change of control, in addition to cash payments and insurance
77
Table of Contents
continuation, pursuant to our stock option plans, all unvested outstanding stock option grants vest immediately. Messrs. Markee, Archbold, Truesdale, La Forgia, and Weiss hold options that would vest upon any change in control, all of which are compensatory options, which would impact our statements of operations.
Employee Benefit Plans
Our employees, including our named executive officers, are entitled to various employee benefits. These benefits include medical and dental care plans, flexible spending accounts for healthcare and life and disability insurance.
78
Table of Contents
PRINCIPAL AND SELLING STOCKHOLDERS
The following table sets forth, as of April 30, 2010 information concerning the beneficial ownership of our capital stock after giving effect to our corporate reorganization and after giving effect to this offering by:
| • | each of the selling stockholders; |
| • | each holder of more than 5% of any class of voting stock; |
| • | each of our executive officers; |
| • | each of our directors; and |
| • | all of our directors and executive officers as a group. |
Beneficial ownership percentages prior to the consummation of this offering are based upon 27,047,234 shares of common stock outstanding as of April 30, 2010. Beneficial ownership percentages after the consummation of this offering are based upon 27,698,366 shares of common stock outstanding, which includes 27,047,234 shares outstanding as of April 30, 2010 plus 651,132 shares to be received upon exercise of outstanding stock options by the members of our management selling in this offering. Each of the persons set forth below has sole voting power and sole investment power with respect to the shares set forth opposite his or her name, except as otherwise noted. Except as expressly set forth below, none of the selling stockholders is known to us to be a registered broker-dealer or an affiliate of a registered broker-dealer. Unless otherwise noted, the address of each stockholder is c/o Vitamin Shoppe, Inc., 2101 91st Street, North Bergen, NJ 07047. The following table includes shares of common stock issuable within 60 days of April 30, 2010 upon the exercise of all options and other rights beneficially owned by the indicated person on that date. After giving effect to our corporate reorganization we will not have any preferred stock outstanding.
| COMMON STOCK BENEFICIALLY OWNED |
PERCENT | SHARES OF COMMON STOCK BEING OFFERED |
SHARES OF COMMON STOCK BENEFICIALLY OWNED AFTER THIS OFFERING |
PERCENT | ||||||||
| IPC/Vitamin, LLC (1) |
14,245,729 | 52.7 | % | 4,300,000 | 9,945,729 | 35.9 | % | |||||
| Adage Capital Management, L.P. (2) |
1,350,000 | 5.0 | % | — | 1,350,000 | 4.9 | % | |||||
| FdG Capital Partners LLC (3) |
116,921 | * | 106,921 | 10,000 | * | |||||||
| VSI Investments, LLC (4) |
701,529 | 2.6 | % | 701,529 | — | — | ||||||
| JPMP Capital Corp. (5) |
404,396 | 1.5 | % | 404,396 | — | — | ||||||
| All other selling stockholders as a group (6) |
72,342 | * | 72,342 | — | — | |||||||
| Executive Officers and Directors: |
||||||||||||
| Richard L. Markee |
231,232 | * | — | 231,232 | * | |||||||
| Anthony N. Truesdale |
737,374 | 2.7 | % | 125,000 | 612,374 | 2.2 | % | |||||
| Michael G. Archbold |
436,338 | 1.6 | % | — | 436,338 | 1.6 | % | |||||
| Cosmo La Forgia |
72,803 | * | — | 72,803 | * | |||||||
| James M. Sander |
20,267 | * | — | 20,267 | * | |||||||
| Thomas A. Tolworthy |
659,967 | 2.4 | % | 518,632 | 141,335 | * | ||||||
| Louis H. Weiss |
91,500 | * | 7,500 | 84,000 | * | |||||||
| B. Michael Becker |
13,958 | * | — | 13,958 | * | |||||||
| Catherine E. Buggeln |
— | — | — | — | — | |||||||
| John H. Edmondson |
28,499 | * | — | 28,499 | * | |||||||
| David H. Edwab |
28,790 | * | — | 28,790 | * | |||||||
| John D. Howard (1) |
14,245,729 | 52.7 | % | 4,300,000 | 9,945,729 | 35.9 | % | |||||
| Douglas R. Korn (7) |
— | — | — | — | — | |||||||
| Richard L. Perkal (8) |
— | — | — | — | — | |||||||
| Beth M. Pritchard |
13,958 | * | — | 13,958 | * | |||||||
| Katherine Savitt-Lennon |
— | — | — | — | — | |||||||
| All named directors and executive officers as a group (16 persons) |
16,580,415 | 59.4 | % | 4,951,132 | 11,629,283 | 39.7 | % |
| * | Represents less than 1%. |
79
Table of Contents
| (1) | Mr. Howard, by virtue of his status as the sole member of JDH Management, LLC, may be deemed to share beneficial ownership of shares owned by IPC/Vitamin, LLC. Mr. Howard and IPC Manager II, LLC share investment and voting power with respect to such shares. Mr. Howard is employed by Irving Place Capital Management, L.P., a private equity firm. His business address is 277 Park Avenue, New York, New York 10172. |
| (2) | Based solely on a Schedule 13G filed with the SEC by Adage Capital Management, L.P., Adage has sole voting and dispositive power with respect to all shares. Adage’s address is 200 Clarendon Street, 52nd floor, Boston, Massachusetts 02116. |
| (3) | The Managing Member of FdG Capital Partners LLC (“FdG Capital”) is FdG Capital Associates LLC (“FdG Associates”). Each of FdG Capital and FdG Associates is a Delaware limited liability company. FdG Associates is managed by a board of managers, comprised of Charles de Gunzburg, Martin Edelman and David Gellman, which has full voting power over our shares. The FdG Associates investment committee, comprised of Charles de Gunzburg and David Gellman, has full investment discretion over our shares. No single member of the board of managers or investment committee has voting or dispositive authority over these shares. Consequently, each member disclaims beneficial ownership of such securities except to the extent of his pecuniary interest therein. |
| (4) | VSI Investments, LLC is managed by Charles de Gunzburg and Martin Edelman as managers. Decisions required to be made by the managers, including disposition of the shares, must be made unanimously. Neither Charles de Gunzburg nor Martin Edelman individually has voting or dispositive authority over these shares. Consequently, each of Messrs. De Gunzburg and Edelman disclaims beneficial ownership of such securities except to the extent of his pecuniary interest therein. |
| (5) | JPMP Capital Corp., a wholly-owned subsidiary of JPMorgan Chase & Co., a publicly traded company, is the general partner of JPMP Master Fund Manager, L.P. JPMP Master Fund Manager L.P. is the general partner of J.P. Morgan Partners (BHCA), L.P. Prior to the offering, J.P. Morgan Partners (BHCA), L.P. was the owner of 233,686 shares of our common stock. JPMP Capital Corp is also the general partner of JPMP Global Investors, L.P. JPMP Global Investors, L.P. is the general partner of each of J.P. Morgan Partners Global Investors, L.P., J.P. Morgan Partners Global Investors A, L.P., J.P. Morgan Partners Global Investors (Cayman), L.P., J.P. Morgan Partners Global Investors (Cayman) II, L.P., J.P. Morgan Partners Global Investors (Selldown), L.P., and J.P. Morgan Partners Global Investors (Selldown) II, L.P. Prior to the offering, these entities owned 50,470 shares, 6,900 shares, 10,805 shares, 17,705 shares, 18,978 shares and 65,852 shares of the Company’s common stock, respectively. Voting and disposition decisions at JPMP Capital Corp. are made by three or more of its officers, and therefore no individual officer of JPMP Capital Corp. is the beneficial owner of the securities. The address for each of the entities described above is 270 Park Avenue, New York, New York 10017, except that the address of each Cayman entity described above is c/o Walkers SPV Limited, PO Box 908 GT, Walker House, George Town, Grand Cayman, Cayman Islands. |
| (6) | Includes all other selling stockholders, who in the aggregate beneficially own less than 1% of our common stock. |
| (7) | Mr. Korn is employed by Irving Place Capital Management, L.P., a private equity firm. His business address is 277 Park Avenue, New York, New York 10172. |
| (8) | Mr. Perkal is employed by Irving Place Capital Management, L.P., a private equity firm. His business address is 277 Park Avenue, New York, New York 10172. |
80
Table of Contents
CERTAIN RELATIONSHIPS AND RELATED PARTY TRANSACTIONS
Our Board has not adopted a written policy or procedure for the review, approval and ratification of related party transactions, however the Audit Committee Charter requires the Audit Committee to review all relationships and transactions in which the Company and its employees, directors and officers or their immediate family members are participants to determine whether such persons have a direct or indirect material interest. Based on all the relevant facts and circumstances, the Audit Committee will decide whether the related-party transaction is appropriate and will approve only those transactions that are in the best interests of the Company.
We require our directors and executive officers to complete annually a directors’ and officers’ questionnaire which requires disclosure of any related-party transactions. As required under SEC rules, transactions that are determined to be directly or indirectly material to the Company or a related person are disclosed in our periodic filings, as appropriate.
Securityholders Agreement
In connection with the Merger, the Company entered into a securityholders agreement substantially similar to the Amended and Restated Securityholders Agreement. The securityholders agreement, among other things:
| • | Limits the ability of securityholders to transfer their capital stock (or derivatives thereof) of the Company, except, with the consent of Irving Place Capital or a transfer of securities, (i) subject to certain co-sale rights, (ii) with respect to securityholders who are natural persons, to such securityholder’s family members, (iii) to certain affiliates, (iv) in the event of a sale of the Company, and (iv) pursuant to a public sale. |
| • | Provides for take-along rights, such that if Irving Place Capital elects to consummate, or to cause the Company to consummate, a transaction constituting a sale of the Company, then Irving Place Capital will notify the Company and the other securityholders in writing of their election at least 30 days prior to the consummation of such transaction. If Irving Place Capital delivers such notice, the other securityholders must vote for, consent to, and raise no objections to the proposed transaction, and the securityholders and the Company will take all other actions necessary to cause the consummation of the sale on the terms proposed by Irving Place Capital. The securityholders are entitled to receive the same form and amount of consideration per share of common stock as Irving Place Capital in the proposed transaction. |
| • | Provides for co-sale rights, which require that at least 30 days prior to any sales by Irving Place Capital or its affiliates of capital stock (or derivatives thereof) of the Company, such entity deliver a written notice to the Company and each other securityholder of the Company. Securityholders may elect to participate in the contemplated transfer at the same price per share and on the same terms, provided that securityholders seeking to elect to participate must participate in the same relative proportion. |
| • | Provides for certain rights of first-offer with respect to transfers by security holders other than to certain permitted transferees. If the Company elects not to purchase such securities within ten days after delivery of the written notice of the offer, Irving Place Capital may elect to purchase all of the securities which the Company has not elected to purchase within 25 days after delivery of the written notice. |
The securityholders agreement also provides that the parties thereto must vote their securities to elect a Board of the Company which must be comprised of:
| • | persons designated by the securityholders who are affiliates of Irving Place Capital (the “IPC Directors”); and |
| • | persons possessing relevant industry experience or operational expertise as designated by the securityholders who are affiliates of Irving Place Capital. |
81
Table of Contents
In addition, the securityholders agreement provides that IPC Directors shall comprise a majority of the directors on the board of directors of any of the subsidiaries of the Company and of any committee of the Board of the Company or any of its subsidiaries.
The securityholders agreement also gives certain securityholders rights with respect to registration under the Securities Act of shares of the Company’s securities held by them, including demand registration rights and piggy-back registration rights.
In connection with this offering, we expect to amend the securityholders agreement in order to permit members of our management to sell in this offering shares of common stock they will receive upon the exercise of outstanding stock options.
Advisory Services Agreement
The Company and IPC Manager II, LLC (formerly Bear Stearns Merchant Manager II, LLC), an affiliate of Irving Place Capital, were parties to an advisory services agreement, pursuant to which general advisory and management services were provided to us with respect to financial and operating matters. The agreement terminated in connection with our initial public offering. Pursuant to the agreement, a one-time termination fee of approximately $0.8 million was paid during the fourth fiscal quarter of 2009 in connection with the IPO. Amounts paid for Fiscal 2009, Fiscal 2008 and Fiscal 2007 were approximately $2.4 million, $1.5 million, and $1.4 million, respectively.
Transaction with Management
We held a promissory note made by Thomas A. Tolworthy on November 27, 2002, in the aggregate principal amount of $1,500,000 issued in connection with Mr. Tolworthy’s purchase of our common and preferred stock. On June 12, 2006, this note was assigned as a dividend to VS Parent, Inc., and was no longer held by or payable to us. In July 2008, the Company redeemed preferred shares held by Mr. Tolwrothy, for a value of approximately $562,000. The dollar value represented the redemption of 358 of Vitamin Shoppe, Inc.’s preferred shares including the associated preferred dividends in arrears held by Mr. Tolworthy. On September 8, 2009, Mr. Tolworthy sold shares of VS Parent, Inc. common stock to VS Parent, Inc. at his original cost of $754,970 ($10 per share) and the proceeds from the repurchase were used to reduce Mr. Tolworthy’s promissory note. Mr. Tolworthy surrendered 634 shares of Series A Preferred Stock to VS Parent, Inc. in satisfaction of the remaining balance on the promissory note.
2009 Corporate Reorganization
On October 27, 2009, the Merger was consummated, in which VS Parent, Inc. merged into VS Holdings, Inc., with VS Holdings being renamed, as Vitamin Shoppe, Inc. All common shares and warrants previously issued by VS Parent, Inc., were converted to common shares of Vitamin Shoppe, Inc., at approximately a 1.8611-for-one split, resulting in 14,085,349 common shares and 1,055,540 warrants issued and outstanding at October 27, 2009. In addition 78,868 preferred shares were converted to preferred shares of Vitamin Shoppe, Inc. Also in connection with the Merger, a note receivable of $1.5 million from the Company’s former chief executive officer, which was accounted for as a separate component of VS Parent, Inc.’s stockholders’ equity, along with accrued interest of $0.3 million, was extinguished. As consideration for extinguishment of the note and accrued interest, 140,507 common shares (after taking into effect the stock split) and 634 preferred shares of VS Parent, Inc., which were held by the Company’s former chief executive officer to whom the note was extended, were surrendered. The common shares were surrendered at their acquisition cost and the preferred shares were surrendered in satisfaction of the remaining balance on the note.
82
Table of Contents
The provisions of our amended and restated certificate of incorporation and bylaws and relevant sections of the Delaware General Corporation Law, which we refer to as the “DGCL” are summarized below. The following summary is qualified in its entirety by the provisions of our amended and restated certificate of incorporation and bylaws, which are filed as exhibits to the registration statement of which this prospectus is a part, and to the applicable provisions of the DGCL.
Authorized Capital Stock
Our authorized capital stock consists of 400,000,000 shares of common stock, par value $0.01 per share and 250,000,000 shares of preferred stock, par value $0.01 per share.
Common Stock
Holders of our common stock are entitled to one vote per share on all matters submitted to a vote of stockholders. Upon the liquidation, dissolution or winding up of our company, the holders of our common stock are entitled to receive their ratable share of the net assets of our company available after payment of all debts and other liabilities, subject to the prior rights of any outstanding preferred stock. Holders of common stock have no preemptive, subscription or redemption rights. The outstanding shares of common stock are fully paid and non-assessable.
Preferred Stock
The Board has the authority, without any further vote or action by the stockholders, to issue preferred stock in one or more series and to fix the preferences, limitations and rights of the shares of each series, including:
| • | dividend rates; |
| • | conversion rights; |
| • | voting rights; |
| • | terms of redemption and liquidation preferences; and |
| • | the number of shares constituting each series. |
The authority possessed by our Board to issue preferred stock could potentially be used to discourage attempts by third parties to obtain control of our company through a merger, tender offer, proxy contest or otherwise by making such attempts more difficult or more costly. Our Board may issue preferred stock with voting rights or conversion rights that, if exercised, could adversely affect the voting power of the holders of common stock. There are no current agreements or understandings with respect to the issuance of preferred stock and our Board has no present intention to issue any shares of preferred stock.
Antitakeover Effects of Provisions of the Certificate of Incorporation and Bylaws
Stockholders’ rights and related matters are governed by the DGCL, our certificate of incorporation and our bylaws. Provisions of the DGCL, our certificate of incorporation, and our bylaws, which are summarized below, may discourage or make more difficult a takeover attempt that a stockholder might consider in its best interest. These provisions may also adversely affect prevailing market prices for our common stock.
Board Of Directors
The Board has the authority to fill any vacancy on the Board, whether such vacancy occurs as a result of an increase in the number of directors or otherwise.
83
Table of Contents
Stockholder Action By Written Consent; Special Meetings
Our certificate of incorporation permits stockholders to take action by written consent in lieu of an annual or special meeting except that if IPC owns shares entitled to cast at least a majority of the votes entitled to be cast in the election of directors, action may be taken by written consent.
Our bylaws provide that special meetings of stockholders may only be called by:
| • | the chairman of the Board; |
| • | the chief executive officer; |
| • | the president; |
| • | the secretary; |
| • | IPC, until IPC no longer owns shares entitled to 33 1 /3% or more of the votes entitled to be cast by holders of then outstanding common stock (which is expected to be the case subsequent to the completion of this offering); and |
| • | written request of the Board or of a committee of the Board whose powers include the power to call such meetings. |
Antitakeover Legislation
As a Delaware corporation, by an express provision in our certificate of incorporation, we have elected to “opt out” of the restrictions under Section 203 of the DGCL regulating corporate takeovers. In general, Section 203 prohibits a publicly-held Delaware corporation from engaging, under certain circumstances, in a business combination with an interested stockholder for a period of three years following the date the person became an interested stockholder, unless:
| • | Prior to the date of the transaction, the board of directors of the corporation approved either the business combination or the transaction which resulted in the stockholder becoming an interested stockholder; |
| • | Upon completion of the transaction that resulted in the stockholder becoming an interested stockholder, the interested stockholder owned at least 85% of the voting stock of the corporation outstanding at the time such transaction commenced, excluding, for purposes of determining the number of shares outstanding, (1) shares owned by persons who are directors and also officers of the corporation and (2) shares owned by employee stock plans in which employee participants do not have the right to determine confidentially whether shares held subject to the plan will be tendered in a tender or exchange offer; or |
| • | On or subsequent to the date of the transaction, the business combination is approved by the board of directors of the corporation and authorized at an annual or special meeting of stockholders by the affirmative vote of at least 66 2/3% of the outstanding voting stock which is not owned by the interested stockholder. |
In this context, a business combination includes a merger, asset or stock sale, or other transaction resulting in a financial benefit to the interested stockholder. An interested stockholder is a person who, together with affiliates and associates, owns or, within three years prior to the determination of interested stockholder status owned, 15% or more of a corporation’s outstanding voting securities.
A Delaware corporation may “opt out” of Section 203 with an express provision in its original certificate of incorporation or an express provision in its certificate of incorporation or by-laws resulting from amendments approved by holders of at least a majority of the corporation’s outstanding voting shares. We elected to “opt out” of Section 203 by an express provision in our certificate of incorporation.
84
Table of Contents
Certificate of Incorporation Provisions Relating to Corporate Opportunities and Interested Directors
In order to address potential conflicts of interest between us and IPC, our certificate of incorporation contains provisions regulating and defining the conduct of our affairs as they may involve IPC and its officers, directors or employees, and our powers, rights, duties and liabilities and those of our officers, directors and stockholders in connection with our relationship with IPC. In general, these provisions recognize that we and IPC may engage in the same or similar business activities and lines of business, have an interest in the same areas of corporate opportunities and that we and IPC will continue to have contractual and business relations with each other, including service of officers and directors of IPC serving as our directors.
Our certificate of incorporation provides that, subject to any contractual provision to the contrary, IPC will have no duty to refrain from:
| • | engaging in the same or similar business activities or lines of business as us; |
| • | any decision or action by IPC to assert or enforce its rights under any agreement or contract with us; |
| • | doing business with any of our clients or customers; or |
| • | employing or otherwise engaging any of our officers or employees. |
Under our certificate of incorporation, neither IPC nor any officer, director or employee of IPC, except as described in the following paragraph, will be liable to us or our stockholders for breach of any fiduciary duty by reason of any such activities. Our certificate of incorporation provides that IPC is not under any duty to present any corporate opportunity to us which may be a corporate opportunity for IPC and us and IPC will not be liable to us or our stockholders for breach of any fiduciary duty as our stockholder by reason of the fact that IPC pursues or acquires that corporate opportunity for itself, directs that corporate opportunity to another person or does not present that corporate opportunity to us.
When one of our directors or officers who is also a director, officer or employee of IPC learns of a potential transaction or matter that may be a corporate opportunity for both us and IPC, our certificate of incorporation provides that the director or officer:
| • | will have fully satisfied his or her fiduciary duties to us and our stockholders with respect to that corporate opportunity; |
| • | will not be liable to us or our stockholders for breach of fiduciary duty by reason of IPC’s actions with respect to that corporate opportunity; |
| • | will be deemed to have acted in good faith and in a manner he or she believed to be in, and not opposed to, our best interests for purposes of our certificate of incorporation; and |
| • | will be deemed not to have breached his or her duty of loyalty to us or our stockholders and not to have derived an improper personal benefit therefrom for purposes of our certificate of incorporation, |
if he or she acts in good faith in a manner consistent with the following policy:
| • | a corporate opportunity offered to any of our officers or directors who is also a director, officer, or employee of IPC will belong to us, only if that opportunity is expressly offered in writing to that person solely in his or her capacity as our director or officer, and not separately offered to IPC or any of its officers, directors or employees; and |
| • | otherwise such opportunity shall belong to IPC. |
For purposes of our certificate of incorporation, “corporate opportunities” include business opportunities that we are financially able to undertake, that are, from their nature, in our line of business, are of practical advantage to us and are ones in which we have an interest or a reasonable expectancy, and in which, by embracing the opportunities, the self-interest of IPC or its officers or directors will be brought into conflict with our self-interest.
85
Table of Contents
Our certificate of incorporation also provides that no contract, agreement, arrangement or transaction between us and IPC or any entity affiliated with IPC will be void or voidable solely for the reason that IPC is a party to such agreement or by reason of the execution of any contract or agreement by an officer, director or employee of IPC who is also an officer or director of ours; and each such officer, director and employee:
| • | will have fully satisfied and fulfilled its fiduciary duties to us and our stockholders with respect to the contract, agreement, arrangement or transaction; |
| • | will not be liable to us or our stockholders for breach of fiduciary duty by reason of entering into, performance or consummation of any such contract, agreement, arrangement or transaction; |
| • | will be deemed to have acted in good faith and in a manner it reasonably believed to be in, and not opposed to, the best interests of us for purposes of our certificate of incorporation; and |
| • | will be deemed not to have breached its duties of loyalty to us and our stockholders and not to have derived an improper personal benefit therefrom for purposes of our certificate of incorporation; |
if:
| • | the material facts as to the contract, agreement, arrangement or transaction are disclosed or are known to our Board or the committee of our Board that authorizes the contract, agreement, arrangement or transaction and our Board or that committee in good faith authorizes the contract, agreement, arrangement or transaction by the affirmative vote of a majority of the disinterested directors; |
| • | the material facts as to the contract, agreement, arrangement or transaction are disclosed or are known to one or more of our officers or employees who are not “interested” and who were authorized to approve such transaction and the contract, agreement, arrangement or transaction is specifically approved in good faith by one or more of our officers or employees who are not “interested” and who were authorized to approve such transaction; or |
| • | the transaction, judged according to the circumstances at the time of the commitment, was fair to us; or |
| • | the transaction or agreement was approved by an affirmative vote of a majority of the shares of common stock entitled to vote, excluding IPC or any interested person. |
Any person purchasing or otherwise acquiring any interest in any shares of our capital stock will be deemed to have consented to these provisions of our certificate of incorporation.
Provisions Relating to Control by IPC
Our certificate of incorporation provides that when IPC ceases to beneficially own shares entitled to 33 1/3% or more of the votes entitled to be cast by then outstanding common stock (which we expect to be the case subsequent to the completion of this offering), the prior consent of IPC will no longer be required for:
| • | any consolidation or merger of us or any of our subsidiaries with any person, other than a subsidiary; |
| • | any sale, lease, exchange or other disposition or any acquisition by us, other than transactions between us and our subsidiaries, or any series of related dispositions or acquisitions, except for those for which we give IPC at least 15 days prior written notice and which involve consideration not in excess of $10 million in fair market value, and except (1) any disposition of cash equivalents or investment grade securities or obsolete or worn out equipment and (2) the lease, assignment or sublease of any real or personal property, in each case, in the ordinary course of business; |
| • | any change in our authorized capital stock or our creation of any class or series of capital stock; |
| • | the amendment or adoption of any incentive plan for us or any of our subsidiaries; |
| • | the amendment of various provisions of our certificate of incorporation and bylaws; |
86
Table of Contents
| • | the declaration of dividends on any class of our capital stock; |
| • | the issuance of any series of preferred stock; and |
| • | any change in the number of directors on our Board , the establishment of any committee of the Board, the determination of the members of the Board or any committee of the Board, and the filling of newly created memberships and vacancies on the Board or any committee of the Board. |
Until the time that IPC ceases to be entitled to 33 1/3% or more of the votes entitled to be cast, the affirmative vote of the holders of at least 66 2/3% of the votes entitled to be cast is required to alter, amend or repeal, or adopt any provision inconsistent with the control provisions described above; however, after IPC no longer owns shares for its own account entitling it to cast at least 33 1 /3% of the votes entitled to be cast by the holders of the then outstanding common stock, any such alteration, adoption, amendment or repeal would be approved if a quorum is present and the votes favoring the action exceed the votes opposing it. Accordingly, until such time, so long as IPC controls at least 33 1 /3% of the votes entitled to be cast, it can prevent any such alteration, adoption, amendment or repeal.
References to “IPC” in the this “Description of Capital Stock” includes Irving Place Capital Management, L.P., and its affiliates, and certain funds with an economic interest in our common stock.
Limitation of Liability of Directors
Our certificate of incorporation provides that none of our directors shall be liable to us or our stockholders for monetary damages for any breach of fiduciary duty as a director, except to the extent otherwise required by the DGCL. The effect of this provision is to eliminate our rights, and our stockholders’ rights, to recover monetary damages against a director for breach of a fiduciary duty of care as a director. This provision does not limit or eliminate our right, or the right of any stockholder, to seek non-monetary relief, such as an injunction or rescission in the event of a breach of a director’s duty of care. In addition, our certificate of incorporation provides that if the DGCL is amended to authorize the further elimination or limitation of the liability of a director, then the liability of the directors shall be eliminated or limited to the fullest extent permitted by the DGCL, as so amended. These provisions will not alter the liability of directors under federal or state securities laws. Our certificate of incorporation and by-laws also includes provisions for the indemnification of our directors and officers to the fullest extent permitted by Section 145 of the DGCL. Further, we intend to enter into indemnification agreements with certain of our directors and officers which require us, among other things, to indemnify them against certain liabilities which may arise by reason of the directors’ status or service as a director, so long as the indemnitee acted in good faith. We also intend to maintain director and officer liability insurance, if available on reasonable terms.
Listing
Our common stock is listed on the NYSE under the symbol “VSI.”
Transfer Agent and Registrar
The transfer agent and registrar for our common stock is BNY Mellon Shareowner Services.
87
Table of Contents
SHARES ELIGIBLE FOR FUTURE SALE
Future sales of substantial amounts of our common stock in the public market, or the possibility of these sales, could adversely affect the trading price of our common stock and could impair our future ability to raise capital through the sale of our equity at a time and price we deem appropriate.
Upon consummation of this offering, we will have 27,698,366 outstanding shares of our common stock, of which 17,102,789 shares will be freely tradable without restriction or further registration under the Securities Act, except for any common stock held by our “affiliates,” as defined in Rule 144 under the Securities Act, which would be subject to the limitations and restrictions described below.
Lock-Up Agreements
We, the selling stockholders, IPC/Vitamin LLC and each of our directors and executive officers and other stockholders have agreed with the underwriters, subject to certain exceptions described below, not to (i) offer, pledge, announce the intention to sell, sell, contract to sell, sell any option or contract to purchase, purchase any option or contract to sell, grant any option, right or warrant to purchase, or otherwise transfer or dispose of, directly or indirectly, any shares of our common stock or any securities convertible into or exercisable or exchangeable for shares of our common stock, (ii) enter into any swap or other arrangement that transfers, in whole or in part, any of the economic consequences of ownership of our common stock or such other securities, whether any such transaction described in clauses (i) or (ii) above is to be settled by delivery of common stock or such other securities, in cash or otherwise or (iii) make any demand for or exercise any right with respect to the registration of any shares of our common stock or any security convertible or exchangeable for our common stock, during the period from the date of this prospectus continuing through the 90 days after the date of this prospectus, except with the prior written consent of J.P. Morgan Securities Inc., Merrill Lynch, Pierce, Fenner & Smith Incorporated and Barclays Capital Inc., on behalf of the underwriters. The underwriters may waive these restrictions in their discretion. Currently, the underwriters have no intention to release the aforementioned holders of our common stock from the lock-up restrictions described above.
The 90-day restricted period described in the preceding paragraph will be automatically extended if (i) during the last 17 days of the 90-day restricted period we issue an earnings release or announce material news or a material event relating to us occurs or (ii) prior to the expiration of the 90-day restricted period, we announce that we will release earnings results during the 16-day period beginning on the last day of the 90-day restricted period, in which case the restrictions described in the preceding paragraph will continue to apply until the expiration of the 18-day period beginning on the issuance of the earnings release or the announcement of the material news or material event.
Our lock-up agreement will provide exceptions for, among other things:
| • | the securities to be sold in connection with this offering; |
| • | transfers by our directors, executive officers and other stockholders as bona fide gifts as long as the recipient agrees to be bound by the terms of the lock-up provisions; and |
| • | distributions of shares of common stock to members or stockholders of our stockholders as long as the recipient agrees to be bound by the terms of the lock-up provisions. |
Rule 144
The SEC adopted amendments to Rule 144 which became effective on February 15, 2008. Under these amendments, persons who became the beneficial owner of shares of our common stock prior to the completion of this offering may not sell their shares until the earlier of (i) the expiration of a six-month holding period, if we have been subject to the reporting requirements of the Exchange Act and have filed all required reports for at least 90 days prior to the date of the sale, or (ii) a one-year holding period.
88
Table of Contents
At the expiration of the six-month holding period, a person who was not one of our affiliates at any time during the three months preceding a sale is entitled to sell an unlimited number of shares of our common stock provided current public information about us is available, and a person who was one of our affiliates at any time during the three months preceding a sale is entitled to sell within any three-month period only a number of shares of common stock that does not exceed the greater of either of the following:
| • | 1% of the number of shares of our common stock then outstanding, which equals approximately 27 million shares immediately after this offering; or |
| • | the average weekly trading volume of our common stock on the NYSE during the four calendar weeks preceding the filing of a notice on Form 144 with respect to the sale. |
At the expiration of the one-year holding period, a person who was not one of our affiliates at any time during the three months preceding a sale would be entitled to sell an unlimited number of shares of our common stock without restriction. A person who was one of our affiliates at any time during the three months preceding a sale would remain subject to the volume restrictions described above.
Sales under Rule 144 by our affiliates are also subject to manner of sale provisions and notice requirements and to the availability of current public information about us.
Rule 701
Rule 701, as currently in effect, permits resales of shares in reliance upon Rule 144 but without compliance with certain restrictions, including the holding period requirement, of Rule 144. Any of our employees, officers, directors or consultants who purchased shares under a written compensatory plan or contract may be entitled to rely on the resale provisions of Rule 701. Rule 701 permits affiliates to sell their Rule 701 shares under Rule 144 without complying with the holding period requirements of Rule 144. Rule 701 further provides that non-affiliates may sell their shares in reliance on Rule 144 without having to comply with the holding period, public information, volume limitation or notice provisions of Rule 144. All holders of Rule 701 shares are required to wait until 90 days after the date of this prospectus before selling their shares.
Stock Options
As of April 30, 2010, options to purchase a total of 3,789,935 shares of our common stock were outstanding and 938,779 shares of our common stock were reserved for future issuance under the 2006 and 2009 Plans, and 200,000 shares reserved for issuance under our ESPP.
Registration Rights
Beginning 90 days after the date of this offering, holders of approximately 10.3 million shares of our common stock will be able to require us to conduct a registered public offering of their shares. In addition, holders of approximately 10.6 million shares of our common stock will be entitled to have their shares included for sale in subsequent registered offerings of our common stock. See “Certain Relationships and Related Party Transactions—Securityholders Agreement.” Registration of such shares under the Securities Act would, except for shares purchased by affiliates, result in such shares becoming freely tradable without restriction under the Securities Act immediately upon the effectiveness of such registration.
89
Table of Contents
MATERIAL U.S. FEDERAL INCOME TAX CONSIDERATIONS
The following is a summary of material U.S. federal income tax consequences of the purchase, ownership and disposition of our common stock to a non-U.S. holder. For purposes of this summary, a “non-U.S. holder” means a beneficial owner of our common stock that is, for U.S. federal income tax purposes:
| • | a nonresident alien individual; |
| • | a foreign corporation; or |
| • | a foreign estate or foreign trust. |
In the case of a holder that is classified as a partnership for U.S. federal income tax purposes that holds our common stock, the tax treatment of a partner in such partnership generally will depend upon the status of the partner and the activities of the partnership. If you are a partner of a partnership holding our common stock, then you should consult your own tax advisors.
This summary is based upon the provisions of the Code, the Treasury regulations promulgated thereunder and administrative and judicial interpretations thereof, all as of the date hereof. Those authorities may be changed, perhaps retroactively, so as to result in U.S. federal income tax consequences different from those summarized below. We cannot assure you that a change in law will not alter significantly the tax considerations that we describe in this summary.
This summary does not address all aspects of U.S. federal income taxes that may be relevant to non-U.S. holders in light of their personal circumstances, and does not deal with federal taxes other than the federal income tax or with foreign, state, local or other tax considerations. Special rules, not discussed here, may apply to certain non-U.S. holders, including:
| • | U.S. expatriates; |
| • | controlled foreign corporations; |
| • | passive foreign investment companies; and |
| • | corporations that accumulate earnings to avoid U.S. federal income tax. |
Such non-U.S. holders should consult their own tax advisors to determine the U.S. federal, state, local and other tax consequences that may be relevant to them.
This summary applies only to a non-U.S. holder that holds our common stock as a capital asset (within the meaning of Section 1221 of the Internal Revenue Code), and assumes that no item of income or gain in respect of the common stock at any time will be effectively connected with a U.S. trade or business conducted by the non-U.S. holder.
If you are considering the purchase of our common stock, you should consult your own tax advisors concerning the particular U.S. federal income tax consequences to you of the ownership of common stock, as well as the consequences to you arising under U.S. tax laws other than the federal income tax law or under the laws of any other taxing jurisdiction.
Dividends
Dividends paid to you (to the extent paid out of our current or accumulated earnings and profits, as determined for U.S. federal income tax purposes) generally will be subject to withholding of U.S. federal income tax at a 30% rate or such lower rate as may be specified by an applicable income tax treaty.
If you wish to claim the benefit of an applicable treaty rate and to avoid backup withholding tax, as discussed below, for dividends, then you must (a) provide the withholding agent with a properly completed
90
Table of Contents
Internal Revenue Service Form W-8BEN (or other applicable form), and certify under penalties of perjury that you are not a U.S. person, as defined in the Code, and are eligible for treaty benefits or (b) if our common stock is held through certain foreign intermediaries, satisfy the relevant certification requirements of applicable U.S. Treasury regulations. Special certification and other requirements apply to certain non-U.S. holders other than corporations or individuals.
If you are eligible for a reduced rate of U.S. withholding tax pursuant to an income tax treaty, then you may obtain a refund of any excess amounts withheld by filing timely an appropriate claim for refund with the Internal Revenue Service.
Gain on Disposition of Common Stock
You generally will not be subject to U.S. federal income tax with respect to gain realized on the sale or other taxable disposition of our common stock, unless:
| • | if you are an individual, you are present in the U.S. for 183 days or more in the taxable year of the sale or other taxable disposition, and you have a “tax home” in the U.S.; or |
| • | we are or have been during a specified testing period a “U.S. real property holding corporation” for U.S. federal income tax purposes. |
If the first bullet point immediately above is applicable to you, any gain derived on the sale or taxable disposition of our common stock will be subject to a flat 30.0% tax, which may be offset by U.S. source capital losses. We believe that we have not been and are not, and we do not anticipate becoming, a “U.S. real property holding corporation” for U.S. federal income tax purposes.
Information Reporting and Backup Withholding Tax
We must report annually to the Internal Revenue Service and to you the amount of dividends paid to you and amount of tax, if any, withheld with respect to such dividends. The Internal Revenue Service may make the information returns reporting such dividends and withholding available to the tax authorities in the country in which you are resident.
In addition, you may be subject to information reporting requirements and backup withholding tax with respect to dividends paid on, and the proceeds of disposition of, shares of our common stock, unless, generally, you certify under penalties of perjury (usually on Internal Revenue Service Form W-8BEN) that you are not a U.S. person or you otherwise establish an exemption. Additional rules relating to information reporting requirements and backup withholding tax with respect to payments of the proceeds from the disposition of shares of our common stock are as follows:
| • | If the proceeds are paid to or through the U.S. office of a broker, they generally will be subject to backup withholding tax and information reporting, unless you certify under penalties of perjury (usually on Internal Revenue Service Form W-8BEN) that you are not a U.S. person or you otherwise establish an exemption. |
| • | If the proceeds are paid to or through a non-U.S. office of a broker that is not a U.S. person and is not a foreign person with certain specified U.S. connections (a “U.S.-related person”), information reporting and backup withholding tax will not apply. |
| • | If the proceeds are paid to or through a non-U.S. office of a broker that is a U.S. person or a U.S. related person, they generally will be subject to information reporting (but not to backup withholding tax), unless you certify under penalties of perjury (usually on Internal Revenue Service Form W-8BEN) that you are not a U.S. person or you otherwise establish an exemption. |
Any amounts withheld under the backup withholding tax rules may be allowed as a refund or a credit against your U.S. federal income tax liability, provided the required information is timely furnished by you to the Internal Revenue Service.
91
Table of Contents
Effect of Accounting and Tax Treatment on Compensation Decisions
In Fiscal 2009, while we generally considered the financial accounting and tax implications of our executive compensation decisions, these implications were not material considerations in the compensation awarded to our named executive officers during such fiscal year.
92
Table of Contents
J.P. Morgan Securities Inc., Merrill Lynch, Pierce, Fenner & Smith Incorporated and Barclays Capital Inc. are acting as joint book-running managers of this offering and representatives of the underwriters. Under the terms and subject to the conditions contained in an underwriting agreement dated the date of this prospectus, the underwriters named below have severally agreed to purchase, and the selling stockholders have agreed to sell to them, the number of shares of common stock indicated in the table below:
| Underwriters |
Number of Shares | |
| J.P. Morgan Securities Inc. |
||
| Merrill Lynch, Pierce, Fenner &
Smith |
||
| Barclays Capital Inc. |
||
| Stifel, Nicolaus & Company, Incorporated |
||
| Robert W. Baird & Co. Incorporated |
||
| Piper Jaffray & Co |
||
| Total |
6,236,320 | |
The underwriters are offering the shares of common stock subject to their acceptance of the shares from us and the selling stockholders and subject to prior sale. The underwriting agreement provides that the obligations of the several underwriters to pay for and accept delivery of the shares of common stock offered by this prospectus are subject to the approval of certain legal matters by their counsel and to other conditions. The underwriters are obligated to take and pay for all of the shares of common stock offered by this prospectus if any such shares are taken. However, the underwriters are not required to take or pay for the shares covered by the underwriters’ option to purchase additional shares described below. The underwriters initially propose to offer part of the shares of common stock directly to the public at the public offering price listed on the cover page of this prospectus, less underwriting discounts and commissions, and part to certain dealers at a price that represents a concession not in excess of $ per share under the public offering price. After the initial offering of the shares of common stock, the offering price and other selling terms may from time to time be varied by the representatives.
Option to Purchase Additional Shares
The selling stockholders have granted to the underwriters an option, exercisable for 30 days from the date of this prospectus, to purchase up to an aggregate 935,448 of additional shares of common stock at the public offering price, less underwriting discounts and commissions. To the extent the option is exercised, each underwriter will become obligated, subject to certain conditions, to purchase approximately the same percentage of the additional shares of common stock as the number listed next to the underwriter’s name in the preceding table bears to the total number of shares of common stock listed next to the names of all underwriters in the preceding table. If the underwriters’ option to purchase additional shares is exercised in full the total price to the public would be approximately $ million and the total underwriters’ discounts and commissions would be approximately $ million.
Commissions and Discounts
The following table shows the per share and total underwriting discounts and commissions that the selling stockholders are to pay to the underwriters in connection with this offering. These amounts are shown assuming both no exercise and full exercise of the underwriters’ option.
| No Exercise |
Full Exercise | |||
| Per Share |
$ | $ | ||
| Total |
$ | $ |
93
Table of Contents
In addition, we estimate that our expenses for this offering other than underwriting discounts and commissions payable by us will be approximately $0.6 million. The underwriters have agreed to reimburse us for certain deal related expenses.
No Sales of Similar Securities
We, the selling stockholders, all of our directors and officers and holders of our outstanding stock and holders of securities exercisable for or convertible into shares of common stock have agreed that, subject to specified exceptions, without the prior written consent of J.P. Morgan Securities Inc., Merrill Lynch, Pierce, Fenner & Smith Incorporated and Barclays Capital Inc. on behalf of the underwriters, we and they will not, during the period beginning on the date of this prospectus and ending 90 days thereafter:
| • | offer, pledge, announce the intention to sell, sell, contract to sell, sell any option or contract to purchase, purchase any option or contract to sell, grant any option, right or warrant to purchase, or otherwise transfer or dispose of, directly or indirectly, any shares of common stock or any securities convertible into or exercisable or exchangeable for common stock; |
| • | enter into any swap or other agreement that transfers, in whole or in part, any of the economic consequences of ownership of common stock; or |
| • | make any demand for or exercise any right with respect to the registration of any shares of common stock or any security convertible into or exercisable or exchangeable for common stock; |
with respect to the first and second bullets above, whether any such transaction is to be settled by delivery of common stock or such other securities, in cash or otherwise.
The restrictions described in the preceding paragraphs do not apply to:
| • | the sale by us or the selling stockholders of shares to the underwriters in connection with the offering; |
| • | the transfer by our directors, executive officers and other stockholders of shares of common stock as a bona fide gift or gifts; or |
| • | distributions of share of common stock to members or stockholders of our stockholders. |
With respect to the second and third bullets, it shall be a condition to the transfer or distribution that the transferee execute and deliver a copy of the lock-up agreement and that no filing by any donee or transferee with the SEC shall be required or shall be made voluntarily in connection with such transfer or distribution other than a filing on Form 5 made after the expiration of the 90-day restricted period.
The 90-day restricted period described in the preceding paragraph will be extended if:
| • | during the last 17 days of the 90-day restricted period we issue an earnings release or material news or a material event relating to us occurs; or |
| • | prior to the expiration of the 90-day restricted period, we announce that we will release earnings results during the 16-day period beginning on the last day of the 90-day restricted period, |
in which case the restrictions described in the preceding paragraph will continue to apply until the expiration of the 18-day period beginning on the issuance of the earnings release or the occurrence of the material news or material event.
Price Stabilization, Short Positions and Penalty Bids
In order to facilitate this offering of common stock, the underwriters may engage in transactions that stabilize, maintain or otherwise affect the price of the common stock. Specifically, the underwriters may sell
94
Table of Contents
more shares than they are obligated to purchase under the underwriting agreement, creating a short position. A short sale is covered if the short position is no greater than the number of shares available for purchase by the underwriters under the option to purchase additional shares. The underwriters can close out a covered short sale by exercising the option to purchase additional shares or by purchasing shares in the open market. In determining the source of shares to close out a covered short sale, the underwriters will consider, among other things, the open market price of shares compared to the price available under the option to purchase additional shares. The underwriters may also sell shares in excess of the option to purchase additional shares, creating a naked short position. The underwriters must close out any naked short position by purchasing shares in the open market. A naked short position is more likely to be created if the underwriters are concerned that there may be downward pressure on the price of the common stock in the open market after pricing that could adversely affect investors who purchase in this offering. In addition, to stabilize the price of the common stock, the underwriters may bid for and purchase shares of common stock in the open market. Finally, the underwriting syndicate may reclaim selling concessions allowed to an underwriter or a dealer for distributing the common stock in the offering, if the syndicate repurchases previously distributed common stock to cover syndicate short positions or to stabilize the price of the common stock. These activities may raise or maintain the market price of the common stock above independent market levels or prevent or retard a decline in the market price of the common stock. The underwriters are not required to engage in these activities and may end any of these activities at any time.
Listing on the New York Stock Exchange
Our common stock is listed on the NYSE under the symbol “VSI.”
Indemnification
We, the selling stockholders and the underwriters have agreed to indemnify each other against certain liabilities under the Securities Act, including liabilities arising out of or based upon certain material misstatements or omissions. If we, the selling stockholders or the underwriters are unable to provide this indemnification, we, the selling stockholders or the underwriters, as applicable, will contribute to payments the other party or parties may be required to make in respect of those liabilities.
Electronic Distribution
A prospectus in electronic format may be made available on the Internet sites or through other online services maintained by one or more of the underwriters and/or selling group members participating in this offering, or by their affiliates. In those cases, prospective investors may view offering terms online and, depending upon the particular underwriter or selling group member, prospective investors may be allowed to place orders online. The underwriters may agree with us to allocate a specific number of shares for sale to online brokerage account holders. Any such allocation for online distributions will be made by the representatives on the same basis as other allocations.
Other than the prospectus in electronic format, the information on any underwriter’s or selling group member’s website and any information contained in any other website maintained by an underwriter or selling group member is not part of the prospectus or the registration statement of which this prospectus forms a part, has not been approved and/or endorsed by us or any underwriter or selling group member in its capacity as underwriter or selling group member and should not be relied upon by investors.
Other Relationships
Some of the underwriters and their affiliates have engaged in, and may in the future engage in, investment banking and other commercial dealings in the ordinary course of business with us. These underwriters have received customary fees and commissions for these transactions. Additionally, JPMorgan Chase Bank, N.A., an
95
Table of Contents
affiliate of J.P. Morgan Securities Inc., is agent and issuing bank under our 2009 Revolving Credit Facility, for which they have or will receive customary fees. Chase Lincoln First Commercial Corporation, an affiliate of J.P. Morgan Securities Inc., is a lender under this facility.
IPC and certain of our senior management stockholders are party to a securityholders agreement that governs certain relationships among, and contains certain rights and obligations of, such stockholders. Pursuant to the agreement, each party agreed to take all action necessary to ensure the persons designated by IPC serve on our Board. Additionally, the securityholders agreement provides that the persons designated by IPC shall comprise a majority of directors on the board of directors of any of the subsidiaries of Vitamin Shoppe, Inc. and of any committee of the Board of Vitamin Shoppe, Inc. or any of its subsidiaries.
Conflict of Interest
J.P. Morgan Securities Inc. is a member of the Financial Industry Regulatory Authority, Inc., or “FINRA,” the successor to the National Association of Securities Dealers, Inc., or “NASD.” Under FINRA Rule 2720, we are considered an affiliate of J.P. Morgan Securities Inc. because, as stated above, J.P. Morgan Securities Inc. has an economic interest in approximately 21% of our common stock outstanding as of April 30, 2010. Certain affiliates of J.P. Morgan Securities, Inc. will receive a portion of the proceeds of this offering. See “Principal and Selling Stockholders.”
Selling Restrictions
The common stock is being offered for sale in those jurisdictions in the United States, Europe and elsewhere where it is lawful to make such offers.
Notice to Prospective Investors in the European Economic Area
In relation to each Member State of the European Economic Area which has implemented the Prospectus Directive (each, a “Relevant Member State”) an offer to the public of any shares which are the subject of the offering contemplated by this prospectus may not be made in that Relevant Member State, except that an offer to the public in that Relevant Member State of any shares may be made at any time under the following exemptions under the Prospectus Directive, if they have been implemented in that Relevant Member State:
| (a) | to legal entities which are authorized or regulated to operate in the financial markets or, if not so authorized or regulated, whose corporate purpose is solely to invest in securities; |
| (b) | to any legal entity which has two or more of (1) an average of at least 250 employees during the last financial year; (2) a total balance sheet of more than €43,000,000 and (3) an annual net turnover of more than €50,000,000, as shown in its last annual or consolidated accounts; |
| (c) | by the underwriters to fewer than 100 natural or legal persons (other than “qualified investors” as defined in the Prospectus Directive) subject to obtaining the prior consent of the representatives for any such offer; or |
| (d) | in any other circumstances falling within Article 3(2) of the Prospectus Directive; |
provided that no such offer of shares shall result in a requirement for the publication by us or any representative of a prospectus pursuant to Article 3 of the Prospectus Directive.
Any person making or intending to make any offer of shares within the EEA should only do so in circumstances in which no obligation arises for us or any of the underwriters to produce a prospectus for such offer. Neither we nor the underwriters have authorized, nor do they authorize, the making of any offer of shares through any financial intermediary, other than offers made by the underwriters which constitute the final offering of shares contemplated in this prospectus.
For the purposes of this provision, and your representation below, the expression an “offer to the public” in relation to any shares in any Relevant Member State means the communication in any form and by any means of
96
Table of Contents
sufficient information on the terms of the offer and any shares to be offered so as to enable an investor to decide to purchase any shares, as the same may be varied in that Relevant Member State by any measure implementing the Prospectus Directive in that Relevant Member State and the expression “Prospectus Directive” means Directive 2003/71/EC and includes any relevant implementing measure in each Relevant Member State.
Each person in a Relevant Member State who receives any communication in respect of, or who acquires any shares under, the offer of shares contemplated by this prospectus will be deemed to have represented, warranted and agreed to and with us and each underwriter that:
| (a) | it is a “qualified investor” within the meaning of the law in that Relevant Member State implementing Article 2(1)(e) of the Prospectus Directive; and |
| (b) | in the case of any shares acquired by it as a financial intermediary, as that term is used in Article 3(2) of the Prospectus Directive, (i) the shares acquired by it in the offering have not been acquired on behalf of, nor have they been acquired with a view to their offer or resale to, persons in any Relevant Member State other than “qualified investors” (as defined in the Prospectus Directive), or in circumstances in which the prior consent of the representatives has been given to the offer or resale; or (ii) where shares have been acquired by it on behalf of persons in any Relevant Member State other than qualified investors, the offer of those shares to it is not treated under the Prospectus Directive as having been made to such persons. |
Notice to Prospective Investors in Switzerland
This document, as well as any other material relating to the shares which are the subject of the offering contemplated by this prospectus, do not constitute an issue prospectus pursuant to Article 652a of the Swiss Code of Obligations. The shares will not be listed on the SWX Swiss Exchange and, therefore, the documents relating to the shares, including, but not limited to, this document, do not claim to comply with the disclosure standards of the listing rules of SWX Swiss Exchange and corresponding prospectus schemes annexed to the listing rules of the SWX Swiss Exchange. The shares are being offered in Switzerland by way of a private placement, i.e. to a small number of selected investors only, without any public offer and only to investors who do not purchase the shares with the intention to distribute them to the public. The investors will be individually approached by us from time to time. This document, as well as any other material relating to the shares, is personal and confidential and do not constitute an offer to any other person. This document may only be used by those investors to whom it has been handed out in connection with the offering described herein and may neither directly nor indirectly be distributed or made available to other persons without our express consent. It may not be used in connection with any other offer and shall in particular not be copied and/or distributed to the public in (or from) Switzerland.
Notice to Prospective Investors in the Dubai International Financial Centre
This document relates to an exempt offer in accordance with the Offered Securities Rules of the Dubai Financial Services Authority. This document is intended for distribution only to persons of a type specified in those rules. It must not be delivered to, or relied on by, any other person. The Dubai Financial Services Authority has no responsibility for reviewing or verifying any documents in connection with exempt offers. The Dubai Financial Services Authority has not approved this document nor taken steps to verify the information set out in it, and has no responsibility for it. The shares which are the subject of the offering contemplated by this prospectus may be illiquid and/or subject to restrictions on their resale. Prospective purchasers of the shares offered should conduct their own due diligence on the shares. If you do not understand the contents of this document you should consult an authorized financial adviser.
Notice to Prospective Investors in Australia
This prospectus is not a formal disclosure document and has not been lodged with the Australian Securities and Investments Commission, or ASIC. It does not purport to contain all information that an investor or their
97
Table of Contents
professional advisers would expect to find in a prospectus for the purposes of Chapter 6D.2 of the Australian Corporations Act 2001, or the Act, in relation to the securities or our company.
This prospectus is not an offer to retail investors in Australia generally. Any offer of securities in Australia is made on the condition that the recipient is a “sophisticated investor” within the meaning of section 708(8) of the Act or a “professional investor” within the meaning of section 708(11) of the Act, or on condition that the offer to that recipient can be brought within the exemption for ‘Small-Scale Offerings’ (within the meaning of section 708(1) of the Act). If any recipient does not satisfy the criteria for these exemptions, no applications for securities will be accepted from that recipient. Any offer to a recipient in Australia, and any agreement arising from acceptance of the offer, is personal and may only be accepted by the recipient.
If a recipient on-sells their securities within 12 months of their issue, that person will be required to lodge a disclosure document with ASIC unless either:
| • | the sale is pursuant to an offer received outside Australia or is made to a “sophisticated investor” within the meaning of 708(8) of the Act or a “professional investor” within the meaning of section 708(11) of the Act; or |
| • | it can be established that our company issued, and the recipient subscribed for, the securities without the purpose of the recipient on-selling them or granting, issuing or transferring interests in, or options or warrants over them. |
Notice to Prospective Investors in Hong Kong
The shares may not be offered or sold by means of any document other than (i) in circumstances which do not constitute an offer to the public within the meaning of the Companies Ordinance (Cap. 32, Laws of Hong Kong), or (ii) to “professional investors” within the meaning of the Securities and Futures Ordinance (Cap. 571, Laws of Hong Kong) and any rules made thereunder, or (iii) in other circumstances which do not result in the document being a “prospectus” within the meaning of the Companies Ordinance (Cap. 32, Laws of Hong Kong) and no advertisement, invitation or document relating to the shares may be issued or may be in the possession of any person for the purpose of the issue (in each case whether in Hong Kong or elsewhere), which is directed at, or the contents of which are likely to be accessed or read by, the public in Hong Kong (except if permitted to do so under the laws of Hong Kong) other than with respect to shares which are or are intended to be disposed of only to persons outside Hong Kong or only to “professional investors” within the meaning of the Securities and Futures Ordinance (Cap. 571, Laws of Hong Kong) or any rules made thereunder.
Notice to Prospective Investors in India
This prospectus has not been and will not be registered as a prospectus with the Registrar of Companies in India. This prospectus or any other material relating to these securities may not be circulated or distributed, directly or indirectly, to the public or any members of the public in India. Further, persons into whose possession this prospectus comes are required to inform themselves about and to observe any such restrictions. Each prospective investor is advised to consult its advisors about the particular consequences to it of an investment in these securities. Each prospective investor is also advised that any investment in these securities by it is subject to the regulations prescribed by the Reserve Bank of India and the Foreign Exchange Management Act and any regulations framed thereunder.
Notice to Prospective Investors in Japan
The securities have not been and will not be registered under the Financial Instruments and Exchange Law of Japan (the Financial Instruments and Exchange Law) and each underwriter has agreed that it will not offer or sell any securities, directly or indirectly, in Japan or to, or for the benefit of, any resident of Japan (which term as used herein means any person resident in Japan, including any corporation or other entity organized under the laws of
98
Table of Contents
Japan), or to others for re-offering or resale, directly or indirectly, in Japan or to a resident of Japan, except pursuant to an exemption from the registration requirements of, and otherwise in compliance with, the Financial Instruments and Exchange Law and any other applicable laws, regulations and ministerial guidelines of Japan.
Notice to Prospective Investors in Korea
Our securities may not be offered, sold and delivered directly or indirectly, or offered or sold to any person for reoffering or resale, directly or indirectly, in Korea or to any resident of Korea except pursuant to the applicable laws and regulations of Korea, including the Securities and Exchange Act and the Foreign Exchange Transaction Law and the decrees and regulations thereunder. Our securities have not been registered with the Financial Supervisory Commission of Korea for public offering in Korea. Furthermore, our securities may not be resold to Korean residents unless the purchaser of our securities complies with all applicable regulatory requirements (including but not limited to government approval requirements under the Foreign Exchange Transaction Law and its subordinate decrees and regulations) in connection with the purchase of our securities.
Notice to Prospective Investors in Singapore
This prospectus has not been registered as a prospectus with the Monetary Authority of Singapore. Accordingly, this prospectus and any other document or material in connection with the offer or sale, or invitation for subscription or purchase, of the shares may not be circulated or distributed, nor may the shares be offered or sold, or be made the subject of an invitation for subscription or purchase, whether directly or indirectly, to persons in Singapore other than (i) to an institutional investor under Section 274 of the Securities and Futures Act, Chapter 289 of Singapore (the “SFA”), (ii) to a relevant person, or any person pursuant to Section 275 (1A), and in accordance with the conditions, specified in Section 275 of the SFA or (iii) otherwise pursuant to, and in accordance with the conditions of, any other applicable provision of the SFA.
Where the shares are subscribed or purchased under Section 275 by a relevant person which is: (a) a corporation (which is not an accredited investor) the sole business of which is to hold investments and the entire share capital of which is owned by one or more individuals, each of whom is an accredited investor; or (b) a trust (where the trustee is not an accredited investor) whose sole whole purpose is to hold investments and each beneficiary is an accredited investor, shares, debentures and units of shares and debentures of that corporation or the beneficiaries’ rights and interest in that trust shall not be transferable for six months after that corporation or that trust has acquired the shares under Section 275 except: (i) to an institutional investor under Section 274 of the SFA or to a relevant person, or any person pursuant to Section 275(1A), and in accordance with the conditions, specified in Section 275 of the SFA; (ii) where no consideration is given for the transfer; or (iii) by operation of law.
By accepting this prospectus, the recipient hereof represents and warrants that he is entitled to receive it in accordance with the restrictions set forth above and agrees to be bound by limitations contained herein. Any failure to comply with these limitations may constitute a violation of law.
99
Table of Contents
The validity of the shares offered hereby will be passed upon for us by Kirkland & Ellis LLP, New York, New York. Certain partners of Kirkland & Ellis LLP collectively indirectly hold less than 1% of the common stock of Vitamin Shoppe, Inc. The validity of the shares offered hereby will be passed upon for the underwriters by Latham & Watkins LLP, New York, New York.
The consolidated financial statements as of December 26, 2009 and December 27, 2008, and for each of the three fiscal years in the period ended December 26, 2009 included in this prospectus have been audited by Deloitte & Touche LLP, an independent registered public accounting firm, as stated in their report appearing herein. Such consolidated financial statements have been so included in reliance upon the report of such firm given upon their authority as experts in accounting and auditing.
WHERE YOU CAN FIND ADDITIONAL INFORMATION
We have filed with the SEC a registration statement on Form S-1 under the Securities Act, including the exhibits with the registration statement, with respect to the shares offered by this prospectus. This prospectus does not contain all the information contained in the registration statement. For further information with respect to us and shares to be sold in this offering, we refer you to the registration statement. Statements contained in this prospectus as to the contents of any contract, agreement or other document to which we make reference are not necessarily complete.
You may read a copy or any portion of the registration statement or any reports, statements or other information we file at the SEC’s public reference room at 100 F Street, N.E., Washington, D.C. 20549. Please call the SEC at 1-800-SEC-0330 for further information on the operation of the public reference room. You can receive copies of these documents upon payment of a duplicating fee by writing to the SEC. Our SEC filings, including the registration statement, will also be available to you on the SEC’s Internet site at http://www.sec.gov.
We currently file periodic reports, proxy statements and other information with the SEC, pursuant to the periodic reporting requirements of the Securities Exchange Act of 1934. These periodic reports, proxy statements and other information will be available for inspection and copying at the regional offices, public reference facilities and Internet site of the SEC referred to above.
100
Table of Contents
Index to Consolidated Financial Statements
| Page | ||
| Vitamin Shoppe, Inc. |
||
| F-2 | ||
| Consolidated Balance Sheets as of December 26, 2009 and December 27, 2008 |
F-3 | |
| F-4 | ||
| F-5 | ||
| F-6 | ||
| F-7 | ||
| F-35 | ||
| F-36 | ||
| F-37 | ||
| F-38 | ||
| Notes to Condensed Consolidated Financial Statements (unaudited) |
F-39 |
F-1
Table of Contents
REPORT OF INDEPENDENT REGISTERED PUBLIC ACCOUNTING FIRM
To the Board of Directors and Stockholders of
Vitamin Shoppe, Inc.
North Bergen, New Jersey
We have audited the accompanying consolidated balance sheets of Vitamin Shoppe, Inc. (formerly VS Holdings, Inc.) and Subsidiary (the “Company”) as of December 26, 2009 and December 27, 2008, and the related consolidated statements of operations, stockholders’ equity and cash flows for each of the three fiscal years in the period ended December 26, 2009. These financial statements are the responsibility of the Company’s management. Our responsibility is to express an opinion on these financial statements based on our audits.
We conducted our audits in accordance with the standards of the Public Company Accounting Oversight Board (United States). Those standards require that we plan and perform the audit to obtain reasonable assurance about whether the consolidated financial statements are free of material misstatement. The Company is not required to have, nor were we engaged to perform, an audit of its internal control over financial reporting. Our audits included consideration of internal control over financial reporting as a basis for designing audit procedures that are appropriate in the circumstances, but not for the purpose of expressing an opinion on the effectiveness of the Company’s internal control over financial reporting. Accordingly, we express no such opinion. An audit also includes examining, on a test basis, evidence supporting the amounts and disclosures in the financial statements, assessing the accounting principles used and significant estimates made by management, as well as evaluating the overall financial statement presentation. We believe that our audits provide a reasonable basis for our opinion.
In our opinion, such consolidated financial statements present fairly, in all material respects, the financial position of Vitamin Shoppe, Inc. and Subsidiary as of December 26, 2009 and December 27, 2008, and the results of their operations and their cash flows for each of the three fiscal years in the period ended December 26, 2009, in conformity with accounting principles generally accepted in the United States of America.
| /s/ | Deloitte & Touche LLP | |
| New York, New York | ||
| March 16, 2010 |
F-2
Table of Contents
VITAMIN SHOPPE, INC. AND SUBSIDIARY
CONSOLIDATED BALANCE SHEETS
(In thousands, except share data)
| December 26, 2009 |
December 27, 2008 |
|||||||
| ASSETS | ||||||||
| Current assets: |
||||||||
| Cash and cash equivalents |
$ | 8,797 | $ | 1,623 | ||||
| Inventories |
106,091 | 106,891 | ||||||
| Prepaid expenses and other current assets |
13,401 | 13,005 | ||||||
| Deferred income taxes |
5,145 | 4,750 | ||||||
| Total current assets |
133,434 | 126,269 | ||||||
| Property and equipment, net |
83,960 | 82,989 | ||||||
| Goodwill |
177,248 | 177,248 | ||||||
| Other intangibles, net |
70,356 | 71,088 | ||||||
| Other assets: |
||||||||
| Deferred financing fees, net of accumulated amortization of $2,856 and $3,536, respectively |
2,384 | 4,097 | ||||||
| Other |
1,875 | 2,014 | ||||||
| Total other assets |
4,259 | 6,111 | ||||||
| Total assets |
$ | 469,257 | $ | 463,705 | ||||
| LIABILITIES AND STOCKHOLDERS’ EQUITY | ||||||||
| Current liabilities: |
||||||||
| Current portion of long-term debt |
$ | 20,000 | $ | — | ||||
| Current portion of capital lease obligations |
1,537 | 1,111 | ||||||
| Revolving credit facility |
— | 17,000 | ||||||
| Accounts payable |
25,075 | 24,348 | ||||||
| Deferred sales |
14,386 | 13,039 | ||||||
| Accrued salaries and related expenses |
7,551 | 5,454 | ||||||
| Other accrued expenses |
14,469 | 13,032 | ||||||
| Total current liabilities |
83,018 | 73,984 | ||||||
| Long-term debt |
100,106 | 165,000 | ||||||
| Capital lease obligations, net of current portion |
2,303 | 3,271 | ||||||
| Deferred income taxes |
19,945 | 23,363 | ||||||
| Other long-term liabilities |
4,766 | 8,721 | ||||||
| Deferred rent |
24,768 | 20,883 | ||||||
| Commitments and contingencies |
||||||||
| Stockholders’ equity: |
||||||||
| Preferred stock $0.01 par value; no shares issued and outstanding at December 26, 2009; 500,000 shares authorized and 79,502 Series A Shares issued and outstanding at December 27, 2008 (aggregate liquidation preference $128,844) |
— | 1 | ||||||
| Common stock, $0.01 par value; 400,000,000 shares authorized, 26,750,423 shares issued and outstanding at December 26, 2009, and 20,471,966 shares authorized, 14,175,906 shares issued and outstanding at December 27, 2008 |
268 | 142 | ||||||
| Additional paid-in capital |
210,359 | 154,848 | ||||||
| Warrants |
— | 5,666 | ||||||
| Note receivable due from officer |
— | (1,500 | ) | |||||
| Accumulated other comprehensive loss |
(882 | ) | (2,614 | ) | ||||
| Retained earnings |
24,606 | 11,940 | ||||||
| Total stockholders’ equity |
234,351 | 168,483 | ||||||
| Total liabilities and stockholders’ equity |
$ | 469,257 | $ | 463,705 | ||||
See accompanying notes to consolidated financial statements.
F-3
Table of Contents
VITAMIN SHOPPE, INC. AND SUBSIDIARY
CONSOLIDATED STATEMENTS OF OPERATIONS
(In thousands, except share and per share data)
| Year Ended | ||||||||||||
| December 26, 2009 |
December 27, 2008 |
December 29, 2007 |
||||||||||
| Net sales |
$ | 674,495 | $ | 601,540 | $ | 537,872 | ||||||
| Cost of goods sold |
457,573 | 405,659 | 360,346 | |||||||||
| Gross profit |
216,922 | 195,881 | 177,526 | |||||||||
| Selling, general and administrative expenses |
173,144 | 158,713 | 143,544 | |||||||||
| Related party expenses |
2,446 | 1,523 | 1,365 | |||||||||
| Income from operations |
41,332 | 35,645 | 32,617 | |||||||||
| Loss on extinguishment of debt |
2,016 | — | — | |||||||||
| Interest income |
(43 | ) | (116 | ) | (295 | ) | ||||||
| Interest expense |
18,679 | 21,253 | 22,340 | |||||||||
| Interest expense, net |
18,636 | 21,137 | 22,045 | |||||||||
| Income before provision for income taxes |
20,680 | 14,508 | 10,572 | |||||||||
| Provision for income taxes |
8,014 | 6,341 | 3,792 | |||||||||
| Net income |
12,666 | 8,167 | 6,780 | |||||||||
| Preferred stock dividends in arrears |
7,692 | 9,279 | 9,105 | |||||||||
| Net income (loss) available to common stockholders |
$ | 4,974 | $ | (1,112 | ) | $ | (2,325 | ) | ||||
| Weighted average shares outstanding |
||||||||||||
| Basic |
16,238,338 | 14,175,906 | 14,175,906 | |||||||||
| Diluted |
17,748,371 | 14,175,906 | 14,175,906 | |||||||||
| Net income (loss) per share |
||||||||||||
| Basic |
$ | 0.31 | $ | (0.08 | ) | $ | (0.16 | ) | ||||
| Diluted |
$ | 0.28 | $ | (0.08 | ) | $ | (0.16 | ) | ||||
See accompanying notes to consolidated financial statements.
F-4
Table of Contents
VITAMIN SHOPPE, INC. AND SUBSIDIARY
CONSOLIDATED STATEMENTS OF STOCKHOLDERS’ EQUITY
(in thousands, except share data)
| Preferred Stock Series A |
Common Stock | |||||||||||||||||||||||||||||||||||
| Shares | Amounts | Shares | Amounts | Additional Paid-In Capital |
Warrants | Note Receivable Due from Officer |
Accumulated Other Comprehensive (Loss) Income |
Retained Earnings (Accumulated Deficit) |
Total | |||||||||||||||||||||||||||
| Balance at December 30, 2006 |
79,860 | $ | 1 | 14,175,906 | $ | 142 | $ | 151,495 | $ | 5,666 | $ | (1,500 | ) | $ | 478 | $ | (2,766 | ) | $ | 153,516 | ||||||||||||||||
| Net income |
— | — | — | — | — | — | — | — | 6,780 | 6,780 | ||||||||||||||||||||||||||
| Interest rate swap, net of taxes of $1.1 million |
— | — | — | — | — | — | — | (1,828 | ) | — | (1,828 | ) | ||||||||||||||||||||||||
| Total Comprehensive Income |
4,952 | |||||||||||||||||||||||||||||||||||
| Equity compensation |
— | — | — | — | 1,562 | — | — | — | — | 1,562 | ||||||||||||||||||||||||||
| Adoption of accounting for uncertain tax positions |
— | — | — | — | — | — | — | — | (241 | ) | (241 | ) | ||||||||||||||||||||||||
| Balance at December 29, 2007 |
79,860 | 1 | 14,175,906 | 142 | 153,057 | 5,666 | (1,500 | ) | (1,350 | ) | 3,773 | 159,789 | ||||||||||||||||||||||||
| Net income |
— | — | — | — | — | — | — | — | 8,167 | 8,167 | ||||||||||||||||||||||||||
| Interest rate swap, net of taxes of $0.8 million |
— | — | — | — | — | — | — | (1,264 | ) | — | (1,264 | ) | ||||||||||||||||||||||||
| Total Comprehensive Income |
6,903 | |||||||||||||||||||||||||||||||||||
| Equity compensation |
— | — | — | — | 2,352 | — | — | — | — | 2,352 | ||||||||||||||||||||||||||
| Redemption of preferred shares |
(358 | ) | — | — | — | (561 | ) | — | — | — | — | (561 | ) | |||||||||||||||||||||||
| Balance at December 27, 2008 |
79,502 | 1 | 14,175,906 | 142 | 154,848 | 5,666 | (1,500 | ) | (2,614 | ) | 11,940 | 168,483 | ||||||||||||||||||||||||
| Net income |
— | — | — | — | — | — | — | — | 12,666 | 12,666 | ||||||||||||||||||||||||||
| Interest rate swap, net of taxes of $1.2 million |
— | — | — | — | — | — | — | 1,732 | — | 1,732 | ||||||||||||||||||||||||||
| Total Comprehensive Income |
14,398 | |||||||||||||||||||||||||||||||||||
| Extinguishment of officers’ note |
(634 | ) | — | (140,507 | ) | — | (1,837 | ) | — | 1,500 | — | — | (337 | ) | ||||||||||||||||||||||
| Equity compensation |
— | — | — | — | 3,040 | — | — | — | — | 3,040 | ||||||||||||||||||||||||||
| Issuance of restricted shares |
— | — | 90,557 | 1 | — | — | — | — | — | — | ||||||||||||||||||||||||||
| Issuance of common stock |
— | — | 49,950 | — | 755 | — | — | — | — | 755 | ||||||||||||||||||||||||||
| Issuance of common stock during offering, net* |
(36,969 | ) | — | 12,486,920 | 124 | 125,051 | (5,666 | ) | — | — | — | 119,509 | ||||||||||||||||||||||||
| Redemption of preferred shares |
(41,899 | ) | — | — | — | (72,535 | ) | — | — | — | — | (72,535 | ) | |||||||||||||||||||||||
| Exercise of stock options |
— | — | 87,597 | 1 | 685 | — | — | — | — | 686 | ||||||||||||||||||||||||||
| Tax benefits on exercise of stock options |
— | — | — | — | 352 | — | — | — | — | 352 | ||||||||||||||||||||||||||
| Balance at December 26, 2009 |
— | — | 26,750,423 | $ | 268 | $ | 210,359 | $ | — | $ | — | $ | (882 | ) | $ | 24,606 | $ | 234,351 | ||||||||||||||||||
| * | Includes conversion of preferred shares and warrants. |
See accompanying notes to consolidated financial statements.
F-5
Table of Contents
VITAMIN SHOPPE, INC. AND SUBSIDIARY
CONSOLIDATED STATEMENTS OF CASH FLOWS
(In thousands)
| Year Ended | ||||||||||||
| December 26, 2009 |
December 27, 2008 |
December 29, 2007 |
||||||||||
| Cash flows from operating activities: |
||||||||||||
| Net income |
$ | 12,666 | $ | 8,167 | $ | 6,780 | ||||||
| Adjustments to reconcile net income to net cash provided by operating activities: |
||||||||||||
| Depreciation and amortization of fixed and intangible assets |
21,095 | 17,483 | 14,882 | |||||||||
| Amortization of deferred financing fees |
1,227 | 1,168 | 1,162 | |||||||||
| Loss on extinguishment of debt, net of premium on Note redemption |
1,568 | — | — | |||||||||
| Loss on disposal of fixed assets |
130 | 79 | 80 | |||||||||
| Amortization of unrealized loss on terminated swap |
565 | — | — | |||||||||
| Deferred income taxes |
(4,995 | ) | 695 | 2,255 | ||||||||
| Deferred rent |
3,041 | 3,447 | 2,207 | |||||||||
| Equity compensation expense |
3,040 | 2,352 | 1,562 | |||||||||
| Tax benefits on exercises of stock options |
(352 | ) | ||||||||||
| Changes in operating assets and liabilities: |
||||||||||||
| Inventories |
800 | (9,082 | ) | (15,634 | ) | |||||||
| Prepaid expenses and other current assets |
800 | 74 | (803 | ) | ||||||||
| Other non-current assets |
(217 | ) | (95 | ) | 628 | |||||||
| Accounts payable |
1,336 | (10,908 | ) | 8,677 | ||||||||
| Accrued expenses and other current liabilities |
4,900 | 5,644 | (1,522 | ) | ||||||||
| Other long-term liabilities |
(2,170 | ) | 564 | 344 | ||||||||
| Net cash provided by operating activities |
43,434 | 19,588 | 20,618 | |||||||||
| Cash flows from investing activities: |
||||||||||||
| Capital expenditures |
(21,244 | ) | (31,895 | ) | (14,074 | ) | ||||||
| Trademarks and other intangible assets |
(37 | ) | (3,494 | ) | (18 | ) | ||||||
| Net cash used in investing activities |
(21,281 | ) | (35,389 | ) | (14,092 | ) | ||||||
| Cash flows from financing activities: |
||||||||||||
| Borrowings under revolving credit agreement |
8,594 | 20,000 | 4,000 | |||||||||
| Repayment of borrowings under revolving credit agreement |
(25,594 | ) | (3,000 | ) | (10,500 | ) | ||||||
| Payments of capital lease obligation |
(1,334 | ) | (468 | ) | — | |||||||
| Redemption of long term debt (Notes) |
(44,894 | ) | — | — | ||||||||
| Redemption of preferred shares |
(72,535 | ) | (561 | ) | — | |||||||
| Proceeds from issuance of common stock |
755 | — | — | |||||||||
| Proceeds from issuance of common stock during offering, net |
121,209 | — | — | |||||||||
| Payments for expenses related to the offering |
(1,700 | ) | — | — | ||||||||
| Proceeds from exercises of common stock options |
686 | — | — | |||||||||
| Tax benefits on exercises of stock options |
352 | — | — | |||||||||
| Deferred financing fees |
(518 | ) | — | (45 | ) | |||||||
| Net cash (used in) provided by financing activities |
(14,979 | ) | 15,971 | (6,545 | ) | |||||||
| Net increase (decrease) in cash and cash equivalents |
7,174 | 170 | (19 | ) | ||||||||
| Cash and cash equivalents beginning of year |
1,623 | 1,453 | 1,472 | |||||||||
| Cash and cash equivalents end of year |
$ | 8,797 | $ | 1,623 | $ | 1,453 | ||||||
| Supplemental disclosures of cash flow information: |
||||||||||||
| Interest paid |
$ | 17,279 | $ | 20,386 | $ | 21,895 | ||||||
| Income taxes paid |
$ | 11,258 | $ | 5,919 | $ | 752 | ||||||
| Supplemental disclosures of non-cash investing activities: |
||||||||||||
| Accrued purchases of property and equipment |
$ | 1,525 | $ | 2,134 | $ | 2,227 | ||||||
| Assets acquired under capital lease |
$ | 792 | $ | 4,850 | $ | — | ||||||
See accompanying notes to consolidated financial statements.
F-6
Table of Contents
VITAMIN SHOPPE, INC. AND SUBSIDIARY
NOTES TO CONSOLIDATED FINANCIAL STATEMENTS
| 1. | Basis of Presentation |
Vitamin Shoppe, Inc. (“VSI”), formerly VS Holdings, Inc., is incorporated in the State of Delaware, and through its wholly-owned subsidiary, Vitamin Shoppe Industries Inc. (“Subsidiary” or “Industries”) and Industries’ wholly-owned subsidiary, VS Direct Inc. (“Direct,” and, together with Industries and VSI, the “Company”), is a leading specialty retailer and direct marketer of nutritional products. Sales of both national brands and proprietary brands of vitamins, minerals, nutritional supplements, herbs, sports nutrition formulas, homeopathic remedies and other health and beauty aids are made through VSI-owned retail stores, the Internet and mail order catalogs to customers located primarily in the United States. VSI operates from its headquarters in North Bergen, New Jersey.
For all periods presented, share and per share information in these consolidated financial statements and the notes hereto have been adjusted to reflect the Company’s approximately 1.8611-for-one stock split effective on October 27, 2009, described in Note 2- Reorganization and Initial Public Offering, below. In addition, as the merger discussed below was between entities under common control, the consolidated financial statements for all years presented reflect the activity and balances of the merged company described in Note 2, as if the merger had occurred prior to December 31, 2006.
The consolidated financial statements for the fiscal years ended December 26, 2009, December 27, 2008, and December 29, 2007 include the accounts of VSI, Industries and Direct. All significant intercompany transactions have been eliminated.
The Company’s fiscal year ends on the last Saturday in December. As used herein, the term “Fiscal Year” or “Fiscal” refers to the 52-week period ending the last Saturday in December. Fiscal 2009 is a 52-week period ended December 26, 2009, Fiscal 2008 is a 52-week period ended December 27, 2008, and Fiscal 2007 is a 52-week period ended December 29, 2007.
| 2. | Reorganization and Initial Public Offering |
On October 27, 2009, VS Parent, Inc. merged into VS Holdings, Inc., with VS Holdings being renamed, as Vitamin Shoppe, Inc (the “Merger”). All common shares and warrants previously issued by VS Parent, Inc., were converted to common shares of Vitamin Shoppe, Inc., at approximately a 1.8611-for-one split, resulting in 14,085,349 common shares and 1,055,540 warrants issued and outstanding at October 27, 2009. In addition 78,868 preferred shares were converted to preferred shares of Vitamin Shoppe, Inc. Also in connection with the Merger, a note receivable of $1.5 million from the Company’s former chief executive officer, which was accounted for as a separate component of VS Parent, Inc.’s stockholders’ equity, along with accrued interest of $0.3 million, was extinguished. As consideration for extinguishment of the note and accrued interest, 140,507 common shares (after taking into effect the stock split) and 634 preferred shares of VS Parent, Inc., which were held by the Company’s former chief executive officer to whom the note was extended, were surrendered. The common shares were surrendered at their acquisition cost and the preferred shares were surrendered in satisfaction of the remaining balance on the note.
As a result of the Merger, the following balance sheet items of VS Parent, Inc., at October 27, 2009, were combined into Vitamin Shoppe, Inc: accrued expenses of $16,000, additional paid-in capital of $773,000, and an accumulated deficit of $154,000. In addition, due from/to affiliate balances were combined in and reclassified to intercompany accounts where they were eliminated upon consolidation.
On November 2, 2009, the Company completed an initial public offering (“IPO”), issuing 7,666,667 new common shares in connection with the IPO, at a price of $17 per share, resulting in net proceeds from the
F-7
Table of Contents
offering of approximately $121.2 million, net of underwriters commissions. Other fees associated with the IPO amounted to approximately $1.7 million, which were offset against the proceeds of the IPO. In connection with the IPO, 36,969 preferred shares previously held by VS Parent Inc., along with accumulated dividends in arrears, were converted into 3,764,720 common shares of Vitamin Shoppe, Inc., with the remaining 41,899 preferred shares being redeemed for cash of approximately $72.5 million.
In addition, certain designated proceeds of the IPO were used to redeem $44.9 million in aggregate principal of the Company’s Second Priority Senior Secured Floating Rate Notes due 2012 (the “Notes”) along with a premium on the Notes of approximately $0.4 million, which reduced the outstanding balance of the Notes from $165.0 million to approximately $120.1 million. In connection with the redemption of the Notes, approximately $0.7 million of deferred financing fees and $0.6 million of unrecognized losses related to a terminated interest rate swap along with the aforementioned premium were expensed in the fourth fiscal quarter of 2009.
On November 2, 2009, in connection with the IPO, the Company’s management agreement with IPC Manager II, LLC was terminated. A termination fee of approximately $0.8 million was paid and expensed in the fourth fiscal quarter of 2009. There are no obligations remaining under the agreement as of November 2, 2009.
| 3. | Summary of Significant Accounting Policies |
Use of Estimates—The preparation of financial statements in conformity with accounting principles generally accepted in the United States of America requires management to make estimates and assumptions that affect the reported amounts of assets and liabilities, and disclosures of contingent assets and liabilities at the date of the financial statements, and revenue and expenses during the reporting period. Actual results could differ from those estimates.
Cash and Cash Equivalents—All highly liquid investments with original maturities of three months or less are considered to be cash equivalents.
Inventories—Inventories, which are comprised solely of finished goods, are stated at the lower of cost or market value. Cost is determined using the moving weighted average method. Finished goods inventory includes the cost of labor and overhead required to package products. In addition, the cost of inventory is reduced by purchase discounts and allowances received from certain of our vendors. The Company estimates losses for excess and/or obsolete inventory and the net realizable value of inventory based on when a product is close to expiration and not expected to be sold, when a product has reached its expiration date, or when a product is not expected to be saleable. In determining the reserves for these products consideration is given to such factors as the amount of inventory on hand, the remaining shelf life, current and expected market conditions, historical trends and the likelihood of recovering the inventory costs based on anticipated demand. The following table details the activity and balances for the Company’s reserve for obsolete inventory at December 26, 2009, December 27, 2008, and December 29, 2007 (in thousands):
| Balance Beginning of Year |
Amounts Charged to Cost of Goods Sold |
Write-Offs Against Reserves |
Balance at End of Year | ||||||||||
| Obsolescence Reserves: |
|||||||||||||
| Year Ended December 26, 2009 |
$ | 1,389.1 | $ | 1,985.6 | $ | (2,008.0 | ) | $ | 1,366.7 | ||||
| Year Ended December 27, 2008 |
1,252.8 | 1,929.3 | (1,793.0 | ) | 1,389.1 | ||||||||
| Year Ended December 29, 2007 |
1,315.6 | 1,334.0 | (1,396.8 | ) | 1,252.8 | ||||||||
Property and Equipment—Property and equipment is stated at cost less accumulated depreciation and amortization. Depreciation and amortization are provided for on a straight-line basis over the estimated useful lives of the related assets. Furniture, fixtures and equipment are depreciated over three to fifteen years. Leasehold improvements are amortized over the shorter of their useful lives or related lease terms. The direct internal and external costs associated with the development of the features and functionality of the Company’s website,
F-8
Table of Contents
transaction processing systems, telecommunications infrastructure and network operations, are capitalized and are amortized on a straight line basis over the estimated useful lives of five years. Capitalization of costs begin when the preliminary project stage is completed and management authorizes and commits to funding the computer software project and that it is probable that the project will be completed and the software will be used to perform the function intended. Depreciation of the assets commence when they are put into use. Expenditures for repairs and maintenance are expensed as incurred and expenditures for major renovations and improvements are capitalized. Upon retirement or disposition of property and equipment, the applicable cost and accumulated depreciation are removed from the accounts and any resulting gains or losses are included in the results of operations.
Impairment of Long-Lived Assets—The Company reviews its long-lived assets for impairment whenever events or changes in circumstances indicate that the carrying amount of an asset may not be recoverable. Recoverability of assets held and used is measured by a comparison of the carrying amount of an asset to undiscounted pre-tax future net cash flows expected to be generated by that asset. If the undiscounted future cash flows are not adequate to recover the carrying value of the asset, an impairment loss is recognized for the amount by which the carrying amount of the assets exceeds the fair value of the assets. For all periods presented, there were no impairments recognized.
Goodwill and Other Intangibles—Goodwill is not amortized but is reviewed for impairment at least annually, in the fourth quarter of each year, or whenever impairment indicators exist. Judgments regarding the existence of impairment indicators are based on market conditions and operational performance of the business. Goodwill is tested for impairment at the reporting unit level (the Company’s operating segments). Impairment tests involve calculating the fair value of both reporting units using the discounted cash flow analysis method and the market multiples method which is used primarily for additional validation of the value calculated. Both of these valuation methods require certain assumptions and estimates be made by the Company regarding certain industry trends and future profitability. It is the Company’s policy to conduct goodwill impairment testing from information based on the most current business projections, which include projected future revenues and cash flows. The cash flows utilized in the discounted cash flow analysis are based on five-year financial forecasts developed internally by management. Cash flows for each reporting unit are discounted using an internally derived weighted average cost of capital which reflects the costs of borrowing for the funding of each unit as well as the risk associated with the units themselves. If the carrying amount of a reporting unit exceeds its fair value, the Company would compare the implied fair value of the reporting unit goodwill with its carrying value. To compute the implied fair value, the Company would assign the fair value of the reporting unit to all of the assets and liabilities of that unit (including any unrecognized intangible assets) as if the reporting unit had been acquired in a business combination. The excess of the fair value of a reporting unit over the amounts assigned to its assets and liabilities is the implied fair value of goodwill. To the extent that the implied fair value associated with the goodwill and indefinite-lived intangible assets is less than the recorded value, this would result in a write down of the carrying value of the asset. Impairment tests between annual tests may be undertaken if an event occurs or circumstances change that would reduce the fair value of a reporting unit below its carrying value. The valuation of the goodwill and indefinite-lived intangible assets is affected by, among other things, the Company’s projections for the future and estimated results of future operations. Changes in the business plan or operating results that are different than the estimates used to develop the valuation of the assets may impact these valuations. Intangible assets with indefinite lives are not amortized but are reviewed for impairment annually or more frequently if circumstances indicate a possible impairment may have occurred. For those intangible assets which have definite lives, the Company amortizes their cost on a straight-line basis over their estimated useful lives which are various periods based on their contractual terms.
Insurance Liabilities—Based on the Company’s assessment of risk and cost efficiency, the Company purchases insurance policies to provide for workers’ compensation, general liability, and property losses, as well as director’s and officer’s liability. Effective January 1, 2006, the Company self insures its employee medical benefits, up to a certain limit on individual claims. At December 26, 2009 and December 27, 2008, the accruals for claims incurred but not reported amounted to $1.2 million and $0.9 million, respectively.
F-9
Table of Contents
Rent Expenses, Deferred Rent and Landlord Construction Allowances—Rent expense and rent incentives, including landlord construction allowances, are recognized on a straight-line basis over the lease term. The Company records rent expense for stores and the distribution center as a component of cost of goods sold. The Company accounts for landlord construction allowances as lease incentives and records them as a component of deferred rent, which is recognized in cost of goods sold over the lease term.
Deferred Financing Fees—The Company capitalizes costs directly associated with acquiring third-party financing. Deferred financing fees are included in other assets and are amortized as interest expense over the term of the related indebtedness.
Revenue Recognition—The Company recognizes revenue, net of sales returns and deferred sales, when merchandise is sold “over-the-counter” in retail stores or upon delivery to a direct customer. In addition, shipping fees billed to customers are classified as sales. To arrive at net sales, gross sales are reduced by actual customer returns and a provision for estimated future customer returns, which is based on management’s review of historical and current customer returns. The following table details the activity and balances of the sales return reserves at December 26, 2009, December 27, 2008 and December 29, 2007 (in thousands):
| Balance Beginning of Year |
Amounts Charged to Sales |
Write-Offs/Recoveries Against Reserves |
Balance at End of Year | ||||||||||
| Sales return reserves: |
|||||||||||||
| Year Ended December 26, 2009 |
$ | 102.8 | $ | 12,602.2 | $ | (12,580.0 | ) | $ | 125.0 | ||||
| Year Ended December 27, 2008 |
119.9 | 10,739.0 | (10,756.1 | ) | 102.8 | ||||||||
| Year Ended December 29, 2007 |
112.5 | 9,973.5 | (9,966.1 | ) | 119.9 | ||||||||
Cost of Goods Sold—The Company includes the cost of inventory sold, costs of warehousing and distribution and store occupancy costs in cost of goods sold. Warehousing and distribution costs include freight on internally transferred merchandise as well as for shipments to direct customers, rent for the distribution center and costs associated with our buying department and distribution facility, including payroll, which are capitalized into inventory and then expensed as merchandise is sold. Store occupancy costs include rent, common area maintenance, real estate taxes, repairs and maintenance, insurance and utilities.
Frequent Buyer Program—The Company has a frequent buyer program (“Healthy Awards Program”), whereby customers earn points toward free merchandise based on the volume of purchases. Points are earned each calendar year and must be redeemed within the first three months of the following year or they expire. Sales are deferred at the time points are earned based on the value of points that are projected to be redeemed, which are based on historical redemption data. The Company records a liability for points earned within the current period. This is reported as a reduction of sales with a liability recorded as “deferred sales” on the consolidated balance sheet.
Store Pre-opening Costs—Costs associated with the opening of new retail stores and start up activities are expensed as incurred.
Advertising Costs—Costs associated with the production and distribution of the Company’s monthly and quarterly catalogs are expensed as incurred. The costs of advertising for online marketing arrangements, magazines, television and radio are expensed the first time the advertising takes place. Advertising expense was $12.8 million, $13.2 million and $13.7 million for Fiscal 2009, Fiscal 2008 and Fiscal 2007, respectively.
Online Marketing Arrangements—The Company has entered into online marketing arrangements with various online companies. These agreements are established for periods of 24 months, 12 months or, in some cases, a lesser period and generally provide for compensation based on revenue sharing upon the attainment of stipulated revenue amounts or based on the number of visitors that the online company refers to the Company. The Company had no fixed payment contracts during Fiscal 2009, Fiscal 2008 and Fiscal 2007.
F-10
Table of Contents
Research and Development Costs—Research and development costs are expensed as incurred and recorded in selling, general and administrative expenses in our consolidated statements of operations. The Company incurred $1.5 million, $1.4 million, and $1.6 million of research and development expense for the fiscal years ended December 26, 2009, December 27, 2008 and December 29, 2007, respectively.
Income Taxes—Deferred income tax assets and liabilities are recorded in accordance with the liability method. Deferred income taxes have been provided for temporary differences between the tax bases and financial reporting bases of the Company’s assets and liabilities using the tax rates and laws in effect for the periods in which the differences are expected to reverse.
Effective December 31, 2006, the Company adopted the provisions of a new pronouncement issued by the Financial Accounting Standards Board (“FASB”) relating to uncertain tax positions. Such literature provides guidance for the recognition threshold and measurement attribute for financial statement recognition and measurement of a tax position taken or expected to be taken in a tax return. In accordance with this guidance, the Company recognized an adjustment of $2.7 million, increasing the liability for uncertain tax positions, and interest, and reducing the December 31, 2006 balance of retained earnings by $0.2 million as well as increasing the balance of goodwill by $1.4 million. See Note 7 for a further discussion.
Prior to Fiscal 2007 and the adoption of these provisions, the Company recognized the largest amount that is more likely than not to be sustained upon audit by the relevant taxing authority, the impact of an uncertain income tax position on the Company’s income tax return. An uncertain income tax position will not be recognized if it has less than a 50% likelihood of being sustained. The tax positions are analyzed periodically (at least quarterly) and adjustments are made as events occur that warrant adjustments for those positions. Interest expense and penalties payable to relevant tax authorities are recorded as a component of income tax expense.
Comprehensive Income—Comprehensive income represents net income plus the results of certain non-stockholders’ equity changes not reflected in the statement of operations. The amounts recorded in accumulated other comprehensive loss represent the fair value of an interest rate swap at December 27, 2008, and the unamortized residual value of that swap at December 26, 2009, which represents the fair value of the swap at its termination during September 2009, net of amortization.
Financial Instruments Policy—The Company has used interest rate swaps as cash flow hedges to manage exposure to fluctuating interest rates on the Company’s debt. In accordance with hedge accounting derivative instruments are reported in the consolidated financial statements at fair value. Changes in the fair value of derivatives are to be recorded each period in earnings in other comprehensive income (loss), depending on whether the derivative is designated as a hedge and if so whether it is effective as a hedge. Gains or losses on derivative instruments reported in other comprehensive income (loss) must be reclassified as earnings in the period in which earnings are affected by the underlying hedged item, and the ineffective portion of all hedges must be recognized in earnings in the current period.
On the date a derivative contract is entered into, a qualifying derivative is required to be designated as (1) a hedge of a recognized asset or liability or an unrecognized firm commitment (a fair value hedge), or (2) a hedge of a forecasted transaction or the variability of cash flows to be received or paid related to the asset or liability (cash flow hedge). At the inception of the hedging relationship, the Company documents its hedge relationships, including identification of the hedging instruments and the hedged items, as well as its risk management objectives and strategies for undertaking the hedge transaction. Derivatives are recorded in the consolidated balance sheet at fair value in other long-term assets or other long-term liabilities. Both at inception of the hedge and quarterly thereafter, the Company performs an assessment to determine whether the derivatives that are used in hedging transactions are expected to be highly effective in offsetting changes in the cash flows of the hedged item.
F-11
Table of Contents
The effective portion of the changes in fair value of the Company’s interest rate swap, which is designated as a cash flow hedge, is recorded in accumulated other comprehensive income (loss), net of tax. The ineffective portion of the change in fair value is recorded as a component of interest expense. Changes in fair value are estimated by management quarterly, based on dealer quotes.
The Company entered into an interest rate swap during December 2005 on a portion of its Notes, which was designated as a cash flow hedge. The interest rate swap had a maturity date of November 2010, and was terminated on September 25, 2009, at a cost of $2.6 million (its then fair market value). The swap’s fair market value of ($4.4) million at December 27, 2008 is recorded in other long-term liabilities on the consolidated balance sheets as of that date. The unamortized residual unrecognized loss of the interest rate swap resulting from the termination is recorded in accumulated other comprehensive loss in the amount of $0.9 million along with related deferred taxes of $0.6 million at December 26, 2009. The amounts in both accumulated comprehensive income and deferred tax assets relating to the unrecognized loss will amortize through Fiscal 2010 and be charged as a component of interest expense.
Concentrations of Credit Risk—The Company’s customers are consumers who purchase products at the Company’s retail stores, through the Company’s websites and mail-order services. Financial instruments, which potentially subject the Company to concentrations of credit risk, consist principally of accounts receivable from credit card processors. As of December 26, 2009, there were no significant concentrations of accounts receivable, or related credit risks. Accounts receivable from credit card processors, included in prepaid expenses and other current assets on the consolidated balance sheets, totaled $4.5 million at December 26, 2009 and $3.8 million at December 27, 2008.
Nature’s Value, Inc. is the only supplier from whom the Company purchased at least 5% of its merchandise during Fiscal 2009, 2008 and 2007. The Company purchased approximately 6%, 7%, and 10% of its total merchandise from Nature’s Value, Inc. in Fiscal 2009, 2008, and 2007, respectively.
Stock-Based Compensation—Stock-based compensation cost is measured at the grant date based on the fair value of awards and is recognized as expense over the vesting period, net of anticipated forfeitures. Determining the fair value of stock-based awards at the grant date requires considerable judgment, including estimating expected volatility, expected term and risk-free rate. The expected volatility is based on the volatility levels over the past 6.25 and 4.81 years (our holding periods) depending on the grant, from the average volatility of similar actively traded companies. Generally, the expected holding period of the option is calculated using the simplified method using the vesting term of 4 years and the contractual term of 10 years, and in certain instances contractual terms of 7.5 years, resulting in 6.25 years and 4.81 years, respectively. The simplified method was chosen as a means to determine the Company’s holding period as prior to November 2009 there was no historical option exercise experience due to the Company being privately held. As of December 26, 2009 there is insufficient information due to the Company being a new publicly owned company. The risk-free interest rate is derived from the average yield for the five and seven year zero-coupon U.S. Treasury Strips.
Compensation expense attributable to stock-based compensation for Fiscal 2009 was approximately $3.0 million, for Fiscal 2008 was approximately $2.4 million and for Fiscal 2007 was approximately $1.6 million. The weighted average grant date fair value for grants was $7.70, $7.92 and $7.04 for Fiscal 2009, Fiscal 2008 and Fiscal 2007, respectively. As of December 26, 2009, the remaining unrecognized stock-based compensation expense for non-vested stock options and restricted shares to be expensed in future periods is $8.4 million, and the related weighted-average period over which it is expected to be recognized is 3.1 years. There were 2,625,589 and 1,243,391 vested and non-vested outstanding options, respectively, at December 26, 2009. Forfeitures are required to be estimated at the time of grant and revised, if necessary, in subsequent periods if actual forfeitures differ from those estimates. The Company estimates forfeitures based on its historical forfeiture rate since the plan inception in Fiscal 2002. The estimated value of future forfeitures as of December 26, 2009 is approximately $0.5 million.
F-12
Table of Contents
The Company previously accounted for stock options under Accounting Principles Bulletin (“APB”) No. 25, “Accounting for Stock Issued to Employees” (“APB No. 25”), using the intrinsic value method. The FASB permits companies to adopt its requirements using various methods. The Company adopted the prospective method for all stock option grants issued prior to December 31, 2005. Subsequent to December 31, 2005, under the prospective method, those nonpublic companies that used the minimum value method of measuring equity share options and similar instruments for either recognition or pro forma disclosure purposes applied the new fair value measurement requirements prospectively to new awards and to awards modified, repurchased, or cancelled after the required effective date. The Company continues to account for any portion of awards outstanding at the date of initial application using the accounting principles originally applied to those awards as allowed by the prospective method. As such, no stock-based compensation costs were reflected in net income for those stock option grants issued prior to the adoption of the provisions of fair value accounting for equity shares, as the Company was not required to do so under the previous guidance nor under the new guidance.
The following table represents assumptions used to estimate the fair value of options:
| Fiscal Year Ended | |||||||||
| December 26, 2009 |
December 27, 2008 |
December 29, 2007 |
|||||||
| Expected dividend yield |
0.0 | % | 0.0 | % | 0.0 | % | |||
| Volatility factor |
49.1 | % | 47.9 | % | 51.8 | % | |||
| Weighted average risk-free interest rate |
2.8 | % | 3.2 | % | 4.5 | % | |||
| Expected life of option |
5.37 years | 6.25 years | 6.25 years | ||||||
Net Income Per Share—The Company’s basic net income per share excludes the dilutive effect of stock options, warrants and unvested restricted shares. It is based upon the weighted average number of common shares outstanding during the period divided into net income (loss) after deducting accumulated dividends on the Company’s Series A Preferred Stock, up until such time the preferred shares were either liquidated or converted to common shares.
Diluted net income per share reflects the potential dilution that would occur if securities or other contracts to issue common stock were exercised or converted into common stock. Stock options, warrants and unvested restricted shares are included as potential dilutive securities for the periods applicable.
For the purposes of basic and diluted net income per share, as a result of the merger on October 27, 2009, weighted average shares outstanding for purposes of presenting net income per share on a comparative basis were retroactively restated for all periods presented based on a approximately a 1.8611-for-one split at the time of the merger.
The computation of basic net income per share is based on the weighted average number of common shares outstanding during the period. The computation of diluted net income per share assumes the foregoing and the exercise of stock options and warrants, as well as vesting of restricted shares, using the treasury stock method to the extent dilutive.
F-13
Table of Contents
The components of the calculation of basic net income per common share and diluted net income per common share are as follows (in thousands except share and per share data):
| Year Ended | |||||||||||
| December 26, 2009 |
December 27, 2008 |
December 29, 2007 |
|||||||||
| Numerator: |
|||||||||||
| Net income (loss) available to common stockholders |
$ | 4,974 | $ | (1,112 | ) | $ | (2,325 | ) | |||
| Denominator: |
|||||||||||
| Basic weighted average common shares outstanding |
16,238,338 | 14,175,906 | 14,175,906 | ||||||||
| Diluted weighted average common shares outstanding |
17,748,371 | 14,175,906 | 14,175,906 | ||||||||
| Basic net income (loss) per common share |
$ | 0.31 | $ | (0.08 | ) | $ | (0.16 | ) | |||
| Diluted net income (loss) per common share |
$ | 0.28 | $ | (0.08 | ) | $ | (0.16 | ) | |||
Stock options for the fiscal year ended December 26, 2009 for 522,363 shares have been excluded from the above calculation as they were anti-dilutive. Stock options and warrants for the fiscal years ended December 27, 2008 and December 29, 2007 have been excluded from the above calculation as they were anti-dilutive.
Recent Accounting Pronouncements—The Company has considered all new accounting pronouncements and has concluded that there are no new pronouncements that may have a material impact on results of operations, financial condition, or cash flows, based on current information
| 4. | Goodwill and Intangible Assets |
The Company acquired $88.0 million of intangible assets and recorded $177.2 million of goodwill in connection with an acquisition completed in Fiscal 2002. The Company also acquired $3.0 million of intangible assets related to an asset purchase in the first quarter of Fiscal 2008, comprised primarily of operating leases, and $0.5 million of intangible assets related to an asset purchase completed in the second quarter of Fiscal 2008, which was primarily attributable to the acquisition of a tradename. Other intangible assets relating to the asset purchases which occurred in the first and second quarters of Fiscal 2008 include customer lists and non-compete agreements.
The following table discloses the carrying value of all intangible assets (in thousands):
| December 26, 2009 | December 27, 2008 | |||||||||||||||||
| Gross Carrying Amount |
Accumulated Amortization |
Net | Gross Carrying Amount |
Accumulated Amortization |
Net | |||||||||||||
| Intangible assets: |
||||||||||||||||||
| Intangibles related to asset purchases |
$ | 3,000 | $ | 1,398 | $ | 1,602 | $ | 3,000 | $ | 629 | $ | 2,371 | ||||||
| Tradenames |
68,754 | — | 68,754 | 68,717 | — | 68,717 | ||||||||||||
| Goodwill |
177,248 | — | 177,248 | 177,248 | — | 177,248 | ||||||||||||
| $ | 249,002 | $ | 1,398 | $ | 247,604 | $ | 248,965 | $ | 629 | $ | 248,336 | |||||||
F-14
Table of Contents
Intangible amortization expense for Fiscal 2009 and Fiscal 2008 was $0.8 million and $0.6 million, respectively. There was no amortization expense in Fiscal 2007. Tradenames are not amortized, as they are determined to be intangible assets with indefinite lives. The annual impairment tests for Goodwill and Tradenames were performed during the fourth quarter of Fiscal 2009 and neither asset was found to be impaired. The useful lives of the Company’s definite-lived intangibles assets is between 1 to 7 years. The expected amortization expense on definite-lived intangible assets on the Company’s consolidated balance sheet at December 26, 2009, is as follows (in thousands):
| Fiscal 2010 |
$ | 727 | |
| Fiscal 2011 |
553 | ||
| Fiscal 2012 |
128 | ||
| Fiscal 2013 |
128 | ||
| Fiscal 2014 |
66 | ||
| $ | 1,602 | ||
| 5. | Property and Equipment |
Property and equipment consists of the following (in thousands):
| As of | ||||||||
| December 26, 2009 |
December 27, 2008 |
|||||||
| Furniture, fixtures and equipment |
$ | 99,215 | $ | 87,491 | ||||
| Leasehold improvements |
95,897 | 83,242 | ||||||
| Website development costs |
11,014 | 11,179 | ||||||
| 206,126 | 181,912 | |||||||
| Less: accumulated depreciation and amortization |
(123,123 | ) | (103,243 | ) | ||||
| Subtotal |
83,003 | 78,669 | ||||||
| Construction in progress |
957 | 4,320 | ||||||
| $ | 83,960 | $ | 82,989 | |||||
Depreciation and amortization expense on property and equipment for the fiscal years ended December 26, 2009, December 27, 2008, and December 29, 2007 was approximately $20.3 million, $16.9 million and $14.9 million, respectively. Depreciation and amortization expense is included in selling, general and administrative expense in the Company’s consolidated statements of operations. Assets held under capital leases, which are classified under furniture, fixtures and equipment, were $4.2 million, net of accumulated amortization of $2.9 million, at December 26, 2009, and $4.4 million, net of accumulated amortization of $1.8 million, at December 27, 2008.
| 6. | Credit Arrangements |
Debt consists of the following (in thousands):
| As of | ||||||
| December 26, 2009 |
December 27, 2008 | |||||
| Revolving Credit Facility |
$ | — | $ | 17,000 | ||
| Second Priority Senior Secured Floating Rate Notes (the “Notes”) |
$ | 120,106 | $ | 165,000 | ||
F-15
Table of Contents
2005 Second Priority Senior Secured Floating Rate Notes
During December 2009, the Company repurchased approximately $44.9 million of its Notes at a premium of $0.4 million. Interest on the Notes is set at a per annum rate equal to a three month LIBOR plus 7.5%, which is reset quarterly on February 15, May 15, August 15 and November 15 of each year. The combined weighted average interest rate before the impact of our hedging activities from December 28, 2008 through December 26, 2009 was 8.45%, and from December 30, 2007 through December 27, 2008 was 10.46%. The Notes will mature on November 15, 2012. Interest on overdue principal and interest and liquidated damages, if any, will accrue at a rate that is 1% higher than the applicable interest rate on the Notes. If Industries cannot make payments on the Notes when they are due, VSI and Industries’ only subsidiary, Direct (collectively, the “Guarantors”), have guaranteed the Notes and must make payments instead. The Notes and the guarantees are secured by a second priority security interest in substantially all of Industries’ and the Guarantors’ assets that secure Industries’ new first priority senior secured credit facility. The Notes and the guarantees are Industries’, and the Guarantors’ second priority senior secured obligations, and rank equally in right of payment with all of Industries’ and the Guarantors’ existing and future senior indebtedness and senior to all of Industries’ and the Guarantors’ existing and future subordinated indebtedness. The Notes and the guarantees are effectively subordinated to all of Industries’ and the Guarantors’ first priority senior secured indebtedness, including Industries’ new first priority senior secured credit facility, to the extent of the collateral securing such indebtedness. If Industries sells certain assets, issues equity or experiences specific kinds of changes in control, Industries must offer to repurchase the Notes. Since November 15, 2007, Industries has had the option to redeem some or all of the Notes. Industries used the proceeds from the sale of the Notes to repay all of its and VSI’s existing indebtedness and to pay related fees and expenses.
Revolving Credit Facility
On November 15, 2005, the Company entered into a $50.0 million senior secured revolving credit facility, which was terminated on September 25, 2009, resulting in a loss on extinguishment of debt of approximately $0.3 million. The largest amount borrowed at any given point during the period ended September 25, 2009 was $17.0 million.
2009 Revolving Credit Facility
On September 25, 2009, the Company entered into a new revolving credit facility (the “2009 Revolving Credit Facility”), and simultaneously terminated its existing credit facility. The terms of the 2009 Revolving Credit Facility extend through September, 2013, and allow the Company to borrow up to $50.0 million subject to the terms of the facility. Similar to the Company’s previous credit facility, the availability under the 2009 Revolving Credit Facility is subject to a borrowing base calculated on the value of certain accounts receivable from credit card companies as well as the inventory of Vitamin Shoppe Industries Inc. and VS Direct Inc. The obligations thereunder are secured by a security interest in substantially all of the assets of Vitamin Shoppe, Inc., Vitamin Shoppe Industries Inc. and VS Direct Inc. VS Direct Inc. and Vitamin Shoppe, Inc. provided guarantees in respect of the Company’s obligations under the 2009 Revolving Credit Facility, and Vitamin Shoppe Industries Inc. and Vitamin Shoppe, Inc. have provided guarantees in respect of VS Direct Inc.’s obligations under the 2009 Revolving Credit Facility. The 2009 Revolving Credit Facility provides for affirmative and negative covenants affecting Vitamin Shoppe Industries Inc., Vitamin Shoppe, Inc. and VS Direct Inc. The 2009 Revolving Credit Facility restricts, among other things, the Company’s ability to incur indebtedness, create or permit liens on the Company’s assets, declare or pay dividends and make certain other restricted payments, consolidate, merge or recapitalize, acquire or sell assets, make certain investments, loans or other advances, enter into transactions with affiliates, change the line of business, and restricts the types of hedging activities can be entered into. The 2009 Revolving Credit Facility has a maturity date of September 2013. However, if, not amended, the 2009 Revolving Credit Facility may terminate at August 15, 2012, if, prior to such date, a significant portion of the Notes has not been redeemed, as, at that date, the facility requires that the sum of all amounts owed under the Notes must be less than the sum of the Company’s cash and cash equivalents plus excess availability (as defined under the 2009 Revolving Credit Facility), subject to certain limitations. The
F-16
Table of Contents
largest amount borrowed at any given point during Fiscal 2009 was $8.6 million. The unused available line of credit under the 2009 Revolving Credit Facility at December 26, 2009 was $49.4 million. As of January 17, 2010, the available balance was decreased by $20.0 million due to the funding of the redemption of a portion of the Notes.
The borrowings under our 2009 Revolving Credit Facility accrue interest, at the Company’s option, at the rate per annum announced from time to time by the agent as its “prime rate,” or at a per annum rate equal to 2.50% above the adjusted Eurodollar rate.
The borrowings under the terminated revolving credit facility accrued interest through September 25, 2009, at a per annum rate equal to between 1.25% and 1.75% (depending on excess availability) above the adjusted Eurodollar rate.
The combined weighted average interest rate for both the 2009 and terminated revolving credit lines from December 27, 2008 through December 26, 2009 was 2.51%. The weighted average interest rate for the terminated revolving credit line from December 30, 2007 through December 27, 2008 was 4.06%.
Scheduled maturities of borrowings as of December 26, 2009, are as follows (in thousands):
| Year |
The Notes | ||
| 2010* |
$ | 20,000 | |
| 2011 |
— | ||
| 2012 |
100,106 | ||
| $ | 120,106 | ||
| * | $20.0 million of the Notes was classified as short term due to the tender offer made during December 2009 for the redemption of that portion of the Notes. |
Net interest expense for Fiscal 2009, 2008 and 2007 consists of the following (in thousands):
| Fiscal Year Ended | ||||||||||||
| December 26, 2009 |
December 27, 2008 |
December 29, 2007 |
||||||||||
| Interest on the Notes |
$ | 16,681 | $ | 19,404 | $ | 20,473 | ||||||
| Amortization of deferred financing fees |
1,227 | 1,168 | 1,162 | |||||||||
| Interest on revolving credit facilities and other |
771 | 681 | 705 | |||||||||
| Interest income |
(43 | ) | (116 | ) | (295 | ) | ||||||
| $ | 18,636 | $ | 21,137 | $ | 22,045 | |||||||
F-17
Table of Contents
Capital Leases
The Company leases certain computer equipment under capital leases, which expire between Fiscal 2010 and Fiscal 2012. The following is a schedule of the future minimum lease payments under capital leases as of December 26, 2009 (in thousands):
| Fiscal 2010 |
$ | 1,753 | |
| Fiscal 2011 |
1,597 | ||
| Fiscal 2012 |
838 | ||
| Total |
4,188 | ||
| Less amount representing interest |
348 | ||
| Present value of minimum lease payments |
3,840 | ||
| Less current portion of capital lease obligation |
1,537 | ||
| $ | 2,303 | ||
| 7. | Income Taxes |
The provision for income taxes for Fiscal 2009, Fiscal 2008 and Fiscal 2007 consists of the following (in thousands):
| Year Ended | ||||||||||||
| December 26, 2009 |
December 27, 2008 |
December 29, 2007 |
||||||||||
| Current: |
||||||||||||
| Federal |
$ | 10,469 | $ | 3,297 | $ | 267 | ||||||
| State |
2,540 | 2,349 | 1,270 | |||||||||
| Total current |
13,009 | 5,646 | 1,537 | |||||||||
| Deferred: |
||||||||||||
| Federal |
(4,051 | ) | 1,003 | 2,808 | ||||||||
| State |
(944 | ) | (308 | ) | (553 | ) | ||||||
| Total deferred |
(4,995 | ) | 695 | 2,255 | ||||||||
| Provision for income taxes |
$ | 8,014 | $ | 6,341 | $ | 3,792 | ||||||
A reconciliation of the statutory Federal income tax rate and effective rate of the provision for income taxes is as follows:
| Year Ended | |||||||||
| December 26, 2009 |
December 27, 2008 |
December 29, 2007 |
|||||||
| Federal statutory rate |
35.0 | % | 35.0 | % | 35.0 | % | |||
| State income taxes, net of Federal income tax benefit |
4.1 | % | 2.6 | % | 2.0 | % | |||
| Impact of state tax rate changes on prior period items |
0.0 | % | 0.0 | % | (2.8 | )% | |||
| Adjustments for uncertain tax positions |
(1.6 | )% | 3.1 | % | 1.8 | % | |||
| Valuation allowance |
0.0 | % | 0.0 | % | 0.4 | % | |||
| Other |
1.3 | % | 2.9 | % | (0.5 | )% | |||
| Effective tax rate |
38.8 | % | 43.6 | % | 35.8 | % | |||
F-18
Table of Contents
Deferred income taxes reflect the net tax effects of temporary differences between the carrying value of assets and liabilities for financial reporting purposes and amounts used for income tax purposes. The temporary differences and carryforwards that give rise to deferred tax assets and liabilities at December 26, 2009 and December 27, 2008 are as follows (in thousands):
| As of | ||||||||
| December 26, 2009 |
December 27, 2008 |
|||||||
| Deferred tax assets: |
||||||||
| Net operating loss carryforward |
$ | 883 | $ | 1,004 | ||||
| Deferred rent |
8,715 | 7,351 | ||||||
| Tenant allowance |
996 | 846 | ||||||
| Deferred sales |
3,115 | 2,789 | ||||||
| Organizational costs |
31 | 35 | ||||||
| Inventory |
2,511 | 2,223 | ||||||
| Other comprehensive income |
555 | 1,737 | ||||||
| Equity compensation expense |
3,279 | 1,946 | ||||||
| Other |
1,877 | 956 | ||||||
| 21,962 | 18,887 | |||||||
| Valuation allowance |
(883 | ) | (883 | ) | ||||
| Deferred tax assets |
21,079 | 18,004 | ||||||
| Deferred tax liabilities: |
||||||||
| Trade name |
(27,696 | ) | (27,858 | ) | ||||
| Accumulated depreciation |
(6,981 | ) | (7,671 | ) | ||||
| Prepaid expenses |
(1,202 | ) | (1,088 | ) | ||||
| Deferred tax liabilities |
(35,879 | ) | (36,617 | ) | ||||
| Net deferred tax liability |
$ | (14,800 | ) | $ | (18,613 | ) | ||
| Amounts recognized in the consolidated balance sheets consist of: |
||||||||
| Deferred tax assets - current |
$ | 5,145 | $ | 4,750 | ||||
| Deferred tax liabilities - long term |
(19,945 | ) | (23,363 | ) | ||||
| Net deferred tax liability |
$ | (14,800 | ) | $ | (18,613 | ) | ||
Management periodically assesses whether the Company is more likely than not to realize some or all of its deferred tax assets. As of December 26, 2009, with the exception of $883,000 of deferred tax assets arising from a net operating loss carryforward for which there is a valuation allowance against (see above table), management determined that the Company is more likely than not to realize the deferred tax assets detailed above.
During Fiscal 2009, with the exception of the above net operating loss related to the valuation allowance, the Company utilized the entirety of its previous years’ net operating loss carryforwards. Accordingly, at December 26, 2009, the Company has no net operating loss carryforwards for which there are expectations for utilization in future periods. Realization of deferred tax assets associated with the state net operating loss carryforwards is dependent upon generating sufficient taxable income prior to their expiration by tax jurisdiction. The Company believes that it is more likely than not that their remaining state net operating loss (held at the holding company level) may expire unused and, accordingly, has established the aforementioned valuation allowance against it. There was no change in the valuation allowance during Fiscal 2009.
The Company and its subsidiaries file income tax returns in the U.S. federal jurisdiction, and various state jurisdictions. On December 31, 2006 (the first day of the 2007 Fiscal year) the Company adopted the provisions
F-19
Table of Contents
of new accounting requirements regarding uncertain tax positions. As a result of the implementation of these requirements, the Company provided an accrual for uncertain tax positions of $3.2 million. Included in the $3.2 million accrual for uncertain tax positions was an adjustment to goodwill for $1.4 million, and a cumulative effect adjustment to reduce the December 31, 2006 beginning balance of retained earnings by $0.2 million. The remainder consisted of tax accruals previously provided for. As of December 26, 2009, the Company has total unrecognized tax benefits of $4.2 million which is included in other long-term liabilities in the consolidated balance sheet. The Company does not currently expect any significant change relative to its accrual for uncertain tax positions in the next twelve months.
The total amount of unrecognized tax benefits that, if recognized, would impact the effective tax rate was approximately $0.7 million at December 29, 2007, $3.7 million at December 27, 2008, and the amount at December 26, 2009 was $3.1 million. A reconciliation of the beginning and ending amount of unrecognized tax benefits is as follows (in thousands):
| Balance at December 30, 2006 |
$ | 3,209 | ||
| Additions based on tax positions related to the current year |
287 | |||
| Balance at December 29, 2007 |
3,496 | |||
| Additions based on tax positions related to the current year |
380 | |||
| Additions for tax positions of prior years |
231 | |||
| Balance at December 27, 2008 |
4,107 | |||
| Additions based on tax positions related to the current year |
92 | |||
| Decreases for tax positions of prior years |
(190 | ) | ||
| Additions for tax positions of prior years |
226 | |||
| Balance at December 26, 2009 |
$ | 4,235 | ||
The Company recognizes interest related to uncertain tax positions in income tax expense. At December 26, 2009, the Company has recorded approximately $0.2 million of accrued interest included in the aforementioned liability for uncertain tax positions for potential payments related to that liability. Interest recognized through the consolidated statements of operations for Fiscal 2008 was approximately $0.1 million.
The Company is no longer subject to U.S. federal examinations by tax authorities for years before 2004 and for state examinations before 2004. However, the tax authorities still have the ability to review the relevance of net operating loss carryforwards created in closed years if such tax attributes are utilized in open years (subsequent to 2004).
| 8. | Stockholders’ Equity |
In connection with the IPO, 7,666,667 new shares were issued at an offering price to the public of $17.00 per share. Also in connection with the IPO, 1,055,540 warrants issued and outstanding at October 27, 2009 were converted to common shares on a one-to-one basis, and 36,969 preferred shares along with accumulated dividends in arrears, were converted into 3,764,720 common shares at a value of $17 per share. Subsequent to the completion of the IPO there were no warrants or preferred shares outstanding.
Stock Based Compensation
During fiscal 2002, the Company adopted a stock option plan (the “2002 Plan”) for certain directors, officers, consultants and employees of the Company. The 2002 Plan authorized the issuance of up to 2,046,041 shares of common stock. In June 2006, the 2002 Plan was amended and assigned to VS Parent, Inc. (the Company’s former parent) where it was adopted as the VS Parent, Inc. 2006 Stock Option Plan (the “2006 Plan”), converting all grants on a one-to-one basis for the right to receive a common share of VS parent upon exercise. In connection with the Merger, the 2006 Plan was assigned to Vitamin Shoppe, Inc. where it was
F-20
Table of Contents
converted at approximately a 1.8611-for-one share split resulting in up to 3,807,862 common shares authorized for issuance. In addition to the 2006 Plan, VS Parent, Inc. adopted the Vitamin Shoppe 2009 Equity Incentive Plan (the “2009 Plan”) on September 2, 2009, which authorized the issuance of up to 1,395,816 common shares for issuance of both stock option and restricted stock shares for certain employees of the Company after taking into consideration the approximately 1.8611-for-one share split.
Stock options are generally exercisable at no less than the fair market value on the date of grant. Generally, options awarded shall become vested in four equal increments on each of the first, second, third and fourth anniversaries of the date on which such options were awarded. The stock options have a maximum term of 10 years. The following table summarizes the activity for both the 2006 Plan and 2009 Plan for Fiscal 2009, and information about options outstanding at December 26, 2009:
| Number of Options |
Weighted Average Exercise Price |
Weighted
Average Remaining Contractual Life (years) |
Aggregate Intrinsic Value (in thousands) | |||||||
| Outstanding at December 27, 2008 |
3,632,948 | $ | 10.83 | |||||||
| Granted |
611,747 | $ | 16.91 | |||||||
| Exercised |
(87,597 | ) | $ | 7.84 | ||||||
| Canceled/forfeited* |
(288,118 | ) | $ | 9.84 | ||||||
| Outstanding at December 26, 2009 |
3,868,980 | $ | 11.93 | 5.90 | 45,228 | |||||
| Vested or expected to vest at December 26, 2009 |
3,675,531 | $ | 11.93 | 5.90 | ||||||
| Vested and exercisable at December 26, 2009 |
2,625,589 | $ | 10.52 | 5.16 | 34,394 | |||||
| * | includes approximately 242,937 of vested options forfeited by the Company’s former Chief Executive Officer. |
The total intrinsic value of options exercised during Fiscal 2009 was $1.0 million. The cash received from options exercised during Fiscal 2009 was $0.7 million. There were no exercises during Fiscal 2008 and Fiscal 2007.
Restricted shares are issued at a value no less than the fair market value of the common shares on the date of the grant, and vest in sixteen equal increments at the end of each quarter after date on which such shares were issued. There were 90,557 restricted shares issued during Fiscal 2009 and outstanding under the 2009 Plan as of December 26, 2009, all of which were granted at a share price of $15.11.
| 9. | Lease Commitments |
The Company has non-cancelable operating leases, which expire through 2029. The leases generally contain renewal options for periods ranging from 1 to 10 years and require the Company to pay costs such as real estate taxes and common area maintenance. Contingent rentals are paid based on a percentage of gross sales as defined by lease agreements. The following table provides the net rental expense for all operating leases (in thousands):
| Year Ended | ||||||||||||
| December 26, 2009 |
December 27, 2008 |
December 29, 2007 |
||||||||||
| Minimum rentals |
$ | 65,249 | $ | 55,602 | $ | 48,471 | ||||||
| Contingent rentals |
135 | 101 | 61 | |||||||||
| 65,384 | 55,703 | 48,532 | ||||||||||
| Less: Sublease rentals |
(170 | ) | (122 | ) | (142 | ) | ||||||
| Net rental expense |
$ | 65,214 | $ | 55,581 | $ | 48,390 | ||||||
F-21
Table of Contents
As of December 26, 2009, the Company’s lease commitments are as follows (in thousands):
| Fiscal year |
Total Operating Leases (1) | ||
| 2010 |
$ | 71,307 | |
| 2011 |
69,930 | ||
| 2012 |
67,237 | ||
| 2013 |
60,847 | ||
| 2014 |
50,805 | ||
| Thereafter |
115,836 | ||
| $ | 435,962 | ||
| (1) | The operating leases included in the above table do not include contingent rent based upon sales volume, which represented less than 1% of our minimum lease obligations during Fiscal 2009. In addition, the operating leases do not include common area maintenance costs or real estate taxes that are paid to the landlord during the year, which combined represented approximately 17.0% of our minimum lease obligations during Fiscal 2009. |
| 10. | Legal Proceedings |
Dwight Thompson v. The Vitamin Shoppe and Consolidated Actions. The Company reclassified its California store managers as non-exempt employees in January 2004. On February 25, 2005, plaintiff Dwight Thompson (“Thompson”), a former store manager, filed suit on behalf of himself and other “similarly situated” current and former California store managers and assistant store managers in the Superior Court of the State of California for the County of Orange (“Orange County Superior Court”), alleging causes of action for alleged wage and hour violations, unfair business practices, unfair competition under Cal. Bus. & Prof. Code §§ 17000 et seq. (“UCL”) and penalties under the Labor Code Private Attorneys General Act, Cal. Labor Code §§ 2698 et seq. (“PAGA”) (the “Thompson Action”). Almost one year later, on July 7, 2006, the same group of plaintiffs’ attorneys who were representing Thompson filed another wage and hour lawsuit against The Vitamin Shoppe based on substantively identical allegations in the Orange County Superior Court, entitled Estel v. The Vitamin Shoppe Industries Inc. (Case No. 06CC07852) (the “Estel Action”). Plaintiffs in the Estel Action were already class members in the Thompson Action. In January 2008, the Court consolidated the Thompson and Estel actions. In the consolidated complaint, Plaintiffs assert nine claims for relief against the Company: (1) failure to pay overtime wages; (2) unfair business practices in violation of Cal. Bus. & Prof. Code §§ 17000 et seq.; (3) conversion; (4) failure to provide meal periods; (5) failure to provide rest periods; (6) unfair competition under the UCL; (7) failure to provide itemized wage statements; (8) failure to provide wages and accrued vacation upon termination; and (9) recovery of civil penalties under PAGA. Plaintiffs purport to bring their UCL and PAGA claims as representative actions and the remaining claims on behalf of a class composed of all current and former assistant managers and managers of the Company who were employed on or after April 14, 2006 (the “Amended Thompson Action”). The Company intends to defend the Amended Thompson Action vigorously. At this time, the Company does not have sufficient information to determine the amount or range of any potential loss. Accordingly, as of December 26, 2009, the Company has not accrued any liabilities related to this litigation.
California District Attorney’s Letter. On May 17, 2007, the Company received a letter from the Napa County (California) District Attorney alleging that six of the Company’s private label products contain levels of lead that, pursuant to California’s Proposition 65, Cal. Health & Safety Code section 25249.5 et seq., (“Proposition 65”) require the products to bear a warning when sold in California. The letter claims that 12 other public prosecutors in California, including the California Attorney General, “are involved in a joint investigation of dietary supplements containing lead in amounts that expose users to lead in excess of 0.50 micrograms (ug) per day.” The letter demands that the Company immediately cease all sales of these products in California unless it provides a warning to consumers. It also notes that Proposition 65 provides for civil penalties of up to $2,500 per violation per day. The Company has met with the California Attorney General and certain District Attorneys,
F-22
Table of Contents
and is investigating these allegations and consulting with its third-party suppliers of these products. The Company has withdrawn certain named products from the California market and has provided warnings with respect to other products still available in California pending discussions with the public prosecutors. The Napa County District Attorney has expressed concerns on several occasions as to the method of warning employed by the Company and the completeness of its implementation. The Company has revised its warnings and reviewed its procedures for implementing warnings. The Company has responded to all outstanding requests for information and has met in person with representatives of the Napa County District Attorney and the California Attorney General to attempt to resolve this matter. As of December 26, 2009, the Company does not believe the financial statement impact of this matter will be material.
The People of the State of California v. 21st Century Healthcare, Inc. On October 22, 2008, a private enforcer named Vicky Hamilton sent over 70 manufacturers and retailers of multivitamin products, including the Company, various Sixty-Day Notices of Violation of Proposition 65, Cal. Health & Safety Code section 25249.5 et seq. alleging that certain products contain lead and lead compounds and were sold in California without a Proposition 65 warning and threatening litigation pertaining to two of the Company’s multivitamin products. On December 23, 2008, the California Attorney General and nine California District Attorneys filed a complaint on behalf of the People of the State of California against a number of companies who received notices of violation from Ms. Hamilton, including the Company in Alameda County Superior Court. The action alleges violations of both Proposition 65 and the UCL and supplants the litigation Ms. Hamilton sought to bring against the Company on the claims stated in her Notice of Violation. Penalties under Proposition 65 may be assessed at the maximum rate of $2,500 per violation per day. Penalties under the UCL may be assessed at the same rate and are cumulative to those available under Proposition 65. Injunctive relief and attorney’s fees are also available. The Company is investigating these claims and discussing them with the California Attorney General and District Attorneys. At this time it is premature to determine the extent of any potential loss. Accordingly, as of December 26, 2009, the Company has not accrued any liabilities related to this litigation.
J.C. Romero v. ErgoPharm Inc., Proviant Technologies Inc., VS Holdings Inc, d/b/a Vitamin Shoppe, and General Nutrition Centers Inc. On April 27, 2009, the plaintiff, a professional baseball player, filed a complaint against the Company, among others, in Superior Court of New Jersey (Law Division/Camden County). Plaintiff alleges that he purchased from one of the Company’s stores and consumed 6-OXO Extreme, which is manufactured by a third party, and in August 2008, allegedly tested positive for a banned substance. Plaintiff served a 50 game suspension imposed by Major League Baseball. The seven count complaint asserts, among other things, claims for negligence, strict liability, misrepresentation, breach of implied warranty and violations of the New Jersey Consumer Fraud Act, and seeks unspecified monetary damages. The Company denies any and all liability and intends to vigorously defend these claims. Any liabilities that may arise from this matter are not probable or reasonably estimable at this time. Accordingly, as of December 26, 2009, the Company has not accrued any liabilities related to this litigation.
The Company is party to various lawsuits arising from time to time in the normal course of business, many of which are covered by insurance. Except as described above, as of December 26, 2009, the Company was not party to any material legal proceedings. Although the impact of the final resolution of these matters on the Company’s financial condition, results of operations or cash flows is not known, management does not believe that the resolution of these lawsuits will have a material adverse effect on the financial condition, results of operations or liquidity of the Company.
| 11. | Related Party Transactions |
The Company had a management agreement with IPC Manager II, LLC (formerly Bear Stearns Merchant Manager II, LLC), which terminated on November 2, 2009, as a result of the IPO. This agreement provided for a quarterly fee of the greater of $187,500 or 0.25% of gross sales for the preceding fiscal quarter for advisory and consulting services. In addition, per the agreement a one-time termination fee of approximately $0.8 million was charged to expense during the fourth Fiscal quarter of 2009 in connection with the IPO. Amounts paid for the
F-23
Table of Contents
fiscal years ended December 26, 2009, December 27, 2008, and December 29, 2007 were approximately $2.4 million, $1.5 million, and $1.4 million, respectively.
In July 2008, the Company redeemed preferred shares held by the Company’s former Chief Executive Officer, for a value of approximately $562,000. The dollar value represented the redemption of 358 of Vitamin Shoppe, Inc.’s preferred shares including the associated preferred dividends in arrears held by the Company’s former Chief Executive Officer.
The Company loaned $1.5 million to the Company’s former Chief Executive Officer as part of a purchase of VSI stock, of which the Company had recourse on $375,000. The note incurred interest at 3.06% annually. In connection with the Merger on October 27, 2009, this $1.5 million note receivable along with a related accrued interest receivable of approximately $0.3 million, which was held by VS Parent, Inc. prior to the Merger, was extinguished in consideration of the surrender of 140,507 common shares and 634 preferred shares of VS Parent.
| 12. | Segment Data |
The Company currently operates two business segments, retail and direct. The operating segments are segments of the Company for which separate financial information is available and for which operating results are evaluated regularly by executive management in deciding how to allocate resources and in assessing performance. The Company’s management evaluates segment operating results based on several indicators. The primary key performance indicators are sales and operating income for each segment. The table below represents key financial information for each of the Company’s business segments, retail and direct, as well as corporate costs. The retail segment includes the Company’s retail stores. The retail segment generates revenue primarily through the sale of third-party branded and proprietary branded vitamins, minerals, herbs, specialty supplements, sports nutrition and other health and wellness products through retail stores throughout the United States. The direct segment generates revenue through the sale of third-party branded and proprietary branded vitamins, minerals, herbs, specialty supplements, sports nutrition and other health and wellness products through the Company’s Websites and its catalog. A catalog is mailed each month to customers in the Company’s Healthy Awards Program database, and the Company’s website at www.vitaminshoppe.com offers its customers online access to a full assortment of over 20,000 SKUs. Corporate costs represent the Company’s administrative expenses which include, but are not limited to human resources, legal, finance, information technology, depreciation and amortization, and various other corporate level activity related expenses. There are no inter-segment sales transactions.
The Company’s segments are designed to allocate resources internally and provide a framework to determine management responsibility. The Company has allocated $131.9 million and $45.3 million of its recorded goodwill to the retail and direct segments, respectively. The Company does not have identifiable assets separated by segment.
The following table contains key financial information of the Company’s business segments (in thousands):
| Year Ended | ||||||||||||
| December 26, 2009 |
December 27, 2008 |
December 29, 2007 |
||||||||||
| Net Sales: |
||||||||||||
| Retail |
$ | 596,253 | $ | 522,541 | $ | 461,979 | ||||||
| Direct |
78,242 | 78,999 | 75,893 | |||||||||
| Total net sales |
674,495 | 601,540 | 537,872 | |||||||||
| Income from operations: |
||||||||||||
| Retail |
94,494 | 80,422 | 71,199 | |||||||||
| Direct |
15,126 | 14,884 | 13,953 | |||||||||
| Corporate costs |
(68,288 | ) | (59,661 | ) | (52,535 | ) | ||||||
| Income from operations |
$ | 41,332 | $ | 35,645 | $ | 32,617 | ||||||
F-24
Table of Contents
| 13. | Fair Value of Financial Instruments |
The fair value of the Company’s Notes have been determined by the Company using quoted market prices. The following table sets forth the carrying amounts and fair values of the Company’s Notes at December 26, 2009 and December 27, 2008 (in thousands):
| December 26, 2009 | December 27, 2008 | |||||||||||
| Carrying Amount |
Fair Value | Carrying Amount |
Fair Value | |||||||||
| Second Priority Senior Secured Floating Rate Notes |
$ | 120,106 | $ | 120,669 | $ | 165,000 | $ | 103,950 | ||||
The fair value for December 26, 2009, is based on the last trade closest to that date which is December 23, 2009. The fair value for December 27, 2008, was based on December 30, 2008 trade information, as that was the closest trade to the Company’s 2008 Fiscal year end.
Prior to its termination, the Company had an interest rate swap which was established as a cash flow hedge on a portion of its Notes to offset fluctuations related to the variable rate interest payments as described in Note 6. The unrecognized loss related to the interest rate swap is included in accumulated other comprehensive loss in the consolidated balance sheets. The swap was previously categorized within Level 2 in the fair value hierarchy. For the fiscal year ended December 26, 2009, approximately $1.4 million, was reclassified from accumulated other comprehensive loss to earnings (as a component of interest expense). The Company expects approximately $0.9 million of unrealized losses, net of taxes, that are reported in accumulated other comprehensive loss as of December 26, 2009 to be reclassified into earnings within the next 12 months along with the reclassification of the related deferred tax assets.
| 14. | Subsequent Events |
During January 2010, the Company completed its tender offer for the redemption of $20.0 million of its outstanding Notes, which resulted in a charge to extinguishment of debt of approximately $0.6 million.
| 15. | Supplemental Guarantor Information |
The payment obligations of Industries under the Senior Notes due 2012 are jointly and severally and fully and unconditionally guaranteed on a senior basis by: VSI, the parent company; Direct, the only subsidiary; and all of the Industries’ future restricted domestic subsidiaries. The Notes and the guarantees will be VSI’s, Industries’ and Direct’s second priority senior secured obligations. They rank equally with all of the Company’s existing and future senior indebtedness and rank senior to all of the Company’s existing and future subordinated indebtedness. The Notes and the guarantees are effectively subordinated to all of the Company’s existing first priority senior secured indebtedness, to the extent of the collateral securing such indebtedness, including indebtedness under the Credit Facility.
The indenture governing the Notes restrict the ability of Industries and Direct to incur additional debt, pay dividends and make distributions, make certain investments, repurchase stock, incur liens, enter into transactions with affiliates, enter into sale and lease back transactions, merge, or consolidate or transfer or sell assets.
The following supplemental financial information sets forth, on a consolidating basis, balance sheets, statements of operations, and statements of cash flows for Vitamin Shoppe, Inc. and the Company’s guarantor subsidiary.
F-25
Table of Contents
VITAMIN SHOPPE, INC. AND SUBSIDIARY
CONSOLIDATING BALANCE SHEET AS OF DECEMBER 26, 2009
(In thousands, except share data)
| Vitamin Shoppe, Inc. |
VS Direct | Vitamin Shoppe Industries Inc. |
Eliminations | Consolidated | |||||||||||||||
| ASSETS | |||||||||||||||||||
| Current assets: |
|||||||||||||||||||
| Cash and cash equivalents |
$ | 1,767 | $ | 917 | $ | 6,113 | $ | — | $ | 8,797 | |||||||||
| Inventories |
— | 17,510 | 88,581 | — | 106,091 | ||||||||||||||
| Prepaid expenses and other current assets |
— | 208 | 13,193 | 13,401 | |||||||||||||||
| Intercompany receivable |
47,444 | 292,145 | 262,745 | (602,334 | ) | — | |||||||||||||
| Deferred income taxes |
— | 723 | 4,422 | — | 5,145 | ||||||||||||||
| Total current assets |
49,211 | 311,503 | 375,054 | (602,334 | ) | 133,434 | |||||||||||||
| Property and equipment, net |
— | 21,869 | 62,091 | — | 83,960 | ||||||||||||||
| Goodwill |
— | — | 177,248 | — | 177,248 | ||||||||||||||
| Other intangibles, net |
— | — | 70,356 | — | 70,356 | ||||||||||||||
| Other assets: |
|||||||||||||||||||
| Deferred financing fees, net of accumulated amortization of $2,856 |
— | — | 2,384 | — | 2,384 | ||||||||||||||
| Other |
— | 2 | 1,873 | — | 1,875 | ||||||||||||||
| Deferred income tax asset |
3,741 | 1,969 | 15,844 | (21,554 | ) | — | |||||||||||||
| Total other assets |
3,741 | 1,971 | 20,101 | (21,554 | ) | 4,259 | |||||||||||||
| Investment in Subsidiary |
200,051 | — | 54,533 | (254,584 | ) | — | |||||||||||||
| Total assets |
$ | 253,003 | $ | 335,343 | $ | 759,383 | $ | (878,472 | ) | $ | 469,257 | ||||||||
| LIABILITIES AND STOCKHOLDERS’ EQUITY | |||||||||||||||||||
| Current liabilities: |
|||||||||||||||||||
| Current portion of long-term debt |
$ | — | $ | — | $ | 20,000 | $ | — | $ | 20,000 | |||||||||
| Current portion of capital lease obligation |
— | — | 1,537 | — | 1,537 | ||||||||||||||
| Revolving credit facility |
— | — | — | — | — | ||||||||||||||
| Intercompany payable |
17,400 | 269,225 | 315,709 | (602,334 | ) | — | |||||||||||||
| Accounts payable |
— | 166 | 24,909 | — | 25,075 | ||||||||||||||
| Deferred sales |
— | 2,596 | 11,790 | — | 14,386 | ||||||||||||||
| Accrued salaries and related expenses |
— | 716 | 6,835 | — | 7,551 | ||||||||||||||
| Other accrued expenses |
803 | 953 | 12,713 | — | 14,469 | ||||||||||||||
| Total current liabilities |
18,203 | 273,656 | 393,493 | (602,334 | ) | 83,018 | |||||||||||||
| Long-term debt |
— | — | 100,106 | — | 100,106 | ||||||||||||||
| Capital lease obligation, net of current portion |
— | — | 2,303 | — | 2,303 | ||||||||||||||
| Deferred income taxes |
449 | 3,020 | 38,030 | (21,554 | ) | 19,945 | |||||||||||||
| Other long term liabilities |
— | 4 | 4,762 | — | 4,766 | ||||||||||||||
| Deferred rent |
— | 4,130 | 20,638 | — | 24,768 | ||||||||||||||
| Commitments and contingencies |
|||||||||||||||||||
| Stockholders’ equity: |
|||||||||||||||||||
| Common stock, $0.01 par value, 400,000,000 shares authorized, 26,750,423 shares issued and outstanding |
268 | — | — | — | 268 | ||||||||||||||
| Additional paid-in capital |
210,359 | 20,165 | 166,791 | (186,956 | ) | 210,359 | |||||||||||||
| Accumulated other comprehensive loss |
(882 | ) | — | (882 | ) | 882 | (882 | ) | |||||||||||
| Retained earnings |
24,606 | 34,368 | 34,142 | (68,510 | ) | 24,606 | |||||||||||||
| Total stockholders’ equity |
234,351 | 54,533 | 200,051 | (254,584 | ) | 234,351 | |||||||||||||
| Total liabilities and stockholders’ equity |
$ | 253,003 | $ | 335,343 | $ | 759,383 | $ | (878,472 | ) | $ | 469,257 | ||||||||
F-26
Table of Contents
VITAMIN SHOPPE, INC. AND SUBSIDIARY
CONSOLIDATING BALANCE SHEET AS OF DECEMBER 27, 2008
(In thousands, except share data)
| Vitamin Shoppe, Inc. |
VS Direct |
Vitamin Shoppe Industries Inc. |
Eliminations | Consolidated | |||||||||||||||
| ASSETS | |||||||||||||||||||
| Current assets: |
|||||||||||||||||||
| Cash and cash equivalents |
$ | — | $ | 841 | $ | 782 | $ | — | $ | 1,623 | |||||||||
| Inventories |
— | 17,547 | 89,344 | — | 106,891 | ||||||||||||||
| Prepaid expenses and other current assets |
— | 198 | 12,807 | 13,005 | |||||||||||||||
| Intercompany receivable |
2 | 284,763 | 317,857 | (602,622 | ) | — | |||||||||||||
| Deferred income taxes |
— | 707 | 4,043 | — | 4,750 | ||||||||||||||
| Total current assets |
2 | 304,056 | 424,833 | (602,622 | ) | 126,269 | |||||||||||||
| Property and equipment, net |
— | 21,399 | 61,590 | — | 82,989 | ||||||||||||||
| Goodwill |
— | — | 177,248 | — | 177,248 | ||||||||||||||
| Other intangibles, net |
— | — | 71,088 | — | 71,088 | ||||||||||||||
| Other assets: |
|||||||||||||||||||
| Deferred financing fees, net of accumulated amortization of $3,536 |
— | — | 4,097 | — | 4,097 | ||||||||||||||
| Other |
302 | — | 1,712 | — | 2,014 | ||||||||||||||
| Deferred income tax asset |
2,218 | 1,873 | 12,816 | (16,907 | ) | — | |||||||||||||
| Total other assets |
2,520 | 1,873 | 18,625 | (16,907 | ) | 6,111 | |||||||||||||
| Investment in Subsidiary |
183,972 | — | 47,628 | (231,600 | ) | — | |||||||||||||
| Total assets |
$ | 186,494 | $ | 327,328 | $ | 801,012 | $ | (851,129 | ) | $ | 463,705 | ||||||||
| LIABILITIES AND STOCKHOLDERS’ EQUITY | |||||||||||||||||||
| Current liabilities: |
|||||||||||||||||||
| Current portion of capital lease obligation |
$ | — | $ | — | $ | 1,111 | $ | — | $ | 1,111 | |||||||||
| Revolving credit facility |
— | — | 17,000 | — | 17,000 | ||||||||||||||
| Intercompany payable |
17,687 | 269,225 | 315,710 | (602,622 | ) | — | |||||||||||||
| Accounts payable |
— | 102 | 24,246 | — | 24,348 | ||||||||||||||
| Deferred sales |
— | 2,538 | 10,501 | — | 13,039 | ||||||||||||||
| Accrued salaries and related expenses |
— | 142 | 5,312 | — | 5,454 | ||||||||||||||
| Other accrued expenses |
91 | 708 | 12,233 | — | 13,032 | ||||||||||||||
| Total current liabilities |
17,778 | 272,715 | 386,113 | (602,622 | ) | 73,984 | |||||||||||||
| Long-term debt |
— | — | 165,000 | — | 165,000 | ||||||||||||||
| Capital lease obligation, net of current portion |
— | — | 3,271 | — | 3,271 | ||||||||||||||
| Deferred income taxes |
233 | 3,209 | 36,828 | (16,907 | ) | 23,363 | |||||||||||||
| Other long term liabilities |
— | — | 8,721 | — | 8,721 | ||||||||||||||
| Deferred rent |
— | 3,776 | 17,107 | — | 20,883 | ||||||||||||||
| Commitments and contingencies |
|||||||||||||||||||
| Stockholders’ equity: |
|||||||||||||||||||
| Preferred stock $0.01 par value; authorized 500,000 shares; Series A shares issued and outstanding 79,502 (aggregate liquidation preference $128,844) |
1 | 1 | |||||||||||||||||
| Common stock, $0.01 par value, authorized 20,471,966 shares, 14,175,906 shares issued and outstanding |
142 | 142 | |||||||||||||||||
| Additional paid-in capital |
154,848 | 20,165 | 166,791 | (186,956 | ) | 154,848 | |||||||||||||
| Warrants |
5,666 | 5,666 | |||||||||||||||||
| Note receivable due from officer |
(1,500 | ) | (1,500 | ) | |||||||||||||||
| Accumulated other comprehensive loss |
(2,614 | ) | — | (2,614 | ) | 2,614 | (2,614 | ) | |||||||||||
| Retained earnings |
11,940 | 27,463 | 19,795 | (47,258 | ) | 11,940 | |||||||||||||
| Total stockholders’ equity |
168,483 | 47,628 | 183,972 | (231,600 | ) | 168,483 | |||||||||||||
| Total liabilities and stockholders’ equity |
$ | 186,494 | $ | 327,328 | $ | 801,012 | $ | (851,129 | ) | $ | 463,705 | ||||||||
F-27
Table of Contents
VITAMIN SHOPPE, INC. AND SUBSIDIARY
CONSOLIDATING STATEMENT OF OPERATIONS FOR THE YEAR ENDED DECEMBER 26, 2009
(In thousands)
| Vitamin Shoppe, Inc. |
VS Direct | Vitamin Shoppe Industries Inc. |
Eliminations | Consolidated | |||||||||||||||
| Net sales |
$ | — | $ | 133,216 | $ | 541,279 | $ | — | $ | 674,495 | |||||||||
| Commissions |
— | 18,622 | 7,723 | (26,345 | ) | — | |||||||||||||
| Cost of goods sold |
— | 96,079 | 366,759 | (5,265 | ) | 457,573 | |||||||||||||
| Gross profit |
— | 55,759 | 182,243 | (21,080 | ) | 216,922 | |||||||||||||
| Selling, general and administrative expenses |
3,052 | 43,994 | 147,178 | (21,080 | ) | 173,144 | |||||||||||||
| Related party expenses |
— | — | 2,446 | — | 2,446 | ||||||||||||||
| (Loss) income from operations |
(3,052 | ) | 11,765 | 32,619 | — | 41,332 | |||||||||||||
| Loss on extinguishment of debt |
— | — | 2,016 | — | 2,016 | ||||||||||||||
| Interest income |
(39 | ) | — | (4 | ) | — | (43 | ) | |||||||||||
| Interest expense |
— | 1,101 | 17,578 | — | 18,679 | ||||||||||||||
| (Loss) income before (benefit) provision for income taxes |
(3,013 | ) | 10,664 | 13,029 | — | 20,680 | |||||||||||||
| (Benefit) provision from income taxes |
(1,333 | ) | 3,759 | 5,588 | — | 8,014 | |||||||||||||
| (Loss) income before equity in net earnings of subsidiary |
(1,680 | ) | 6,905 | 7,441 | — | 12,666 | |||||||||||||
| Equity in net earnings of subsidiary |
14,346 | — | 6,905 | (21,251 | ) | — | |||||||||||||
| Net income |
$ | 12,666 | $ | 6,905 | $ | 14,346 | $ | (21,251 | ) | $ | 12,666 | ||||||||
F-28
Table of Contents
VITAMIN SHOPPE, INC. AND SUBSIDIARY
CONSOLIDATING STATEMENT OF OPERATIONS FOR THE YEAR ENDED DECEMBER 27, 2008
(In thousands)
| Vitamin Shoppe, Inc. |
VS Direct | Vitamin Shoppe Industries Inc. |
Eliminations | Consolidated | ||||||||||||||||
| Net sales |
$ | — | $ | 112,864 | $ | 488,676 | $ | — | $ | 601,540 | ||||||||||
| Commissions |
— | 25,776 | 6,924 | (32,700 | ) | — | ||||||||||||||
| Cost of goods sold |
— | 80,890 | 329,368 | (4,599 | ) | 405,659 | ||||||||||||||
| Gross profit |
— | 57,750 | 166,232 | (28,101 | ) | 195,881 | ||||||||||||||
| Selling, general and administrative expenses |
2,448 | 40,257 | 144,109 | (28,101 | ) | 158,713 | ||||||||||||||
| Related party expenses |
— | — | 1,523 | 1,523 | ||||||||||||||||
| (Loss) income from operations |
(2,448 | ) | 17,493 | 20,600 | — | 35,645 | ||||||||||||||
| Interest income |
(54 | ) | (10 | ) | (52 | ) | — | (116 | ) | |||||||||||
| Interest expense |
— | 3,249 | 18,004 | — | 21,253 | |||||||||||||||
| (Loss) income before (benefit) provision for income taxes |
(2,394 | ) | 14,254 | 2,648 | — | 14,508 | ||||||||||||||
| (Benefit) provision from income taxes |
(1,048 | ) | 5,331 | 2,058 | — | 6,341 | ||||||||||||||
| (Loss) income before equity in net earnings of subsidiary |
(1,346 | ) | 8,923 | 590 | — | 8,167 | ||||||||||||||
| Equity in net earnings of subsidiary |
9,513 | — | 8,923 | (18,436 | ) | — | ||||||||||||||
| Net income |
$ | 8,167 | $ | 8,923 | $ | 9,513 | $ | (18,436 | ) | $ | 8,167 | |||||||||
F-29
Table of Contents
VITAMIN SHOPPE, INC. AND SUBSIDIARY
CONSOLIDATING STATEMENT OF OPERATIONS FOR THE YEAR ENDED DECEMBER 29, 2007
(In thousands)
| Vitamin Shoppe, Inc. |
VS Direct |
Vitamin Shoppe Industries Inc. |
Eliminations | Consolidated | ||||||||||||||||
| Net sales |
$ | — | $ | 97,218 | $ | 440,654 | $ | — | $ | 537,872 | ||||||||||
| Commissions |
— | 24,786 | 6,056 | (30,842 | ) | — | ||||||||||||||
| Cost of goods sold |
— | 69,071 | 295,142 | (3,867 | ) | 360,346 | ||||||||||||||
| Gross profit |
— | 52,933 | 151,568 | (26,975 | ) | 177,526 | ||||||||||||||
| Selling, general and administrative expenses |
1,638 | 37,039 | 131,842 | (26,975 | ) | 143,544 | ||||||||||||||
| Related party expenses |
— | — | 1,365 | 1,365 | ||||||||||||||||
| (Loss) income from operations |
(1,638 | ) | 15,894 | 18,361 | — | 32,617 | ||||||||||||||
| Interest income |
(61 | ) | (10 | ) | (224 | ) | — | (295 | ) | |||||||||||
| Interest expense |
— | 3,072 | 19,268 | — | 22,340 | |||||||||||||||
| (Loss) income before (benefit) provision for income taxes |
(1,577 | ) | 12,832 | (683 | ) | — | 10,572 | |||||||||||||
| (Benefit) provision from income taxes |
(679 | ) | 4,922 | (451 | ) | — | 3,792 | |||||||||||||
| (Loss) income before equity in net earnings of subsidiary |
(898 | ) | 7,910 | (232 | ) | — | 6,780 | |||||||||||||
| Equity in net earnings of subsidiary |
7,678 | — | 7,910 | (15,588 | ) | — | ||||||||||||||
| Net income |
$ | 6,780 | $ | 7,910 | $ | 7,678 | $ | (15,588 | ) | $ | 6,780 | |||||||||
F-30
Table of Contents
VITAMIN SHOPPE, INC. AND SUBSIDIARY
CONSOLIDATING STATEMENT OF CASH FLOWS FOR THE YEAR ENDED DECEMBER 26, 2009
(In thousands)
| Vitamin Shoppe, Inc. |
VS Direct | Vitamin Shoppe Industries Inc. |
Eliminations | Consolidated | ||||||||||||||||
| Cash flows from operating activities: |
||||||||||||||||||||
| Net income |
$ | 12,666 | $ | 6,905 | $ | 14,346 | $ | (21,251 | ) | $ | 12,666 | |||||||||
| Adjustments to reconcile net income to net cash (used in) provided by operating activities: |
||||||||||||||||||||
| Depreciation and amortization of fixed and intangible assets |
— | 4,767 | 16,328 | — | 21,095 | |||||||||||||||
| Amortization of deferred financing fees |
— | — | 1,227 | — | 1,227 | |||||||||||||||
| Loss on extinguishment of debt, net of premium on Note redemption |
— | — | 1,568 | — | 1,568 | |||||||||||||||
| Loss on disposal of fixed assets |
— | 9 | 121 | — | 130 | |||||||||||||||
| Amortization of swap |
— | — | 565 | — | 565 | |||||||||||||||
| Deferred income taxes |
(1,307 | ) | (301 | ) | (3,387 | ) | — | (4,995 | ) | |||||||||||
| Deferred rent |
— | 354 | 2,687 | — | 3,041 | |||||||||||||||
| Equity compensation expense |
3,040 | — | — | — | 3,040 | |||||||||||||||
| Tax benefits on exercise of stock options |
— | — | (352 | ) | — | (352 | ) | |||||||||||||
| Equity in earnings of subsidiary |
(14,346 | ) | — | (6,905 | ) | 21,251 | — | |||||||||||||
| Changes in operating assets and liabilities: |
||||||||||||||||||||
| Inventories |
— | 37 | 763 | — | 800 | |||||||||||||||
| Prepaid expenses and other current assets |
— | (10 | ) | 810 | — | 800 | ||||||||||||||
| Intercompany |
(47,442 | ) | (7,382 | ) | 54,824 | — | — | |||||||||||||
| Other non-current assets |
— | (2 | ) | (215 | ) | — | (217 | ) | ||||||||||||
| Accounts payable |
— | 64 | 1,272 | — | 1,336 | |||||||||||||||
| Accrued expenses and other current liabilities |
389 | 877 | 3,634 | — | 4,900 | |||||||||||||||
| Other long-term liabilities |
— | 4 | (2,174 | ) | — | (2,170 | ) | |||||||||||||
| Net cash (used in) provided by operating activities |
(47,000 | ) | 5,322 | 85,112 | — | 43,434 | ||||||||||||||
| Cash flows from investing activities: |
||||||||||||||||||||
| Capital expenditures |
— | (5,246 | ) | (15,998 | ) | — | (21,244 | ) | ||||||||||||
| Trademarks and other intangible assets |
— | — | (37 | ) | — | (37 | ) | |||||||||||||
| Net cash used in investing activities |
— | (5,246 | ) | (16,035 | ) | — | (21,281 | ) | ||||||||||||
| Cash flows from financing activities: |
||||||||||||||||||||
| Borrowings under revolving credit agreement |
— | — | 8,594 | — | 8,594 | |||||||||||||||
| Repayment of borrowings under revolving credit agreement |
— | — | (25,594 | ) | — | (25,594 | ) | |||||||||||||
| Payments of capital lease obligation |
— | — | (1,334 | ) | — | (1,334 | ) | |||||||||||||
| Redemption of long term debt (Notes) |
— | — | (44,894 | ) | — | (44,894 | ) | |||||||||||||
| Payments of accumulated preferred dividends in arrears |
(72,535 | ) | — | — | — | (72,535 | ) | |||||||||||||
| Proceeds from issuance of common stock |
755 | — | — | — | 755 | |||||||||||||||
| Proceeds from issuance of common stock during offering, net |
121,209 | — | — | — | 121,209 | |||||||||||||||
| Payments for expenses related to the offering |
(1,700 | ) | — | — | — | (1,700 | ) | |||||||||||||
| Proceeds from exercises of common stock options |
686 | — | — | — | 686 | |||||||||||||||
| Tax benefits on exercise of stock options |
352 | — | — | — | 352 | |||||||||||||||
| Deferred financing fees |
— | — | (518 | ) | — | (518 | ) | |||||||||||||
| Net cash provided by (used in) financing activities |
48,767 | — | (63,746 | ) | — | (14,979 | ) | |||||||||||||
| Net increase in cash and cash equivalents |
1,767 | 76 | 5,331 | — | 7,174 | |||||||||||||||
| Cash and cash equivalents beginning of year |
— | 841 | 782 | — | 1,623 | |||||||||||||||
| Cash and cash equivalents end of year |
$ | 1,767 | $ | 917 | $ | 6,113 | $ | — | $ | 8,797 | ||||||||||
F-31
Table of Contents
VITAMIN SHOPPE, INC. AND SUBSIDIARY
CONSOLIDATING STATEMENT OF CASH FLOWS FOR THE YEAR ENDED DECEMBER 27, 2008
(In thousands)
| Vitamin Shoppe, Inc. |
VS Direct | Vitamin Shoppe Industries Inc. |
Eliminations | Consolidated | ||||||||||||||||
| Cash flows from operating activities: |
||||||||||||||||||||
| Net income |
$ | 8,167 | $ | 8,923 | $ | 9,513 | $ | (18,436 | ) | $ | 8,167 | |||||||||
| Adjustments to reconcile net income to net cash provided by operating activities: |
||||||||||||||||||||
| Depreciation and amortization of fixed and intangible assets |
— | 3,651 | 13,832 | — | 17,483 | |||||||||||||||
| Amortization of deferred financing fees |
— | — | 1,168 | — | 1,168 | |||||||||||||||
| Loss on disposal of fixed assets |
— | 7 | 72 | — | 79 | |||||||||||||||
| Deferred income taxes |
(1,047 | ) | 638 | 1,104 | — | 695 | ||||||||||||||
| Deferred rent |
— | 1,217 | 2,230 | — | 3,447 | |||||||||||||||
| Equity compensation expense |
2,352 | — | — | — | 2,352 | |||||||||||||||
| Equity in earnings of subsidiary |
(9,513 | ) | — | (8,923 | ) | 18,436 | — | |||||||||||||
| Changes in operating assets and liabilities: |
||||||||||||||||||||
| Inventories |
— | (1,296 | ) | (7,786 | ) | — | (9,082 | ) | ||||||||||||
| Prepaid expenses and other current assets |
— | (110 | ) | 184 | — | 74 | ||||||||||||||
| Intercompany |
83 | (3,448 | ) | 3,365 | — | — | ||||||||||||||
| Other non-current assets |
(54 | ) | 20 | (61 | ) | — | (95 | ) | ||||||||||||
| Accounts payable |
— | (124 | ) | (10,784 | ) | — | (10,908 | ) | ||||||||||||
| Accrued expenses and other current liabilities |
12 | 868 | 4,764 | — | 5,644 | |||||||||||||||
| Other long-term liabilities |
— | — | 564 | — | 564 | |||||||||||||||
| Net cash provided by operating activities |
— | 10,346 | 9,242 | — | 19,588 | |||||||||||||||
| Cash flows from investing activities: |
||||||||||||||||||||
| Capital expenditures |
— | (10,072 | ) | (21,823 | ) | — | (31,895 | ) | ||||||||||||
| Trademarks and other intangible assets |
— | — | (3,494 | ) | — | (3,494 | ) | |||||||||||||
| Net cash used in investing activities |
— | (10,072 | ) | (25,317 | ) | — | (35,389 | ) | ||||||||||||
| Cash flows from financing activities: |
||||||||||||||||||||
| Borrowings under revolving credit agreement |
— | — | 20,000 | — | 20,000 | |||||||||||||||
| Repayment of borrowings under revolving credit agreement |
— | — | (3,000 | ) | — | (3,000 | ) | |||||||||||||
| Payments of accumulated preferred dividends in arrears |
— | — | (561 | ) | — | (561 | ) | |||||||||||||
| Payments of capital lease obligation |
— | — | (468 | ) | — | (468 | ) | |||||||||||||
| Deferred financing fees |
— | — | — | — | — | |||||||||||||||
| Net cash provided by financing activities |
— | — | 15,971 | — | 15,971 | |||||||||||||||
| Net increase (decrease) in cash and cash equivalents |
— | 274 | (104 | ) | — | 170 | ||||||||||||||
| Cash and cash equivalents beginning of year |
— | 567 | 886 | — | 1,453 | |||||||||||||||
| Cash and cash equivalents end of year |
$ | — | $ | 841 | $ | 782 | $ | — | $ | 1,623 | ||||||||||
F-32
Table of Contents
VITAMIN SHOPPE, INC. AND SUBSIDIARY
CONSOLIDATING STATEMENT OF CASH FLOWS FOR THE YEAR ENDED DECEMBER 29, 2007
(In thousands)
| Vitamin Shoppe, Inc. |
VS Direct | Vitamin Shoppe Industries Inc. |
Eliminations | Consolidated | ||||||||||||||||
| Cash flow from operating activities: |
||||||||||||||||||||
| Net income |
$ | 6,780 | $ | 7,910 | $ | 7,678 | $ | (15,588 | ) | $ | 6,780 | |||||||||
| Adjustments to reconcile net income to net cash provided by operating activities: |
||||||||||||||||||||
| Depreciation and amortization of fixed and intangible assets |
— | 2,450 | 12,432 | — | 14,882 | |||||||||||||||
| Amortization of deferred financing fees |
— | — | 1,162 | — | 1,162 | |||||||||||||||
| Loss on disposal of fixed assets |
— | 17 | 63 | — | 80 | |||||||||||||||
| Deferred income taxes |
(537 | ) | (65 | ) | 2,857 | — | 2,255 | |||||||||||||
| Deferred rent |
— | 859 | 1,348 | — | 2,207 | |||||||||||||||
| Equity compensation expense |
1,562 | — | — | — | 1,562 | |||||||||||||||
| Equity in earnings of subsidiary |
(7,678 | ) | — | (7,910 | ) | 15,588 | — | |||||||||||||
| Changes in operating assets and liabilities: |
||||||||||||||||||||
| Inventories |
— | (3,179 | ) | (12,455 | ) | — | (15,634 | ) | ||||||||||||
| Prepaid expenses and other current assets |
— | 11 | (814 | ) | — | (803 | ) | |||||||||||||
| Intercompany |
(72 | ) | (4,391 | ) | 4,463 | — | — | |||||||||||||
| Other non-current assets |
(61 | ) | — | 689 | — | 628 | ||||||||||||||
| Accounts payable |
— | 208 | 8,469 | — | 8,677 | |||||||||||||||
| Accrued expenses and other current liabilities |
6 | 199 | (1,727 | ) | — | (1,522 | ) | |||||||||||||
| Other long-term liabilities |
— | — | 344 | — | 344 | |||||||||||||||
| Net cash provided by operating activities |
— | 4,019 | 16,599 | — | 20,618 | |||||||||||||||
| Cash flow from investing activities: |
||||||||||||||||||||
| Capital expenditures |
— | (4,337 | ) | (9,737 | ) | — | (14,074 | ) | ||||||||||||
| Trademarks |
— | — | (18 | ) | — | (18 | ) | |||||||||||||
| Net cash used in investing activities |
— | (4,337 | ) | (9,755 | ) | — | (14,092 | ) | ||||||||||||
| Cash flow from financing activities: |
||||||||||||||||||||
| Borrowings under revolving credit agreement |
— | — | 4,000 | — | 4,000 | |||||||||||||||
| Repayment of borrowings under revolving credit agreement |
— | — | (10,500 | ) | — | (10,500 | ) | |||||||||||||
| Deferred financing fees |
— | — | (45 | ) | — | (45 | ) | |||||||||||||
| Net cash used in financing activities |
— | — | (6,545 | ) | — | (6,545 | ) | |||||||||||||
| Net increase (decrease) in cash and cash equivalents |
— | (318 | ) | 299 | — | (19 | ) | |||||||||||||
| Cash and cash equivalents beginning of year |
— | 885 | 587 | — | 1,472 | |||||||||||||||
| Cash and cash equivalents end of year |
$ | — | $ | 567 | $ | 886 | $ | — | $ | 1,453 | ||||||||||
F-33
Table of Contents
17. Selected Quarterly Financial Information (unaudited)
The following table summarizes the 2009 and 2008 quarterly results:
| Quarter Ended | ||||||||||||
| March | June | September | December* | |||||||||
| Year Ended December 26, 2009 |
||||||||||||
| Total revenues |
$ | 172,555 | $ | 171,143 | $ | 168,400 | $ | 162,397 | ||||
| Gross profit |
57,012 | 55,762 | 52,389 | 51,759 | ||||||||
| Income from operations |
12,701 | 12,144 | 8,506 | 7,981 | ||||||||
| Net income |
4,562 | 4,206 | 2,035 | 1,863 | ||||||||
| Weighted average shares outstanding: |
||||||||||||
| Basic |
14,175,906 | 14,175,906 | 14,175,906 | 22,455,694 | ||||||||
| Diluted |
15,969,484 | 15,670,533 | 15,789,680 | 23,607,922 | ||||||||
| Year Ended December 27, 2008 |
||||||||||||
| Total revenues |
$ | 153,737 | $ | 153,354 | $ | 151,318 | $ | 143,131 | ||||
| Gross profit |
50,753 | 49,547 | 49,684 | 45,897 | ||||||||
| Income from operations |
11,264 | 8,708 | 8,900 | 6,773 | ||||||||
| Net income |
3,609 | 2,007 | 1,955 | 596 | ||||||||
| Weighted average shares outstanding: |
||||||||||||
| Basic |
14,175,906 | 14,175,906 | 14,175,906 | 14,175,906 | ||||||||
| Diluted |
15,802,889 | 14,175,906 | 15,761,821 | 14,175,906 | ||||||||
| * | Results for the fourth fiscal quarter of 2009 include the following: charges to extinguishment of debt related to the redemption of a portion of the Notes of approximately $1.7 million, related party fees of approximately $0.8 million due to the termination of a management services agreement with IPC, and a tax benefit of approximately $0.5 million related to uncertain tax positions. |
F-34
Table of Contents
VITAMIN SHOPPE, INC. AND SUBSIDIARY
CONDENSED CONSOLIDATED BALANCE SHEETS
(In thousands, except share data)
(Unaudited)
| March 27, 2010 |
December 26, 2009 |
|||||||
| ASSETS | ||||||||
| Current assets: |
||||||||
| Cash and cash equivalents |
$ | 12,162 | $ | 8,797 | ||||
| Inventories |
112,457 | 106,091 | ||||||
| Prepaid expenses and other current assets |
13,446 | 13,401 | ||||||
| Deferred income taxes |
3,086 | 5,145 | ||||||
| Total current assets |
141,151 | 133,434 | ||||||
| Property and equipment, net |
83,455 | 83,960 | ||||||
| Goodwill |
177,248 | 177,248 | ||||||
| Other intangibles, net |
70,165 | 70,356 | ||||||
| Other assets: |
||||||||
| Deferred financing fees, net of accumulated amortization of $2,678 and $2,856 in 2010 and 2009, respectively |
1,796 | 2,384 | ||||||
| Other long-term assets |
1,872 | 1,875 | ||||||
| Total other assets |
3,668 | 4,259 | ||||||
| Total assets |
$ | 475,687 | $ | 469,257 | ||||
| LIABILITIES AND STOCKHOLDERS’ EQUITY | ||||||||
| Current liabilities: |
||||||||
| Current portion of long-term debt |
$ | — | $ | 20,000 | ||||
| Current portion of capital lease obligation |
1,595 | 1,537 | ||||||
| Revolving credit facility |
20,000 | — | ||||||
| Accounts payable |
28,693 | 25,075 | ||||||
| Deferred sales |
5,504 | 14,386 | ||||||
| Accrued salaries and related expenses |
4,328 | 7,551 | ||||||
| Other accrued expenses |
18,580 | 14,469 | ||||||
| Total current liabilities |
78,700 | 83,018 | ||||||
| Long-term debt, net of current portion |
100,106 | 100,106 | ||||||
| Capital lease obligation, net of current portion |
1,953 | 2,303 | ||||||
| Deferred income taxes |
19,057 | 19,945 | ||||||
| Other long-term liabilities |
4,987 | 4,766 | ||||||
| Deferred rent |
25,648 | 24,768 | ||||||
| Commitments and contingencies |
||||||||
| Stockholders’ equity: |
||||||||
| Common stock, $0.01 par value; 400,000,000 shares authorized, 26,849,710 shares issued and outstanding at March 27, 2010, and 400,000,000 shares authorized, 26,750,423 shares issued and outstanding at December 26, 2009 |
268 | 268 | ||||||
| Additional paid-in capital |
212,171 | 210,359 | ||||||
| Accumulated other comprehensive loss |
(535 | ) | (882 | ) | ||||
| Retained earnings |
33,332 | 24,606 | ||||||
| Total stockholders’ equity |
245,236 | 234,351 | ||||||
| Total liabilities and stockholders’ equity |
$ | 475,687 | $ | 469,257 | ||||
See accompanying notes to condensed consolidated financial statements.
F-35
Table of Contents
VITAMIN SHOPPE, INC. AND SUBSIDIARY
CONDENSED CONSOLIDATED STATEMENTS OF OPERATIONS
(In thousands, except share and per share data)
(Unaudited)
| Three Months Ended | ||||||
| March 27, 2010 |
March 28, 2009 | |||||
| Net sales |
$ | 191,613 | $ | 172,555 | ||
| Cost of goods sold |
126,599 | 115,543 | ||||
| Gross profit |
65,014 | 57,012 | ||||
| Selling, general and administrative expenses |
46,942 | 43,941 | ||||
| Related party expenses |
— | 370 | ||||
| Income from operations |
18,072 | 12,701 | ||||
| Loss on extinguishment of debt |
552 | — | ||||
| Interest expense, net |
2,927 | 5,007 | ||||
| Income before provision for income taxes |
14,593 | 7,694 | ||||
| Provision for income taxes |
5,867 | 3,132 | ||||
| Net income |
8,726 | 4,562 | ||||
| Preferred stock dividends in arrears |
— | 2,577 | ||||
| Net income available to common stockholders |
$ | 8,726 | $ | 1,985 | ||
| Weighted average shares outstanding |
||||||
| Basic |
26,692,983 | 14,175,906 | ||||
| Diluted |
27,708,463 | 15,969,484 | ||||
| Net income per share |
||||||
| Basic |
$ | 0.33 | $ | 0.14 | ||
| Diluted |
$ | 0.31 | $ | 0.12 | ||
See accompanying notes to condensed consolidated financial statements.
F-36
Table of Contents
VITAMIN SHOPPE, INC. AND SUBSIDIARY
CONDENSED CONSOLIDATED STATEMENTS OF CASH FLOWS
(In thousands)
(Unaudited)
| Three Months Ended | ||||||||
| March 27, 2010 |
March 28, 2009 |
|||||||
| Cash flows from operating activities: |
||||||||
| Net income |
$ | 8,726 | $ | 4,562 | ||||
| Adjustments to reconcile net income to net cash provided by operating activities: |
||||||||
| Loss on extinguishment of debt |
552 | — | ||||||
| Loss on disposal of fixed assets |
2 | 1 | ||||||
| Depreciation and amortization of fixed and intangible assets |
5,414 | 5,078 | ||||||
| Amortization of deferred financing fees |
285 | 292 | ||||||
| Amortization of unrealized loss on terminated swap |
366 | — | ||||||
| Deferred income taxes |
930 | 608 | ||||||
| Deferred rent |
707 | 958 | ||||||
| Equity compensation expense |
809 | 628 | ||||||
| Tax benefits on exercises of stock options |
(403 | ) | — | |||||
| Changes in operating assets and liabilities: |
||||||||
| Inventories |
(6,366 | ) | 852 | |||||
| Prepaid expenses and other current assets |
531 | 343 | ||||||
| Other non-current assets |
3 | (9 | ) | |||||
| Accounts payable |
4,341 | 5,292 | ||||||
| Accrued expenses and other current liabilities |
(7,941 | ) | (9,823 | ) | ||||
| Other long-term liabilities |
222 | 48 | ||||||
| Net cash provided by operating activities |
8,178 | 8,830 | ||||||
| Cash flows from investing activities: |
||||||||
| Capital expenditures |
(5,408 | ) | (8,377 | ) | ||||
| Net cash used in investing activities |
(5,408 | ) | (8,377 | ) | ||||
| Cash flows from financing activities: |
||||||||
| Borrowings under revolving credit agreement |
20,000 | 3,000 | ||||||
| Repayments of borrowings under revolving credit agreement |
— | (3,000 | ) | |||||
| Payment of capital lease obligations |
(381 | ) | (290 | ) | ||||
| Redemption of long term debt (Notes) |
(20,000 | ) | — | |||||
| Payments for expenses related to the stock offering |
(87 | ) | — | |||||
| Proceeds from exercises of common stock options |
687 | — | ||||||
| Tax benefits on exercises of stock options |
403 | — | ||||||
| Deferred financing fees |
(27 | ) | — | |||||
| Net cash provided by (used in) financing activities |
595 | (290 | ) | |||||
| Net increase in cash and cash equivalents |
3,365 | 163 | ||||||
| Cash and cash equivalents beginning of period |
8,797 | 1,623 | ||||||
| Cash and cash equivalents end of period |
$ | 12,162 | $ | 1,786 | ||||
| Supplemental disclosures of cash flow information: |
||||||||
| Interest paid |
$ | 2,095 | $ | 4,687 | ||||
| Income taxes paid |
$ | 372 | $ | 2,035 | ||||
| Supplemental disclosures of non-cash investing activities: |
||||||||
| Accrued purchases of property and equipment |
$ | 802 | $ | 301 | ||||
| Assets acquired under capital lease |
$ | 89 | $ | 234 | ||||
See accompanying notes to condensed consolidated financial statements.
F-37
Table of Contents
VITAMIN SHOPPE, INC. AND SUBSIDIARY
CONDENSED CONSOLIDATED STATEMENT OF STOCKHOLDERS’ EQUITY
(in thousands, except share data)
| Common Stock | Additional Paid-In Capital |
Accumulated Other Comprehensive Loss |
Retained Earnings |
Total | ||||||||||||||||
| Shares | Amounts | |||||||||||||||||||
| Balance at December 26, 2009 |
26,750,423 | $ | 268 | $ | 210,359 | $ | (882 | ) | $ | 24,606 | $ | 234,351 | ||||||||
| Net income |
— | — | — | — | 8,726 | 8,726 | ||||||||||||||
| Interest rate swap, net of taxes of $246 |
— | — | — | 347 | — | 347 | ||||||||||||||
| Total Comprehensive Income |
9,073 | |||||||||||||||||||
| Expenses relating to the stock offering |
— | — | (87 | ) | — | — | (87 | ) | ||||||||||||
| Exercise of stock options |
— | — | 687 | — | — | 687 | ||||||||||||||
| Tax benefits on exercise of stock options |
— | — | 403 | — | — | 403 | ||||||||||||||
| Equity compensation expense |
— | — | 809 | — | — | 809 | ||||||||||||||
| Balance at March 27, 2010 |
26,750,423 | $ | 268 | $ | 212,171 | $ | (535 | ) | $ | 33,332 | $ | 245,236 | ||||||||
See accompanying notes to condensed consolidated financial statements.
F-38
Table of Contents
VITAMIN SHOPPE, INC. AND SUBSIDIARY
NOTES TO CONDENSED CONSOLIDATED FINANCIAL STATEMENTS (UNAUDITED)
| 1. | Basis of Presentation |
Vitamin Shoppe, Inc. (“VSI”), formerly VS Holdings, Inc., is incorporated in the State of Delaware, and through its wholly-owned subsidiary, Vitamin Shoppe Industries Inc. (“Subsidiary” or “Industries”) and Industries’ wholly-owned subsidiary, VS Direct Inc. (“Direct,” and, together with Industries and VSI, the “Company”), is a leading specialty retailer and direct marketer of nutritional products. Sales of both national brands and proprietary brands of vitamins, minerals, nutritional supplements, herbs, sports nutrition formulas, homeopathic remedies and other health and beauty aids are made through VSI-owned retail stores, the Internet and mail order catalogs to customers located primarily in the United States. VSI operates from its headquarters in North Bergen, New Jersey.
For the 2009 period presented, share and per share information in these condensed consolidated financial statements and the notes hereto have been adjusted to reflect the Company’s approximately 1.8611-for-one stock split effective on October 27, 2009, described in Note 2—Reorganization and Initial Public Offering, below.
The condensed consolidated financial statements as of March 27, 2010 and December 26, 2009, and for the three months ended March 27, 2010 and March 28, 2009, include the accounts of VSI, Industries and Direct. All significant intercompany transactions have been eliminated. The condensed consolidated financial statements as of March 27, 2010 and for the three months ended March 27, 2010 and March 28, 2009, are unaudited. In addition, certain information and footnote disclosures normally included in financial statements prepared in accordance with accounting principles generally accepted in the United States (“GAAP”) have been condensed or omitted. The interim financial statements reflect all adjustments, which are, in the opinion of management, necessary for a fair presentation in conformity with GAAP. The interim financial statements should be read in conjunction with the audited financial statements and notes thereto for the year ended December 26, 2009, as filed with the Securities and Exchange Commission on March 17, 2010. The results of operations for the interim periods should not be considered indicative of results to be expected for the full year.
The Company’s fiscal year ends on the last Saturday in December. As used herein, the term “Fiscal Year” or “Fiscal” refers to the 52-week period, ending the last Saturday in December. Fiscal 2010 is a 52-week period ending December 25, 2010 and Fiscal 2009 was a 52-week period ended December 26, 2009. The results for the three months ended March 27, 2010 and March 28, 2009, are each based on a 13-week period.
| 2. | Reorganization and Initial Public Offering |
On October 27, 2009, VS Parent, Inc. merged into VS Holdings, Inc., with VS Holdings being renamed, as Vitamin Shoppe, Inc (the “Merger”). All common shares and warrants previously issued by VS Parent, Inc., were converted to common shares of Vitamin Shoppe, Inc., at approximately a 1.8611-for-one split, resulting in 14,085,349 common shares and 1,055,540 warrants issued and outstanding at October 27, 2009. In addition 78,868 preferred shares were converted to preferred shares of Vitamin Shoppe, Inc.
On November 2, 2009, the Company completed an initial public offering (“IPO”), issuing 7,666,667 new common shares in connection with the IPO, at a price of $17 per share, resulting in net proceeds from the offering of approximately $121.2 million, net of underwriters commissions. Other fees associated with the IPO amounted to approximately $1.7 million, which were offset against the proceeds of the IPO. In connection with the IPO, 36,969 preferred shares previously held by VS Parent Inc., along with accumulated dividends in arrears, were converted into 3,764,720 common shares of Vitamin Shoppe, Inc., with the remaining 41,899 preferred shares being redeemed for cash of approximately $72.5 million.
F-39
Table of Contents
| 3. | Summary of Significant Accounting Policies |
Use of Estimates—The preparation of financial statements in conformity with GAAP requires management to make estimates and assumptions that affect the reported amounts of assets and liabilities, and disclosures of contingent assets and liabilities at the date of the financial statements, and revenue and expenses during the reporting period. Actual results could differ from those estimates.
Financial Instruments Policy—The Company entered into an interest rate swap during December 2005 on a portion of its Second Priority Senior Secured Floating Rate Notes due 2012 (the “Notes”), which was designated as a cash flow hedge. The interest rate swap had a maturity date of November 2010, and was terminated on September 25, 2009, at a cost of $2.6 million (the fair market value). The unamortized residual unrecognized loss of the interest rate swap resulting from the termination is recorded in accumulated other comprehensive loss in the amount of $0.9 million along with related deferred taxes of $0.6 million at December 26, 2009, and at March 27, 2010, the balance of the unamortized residual unrecognized loss recorded in other comprehensive loss was $0.5 million along with related deferred taxes of $0.4 million.
The amounts in both accumulated comprehensive loss and deferred tax assets relating to the unrecognized loss will amortize during Fiscal 2010 and be charged as a component of interest expense through November 2010, the remainder of the original term of the hedge. The Company does not engage in hedging activities for speculative purposes.
Advertising Costs—Costs associated with the production and distribution of the Company’s catalogs are expensed as incurred. The costs of advertising for online marketing arrangements, magazines, television and radio are expensed the first time the advertising takes place. Advertising expense was $3.7 million and $4.4 million for the three months ended March 27, 2010 and March 28, 2009, respectively.
Net Income Per Share—The Company’s basic net income per share excludes the dilutive effect of stock options, warrants and unvested restricted shares. It is based upon the weighted average number of common shares outstanding during the period divided into net income after deducting accumulated dividends on the Company’s Series A Preferred Stock, up until the preferred shares were either liquidated or converted to common shares.
Diluted net income per share reflects the potential dilution that would occur if securities or other contracts to issue common stock were exercised or converted into common stock. Stock options, warrants and unvested restricted shares are included as potential dilutive securities for the periods applicable, using the treasury stock method to the extent dilutive.
For the purposes of basic and diluted net income per share, as a result of the merger on October 27, 2009, weighted average shares outstanding for purposes of presenting net income per share on a comparative basis were retroactively restated for the three months ended March 28, 2009, based on a approximately a 1.8611-for-one split at the time of the merger.
F-40
Table of Contents
The components of the calculation of basic net income per common share and diluted net income per common share are as follows (in thousands except share and per share data):
| Three months ended | ||||||
| March 27, 2010 |
March 28, 2009 | |||||
| Numerator: |
||||||
| Net income available to common stockholders |
$ | 8,726 | $ | 1,985 | ||
| Denominator: |
||||||
| Basic weighted average common shares outstanding |
26,692,983 | 14,175,906 | ||||
| Effect of dilutive stock options, restricted stock and warrants: |
||||||
| Stock options |
990,485 | 738,038 | ||||
| Unvested restricted stock |
24,996 | — | ||||
| Warrants |
— | 1,055,540 | ||||
| Diluted weighted average common shares outstanding |
27,708,463 | 15,969,484 | ||||
| Basic net income per common share |
$ | 0.33 | $ | 0.14 | ||
| Diluted net income per common share |
$ | 0.31 | $ | 0.12 | ||
Stock options for the three months ended March 27, 2010 and March 28, 2009, in the amount of 522,232 grants and 436,784 grants, respectively, have been excluded from the above calculation as they were anti-dilutive.
Recent Accounting Pronouncements—The Company has considered all new accounting pronouncements and has concluded that there are no new pronouncements that may have a material impact on results of operations, financial condition, or cash flows, based on current information.
| 4. | Goodwill and Intangible Assets |
The Company acquired $88.0 million of intangible assets and recorded $177.2 million of goodwill in an acquisition completed in Fiscal 2002. The Company also acquired $3.0 million of intangible assets related to asset purchases in Fiscal 2008, comprised primarily of operating leases and the acquisition of a tradename. Other intangible assets relating to asset purchases during Fiscal 2008 include customer lists and non-compete agreements.
The following table discloses the carrying value of all intangible assets (in thousands):
| March 27, 2010 | December 26, 2009 | |||||||||||||||||
| Gross Carrying Amount |
Accumulated Amortization |
Net | Gross Carrying Amount |
Accumulated Amortization |
Net | |||||||||||||
| Intangible assets: |
||||||||||||||||||
| Intangibles related to asset purchase |
$ | 3,000 | $ | 1,589 | $ | 1,411 | $ | 3,000 | $ | 1,398 | $ | 1,602 | ||||||
| Tradenames |
68,754 | — | 68,754 | 68,754 | — | 68,754 | ||||||||||||
| Goodwill |
177,248 | — | 177,248 | 177,248 | — | 177,248 | ||||||||||||
| $ | 249,002 | $ | 1,589 | $ | 247,413 | $ | 249,002 | $ | 1,398 | $ | 247,604 | |||||||
Intangible amortization expense for the three months ended March 27, 2010 was $0.2 million, and amortization expense for the three months ended March 28, 2009 was $0.2 million. Tradenames are not amortized, as they are determined to be intangible assets with indefinite lives. Tradenames and goodwill will be tested for impairment in the last quarter of Fiscal 2010 or whenever impairment indicators exist.
F-41
Table of Contents
The useful lives of the Company’s definite-lived intangible assets are between 1 to 7 years. The expected amortization expense on finite-lived intangible assets on the Company’s condensed consolidated balance sheet at March 27, 2010, is as follows (in thousands):
| Remainder of Fiscal 2010 |
$ | 537 | |
| Fiscal 2011 |
541 | ||
| Fiscal 2012 |
124 | ||
| Fiscal 2013 |
124 | ||
| Fiscal 2014 |
85 | ||
| $ | 1,411 | ||
| 5. | Property and Equipment |
Property and equipment consists of the following (in thousands):
| March 27. 2010 |
December 26, 2009 |
|||||||
| Furniture, fixtures and equipment |
$ | 101,821 | $ | 99,215 | ||||
| Leasehold improvements |
97,861 | 95,897 | ||||||
| Website development costs |
11,014 | 11,014 | ||||||
| 210,696 | 206,126 | |||||||
| Less: accumulated depreciation and amortization. |
(127,977 | ) | (123,123 | ) | ||||
| Subtotal |
82,719 | 83,003 | ||||||
| Construction in progress |
736 | 957 | ||||||
| $ | 83,455 | $ | 83,960 | |||||
Depreciation and amortization expense on property and equipment, including equipment recorded under capital leases, for the three months ended March 27, 2010 was $5.2 million, and for the three months ended March 28, 2009 was $4.9 million. Depreciation and amortization expense on property and equipment is recorded in selling, general and administrative expenses on the condensed consolidated statements of operations. Assets held under capital leases, which are classified under furniture, fixtures and equipment, were $4.0 million, net of accumulated depreciation of $3.1 million, at March 27, 2010, and $4.2 million, net of accumulated depreciation of $2.9 million, at December 26, 2009.
| 6. | Credit Arrangements |
Debt consists of the following (in thousands):
| March 27, 2010 |
December 26, 2009 | |||||
| Revolving Credit Facility |
$ | 20,000 | $ | — | ||
| Second Priority Senior Secured Floating Rate Notes (the “Notes”) |
$ | 100,106 | $ | 120,106 | ||
Second Priority Senior Secured Floating Rate Notes
During January 2010, the Company repurchased $20.0 million of its Notes. Interest on the Notes, which were issued in November 2005, is set at a per annum rate equal to a three month LIBOR plus 7.5%, which is reset quarterly on February 15, May 15, August 15 and November 15 of each year. The weighted average interest
F-42
Table of Contents
rate from December 26, 2009 through March 27, 2010 was 7.85%, and from December 27, 2008 through March 28, 2009 was 9.11% (Fiscal 2009 is presented exclusive of hedging activities). The Notes mature on November 15, 2012. Interest on overdue principal and interest and liquidated damages, if any, will accrue at a rate that is 1% higher than the applicable interest rate on the Notes. If Industries cannot make payments on the Notes when they are due, VSI and Industries’ only subsidiary, Direct (collectively, the “Guarantors”), have guaranteed the Notes and must make payments instead. The Notes and the guarantees are secured by a second priority security interest in substantially all of Industries’ and the Guarantors’ assets that secure Industries’ new first priority senior secured credit facility. The Notes and the guarantees are Industries’, and the Guarantors’ second priority senior secured obligations, and rank equally in right of payment with all of Industries’ and the Guarantors’ existing and future senior indebtedness and senior to all of Industries’ and the Guarantors’ existing and future subordinated indebtedness. The Notes and the guarantees are effectively subordinated to all of Industries’ and the Guarantors’ first priority senior secured indebtedness, including Industries’ new first priority senior secured credit facility, to the extent of the collateral securing such indebtedness. If Industries sells certain assets, issues equity or experiences specific kinds of changes in control, Industries must offer to repurchase the Notes. Since November 15, 2007, Industries has had the option to redeem some or all of the Notes. Industries used the proceeds from the sale of the Notes to repay all of its and VSI’s existing indebtedness and to pay related fees and expenses.
Revolving Credit Facilities
On November 15, 2005, the Company entered into a $50.0 million senior secured revolving credit facility, which was terminated on September 25, 2009.
2009 Revolving Credit Facility
On September 25, 2009, the Company entered into a new revolving credit facility (the “2009 Revolving Credit Facility”), and simultaneously terminated its existing credit facility. The terms of the 2009 Revolving Credit Facility extend through September, 2013, and allow the Company to borrow up to $50.0 million subject to the terms of the facility. Similar to the Company’s previous credit facility, the availability under the 2009 Revolving Credit Facility is subject to a borrowing base calculated on the value of certain accounts receivable from credit card companies as well as the inventory of Industries and Direct. The obligations thereunder are secured by a security interest in substantially all of the assets of VSI, Industries and Direct and VSI provided guarantees in respect of the Company’s obligations under the 2009 Revolving Credit Facility, and Industries and VSI have provided guarantees in respect of Direct’s obligations under the 2009 Revolving Credit Facility. The 2009 Revolving Credit Facility provides for affirmative and negative covenants affecting Industries, VSI and Direct. The 2009 Revolving Credit Facility restricts, among other things, the Company’s ability to incur indebtedness, create or permit liens on the Company’s assets, declare or pay dividends and make certain other restricted payments, consolidate, merge or recapitalize, acquire or sell assets, make certain investments, loans or other advances, enter into transactions with affiliates, change the line of business, and restricts the types of hedging activities can be entered into. The 2009 Revolving Credit Facility has a maturity date of September 2013. However, if not amended, the 2009 Revolving Credit Facility may terminate at August 15, 2012, if, prior to such date, a significant portion of the Notes has not been redeemed, as, at that date, the facility requires that the sum of all amounts owed under the Notes must be less than the sum of the Company’s cash and cash equivalents plus excess availability (as defined under the 2009 Revolving Credit Facility), subject to certain limitations. The largest amount borrowed at any given point during the first fiscal quarter of 2010 was $20.0 million. The unused available line of credit under the 2009 Revolving Credit Facility at March 27, 2010 was $29.1 million.
The borrowings under our 2009 Revolving Credit Facility accrue interest, at the Company’s option, at the rate per annum announced from time to time by the agent as its “prime rate,” or at a per annum rate equal to 2.50% above the adjusted Eurodollar rate. The weighted average interest rate for the 2009 revolving credit line from December 26, 2009 through March 27, 2010 was 2.74%.
F-43
Table of Contents
The borrowings under the terminated revolving credit facility accrued interest through September 25, 2009, at a per annum rate equal to between 1.25% and 1.75% (depending on excess availability) above the adjusted Eurodollar rate. The weighted average interest rate for the terminated revolving credit line from December 27, 2008 through March 28, 2009 was 2.82%.
Interest expense, net for the three months ended March 27, 2010 and March 28, 2009 consists of the following (in thousands):
| Three Months Ended | ||||||||
| March 27, 2010 |
March 28, 2009 |
|||||||
| Interest on the Notes |
$ | 2,430 | $ | 4,403 | ||||
| Amortization of deferred financing fees |
285 | 292 | ||||||
| Interest on the revolving credit facility and other |
215 | 313 | ||||||
| Interest income |
(3 | ) | (1 | ) | ||||
| Interest expense, net |
$ | 2,927 | $ | 5,007 | ||||
Capital Leases
The Company leases certain computer equipment under capital leases which expire through fiscal 2012. The following is a schedule of the future minimum lease payments under capital leases as of March 27, 2010 (in thousands):
| Remainder of Fiscal 2010 |
$ | 1,349 | |
| Fiscal 2011 |
1,642 | ||
| Fiscal 2012 |
848 | ||
| Total |
3,839 | ||
| Less amount representing interest |
291 | ||
| Present value of minimum lease payments |
3,548 | ||
| Less current portion of capital lease obligation |
1,595 | ||
| $ | 1,953 | ||
F-44
Table of Contents
| 7. | Stock-Based Compensation |
Stock Option Plans—In Fiscal 2002 the Company adopted a Stock Option Plan (the “2002 Plan”) for certain directors, officers, consultants and employees of the Company. The Company authorized the issuance of up to 2,046,041 shares of common stock. In June 2006, the 2002 Plan was amended and assigned to VS Parent, Inc. (the Company’s former parent) where it was adopted as the VS Parent, Inc. 2006 Stock Option Plan (the “2006 Plan”), converting all grants on a one-to-one basis for the right to receive a common share of VS Parent upon exercise. In connection with the Merger, the 2006 Plan was assigned to VSI where it was converted at approximately a 1.8611-for-one share split resulting in up to 3,807,862 common shares authorized for issuance. In addition to the 2006 Plan, VSI adopted the Vitamin Shoppe 2009 Equity Incentive Plan (the “2009 Plan”) on September 2, 2009, which authorized the issuance of up to 1,395,816 common shares for issuance of both stock option and restricted stock shares for certain employees of the Company after taking into consideration the approximately 1.8611-for-one share split. The stock options are exercisable at no less than the fair market value of the underlying shares on the date of grant. Generally, options and restricted shares awarded shall become vested in four equal increments on each of the first, second, third and fourth anniversaries of the date on which such options were awarded. The stock options have a maximum term of 10 years. The following table summarizes the 2006 and 2009 Plans as of March 27, 2010 and changes during the three month period then ended:
| Number of Options |
Weighted Average Exercise Price |
Weighted Average Remaining Contractual Life (years) |
Aggregate Intrinsic Value (in thousands) | |||||||
| Outstanding at December 26, 2009 |
3,868,980 | $ | 11.93 | |||||||
| Granted |
— | — | ||||||||
| Exercised |
(85,787 | ) | $ | 8.01 | ||||||
| Canceled/forfeited |
(17,659 | ) | $ | 14.97 | ||||||
| Outstanding at March 27, 2010 |
3,765,534 | $ | 12.01 | 5.66 | 33,498 | |||||
| Vested or expected to vest at March 27, 2010 |
3,577,257 | $ | 12.01 | 5.66 | ||||||
| Vested and exercisable at March 27, 2010 |
2,602,127 | $ | 10.69 | 4.97 | 26,578 | |||||
The total intrinsic value of options exercised during the three months ended March 27, 2010, was $1.1 million. The cash received from options exercised during the quarter ended March 27, 2010 was $0.7 million. There were no exercises during the quarter ended March 28, 2009.
Restricted shares are issued at a value not less than the fair market value of the common shares on the date of the grant, and generally vest in four equal increments on the anniversary date of each year after the date on which such shares were issued. There were 13,500 restricted shares issued during the first fiscal quarter of 2010, all of which were granted at the market value on the date of grant of $20.01 per share. There were 90,557 restricted shares issued under the 2009 Plan during Fiscal 2009, of which 11,320 shares were vested as of March 27, 2010, resulting in a total of 92,737 shares of unvested restricted stock outstanding as of March 27, 2010.
Stock-based compensation cost is measured at the grant date based on the fair value of awards and is recognized as expense over the vesting period, net of anticipated forfeitures. Determining the fair value of stock-based awards at the grant date requires considerable judgment, including estimating expected volatility, expected term and risk-free rate. The expected volatility is based on the volatility levels over the past 6.25 and 4.81 years (our expected holding periods) depending on the grant, from the average volatility of similar actively traded companies. Generally, the expected holding period of the option is calculated using the simplified method using the vesting term of 4 years and the contractual term of 10 years, resulting in a holding period 6.25 years, Certain limited grants have contractual terms of 7.5 years, and as such have a calculated holding period of 4.81 years. The simplified method was chosen as a means to determine the Company’s holding period as prior to November
F-45
Table of Contents
2009 there was no historical option exercise experience due to the Company being privately held. As of March 27, 2010 there is insufficient information due to the Company being a new publicly owned company. The risk-free interest rate is derived from the average yield for the five and seven year zero-coupon U.S. Treasury Strips, and from the five year zero-coupon U.S. Treasury Strips.
Compensation expense attributable to stock-based compensation for the first quarter of Fiscal 2010 was approximately $0.8 million, and for the first fiscal quarter of 2009 was approximately $0.6 million. There were no options granted during the three months ended March 27, 2010 and March 28, 2009. As of March 27, 2010, the remaining unrecognized stock-based compensation expense for non-vested stock options and restricted shares to be expensed in future periods is $7.9 million, and the related weighted-average period over which it is expected to be recognized is 2.8 years. There were 2,602,127 and 1,163,407 vested and non-vested outstanding options, respectively, at March 27, 2010. Forfeitures are estimated at the time of grant and revised, if necessary, in subsequent periods if actual forfeitures differ from those estimates. The Company estimates forfeitures based on its historical forfeiture rate since the plan inception in Fiscal 2002. The estimated value of future forfeitures as of March 27, 2010 is approximately $0.4 million.
Employee Stock Purchase Plan—On December 16, 2009, the Company’s board of directors approved the Vitamin Shoppe 2010 Employee Stock Purchase Plan (the “ESPP”), subject to approval of the Company’s shareholders. Pursuant to the plan, shares of common stock will be issued beginning on July 1, 2010, and will continue to be issued quarterly thereafter subject to employee participation in the plan. Under the ESPP, participating employees will be allowed to purchase shares at 85% of the lower market price of the Company’s common stock at either the first or last trading day of the participation period. Similar to stock option grants, under the fair value accounting guidelines for stock compensation, the Company will recognize compensation expense related to the estimated fair value of the discounted components of stock purchased under the ESPP.
| 8. | Legal Proceedings |
Dwight Thompson v. The Vitamin Shoppe and Consolidated Actions. The Company reclassified its California store managers as non-exempt employees in January 2004. On February 25, 2005, plaintiff Dwight Thompson (“Thompson”), a former store manager, filed suit on behalf of himself and other “similarly situated” current and former California store managers and assistant store managers in the Superior Court of the State of California for the County of Orange (“Orange County Superior Court”), alleging causes of action for alleged wage and hour violations, unfair business practices, unfair competition under Cal. Bus. & Prof. Code §§ 17000 et seq. (“UCL”) and penalties under the Labor Code Private Attorneys General Act, Cal. Labor Code §§ 2698 et seq. (“PAGA”) (the “Thompson Action”). Almost one year later, on July 7, 2006, the same group of plaintiffs’ attorneys who were representing Thompson filed another wage and hour lawsuit against The Vitamin Shoppe based on substantively identical allegations in the Orange County Superior Court, entitled Estel v. The Vitamin Shoppe Industries Inc. (Case No. 06CC07852) (the “Estel Action”). Plaintiffs in the Estel Action were already class members in the Thompson Action. In January 2008, the Court consolidated the Thompson and Estel actions. In the consolidated complaint, Plaintiffs assert nine claims for relief against the Company: (1) failure to pay overtime wages; (2) unfair business practices in violation of Cal. Bus. & Prof. Code §§ 17000 et seq.; (3) conversion; (4) failure to provide meal periods; (5) failure to provide rest periods; (6) unfair competition under the UCL; (7) failure to provide itemized wage statements; (8) failure to provide wages and accrued vacation upon termination; and (9) recovery of civil penalties under PAGA. Plaintiffs purport to bring their UCL and PAGA claims as representative actions and the remaining claims as individual claims and on behalf of a class composed of all current and former assistant managers and managers of the Company who were employed on or after April 14, 2006 (the “Amended Thompson Action”). The Company intends to defend the Amended Thompson Action vigorously. As of March 27, 2010, the Company does not believe the financial statement impact of this matter will be material.
California District Attorney’s Letter. On May 17, 2007, the Company received a letter from the Napa County (California) District Attorney alleging that six of the Company’s private label products contain levels of lead that, pursuant to California’s Proposition 65, Cal. Health & Safety Code section 25249.5 et seq.,
F-46
Table of Contents
(“Proposition 65”) require the products to bear a warning when sold in California. The letter claims that 12 other public prosecutors in California, including the California Attorney General, “are involved in a joint investigation of dietary supplements containing lead in amounts that expose users to lead in excess of 0.50 micrograms (ug) per day.” The letter demands that the Company immediately cease all sales of these products in California unless it provides a warning to consumers. It also notes that Proposition 65 provides for civil penalties of up to $2,500 per violation per day. The Company has met with the California Attorney General and certain District Attorneys, and is investigating these allegations and consulting with its third-party suppliers of these products. The Company has withdrawn certain named products from the California market and has provided warnings with respect to other products still available in California pending discussions with the public prosecutors. The Napa County District Attorney has expressed concerns on several occasions as to the method of warning employed by the Company and the completeness of its implementation. The Company has revised its warnings and reviewed its procedures for implementing warnings. The Company has responded to numerous requests for information and has met in person with representatives of the Napa County District Attorney and the California Attorney General to attempt to resolve this matter. As of March 27, 2010, the Company does not believe the financial statement impact of this matter will be material.
The People of the State of California v. 21st Century Healthcare, Inc. On October 22, 2008, a private enforcer named Vicky Hamilton sent over 70 manufacturers and retailers of multivitamin products, including the Company, various Sixty-Day Notices of Violation of Proposition 65, Cal. Health & Safety Code section 25249.5 et seq. alleging that certain products contain lead and lead compounds and were sold in California without a Proposition 65 warning threatening litigation pertaining to two of the Company’s multivitamin products. On December 23, 2008, the California Attorney General and nine California District Attorneys filed a complaint on behalf of the People of the State of California against a number of companies who received notices of violation from Ms. Hamilton, including the Company in Alameda County Superior Court. The action alleges violations of both Proposition 65 and the UCL and supplants the litigation Ms. Hamilton sought to bring against the Company on the claims stated in her Notice of Violation. Penalties under Proposition 65 may be assessed at the maximum rate of $2,500 per violation per day. Penalties under the UCL may be assessed at the same rate and are cumulative to those available under Proposition 65. Injunctive relief and attorneys fees are also available. The Company is investigating these claims and discussing them with the California Attorney General and District Attorneys. At this time it is premature to determine the extent of any potential loss. Accordingly, as of March 27, 2010, the Company has not accrued any liabilities related to this litigation.
J.C. Romero v. ErgoPharm Inc., Proviant Technologies Inc., VS Holdings Inc, d/b/a Vitamin Shoppe, and General Nutrition Centers Inc. On April 27, 2009, plaintiff, a professional baseball player, filed a complaint against us, among others, in Superior Court of New Jersey (Law Division/Camden County). Plaintiff alleges that he purchased from one of our stores and consumed 6-OXO Extreme, which was manufactured by a third party, and in August 2008, allegedly tested positive for a banned substance. Plaintiff served a 50 game suspension imposed by Major League Baseball. The seven count complaint asserts, among other things, claims for negligence, strict liability, misrepresentation, breach of implied warranty and violations of the New Jersey Consumer Fraud Act, and seeks unspecified monetary damages, including lost income during the suspension. The Company denies any and all liability and intends to vigorously defend these claims. Any liabilities that may arise from this matter are not probable or reasonably estimable at this time. Accordingly, as of March 27, 2010, the Company has not accrued any liabilities related to this litigation.
The Company is party to various lawsuits arising from time to time in the normal course of business, many of which are covered by insurance. Except as described above, as of March 27, 2010, the Company was not party to any material legal proceedings. Although the impact of the final resolution of these matters on the Company’s financial condition, results of operations or cash flows is not known, management does not believe that the resolution of these lawsuits will have a material adverse effect on the financial condition, results of operations or liquidity of the Company.
F-47
Table of Contents
| 9. | Related Party Transactions |
The Company had a management agreement with IPC Manager II, LLC (formerly Bear Stearns Merchant Manager II, LLC), which terminated on November 2, 2009, as a result of the IPO. This agreement provided for a quarterly fee of the greater of $187,500 or 0.25% of gross sales for the preceding fiscal quarter for advisory and consulting services. In addition, per the agreement a one-time termination fee of approximately $0.8 million was charged to expense during the fourth Fiscal quarter of 2009 in connection with the Company’s initial public offering. Accordingly, there were no amounts paid during the three months ended March 27, 2010. Amounts paid for the three months ended March 28, 2009 were approximately $0.4 million.
| 10. | Segment Data |
The Company currently operates two business segments, retail and direct. The operating segments are segments of the Company for which separate financial information is available and for which operating results are evaluated regularly by executive management in deciding how to allocate resources and in assessing performance. The Company’s management evaluates segment operating results based on several indicators. The primary key performance indicators are sales and operating income for each segment. The table below represents key financial information for each of the Company’s business segments, retail and direct, as well as corporate costs. The retail segment includes the Company’s retail stores. The retail segment generates revenue primarily through the sale of third-party branded and proprietary branded vitamins, minerals, herbs, supplements, sports nutrition and other health and wellness products through retail stores throughout the United States. The direct segment generates revenue through the sale of third-party branded and proprietary branded vitamins, minerals, herbs, supplements, sports nutrition and other health and wellness products through the Company’s Web site and catalog. A catalog is mailed periodically to customers in the Company’s Healthy Awards Program database, and the Company’s website at www.vitaminshoppe.com offers its customers online access to a full assortment of over 20,000 SKUs. Corporate costs represent the Company’s administrative expenses which include, but are not limited to: human resources, legal, finance, information technology, and various other corporate level activity related expenses. There are no inter-segment sales transactions.
The Company’s segments are designed to allocate resources internally and provide a framework to determine management responsibility. The accounting policies of the segments are consistent with those described in Note 3- Summary of Significant Accounting Policies in the Fiscal 2009 consolidated financial statements. The Company has allocated $131.9 million and $45.3 million of its recorded goodwill to the retail and direct segments, respectively. The Company does not have identifiable assets separated by segment.
The following table contains key financial information of the Company’s business segments (in thousands):
| Three Months Ended | ||||||||
| March 27, 2010 |
March 28, 2009 |
|||||||
| Sales: |
||||||||
| Retail |
$ | 169,063 | $ | 151,642 | ||||
| Direct |
22,550 | 20,913 | ||||||
| Net sales |
191,613 | 172,555 | ||||||
| Income from operations: |
||||||||
| Retail |
31,356 | 24,675 | ||||||
| Direct |
4,491 | 4,366 | ||||||
| Corporate costs |
(17,775 | ) | (16,340 | ) | ||||
| Income from operations |
$ | 18,072 | $ | 12,701 | ||||
F-48
Table of Contents
| 11. | Fair Value of Financial Instruments |
The fair value of the Company’s Notes have been determined by the Company using quoted market prices. The following table sets forth the carrying amounts and fair values of the Company’s Notes at March 27, 2010 and December 26, 2009 (in thousands):
| March 27, 2010 | December 26, 2009 | |||||||||||
| Carrying Amount |
Fair Value | Carrying Amount |
Fair Value | |||||||||
| Second Priority Senior Secured Floating Rate Notes |
$ | 100,106 | $ | 100,481 | $ | 120,106 | $ | 120,669 | ||||
The fair value of the Notes at March 27, 2010, is based on the last trade closest to that date which was February 11, 2010. The fair value for December 26, 2009, is based on the last trade closest to that date which was December 23, 2009.
Prior to its termination, the Company had an interest rate swap which was established as a cash flow hedge on a portion of its Notes to offset fluctuations related to the variable rate interest payments as described in Note 6. The unrecognized loss related to the interest rate swap is included in accumulated other comprehensive loss in the condensed consolidated balance sheets. The swap was previously categorized within Level 2 in the fair value hierarchy. For the three months ended March 27, 2010, approximately $0.4 million, was reclassified from accumulated other comprehensive loss and the related deferred tax assets to earnings (as a component of interest expense). As of March 27, 2010, the Company expects approximately $0.5 million of unrealized losses, net of taxes, that are reported in accumulated other comprehensive loss, along with $0.4 million of deferred tax assets related to the swap, to be reclassified into earnings within the next seven months.
| 12. | Subsequent Events |
On March 30, 2010, the Company entered into a three year agreement with a west coast third party logistics facility to service its stores in the westernmost United States. On April 21, 2010, the Company amended its 2009 Revolving Credit Facility agreement increasing the maximum credit limit by $20.0 million to $70.0 million. In addition, in connection with the aforementioned west coast facility agreement, the 2009 Revolving Credit Facility was amended to accommodate the allocation of the Company’s inventory between its New Jersey distribution center and the west coast logistics facility. On April 21, 2010, the Company announced its notice of redemption for $25.0 million in aggregate principal of its outstanding Notes, along with accrued and unpaid interest through the redemption date. The Company expects to complete the redemption by May 21, 2010, which will be funded through drawing on the amended Revolving Credit Facility and existing cash and cash equivalents.
| 13. | Supplemental Guarantor Information |
The payment obligations of Industries under the Notes are jointly and severally and fully and unconditionally guaranteed on a senior basis by: VSI (Industries’s parent), Direct (Industries’s sole subsidiary), all of Industries’s future restricted domestic subsidiaries, and VSI’s. The Notes and the guarantees are Industries’s, VSI’ and Direct’s second priority senior secured obligations. They rank equally with all of Industries’s, Holding’s and Direct’s existing and future senior indebtedness and rank senior to all of Industries’s, VSI’ and Direct’s existing and future subordinated indebtedness. The Notes and the guarantees are effectively subordinate to all of Industries’s, VSI’ and Direct’s existing first priority senior secured indebtedness, to the extent of the collateral securing such indebtedness, including indebtedness under the Revolving Credit Facility.
The indenture governing the Notes restricts the ability of Industries and Direct to incur additional debt, pay dividends and make distributions, make certain investments, repurchase stock, incur liens, enter into transactions with affiliates, enter into sale and lease back transactions, merge, or consolidate or transfer or sell assets.
The following supplemental financial information sets forth, on a consolidating basis, balance sheets, statements of operations, and statements of cash flows for VSI, Industries and Direct:
F-49
Table of Contents
VITAMIN SHOPPE, INC. AND SUBSIDIARY
CONDENSED CONSOLIDATING BALANCE SHEETS AS OF MARCH 27, 2010
(In thousands, except share data)
| Vitamin Shoppe, Inc. |
VS Direct Inc. |
Vitamin Shoppe Industries Inc. |
Eliminations | Consolidated | |||||||||||||||
| ASSETS | |||||||||||||||||||
| Current assets: |
|||||||||||||||||||
| Cash and cash equivalents |
$ | 1,663 | $ | 1,932 | $ | 8,567 | $ | — | $ | 12,162 | |||||||||
| Inventories |
— | 17,510 | 94,947 | — | 112,457 | ||||||||||||||
| Prepaid expenses and other current assets |
— | 170 | 13,276 | — | 13,446 | ||||||||||||||
| Intercompany receivable |
50,292 | 294,355 | 257,687 | (602,334 | ) | — | |||||||||||||
| Deferred income taxes |
— | 370 | 2,716 | — | 3,086 | ||||||||||||||
| Total current assets |
51,955 | 314,337 | 377,193 | (602,334 | ) | 141,151 | |||||||||||||
| Property and equipment, net |
— | 21,362 | 62,093 | — | 83,455 | ||||||||||||||
| Goodwill |
— | — | 177,248 | — | 177,248 | ||||||||||||||
| Other intangibles, net |
— | — | 70,165 | — | 70,165 | ||||||||||||||
| Other assets: |
|||||||||||||||||||
| Deferred financing fees, net of accumulated amortization of $2,678 |
— | — | 1,796 | — | 1,796 | ||||||||||||||
| Other long-term assets |
— | 2 | 1,870 | — | 1,872 | ||||||||||||||
| Deferred income tax asset |
4,117 | 2,027 | 15,802 | (21,946 | ) | — | |||||||||||||
| Total other assets |
4,117 | 2,029 | 19,468 | (21,946 | ) | 3,668 | |||||||||||||
| Investment in subsidiary |
209,580 | — | 57,953 | (267,533 | ) | — | |||||||||||||
| Total assets |
$ | 265,652 | $ | 337,728 | $ | 764,120 | $ | (891,813 | ) | $ | 475,687 | ||||||||
| LIABILITIES AND STOCKHOLDERS’ EQUITY | |||||||||||||||||||
| Current liabilities: |
|||||||||||||||||||
| Current portion of capital lease obligation |
$ | — | $ | — | $ | 1,595 | $ | — | $ | 1,595 | |||||||||
| Revolving credit facility |
— | — | 20,000 | — | 20,000 | ||||||||||||||
| Intercompany payable |
17,400 | 269,225 | 315,709 | (602,334 | ) | — | |||||||||||||
| Accounts payable |
— | 132 | 28,561 | — | 28,693 | ||||||||||||||
| Deferred sales |
— | 836 | 4,668 | — | 5,504 | ||||||||||||||
| Accrued salaries and related expenses |
— | 656 | 3,672 | — | 4,328 | ||||||||||||||
| Other accrued expenses |
2,502 | 1,712 | 14,366 | — | 18,580 | ||||||||||||||
| Total current liabilities |
19,902 | 272,561 | 388,571 | (602,334 | ) | 78,700 | |||||||||||||
| Long-term debt |
— | — | 100,106 | — | 100,106 | ||||||||||||||
| Capital lease obligation, net of current portion |
— | — | 1,953 | — | 1,953 | ||||||||||||||
| Deferred income taxes |
514 | 2,995 | 37,494 | (21,946 | ) | 19,057 | |||||||||||||
| Other long-term liabilities |
— | 6 | 4,981 | — | 4,987 | ||||||||||||||
| Deferred rent |
— | 4,213 | 21,435 | — | 25,648 | ||||||||||||||
| Commitments and contingencies |
|||||||||||||||||||
| Stockholders’ equity: |
|||||||||||||||||||
| Common stock, $0.01 par value; 400,000,000 shares authorized, 26,849,710 shares issued and outstanding at March 27, 2010 |
268 | — | — | — | 268 | ||||||||||||||
| Additional paid-in capital |
212,171 | 20,165 | 166,791 | (186,956 | ) | 212,171 | |||||||||||||
| Accumulated other comprehensive loss |
(535 | ) | — | (535 | ) | 535 | (535 | ) | |||||||||||
| Retained earnings |
33,332 | 37,788 | 43,324 | (81,112 | ) | 33,332 | |||||||||||||
| Total stockholders’ equity |
245,236 | 57,953 | 209,580 | (267,533 | ) | 245,236 | |||||||||||||
| Total liabilities and stockholders’ equity |
$ | 265,652 | $ | 337,728 | $ | 764,120 | $ | (891,813 | ) | $ | 475,687 | ||||||||
F-50
Table of Contents
VITAMIN SHOPPE, INC. AND SUBSIDIARY
CONSOLIDATING BALANCE SHEET AS OF DECEMBER 26, 2009
(In thousands, except share data)
| Vitamin Shoppe, Inc. |
VS Direct | Vitamin Shoppe Industries Inc. |
Eliminations | Consolidated | |||||||||||||||
| ASSETS | |||||||||||||||||||
| Current assets: |
|||||||||||||||||||
| Cash and cash equivalents |
$ | 1,767 | $ | 917 | $ | 6,113 | $ | — | $ | 8,797 | |||||||||
| Inventories |
— | 17,510 | 88,581 | — | 106,091 | ||||||||||||||
| Prepaid expenses and other current assets |
— | 208 | 13,193 | 13,401 | |||||||||||||||
| Intercompany receivable |
47,444 | 292,145 | 262,745 | (602,334 | ) | — | |||||||||||||
| Deferred income taxes |
— | 723 | 4,422 | — | 5,145 | ||||||||||||||
| Total current assets |
49,211 | 311,503 | 375,054 | (602,334 | ) | 133,434 | |||||||||||||
| Property and equipment, net |
— | 21,869 | 62,091 | — | 83,960 | ||||||||||||||
| Goodwill |
— | — | 177,248 | — | 177,248 | ||||||||||||||
| Other intangibles, net |
— | — | 70,356 | — | 70,356 | ||||||||||||||
| Other assets: |
|||||||||||||||||||
| Deferred financing fees, net of accumulated amortization of $2,856 |
— | — | 2,384 | — | 2,384 | ||||||||||||||
| Other |
— | 2 | 1,873 | — | 1,875 | ||||||||||||||
| Deferred income tax asset |
3,741 | 1,969 | 15,844 | (21,554 | ) | — | |||||||||||||
| Total other assets |
3,741 | 1,971 | 20,101 | (21,554 | ) | 4,259 | |||||||||||||
| Investment in Subsidiary |
200,051 | — | 54,533 | (254,584 | ) | — | |||||||||||||
| Total assets |
$ | 253,003 | $ | 335,343 | $ | 759,383 | $ | (878,472 | ) | $ | 469,257 | ||||||||
| LIABILITIES AND STOCKHOLDERS’ EQUITY | |||||||||||||||||||
| Current liabilities: |
|||||||||||||||||||
| Current portion of long-term debt |
$ | — | $ | — | $ | 20,000 | $ | — | $ | 20,000 | |||||||||
| Current portion of capital lease obligation |
— | — | 1,537 | — | 1,537 | ||||||||||||||
| Revolving credit facility |
— | — | — | — | — | ||||||||||||||
| Intercompany payable |
17,400 | 269,225 | 315,709 | (602,334 | ) | — | |||||||||||||
| Accounts payable |
— | 166 | 24,909 | — | 25,075 | ||||||||||||||
| Deferred sales |
— | 2,596 | 11,790 | — | 14,386 | ||||||||||||||
| Accrued salaries and related expenses |
— | 716 | 6,835 | — | 7,551 | ||||||||||||||
| Other accrued expenses |
803 | 953 | 12,713 | — | 14,469 | ||||||||||||||
| Total current liabilities |
18,203 | 273,656 | 393,493 | (602,334 | ) | 83,018 | |||||||||||||
| Long-term debt |
— | — | 100,106 | — | 100,106 | ||||||||||||||
| Capital lease obligation, net of current portion |
— | — | 2,303 | — | 2,303 | ||||||||||||||
| Deferred income taxes |
449 | 3,020 | 38,030 | (21,554 | ) | 19,945 | |||||||||||||
| Other long term liabilities |
— | 4 | 4,762 | — | 4,766 | ||||||||||||||
| Deferred rent |
— | 4,130 | 20,638 | — | 24,768 | ||||||||||||||
| Commitments and contingencies |
|||||||||||||||||||
| Stockholders’ equity: |
|||||||||||||||||||
| Common stock, $0.01 par value, 400,000,000 shares authorized, 26,750,423 shares issued and outstanding |
268 | — | — | — | 268 | ||||||||||||||
| Additional paid-in capital |
210,359 | 20,165 | 166,791 | (186,956 | ) | 210,359 | |||||||||||||
| Accumulated other comprehensive loss |
(882 | ) | — | (882 | ) | 882 | (882 | ) | |||||||||||
| Retained earnings |
24,606 | 34,368 | 34,142 | (68,510 | ) | 24,606 | |||||||||||||
| Total stockholders’ equity |
234,351 | 54,533 | 200,051 | (254,584 | ) | 234,351 | |||||||||||||
| Total liabilities and stockholders’ equity |
$ | 253,003 | $ | 335,343 | $ | 759,383 | $ | (878,472 | ) | $ | 469,257 | ||||||||
F-51
Table of Contents
VITAMIN SHOPPE, INC. AND SUBSIDIARY
CONDENSED CONSOLIDATING STATEMENTS OF OPERATIONS
FOR THE THREE MONTHS ENDED MARCH 27, 2010
(In thousands)
| Vitamin Shoppe, Inc. |
VS Direct Inc. |
Vitamin Shoppe Industries Inc. |
Eliminations | Consolidated | |||||||||||||
| Net sales |
$ | — | $ | 38,570 | $ | 153,043 | $ | — | $ | 191,613 | |||||||
| Commissions |
— | 5,301 | 2,128 | (7,429 | ) | — | |||||||||||
| Cost of goods sold |
— | 26,663 | 101,427 | (1,491 | ) | 126,599 | |||||||||||
| Gross profit |
— | 17,208 | 53,744 | (5,938 | ) | 65,014 | |||||||||||
| Selling, general and administrative expenses |
809 | 11,655 | 40,416 | (5,938 | ) | 46,942 | |||||||||||
| Related party expenses |
— | — | — | — | — | ||||||||||||
| (Loss) income from operations |
(809 | ) | 5,553 | 13,328 | — | 18,072 | |||||||||||
| Loss on extinguishment of debt |
— | — | 552 | — | 552 | ||||||||||||
| Interest expense, net |
— | 1 | 2,926 | — | 2,927 | ||||||||||||
| (Loss) income before (benefit) provision for income taxes |
(809 | ) | 5,552 | 9,850 | — | 14,593 | |||||||||||
| (Benefit) provision for income taxes |
(354 | ) | 2,131 | 4,090 | — | 5,867 | |||||||||||
| (Loss) income before equity in net earnings of subsidiary |
(455 | ) | 3,421 | 5,760 | — | 8,726 | |||||||||||
| Equity in net earnings of subsidiary |
9,181 | — | 3,421 | (12,602 | ) | — | |||||||||||
| Net income |
$ | 8,726 | $ | 3,421 | $ | 9,181 | $ | (12,602 | ) | $ | 8,726 | ||||||
F-52
Table of Contents
VITAMIN SHOPPE, INC. AND SUBSIDIARY
CONDENSED CONSOLIDATING STATEMENTS OF OPERATIONS
FOR THE THREE MONTHS ENDED MARCH 28, 2009
(In thousands)
| Vitamin Shoppe, Inc. |
VS Direct Inc. |
Vitamin Shoppe Industries Inc. |
Eliminations | Consolidated | |||||||||||||
| Net sales |
$ | — | $ | 32,852 | $ | 139,703 | $ | — | $ | 172,555 | |||||||
| Commissions |
— | 5,078 | 1,865 | (6,943 | ) | — | |||||||||||
| Cost of goods sold |
— | 23,762 | 93,041 | (1,260 | ) | 115,543 | |||||||||||
| Gross profit |
— | 14,168 | 48,527 | (5,683 | ) | 57,012 | |||||||||||
| Selling, general and administrative expenses |
628 | 11,244 | 37,752 | (5,683 | ) | 43,941 | |||||||||||
| Related party expenses |
— | — | 370 | — | 370 | ||||||||||||
| (Loss) income from operations |
(628 | ) | 2,924 | 10,405 | — | 12,701 | |||||||||||
| Interest expense, net |
— | — | 5,007 | — | 5,007 | ||||||||||||
| (Loss) income before (benefit) provision for income taxes |
(628 | ) | 2,924 | 5,398 | — | 7,694 | |||||||||||
| (Benefit) provision for income taxes |
(275 | ) | 1,134 | 2,273 | — | 3,132 | |||||||||||
| (Loss) income before equity in net earnings of subsidiary |
(353 | ) | 1,790 | 3,125 | — | 4,562 | |||||||||||
| Equity in net earnings of subsidiary |
4,915 | — | 1,790 | (6,705 | ) | — | |||||||||||
| Net income |
$ | 4,562 | $ | 1,790 | $ | 4,915 | $ | (6,705 | ) | $ | 4,562 | ||||||
F-53
Table of Contents
VITAMIN SHOPPE, INC. AND SUBSIDIARY
CONDENSED CONSOLIDATING STATEMENTS OF CASH FLOWS
FOR THE THREE MONTHS ENDED MARCH 27, 2010
(In thousands)
| Vitamin Shoppe, Inc. |
VS Direct Inc. |
Vitamin Shoppe Industries Inc. |
Eliminations | Consolidated | ||||||||||||||||
| Cash flows from operating activities: |
||||||||||||||||||||
| Net income |
$ | 8,726 | $ | 3,421 | $ | 9,181 | $ | (12,602 | ) | $ | 8,726 | |||||||||
| Adjustments to reconcile net income to net cash provided by operating activities: |
||||||||||||||||||||
| Loss on extinguishment of debt |
— | — | 552 | — | 552 | |||||||||||||||
| Loss on disposal of fixed assets |
— | — | 2 | — | 2 | |||||||||||||||
| Depreciation and amortization of fixed and intangible assets |
— | 1,253 | 4,161 | — | 5,414 | |||||||||||||||
| Amortization of deferred financing fees |
— | — | 285 | 285 | ||||||||||||||||
| Amortization of unrealized loss on terminated swap |
366 | 366 | ||||||||||||||||||
| Deferred income taxes |
(311 | ) | 270 | 971 | — | 930 | ||||||||||||||
| Deferred rent |
— | 83 | 624 | — | 707 | |||||||||||||||
| Equity compensation expense |
809 | — | — | — | 809 | |||||||||||||||
| Tax benefits on exercises of stock options |
(403 | ) | — | (403 | ) | |||||||||||||||
| Equity in earnings of subsidiary |
(9,181 | ) | — | (3,421 | ) | 12,602 | — | |||||||||||||
| Changes in operating assets and liabilities: |
||||||||||||||||||||
| Inventories |
— | — | (6,366 | ) | — | (6,366 | ) | |||||||||||||
| Prepaid expenses and other current assets |
— | 38 | 493 | — | 531 | |||||||||||||||
| Intercompany |
(2,445 | ) | (2,210 | ) | 4,655 | — | — | |||||||||||||
| Other non-current assets |
— | — | 3 | — | 3 | |||||||||||||||
| Accounts payable |
— | (34 | ) | 4,375 | — | 4,341 | ||||||||||||||
| Accrued expenses and other current liabilities |
1,697 | (1,061 | ) | (8,577 | ) | — | (7,941 | ) | ||||||||||||
| Other long-term liabilities |
— | 1 | 221 | — | 222 | |||||||||||||||
| Net cash provided by operating activities |
(1,108 | ) | 1,761 | 7,525 | — | 8,178 | ||||||||||||||
| Cash flows from investing activities: |
||||||||||||||||||||
| Capital expenditures |
— | (746 | ) | (4,662 | ) | — | (5,408 | ) | ||||||||||||
| Net cash used in investing activities |
— | (746 | ) | (4,662 | ) | — | (5,408 | ) | ||||||||||||
| Cash flows from financing activities: |
||||||||||||||||||||
| Borrowings under revolving credit agreement |
— | — | 20,000 | — | 20,000 | |||||||||||||||
| Repayment of borrowings under revolving credit agreement |
— | — | — | — | — | |||||||||||||||
| Payments of capital lease obligation |
— | — | (381 | ) | — | (381 | ) | |||||||||||||
| Redemption of long term debt (Notes) |
— | (20,000 | ) | (20,000 | ) | |||||||||||||||
| Payments for expenses related to the offering |
(87 | ) | — | (87 | ) | |||||||||||||||
| Proceeds from exercises of common stock options |
687 | — | 687 | |||||||||||||||||
| Tax benefits on exercises of stock options |
403 | — | 403 | |||||||||||||||||
| Deferred financing fees |
— | — | (27 | ) | — | (27 | ) | |||||||||||||
| Net cash provided by (used in) financing activities |
1,003 | — | (408 | ) | — | 595 | ||||||||||||||
| Net (decrease) increase in cash and cash equivalents |
(105 | ) | 1,015 | 2,455 | — | 3,365 | ||||||||||||||
| Cash and cash equivalents beginning of period |
1,767 | 917 | 6,113 | — | 8,797 | |||||||||||||||
| Cash and cash equivalents end of period |
$ | 1,662 | $ | 1,932 | $ | 8,568 | $ | — | $ | 12,162 | ||||||||||
F-54
Table of Contents
VITAMIN SHOPPE, INC. AND SUBSIDIARY
CONDENSED CONSOLIDATING STATEMENTS OF CASH FLOWS
FOR THE THREE MONTHS ENDED MARCH 28, 2009
(In thousands)
| Vitamin Shoppe, Inc. |
VS Direct Inc. |
Vitamin Shoppe Industries Inc. |
Eliminations | Consolidated | ||||||||||||||||
| Cash flows from operating activities: |
||||||||||||||||||||
| Net income |
$ | 4,562 | $ | 1,790 | $ | 4,915 | $ | (6,705 | ) | $ | 4,562 | |||||||||
| Adjustments to reconcile net income to net cash provided by operating activities: |
||||||||||||||||||||
| Loss on disposal of fixed assets |
— | 1 | — | — | 1 | |||||||||||||||
| Depreciation and amortization of fixed and intangible assets |
— | 1,143 | 3,935 | — | 5,078 | |||||||||||||||
| Amortization of deferred financing fees |
292 | 292 | ||||||||||||||||||
| Deferred income taxes |
(275 | ) | 243 | 640 | — | 608 | ||||||||||||||
| Deferred rent |
— | 55 | 903 | — | 958 | |||||||||||||||
| Equity compensation expense |
628 | — | — | — | 628 | |||||||||||||||
| Equity in earnings of subsidiary |
(4,915 | ) | — | (1,790 | ) | 6,705 | — | |||||||||||||
| Changes in operating assets and liabilities: |
— | |||||||||||||||||||
| Inventories |
— | 27 | 825 | — | 852 | |||||||||||||||
| Prepaid expenses and other current assets |
— | 19 | 324 | — | 343 | |||||||||||||||
| Intercompany |
275 | (275 | ) | — | — | |||||||||||||||
| Other non-current assets |
— | — | (9 | ) | — | (9 | ) | |||||||||||||
| Accounts payable |
— | 93 | 5,199 | — | 5,292 | |||||||||||||||
| Accrued expenses and other current liabilities |
— | (1,267 | ) | (8,556 | ) | — | (9,823 | ) | ||||||||||||
| Other long-term liabilities |
— | 3 | 45 | — | 48 | |||||||||||||||
| Net cash provided by operating activities |
— | 2,382 | 6,448 | — | 8,830 | |||||||||||||||
| Cash flows from investing activities: |
||||||||||||||||||||
| Capital expenditures |
— | (2,403 | ) | (5,974 | ) | — | (8,377 | ) | ||||||||||||
| Net cash used in investing activities |
— | (2,403 | ) | (5,974 | ) | — | (8,377 | ) | ||||||||||||
| Cash flows from financing activities: |
||||||||||||||||||||
| Borrowings under revolving credit agreement |
— | — | 3,000 | — | 3,000 | |||||||||||||||
| Repayment of borrowings under revolving credit agreement |
— | — | (3,000 | ) | (3,000 | ) | ||||||||||||||
| Payments of capital lease obligation |
— | — | (290 | ) | — | (290 | ) | |||||||||||||
| Net cash provided by financing activities |
— | — | (290 | ) | — | (290 | ) | |||||||||||||
| Net increase (decrease) in cash and cash equivalents |
— | (21 | ) | 184 | — | 163 | ||||||||||||||
| Cash and cash equivalents beginning of period |
— | 841 | 782 | — | 1,623 | |||||||||||||||
| Cash and cash equivalents end of period |
$ | — | $ | 820 | $ | 966 | $ | — | $ | 1,786 | ||||||||||
F-55
Table of Contents
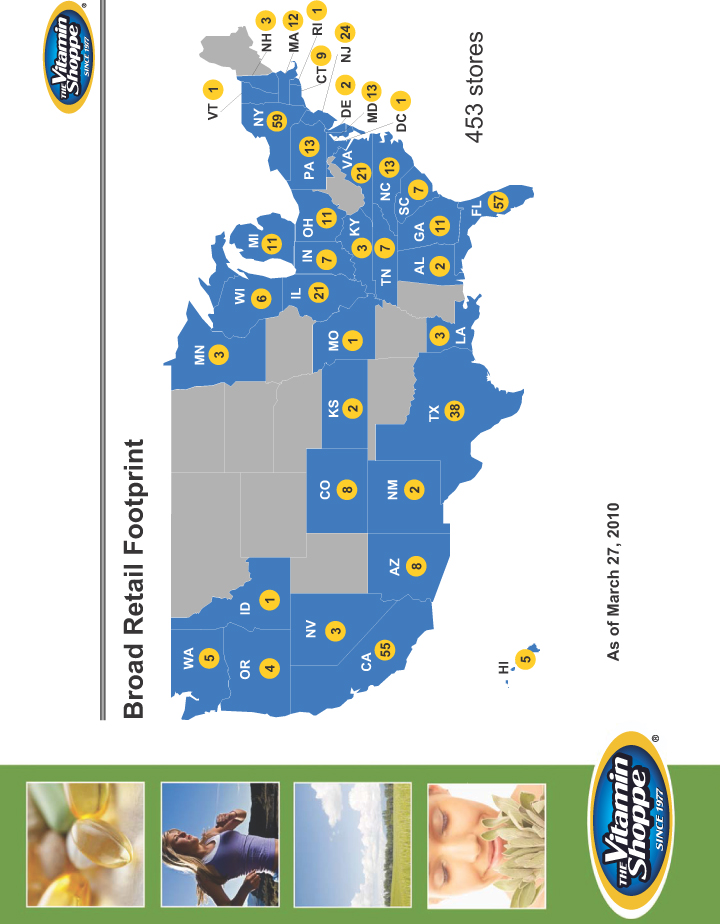
Table of Contents
Through and including , 2010 (25 days after the date of this prospectus), all dealers that buy, sell or trade our common stock, whether or not participating in this offering, may be required to deliver a prospectus. This delivery requirement is in addition to the obligation of dealers to deliver a prospectus when acting as underwriters and with respect to their unsold allotments or subscriptions.
6,236,320 Shares
Common Stock
PROSPECTUS
Joint Book-Running Managers
| J.P.Morgan | BofA Merrill Lynch | Barclays Capital |
Co-Managers
| Stifel Nicolaus | Baird |
Piper Jaffray |
, 2010
Table of Contents
PART II
INFORMATION NOT REQUIRED IN PROSPECTUS
ITEM 13. OTHER EXPENSES OF ISSUANCE AND DISTRIBUTION
The following table shows the costs and expenses, other than underwriting discounts and commissions, payable in connection with the sale and distribution of the securities being registered. All amounts except the SEC registration fee are estimated. The missing amounts will be filed by amendment.
| SEC Registration Fee |
$ | 10,000 | |
| FINRA filing fee |
15,000 | ||
| Printing and engraving expenses |
150,000 | ||
| Legal fees and expenses |
235,000 | ||
| Transfer agent and registrar fees |
13,500 | ||
| Accounting fees and expenses |
165,000 | ||
| Blue Sky fees and expenses |
10,000 | ||
| Miscellaneous |
5,000 | ||
| Total |
$ | 600,000 | |
ITEM 14. INDEMNIFICATION OF DIRECTORS AND OFFICERS
Vitamin Shoppe, Inc. is incorporated under the laws of the state of Delaware.
Section 145 of the Delaware General Corporation Law, or the DGCL, provides that a corporation may indemnify any person, including an officer or director, who was or is, or is threatened to be made, a party to any threatened, pending or completed action, suit or proceeding, whether civil, criminal, administrative or investigative (other than an action by or in the right of such corporation), by reason of the fact that such person is or was a director, officer, employee or agent of such corporation, or is or was serving at the request of such corporation as a director, officer, employee or agent of another corporation, partnership, joint venture, trust or other enterprise. The indemnity may include expenses (including attorneys’ fees), judgments, fines and amounts paid in settlement actually and reasonably incurred by such person in connection with such action, suit or proceeding, provided such person acted in good faith and in a manner such person reasonably believed to be in or not opposed to the best interests of such corporation, and, with respect to any criminal actions and proceedings, had no reasonable cause to believe that his conduct was unlawful. A Delaware corporation may indemnify any person, including an officer or director, who was or is, or is threatened to be made, a party to any threatened, pending or contemplated action or suit by or in the right of such corporation, under the same conditions, except that such indemnification is limited to expenses (including attorneys’ fees) actually and reasonably incurred by such person, and except that no indemnification is permitted without judicial approval if such person is adjudged to be liable to such corporation. Where an officer or director of a corporation is successful, on the merits or otherwise, in the defense of any action, suit or proceeding referred to above, or any claim, issue or matter therein, the corporation must indemnify that person against the expenses (including attorneys’ fees) which such officer or director actually and reasonably incurred in connection therewith.
The amended and restated certificate of incorporation of Vitamin Shoppe, Inc. provides for the indemnification of directors, officers and employees to the fullest extent permitted by the Delaware General Corporation Law. In addition, as permitted by the Delaware General Corporation Law, the certificate of incorporation of Vitamin Shoppe, Inc. provides that none of its directors will be personally liable to it or its stockholders for monetary damages for breach of fiduciary duty as a director, except to the extent such exemption from liability or limitation thereof is not permitted under the Delaware General Corporation Law as currently in effect or as the same may hereafter be amended.
II-1
Table of Contents
The amended and restated by-laws of Vitamin Shoppe, Inc. provides for the indemnification of all of their respective current and former directors and current or former officers to the fullest extent permitted by the Delaware General Corporation Law.
Vitamin Shoppe, Inc. intends to enter into indemnification agreements with its directors and officers to indemnify them against liabilities which may arise by reason of the directors’ status or service as a director. Vitamin Shoppe, Inc. also intends to maintain director and officer liability insurance, if available on reasonable terms.
ITEM 15. RECENT SALES OF UNREGISTERED SECURITIES.
In the past three years, we have issued unregistered securities to a limited number of persons, as described below. None of these transactions involved any underwriters, underwriting discounts or commissions, or any public offering, and we believe that each transaction was exempt from the registration requirements of the Securities Act by virtue of Section 4(2) thereof or Rule 701 pursuant to compensatory benefit plans and contracts relating to compensation as provided under such Rule 701.
We also have issued stock option grants under our Amended and Restated 2006 Stock Option Plan, a written compensatory benefit plan under which we have issued options to employees and directors and our 2009 Vitamin Shoppe Equity Incentive Plan (the “2009 Plan”), a written compensatory benefit plan under which we have issued restricted stock to our Chief Executive Officer. The aggregate sales price of the securities issued under both plans in reliance on Rule 701 did not exceed 15% of our total assets in any given year.
Option Grants in Past Three Years. All of our grants of options in the past three years were for options to purchase shares of our common stock and were made under our Amended and Restated 2006 Stock Option Plan and 2009 Plan.
Since January 1, 2007, the registrant has issued to certain officers, employees and directors options to purchase 3,762,003 shares of common stock, with an estimated approximate aggregate exercise price of $48 million upon exercise of such options.
Issuances to Richard L. Markee. On September 8, 2009, we issued to our Chief Executive Officer, Richard L. Markee, in connection with his acceptance of employment with us, 90,557 restricted shares of our common stock under the 2009 Plan. These restricted shares vest quarterly in equal increments over four years. Mr. Markee also purchased from us 49,950 shares of common stock at a price per share of $15.11, for an aggregate cash purchase price of $754,981.
ITEM 16. EXHIBITS AND FINANCIAL STATEMENT SCHEDULES
(a) See the Exhibit Index beginning on the page II-5 for a list of exhibits filed as part of this registration statement on Form S-1, which Exhibit Index is incorporated herein by reference.
(b) Financial Statement Schedules.
Not applicable.
ITEM 17. UNDERTAKINGS
1. The undersigned registrant hereby undertakes to provide to the underwriters at the closing specified in the underwriting agreement certificates in such denominations and registered in such names as required by the underwriter to permit prompt delivery to each purchaser.
II-2
Table of Contents
2. Insofar as indemnification for liabilities arising under the Securities Act may be permitted to directors, officers and controlling persons of the registrant pursuant to the foregoing provisions, or otherwise, the registrant has been advised that in the opinion of the Securities and Exchange Commission such indemnification is against public policy as expressed in the Securities Act and is, therefore, unenforceable. In the event that a claim for indemnification against such liabilities (other than the payment by the registrant of expenses incurred or paid by a director, officer or controlling person of the registrant in the successful defense of any action, suit or proceeding) is asserted by such director, officer or controlling person in connection with the securities being registered, the registrant will, unless in the opinion of its counsel the matter has been settled by controlling precedent, submit to a court of appropriate jurisdiction the question whether such indemnification by it is against public policy as expressed in the Securities Act and will be governed by the final adjudication of such issue.
3. The undersigned registrant hereby undertakes that:
(1) For the purposes of determining any liability under the Securities Act, the information omitted from the form of prospectus filed as a part of this registration statement in reliance upon Rule 430A and contained in a form of prospectus filed by the registrant pursuant to Rule 424(b)(1) or (4) or 497(h) under the Securities Act shall be deemed to be part of this registration statement as of the time it was declared effective.
(2) For the purpose of determining any liability under the Securities Act, each post-effective amendment that contains a form of prospectus shall be deemed to be a new registration statement relating to the securities offered therein, and this offering of such securities at that time shall be deemed to be the initial bona fide offering thereof.
II-3
Table of Contents
SIGNATURES
Pursuant to the requirements of the Securities Act of 1933, the registrant has duly caused this registration statement to be signed on its behalf by the undersigned, thereunto duly authorized, in the City of North Bergen, State of New Jersey, on May 18, 2010.
| VITAMIN SHOPPE, INC. (Registrant) | ||
| By: |
/S/ RICHARD L. MARKEE | |
| Richard L. Markee Chief Executive Officer, Chairman and Director | ||
Pursuant to the requirements of the Securities Act of 1933, this registration statement has been signed by the following persons on May 18, 2010 in the capacities indicated.
|
Name |
Title |
Date | ||||
| By: |
/S/ RICHARD L. MARKEE Richard L. Markee |
Chief Executive Officer, Chairman of the Board, Director (Principal Executive Officer) | May 18, 2010 | |||
| By: |
/S/ MICHAEL G. ARCHBOLD Michael G. Archbold |
Executive Vice President, Chief Operating Officer and Chief Financial Officer (Principal Financial and Accounting Officer) | May 18, 2010 | |||
| By: |
/S/ B. MICHAEL BECKER B. Michael Becker |
Director | May 18, 2010 | |||
| By: |
/S/ CATHERINE E. BUGGELN Catherine E. Buggeln |
Director | May 18, 2010 | |||
| By: |
/S/ JOHN H. EDMONDSON John H. Edmondson |
Director | May 18, 2010 | |||
| By: |
/S/ DAVID H. EDWAB David H. Edwab |
Director | May 18, 2010 | |||
| By: |
John D. Howard |
Director | ||||
| By: |
/S/ DOUGLAS R. KORN Douglas R. Korn |
Director | May 18, 2010 | |||
| By: |
/S/ RICHARD L. PERKAL Richard L. Perkal |
Director | May 18, 2010 | |||
| By: |
/S/ BETH M. PRITCHARD Beth M. Pritchard |
Director | May 18, 2010 | |||
| By: |
Katherine Savitt-Lennon |
Director | ||||
II-4
Table of Contents
EXHIBIT INDEX
| EXHIBIT NO. |
DESCRIPTION | |
| 1.1 | Form of Underwriting Agreement. § § | |
| 2.1 | Agreement and Plan of Merger by and between VS Holdings, Inc. and VS Parent, Inc., dated as of October 27, 2009. ‡ | |
| 3.1 | Amended and Restated Certificate of Incorporation of Vitamin Shoppe, Inc. ‡ ‡ | |
| 3.2 | Second Amended and Restated By-Laws of Vitamin Shoppe, Inc. ‡ ‡ | |
| 4.1 | Indenture dated as of November 15, 2005, by and among Vitamin Shoppe Industries Inc., VS Holdings, Inc. and VS Direct Inc., as Guarantors, and Wilmington Trust Company, as Trustee. ‡ ‡ ‡ | |
| 4.2 | Registration Rights Agreement dated as of dated as of November 15, 2005, by and among Vitamin Shoppe Industries Inc., VS Holdings, Inc. and VS Direct Inc., as Guarantors, and Bear, Stearns & Co. Inc., BNP Paribas Securities Corp., Banc of America Securities LLC, Jefferies & Company, Inc. and Rothschild Inc., as Initial Purchasers. ‡ ‡ ‡ | |
| 4.3 | Form of Second Priority Senior Secured Floating Rate Note due 2012. ‡ ‡ ‡ | |
| 4.4 | Specimen Common Stock Certificate. ** | |
| 5.1 | Opinion of Kirkland & Ellis LLP. v | |
| 10.1 | Securityholders Agreement, by and among Vitamin Shoppe, Inc. and its securityholders, dated October 27, 2009. ‡ | |
| 10.2 | Loan and Security Agreement, dated as of September 25, 2009, by and among Vitamin Shoppe Industries Inc. and VS Direct Inc. as borrowers, Vitamin Shoppe, Inc. (f/k/a VS Holdings, Inc.) as Guarantor, the Lenders and Issuing Bank from time to time party thereto, and JPMorgan Chase Bank, N.A. as Administrative Agent. ‡ ‡ ‡ ‡ | |
| 10.3 | Intercreditor Agreement Joinder, dated as of September 25, 2009, by JPMorgan Chase Bank, N.A. ‡ ‡ ‡ ‡ | |
| 10.4 | Intellectual Property Security Agreement, dated as of September 25, 2009, by and among Vitamin Shoppe Industries Inc., VS Direct Inc. and Vitamin Shoppe, Inc. (f/k/a VS Holdings, Inc.) and JPMorgan Chase Bank, N.A., as Administrative Agent for the Lenders. ‡ ‡ ‡ ‡ | |
| 10.5 | Stock Pledge Agreement, dated September 25, 2009 by and between Vitamin Shoppe, Inc. (f/k/a VS Holdings, Inc.) as Pledgor and JPMorgan Chase Bank, N.A. as Pledgee. ‡ ‡ ‡ ‡ | |
| 10.6 | Stock Pledge Agreement, dated September 25, 2009 by and between Vitamin Shoppe Industries Inc. as Pledgor and JPMorgan Chase Bank, N.A. as Pledgee. ‡ ‡ ‡ ‡ | |
| 10.7 | Guarantee of Vitamin Shoppe Industries Inc. and Vitamin Shoppe, Inc. (f/k/a VS Holdings, Inc.), dated September 25, 2009, of obligations of VS Direct Inc. under the Loan and Security Agreement. ‡ ‡ ‡ ‡ | |
| 10.8 | Guarantee of VS Direct Inc. and Vitamin Shoppe, Inc. (f/k/a VS Holdings, Inc.), dated September 25, 2009, of obligations of Vitamin Shoppe Industries Inc. under the Loan and Security Agreement. ‡ ‡ ‡ ‡ | |
| 10.9 | Lease Agreement, dated as of May 2, 2002, between Hartz Mountain Industries, Inc. and Vitamin Shoppe Industries Inc. ‡ ‡ ‡ | |
| 10.10 | Purchase Agreement, dated as of November 1, 2004, between Natures Value, Inc. and Vitamin Shoppe Industries Inc. ‡ ‡ ‡ | |
| 10.11 | Form of Employment Agreement by and among executive officer, VS Parent, Inc., Vitamin Shoppe Industries Inc. and VS Holdings, Inc. § ‡ ‡ ‡ | |
Table of Contents
| EXHIBIT NO. |
DESCRIPTION | |
| 10.12 | Form of Indemnification Agreement by and among executive officer, VS Holdings, Inc. and Vitamin Shoppe Industries Inc. § † † † | |
| 10.13 | Form of Indemnification Agreement by and among director, VS Holdings, Inc. and Vitamin Shoppe Industries Inc. § † † † | |
| 10.14 | VS Parent, Inc. 2006 Stock Option Plan. § † | |
| 10.15 | 2009 Vitamin Shoppe Equity Incentive Plan, effective as of September 2, 2009. § † † | |
| 10.16 | Vitamin Shoppe 2010 Employee Stock Purchase Plan, effective December 16, 2009. § † † † † | |
| 10.17 | Employment and Non-Competition Agreement, dated as of September 9, 2009, among Richard L. Markee, VS Parent, Inc., VS Direct, Inc. and Vitamin Shoppe, Inc. (f/k/a VS Holdings, Inc.) and Vitamin Shoppe Industries Inc. † † | |
| 10.18 | Amended and Restated Employment and Non-Competition Agreement, dated as of June 12, 2006, by and among Anthony N. Truesdale, VS Parent, Inc., VS Holdings, Inc. and Vitamin Shoppe Industries Inc. § ‡ ‡ ‡ | |
| 10.19 | Amendment to Amended and Restated Employment and Non-Competition Agreement, dated as of December 28, 2007, by and among Anthony N. Truesdale, VS Parent, Inc., VS Holdings, Inc. and Vitamin Shoppe Industries Inc. § * | |
| 10.20 | Amendment No. 2 to Employment and Non-Competition Agreement, dated as of September 25, 2009 by and among Anthony Truesdale, VS Parent, Inc., Vitamin Shoppe Industries Inc. and Vitamin Shoppe, Inc. (f/k/a VS Holdings, Inc.). ‡ ‡ ‡ ‡ | |
| 10.21 | Employment and Non-Competition Agreement, dated as of April 16, 2007, by and among Michael G. Archbold, VS Parent, Inc., VS Holdings, Inc. and Vitamin Shoppe Industries Inc. § * * * | |
| 10.22 | Amendment to Employment and Non-Competition Agreement, dated as of December 28, 2007, by and among Michael G. Archbold, VS Parent, Inc. and VS Holdings, Inc. and Vitamin Shoppe Industries Inc. § ‡ ‡ ‡ ‡ | |
| 10.23 | Amendment No. 2 to Employment and Non-Competition Agreement, dated as of September 25, 2009 by and among Michael G. Archbold, VS Parent, Inc., Vitamin Shoppe Industries Inc. and Vitamin Shoppe, Inc. (f/k/a VS Holdings, Inc.). ‡ ‡ ‡ ‡ | |
| 10.24 | Fourth Amended and Restated Employment and Non-Competition Agreement, dated as of September 4, 2009, by and among Thomas A. Tolworthy, VS Parent, Inc. and Vitamin Shoppe, Inc. (f/k/a VS Holdings, Inc.) and Vitamin Shoppe Industries Inc. † † | |
| 10.25 | Employment and Non-Competition Agreement, dated as of January 15, 2007, by and among Louis H. Weiss, VS Parent, Inc., VS Holdings, Inc., VS Direct, Inc., and Vitamin Shoppe Industries, Inc. § * * | |
| 10.26 | Amendment to Employment and Non-Competition Agreement, dated as of December 28, 2007, by and among Louis H. Weiss, VS Parent, Inc., VS Holdings, Inc., VS Direct, Inc. and Vitamin Shoppe Industries Inc. § * | |
| 10.27 | Amendment to Employment Agreement, dated as of June 12, 2006, by and among Cosmo La Forgia, VS Parent, Inc., Vitamin Shoppe Industries Inc. and VS Holdings, Inc. § ‡ ‡ ‡ | |
| 10.28 | Second Amendment to Employment Agreement, dated as of December 28, 2007, by and among Cosmo La Forgia, VS Parent, Inc., Vitamin Shoppe Industries Inc. and VS Holdings, Inc. § * | |
| 10.29 | Third Amendment to Employment Agreement, dated as of March 6, 2008, by and among Cosmo La Forgia, VS Parent, Inc., Vitamin Shoppe Industries Inc. and VS Holdings, Inc. § * | |
Table of Contents
| EXHIBIT NO. |
DESCRIPTION | |
| 10.30 | Letter Agreement dated April 20, 2010, Amending the Loan and Security Agreement, dated as of September 25, 2009, by and among Vitamin Shoppe Industries Inc. and VS Direct Inc. as borrowers, Vitamin Shoppe, Inc. as Guarantor, the Lenders and Issuing Bank from time to time party thereto, and JPMorgan Chase Bank, N.A. as Administrative Agent. **** | |
| 21.1 | Subsidiaries of the Registrant. ‡ ‡ ‡ | |
| 23.1 | Consent of Independent Registered Public Accounting Firm. v | |
| 23.2 | Consent of Kirkland & Ellis LLP (included in Exhibit 5.1). v | |
| v | Filed herewith. |
| ‡ | Incorporated by reference to our Current Report on Form 8-K, filed on November 2, 2009 (File No. 001-34507). |
| ‡ ‡ | Incorporated by reference to our Form 10-Q/A, filed on November 13,2009 (File No. 001-34507). |
| ‡ ‡ ‡ | Incorporated by reference to Registration Statement No. 333-134983 on Form S-4 filed on June 13, 2006, as amended (File No. 333-134983-2). |
| ‡ ‡ ‡ ‡ | Incorporated by reference to our Current Report on Form 8-K, filed on September 30, 2009 (File No. 001-34507). |
| * | Incorporated by reference to our Annual report on Form 10-K for the fiscal year ended December 29, 2007, filed on March 28, 2008. |
| * * | Incorporated by reference to our Current Report on Form 8-K, filed on January 16, 2007 (File No. 001-34507). |
| * * * | Incorporated by reference to our Current Report on Form 8-K, filed on April 19, 2007 (File No. 001-34507). |
| * * * * | Incorporated by reference to our Current Report on Form 8-K, filed on April 21, 2010 (File No. 001-34507). |
| † | Incorporated by reference to Amendment No. 5 to our Registration Statement on Form S-1, filed on October 22, 2009 (File No. 333-160756). |
| †† | Incorporated by reference to Amendment No. 2 to our Registration Statement on Form S-1, filed on September 22, 2009 (File No. 333-160756). |
| ††† | Incorporated by reference to Amendment No. 4 to our Registration Statement on Form S-1, filed on October 14, 2009 (File No. 333-160756). |
| †††† | Incorporated by reference to our Annual Report on Form 10-K for the fiscal year ended December 26, 2009. |
| § | Management contract or compensation plan or arrangement. |
| §§ | To be filed by amendment. |