Attached files
| file | filename |
|---|---|
| 8-K - FORM 8-K - PIEDMONT NATURAL GAS CO INC | g23425e8vk.htm |
Exhibit 99.1
| AGA Financial Forum Piedmont Natural Gas May 18, 2010 |
| Forward-Looking Statements Under the Private Securities Litigation Reform Act of 1995 |
| This presentation contains forward-looking statements. These statements are based on management’s current expectations and information currently available and are believed to be reasonable and are made in good faith. However, the forward-looking statements are subject to future events, risks, uncertainties and other factors that could cause actual results to differ materially from those projected in the statements. Factors that may make the actual results differ from anticipated results include, but are not limited to, weather conditions, rate of customer growth, the cost and availability of natural gas, competition from other energy providers, new legislation and regulation and application of existing laws and regulations, economic and capital market conditions, the cost and availability of labor and materials, and other uncertainties, all of which are difficult to predict and some of which are beyond our control. For these reasons, you should not rely on these forward-looking statements when making investment decisions. The words “expect,” “believe,” “project,” “anticipate,” “intend,” “should,” “could,” “will,” “assume,” “can,” “estimate,” “forecast,” “future,” “indicate,” “outlook,” “plan,” “predict,” “seek,” “target,” “would,” and variations of such words and similar expressions are intended to identify forward-looking statements. Forward-looking statements are only as of the date they are made and we do not undertake any obligation to update publicly any forward-looking statement, either as a result of new information, future events or otherwise. More information about the risks and uncertainties relating to these forward-looking statements may be found in Piedmont’s most recent Form 10-K or Form 10-Q, which are available on the SEC’s website at http://www.sec.gov. |
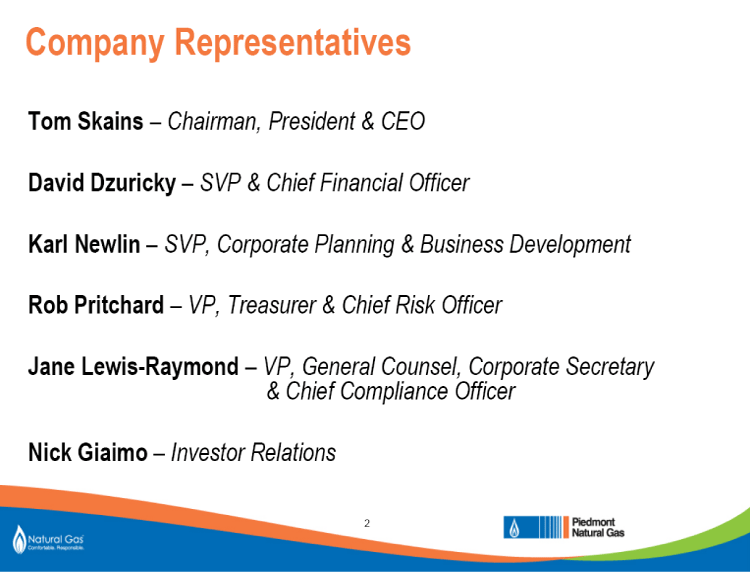
| Company Representatives Tom Skains — Chairman, President & CEO David Dzuricky — SVP & Chief Financial Officer Karl Newlin — SVP, Corporate Planning & Business Development Rob Pritchard — VP, Treasurer & Chief Risk Officer Jane Lewis-Raymond — VP, General Counsel, Corporate Secretary & Chief Compliance Officer Nick Giaimo — Investor Relations |
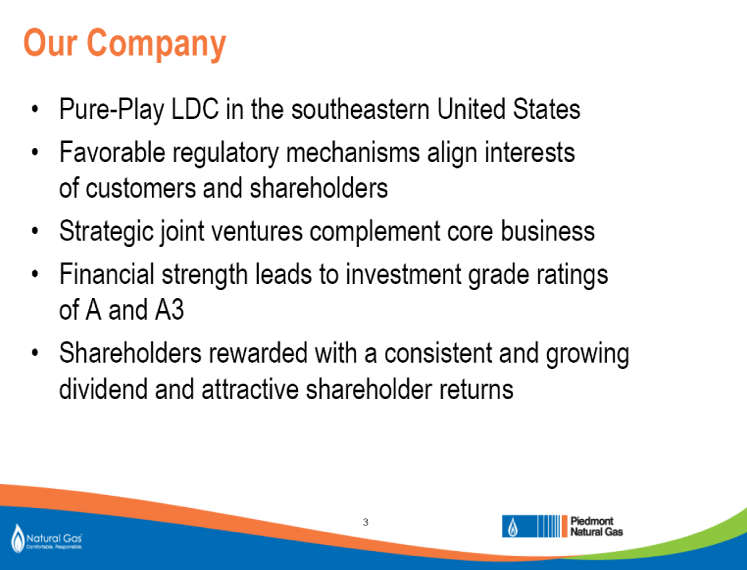
| Our Company • Pure-Play LDC in the southeastern United States • Favorable regulatory mechanisms align interests of customers and shareholders • Strategic joint ventures complement core business • Financial strength leads to investment grade ratings of A and A3 • Shareholders rewarded with a consistent and growing dividend and attractive shareholder returns |
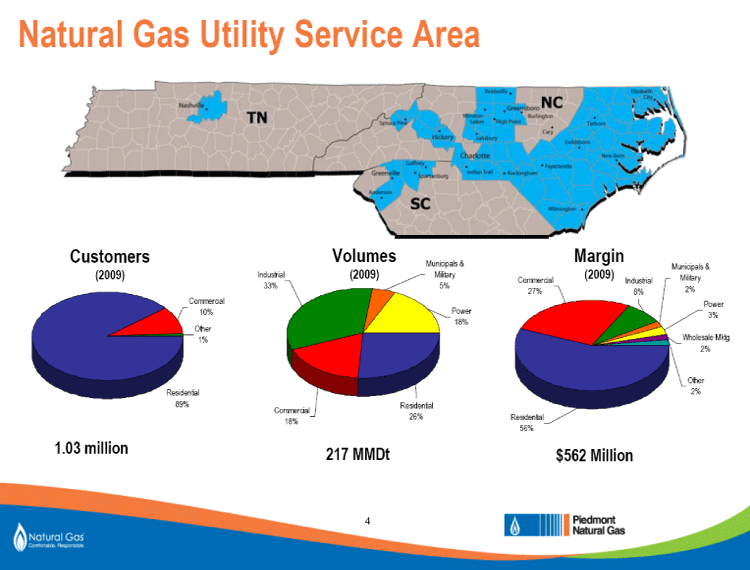
| Natural Gas Utility Service Area Customers Volumes Margin Municipals & Municipals & (2009) Industrial (2009) Military (2009) Military Commercial Industrial 33% 5% 2% 27% 8% Commercial Power 10% Power 3% 18% Other 1% Wholesale Mktg 2% Other Residential 2% 89% Residential Commercial 26% Residential 18% 56% 1.03 million 217 MMDt $562 Million |
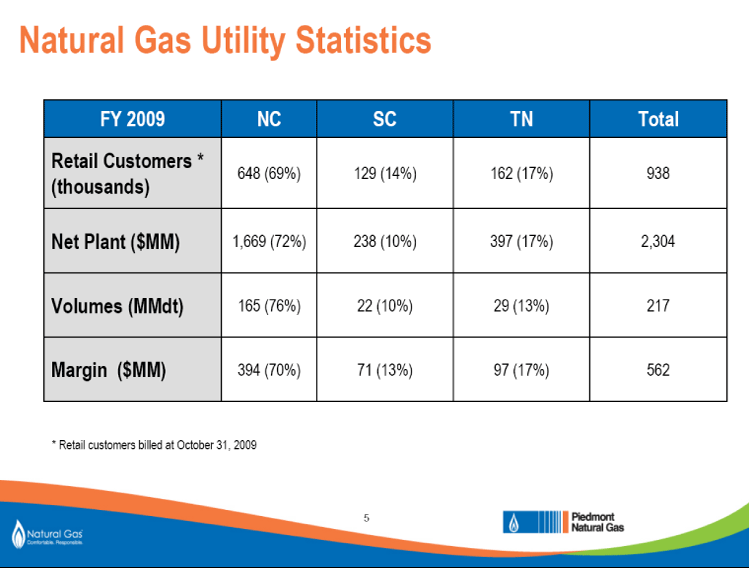
| Natural Gas Utility Statistics FY 2009 NC SC TN Total Retail Customers * 648 (69%) 129 (14%) 162 (17%) 938 (thousands) Net Plant ($MM) 1,669 (72%) 238 (10%) 397 (17%) 2,304 Volumes (MMdt) 165 (76%) 22 (10%) 29 (13%) 217 Margin ($MM) 394 (70%) 71 (13%) 97 (17%) 562 * Retail customers billed at October 31, 2009 |
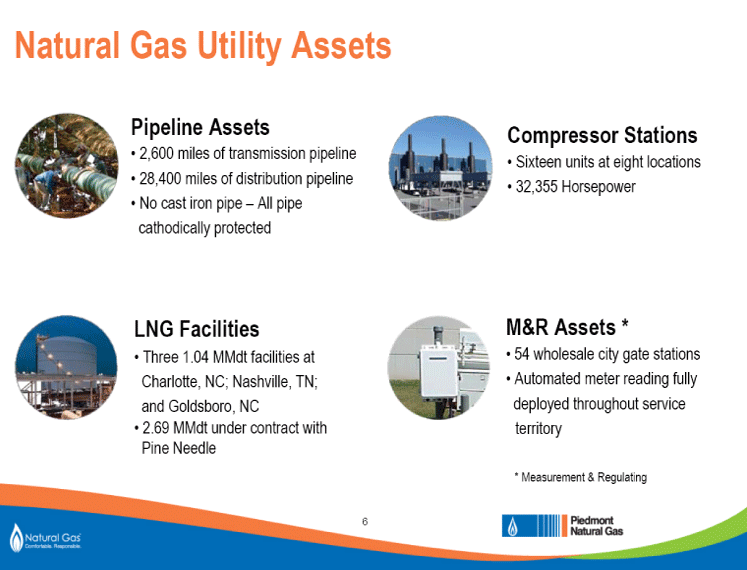
| Natural Gas Utility Assets Pipeline Assets • 2,600 miles of transmission pipeline • 28,400 miles of distribution pipeline • No cast iron pipe — All pipe cathodically protected LNG Facilities • Three 1.04 MMdt facilities at Charlotte, NC; Nashville, TN; and Goldsboro, NC • 2.69 MMdt under contract with Pine Needle Compressor Stations • Sixteen units at eight locations • 32,355 Horsepower M&R Assets * • 54 wholesale city gate stations • Automated meter reading fully deployed throughout service territory * Measurement & Regulating |
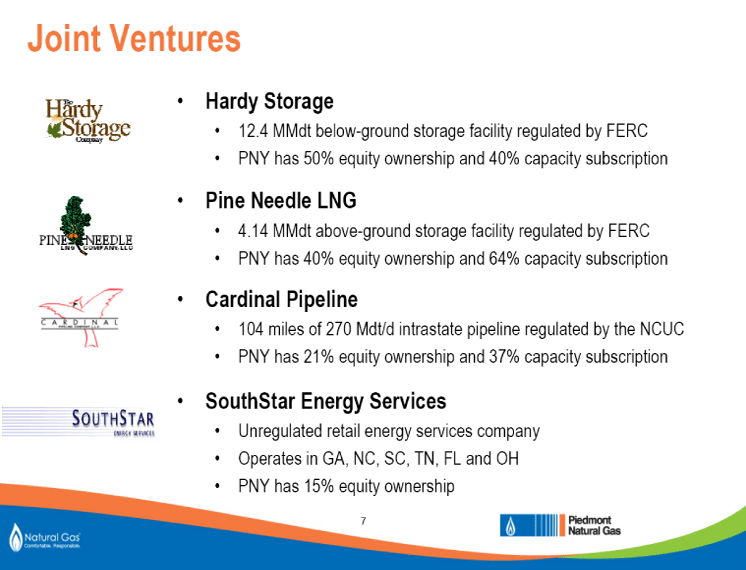
| Joint Ventures • Hardy Storage • 12.4 MMdt below-ground storage facility regulated by FERC • PNY has 50% equity ownership and 40% capacity subscription • Pine Needle LNG • 4.14 MMdt above-ground storage facility regulated by FERC • PNY has 40% equity ownership and 64% capacity subscription • Cardinal Pipeline • 104 miles of 270 Mdt/d intrastate pipeline regulated by the NCUC • PNY has 21% equity ownership and 37% capacity subscription • SouthStar Energy Services • Unregulated retail energy services company • Operates in GA, NC, SC, TN, FL and OH • PNY has 15% equity ownership |
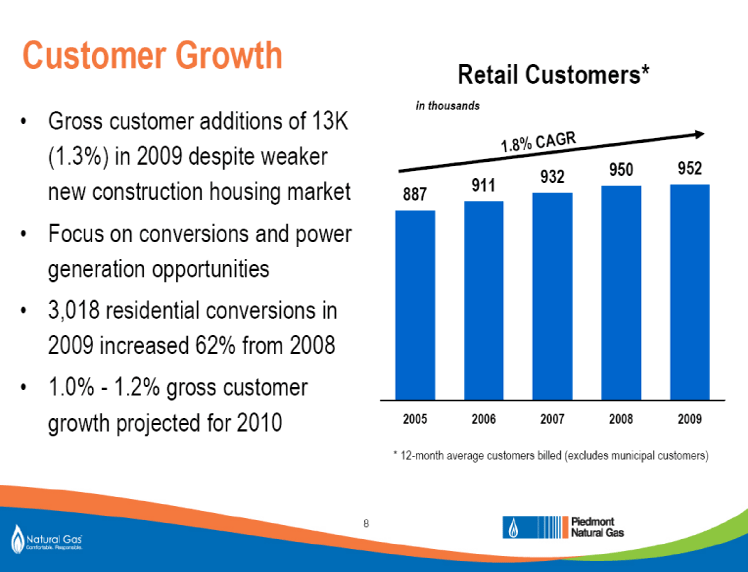
| Customer Growth • Gross customer additions of 13K (1.3%) in 2009 despite weaker new construction housing market • Focus on conversions and power generation opportunities • 3,018 residential conversions in 2009 increased 62% from 2008 • 1.0% — 1.2% gross customer growth projected for 2010 Retail Customers* in thousands .8% CAGR 1 932 950 952 911 887 2005 2006 2007 2008 2009 * 12-month average customers billed (excludes municipal customers) |
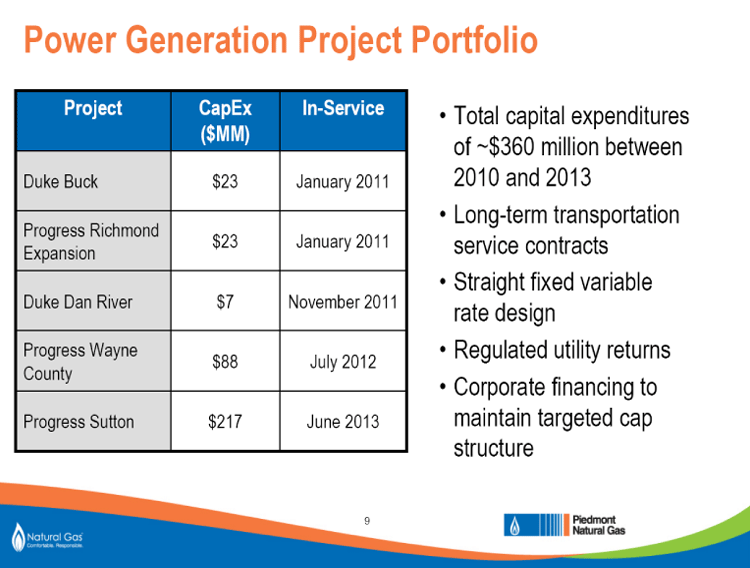
| Power Generation Project Portfolio Project CapEx In-Service ($MM) Duke Buck $23 January 2011 Progress Richmond $23 January 2011 Expansion Duke Dan River $7 November 2011 Progress Wayne $88 July 2012 County Progress Sutton $217 June 2013 • Total capital expenditures of ~$360 million between 2010 and 2013 • Long-term transportation service contracts • Straight fixed variable rate design • Regulated utility returns • Corporate financing to maintain targeted cap structure |
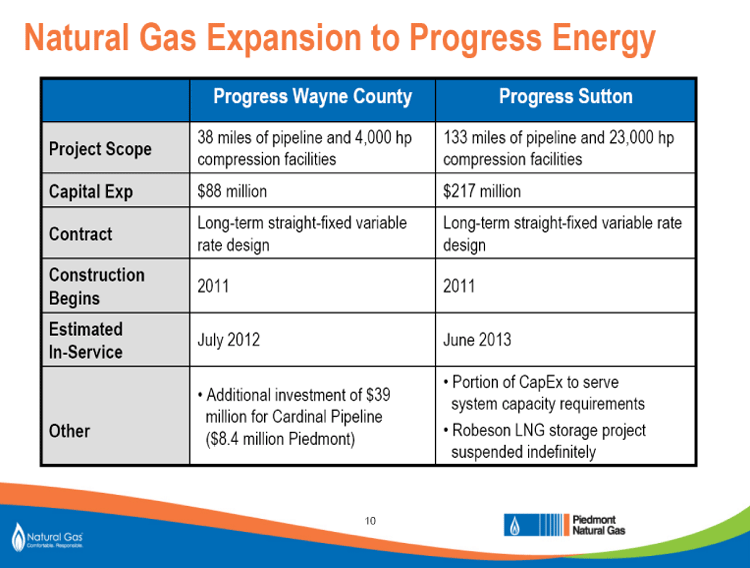
| Natural Gas Expansion to Progress Energy Progress Wayne County Progress Sutton 38 miles of pipeline and 4,000 hp 133 miles of pipeline and 23,000 hp Project Scope compression facilities compression facilities Capital Exp $88 million $217 million Long-term straight-fixed variable Long-term straight-fixed variable rate Contract rate design design Construction 2011 2011 Begins Estimated July 2012 June 2013 In-Service • Portion of CapEx to serve • Additional investment of $39 system capacity requirements million for Cardinal Pipeline Other • Robeson LNG storage project ($8.4 million Piedmont) suspended indefinitely |
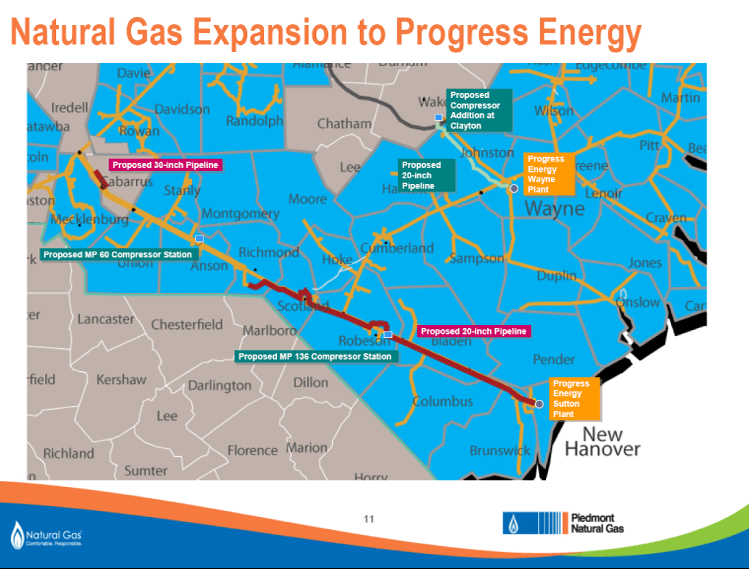
| Natural Gas Expansion to Progress Energy Proposed Proposed Compressor Compressor Addition Addition at at Clayton Clayton Progress Progress Proposed Proposed 30 30—inch inch Pipeline Pipeline Proposed ed Energy 20 20—inch inch Wayne Wayne Pipeline Pipeline Plant Plant Proposed Proposed MP MP 60 60 Compressor Compressor Station Station Proposed Proposed 20 20—inch inch Pipeline Pipeline Proposed Proposed MP MP 136 136 Compressor Compressor Station Station Progress Progress Energy Sutton Plant Plant |
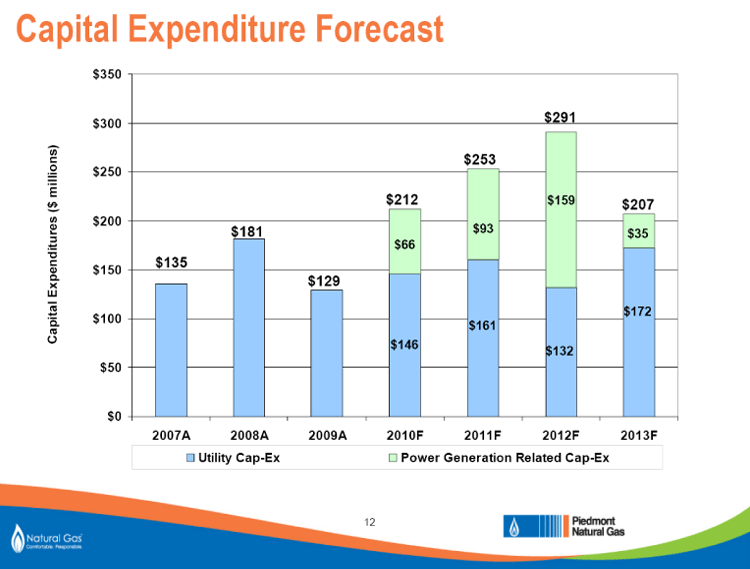
| Capital Expenditure Forecast Capital Expenditures ($ millions) $350 $300 $291 $250 $253 $212 $159 $207 $200 $181 $93 $35 $66 $135 $150 $129 $172 $100 $161 $146 $132 $50 $0 2007A 2008A 2009A 2010F 2011F 2012F 2013F Utility Cap-Ex Power Generation Related Cap-Ex |
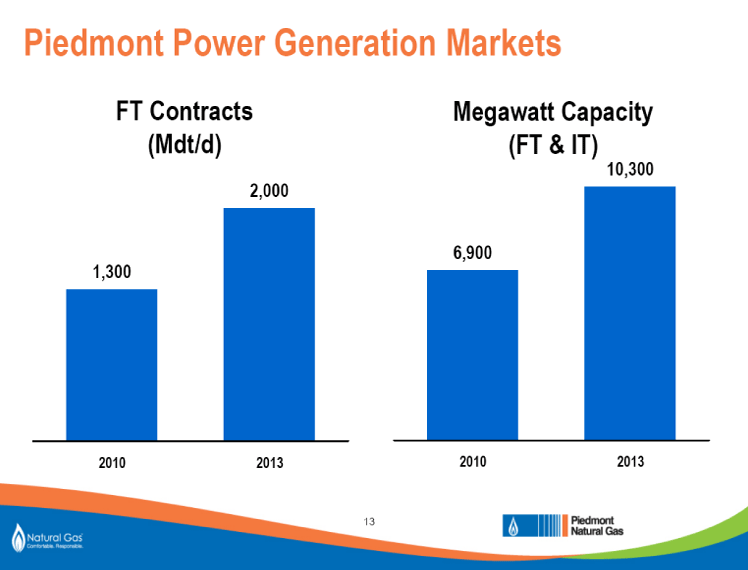
| Piedmont Power Generation Markets FT Contracts Megawatt Capacity (Mdt/d) (FT & IT) 10,300 2,000 6,900 1,300 2010 2013 2010 2013 |
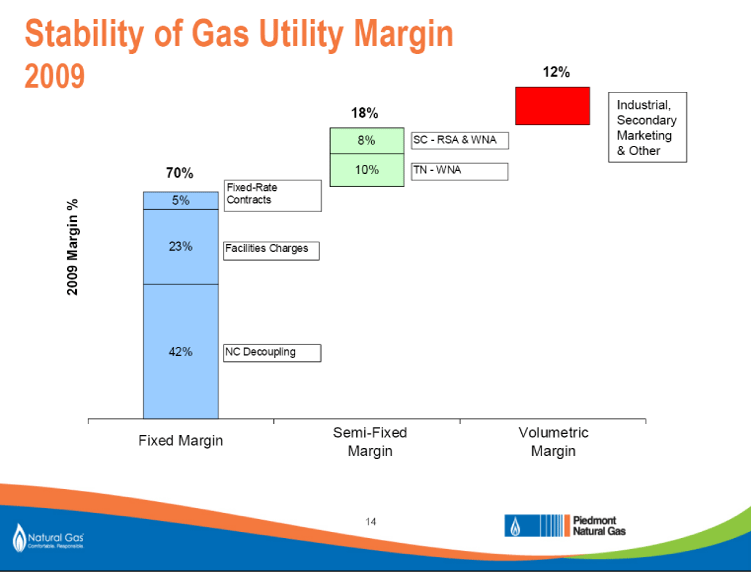
| Stability of Gas Utility Margin 2009 12% Industrial, 18% Secondary 8% SC — RSA & WNA Marketing & Other 70% 10% TN — WNA Fixed-Rate % 5% Contracts Margin 23% Facilities Charges 2009 42% NC Decoupling Semi-Fixed Volumetric Fixed Margin Margin Margin |
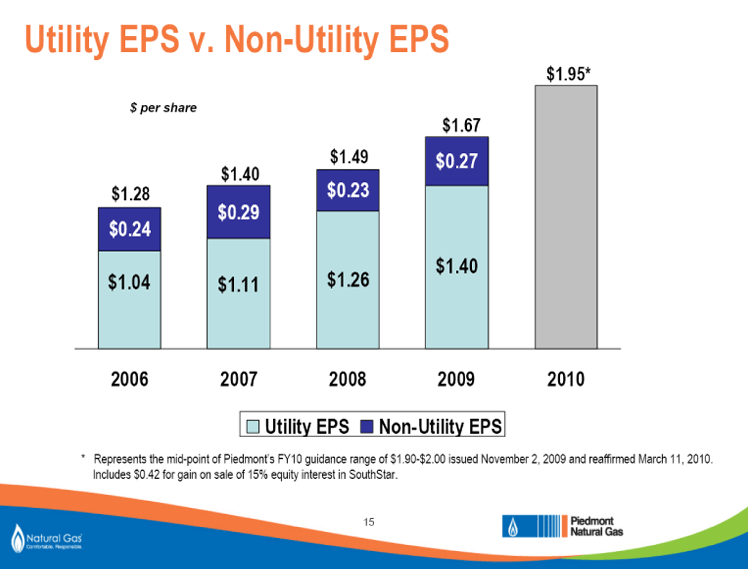
| Utility EPS v. Non-Utility EPS $1.95* $ per share $1.67 $1.49 $0.27 $1.40 $1.28 $0.23 $0.29 $0.24 $1.40 $1.04 $1.11 $1.26 2006 2007 2008 2009 2010 * Represents the mid-point of Piedmont’s FY10 guidance range of $1.90-$2.00 issued November 2, 2009 and reaffirmed March 11, 2010. Includes $0.42 for gain on sale of 15% equity interest in SouthStar. |
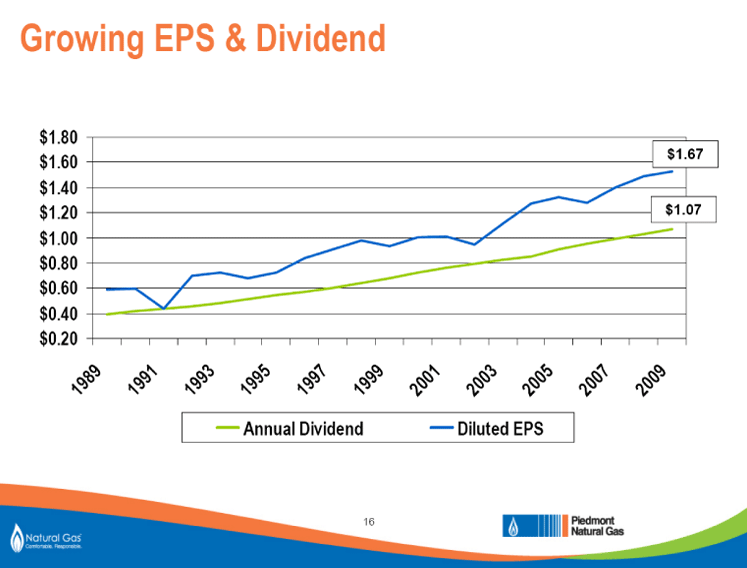
| Growing EPS & Dividend $1.80 $1.60 $1.67 $1.40 $1.20 $1.07 $1.00 $0.80 $0.60 $0.40 $0.20 1989 1991 1 9 93 1 995 1997 1999 2 0 01 2 0 03 2005 2007 2 0 09 Annual Dividend Diluted EPS |

| Questions? |
