Attached files
| file | filename |
|---|---|
| 8-K - FORM 8-K - NTELOS HOLDINGS CORP. | d8k.htm |
 Investor Presentation
First Quarter 2010 Update
Exhibit 99.1 |
 1
Use of Non-GAAP Financial Measures
Included in this presentation are certain non-GAAP financial measures that
are not determined in accordance with US generally accepted accounting
principles. These financial performance measures are not indicative of cash
provided or used by operating activities and exclude the effects
of certain
operating, capital and financing costs and may differ from comparable
information provided by other companies, and they should not be considered
in isolation, as an alternative to, or more meaningful than measures of
financial performance determined in accordance with US generally
accepted
accounting principles. These financial performance measures are
commonly
used in the industry and are presented because NTELOS believes they
provide relevant and useful information to investors. NTELOS utilizes these
financial performance measures to assess its ability to meet future capital
expenditure and working capital requirements, to incur indebtedness if
necessary, and to fund continued growth. NTELOS also uses these
financial
performance measures to evaluate the performance of its business, for
budget planning purposes and as factors in its employee compensation
programs. |
 2
Special Note Regarding Forward-Looking
Statements
Any statements contained in this presentation that are not statements of
historical fact, including statements about our beliefs and expectations, are
forward-looking statements and should be evaluated as such. The words
"anticipates," "believes," "expects," "intends,"
"plans," "estimates," "targets," "projects,"
"should," "may," "will" and similar words and expressions are
intended to identify forward-looking statements. Such forward-looking
statements reflect, among other things, our current expectations, plans and
strategies, and anticipated financial results, all of which are subject to known
and unknown risks, uncertainties and factors that may cause our actual
results to differ materially from those expressed or implied by these forward-
looking statements. Many of these risks are beyond our ability to control or
predict. Because of these risks, uncertainties and assumptions, you should
not place undue reliance on these forward-looking statements. Furthermore,
forward-looking statements speak only as of the date they are made. We do
not undertake any obligation to update or review any forward-looking
information, whether as a result of new information, future events or
otherwise. Important factors with respect to any such forward-looking
statements, including certain risks and uncertainties that could
cause actual
results to differ from those contained in the forward-looking statements,
|
 3
Special Note Regarding Forward-Looking Statements
(cont.)
include, but are not limited to: rapid development and intense competition in
the telecommunications industry; adverse economic conditions; operating
and financial restrictions imposed by our senior credit facility; our cash and
capital requirements; declining prices for our services; the potential to
experience a high rate of customer turnover; our dependence on our
affiliation with Sprint Nextel ("Sprint"); a potential increase in our roaming
rates and wireless handset subsidy costs; the potential for Sprint to build
networks in our markets; federal and state regulatory fees, requirements
and developments; loss of our cell sites; the rates of penetration in the
wireless telecommunications industry; our reliance on certain suppliers and
vendors; and other unforeseen difficulties that may occur. These
risks and
uncertainties are not intended to represent a complete list of all risks and
uncertainties inherent in our business, and should be read in conjunction
with the more detailed cautionary statements and risk factors included in our
SEC filings, including our Annual Reports filed on Forms 10-K.
|
 Company Overview |
 5
Company Overview
•
Leading
provider
of
wireless
and
wireline
communications
services
in
Virginia,
Pennsylvania
and
West
Virginia
•
Strategies
•
Facilities based
•
Retail & Wholesale
•
Multiple products
•
Leverage brand
•
Leverage common cost
•
Wireless revenue 5-year CAGR of 11%
•
Exclusive
strategic
wholesale
Sprint
agreement
through
July
2015
•
Wireline
business includes CLECs
with double digit strategic high-speed broadband product
revenue
growth
and
RLECs
with
strong
Adjusted
EBITDA
margins
•
Continued
revenue
growth
fueled
by
investments
in
cell
sites
and
fiber
network
upgrades
and acquisitions
•
Strong growth in Free Cash Flows |
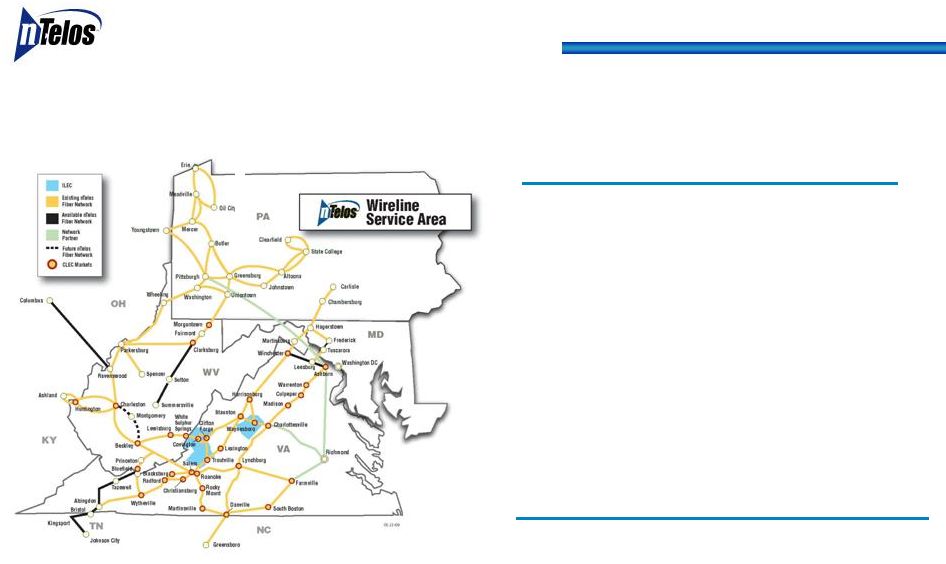
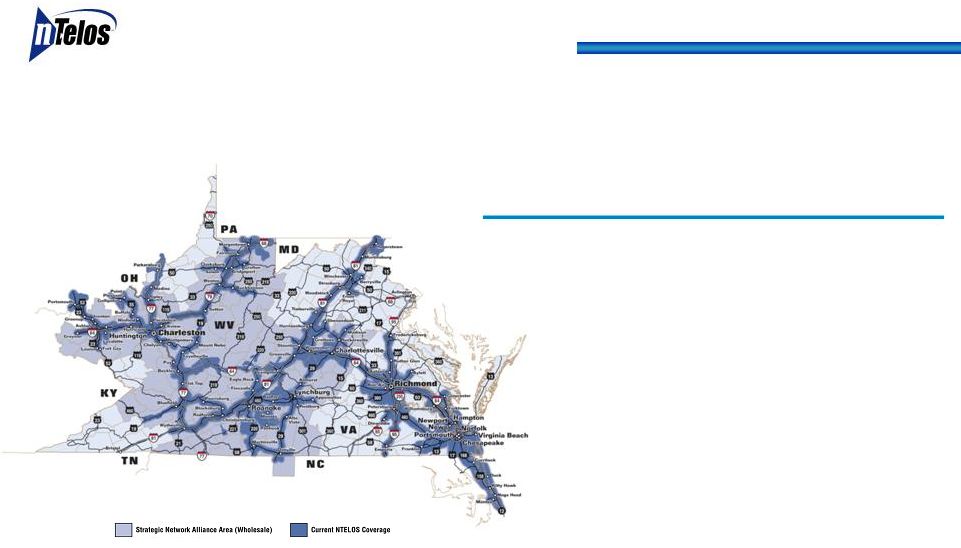 6
Regionally-Focused Service Provider
($ in millions)
(1)
As of March 31, 2010 or for the twelve months ended March 31, 2010
(2)
Throughout this presentation, year over year (YOY) comparisons are
calculated using the twelve months ended on March 31, 2009 and March 31,
2010
•
Average of 23.0 MHz of spectrum
•
5.6 million covered POPs
•
445K
(1)
retail subscribers
•
Data ARPU growth of 26% driven by EV-DO
upgrade and expanded prepay data offerings
•
Wholesale revenues (primarily Sprint Nextel
agreement) of $117 million
•
37% YTD Adjusted EBITDA margin
Wireless
($420M
Revenue
/
$157M
Adj.
EBITDA)
(1)
(2) |
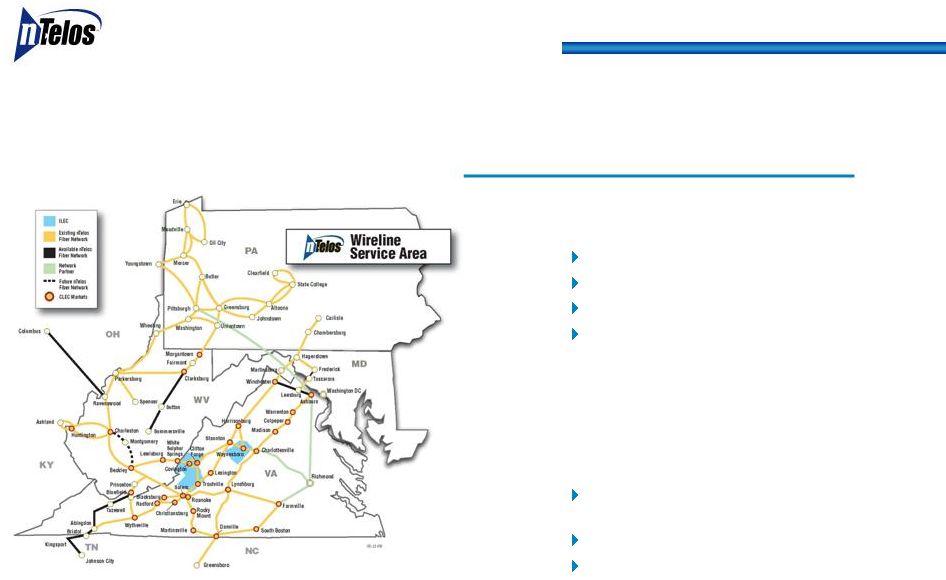 7
Wireline: Repositioning as High Speed Data Provider
(1)
($ in millions)
(1)
As of March 31, 2010 or for the twelve months ended March 31, 2010
Competitive Segment
•
Commercial or Institutional
Healthcare
Government
Education
Regional Banking
•
22% YoY
growth in strategic broadband and
video services
•
45% Adjusted EBITDA margin
•
Acquisition of 2,200 fiber route mile assets of
Allegheny Energy, Inc. on 12/31/09 nearly
doubled the network
Integration on schedule with key initiatives
completed
25 new markets
50% more colleges and universities
•
RLEC -
Growth in Data and Video
•
98% DSL coverage with 6 MB speed
•
23% IPTV penetration of homes passed with fiber;
30%-35% penetration of neighborhoods available over
18 months
Wireline
($127M
Revenue
/
$72M
Adj.
EBITDA)
(1) |
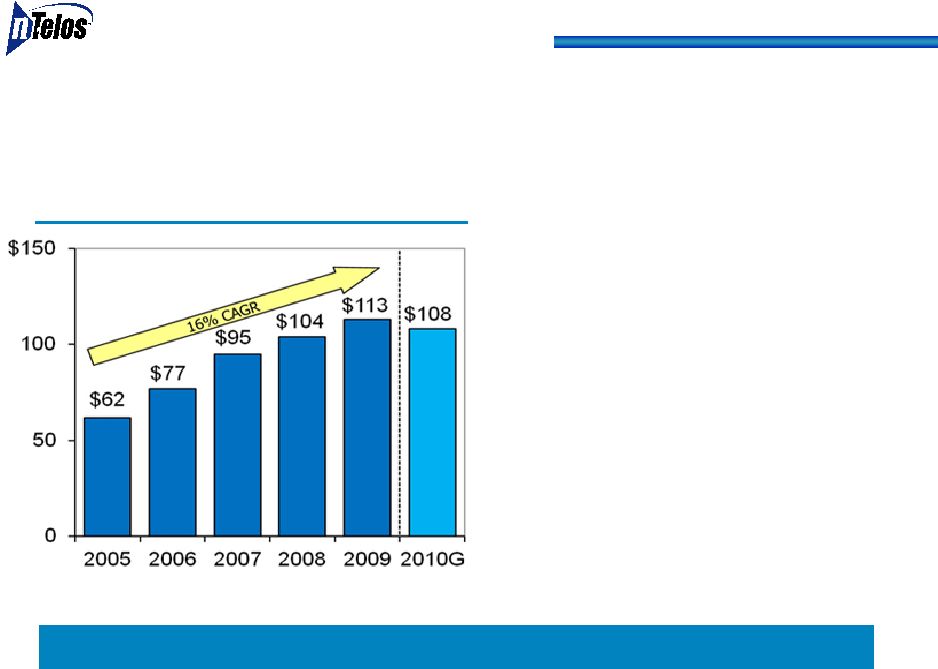
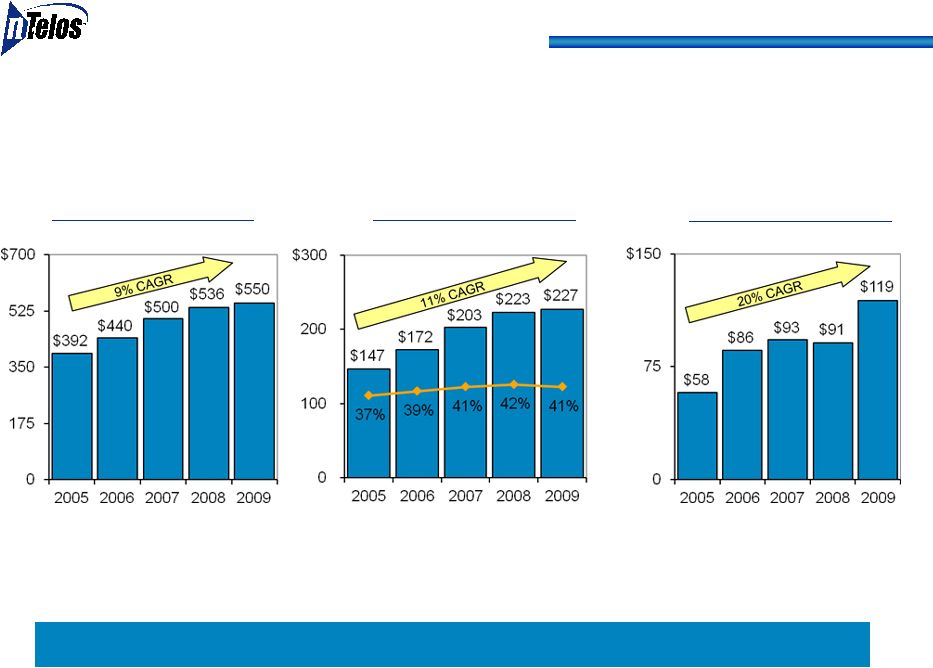 8
Focused on Growth Opportunities
($ in millions)
Total Revenue
Total Adj. EBITDA/
Margin %
(1)
Throughout this presentation, Free Cash Flow is defined as Consolidated Adjusted EBITDA less
CAPEX, exclusive of $26.7 million of fiber optics and network assets and transport and
data service contract assets acquired from Alleghany Energy, Inc. on December 31, 2009
Note:
Throughout
this
presentation,
Compound
Annual
Growth
Rates
(CAGR)
presented
are
calculated
over
the
period
of
2005
to
2009.
Free Cash Flow
(1)
Strong financial performance |
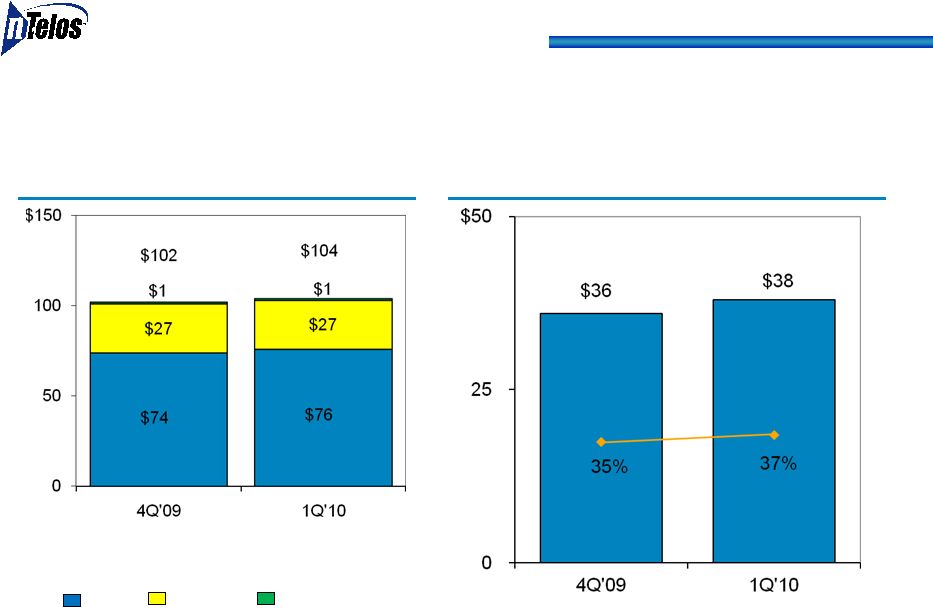
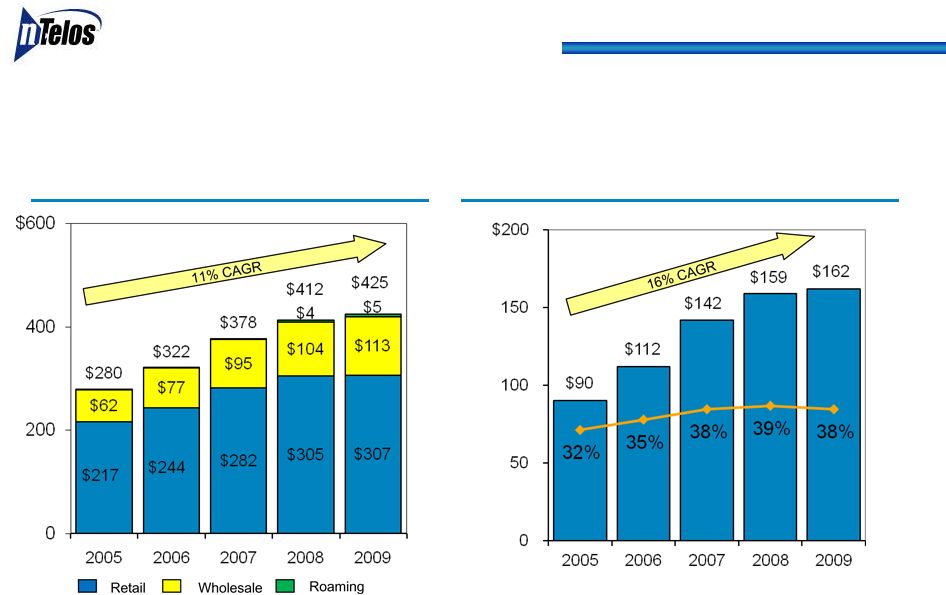 9
Revenue
(1)
Network Upgrade and Data Drives Wireless Growth
($ in millions)
Adjusted EBITDA/Margin %
(1)
Refer to Form 10-K for 2009 for explanation and impact of change from gross to net
reporting of handset insurance revenues and costs effective April 1, 2008
|
 10
Revenue
1Q ‘10 over 4Q ‘09 Wireless Operations
($ in millions)
Adjusted EBITDA/Margin %
Retail
Wholesale
Roaming |
 11
Catalysts for Wireless Growth
•
NTELOS brand positioned as the “Best Value in
Wireless”
•
Leveraging extensive retail presence –
79% of sales
through direct channels
•
Approximately 34,000 total device upgrades in 1Q’10,
up 21% from 1Q’09
•
The most complete nationwide coverage with no
roaming –
“Same Nation. Better Price.”
•
EV-DO upgrade: completed mid-year 2009
•
Emphasis on Postpay
plans
Expansion of data products and services
15 smartphones
& data-centric devices currently
in line-up
•
FRAWG Unlimited prepay in VA East urban markets
Gross adds exceeding expectations
89% FRAWG customers at the two higher price
tiers of $40 and $50 at March 31, 2010
Postpay
Prepay
Gross Adds
Churn
3 Mo 2009
3 Mo 2010
Postpay
2.2%
2.3%
Total
3.1%
3.1% |
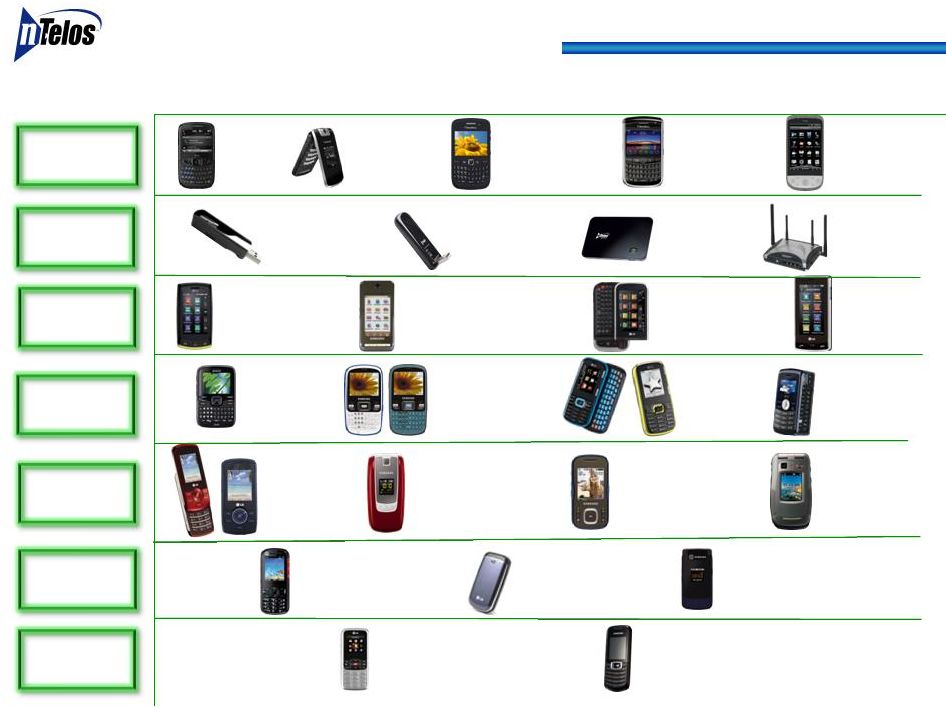 BlackBerry
Curve 8530
Data
Card
QWERTY
Feature
EV-DO
Feature 1X
Value
Touch
Samsung
SCH-r810
Finesse
BlackBerry Flip
8230
Samsung
SCH-r350
Freeform
LG 265
Script
LG 840
Spyder
II
LG 700
Volt
Samsung
SCH-r600
LG 370
Force
HTC Snap
Novatel
MC760
Axesstel
MV440
HTC Hero
Android
Samsung
SCH-r520
Trill
LG 9600
Motorola
W845
Quantico
BlackBerry
Tour 9630
Device Line-up 2Q2010
Device Line-up 2Q2010
Motorola
VE440
Samsung
SCH-r460
MyShot
II
Samsung
SCH-r100
Stunt
LG 100
Smartphone
Novatel
MiFi
Franklin Wireless
U210
LG 9250
Ellipse
Kyocera
S2300
Torino
LG 230
Nite |
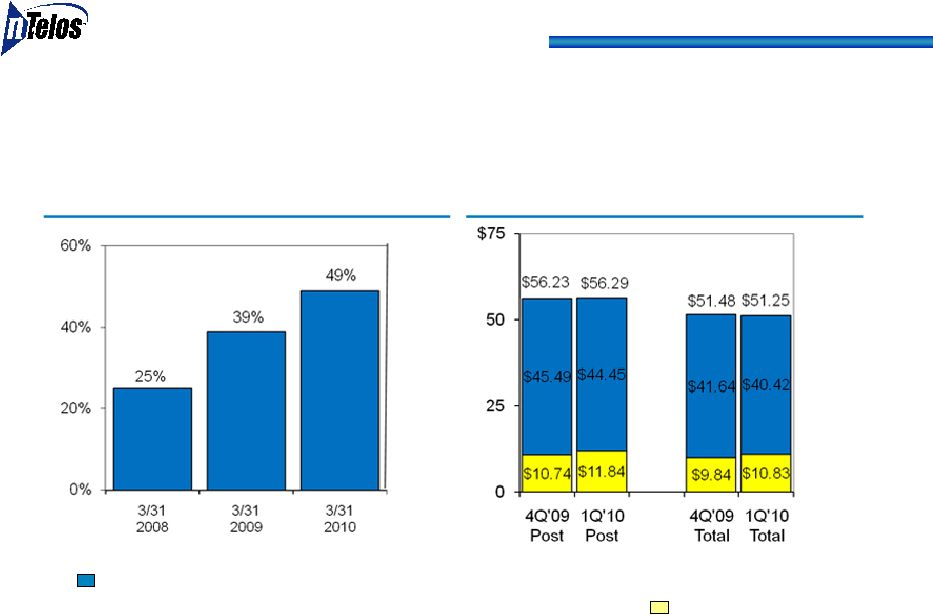 13
Successful Growth in Data Subscribers and ARPU
Retail ARPU
Postpay
Subscribers with EV-DO
Data Devices
Data
Postpay
Subscribers with EV-DO Data Devices |
 VAW
VAE
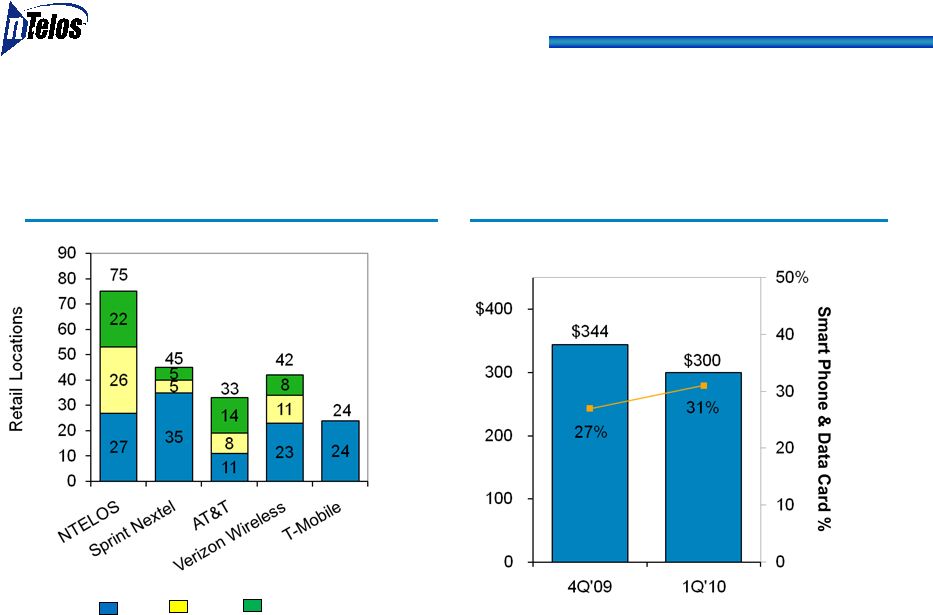
14
Direct Distribution Model Improves Customer
Satisfaction
Extensive
Retail
Presence
(1)
CPGA ($)/Smart Phone & Data
Card %
(2)
(1)
As of December 31, 2009 for all competitors; as of March 31, 2010 for NTELOS
(2)
Represents
Smart
Phone
&
Data
Card
sales
as
a
%
of
Postpay
Gross
Adds
WVA |
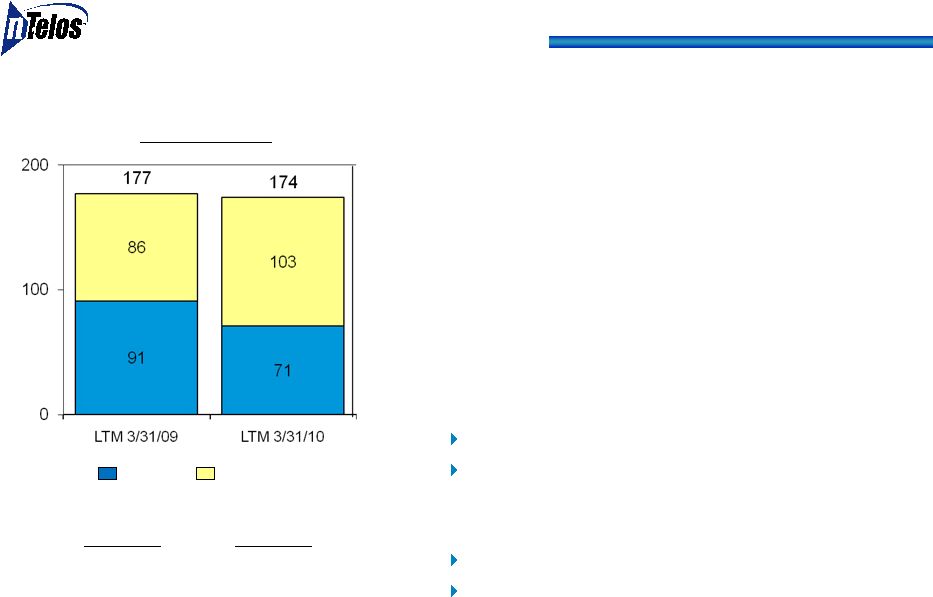
 15
Wireless
Wholesale
Revenue
(1)
Strategic
Network
Alliance
Leverages
NTELOS
’
Network
•
Sprint Nextel Strategic Network
Alliance through at least July 2015
•
$9 million monthly minimum revenue
guarantee
•
Attractive contribution margin
•
Growing Usage
•
Significant growth in both home &
travel data usage since EV-DO
launched
•
Voice traffic back on the rise
($ in millions)
Attractive Margin Revenue Stream
(1)
Excludes roaming |
 16
Greensboro, NC
(1)
As of March 31, 2010 or for the twelve months ended March
31, 2010
($ in millions)
Data Driving Wireline
Growth
(1)
RLEC ($57M Revenue / $42M Adj. EBITDA)
(1)
Competitive
($70M Revenues / $30M Adj.
EBITDA)
(1)
•
Revenue growth of 8% YoY
•
Adjusted EBITDA growth of 19% YoY
•
45% YTD Adjusted EBITDA margin
•
Strategic Broadband and Video revenue
growth of 22% YOY to $40 million
•
4,700 mile existing fiber network including
recently acquired 2,200 mile Allegheny
fiber network
•
3 markets launched in late 2009
•
4 markets to be launched mid-year 2010
•
Repositioning assets (data/video)
•
Broadband customer penetration at 55%
•
IPTV now is available to over 8,000 homes
•
Continued strong Adjusted EBITDA margin |
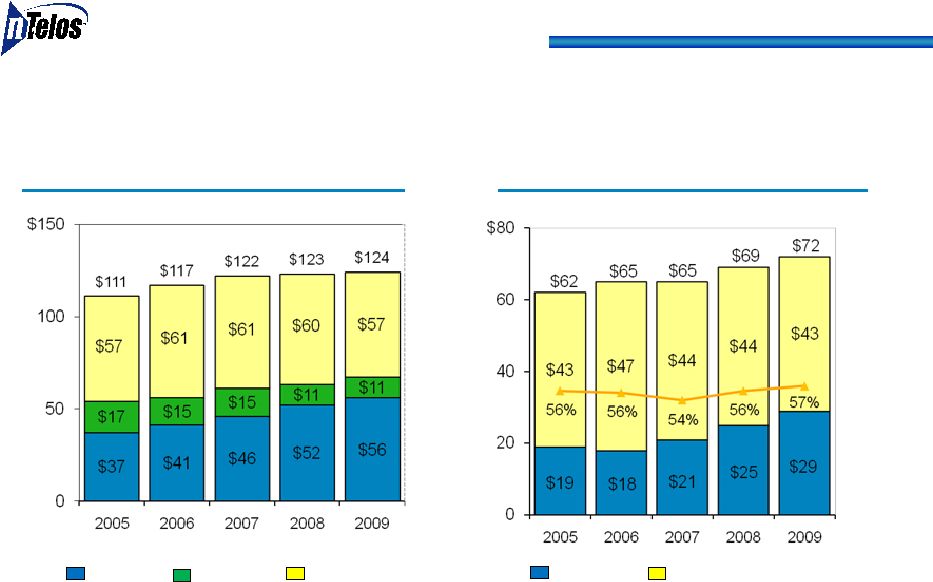 17
Adjusted EBITDA/Margin%
Revenue
Wireline
Provides Strong, Stable Cash Flow
($ in millions)
Note: Competitive -
Strategic includes voice and broadband data services, IPTV video, high-capacity network
access and transport services.
Competitive
-
Strategic
Competitive
-
Other
RLEC
Competitive
RLEC |
 18
Penetration
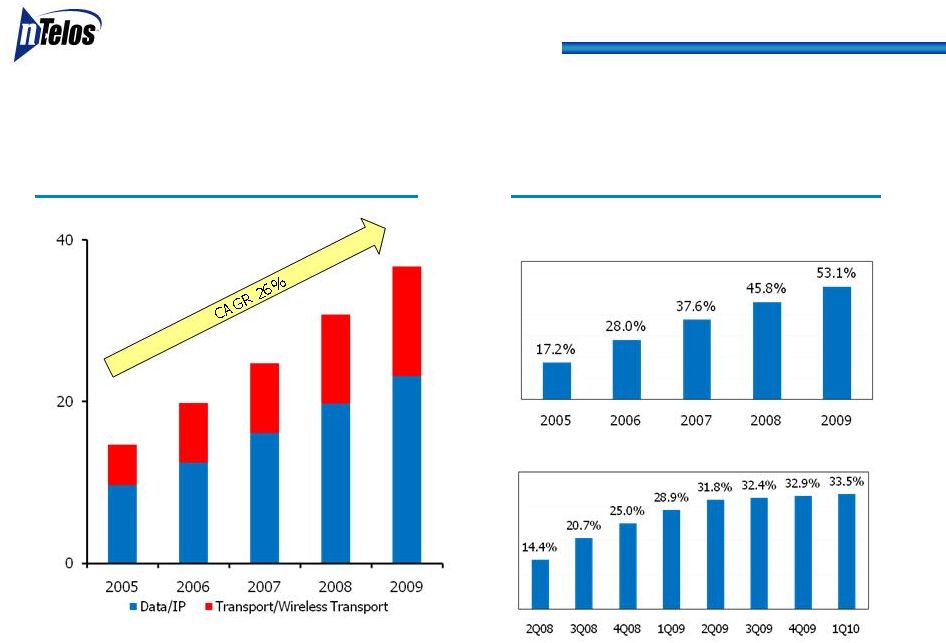
Transport/Data/IP Revenue
Competitive Growth Drivers
($ in millions)
Video
–
Neighborhoods
open
in
1Q-08
Broadband
–
Customer
Penetration
(1) Revenue before intercompany eliminations
(1)
$
$14.7
$19.8
$24.8
$30.8
$36.8 |
 19
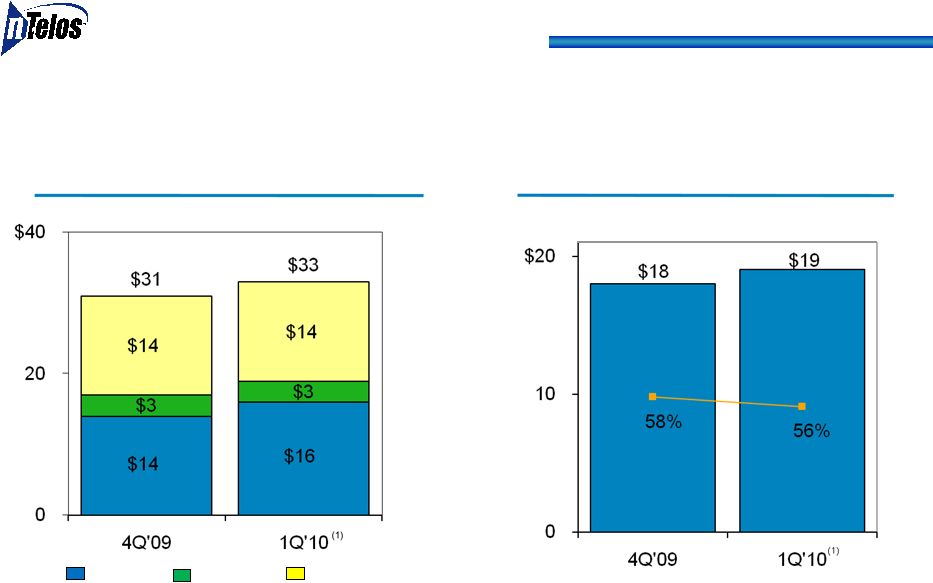
Adjusted EBITDA/Margin%
Revenue
Wireline
YTD ‘10 over YTD ‘09 Strong, Stable Cash Flow
($ in millions)
(1)
Includes contributions from acquisition of certain Alleghany fiber optic and
network assets and related transport and data service contracts on 12/31/09
Competitive
-
Strategic
Competitive
-
Other
RLEC |
 Financial Overview |
 Wireless
Wireline
Other
21
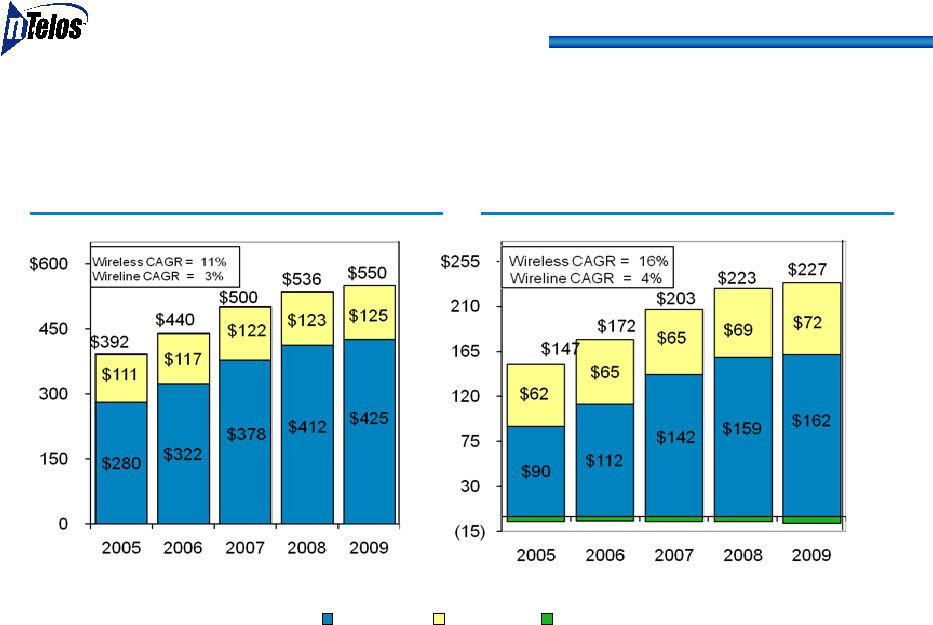
Wireless Drives Revenue Growth
Total Revenue
(1)
($ in millions)
(1)
Refer to Form 10-K for 2009 for explanation and impact of change from gross to net
reporting of handset insurance revenues and costs effective April 1, 2008
Total Adjusted EBITDA |
 22
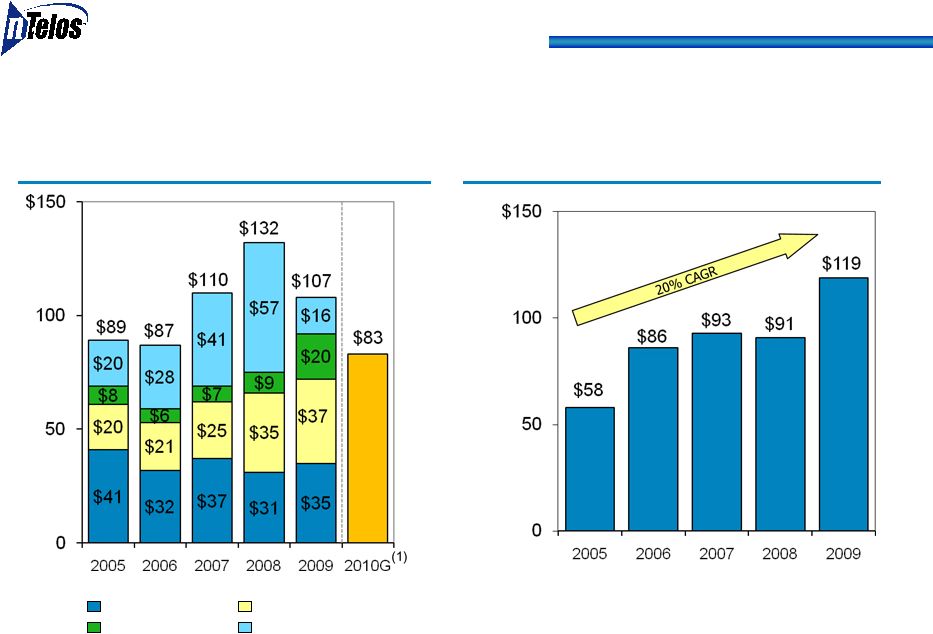
Accelerating Consolidated Free Cash Flow
Free Cash Flow
Consolidated CapEx
($ in millions)
(1)
Based on midpoint of guidance range of $78 million to $87 million
Wireless
Wireline
Other
Discretionary, Incremental EVDO Investment
& Strategic Fiber Builds
Guidance: “Double-digit FCF YOY growth for 2010”
|
 23
Capitalization
($ in millions)
(1)
Debt balances and related ratios are based on actual debt outstanding: Refer to Form 10K
for the year ended December 31, 2009 for carrying basis of debt obligations which are
reported net of unamortized original issuance discounts Adjusted EBITDA
$ 203.0
$ 223.1
$ 227.1
Cash
$ 53.5
$ 65.7
$ 51.1
1st lien senior secured credit facility
(1)
$ 612.9
$ 606.5
$ 633.4
Capital leases
1.3
1.4
1.5
Total Debt
$ 614.2
$ 607.9
$ 634.9
Total Debt Leverage Ratio
3.03x
2.72x
2.80x
Net Debt
(total debt less cash)
$ 560.7
$ 542.2
$ 583.8
Net Debt Leverage Ratio
2.76x
2.43x
2.57x
2007
2008
2009
(1) |
 24
Summary
•
Consistently Strong Financial Performance
•
Numerous
Catalysts
for
Sustainable
Topline
Growth
•
Focused on Long-term Net Income and Free Cash Flow Growth
•
Diversified Business Model
•
Network Upgrade Drives Wireless Growth
•
Data Revenue Growth
•
High-Margin Wholesale Revenue
•
Strong Performing and Growing Regional Wireline
Business Focused
on Data Provision
•
Scalable Systems for Continued Expansion
•
Experienced Management Team |
 Appendix |
 26
Adjusted EBITDA Reconciliation
($ in millions)
2005
2006
2007
2008
2009
3/31/2009
12/31/2009
3/31/2010
Consolidated
Operating Income
$53
$61
$100
$115
$130
$34
$28
$31
Depreciation and Amortization
83
85
97
103
92
23
23
22
Capital and Operational Restructuring
Charges
15
-
-
-
-
-
-
-
Accretion of Asset Retirement Obligations
1
1
1
1
1
-
-
-
Advisory Termination Fees
-
13
-
-
-
-
-
-
Gain on Sale of Assets
(9)
-
-
-
-
-
-
-
Secondary Offering Costs
-
-
1
-
-
-
-
-
Equity Based Compensation
4
13
4
3
3
1
1
1
Voluntary Early Retirement and Workforce Reduction Plans
-
-
-
1
1
-
-
-
Adjusted EBITDA
$147
$172
$203
$223
$227
$58
$52
$54
Three Months Ended |
 27
Adjusted EBITDA Reconciliation
($ in millions)
2005
2006
2007
2008
2009
3/31/2009
12/31/2009
3/31/2010
Wireless
Operating Income
$32
$53
$71
$85
$97
$26
$20
$24
Depreciation and Amortization
57
58
70
73
63
17
15
14
Voluntary Early Retirement and Workforce Reduction Plans
-
-
-
-
1
-
1
-
Accretion of Asset Retirement Obligations
1
1
1
1
1
-
-
-
Adjusted EBITDA
$90
$112
$142
$159
$162
$43
$36
$38
Wireline
Operating Income
$36
$39
$38
$41
$43
$11
$10
$11
Depreciation and Amortization
25
26
27
27
29
7
8
8
Voluntary Early Retirement and Workforce Reduction Plans
-
-
-
1
-
-
-
-
Adjusted EBITDA
$61
$65
$65
$69
$72
$18
$18
$19
Three Months Ended |
 28
ARPU
Reconciliation
($ in thousands, except for subscribers and ARPU data)
Three Months Ended:
Operating Revenues
140,664
$
140,001
$
135,686
$
133,349
$
137,551
$
Less:
Wireline
and
other
operating
revenue
(31,458)
(31,143)
(31,460)
(30,961)
(33,506)
Wireless communications revenue
109,206
108,858
104,226
102,388
104,045
Less: Equipment revenue from sales to new customers
(1,772)
(1,111)
(1,525)
(1,972)
(3,075)
Less: Equipment revenue from sales to existing customers
(5,269)
(4,480)
(4,788)
(3,915)
(4,575)
Less: Wholesale revenue
(30,076)
(31,287)
(28,507)
(28,396)
(28,319)
Less: Other revenues, eliminations and adjustments
53
(858)
856
(625)
(149)
Wireless gross subscriber revenue
72,142
$
71,122
$
70,262
$
67,480
$
67,927
$
Less: Paid in advance subscriber revenue
(18,643)
(17,606)
(15,535)
(16,190)
(16,261)
Plus: Adjustments
(137)
388
(1,121)
387
(214)
Wireless
gross
postpay
subscriber
revenue
53,362
$
53,904
$
53,606
$
51,677
$
51,452
$
Average subscribers
440,629
443,179
440,052
436,970
441,781
Total ARPU
54.58
$
53.49
$
53.22
$
51.48
$
51.25
$
Average postpay
subscribers
312,783
313,661
310,601
306,361
304,670
Postpay
ARPU
56.87
$
57.28
$
57.53
$
56.23
$
56.29
$
Wireless gross subscriber revenue
72,142
$
71,122
$
70,262
$
67,480
$
67,927
$
Less: Wireless voice and other feature revenue
(60,537)
(59,207)
(57,942)
(54,585)
(53,573)
Wireless data revenue
11,605
$
11,915
$
12,320
$
12,895
$
14,354
$
Average subscribers
440,629
443,179
440,052
436,970
441,781
Total Data ARPU
8.78
$
8.96
$
9.33
$
9.84
$
10.83
$
Wireless
gross
postpay
subscriber
revenue
53,362
$
53,904
$
53,606
$
51,677
$
51,452
$
Less:
Wireless
postpay
voice
and
other
feature
revenue
(44,574)
(44,607)
(44,047)
(41,803)
(40,629)
Wireless
postpay
data
revenue
8,788
$
9,297
$
9,559
$
9,874
$
10,823
$
Average postpay
subscribers
312,783
313,661
310,601
306,361
304,670
Postpay
data ARPU
9.37
$
9.88
$
10.26
$
10.74
$
11.84
$
September 30, 2009
December 31, 2009
March 31, 2009
June 30, 2009
March 31, 2010 |
 29
Summary of Operating Results
($ in thousands)
Three Months Ended:
March 31, 2009
June 30, 2009
September 30, 2009
December 31, 2009
March 31, 2010
Operating Revenues
Wireless PCS Operations
109,206
$
108,858
$
104,226
$
102,388
$
104,045
$
Wireline
Operations
RLEC
14,690
14,458
14,395
13,761
14,236
Competitive Wireline
16,643
16,567
16,944
17,083
19,138
Wireline
Total
31,333
31,025
31,339
30,844
33,374
Other
125
118
121
117
132
140,664
$
140,001
$
135,686
$
133,349
$
137,551
$
Operating Expenses
Wireless PCS Operations
66,415
$
64,842
$
65,106
$
66,523
$
65,943
$
Wireline
Operations
RLEC
3,741
3,725
3,326
3,611
4,200
Competitive Wireline
9,849
9,834
9,446
9,416
10,598
Wireline
Total
13,590
13,559
12,772
13,027
14,798
Other
2,558
1,313
1,170
1,685
2,586
82,563
$
79,714
$
79,048
$
81,235
$
83,327
$
Adjusted EBITDA
(a non-GAAP Measure)
Wireless PCS Operations
##
42,791
$
##
44,016
$
39,120
$
35,865
$
38,102
$
Wireline
Operations
RLEC
##
10,949
##
10,733
11,069
10,150
10,036
Competitive Wireline
##
6,794
##
6,733
7,498
7,667
8,540
Wireline
Total
##
17,743
##
17,466
18,567
17,817
18,576
Other
(2,433)
(1,195)
(1,049)
(1,568)
(2,454)
##
58,101
$
##
60,287
$
56,638
$
52,114
$
54,224
$
Wireless PCS Operations
17,951
$
16,668
$
7,759
$
8,369
$
10,208
$
Wireline
Operations
RLEC
2,836
4,025
3,636
819
2,678
Competitive Wireline
7,355
8,001
5,914
4,754
10,521
Wireline
Total
10,191
12,026
9,550
5,573
13,199
Other
3,472
9,231
4,161
2,943
1,984
31,614
$
37,925
$
21,470
$
16,885
$
25,391
$
Wireless PCS Operations
24,840
$
27,348
$
31,361
$
27,496
$
27,894
$
Wireline
Operations
RLEC
8,113
6,708
7,433
9,331
7,358
Competitive Wireline
(561)
(1,268)
1,584
2,913
(1,981)
Wireline
Total
7,552
5,440
9,017
12,244
5,377
Other
(5,905)
(10,426)
(5,210)
(4,511)
(4,438)
26,487
$
22,362
$
35,168
$
35,229
$
28,833
$
1
Adjusted EBITDA less Capital Expenditures
(a non-GAAP measure)
Exclusive of $26.7 million of fiber optics and network assets and transport and data
service contract assets acquired from Allegheny Energy, Inc. on December 31,
2009 (before depreciation & amortization, asset impairment charges,
accretion of asset retirement obligations, equity based compensation, and charges from voluntary early
retirement and workforce reduction plans, a non-GAAP Measure of operating
expenses) 1
1
Capital Expenditures - excluding acquisition of Allegheny fiber assets
1 |