Attached files
| file | filename |
|---|---|
| 8-K - FORM 8-K - GlassBridge Enterprises, Inc. | c58185e8vk.htm |
Exhibit 99.1
| A Global Technology Company: Storing, Protecting, and Connecting a Digital World May 2010 |
| Imation: Storing, Protecting and Connecting 2 Risks and Uncertainties Certain information contained in this presentation which does not relate to historical information may be deemed to constitute forward-looking statements within the meaning of the Private Securities Litigation Reform Act of 1995. Such statements are subject to certain risks and uncertainties that could cause our actual results in the future to differ materially from our historical results and those presently anticipated or projected. We wish to caution investors not to place undue reliance on any such forward-looking statements. Any forward-looking statements speak only as of the date on which such statements are made, and we undertake no obligation to update such statements to reflect events or circumstances arising after such date. Risk factors include our ability to successfully implement our strategy; our ability to grow our business in new products with profitable margins; the possibility that our goodwill, deferred tax assets, or other assets may become further impaired; our ability to introduce new offerings in a timely manner either independently or in association with OEMs or other third parties; the market acceptance of newly introduced product and service offerings; the potential dependence on third parties for new product introductions or technologies in order to introduce our own new products; continuing uncertainty in global and regional economic conditions; foreign currency fluctuations; the volatility of the markets in which we operate; our ability to successfully manage multiple brands globally; our ability to achieve the expected benefits from our strategic relationships and distribution agreements; the competitive pricing environment and its possible impact on profitability and inventory valuations; the ready availability and price of energy and key raw materials or critical components; our ability to meet our revenue growth and cost reduction targets; our ability to secure adequate supply of certain high demand products at acceptable prices; the rate of revenue decline for certain existing products; our ability to efficiently source, warehouse and distribute our products globally; significant changes in discount rates and other assumptions used in the valuation of our pension plans; our ability to continue realizing the benefits from our global manufacturing strategy for magnetic data storage products and the related restructuring; our ability to secure and maintain adequate shelf and display space over time at retailers which conduct semi-annual or annual line reviews; the future financial and operating performance of major customers and industries served; our ability to successfully defend our intellectual property rights and the ability or willingness of our suppliers to provide adequate protection against third party intellectual property or product liability claims; the outcome of any pending or future litigation; the volatility of our stock price due to our results or market trends, as well as various factors set forth from time to time in our filings with the Securities and Exchange Commission. May 2010 |
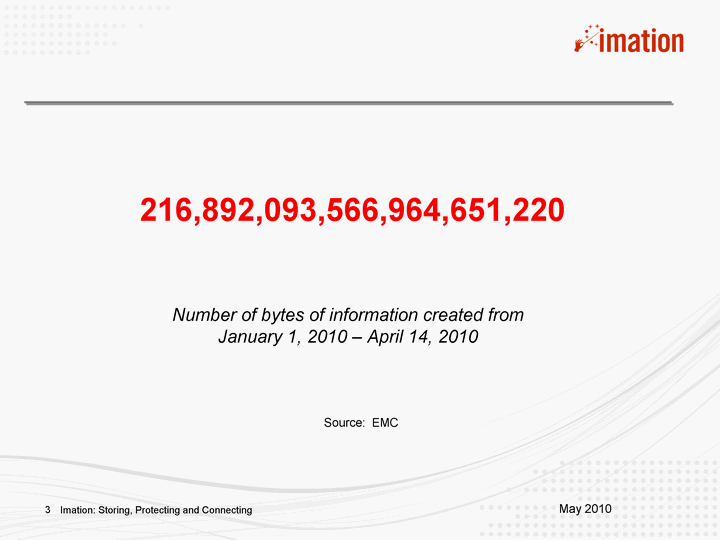
| 216,892,093,566,964,651,220 Number of bytes of information created from January 1, 2010 - April 14, 2010 Source: EMC 3 Imation: Storing, Protecting and Connecting May 2010 |
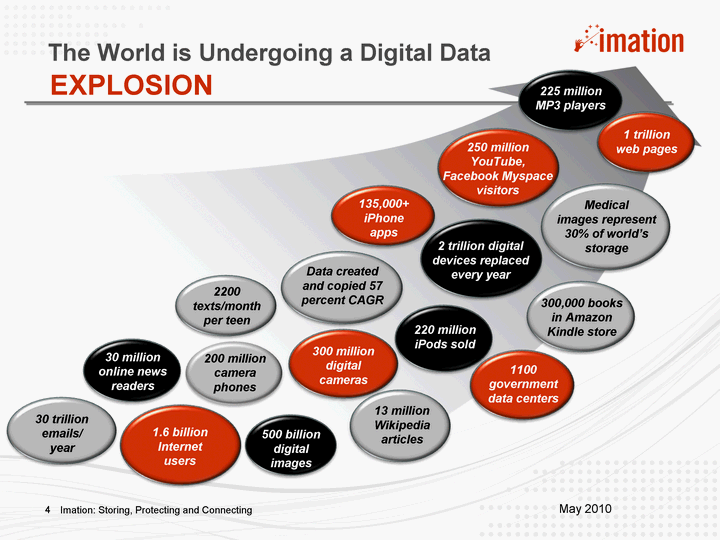
| Imation: Storing, Protecting and Connecting The World is Undergoing a Digital Data 2 trillion digital devices replaced every year 135,000+ iPhone apps 1.6 billion Internet users Medical images represent 30% of world's storage 500 billion digital images 300,000 books in Amazon Kindle store 220 million iPods sold 30 trillion emails/ year 200 million camera phones 30 million online news readers 2200 texts/month per teen 13 million Wikipedia articles 225 million MP3 players Data created and copied 57 percent CAGR 300 million digital cameras 1 trillion web pages 1100 government data centers 250 million YouTube, Facebook Myspace visitors EXPLOSION 4 May 2010 |
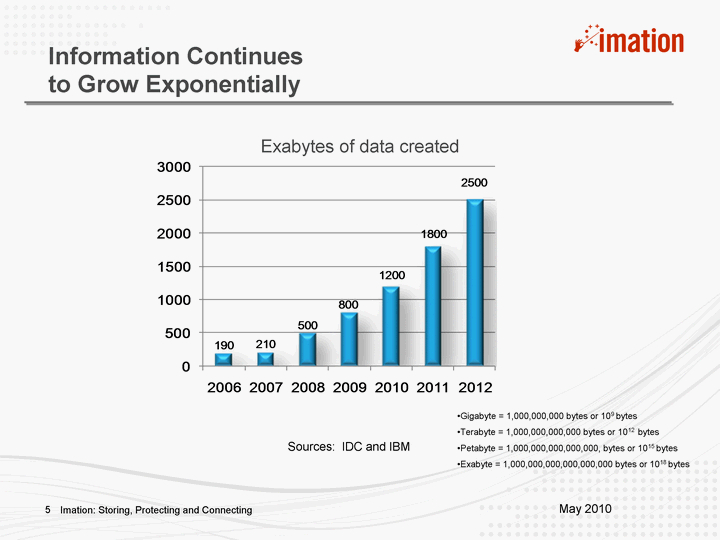
| Information Continues to Grow Exponentially Imation: Storing, Protecting and Connecting Sources: IDC and IBM 5 Exabytes of data created Gigabyte = 1,000,000,000 bytes or 109 bytes Terabyte = 1,000,000,000,000 bytes or 1012 bytes Petabyte = 1,000,000,000,000,000, bytes or 1015 bytes Exabyte = 1,000,000,000,000,000,000 bytes or 1018 bytes May 2010 |
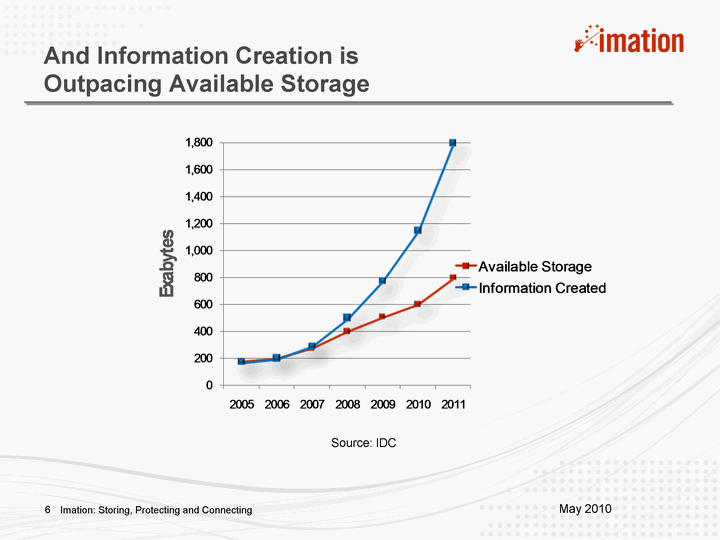
| Imation: Storing, Protecting and Connecting Source: IDC 6 And Information Creation is Outpacing Available Storage May 2010 |
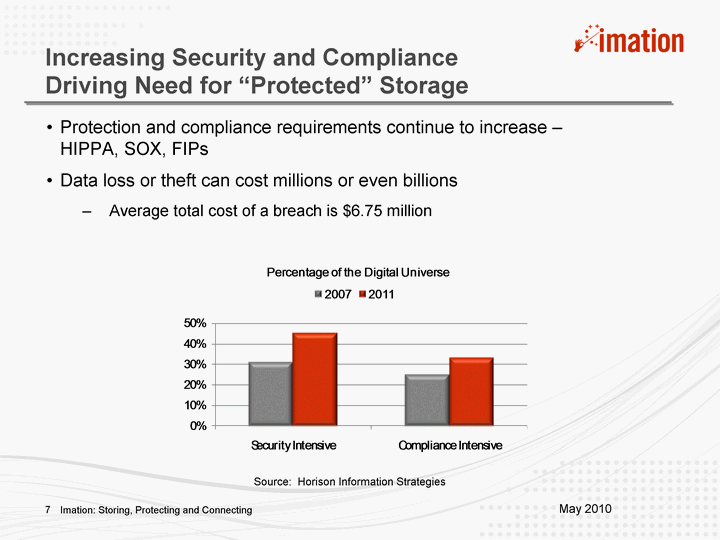
| Protection and compliance requirements continue to increase - HIPPA, SOX, FIPs Data loss or theft can cost millions or even billions Average total cost of a breach is $6.75 million Imation: Storing, Protecting and Connecting Source: Horison Information Strategies 7 Increasing Security and Compliance Driving Need for "Protected" Storage May 2010 |
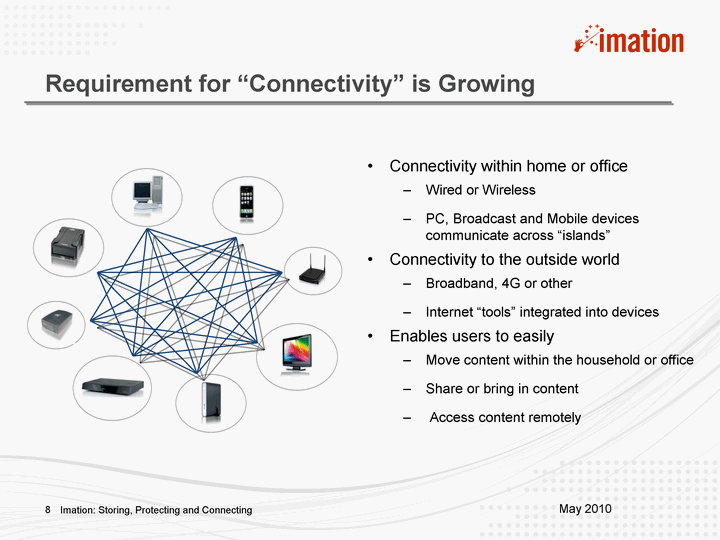
| Requirement for "Connectivity" is Growing Imation: Storing, Protecting and Connecting 8 Connectivity within home or office Wired or Wireless PC, Broadcast and Mobile devices communicate across "islands" Connectivity to the outside world Broadband, 4G or other Internet "tools" integrated into devices Enables users to easily Move content within the household or office Share or bring in content Access content remotely May 2010 |
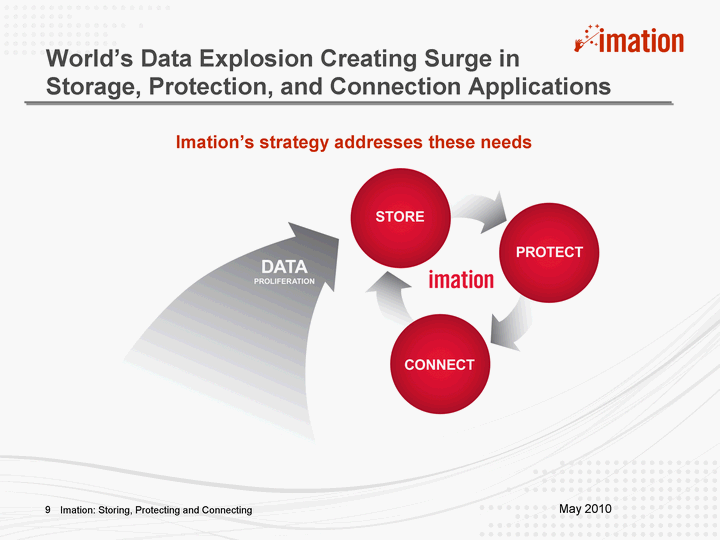
| World's Data Explosion Creating Surge in Storage, Protection, and Connection Applications Imation: Storing, Protecting and Connecting 9 Imation's strategy addresses these needs May 2010 |

| Imation's Product Portfolio: Aligning with Application Needs |
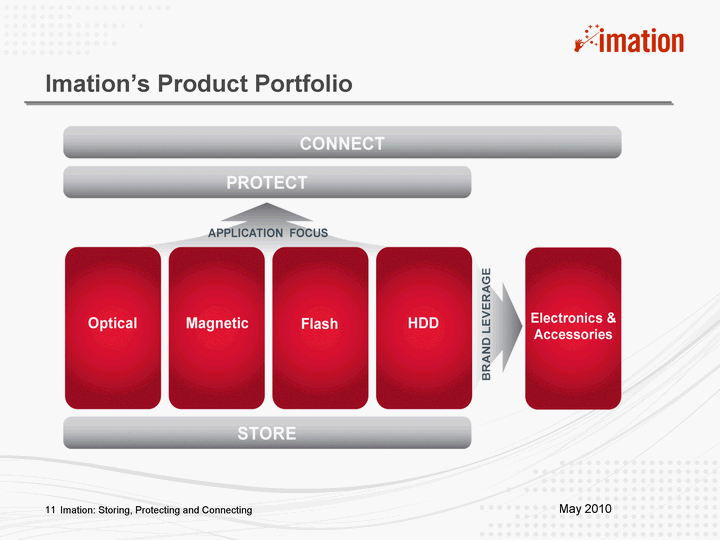
| Imation's Product Portfolio Imation: Storing, Protecting and Connecting 11 May 2010 |
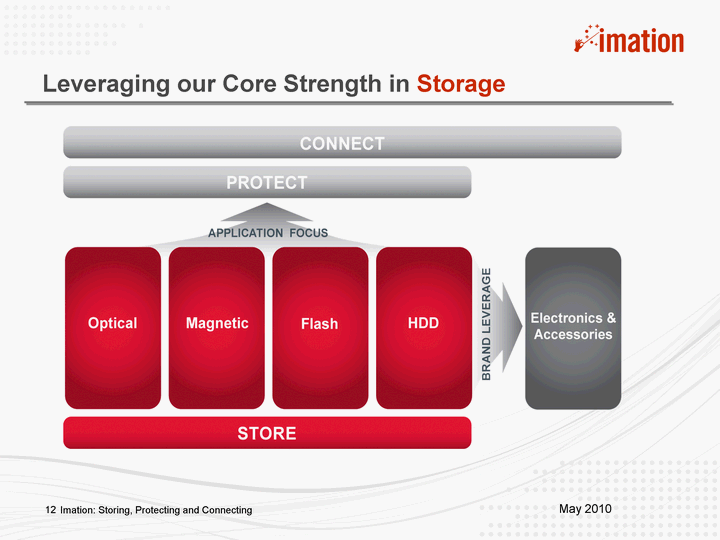
| Leveraging our Core Strength in Storage Imation: Storing, Protecting and Connecting 12 May 2010 |
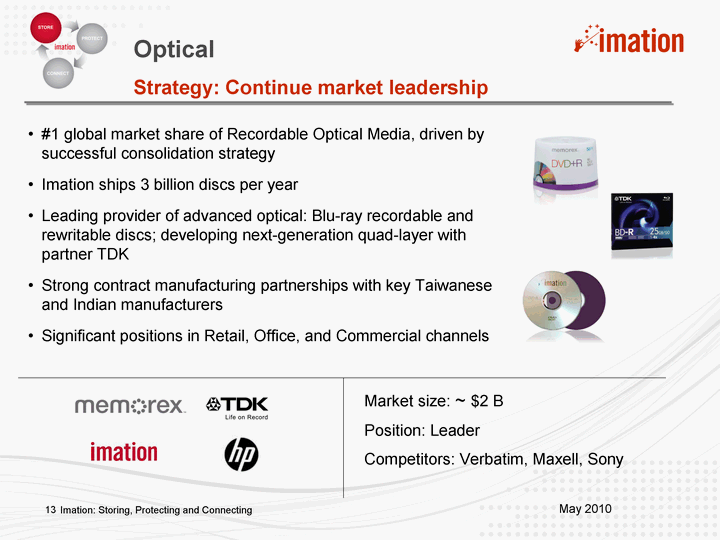
| #1 global market share of Recordable Optical Media, driven by successful consolidation strategy Imation ships 3 billion discs per year Leading provider of advanced optical: Blu-ray recordable and rewritable discs; developing next-generation quad-layer with partner TDK Strong contract manufacturing partnerships with key Taiwanese and Indian manufacturers Significant positions in Retail, Office, and Commercial channels Optical Strategy: Continue market leadership Market size: ~ $2 B Position: Leader Competitors: Verbatim, Maxell, Sony 13 Imation: Storing, Protecting and Connecting May 2010 |
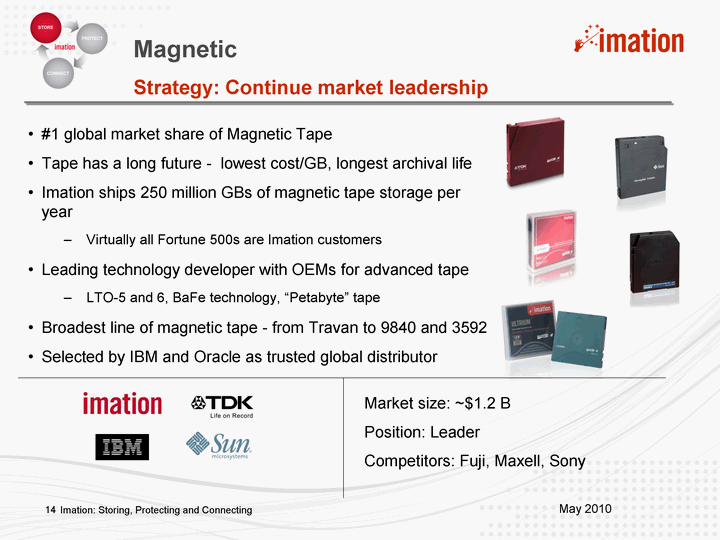
| #1 global market share of Magnetic Tape Tape has a long future - lowest cost/GB, longest archival life Imation ships 250 million GBs of magnetic tape storage per year Virtually all Fortune 500s are Imation customers Leading technology developer with OEMs for advanced tape LTO-5 and 6, BaFe technology, "Petabyte" tape Broadest line of magnetic tape - from Travan to 9840 and 3592 Selected by IBM and Oracle as trusted global distributor Magnetic Strategy: Continue market leadership Market size: ~$1.2 B Position: Leader Competitors: Fuji, Maxell, Sony 14 Imation: Storing, Protecting and Connecting May 2010 |
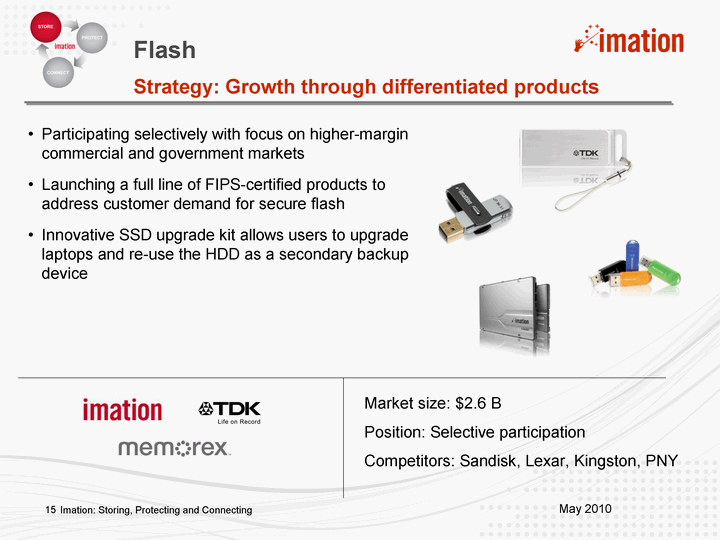
| Participating selectively with focus on higher-margin commercial and government markets Launching a full line of FIPS-certified products to address customer demand for secure flash Innovative SSD upgrade kit allows users to upgrade laptops and re-use the HDD as a secondary backup device Flash Strategy: Growth through differentiated products Market size: $2.6 B Position: Selective participation Competitors: Sandisk, Lexar, Kingston, PNY 15 Imation: Storing, Protecting and Connecting May 2010 |
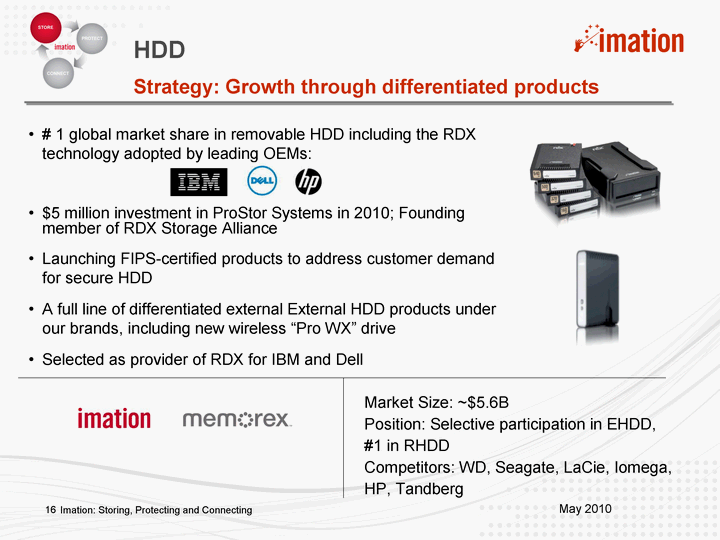
| # 1 global market share in removable HDD including the RDX technology adopted by leading OEMs: $5 million investment in ProStor Systems in 2010; Founding member of RDX Storage Alliance Launching FIPS-certified products to address customer demand for secure HDD A full line of differentiated external External HDD products under our brands, including new wireless "Pro WX" drive Selected as provider of RDX for IBM and Dell HDD Strategy: Growth through differentiated products Market Size: ~$5.6B Position: Selective participation in EHDD, #1 in RHDD Competitors: WD, Seagate, LaCie, Iomega, HP, Tandberg 16 Imation: Storing, Protecting and Connecting May 2010 |
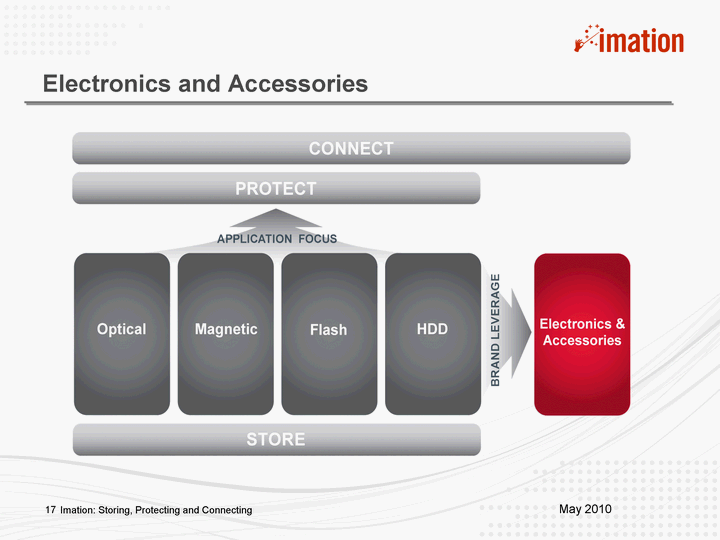
| Electronics and Accessories Imation: Storing, Protecting and Connecting 17 May 2010 Imation: Storing, Protecting and Connecting |
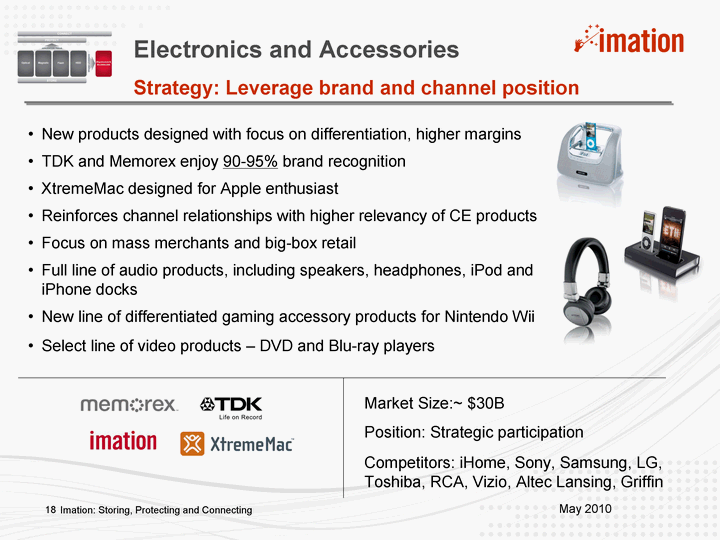
| New products designed with focus on differentiation, higher margins TDK and Memorex enjoy 90-95% brand recognition XtremeMac designed for Apple enthusiast Reinforces channel relationships with higher relevancy of CE products Focus on mass merchants and big-box retail Full line of audio products, including speakers, headphones, iPod and iPhone docks New line of differentiated gaming accessory products for Nintendo Wii Select line of video products - DVD and Blu-ray players Electronics and Accessories Strategy: Leverage brand and channel position Market Size:~ $30B Position: Strategic participation Competitors: iHome, Sony, Samsung, LG, Toshiba, RCA, Vizio, Altec Lansing, Griffin 18 Imation: Storing, Protecting and Connecting May 2010 |
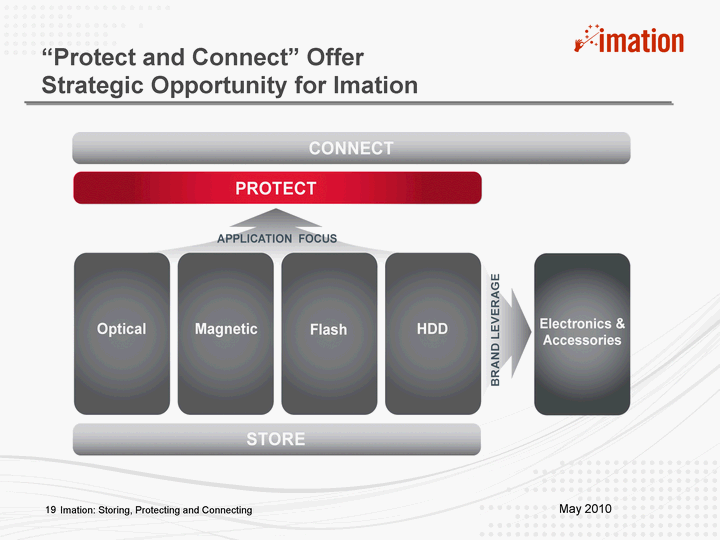
| 19 "Protect and Connect" Offer Strategic Opportunity for Imation Imation: Storing, Protecting and Connecting May 2010 |
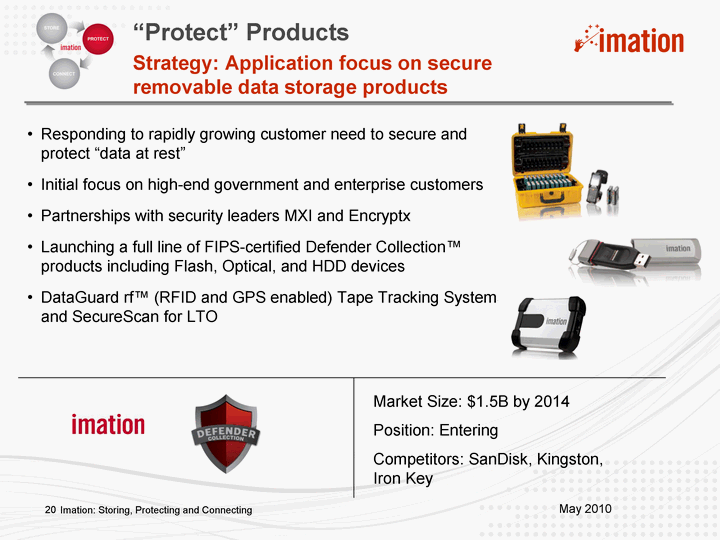
| Responding to rapidly growing customer need to secure and protect "data at rest" Initial focus on high-end government and enterprise customers Partnerships with security leaders MXI and Encryptx Launching a full line of FIPS-certified Defender Collection(tm) products including Flash, Optical, and HDD devices DataGuard rf(tm) (RFID and GPS enabled) Tape Tracking Systems and SecureScan for LTO "Protect" Products Strategy: Application focus on secure removable data storage products Market Size: $1.5B by 2014 Position: Entering Competitors: SanDisk, Kingston, Iron Key 20 Imation: Storing, Protecting and Connecting May 2010 |
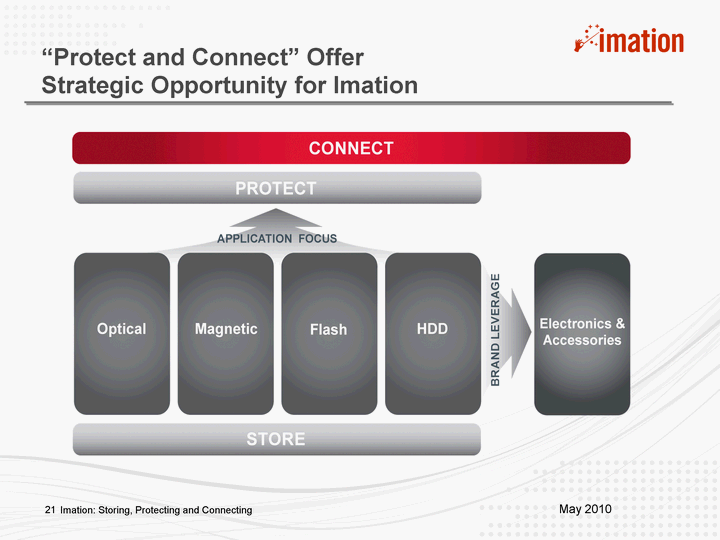
| 21 "Protect and Connect" Offer Strategic Opportunity for Imation Imation: Storing, Protecting and Connecting May 2010 Imation: Storing, Protecting and Connecting |
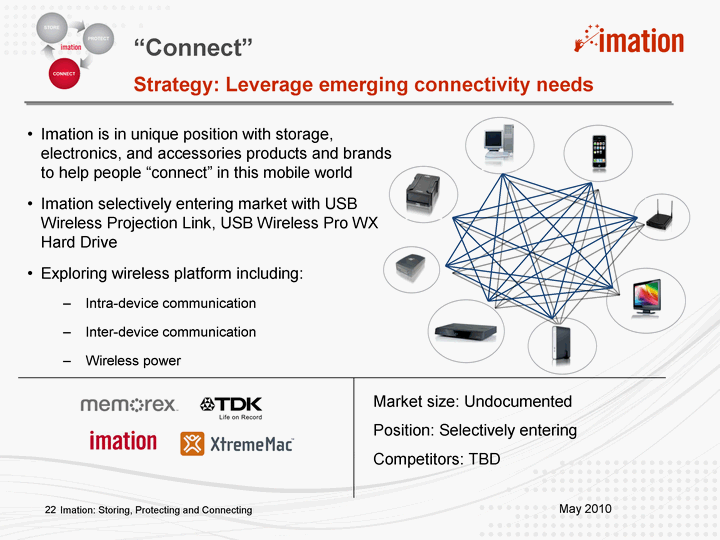
| 22 Imation is in unique position with storage, electronics, and accessories products and brands to help people "connect" in this mobile world Imation selectively entering market with USB Wireless Projection Link, USB Wireless Pro WX Hard Drive Exploring wireless platform including: Intra-device communication Inter-device communication Wireless power "Connect" Strategy: Leverage emerging connectivity needs Market size: Undocumented Position: Selectively entering Competitors: TBD Imation: Storing, Protecting and Connecting May 2010 |
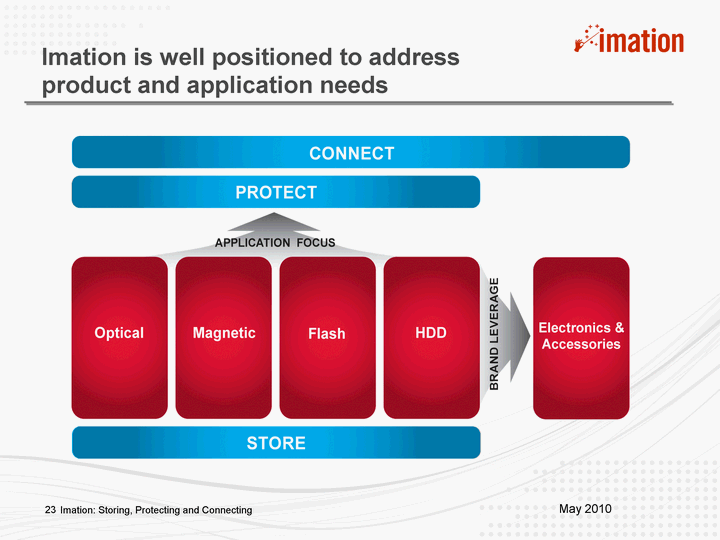
| Imation is well positioned to address product and application needs Imation: Storing, Protecting and Connecting 23 May 2010 |

| Leveraging our Technology, Brands and Operational Expertise |
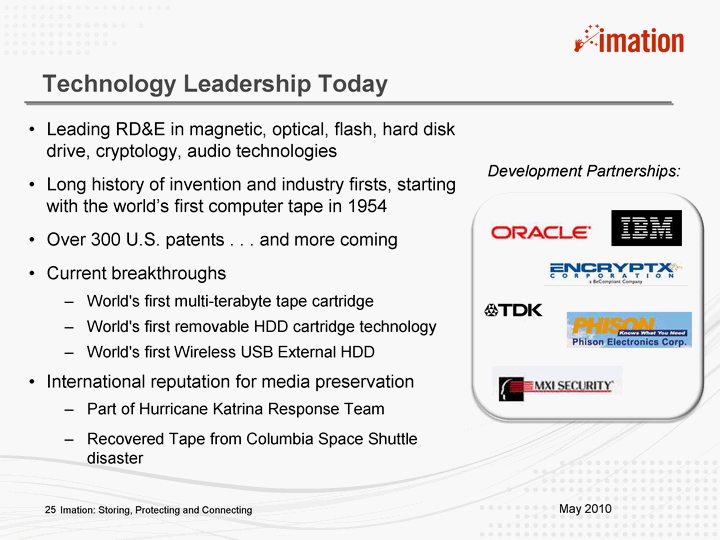
| Imation: Storing, Protecting and Connecting Leading RD&E in magnetic, optical, flash, hard disk drive, cryptology, audio technologies Long history of invention and industry firsts, starting with the world's first computer tape in 1954 Over 300 U.S. patents . . . and more coming Current breakthroughs World's first multi-terabyte tape cartridge World's first removable HDD cartridge technology World's first Wireless USB External HDD International reputation for media preservation Part of Hurricane Katrina Response Team Recovered Tape from Columbia Space Shuttle disaster 25 Development Partnerships: May 2010 Technology Leadership Today |
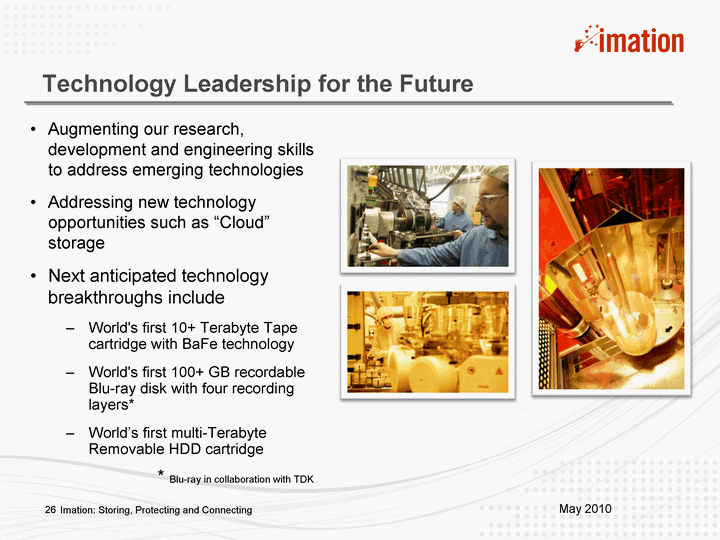
| Imation: Storing, Protecting and Connecting Augmenting our research, development and engineering skills to address emerging technologies Addressing new technology opportunities such as "Cloud" storage Next anticipated technology breakthroughs include World's first 10+ Terabyte Tape cartridge with BaFe technology World's first 100+ GB recordable Blu-ray disk with four recording layers* World's first multi-Terabyte Removable HDD cartridge 26 * Blu-ray in collaboration with TDK Technology Leadership for the Future May 2010 |
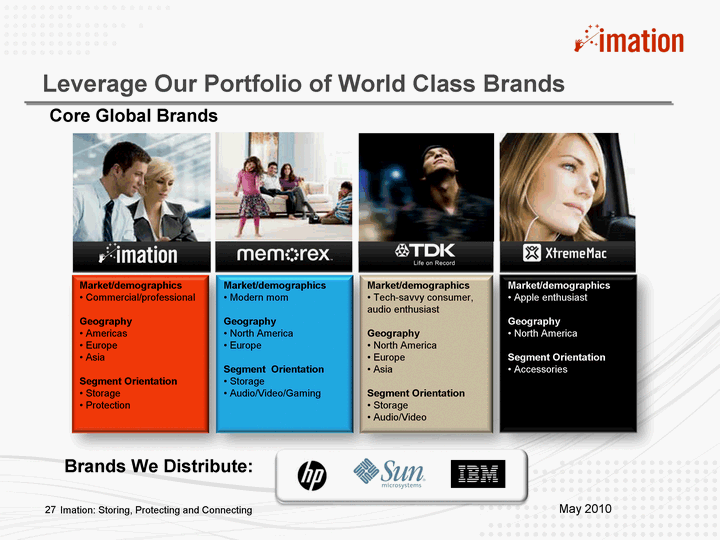
| 27 Core Global Brands Imation: Storing, Protecting and Connecting Brands We Distribute: Market/demographics Commercial/professional Geography Americas Europe Asia Segment Orientation Storage Protection Market/demographics Modern mom Geography North America Europe Segment Orientation Storage Audio/Video/Gaming Market/demographics Tech-savvy consumer, audio enthusiast Geography North America Europe Asia Segment Orientation Storage Audio/Video Market/demographics Apple enthusiast Geography North America Segment Orientation Accessories 27 Leverage Our Portfolio of World Class Brands May 2010 |
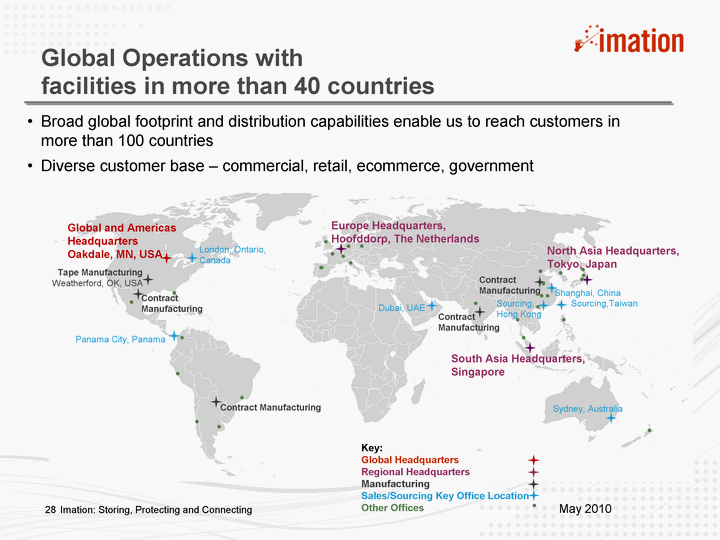
| Global and Americas Headquarters Oakdale, MN, USA Tape Manufacturing Weatherford, OK, USA Panama City, Panama Europe Headquarters, Hoofddorp, The Netherlands Sourcing, Hong Kong London, Ontario, Canada Dubai, UAE Sydney, Australia Shanghai, China South Asia Headquarters, Singapore Contract Manufacturing Contract Manufacturing Contract Manufacturing Contract Manufacturing Imation: Storing, Protecting and Connecting Global Operations with facilities in more than 40 countries Broad global footprint and distribution capabilities enable us to reach customers in more than 100 countries Diverse customer base - commercial, retail, ecommerce, government Global and Americas Headquarters Oakdale, MN, USA Tape Manufacturing Weatherford, OK, USA Panama City, Panama Europe Headquarters, Hoofddorp, The Netherlands North Asia Headquarters, Tokyo, Japan Sourcing, Hong Kong London, Ontario, Canada Dubai, UAE Sourcing,Taiwan Sydney, Australia Shanghai, China South Asia Headquarters, Singapore Contract Manufacturing Contract Manufacturing Contract Manufacturing Contract Manufacturing 28 Key: Global Headquarters Regional Headquarters Manufacturing Sales/Sourcing Key Office Location Other Offices May 2010 |
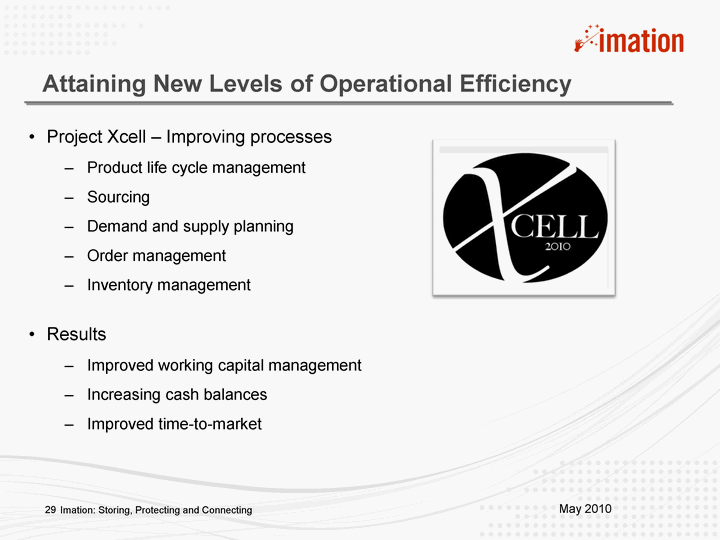
| Imation: Storing, Protecting and Connecting Project Xcell - Improving processes Product life cycle management Sourcing Demand and supply planning Order management Inventory management Results Improved working capital management Increasing cash balances Improved time-to-market 29 Attaining New Levels of Operational Efficiency May 2010 |

| Financials: Improving Results Strong Balance Sheet Increasing Cash No Debt |
| Imation: Storing, Protecting and Connecting 31 Comparison of GAAP to Non-GAAP Financial Measures This presentation contains Non-GAAP financial measurements which are provided to assist in understanding the impact of certain items on Imation's actual results of operations when compared with prior periods. Management believes this will assist investors in making an evaluation of Imation's performance against prior periods on a comparable basis by adjusting for these items. Management understands that there are material limitations on the use of Non-GAAP measures. Non-GAAP measures are not substitutes for GAAP measures for the purpose of analyzing financial performance. These Non-GAAP measures are not in accordance with, or an alternative for measures prepared in accordance with, generally accepted accounting principles and may be different from Non-GAAP measures used by other companies. In addition, these Non-GAAP measures are not based on any comprehensive set of accounting rules or principles. This information should not be construed as an alternative to the reported results, which have been determined in accordance with accounting principles generally accepted in the United States of America. May 2010 |
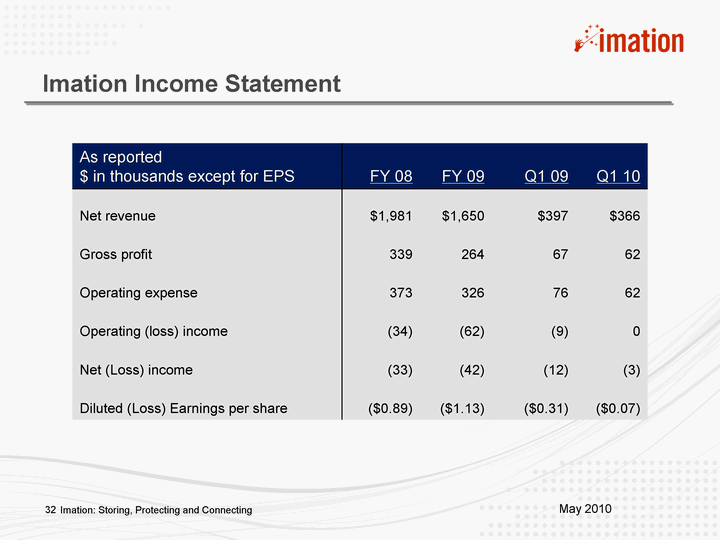
| As reported $ in thousands except for EPS FY 08 FY 09 Q1 09 Q1 10 Net revenue $1,981 $1,650 $397 $366 Gross profit 339 264 67 62 Operating expense 373 326 76 62 Operating (loss) income (34) (62) (9) 0 Net (Loss) income (33) (42) (12) (3) Diluted (Loss) Earnings per share ($0.89) ($1.13) ($0.31) ($0.07) 32 Imation Income Statement May 2010 Imation: Storing, Protecting and Connecting |
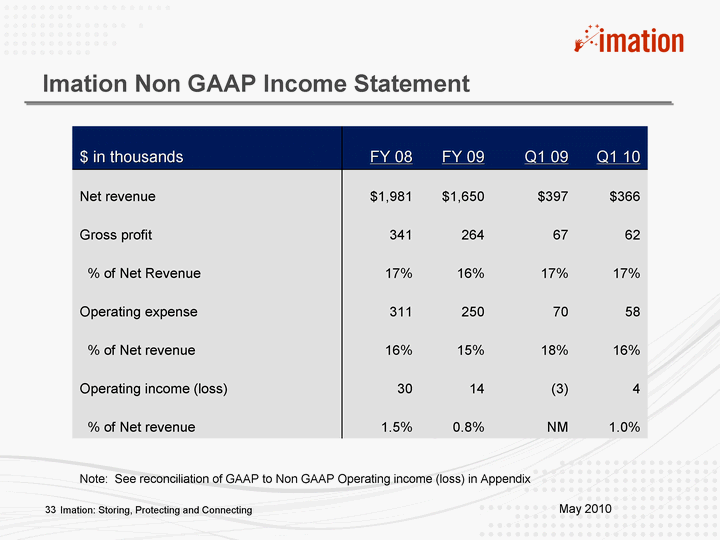
| $ in thousands FY 08 FY 09 Q1 09 Q1 10 Net revenue $1,981 $1,650 $397 $366 Gross profit 341 264 67 62 % of Net Revenue 17% 16% 17% 17% Operating expense 311 250 70 58 % of Net revenue 16% 15% 18% 16% Operating income (loss) 30 14 (3) 4 % of Net revenue 1.5% 0.8% NM 1.0% 33 Imation Non GAAP Income Statement Imation: Storing, Protecting and Connecting Note: See reconciliation of GAAP to Non GAAP Operating income (loss) in Appendix May 2010 |
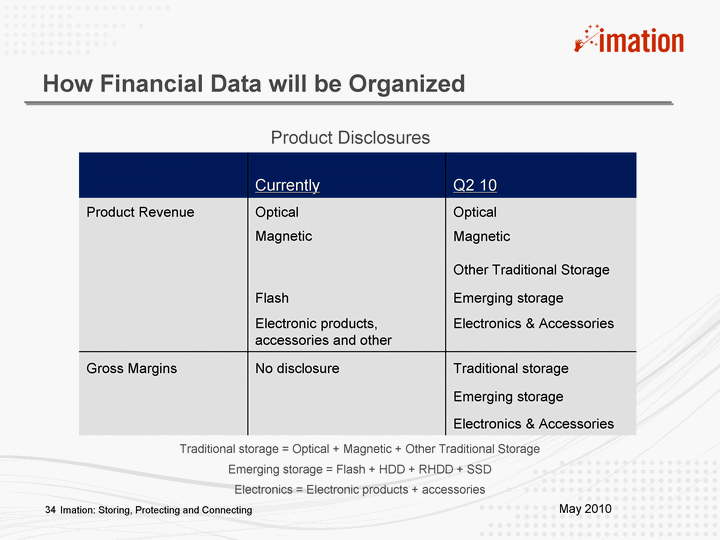
| Product Disclosures Imation: Storing, Protecting and Connecting 34 Currently Q2 10 Product Revenue Optical Optical Magnetic Magnetic Other Traditional Storage Flash Emerging storage Electronic products, accessories and other Electronics & Accessories Gross Margins No disclosure Traditional storage Emerging storage Electronics & Accessories Traditional storage = Optical + Magnetic + Other Traditional Storage Emerging storage = Flash + HDD + RHDD + SSD Electronics = Electronic products + accessories How Financial Data will be Organized May 2010 |
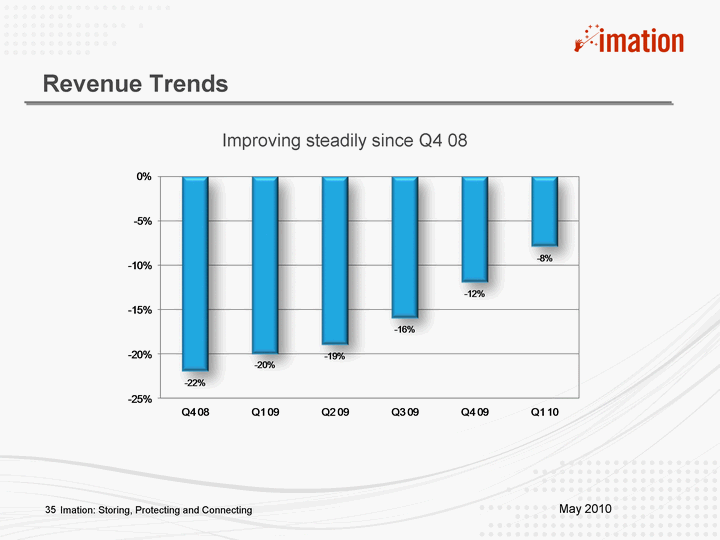
| Imation: Storing, Protecting and Connecting 35 Improving steadily since Q4 08 Revenue Trends May 2010 |
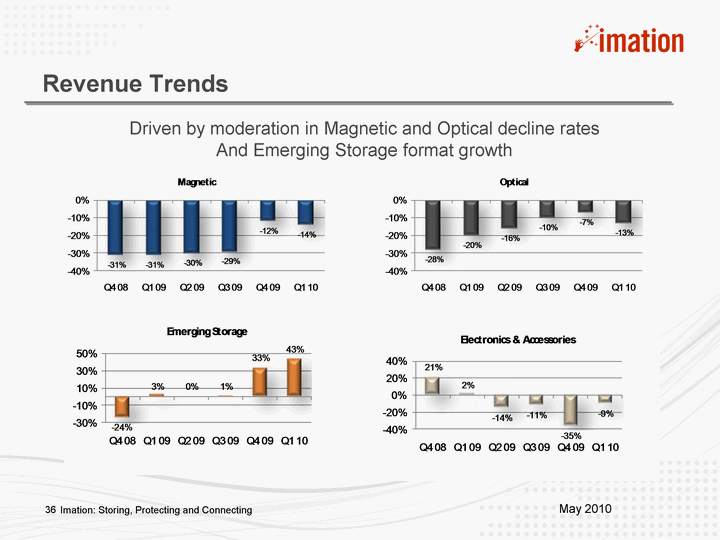
| Imation: Storing, Protecting and Connecting 36 Driven by moderation in Magnetic and Optical decline rates And Emerging Storage format growth Revenue Trends May 2010 |
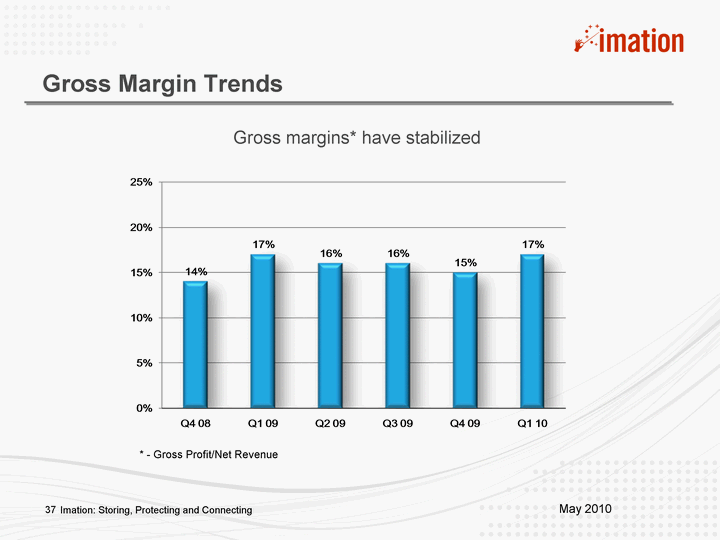
| Imation: Storing, Protecting and Connecting 37 Gross margins* have stabilized Gross Margin Trends May 2010 * - Gross Profit/Net Revenue |
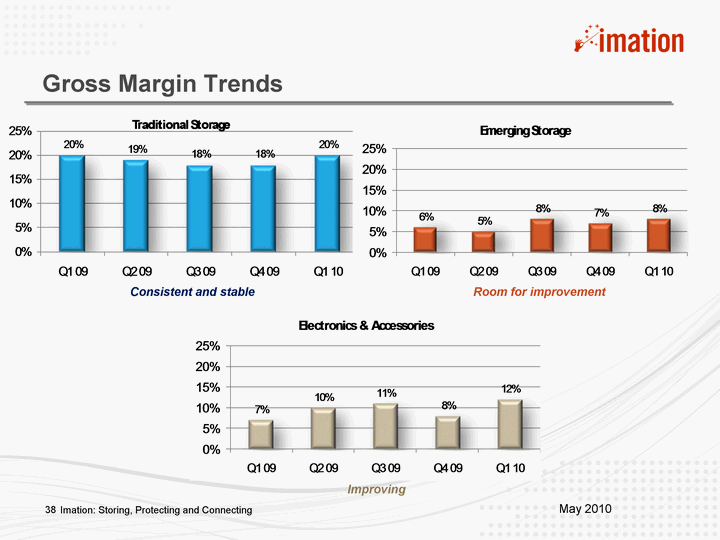
| Imation: Storing, Protecting and Connecting 38 Consistent and stable Improving Room for improvement Gross Margin Trends May 2010 |
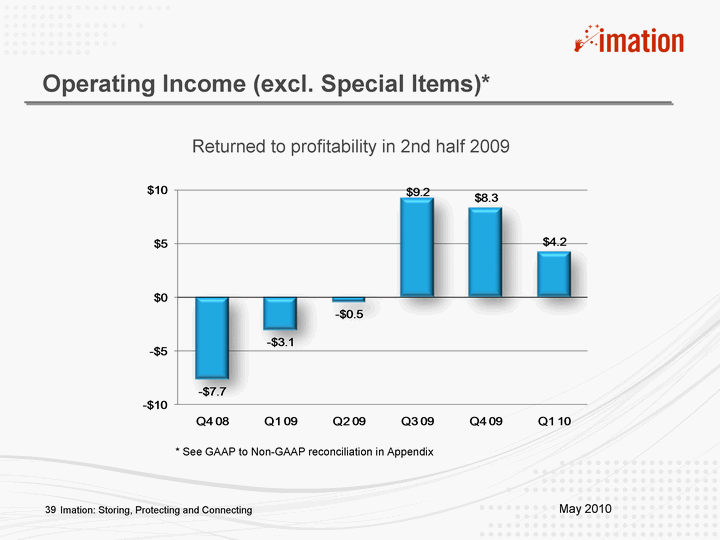
| Imation: Storing, Protecting and Connecting 39 Returned to profitability in 2nd half 2009 Operating Income (excl. Special Items)* May 2010 * See GAAP to Non-GAAP reconciliation in Appendix |
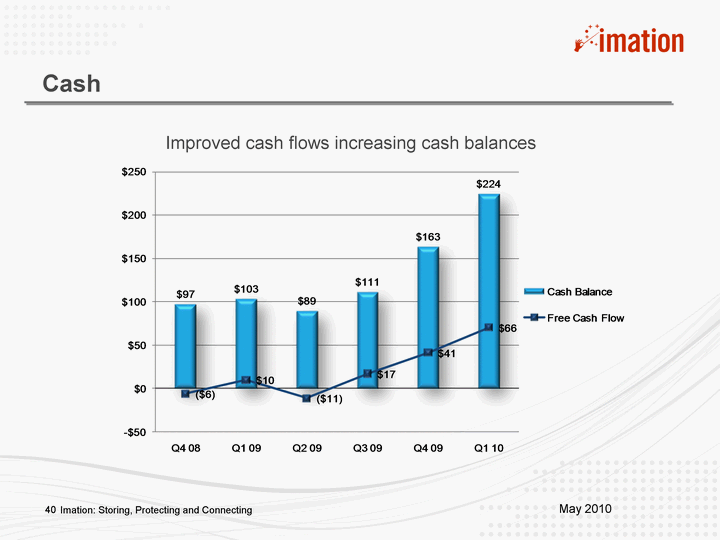
| Imation: Storing, Protecting and Connecting 40 Improved cash flows increasing cash balances Cash May 2010 |
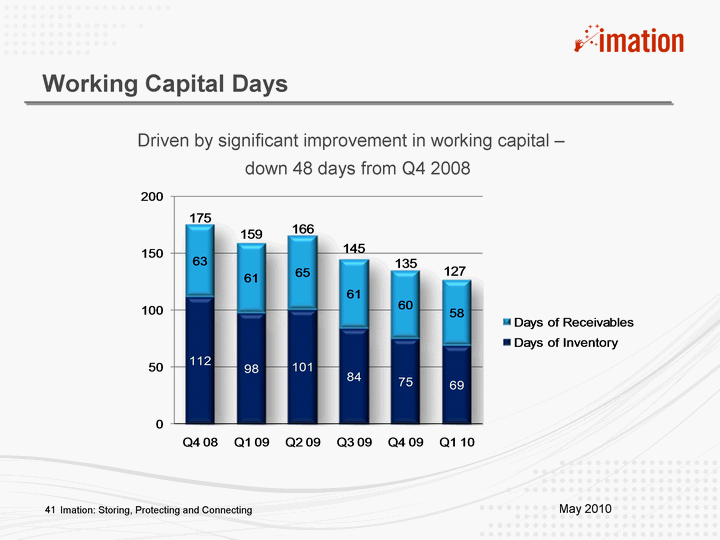
| Imation: Storing, Protecting and Connecting 41 Driven by significant improvement in working capital - down 48 days from Q4 2008 Working Capital Days May 2010 |
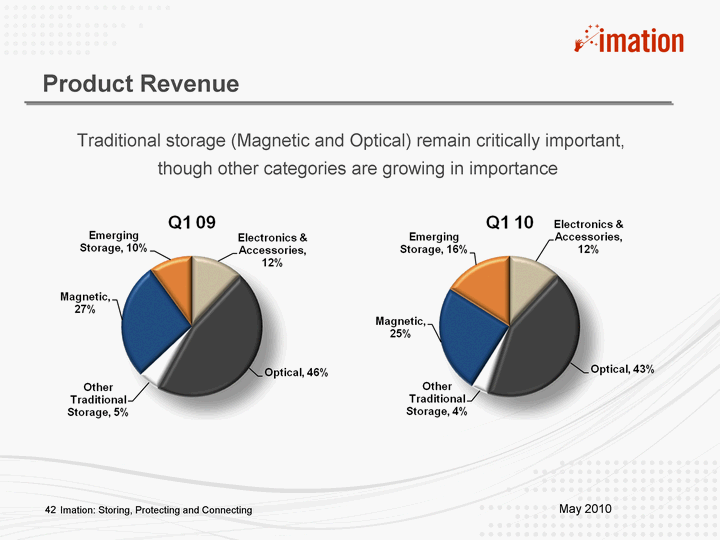
| Imation: Storing, Protecting and Connecting 42 Traditional storage (Magnetic and Optical) remain critically important, though other categories are growing in importance Product Revenue May 2010 |
| Intend to realign in Q2 2010 to a pure regional focus Tighter customer focus Creates better alignment with the way we are now managing the business Change will highly likely trigger non-cash Goodwill write-off of ~$23.5 million within the Electronic Products segment Write-off is not related to the results of this business Imation: Storing, Protecting and Connecting 43 Reporting Segments May 2010 |
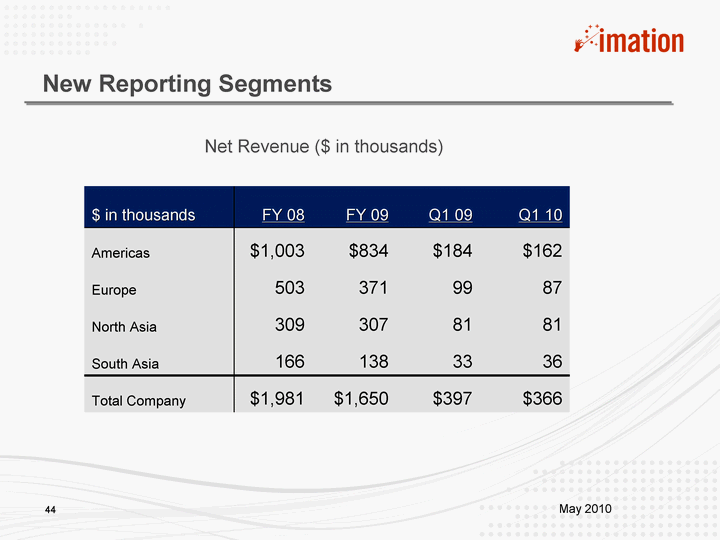
| 44 $ in thousands FY 08 FY 09 Q1 09 Q1 10 Americas $1,003 $834 $184 $162 Europe 503 371 99 87 North Asia 309 307 81 81 South Asia 166 138 33 36 Total Company $1,981 $1,650 $397 $366 New Reporting Segments Net Revenue ($ in thousands) May 2010 |
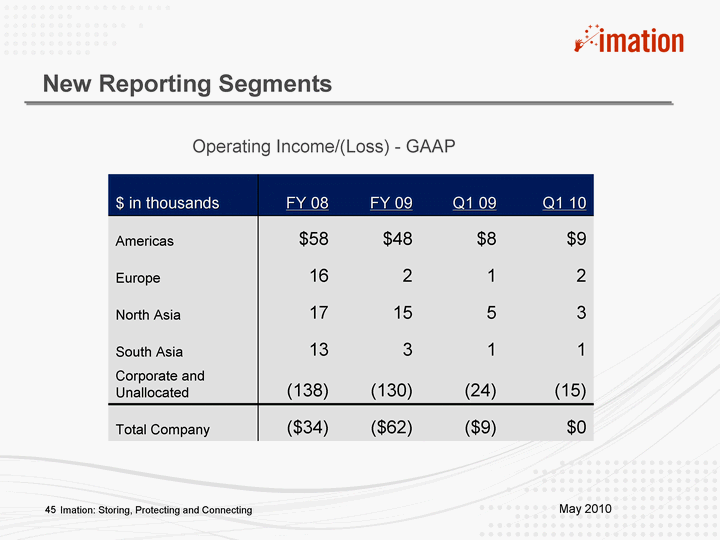
| Imation: Storing, Protecting and Connecting 45 $ in thousands FY 08 FY 09 Q1 09 Q1 10 Americas $58 $48 $8 $9 Europe 16 2 1 2 North Asia 17 15 5 3 South Asia 13 3 1 1 Corporate and Unallocated (138) (130) (24) (15) Total Company ($34) ($62) ($9) $0 New Reporting Segments Operating Income/(Loss) - GAAP May 2010 |
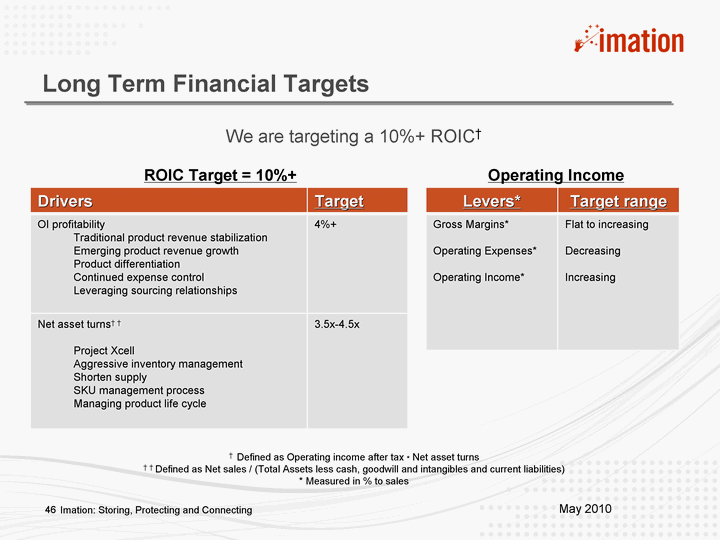
| Imation: Storing, Protecting and Connecting † Defined as Operating income after tax * Net asset turns † † Defined as Net sales / (Total Assets less cash, goodwill and intangibles and current liabilities) * Measured in % to sales 46 ROIC Target = 10%+ Drivers Target OI profitability Traditional product revenue stabilization Emerging product revenue growth Product differentiation Continued expense control Leveraging sourcing relationships 4%+ Net asset turns† † Project Xcell Aggressive inventory management Shorten supply SKU management process Managing product life cycle 3.5x-4.5x Levers* Target range Gross Margins* Operating Expenses* Operating Income* Flat to increasing Decreasing Increasing Operating Income We are targeting a 10%+ ROIC† Financial Targets May 2010 |
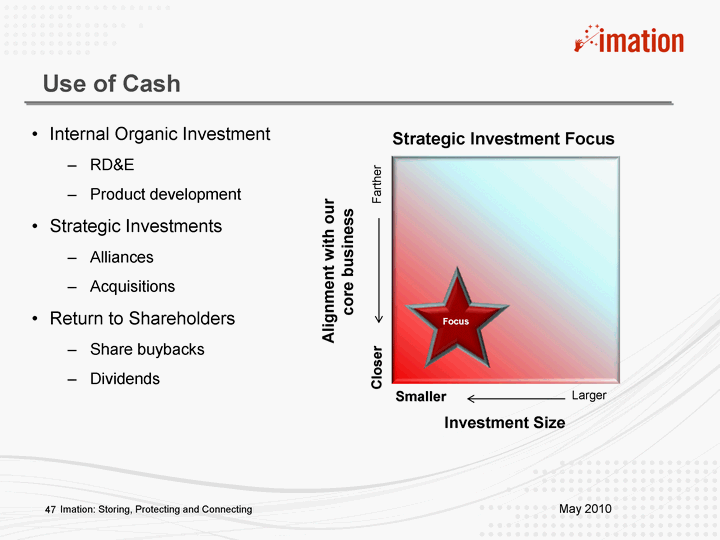
| Imation: Storing, Protecting and Connecting Internal Organic Investment RD&E Product development Strategic Investments Alliances Acquisitions Return to Shareholders Share buybacks Dividends 47 Strategic Investment Focus May 2010 Use of Cash Farther Closer Larger Investment Size Smaller Alignment with our core business Focus |
| Improving operating trends Strong balance sheet Cash on hand $224 million No debt Strong cash flow generation Solid cash earnings Significant cash from operations Improving working capital trends Compelling valuation Imation: Storing, Protecting and Connecting 48 Investment Metrics May 2010 |
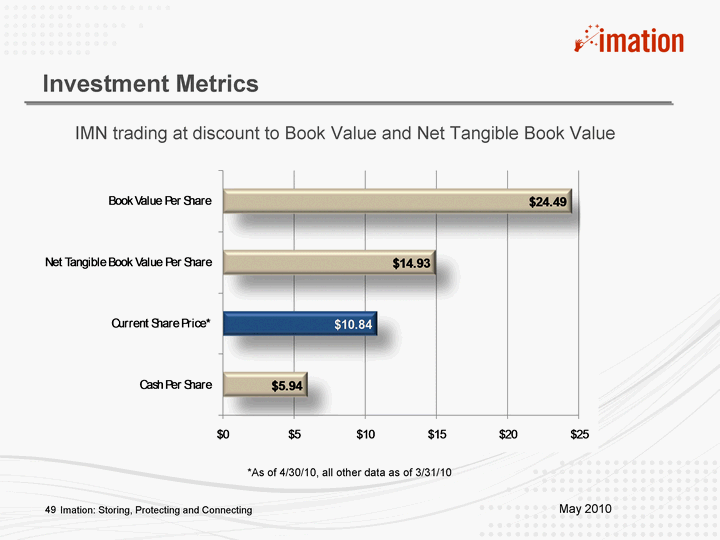
| IMN trading at discount to Book Value and Net Tangible Book Value Imation: Storing, Protecting and Connecting 49 Investment Metrics May 2010 *As of 4/30/10, all other data as of 3/31/10 |

| Summary |
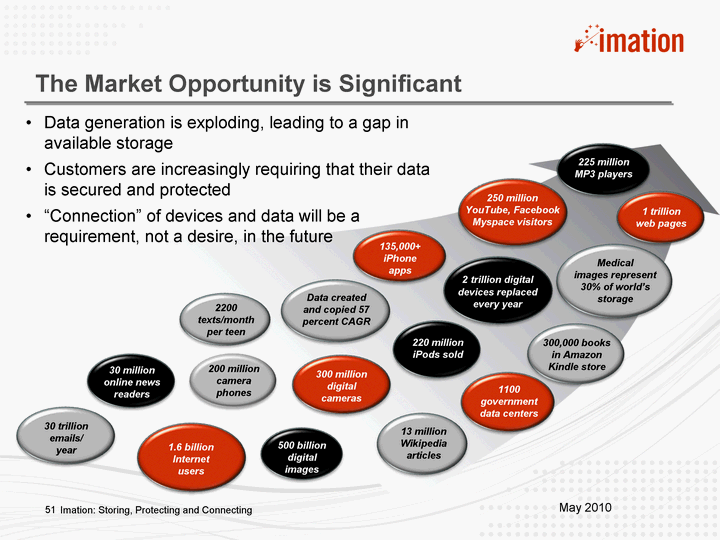
| Imation: Storing, Protecting and Connecting 2 trillion digital devices replaced every year 135,000+ iPhone apps 1.6 billion Internet users Medical images represent 30% of world's storage 500 billion digital images 300,000 books in Amazon Kindle store 220 million iPods sold 30 trillion emails/ year 200 million camera phones 30 million online news readers 2200 texts/month per teen 13 million Wikipedia articles 225 million MP3 players Data created and copied 57 percent CAGR 300 million digital cameras 1 trillion web pages 1100 government data centers 250 million YouTube, Facebook Myspace visitors 51 Data generation is exploding, leading to a gap in available storage Customers are increasingly requiring that their data is secured and protected "Connection" of devices and data will be a requirement, not a desire, in the future The Market Opportunity is Significant May 2010 Imation: Storing, Protecting and Connecting |
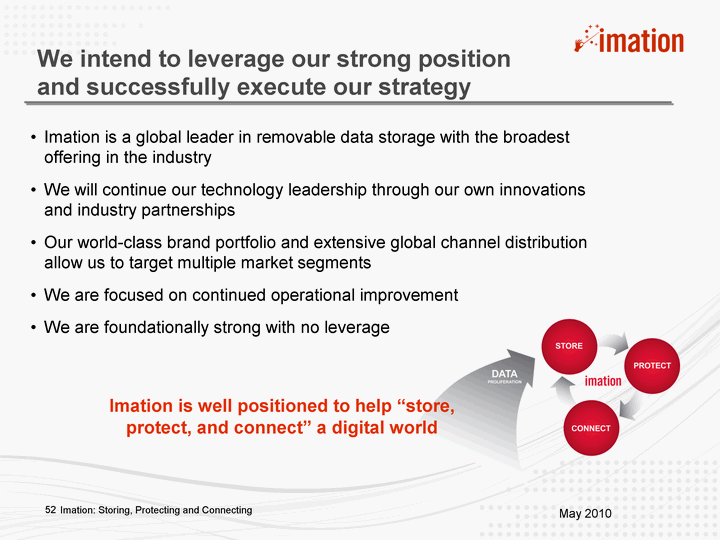
| Imation is a global leader in removable data storage with the broadest offering in the industry We will continue our technology leadership through our own innovations and industry partnerships Our world-class brand portfolio and extensive global channel distribution allow us to target multiple market segments We are focused on continued operational improvement We are foundationally strong with no leverage Imation: Storing, Protecting and Connecting 52 We intend to leverage our strong position and successfully execute our strategy May 2010 Is well positioned to help "store, protect, and connect" a digital world |
| Imation A Global Technology Company: Storing, Protecting, and Connecting a Digital World |

| Appendix |
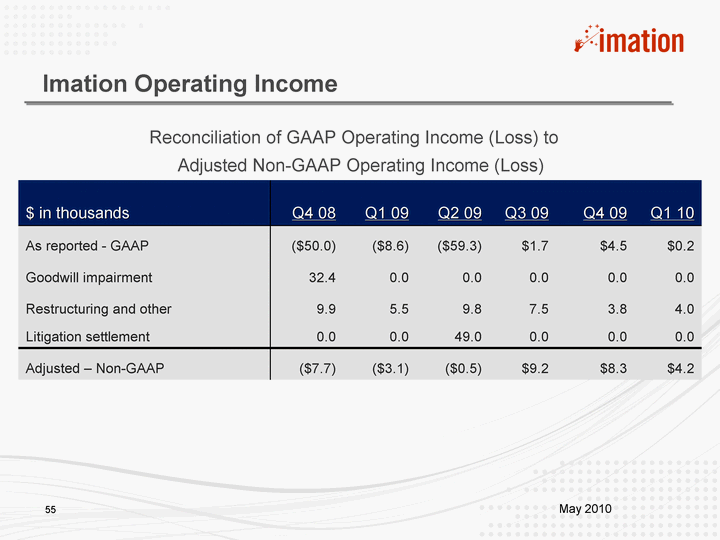
| $ in thousands Q4 08 Q1 09 Q2 09 Q3 09 Q4 09 Q1 10 As reported - GAAP ($50.0) ($8.6) ($59.3) $1.7 $4.5 $0.2 Goodwill impairment 32.4 0.0 0.0 0.0 0.0 0.0 Restructuring and other 9.9 5.5 9.8 7.5 3.8 4.0 Litigation settlement 0.0 0.0 49.0 0.0 0.0 0.0 Adjusted - Non-GAAP ($7.7) ($3.1) ($0.5) $9.2 $8.3 $4.2 Reconciliation of GAAP Operating Income (Loss) to Adjusted Non-GAAP Operating Income (Loss) 55 Imation Operating Income May 2010 |
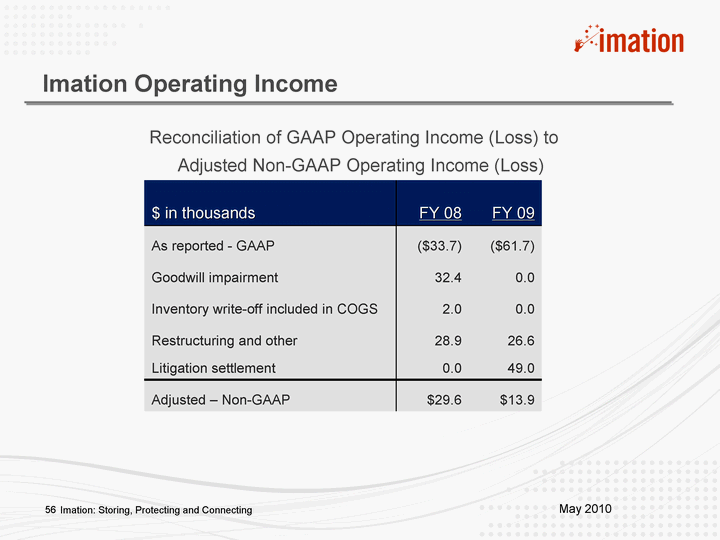
| $ in thousands FY 08 FY 09 As reported - GAAP ($33.7) ($61.7) Goodwill impairment 32.4 0.0 Inventory write-off included in COGS 2.0 0.0 Restructuring and other 28.9 26.6 Litigation settlement 0.0 49.0 Adjusted - Non-GAAP $29.6 $13.9 Reconciliation of GAAP Operating Income (Loss) to Adjusted Non-GAAP Operating Income (Loss) 56 Imation Operating Income Imation: Storing, Protecting and Connecting May 2010 |
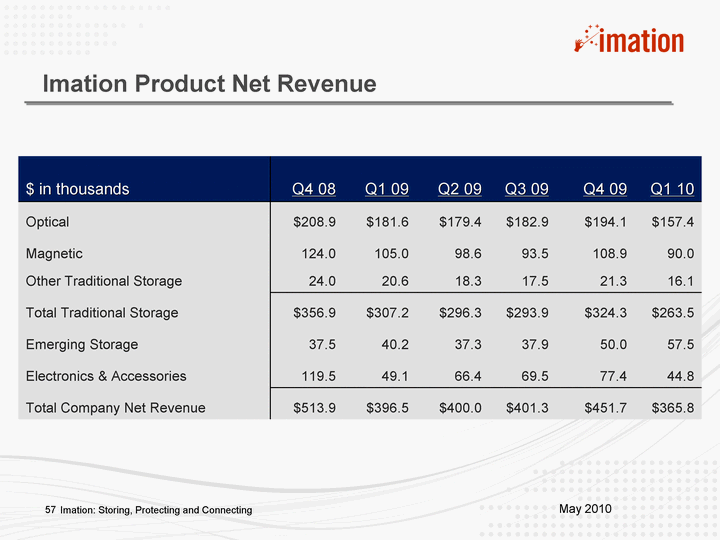
| $ in thousands Q4 08 Q1 09 Q2 09 Q3 09 Q4 09 Q1 10 Optical $208.9 $181.6 $179.4 $182.9 $194.1 $157.4 Magnetic 124.0 105.0 98.6 93.5 108.9 90.0 Other Traditional Storage 24.0 20.6 18.3 17.5 21.3 16.1 Total Traditional Storage $356.9 $307.2 $296.3 $293.9 $324.3 $263.5 Emerging Storage 37.5 40.2 37.3 37.9 50.0 57.5 Electronics & Accessories 119.5 49.1 66.4 69.5 77.4 44.8 Total Company Net Revenue $513.9 $396.5 $400.0 $401.3 $451.7 $365.8 57 Imation Product Net Revenue Imation: Storing, Protecting and Connecting May 2010 |
