Attached files
Table of Contents
UNITED STATES
SECURITIES AND EXCHANGE COMMISSION
WASHINGTON, DC 20549
FORM 10-Q
| x | QUARTERLY REPORT PURSUANT TO SECTION 13 OR 15(d) OF THE SECURITIES EXCHANGE ACT OF 1934 |
For the Period Ended March 31, 2010
OR
| ¨ | TRANSITION REPORT PURSUANT TO SECTION 13 OR 15(d) OF THE SECURITIES EXCHANGE ACT OF 1934 |
Commission File Number 000-51274
THE FRONTIER FUND
FRONTIER DIVERSIFIED SERIES; FRONTIER DYNAMIC SERIES; FRONTIER LONG/SHORT
COMMODITY SERIES; FRONTIER MASTERS SERIES
BALANCED SERIES; CAMPBELL/GRAHAM/TIVERTON SERIES; CURRENCY SERIES; LONG
ONLY COMMODITY SERIES; MANAGED FUTURES INDEX SERIES; WINTON SERIES;
WINTON/GRAHAM SERIES
(Exact Name of Registrant as specified in its Charter)
| Delaware | 36-6815533 | |
| (State of Organization) | (IRS Employer Identification No.) |
c/o Equinox Fund Management, LLC
1660 Lincoln Street, Suite 100
Denver, Colorado 80264
(Address of Principal Executive Offices)
(303) 837-0600
(Registrant’s Telephone Number)
Securities to be registered pursuant to Section 12(b) of the Act: None
Securities registered pursuant to Section 12(g) of the Act:
Frontier Diversified Series Class 1, Class 2 and Class 3 Units;
Frontier Dynamic Series Class 1, Class 2 and Class 3 Units;
Frontier Long/Short Commodity Series Class 1, Class 2, Class 3, Class 1a, Class 2a and Class 3a Units;
Frontier Masters Series Class 1, Class 2 and Class 3 Units;
Balanced Series Class 1, Class 2, Class 3, Class 1a, Class 2a and Class 3a Units;
Campbell/Graham/Tiverton Series Class 1, Class 2 and Class 3 Units;
Currency Series Class 1, Class 2 and Class 3 Units;
Long Only Commodity Series Class 1, Class 2 and Class 3 Units;
Managed Futures Index Series Class 1, Class 2 and Class 3 Units
Winton Series Class 1, Class 2 and Class 3 Units;
Winton/Graham Series Class 1, Class 2 and Class 3 Units
Indicate by check mark whether the registrant: (1) has filed all reports required to be filed by Section 13 or 15(d) of the Securities Exchange Act of 1934 during the preceding 12 months (or for such shorter period that the registrant was required to file such reports), and (2) has been subject to such filing requirements for the past 90 days. Yes x No ¨
Indicate by check mark whether the registrant has submitted electronically and posted on its corporate Web site, if any, every Interactive Data File required to be submitted and posted pursuant to Rule 405 of Regulation S-T (§232.405 of this chapter) during the preceding 12 months (or for such shorter period that the registrant was required to submit and post such files) Yes ¨ No ¨
Indicate by check mark whether the registrant is a large accelerated filer, an accelerated filer, a non-accelerated filer, or a smaller reporting company. See the definitions of “large accelerated filer,” “accelerated filer” and “smaller reporting company” in Rule 12b-2 of the Exchange Act.
| Large Accelerated Filer | ¨ | Accelerated Filer | ¨ | |||
| Non-Accelerated Filer | x (Do not check if a smaller reporting company) | Smaller reporting company | ¨ | |||
Indicate by check mark whether the registrant is a shell company (as defined in Rule 1 2b-2 of the Exchange Act). Yes ¨ No x
Table of Contents
| PART I – FINANCIAL INFORMATION |
||||
| Item 1. |
Financial Statements | |||
| Statements of Financial Condition as of March 31, 2010 (Unaudited) and December 31, 2009 | 4 | |||
| Condensed Schedule of Investments as of March 31, 2010 (Unaudited) and December 31, 2009 | 8 | |||
| Statements of Operations for the Three Months Ended March 31, 2010 and 2009 (Unaudited) | 14 | |||
| Statements of Changes in Owners’ Capital for the Three Months Ended March 31, 2010 (Unaudited) | 18 | |||
| Notes to Financial Statements (Unaudited) | 24 | |||
| Item 2. |
Management’s Discussion and Analysis of Financial Condition and Results of Operations | 51 | ||
| Item 3. |
Quantitative and Qualitative Disclosures About Market Risk | 75 | ||
| Item 4T. |
Controls and Procedures | 82 | ||
| PART II – OTHER INFORMATION |
||||
| Item 1. |
Legal Proceedings | 84 | ||
| Item 1A. |
Risk Factors | 84 | ||
| Item 2. |
Unregistered Sales of Equity Securities and Use of Proceeds | 84 | ||
| Item 3. |
Defaults Upon Senior Securities | 84 | ||
| Item 4. |
Other Information | 84 | ||
| Item 5. |
Exhibits | 84 | ||
| SIGNATURES | 86 | |||
2
Table of Contents
Special Note About Forward-Looking Statements
THIS REPORT CONTAINS STATEMENTS WHICH CONSTITUTE FORWARD-LOOKING STATEMENTS WITHIN THE MEANING OF THE PRIVATE SECURITIES LITIGATION REFORM ACT OF 1995 AND OTHER FEDERAL SECURITIES LAWS. THESE FORWARD-LOOKING STATEMENTS REFLECT THE MANAGING OWNER’S CURRENT EXPECTATIONS ABOUT THE FUTURE RESULTS, PERFORMANCE, PROSPECTS AND OPPORTUNITIES OF THE TRUST. THE MANAGING OWNER HAS TRIED TO IDENTIFY THESE FORWARD-LOOKING STATEMENTS BY USING WORDS SUCH AS “MAY,” “WILL,” “EXPECT,” “ANTICIPATE,” “BELIEVE,” “INTEND,” “SHOULD,” “ESTIMATE” OR THE NEGATIVE OF THOSE TERMS OR SIMILAR EXPRESSIONS. THESE FORWARD-LOOKING STATEMENTS ARE BASED ON INFORMATION CURRENTLY AVAILABLE TO THE MANAGING OWNER AND ARE SUBJECT TO A NUMBER OF RISKS, UNCERTAINTIES AND OTHER FACTORS, BOTH KNOWN, SUCH AS THOSE DESCRIBED IN THE “RISK FACTORS” SECTION UNDER ITEM 1A AND ELSEWHERE IN THIS REPORT, AND UNKNOWN, THAT COULD CAUSE THE TRUST’S ACTUAL RESULTS, PERFORMANCE, PROSPECTS OR OPPORTUNITIES TO DIFFER MATERIALLY FROM THOSE EXPRESSED IN, OR IMPLIED BY, THESE FORWARD-LOOKING STATEMENTS.
YOU SHOULD NOT PLACE UNDUE RELIANCE ON ANY FORWARD-LOOKING STATEMENTS. EXCEPT AS EXPRESSLY REQUIRED BY THE FEDERAL SECURITIES LAWS, THE MANAGING OWNER UNDERTAKES NO OBLIGATION TO PUBLICLY UPDATE OR REVISE ANY FORWARD-LOOKING STATEMENTS OR THE RISKS, UNCERTAINTIES OR OTHER FACTORS DESCRIBED HEREIN, AS A RESULT OF NEW INFORMATION, FUTURE EVENTS OR CHANGED CIRCUMSTANCES OR FOR ANY OTHER REASON AFTER THE DATE OF THIS REPORT.
UNLESS EXPRESSLY STATED OTHERWISE, ALL INFORMATION IN THIS REPORT IS AS OF MARCH 31, 2010, AND THE MANAGING OWNER UNDERTAKES NO OBLIGATION TO UPDATE THIS INFORMATION.
3
Table of Contents
The Frontier Fund
PART I. FINANCIAL INFORMATION
| ITEM 1. | Financial Statements |
Statements of Financial Condition
March 31, 2010 and December 31, 2009
| Frontier Diversified Series (1) | Frontier Dynamic Series (1) | Frontier Long/Short Commodity Series (2) |
|||||||||||||||||
| 3/31/2010 | 12/31/2009 | 3/31/2010 | 12/31/2009 | 3/31/2010 | 12/31/2009 | ||||||||||||||
| (Unaudited) | (Unaudited) | (Unaudited) | |||||||||||||||||
| ASSETS | |||||||||||||||||||
| Cash and cash equivalents |
$ | 8,948,596 | $ | 9,509,091 | $ | 1,825,959 | $ | 2,262,363 | $ | 1,820,252 | $ | 5,387,525 | |||||||
| U.S. Treasury securities, at fair value |
13,290,966 | 7,765,643 | 2,834,169 | 2,739,153 | 3,067,961 | 6,554,990 | |||||||||||||
| Custom time deposits |
65,911,569 | 38,386,489 | 14,054,999 | 13,539,957 | 15,214,406 | 32,402,086 | |||||||||||||
| Receivable from futures commission merchants |
1,313,431 | — | — | — | — | 23,781,708 | |||||||||||||
| Open trade equity |
159,905 | — | — | — | — | — | |||||||||||||
| Swap contracts |
8,298,263 | 8,550,639 | 9,946,597 | 10,027,253 | — | — | |||||||||||||
| Investments in unconsolidated trading companies |
4,455,202 | 3,966,809 | — | — | 47,361,560 | 1,357,682 | |||||||||||||
| Prepaid service fees - Class 1 |
578,973 | 424,337 | 2,284 | 180 | 32,570 | 60,881 | |||||||||||||
| Interest receivable |
59,502 | 107,790 | 12,688 | 38,020 | 13,735 | 90,985 | |||||||||||||
| Receivable from related parties |
2,058 | 279,820 | 71 | 30 | 1,000 | — | |||||||||||||
| Other assets |
7,684 | — | 2,320 | — | 4,752 | — | |||||||||||||
| Total Assets |
$ | 103,026,149 | $ | 68,990,618 | $ | 28,679,087 | $ | 28,606,956 | $ | 67,516,236 | $ | 69,635,857 | |||||||
| LIABILITIES & CAPITAL | |||||||||||||||||||
| LIABILITIES |
|||||||||||||||||||
| Inter-series payables |
$ | 10,859,630 | $ | 10,962,073 | $ | 27,546,908 | $ | 27,676,116 | $ | — | $ | — | |||||||
| Open trade deficit |
— | — | — | — | — | 518,490 | |||||||||||||
| Pending owner additions |
1,660,388 | 1,461,241 | 15,000 | — | 9,600 | — | |||||||||||||
| Owner redemptions payable |
— | — | — | — | — | 212 | |||||||||||||
| Incentive fees payable to Managing Owner |
184,448 | 132,434 | — | — | 54,927 | 278,267 | |||||||||||||
| Management fees payable to Managing Owner |
29,044 | 28,225 | — | — | 52,202 | 144,346 | |||||||||||||
| Interest payable to Managing Owner |
13,780 | 12,179 | 3,609 | 4,048 | 4,145 | 9,939 | |||||||||||||
| Trading fees payable to Managing Owner |
67,272 | 73,768 | 18,087 | 28,591 | 6,445 | 15,480 | |||||||||||||
| Trailing service fees payable to Managing Owner |
1,188 | 607 | — | — | 42,018 | 63,507 | |||||||||||||
| Payables to related parties |
— | — | — | — | 89,726 | 35,524 | |||||||||||||
| Other liabilities |
48 | 3,972 | 13 | 1,284 | 18 | 2,961 | |||||||||||||
| Total Liabilities |
12,815,798 | 12,674,499 | 27,583,617 | 27,710,039 | 259,081 | 1,068,726 | |||||||||||||
| CAPITAL |
|||||||||||||||||||
| Managing Owner Units - Class 1 |
26,260 | 26,621 | 24,918 | 25,142 | — | — | |||||||||||||
| Managing Owner Units - Class 1a |
— | — | — | — | 27,311 | 27,911 | |||||||||||||
| Managing Owner Units - Class 2 |
888,397 | 543,790 | 25,251 | 25,370 | 1,072,174 | 1,089,327 | |||||||||||||
| Managing Owner Units - Class 2a |
— | — | — | — | 27,688 | 28,183 | |||||||||||||
| Limited Owner Units - Class 1 |
53,909,771 | 32,933,919 | 699,068 | 581,113 | 38,910,666 | 45,759,225 | |||||||||||||
| Limited Owner Units - Class 1a |
— | — | — | — | 1,740,198 | 1,064,105 | |||||||||||||
| Limited Owner Units - Class 2 |
35,333,348 | 22,811,789 | 346,233 | 265,292 | 13,282,230 | 13,896,776 | |||||||||||||
| Limited Owner Units - Class 2a |
— | — | — | — | 1,333,880 | 848,349 | |||||||||||||
| Limited Owner Units - Class 3 |
— | — | — | — | 10,863,008 | 6,140,056 | |||||||||||||
| Total Owners’ Capital |
90,157,776 | 56,316,119 | 1,095,470 | 896,917 | 67,257,155 | 68,853,932 | |||||||||||||
| Non-Controlling Interests |
52,575 | — | — | — | — | (286,801 | ) | ||||||||||||
| Total Capital |
90,210,351 | 56,316,119 | 1,095,470 | 896,917 | 67,257,155 | 68,567,131 | |||||||||||||
| Total Liabilities and Capital |
$ | 103,026,149 | $ | 68,990,618 | $ | 28,679,087 | $ | 28,606,956 | $ | 67,516,236 | $ | 69,635,857 | |||||||
| Units Outstanding |
|||||||||||||||||||
| Class 1 |
564,838 | 340,489 | 7,990 | 6,631 | 350,042 | 402,206 | |||||||||||||
| Class 1a |
N/A | N/A | N/A | N/A | 17,797 | 10,759 | |||||||||||||
| Class 2 |
373,960 | 238,874 | 4,046 | 3,151 | 114,391 | 117,544 | |||||||||||||
| Class 2a |
N/A | N/A | N/A | N/A | 13,523 | 8,553 | |||||||||||||
| Class 3 |
N/A | N/A | N/A | N/A | 86,570 | 48,162 | |||||||||||||
| Net Asset Value per Unit |
|||||||||||||||||||
| Class 1 |
$ | 95.49 | $ | 96.80 | $ | 90.61 | $ | 91.43 | $ | 111.16 | $ | 113.77 | |||||||
| Class 1a |
N/A | N/A | N/A | N/A | $ | 99.31 | $ | 101.49 | |||||||||||
| Class 2 |
$ | 96.86 | $ | 97.77 | $ | 91.82 | $ | 92.25 | $ | 125.49 | $ | 127.49 | |||||||
| Class 2a |
N/A | N/A | N/A | N/A | $ | 100.68 | $ | 102.48 | |||||||||||
| Class 3 |
N/A | N/A | N/A | N/A | $ | 125.48 | $ | 127.49 | |||||||||||
| (1) | The Frontier Diversified Series and Frontier Dynamic Series began trading operations on June 9, 2009 |
| (2) | The Frontier Long/Short Commodity Class 3 Units began trading on May 29, 2009 and the Class 1a and 2a Units began trading on June 8, 2009. |
The accompanying notes are an integral part of these financial statements.
4
Table of Contents
The Frontier Fund
Statements of Financial Condition
March 31, 2010 and December 31, 2009
| Frontier Masters Series (1) | Balanced Series (2) | Campbell/Graham/Tiverton Series | |||||||||||||||||
| 3/31/2010 | 12/31/2009 | 3/31/2010 | 12/31/2009 | 3/31/2010 | 12/31/2009 | ||||||||||||||
| (Unaudited) | (Unaudited) | (Unaudited) | |||||||||||||||||
| ASSETS | |||||||||||||||||||
| Cash and cash equivalents |
$ | 3,991,184 | $ | 5,976,679 | $ | 18,381,335 | $ | 24,729,568 | $ | 4,018,400 | $ | 5,851,963 | |||||||
| U.S. Treasury securities, at fair value |
6,462,251 | 3,383,444 | 29,087,972 | 31,833,998 | 6,718,537 | 7,367,693 | |||||||||||||
| Custom time deposits |
32,047,113 | 16,724,760 | 144,250,904 | 157,359,203 | 33,318,069 | 36,419,374 | |||||||||||||
| Receivable from futures commission merchants |
— | — | 58,389,722 | 71,161,299 | 10,960,925 | — | |||||||||||||
| Open trade equity |
— | — | 13,875,669 | 10,933,646 | 741,959 | — | |||||||||||||
| Swap contracts |
16,476,961 | 15,972,156 | 42,259,114 | 41,020,535 | — | — | |||||||||||||
| Investments in unconsolidated trading companies |
1,802,062 | 1,282,798 | 4,792,969 | 303,102 | 15,320,530 | 30,057,520 | |||||||||||||
| Inter-series receivables |
— | — | 69,311,493 | 69,089,082 | — | — | |||||||||||||
| Prepaid service fees - Class 1 |
223,587 | 167,524 | 76,032 | 487,875 | 10,904 | 65,009 | |||||||||||||
| Interest receivable |
28,931 | 46,963 | 130,224 | 441,867 | 30,078 | 102,266 | |||||||||||||
| Receivable from related parties |
929 | 179,715 | 402,499 | 296,789 | 44,231 | 200 | |||||||||||||
| Other assets |
4,146 | — | 4,448 | — | — | — | |||||||||||||
| Total Assets |
$ | 61,037,164 | $ | 43,734,039 | $ | 380,962,381 | $ | 407,656,964 | $ | 71,163,633 | $ | 79,864,025 | |||||||
| LIABILITIES & CAPITAL | |||||||||||||||||||
| LIABILITIES |
|||||||||||||||||||
| Inter-series payables |
$ | 18,309,159 | $ | 18,184,135 | $ | — | $ | — | $ | — | $ | — | |||||||
| Pending owner additions |
490,540 | 2,182,469 | — | — | — | — | |||||||||||||
| Owner redemptions payable |
— | — | 663,532 | 667,616 | 58,886 | — | |||||||||||||
| Incentive fees payable to Managing Owner |
10,304 | — | 663,718 | 1,306,596 | — | — | |||||||||||||
| Management fees payable to Managing Owner |
20,547 | 29,929 | 111,759 | 208,736 | 52,197 | 94,011 | |||||||||||||
| Interest payable to Managing Owner |
7,560 | 6,094 | 145,650 | 74,715 | 35,030 | 58,113 | |||||||||||||
| Trading fees payable to Managing Owner |
39,304 | 40,976 | 15,468 | 103,317 | 7,019 | 17,084 | |||||||||||||
| Trailing service fees payable to Managing Owner |
1,830 | 1,313 | 265,569 | 85,599 | 62,478 | 86,041 | |||||||||||||
| Payables to related parties |
3,000 | — | — | 270,000 | 193,636 | 245,936 | |||||||||||||
| Other liabilities |
25 | 1,936 | 523 | 5,689 | 424 | 480 | |||||||||||||
| Total Liabilities |
18,882,269 | 20,446,852 | 1,866,219 | 2,722,268 | 409,670 | 501,665 | |||||||||||||
| CAPITAL |
|||||||||||||||||||
| Managing Owner Units - Class 1 |
26,044 | 25,977 | — | — | — | — | |||||||||||||
| Managing Owner Units - Class 1a |
— | — | — | — | — | — | |||||||||||||
| Managing Owner Units - Class 2 |
399,958 | 210,351 | 2,397,131 | 3,697,180 | 122,334 | 125,510 | |||||||||||||
| Managing Owner Units - Class 2a |
— | — | 145,431 | 145,517 | — | — | |||||||||||||
| Limited Owner Units - Class 1 |
22,211,436 | 14,697,353 | 277,807,329 | 286,024,307 | 65,562,540 | 69,447,366 | |||||||||||||
| Limited Owner Units - Class 1a |
— | — | 6,847,698 | 9,150,114 | — | — | |||||||||||||
| Limited Owner Units - Class 2 |
19,517,457 | 8,353,506 | 72,045,042 | 73,674,986 | 8,794,924 | 9,789,484 | |||||||||||||
| Limited Owner Units - Class 2a |
— | — | 3,070,605 | 3,153,049 | — | — | |||||||||||||
| Limited Owner Units - Class 3a |
— | — | 2,816,314 | 1,170,746 | — | — | |||||||||||||
| Total Owners’ Capital |
42,154,895 | 23,287,187 | 365,129,550 | 377,015,899 | 74,479,798 | 79,362,360 | |||||||||||||
| Non-Controlling Interests |
— | — | 13,966,612 | 27,918,797 | (3,725,835 | ) | — | ||||||||||||
| Total Capital |
42,154,895 | 23,287,187 | 379,096,162 | 404,934,696 | 70,753,963 | 79,362,360 | |||||||||||||
| Total Liabilities and Captial |
$ | 61,037,164 | $ | 43,734,039 | $ | 380,962,381 | $ | 407,656,964 | $ | 71,163,633 | $ | 79,864,025 | |||||||
| Units Outstanding |
|||||||||||||||||||
| Class 1 |
234,808 | 155,864 | 2,358,181 | 2,412,953 | 647,562 | 663,631 | |||||||||||||
| Class 1a |
N/A | N/A | 65,430 | 86,734 | N/A | N/A | |||||||||||||
| Class 2 |
207,410 | 89,793 | 534,855 | 556,577 | 75,549 | 81,877 | |||||||||||||
| Class 2a |
N/A | N/A | 27,363 | 28,048 | N/A | N/A | |||||||||||||
| Class 3a |
N/A | N/A | 23,961 | 9,955 | N/A | N/A | |||||||||||||
| Net Asset Value per Unit |
|||||||||||||||||||
| Class 1 |
$ | 94.70 | $ | 94.46 | $ | 117.81 | $ | 118.54 | $ | 101.25 | $ | 104.65 | |||||||
| Class 1a |
N/A | N/A | $ | 104.66 | $ | 105.50 | N/A | N/A | |||||||||||
| Class 2 |
$ | 96.03 | $ | 95.37 | $ | 139.18 | $ | 139.01 | $ | 118.03 | $ | 121.10 | |||||||
| Class 2a |
N/A | N/A | $ | 117.53 | $ | 117.60 | N/A | N/A | |||||||||||
| Class 3a |
N/A | N/A | $ | 117.54 | $ | 117.60 | N/A | N/A | |||||||||||
| (1) | The Frontier Masters Series began trading operations on June 9, 2009 |
| (2) | The Balanced Series Class 3a Units began trading operations on June 3, 2009 |
The accompanying notes are an integral part of these financial statements.
5
Table of Contents
The Frontier Fund
Statements of Financial Condition
March 31, 2010 and December 31, 2009
| Currency Series | Long Only Commodity Series |
Managed Futures Index Series | ||||||||||||||||
| 3/31/2010 | 12/31/2009 | 3/31/2010 | 12/31/2009 | 3/31/2010 | 12/31/2009 | |||||||||||||
| (Unaudited) | (Unaudited) | (Unaudited) | ||||||||||||||||
| ASSETS | ||||||||||||||||||
| Cash and cash equivalents |
$ | 1,506,553 | $ | 2,043,698 | $ | 505,091 | $ | 691,771 | $ | 239,226 | $ | 332,007 | ||||||
| U.S. Treasury securities, at fair value |
2,264,361 | 2,514,501 | 560,516 | 571,339 | 293,685 | 417,851 | ||||||||||||
| Custom time deposits |
11,229,250 | 12,429,474 | 2,779,671 | 2,824,195 | 1,456,422 | 2,065,485 | ||||||||||||
| Receivable from futures commission merchants |
792,732 | 489,483 | — | — | — | — | ||||||||||||
| Open trade equity |
64,940 | 19,464 | — | — | — | — | ||||||||||||
| Swap Contracts |
5,463,318 | 4,992,959 | 405,105 | 584,391 | — | — | ||||||||||||
| Investments in unconsolidated trading companies |
— | — | — | — | 3,634,198 | 975,271 | ||||||||||||
| Prepaid service fees - Class 1 |
515 | 2,852 | 2 | 1,065 | 588 | 3,342 | ||||||||||||
| Interest receivable |
10,137 | 34,902 | 2,509 | 7,930 | 1,315 | 5,800 | ||||||||||||
| Receivable from related parties |
5 | — | — | — | 64 | 98 | ||||||||||||
| Other assets |
912 | — | 551 | — | — | — | ||||||||||||
| Total Assets |
$ | 21,332,723 | $ | 22,527,333 | $ | 4,253,445 | $ | 4,680,691 | $ | 5,625,498 | $ | 3,799,854 | ||||||
| LIABILITIES & CAPITAL | ||||||||||||||||||
| LIABILITIES |
||||||||||||||||||
| Inter-series payables |
$ | 12,595,796 | $ | 12,266,758 | $ | — | $ | — | $ | — | $ | — | ||||||
| Management fees payable to Managing Owner |
5,475 | 8,537 | 4,948 | 4,891 | 10,403 | 7,105 | ||||||||||||
| Interest payable to Managing Owner |
11,484 | 14,271 | 1,889 | 1,913 | 953 | 1,405 | ||||||||||||
| Trading fees payable to Managing Owner |
3,309 | 5,570 | 1,790 | 1,904 | 2,375 | 1,636 | ||||||||||||
| Trailing service fees payable to Managing Owner |
11,520 | 13,629 | 5,460 | 5,301 | 2,248 | 2,083 | ||||||||||||
| Payables to related parties |
55,089 | 10,004 | 1,033 | 152 | 6,408 | 14,235 | ||||||||||||
| Other liabilities |
33 | 436 | 2 | 205 | 89 | 181 | ||||||||||||
| Total Liabilities |
12,682,706 | 12,319,205 | 15,122 | 14,366 | 22,476 | 26,645 | ||||||||||||
| CAPITAL |
||||||||||||||||||
| Managing Owner Units - Class 2 |
71,733 | 574,384 | 128,732 | 133,513 | 2,212,196 | 259,205 | ||||||||||||
| Limited Owner Units - Class 1 |
7,792,672 | 7,934,382 | 3,339,646 | 3,711,581 | 1,734,680 | 1,831,435 | ||||||||||||
| Limited Owner Units - Class 2 |
785,612 | 1,699,362 | 769,945 | 821,231 | 1,656,146 | 1,682,569 | ||||||||||||
| Total Owners’ Capital |
8,650,017 | 10,208,128 | 4,238,323 | 4,666,325 | 5,603,022 | 3,773,209 | ||||||||||||
| Non-Controlling Interests |
— | — | — | — | — | — | ||||||||||||
| Total Capital |
8,650,017 | 10,208,128 | 4,238,323 | 4,666,325 | 5,603,022 | 3,773,209 | ||||||||||||
| Total Liabilities and Captial |
$ | 21,332,723 | $ | 22,527,333 | $ | 4,253,445 | $ | 4,680,691 | $ | 5,625,498 | $ | 3,799,854 | ||||||
| Units Outstanding |
||||||||||||||||||
| Class 1 |
98,018 | 101,722 | 41,641 | 44,405 | 15,552 | 16,274 | ||||||||||||
| Class 2 |
9,141 | 24,894 | 10,322 | 10,574 | 32,024 | 16,011 | ||||||||||||
| Net Asset Value per Unit |
||||||||||||||||||
| Class 1 |
$ | 79.50 | $ | 78.00 | $ | 80.20 | $ | 83.59 | $ | 111.54 | $ | 112.54 | ||||||
| Class 2 |
$ | 93.79 | $ | 91.34 | $ | 87.06 | $ | 90.30 | $ | 120.80 | $ | 121.28 | ||||||
The accompanying notes are an integral part of these financial statements.
6
Table of Contents
The Frontier Fund
Statements of Financial Condition
March 31, 2010 and December 31, 2009
| Winton Series | Winton/Graham Series | |||||||||||
| 3/31/2010 | 12/31/2009 | 3/31/2010 | 12/31/2009 | |||||||||
| (Unaudited) | (Unaudited) | |||||||||||
| ASSETS | ||||||||||||
| Cash and cash equivalents |
$ | 4,203,035 | $ | 5,299,857 | $ | 4,276,964 | $ | 6,159,468 | ||||
| U.S. Treasury securities, at fair value |
6,656,099 | 7,125,185 | 7,019,263 | 7,598,224 | ||||||||
| Custom time deposits |
33,008,429 | 35,220,629 | 34,809,407 | 37,558,918 | ||||||||
| Receivable from futures commission merchants |
— | — | 14,859,715 | 13,010,250 | ||||||||
| Open trade equity |
— | — | 2,020,400 | 810,189 | ||||||||
| Investments in unconsolidated trading companies |
15,713,090 | 11,033,691 | 2,722,660 | 2,889,071 | ||||||||
| Prepaid service fees - Class 1 |
— | — | 12,940 | 105,448 | ||||||||
| Interest receivable |
29,799 | 98,900 | 31,425 | 105,466 | ||||||||
| Receivable from related parties |
— | — | 420 | 470 | ||||||||
| Other assets |
— | — | 2,255 | — | ||||||||
| Total Assets |
$ | 59,610,452 | $ | 58,778,262 | $ | 65,755,449 | $ | 68,237,504 | ||||
| LIABILITIES & CAPITAL | ||||||||||||
| LIABILITIES |
||||||||||||
| Management fees payable to Managing Owner |
$ | 42,315 | $ | 63,259 | $ | 48,855 | $ | 79,384 | ||||
| Interest payable to Managing Owner |
37,078 | 51,341 | 35,341 | 54,167 | ||||||||
| Trading fees payable to Managing Owner |
6,816 | 13,271 | 7,118 | 12,080 | ||||||||
| Trailing service fees payable |
60,209 | 74,866 | 47,858 | 52,712 | ||||||||
| Payables to related parties |
44,321 | 172,556 | 40,570 | 3,800 | ||||||||
| Other liabilities |
202 | 790 | 9,685 | 903 | ||||||||
| Total Liabilities |
190,941 | 376,083 | 189,427 | 203,046 | ||||||||
| CAPITAL |
||||||||||||
| Managing Owner Units - Class 1 |
206,087 | — | — | — | ||||||||
| Managing Owner Units - Class 2 |
48,940,862 | 455,282 | 55,101 | 54,990 | ||||||||
| Limited Owner Units - Class 1 |
10,272,562 | 48,198,317 | 46,333,536 | 48,168,395 | ||||||||
| Limited Owner Units - Class 2 |
— | 9,748,580 | 12,207,216 | 12,467,488 | ||||||||
| Total Owners’ Capital |
59,419,511 | 58,402,179 | 58,595,853 | 60,690,873 | ||||||||
| Non-Controlling Interests |
— | — | 6,970,169 | 7,343,585 | ||||||||
| Total Capital |
59,419,511 | 58,402,179 | 65,566,022 | 68,034,458 | ||||||||
| Total Liabilities and Capital |
$ | 59,610,452 | $ | 58,778,262 | $ | 65,755,449 | $ | 68,237,504 | ||||
| Units Outstanding |
||||||||||||
| Class 1 |
396,765 | 409,951 | 423,250 | 437,653 | ||||||||
| Class 2 |
76,202 | 78,429 | 95,316 | 97,534 | ||||||||
| Net Asset Value per Unit |
||||||||||||
| Class 1 |
$ | 123.35 | $ | 117.57 | $ | 109.47 | $ | 110.06 | ||||
| Class 2 |
$ | 137.51 | $ | 130.10 | $ | 128.65 | $ | 128.39 | ||||
The accompanying notes are an integral part of these financial statements.
7
Table of Contents
Condensed Schedule of Investments
March 31, 2010 (Unaudited)
| Frontier Diversified Series | Frontier Dynamic Series | Frontier Long/Short Commodity Series |
Frontier Masters Series | ||||||||||||||||||||||||
| Description |
Value | % of Capital (Net Asset Value) |
Value | % of Capital (Net Asset Value) |
Value | % of Capital (Net Asset Value) |
Value | % of Capital (Net Asset Value) |
|||||||||||||||||||
| LONG FUTURES CONTRACTS * |
|||||||||||||||||||||||||||
| Various base metals futures contracts (U.S.) |
$ | 14,300 | 0.02 | % | $ | — | 0.00 | % | $ | — | 0.00 | % | $ | — | 0.00 | % | |||||||||||
| Various base metals futures contracts (Europe) |
50,356 | 0.06 | % | — | 0.00 | % | — | 0.00 | % | — | 0.00 | % | |||||||||||||||
| Various currency futures contracts (U.S.) |
— | 0.00 | % | — | 0.00 | % | — | 0.00 | % | — | 0.00 | % | |||||||||||||||
| Various currency futures contracts (Canada) |
— | 0.00 | % | — | 0.00 | % | — | 0.00 | % | — | 0.00 | % | |||||||||||||||
| Various currency futures contracts (Europe) |
2,238 | 0.00 | % | — | 0.00 | % | — | 0.00 | % | — | 0.00 | % | |||||||||||||||
| Various currency futures contracts (Far East) |
— | 0.00 | % | — | 0.00 | % | — | 0.00 | % | — | 0.00 | % | |||||||||||||||
| Various energy futures contracts (U.S.) |
14,619 | 0.02 | % | — | 0.00 | % | — | 0.00 | % | — | 0.00 | % | |||||||||||||||
| Various energy futures contracts (Europe) |
3,800 | 0.00 | % | — | 0.00 | % | — | 0.00 | % | — | 0.00 | % | |||||||||||||||
| Various energy futures contracts (Far East) |
— | 0.00 | % | — | 0.00 | % | — | 0.00 | % | — | 0.00 | % | |||||||||||||||
| Various interest rates futures contracts (U.S.) |
(7,227 | ) | -0.01 | % | — | 0.00 | % | — | 0.00 | % | — | 0.00 | % | ||||||||||||||
| Various interest rates futures contracts (Canada) |
(2,187 | ) | 0.00 | % | — | 0.00 | % | — | 0.00 | % | — | 0.00 | % | ||||||||||||||
| Various interest rates futures contracts (Europe) |
7,938 | 0.01 | % | — | 0.00 | % | — | 0.00 | % | — | 0.00 | % | |||||||||||||||
| Various interest rates futures contracts (Far East) |
(7,260 | ) | -0.01 | % | — | 0.00 | % | — | 0.00 | % | — | 0.00 | % | ||||||||||||||
| Various precious metals futures contracts (U.S.) |
39,585 | 0.04 | % | — | 0.00 | % | — | 0.00 | % | — | 0.00 | % | |||||||||||||||
| Various precious metals futures contracts (Europe) |
4,485 | 0.00 | % | — | 0.00 | % | — | 0.00 | % | — | 0.00 | % | |||||||||||||||
| Various soft futures contracts (U.S.) |
28,150 | 0.03 | % | — | 0.00 | % | — | 0.00 | % | — | 0.00 | % | |||||||||||||||
| Various soft futures contracts (Far East) |
(1,284 | ) | 0.00 | % | — | 0.00 | % | — | 0.00 | % | — | 0.00 | % | ||||||||||||||
| Various soft futures contracts (Europe) |
288 | 0.00 | % | — | 0.00 | % | — | 0.00 | % | — | 0.00 | % | |||||||||||||||
| Various soft futures contracts (Canada) |
— | 0.00 | % | — | 0.00 | % | — | 0.00 | % | — | 0.00 | % | |||||||||||||||
| Various stock index futures contracts (U.S.) |
11,691 | 0.01 | % | — | 0.00 | % | — | 0.00 | % | — | 0.00 | % | |||||||||||||||
| Various stock index futures contracts (Canada) |
— | 0.00 | % | — | 0.00 | % | — | 0.00 | % | — | 0.00 | % | |||||||||||||||
| Various stock index futures contracts (Europe) |
2,234 | 0.00 | % | — | 0.00 | % | — | 0.00 | % | — | 0.00 | % | |||||||||||||||
| Various stock index futures contracts (Far East) |
405 | 0.00 | % | — | 0.00 | % | — | 0.00 | % | — | 0.00 | % | |||||||||||||||
| Total Long Futures Contracts |
$ | 162,131 | 0.17 | % | $ | — | 0.00 | % | $ | — | 0.00 | % | $ | — | 0.00 | % | |||||||||||
| LONG OPTIONS * |
$ | — | 0.00 | % | $ | — | 0.00 | % | $ | — | 0.00 | % | $ | — | 0.00 | % | |||||||||||
| SHORT FUTURES CONTRACTS |
|||||||||||||||||||||||||||
| Various base metals futures contracts (U.S.) |
$ | — | 0.00 | % | $ | — | 0.00 | % | $ | — | 0.00 | % | $ | — | 0.00 | % | |||||||||||
| Various base metals futures contracts (Europe) |
(81,341 | ) | -0.09 | % | — | 0.00 | % | — | 0.00 | % | — | 0.00 | % | ||||||||||||||
| Various currency futures contracts (U.S.) |
— | 0.00 | % | — | 0.00 | % | — | 0.00 | % | — | 0.00 | % | |||||||||||||||
| Various currency futures contracts (Canada) |
— | 0.00 | % | — | 0.00 | % | — | 0.00 | % | — | 0.00 | % | |||||||||||||||
| Various currency futures contracts (Europe) |
— | 0.00 | % | — | 0.00 | % | — | 0.00 | % | — | 0.00 | % | |||||||||||||||
| Various currency futures contracts (Far East) |
— | 0.00 | % | — | 0.00 | % | — | 0.00 | % | — | 0.00 | % | |||||||||||||||
| Various energy futures contracts (U.S.) |
10,919 | 0.01 | % | — | 0.00 | % | — | 0.00 | % | — | 0.00 | % | |||||||||||||||
| Various energy futures contracts (Europe) |
— | 0.00 | % | — | 0.00 | % | — | 0.00 | % | — | 0.00 | % | |||||||||||||||
| Various interest rates futures contracts (U.S.) |
(1,594 | ) | 0.00 | % | — | 0.00 | % | — | 0.00 | % | — | 0.00 | % | ||||||||||||||
| Various interest rates futures contracts (Canada) |
— | 0.00 | % | — | 0.00 | % | — | 0.00 | % | — | 0.00 | % | |||||||||||||||
| Various interest rates futures contracts (Europe) |
— | 0.00 | % | — | 0.00 | % | — | 0.00 | % | — | 0.00 | % | |||||||||||||||
| Various interest rates futures contracts (Far East) |
3,702 | 0.00 | % | — | 0.00 | % | — | 0.00 | % | — | 0.00 | % | |||||||||||||||
| Various precious metals futures contracts (U.S.) |
— | 0.00 | % | — | 0.00 | % | — | 0.00 | % | — | 0.00 | % | |||||||||||||||
| Various soft futures contracts (U.S.) |
55,863 | 0.06 | % | — | 0.00 | % | — | 0.00 | % | — | 0.00 | % | |||||||||||||||
| Various soft futures contracts (Europe) |
(3,700 | ) | 0.00 | % | — | 0.00 | % | — | 0.00 | % | — | 0.00 | % | ||||||||||||||
| Various stock index futures contracts (U.S.) |
— | 0.00 | % | — | 0.00 | % | — | 0.00 | % | — | 0.00 | % | |||||||||||||||
| Various stock index futures contracts (Europe) |
— | 0.00 | % | — | 0.00 | % | — | 0.00 | % | — | 0.00 | % | |||||||||||||||
| Various stock index futures contracts (Far East) |
— | 0.00 | % | — | 0.00 | % | — | 0.00 | % | — | 0.00 | % | |||||||||||||||
| Total Short Futures Contracts |
$ | (16,151 | ) | -0.02 | % | $ | — | 0.00 | % | $ | — | 0.00 | % | $ | — | 0.00 | % | ||||||||||
| SHORT OPTIONS * |
$ | — | 0.00 | % | $ | — | 0.00 | % | $ | — | 0.00 | % | $ | — | 0.00 | % | |||||||||||
| CURRENCY FORWARDS * |
$ | 13,925 | 0.02 | % | $ | — | 0.00 | % | $ | — | 0.00 | % | $ | — | 0.00 | % | |||||||||||
| Total Open Trade Equity |
$ | 159,905 | 0.17 | % | $ | — | 0.00 | % | $ | — | 0.00 | % | $ | — | 0.00 | % | |||||||||||
| SWAPS (1) |
$ | 8,298,263 | 9.20 | % | $ | 9,946,597 | 907.98 | % | $ | — | 0.00 | % | $ | 16,476,961 | 39.09 | % | |||||||||||
| U.S. TREASURY SECURITIES | |||||||||||||||||||||||||||
| FACE VALUE |
Fair Value | Fair Value | Fair Value | Fair Value | |||||||||||||||||||||||
| $36,500,000.00 | US Treasury Note 3.875% due 02/15/2013 (Cost $38,125,391) (2) |
6,614,699 | 7.33 | % | 1,410,520 | 128.76 | % | 1,526,875 | 2.27 | % | 3,216,158 | 7.63 | % | ||||||||||||||
| $36,700,000.00 | US Treasury Note 4.000% due 02/15/2015 (Cost $38,016,039) (2) |
6,676,267 | 7.40 | % | 1,423,649 | 129.96 | % | 1,541,086 | 2.29 | % | 3,246,093 | 7.70 | % | ||||||||||||||
| $ | 13,290,966 | 14.73 | % | $ | 2,834,169 | 258.72 | % | $ | 3,067,961 | 4.56 | % | $ | 6,462,251 | 15.33 | % | ||||||||||||
| Additional Disclosure on U.S. |
Face Value | Face Value | Face Value | Face Value | |||||||||||||||||||||||
| US Treasury Note 3.875% due 02/15/2013 |
6,199,162 | 1,321,911 | 1,430,956 | 3,014,118 | |||||||||||||||||||||||
| US Treasury Note 4.000% due 02/15/2015 |
6,233,130 | 1,329,154 | 1,438,797 | 3,030,634 | |||||||||||||||||||||||
| $ | 12,432,292 | $ | 2,651,065 | $ | 2,869,753 | $ | 6,044,752 | ||||||||||||||||||||
| Cost | Cost | Cost | Cost | ||||||||||||||||||||||||
| US Treasury Note 3.875% due 02/15/2013 |
6,500,198 | 1,386,104 | 1,500,444 | 3,160,486 | |||||||||||||||||||||||
| US Treasury Note 4.000% due 02/15/2015 |
6,481,554 | 1,382,128 | 1,496,141 | 3,151,421 | |||||||||||||||||||||||
| $ | 12,981,752 | $ | 2,768,232 | $ | 2,996,585 | $ | 6,311,907 | ||||||||||||||||||||
| * | Except for those items disclosed, no individual futures, forwards and option on futures contract position constituted greater than 1 percent of Net Asset Value. Accordingly, the number of contracts and expiration dates are not presented. |
| (1) | See Notes to Financial Statements, Note 4. |
| (2) | Assets have been allocated to Series based on net assets which include inter-Series investments. |
The accompanying notes are an integral part of these financial statements.
8
Table of Contents
The Frontier Fund
Condensed Schedule of Investments
March 31, 2010 (Unaudited)
| Balanced Series | Campbell/Graham/Tiverton Series | Currency Series | Long Only Series | |||||||||||||||||||||||||
| Description |
Value | % of Capital (Net Asset Value) |
Value | % of Capital (Net Asset Value) |
Value | % of Capital (Net Asset Value) |
Value | % of Capital (Net Asset Value) |
||||||||||||||||||||
| LONG FUTURES CONTRACTS * |
||||||||||||||||||||||||||||
| Various base metals futures contracts (U.S.) |
$ | 147,346 | 0.04 | % | $ | 4,325 | 0.01 | % | $ | — | 0.00 | % | $ | — | 0.00 | % | ||||||||||||
| Various base metals futures contracts (Europe) |
6,734,074 | 1.78 | % | 433,226 | 0.61 | % | — | 0.00 | % | — | 0.00 | % | ||||||||||||||||
| Copper @ London Metal Exchange (LME) Settling 12/15/2010 (Number of Contracts: 58) |
4,715,950 | 1.24 | % | — | 0.00 | % | — | 0.00 | % | — | 0.00 | % | ||||||||||||||||
| Various currency futures contracts (U.S.) |
116,074 | 0.03 | % | — | 0.00 | % | — | 0.00 | % | — | 0.00 | % | ||||||||||||||||
| Various currency futures contracts (Canada) |
— | 0.00 | % | — | 0.00 | % | — | 0.00 | % | — | 0.00 | % | ||||||||||||||||
| Various currency futures contracts (Europe) |
10,774 | 0.00 | % | — | 0.00 | % | — | 0.00 | % | — | 0.00 | % | ||||||||||||||||
| Various currency futures contracts (Far East) |
— | 0.00 | % | — | 0.00 | % | — | 0.00 | % | — | 0.00 | % | ||||||||||||||||
| Various energy futures contracts (U.S.) |
203,494 | 0.05 | % | 127,735 | 0.18 | % | — | 0.00 | % | — | 0.00 | % | ||||||||||||||||
| Various energy futures contracts (Europe) |
171,955 | 0.05 | % | — | 0.00 | % | — | 0.00 | % | — | 0.00 | % | ||||||||||||||||
| Various interest rates futures contracts (U.S.) |
375,031 | 0.10 | % | (110,766 | ) | -0.16 | % | — | 0.00 | % | — | 0.00 | % | |||||||||||||||
| Various interest rates futures contracts (Canada) |
(17,933 | ) | 0.00 | % | — | 0.00 | % | — | 0.00 | % | — | 0.00 | % | |||||||||||||||
| Various interest rates futures contracts (Europe) |
749,253 | 0.20 | % | 160,204 | 0.23 | % | — | 0.00 | % | — | 0.00 | % | ||||||||||||||||
| Various interest rates futures contracts (Far East) |
45,218 | 0.01 | % | (31,592 | ) | -0.04 | % | — | 0.00 | % | — | 0.00 | % | |||||||||||||||
| Various precious metals futures contracts (U.S.) |
297,143 | 0.08 | % | 18,140 | 0.03 | % | — | 0.00 | % | — | 0.00 | % | ||||||||||||||||
| Various precious metals futures contracts (Europe) |
70,730 | 0.02 | % | 6,165 | 0.01 | % | — | 0.00 | % | — | 0.00 | % | ||||||||||||||||
| Various soft futures contracts (U.S.) |
(559,987 | ) | -0.15 | % | 1,064 | 0.00 | % | — | 0.00 | % | — | 0.00 | % | |||||||||||||||
| Various soft futures contracts (Europe) |
517,129 | 0.14 | % | (137 | ) | 0.00 | % | — | 0.00 | % | — | 0.00 | % | |||||||||||||||
| Various soft futures contracts (Far East) |
(10,632 | ) | 0.00 | % | — | 0.00 | % | — | 0.00 | % | — | 0.00 | % | |||||||||||||||
| Various stock index futures contracts (U.S.) |
259,351 | 0.07 | % | 135,760 | 0.19 | % | — | 0.00 | % | — | 0.00 | % | ||||||||||||||||
| Various stock index futures contracts (Europe) |
50,563 | 0.01 | % | 50,182 | 0.07 | % | — | 0.00 | % | — | 0.00 | % | ||||||||||||||||
| Various stock index futures contracts (Far East) |
148,722 | 0.04 | % | 64,009 | 0.09 | % | — | 0.00 | % | — | 0.00 | % | ||||||||||||||||
| Total Long Futures Contracts |
$ | 14,024,255 | 3.71 | % | $ | 858,315 | 1.22 | % | $ | — | 0.00 | % | $ | — | 0.00 | % | ||||||||||||
| LONG OPTIONS * |
(79,532 | ) | -0.02 | % | $ | — | 0.00 | % | $ | — | 0.00 | % | $ | — | 0.00 | % | ||||||||||||
| SHORT FUTURES CONTRACTS * |
||||||||||||||||||||||||||||
| Various base metals futures contracts (U.S.) |
$ | 60,745 | 0.02 | % | $ | — | 0.00 | % | $ | — | 0.00 | % | $ | — | 0.00 | % | ||||||||||||
| Various base metals futures contracts (Europe) |
(2,380,581 | ) | -0.63 | % | — | 0.00 | % | — | 0.00 | % | — | 0.00 | % | |||||||||||||||
| Various currency futures contracts (U.S.) |
2,227 | 0.00 | % | — | 0.00 | % | — | 0.00 | % | — | 0.00 | % | ||||||||||||||||
| Various currency futures contracts (Canada) |
— | 0.00 | % | — | 0.00 | % | — | 0.00 | % | — | 0.00 | % | ||||||||||||||||
| Various currency futures contracts (Europe) |
183,223 | 0.05 | % | — | 0.00 | % | — | 0.00 | % | — | 0.00 | % | ||||||||||||||||
| Various currency futures contracts (Far East) |
— | 0.00 | % | — | 0.00 | % | — | 0.00 | % | — | 0.00 | % | ||||||||||||||||
| Various energy futures contracts (U.S.) |
70,549 | 0.02 | % | 26,302 | 0.04 | % | — | 0.00 | % | — | 0.00 | % | ||||||||||||||||
| Various energy futures contracts (Europe) |
(28,965 | ) | -0.01 | % | — | 0.00 | % | — | 0.00 | % | — | 0.00 | % | |||||||||||||||
| Various interest rates futures contracts (U.S.) |
(75,910 | ) | -0.02 | % | — | 0.00 | % | — | 0.00 | % | — | 0.00 | % | |||||||||||||||
| Various interest rates futures contracts (Canada) |
— | 0.00 | % | 7,259 | 0.01 | % | — | 0.00 | % | — | 0.00 | % | ||||||||||||||||
| Various interest rates futures contracts (Europe) |
(71,190 | ) | -0.02 | % | — | 0.00 | % | — | 0.00 | % | — | 0.00 | % | |||||||||||||||
| Various interest rates futures contracts (Far East) |
136,499 | 0.04 | % | 58,541 | 0.08 | % | — | 0.00 | % | — | 0.00 | % | ||||||||||||||||
| Various precious metals futures contracts (U.S.) |
(143,490 | ) | -0.04 | % | — | 0.00 | % | — | 0.00 | % | — | 0.00 | % | |||||||||||||||
| Various precious metals futures contracts (Europe) |
382 | 0.00 | % | (178,534 | ) | -0.25 | % | — | 0.00 | % | — | 0.00 | % | |||||||||||||||
| Various soft futures contracts (U.S.) |
971,798 | 0.26 | % | 65,609 | 0.09 | % | — | 0.00 | % | — | 0.00 | % | ||||||||||||||||
| Various soft futures contracts (Canada) |
134 | 0.00 | % | 39 | 0.00 | % | — | 0.00 | % | — | 0.00 | % | ||||||||||||||||
| Various soft futures contracts (Europe) |
(451,208 | ) | -0.12 | % | — | 0.00 | % | — | 0.00 | % | — | 0.00 | % | |||||||||||||||
| Various stock index futures contracts (U.S.) |
143,297 | 0.04 | % | — | 0.00 | % | — | 0.00 | % | — | 0.00 | % | ||||||||||||||||
| Various stock index futures contracts (Canada) |
— | 0.00 | % | — | 0.00 | % | — | 0.00 | % | — | 0.00 | % | ||||||||||||||||
| Various stock index futures contracts (Europe) |
103,823 | 0.03 | % | — | 0.00 | % | — | 0.00 | % | — | 0.00 | % | ||||||||||||||||
| Various stock index futures contracts (Far East) |
(22,853 | ) | -0.01 | % | (7,898 | ) | -0.01 | % | — | 0.00 | % | — | 0.00 | % | ||||||||||||||
| Total Short Futures Contracts |
$ | (1,501,520 | ) | -0.39 | % | $ | (28,682 | ) | -0.04 | % | $ | — | 0.00 | % | $ | — | 0.00 | % | ||||||||||
| SHORT OPTIONS * |
1,015,006 | 0.27 | % | $ | — | 0.00 | % | $ | — | 0.00 | % | $ | — | 0.00 | % | |||||||||||||
| CURRENCY FORWARDS * |
$ | 417,460 | 0.11 | % | $ | (87,674 | ) | -0.12 | % | $ | 64,940 | 0.75 | % | $ | — | 0.00 | % | |||||||||||
| Total Open Trade Equity |
$ | 13,875,669 | 3.68 | % | $ | 741,959 | 1.06 | % | $ | 64,940 | 0.75 | % | $ | — | 0.00 | % | ||||||||||||
| SWAPS (1) |
$ | 42,259,114 | 11.15 | % | $ | — | 0.00 | % | $ | 5,463,318 | 63.16 | % | $ | 405,105 | 9.56 | % | ||||||||||||
| U.S. TREASURY SECURITIES |
||||||||||||||||||||||||||||
| FACE VALUE |
Fair Value | Fair Value | Fair Value | Fair Value | ||||||||||||||||||||||||
| $36,500,000.00 | US Treasury Note 3.875% due 02/15/2013 (Cost $38,125,391) (2) |
14,476,615 | 3.82 | % | 3,343,708 | 4.73 | % | 1,126,936 | 13.03 | % | 278,960 | 6.58 | % | |||||||||||||||
| $36,700,000.00 | US Treasury Note 4.000% due 02/15/2015 (Cost $38,016,039) (2) |
14,611,357 | 3.85 | % | 3,374,829 | 4.77 | % | 1,137,425 | 13.15 | % | 281,556 | 6.64 | % | |||||||||||||||
| $ | 29,087,972 | 7.67 | % | $ | 6,718,537 | 9.50 | % | $ | 2,264,361 | 26.18 | % | $ | 560,516 | 13.22 | % | |||||||||||||
| Additional Disclosure on U.S. |
Face Value | Face Value | Face Value | Face Value | ||||||||||||||||||||||||
| US Treasury Note 3.875% due 02/15/2013 |
13,567,189 | 3,133,655 | 1,056,141 | 261,436 | ||||||||||||||||||||||||
| US Treasury Note 4.000% due 02/15/2015 |
13,641,530 | 3,150,826 | 1,061,928 | 262,868 | ||||||||||||||||||||||||
| $ | 27,208,719 | $ | 6,284,481 | $ | 2,118,069 | $ | 524,304 | |||||||||||||||||||||
| Cost | Cost | Cost | Cost | |||||||||||||||||||||||||
| US Treasury Note 3.875% due 02/15/2013 |
14,226,022 | 3,285,827 | 1,107,428 | 274,131 | ||||||||||||||||||||||||
| US Treasury Note 4.000% due 02/15/2015 |
14,185,219 | 3,276,403 | 1,104,252 | 273,345 | ||||||||||||||||||||||||
| $ | 28,411,241 | $ | 6,562,230 | $ | 2,211,680 | $ | 547,476 | |||||||||||||||||||||
| * | Except for those items disclosed, no individual futures, forwards and option on futures contract position constituted greater than 1 percent of Net Asset Value. Accordingly, the number of contracts and expiration dates are not presented. |
| (1) | See Notes to Financial Statements, Note 4. |
| (2) | Assets have been allocated to the Series based on net assets which include inter-Series investments. |
The accompanying notes are an integral part of these financial statements.
9
Table of Contents
The Frontier Fund
Condensed Schedule of Investments
March 31, 2010 (Unaudited)
| Managed Futures Index Series | Winton Series | Winton/Graham Series | |||||||||||||||||||
| Description |
Value | % of Capital (Net Asset Value) |
Value | % of Capital (Net Asset Value) |
Value | % of Capital (Net Asset Value) |
|||||||||||||||
| LONG FUTURES CONTRACTS |
|||||||||||||||||||||
| Various base metals futures contracts (U.S.) |
$ | — | 0.00 | % | $ | — | 0.00 | % | $ | 52,238 | 0.08 | % | |||||||||
| Various base metals futures contracts (Europe) |
— | 0.00 | % | — | 0.00 | % | 132,824 | 0.20 | % | ||||||||||||
| Various currency futures contracts (U.S.) |
— | 0.00 | % | — | 0.00 | % | 8,109 | 0.01 | % | ||||||||||||
| Various currency futures contracts (Canada) |
— | 0.00 | % | — | 0.00 | % | — | 0.00 | % | ||||||||||||
| Various currency futures contracts (Europe) |
— | 0.00 | % | — | 0.00 | % | 4,918 | 0.01 | % | ||||||||||||
| Various currency futures contracts (Far East) |
— | 0.00 | % | — | 0.00 | % | — | 0.00 | % | ||||||||||||
| Various energy futures contracts (U.S.) |
— | 0.00 | % | — | 0.00 | % | 330,615 | 0.50 | % | ||||||||||||
| Various energy futures contracts (Europe) |
— | 0.00 | % | — | 0.00 | % | — | 0.00 | % | ||||||||||||
| Various interest rates futures contracts (U.S.) |
— | 0.00 | % | — | 0.00 | % | (20,996 | ) | -0.03 | % | |||||||||||
| Various interest rates futures contracts (Canada) |
— | 0.00 | % | — | 0.00 | % | — | 0.00 | % | ||||||||||||
| Various interest rates futures contracts (Europe) |
— | 0.00 | % | — | 0.00 | % | 234,898 | 0.36 | % | ||||||||||||
| Various interest rates futures contracts (Far East) |
— | 0.00 | % | — | 0.00 | % | 14,044 | 0.02 | % | ||||||||||||
| Various precious metals futures contracts (U.S.) |
— | 0.00 | % | — | 0.00 | % | 66,490 | 0.10 | % | ||||||||||||
| Various soft futures contracts (U.S.) |
— | 0.00 | % | — | 0.00 | % | (10,507 | ) | -0.02 | % | |||||||||||
| Various soft futures contracts (Far East) |
— | 0.00 | % | — | 0.00 | % | — | 0.00 | % | ||||||||||||
| Various soft futures contracts (Europe) |
— | 0.00 | % | — | 0.00 | % | — | 0.00 | % | ||||||||||||
| Various soft futures contracts (Canada) |
— | 0.00 | % | — | 0.00 | % | — | 0.00 | % | ||||||||||||
| Various stock index futures contracts (U.S.) |
— | 0.00 | % | — | 0.00 | % | 161,141 | 0.24 | % | ||||||||||||
| Various stock index futures contracts (Canada) |
— | 0.00 | % | — | 0.00 | % | 1,340 | 0.00 | % | ||||||||||||
| Various stock index futures contracts (Europe) |
— | 0.00 | % | — | 0.00 | % | (118,949 | ) | -0.18 | % | |||||||||||
| Various stock index futures contracts (Far East) |
— | 0.00 | % | — | 0.00 | % | 118,338 | 0.18 | % | ||||||||||||
| Total Long Futures Contracts |
$ | — | 0.00 | % | $ | — | 0.00 | % | $ | 974,503 | 1.47 | % | |||||||||
| LONG OPTIONS * |
$ | — | 0.00 | % | $ | — | 0.00 | % | $ | — | 0.00 | % | |||||||||
| SHORT FUTURES CONTRACTS |
|||||||||||||||||||||
| Various base metals futures contracts (U.S.) |
$ | — | 0.00 | % | $ | — | 0.00 | % | $ | (1,950 | ) | 0.00 | % | ||||||||
| Various base metals futures contracts (Europe) |
— | 0.00 | % | — | 0.00 | % | (23,106 | ) | -0.04 | % | |||||||||||
| Various currency futures contracts (U.S.) |
— | 0.00 | % | — | 0.00 | % | — | 0.00 | % | ||||||||||||
| Various currency futures contracts (Canada) |
— | 0.00 | % | — | 0.00 | % | — | 0.00 | % | ||||||||||||
| Various currency futures contracts (Europe) |
— | 0.00 | % | — | 0.00 | % | (891 | ) | 0.00 | % | |||||||||||
| Various currency futures contracts (Far East) |
— | 0.00 | % | — | 0.00 | % | — | 0.00 | % | ||||||||||||
| Various energy futures contracts (U.S.) |
— | 0.00 | % | — | 0.00 | % | 182,489 | 0.28 | % | ||||||||||||
| Various energy futures contracts (Europe) |
— | 0.00 | % | — | 0.00 | % | 162,795 | 0.25 | % | ||||||||||||
| Various interest rates futures contracts (U.S.) |
— | 0.00 | % | — | 0.00 | % | (13,063 | ) | -0.02 | % | |||||||||||
| Various interest rates futures contracts (Canada) |
— | 0.00 | % | — | 0.00 | % | 12,971 | 0.02 | % | ||||||||||||
| Various interest rates futures contracts (Europe) |
— | 0.00 | % | — | 0.00 | % | — | 0.00 | % | ||||||||||||
| Various interest rates futures contracts (Far East) |
— | 0.00 | % | — | 0.00 | % | 30,993 | 0.05 | % | ||||||||||||
| Various precious metals futures contracts (U.S.) |
— | 0.00 | % | — | 0.00 | % | — | 0.00 | % | ||||||||||||
| Various soft futures contracts (U.S.) |
— | 0.00 | % | — | 0.00 | % | 416,695 | 0.63 | % | ||||||||||||
| Various soft futures contracts (Europe) |
— | 0.00 | % | — | 0.00 | % | (3,868 | ) | -0.01 | % | |||||||||||
| Various stock index futures contracts (U.S.) |
— | 0.00 | % | — | 0.00 | % | — | 0.00 | % | ||||||||||||
| Various stock index futures contracts (Europe) |
— | 0.00 | % | — | 0.00 | % | — | 0.00 | % | ||||||||||||
| Various stock index futures contracts (Far East) |
— | 0.00 | % | — | 0.00 | % | (8,774 | ) | -0.01 | % | |||||||||||
| Total Short Futures Contracts |
$ | — | 0.00 | % | $ | — | 0.00 | % | $ | 754,291 | 1.15 | % | |||||||||
| SHORT OPTIONS * |
$ | — | 0.00 | % | $ | — | 0.00 | % | 0.00 | % | |||||||||||
| CURRENCY FORWARDS * |
$ | — | 0.00 | % | $ | — | 0.00 | % | $ | 291,606 | 0.44 | % | |||||||||
| Total Open Trade Equity |
$ | — | 0.00 | % | $ | — | 0.00 | % | $ | 2,020,400 | 3.06 | % | |||||||||
| SWAPS (1) |
$ | — | 0.00 | % | $ | — | 0.00 | % | $ | — | 0.00 | % | |||||||||
| FACE VALUE |
Fair Value | Fair Value | Fair Value | ||||||||||||||||||
| $36,500,000.00 | US Treasury Note 3.875% due 02/15/2013 (Cost $38,125,391) (2) |
146,162 | 2.61 | % | 3,312,633 | 5.57 | % | 3,493,374 | 5.33 | % | |||||||||||
| $36,700,000.00 | US Treasury Note 4.000% due 02/15/2015 (Cost $38,016,039) (2) |
147,523 | 2.63 | % | 3,343,466 | 5.63 | % | 3,525,889 | 5.38 | % | |||||||||||
| $ | 293,685 | 5.24 | % | $ | 6,656,099 | 11.20 | % | $ | 7,019,263 | 10.71 | % | ||||||||||
| Additional Disclosure on U.S. Treasury Securities |
Face Value | Face Value | Face Value | ||||||||||||||||||
| US Treasury Note 3.875% due 02/15/2013 |
136,980 | 3,104,532 | 3,273,919 | ||||||||||||||||||
| US Treasury Note 4.000% due 02/15/2015 |
137,731 | 3,121,543 | 3,291,858 | ||||||||||||||||||
| $ | 274,711 | $ | 6,226,075 | $ | 6,565,777 | ||||||||||||||||
| Cost | Cost | Cost | |||||||||||||||||||
| US Treasury Note 3.875% due 02/15/2013 |
143,632 | 3,255,291 | 3,285,827 | ||||||||||||||||||
| US Treasury Note 4.000% due 02/15/2015 |
143,220 | 3,245,954 | 3,276,403 | ||||||||||||||||||
| $ | 286,852 | $ | 6,501,245 | $ | 6,562,230 | ||||||||||||||||
| * | Except for those items disclosed, no individual futures, forwards and option on futures contract position constituted greater than 1 percent of Net Asset Value. Accordingly, the number of contracts and expiration dates are not presented. |
| (1) | See Notes to Financial Statements, Note 4. |
| (2) | Assets have been allocated to Series based on net assets which include inter-Series investments. |
The accompanying notes are an integral part of these financial statements.
10
Table of Contents
The Frontier Fund
Condensed Schedule of Investments
December 31, 2009
| Frontier Diversified Series | Frontier Dynamic Series | Frontier Long/Short Commodity Series |
Frontier Masters Series | ||||||||||||||||||||||||
| Description |
Value | % of Capital (Net Asset Value |
Value | % of Capital (Net Asset Value) |
Value | % of Capital (Net Asset Value) |
Value | % of Capital (Net Asset Value) |
|||||||||||||||||||
| LONG FUTURES CONTRACTS * |
|||||||||||||||||||||||||||
| Various base metals futures contracts (U.S.) |
$ | — | 0.00 | % | $ | — | 0.00 | % | $ | (156,407 | ) | -0.23 | % | $ | — | 0.00 | % | ||||||||||
| Silver @ Comex Settling 5/1/2010 (Number of Contracts: 500) |
— | 0.00 | % | — | 0.00 | % | 1,090,000 | 1.59 | % | ||||||||||||||||||
| Various base metals futures contracts (Europe) |
— | 0.00 | % | — | 0.00 | % | 1,150,643 | 1.68 | % | — | 0.00 | % | |||||||||||||||
| Various currency futures contracts (U.S.) |
— | 0.00 | % | — | 0.00 | % | (6,050 | ) | -0.01 | % | — | 0.00 | % | ||||||||||||||
| Various currency futures contracts (Canada) |
— | 0.00 | % | — | 0.00 | % | — | 0.00 | % | — | 0.00 | % | |||||||||||||||
| Various currency futures contracts (Europe) |
— | 0.00 | % | — | 0.00 | % | (39,963 | ) | -0.06 | % | — | 0.00 | % | ||||||||||||||
| Various currency futures contracts (Far East) |
— | 0.00 | % | — | 0.00 | % | — | 0.00 | % | — | 0.00 | % | |||||||||||||||
| Various energy futures contracts (U.S.) |
— | 0.00 | % | — | 0.00 | % | (2,068,184 | ) | -3.02 | % | — | 0.00 | % | ||||||||||||||
| Crude Oil, Light Settling 3/1/2010 (Number of Contracts: 1,281) |
— | 0.00 | % | — | 0.00 | % | 3,305,111 | 4.82 | % | — | 0.00 | % | |||||||||||||||
| Natural Gas Settling 5/1/2010 (Number of Contracts: 699) |
— | 0.00 | % | — | 0.00 | % | (1,204,616 | ) | -1.76 | % | — | 0.00 | % | ||||||||||||||
| Various energy futures contracts (Europe) |
— | 0.00 | % | — | 0.00 | % | 23,935 | 0.03 | % | — | 0.00 | % | |||||||||||||||
| Various interest rates futures contracts (U.S.) |
— | 0.00 | % | — | 0.00 | % | (159,796 | ) | -0.23 | % | — | 0.00 | % | ||||||||||||||
| Various interest rates futures contracts (Canada) |
— | 0.00 | % | — | 0.00 | % | — | 0.00 | % | — | 0.00 | % | |||||||||||||||
| Various interest rates futures contracts (Europe) |
— | 0.00 | % | — | 0.00 | % | (228,947 | ) | -0.33 | % | — | 0.00 | % | ||||||||||||||
| Various interest rates futures contracts (Far East) |
— | 0.00 | % | — | 0.00 | % | 52,229 | 0.08 | % | — | 0.00 | % | |||||||||||||||
| Various precious metals futures contracts (U.S.) |
— | 0.00 | % | — | 0.00 | % | (269,865 | ) | -0.39 | % | — | 0.00 | % | ||||||||||||||
| Various precious metals futures contracts (Europe) |
— | 0.00 | % | — | 0.00 | % | 15 | 0.00 | % | — | 0.00 | % | |||||||||||||||
| Various soft futures contracts (U.S.) |
— | 0.00 | % | — | 0.00 | % | 495,577 | 0.72 | % | — | 0.00 | % | |||||||||||||||
| Coffee @ CSCE Settling 12/1/2010 (Number of Contracts: 2,014) |
— | 0.00 | % | — | 0.00 | % | (5,962,294 | ) | -8.70 | % | — | 0.00 | % | ||||||||||||||
| Coffee @ CSCE Settling 9/1/2010 (Number of Contracts: 1,703) |
— | 0.00 | % | — | 0.00 | % | (6,875,963 | ) | -10.03 | % | — | 0.00 | % | ||||||||||||||
| Various soft futures contracts (Far East) |
— | 0.00 | % | — | 0.00 | % | 8,290 | 0.01 | % | — | 0.00 | % | |||||||||||||||
| Various soft futures contracts (Europe) |
— | 0.00 | % | — | 0.00 | % | 5,313 | 0.01 | % | — | 0.00 | % | |||||||||||||||
| Various soft futures contracts (Canada) |
— | 0.00 | % | — | 0.00 | % | — | 0.00 | % | — | 0.00 | % | |||||||||||||||
| Various stock index futures contracts (U.S.) |
— | 0.00 | % | — | 0.00 | % | 111,835 | 0.16 | % | — | 0.00 | % | |||||||||||||||
| Various stock index futures contracts (Canada) |
— | 0.00 | % | — | 0.00 | % | 0.00 | % | — | 0.00 | % | ||||||||||||||||
| Various stock index futures contracts (Europe) |
— | 0.00 | % | — | 0.00 | % | (7,766 | ) | -0.01 | % | — | 0.00 | % | ||||||||||||||
| Various stock index futures contracts (Far East) |
— | 0.00 | % | — | 0.00 | % | — | 0.00 | % | — | 0.00 | % | |||||||||||||||
| Total Long Futures Contracts |
$ | — | 0.00 | % | $ | — | 0.00 | % | $ | (10,736,903 | ) | -15.66 | % | $ | — | 0.00 | % | ||||||||||
| LONG OPTIONS * |
$ | — | 0.00 | % | $ | — | 0.00 | % | $ | (205,075 | ) | -0.30 | % | $ | — | 0.00 | % | ||||||||||
| SHORT FUTURES CONTRACTS |
|||||||||||||||||||||||||||
| Various base metals futures contracts (U.S.) |
$ | — | 0.00 | % | $ | — | 0.00 | % | $ | (13,613 | ) | -0.02 | % | $ | — | 0.00 | % | ||||||||||
| Silver @ Comex Settling 3/1/2010 (Number of Contracts: 500) |
— | 0.00 | % | — | 0.00 | % | (1,075,000 | ) | -1.57 | % | |||||||||||||||||
| Various base metals futures contracts (Europe) |
— | 0.00 | % | — | 0.00 | % | (799,966 | ) | -1.17 | % | — | 0.00 | % | ||||||||||||||
| Various currency futures contracts (U.S.) |
— | 0.00 | % | — | 0.00 | % | 5,488 | 0.01 | % | — | 0.00 | % | |||||||||||||||
| Various currency futures contracts (Canada) |
— | 0.00 | % | — | 0.00 | % | — | 0.00 | % | — | 0.00 | % | |||||||||||||||
| Various currency futures contracts (Europe) |
— | 0.00 | % | — | 0.00 | % | 10,638 | 0.02 | % | — | 0.00 | % | |||||||||||||||
| Various currency futures contracts (Far East) |
— | 0.00 | % | — | 0.00 | % | 21,703 | 0.03 | % | — | 0.00 | % | |||||||||||||||
| Various energy futures contracts (U.S.) |
— | 0.00 | % | — | 0.00 | % | 694,557 | 1.01 | % | — | 0.00 | % | |||||||||||||||
| Crude Oil, Light Settling 2/1/2010 (Number of Contracts: 650) |
— | 0.00 | % | — | 0.00 | % | (1,812,713 | ) | -2.64 | % | — | 0.00 | % | ||||||||||||||
| Crude Oil, Light Settling 4/1/2010 (Number of Contracts: 613) |
— | 0.00 | % | — | 0.00 | % | (1,370,558 | ) | -2.00 | % | — | 0.00 | % | ||||||||||||||
| Natural Gas Settling 4/1/2010 (number of Contracts: 747) |
— | 0.00 | % | — | 0.00 | % | 1,627,470 | 2.37 | % | — | 0.00 | % | |||||||||||||||
| Natural Gas Settling 5/1/2010 (number of Contracts: 1,387) |
— | 0.00 | % | — | 0.00 | % | 941,441 | 1.37 | % | — | 0.00 | % | |||||||||||||||
| Various energy futures contracts (Europe) |
— | 0.00 | % | — | 0.00 | % | (69,230 | ) | -0.10 | % | — | 0.00 | % | ||||||||||||||
| Various interest rates futures contracts (US) |
— | 0.00 | % | — | 0.00 | % | 361,042 | 0.53 | % | — | 0.00 | % | |||||||||||||||
| Various interest rates futures contracts (Canada) |
— | 0.00 | % | — | 0.00 | % | — | 0.00 | % | — | 0.00 | % | |||||||||||||||
| Various interest rates futures contracts (Europe) |
— | 0.00 | % | — | 0.00 | % | — | 0.00 | % | — | 0.00 | % | |||||||||||||||
| Various interest rates futures contracts (Far East) |
— | 0.00 | % | — | 0.00 | % | — | 0.00 | % | — | 0.00 | % | |||||||||||||||
| Various precious metals futures contracts (U.S.) |
— | 0.00 | % | — | 0.00 | % | — | 0.00 | % | — | 0.00 | % | |||||||||||||||
| Various soft futures contracts (U.S.) |
— | 0.00 | % | — | 0.00 | % | (1,126,898 | ) | -1.64 | % | — | 0.00 | % | ||||||||||||||
| Coffee @ CSCE Settling 3/1/2010 (Number of Contracts: 2,562) |
— | 0.00 | % | — | 0.00 | % | 7,791,994 | 11.36 | % | — | 0.00 | % | |||||||||||||||
| Coffee @ CSCE Settling 5/1/2010 (Number of Contracts: 456) |
— | 0.00 | % | — | 0.00 | % | 2,061,450 | 3.01 | % | — | 0.00 | % | |||||||||||||||
| Coffee @ CSCE Settling 7/1/2010 (Number of Contracts: 718) |
— | 0.00 | % | — | 0.00 | % | 3,021,281 | 4.41 | % | — | 0.00 | % | |||||||||||||||
| Various soft futures contracts (Europe) |
— | 0.00 | % | — | 0.00 | % | 5,063 | 0.01 | % | — | 0.00 | % | |||||||||||||||
| Various stock index futures contracts (U.S.) |
— | 0.00 | % | — | 0.00 | % | (16,665 | ) | -0.02 | % | — | 0.00 | % | ||||||||||||||
| Various stock index futures contracts (Europe) |
— | 0.00 | % | — | 0.00 | % | — | 0.00 | % | — | 0.00 | % | |||||||||||||||
| Various stock index futures contracts (Far East) |
— | 0.00 | % | — | 0.00 | % | (1,461 | ) | 0.00 | % | — | 0.00 | % | ||||||||||||||
| Total Short Futures Contracts |
$ | — | 0.00 | % | $ | — | 0.00 | % | $ | 10,256,023 | 14.96 | % | $ | — | 0.00 | % | |||||||||||
| SHORT OPTIONS * |
$ | — | 0.00 | % | $ | — | 0.00 | % | $ | 167,465 | 0.24 | % | $ | — | 0.00 | % | |||||||||||
| CURRENCY FORWARDS * |
$ | — | 0.00 | % | $ | — | 0.00 | % | $ | — | 0.00 | % | $ | — | 0.00 | % | |||||||||||
| Total Open Trade Equity |
$ | — | 0.00 | % | $ | — | 0.00 | % | $ | (518,490 | ) | -0.76 | % | $ | — | 0.00 | % | ||||||||||
| SWAPS (1) |
$ | 8,550,639 | 15.18 | % | $ | 10,027,253 | 1117.97 | % | $ | — | 0.00 | % | $ | 15,972,156 | 68.59 | % | |||||||||||
| U.S. TREASURY SECURITIES |
|||||||||||||||||||||||||||
| FACE VALUE |
Fair Value | Fair Value | Fair Value | Fair Value | |||||||||||||||||||||||
| $36,500,000.00 | US Treasury Note 3.875% due 02/15/2013 (Cost $38,125,391) (2) |
3,875,920 | 6.88 | % | 1,367,142 | 152.43 | % | 3,271,669 | 4.77 | % | 1,688,715 | 7.25 | % | ||||||||||||||
| $36,700,000.00 | US Treasury Note 4.000% due 02/15/2015 (Cost $38,016,039) (2) |
3,889,723 | 6.91 | % | 1,372,011 | 152.97 | % | 3,283,321 | 4.79 | % | 1,694,729 | 7.28 | % | ||||||||||||||
| $ | 7,765,643 | 13.79 | % | $ | 2,739,153 | 305.40 | % | $ | 6,554,990 | 9.56 | % | $ | 3,383,444 | 14.53 | % | ||||||||||||
| Additional Disclosure on U.S. Treasury Securities |
Face Value | Face Value | Face Value | Face Value | |||||||||||||||||||||||
| US Treasury Note 3.875% due 02/15/2013 |
3,639,895 | 1,283,890 | 3,072,440 | 1,585,880 | |||||||||||||||||||||||
| US Treasury Note 4.000% due 02/15/2015 |
3,659,840 | 1,290,925 | 3,089,276 | 1,594,570 | |||||||||||||||||||||||
| $ | 7,299,735 | $ | 2,574,815 | $ | 6,161,716 | $ | 3,180,450 | ||||||||||||||||||||
| Cost | Cost | Cost | Cost | ||||||||||||||||||||||||
| US Treasury Note 3.875% due 02/15/2013 |
3,801,984 | 1,341,063 | 3,209,260 | 1,656,502 | |||||||||||||||||||||||
| US Treasury Note 4.000% due 02/15/2015 |
3,791,079 | 1,337,216 | 3,200,055 | 1,651,750 | |||||||||||||||||||||||
| $ | 7,593,063 | $ | 2,678,279 | $ | 6,409,315 | $ | 3,308,252 | ||||||||||||||||||||
| * | Except for those items disclosed, no individual futures, forwards and option on futures contract position constituted greater than 1 percent of Net Asset Value. Accordingly, the number of contracts and expiration dates are not presented. |
| (1) | See Notes to Financial Statements, Note 4. |
| (2) | Assets have been allocated to Series based on net assets which include inter-Series investments. |
The accompanying notes are an integral part of these financial statements.
11
Table of Contents
The Frontier Fund
Condensed Schedule of Investments
December 31, 2009
| Balanced Series | Campbell/Graham/Tiverton Series | Currency Series | Long Only Series | ||||||||||||||||||||||||
| Description |
Value | % of Capital (Net Asset Value |
Value | % of Capital (Net Asset Value |
Value | % of Capital (Net Asset Value |
Value | % of Capital (Net Asset Value) |
|||||||||||||||||||
| LONG FUTURES CONTRACTS * |
|||||||||||||||||||||||||||
| Various base metals futures contracts (U.S.) |
$ | (102,978 | ) | -0.03 | % | $ | — | 0.00 | % | $ | — | 0.00 | % | $ | — | 0.00 | % | ||||||||||
| Various base metals futures contracts (Europe) |
22,207,995 | 5.48 | % | — | 0.00 | % | — | 0.00 | % | — | 0.00 | % | |||||||||||||||
| Various currency futures contracts (U.S.) |
81,706 | 0.02 | % | — | 0.00 | % | — | 0.00 | % | — | 0.00 | % | |||||||||||||||
| Various currency futures contracts (Canada) |
— | 0.00 | % | — | 0.00 | % | — | 0.00 | % | — | 0.00 | % | |||||||||||||||
| Various currency futures contracts (Europe) |
(97,838 | ) | -0.02 | % | — | 0.00 | % | — | 0.00 | % | — | 0.00 | % | ||||||||||||||
| Various currency futures contracts (Far East) |
32,904 | 0.01 | % | — | 0.00 | % | — | 0.00 | % | — | 0.00 | % | |||||||||||||||
| Various energy futures contracts (U.S.) |
572,173 | 0.14 | % | — | 0.00 | % | — | 0.00 | % | — | 0.00 | % | |||||||||||||||
| Various energy futures contracts (Europe) |
155,870 | 0.04 | % | — | 0.00 | % | — | 0.00 | % | — | 0.00 | % | |||||||||||||||
| Various interest rates futures contracts (U.S.) |
(794,718 | ) | -0.20 | % | — | 0.00 | % | — | 0.00 | % | — | 0.00 | % | ||||||||||||||
| Various interest rates futures contracts (Canada) |
(31,250 | ) | -0.01 | % | — | 0.00 | % | — | 0.00 | % | — | 0.00 | % | ||||||||||||||
| Various interest rates futures contracts (Europe) |
(477,750 | ) | -0.12 | % | — | 0.00 | % | — | 0.00 | % | — | 0.00 | % | ||||||||||||||
| Various interest rates futures contracts (Far East) |
24,871 | 0.01 | % | — | 0.00 | % | — | 0.00 | % | — | 0.00 | % | |||||||||||||||
| Various precious metals futures contracts (U.S.) |
(209,115 | ) | -0.05 | % | — | 0.00 | % | — | 0.00 | % | — | 0.00 | % | ||||||||||||||
| Various precious metals futures contracts (Europe) |
19,570 | 0.00 | % | — | 0.00 | % | — | 0.00 | % | — | 0.00 | % | |||||||||||||||
| Various soft futures contracts (U.S.) |
913,853 | 0.23 | % | — | 0.00 | % | — | 0.00 | % | — | 0.00 | % | |||||||||||||||
| Various soft futures contracts (Far East) |
389,458 | 0.10 | % | — | 0.00 | % | — | 0.00 | % | — | 0.00 | % | |||||||||||||||
| Various soft futures contracts (Europe) |
4,769 | 0.00 | % | — | 0.00 | % | — | 0.00 | % | — | 0.00 | % | |||||||||||||||
| Various soft futures contracts (Canada) |
— | 0.00 | % | — | 0.00 | % | — | 0.00 | % | — | 0.00 | % | |||||||||||||||
| Various stock index futures contracts (U.S.) |
1,067,750 | 0.26 | % | — | 0.00 | % | — | 0.00 | % | — | 0.00 | % | |||||||||||||||
| Various stock index futures contracts (Canada) |
— | 0.00 | % | — | 0.00 | % | — | 0.00 | % | — | 0.00 | % | |||||||||||||||
| Various stock index futures contracts (Europe) |
241,919 | 0.06 | % | — | 0.00 | % | — | 0.00 | % | — | 0.00 | % | |||||||||||||||
| Various stock index futures contracts (Far East) |
183,153 | 0.05 | % | — | 0.00 | % | — | 0.00 | % | — | 0.00 | % | |||||||||||||||
| Total Long Futures Contracts |
$ | 24,182,342 | 5.97 | % | $ | — | 0.00 | % | $ | — | 0.00 | % | $ | — | 0.00 | % | |||||||||||
| LONG OPTIONS * |
$ | (1,304,319 | ) | -0.32 | % | $ | — | 0.00 | % | $ | — | 0.00 | % | $ | — | 0.00 | % | ||||||||||
| SHORT FUTURES CONTRACTS * |
|||||||||||||||||||||||||||
| Various base metals futures contracts (U.S.) |
$ | (170,634 | ) | -0.04 | % | $ | — | 0.00 | % | $ | — | 0.00 | % | $ | — | 0.00 | % | ||||||||||
| Various base metals futures contracts (Europe) |
5,803,306 | 1.43 | % | — | 0.00 | % | — | 0.00 | % | — | 0.00 | % | |||||||||||||||
| Copper @ LME Settling 3/17/2010 (Number of Contracts: 744) |
(14,032,634 | ) | -3.47 | % | — | 0.00 | % | — | 0.00 | % | — | 0.00 | % | ||||||||||||||
| Various currency futures contracts (US) |
(41,610 | ) | -0.01 | % | — | 0.00 | % | — | 0.00 | % | — | 0.00 | % | ||||||||||||||
| Various currency futures contracts (Canada) |
— | 0.00 | % | — | 0.00 | % | — | 0.00 | % | — | 0.00 | % | |||||||||||||||
| Various currency futures contracts (Europe) |
934,027 | 0.23 | % | — | 0.00 | % | — | 0.00 | % | — | 0.00 | % | |||||||||||||||
| Various currency futures contracts (Far East) |
— | 0.00 | % | — | 0.00 | % | — | 0.00 | % | — | 0.00 | % | |||||||||||||||
| Various energy futures contracts (U.S.) |
(798,293 | ) | -0.20 | % | — | 0.00 | % | — | 0.00 | % | — | 0.00 | % | ||||||||||||||
| Various energy futures contracts (Europe) |
(203,350 | ) | -0.05 | % | — | 0.00 | % | — | 0.00 | % | — | 0.00 | % | ||||||||||||||
| Various interest rates futures contracts (U.S.) |
553,520 | 0.14 | % | — | 0.00 | % | — | 0.00 | % | — | 0.00 | % | |||||||||||||||
| Various interest rates futures contracts (Canada) |
(3,329 | ) | 0.00 | % | — | 0.00 | % | — | 0.00 | % | — | 0.00 | % | ||||||||||||||
| Various interest rates futures contracts (Europe) |
1,038,814 | 0.26 | % | — | 0.00 | % | — | 0.00 | % | — | 0.00 | % | |||||||||||||||
| Various interest rates futures contracts (Far East) |
59,775 | 0.01 | % | — | 0.00 | % | — | 0.00 | % | — | 0.00 | % | |||||||||||||||
| Various precious metals futures contracts (U.S.) |
3,503,876 | 0.87 | % | — | 0.00 | % | — | 0.00 | % | — | 0.00 | % | |||||||||||||||
| Various precious metals futures contracts (Europe) |
(4,850,464 | ) | -1.20 | % | — | 0.00 | % | — | 0.00 | % | — | 0.00 | % | ||||||||||||||
| Various soft futures contracts (U.S.) |
68,903 | 0.02 | % | — | 0.00 | % | — | 0.00 | % | — | 0.00 | % | |||||||||||||||
| Various soft futures contracts (Canada) |
— | 0.00 | % | — | 0.00 | % | — | 0.00 | % | — | 0.00 | % | |||||||||||||||
| Various soft futures contracts (Europe) |
(568,685 | ) | -0.14 | % | — | 0.00 | % | — | 0.00 | % | — | 0.00 | % | ||||||||||||||
| Various stock index futures contracts (U.S.) |
5,095 | 0.00 | % | — | 0.00 | % | — | 0.00 | % | — | 0.00 | % | |||||||||||||||
| Various stock index futures contracts (Canada) |
— | 0.00 | % | — | 0.00 | % | — | 0.00 | % | — | 0.00 | % | |||||||||||||||
| Various stock index futures contracts (Europe) |
(11,061 | ) | 0.00 | % | — | 0.00 | % | — | 0.00 | % | — | 0.00 | % | ||||||||||||||
| Various stock index futures contracts (Far East) |
(282,798 | ) | -0.07 | % | — | 0.00 | % | — | 0.00 | % | — | 0.00 | % | ||||||||||||||
| Total Short Futures Contracts |
$ | (8,995,542 | ) | -2.22 | % | $ | — | 0.00 | % | $ | — | 0.00 | % | $ | — | 0.00 | % | ||||||||||
| SHORT OPTIONS * |
$ | (394,585 | ) | -0.10 | % | $ | — | 0.00 | % | $ | 201 | 0.00 | % | $ | — | 0.00 | % | ||||||||||
| CURRENCY FORWARDS * |
$ | (2,554,250 | ) | -0.63 | % | $ | — | 0.00 | % | $ | 19,263 | 0.19 | % | $ | — | 0.00 | % | ||||||||||
| Total Open Trade Equity |
$ | 10,933,646 | 2.70 | % | $ | — | 0.00 | % | $ | 19,464 | 0.19 | % | $ | — | 0.00 | % | |||||||||||
| SWAPS (1) |
$ | 41,020,535 | 10.13 | % | $ | — | 0.00 | % | $ | 4,992,959 | 48.91 | % | $ | 584,391 | 12.52 | % | |||||||||||
| U.S. TREASURY SECURITIES |
|||||||||||||||||||||||||||
| FACE VALUE |
Fair Value | Fair Value | Fair Value | Fair Value | |||||||||||||||||||||||
| $36,500,000.00 |
US Treasury Note 3.875% due 02/15/2013 (Cost $38,125,391) (2) |
15,888,706 | 3.92 | % | 3,677,298 | 4.63 | % | 1,255,016 | 12.29 | % | 285,162 | 6.11 | % | ||||||||||||||
| $36,700,000.00 |
US Treasury Note 4.000% due 02/15/2015 (Cost $38,016,039) (2) |
15,945,292 | 3.94 | % | 3,690,395 | 4.65 | % | 1,259,485 | 12.34 | % | 286,177 | 6.13 | % | ||||||||||||||
| $ | 31,833,998 | 7.86 | % | $ | 7,367,693 | 9.28 | % | $ | 2,514,501 | 24.63 | % | $ | 571,339 | 12.24 | % | ||||||||||||
| Additional Disclosure on U.S. |
Face Value | Face Value | Face Value | Face Value | |||||||||||||||||||||||
| US Treasury Note 3.875% due 02/15/2013 |
14,921,160 | 3,453,369 | 1,178,591 | 267,797 | |||||||||||||||||||||||
| US Treasury Note 4.000% due 02/15/2015 |
15,002,920 | 3,472,291 | 1,185,049 | 269,264 | |||||||||||||||||||||||
| $ | 29,924,080 | $ | 6,925,660 | $ | 2,363,640 | $ | 537,061 | ||||||||||||||||||||
| Cost | Cost | Cost | Cost | ||||||||||||||||||||||||
| US Treasury Note 3.875% due 02/15/2013 |
15,585,618 | 3,607,152 | 1,231,075 | 279,722 | |||||||||||||||||||||||
| US Treasury Note 4.000% due 02/15/2015 |
15,540,915 | 3,596,805 | 1,227,544 | 278,920 | |||||||||||||||||||||||
| $ | 31,126,533 | $ | 7,203,957 | $ | 2,458,619 | $ | 558,642 | ||||||||||||||||||||
| * | Except for those items disclosed, no individual futures, forwards and option on futures contract position constituted greater than 1 percent of Net Asset Value. Accordingly, the number of contracts and expiration dates are not presented. |
| (1) | See Notes to Financial Statements, Note 4. |
| (2) | Assets have been allocated to Series based on net assets which include inter-Series investments. |
The accompanying notes are an integral part of these financial statements.
12
Table of Contents
The Frontier Fund
Condensed Schedule of Investments
December 31, 2009
| Managed Futures Index Series | Winton Series | Winton/Graham Series | |||||||||||||||||||
| Description |
Value | % of Capital (Net Asset Value |
Value | % of Capital (Net Asset Value) |
Value | % of Capital (Net Asset Value) |
|||||||||||||||
| LONG FUTURES CONTRACTS |
|||||||||||||||||||||
| Various base metals futures contracts (U.S.) |
$ | — | 0.00 | % | $ | — | 0.00 | % | $ | 1,403 | 0.00 | % | |||||||||
| Various base metals futures contracts (Europe) |
— | 0.00 | % | — | 0.00 | % | 1,132,371 | 1.66 | % | ||||||||||||
| Various currency futures contracts (U.S.) |
— | 0.00 | % | — | 0.00 | % | (60 | ) | 0.00 | % | |||||||||||
| Various currency futures contracts (Canada) |
— | 0.00 | % | — | 0.00 | % | — | 0.00 | % | ||||||||||||
| Various currency futures contracts (Europe) |
— | 0.00 | % | — | 0.00 | % | (49,882 | ) | -0.07 | % | |||||||||||
| Various currency futures contracts (Far East) |
— | 0.00 | % | — | 0.00 | % | — | 0.00 | % | ||||||||||||
| Various energy futures contracts (U.S.) |
— | 0.00 | % | — | 0.00 | % | 78,236 | 0.11 | % | ||||||||||||
| Various energy futures contracts (Europe) |
— | 0.00 | % | — | 0.00 | % | 46,060 | 0.07 | % | ||||||||||||
| Various interest rates futures contracts (U.S.) |
— | 0.00 | % | — | 0.00 | % | (738 | ) | 0.00 | % | |||||||||||
| Various interest rates futures contracts (Canada) |
— | 0.00 | % | — | 0.00 | % | (22,874 | ) | -0.03 | % | |||||||||||
| Various interest rates futures contracts (Europe) |
— | 0.00 | % | — | 0.00 | % | (404,032 | ) | -0.59 | % | |||||||||||
| Various interest rates futures contracts (Far East) |
— | 0.00 | % | — | 0.00 | % | 9,295 | 0.01 | % | ||||||||||||
| Various precious metals futures contracts (U.S.) |
— | 0.00 | % | — | 0.00 | % | (62,250 | ) | -0.09 | % | |||||||||||
| Various soft futures contracts (U.S.) |
— | 0.00 | % | — | 0.00 | % | 213,979 | 0.31 | % | ||||||||||||
| Various soft futures contracts (Far East) |
— | 0.00 | % | — | 0.00 | % | 39,774 | 0.06 | % | ||||||||||||
| Various soft futures contracts (Europe) |
— | 0.00 | % | — | 0.00 | % | — | 0.00 | % | ||||||||||||
| Various soft futures contracts (Canada) |
— | 0.00 | % | — | 0.00 | % | — | 0.00 | % | ||||||||||||
| Various stock index futures contracts (U.S.) |
— | 0.00 | % | — | 0.00 | % | (52,431 | ) | -0.08 | % | |||||||||||
| Various stock index futures contracts (Canada) |
— | 0.00 | % | — | 0.00 | % | 17,967 | 0.03 | % | ||||||||||||
| Various stock index futures contracts (Europe) |
— | 0.00 | % | — | 0.00 | % | 17,477 | 0.03 | % | ||||||||||||
| Various stock index futures contracts (Far East) |
— | 0.00 | % | — | 0.00 | % | 94,269 | 0.14 | % | ||||||||||||
| Total Long Futures Contracts |
$ | — | 0.00 | % | $ | — | 0.00 | % | $ | 1,058,564 | 1.56 | % | |||||||||
| LONG OPTIONS * |
$ | — | 0.00 | % | $ | — | 0.00 | % | $ | — | 0.00 | % | |||||||||
| SHORT FUTURES CONTRACTS |
|||||||||||||||||||||
| Various base metals futures contracts (U.S.) |
$ | — | 0.00 | % | $ | — | 0.00 | % | $ | 7,800 | 0.01 | % | |||||||||
| Various base metals futures contracts (Europe) |
— | 0.00 | % | — | 0.00 | % | (508,727 | ) | -0.75 | % | |||||||||||
| Various currency futures contracts (U.S.) |
— | 0.00 | % | — | 0.00 | % | 4,708 | 0.01 | % | ||||||||||||
| Various currency futures contracts (Canada) |
— | 0.00 | % | — | 0.00 | % | — | 0.00 | % | ||||||||||||
| Various currency futures contracts (Europe) |
— | 0.00 | % | — | 0.00 | % | (1,907 | ) | 0.00 | % | |||||||||||
| Various currency futures contracts (Far East) |
— | 0.00 | % | — | 0.00 | % | (3,276 | ) | 0.00 | % | |||||||||||
| Various energy futures contracts (U.S.) |
— | 0.00 | % | — | 0.00 | % | 18,764 | 0.03 | % | ||||||||||||
| Various interest rates futures contracts (US) |
— | 0.00 | % | — | 0.00 | % | — | 0.00 | % | ||||||||||||
| Various interest rates futures contracts (Canada) |
— | 0.00 | % | — | 0.00 | % | — | 0.00 | % | ||||||||||||
| Various interest rates futures contracts (Europe) |
— | 0.00 | % | — | 0.00 | % | — | 0.00 | % | ||||||||||||
| Various interest rates futures contracts (Far East) |
— | 0.00 | % | — | 0.00 | % | 35,289 | 0.05 | % | ||||||||||||
| Various precious metals futures contracts (U.S.) |
— | 0.00 | % | — | 0.00 | % | — | 0.00 | % | ||||||||||||
| Various soft futures contracts (U.S.) |
— | 0.00 | % | — | 0.00 | % | 16,048 | 0.02 | % | ||||||||||||
| Various soft futures contracts (Europe) |
— | 0.00 | % | — | 0.00 | % | — | 0.00 | % | ||||||||||||
| Various stock index futures contracts (U.S.) |
— | 0.00 | % | — | 0.00 | % | (2,250 | ) | 0.00 | % | |||||||||||
| Various stock index futures contracts (Europe) |
— | 0.00 | % | — | 0.00 | % | — | 0.00 | % | ||||||||||||
| Various stock index futures contracts (Far East) |
— | 0.00 | % | — | 0.00 | % | — | 0.00 | % | ||||||||||||
| Total Short Futures Contracts |
$ | — | 0.00 | % | $ | — | 0.00 | % | $ | (433,551 | ) | -0.64 | % | ||||||||
| SHORT OPTIONS * |
$ | — | 0.00 | % | $ | — | 0.00 | % | $ | — | 0.00 | % | |||||||||
| CURRENCY FORWARDS * |
$ | — | 0.00 | % | $ | — | 0.00 | % | $ | 185,176 | 0.27 | % | |||||||||
| Total Open Trade Equity |
$ | — | 0.00 | % | $ | — | 0.00 | % | $ | 810,189 | 1.19 | % | |||||||||
| SWAPS (1) |
$ | — | 0.00 | % | $ | — | 0.00 | % | $ | — | 0.00 | % | |||||||||
| FACE VALUE |
Fair Value | Fair Value | Fair Value | ||||||||||||||||||
| $36,500,000.00 | US Treasury Note 3.875% due 02/15/2013 (Cost $38,125,391) (2) |
208,554 | 5.53 | % | 3,556,260 | 6.09 | % | 3,792,359 | 5.57 | % | |||||||||||
| $36,700,000.00 | US Treasury Note 4.000% due 02/15/2015 (Cost $38,016,039 (2) |
209,297 | 5.55 | % | 3,568,925 | 6.11 | % | 3,805,865 | 5.59 | % | |||||||||||
| $ | 417,851 | 11.08 | % | $ | 7,125,185 | 12.20 | % | $ | 7,598,224 | 11.16 | % | ||||||||||
| Additional Disclosure on U.S. Treasury Securities |
Face Value | Face Value | Face Value | ||||||||||||||||||
| US Treasury Note 3.875% due 02/15/2013 |
195,854 | 3,339,701 | 3,561,423 | ||||||||||||||||||
| US Treasury Note 4.000% due 02/15/2015 |
196,927 | 3,358,001 | 3,580,937 | ||||||||||||||||||
| $ | 392,781 | $ | 6,697,702 | $ | 7,142,360 | ||||||||||||||||
| Cost | Cost | Cost | |||||||||||||||||||
| US Treasury Note 3.875% due 02/15/2013 |
204,576 | 3,488,422 | 3,720,017 | ||||||||||||||||||
| US Treasury Note 4.000% due 02/15/2015 |
203,989 | 3,478,416 | 3,709,347 | ||||||||||||||||||
| $ | 408,565 | $ | 6,966,838 | $ | 7,429,364 | ||||||||||||||||
| * | Except for those items disclosed, no individual futures, forwards and option on futures contract position constituted greater than 1 percent of Net Asset Value. Accordingly, the number of contracts and expiration dates are not presented. |
| (1) | See Notes to Financial Statements, Note 4. |
| (2) | Assets have been allocated to Series based on net assets which include inter-Series investments. |
The accompanying notes are an integral part of these financial statements.
13
Table of Contents
Statements of Operations
For the Three Months Ended March 31, 2010 and 2009
| Frontier Diversified Series (1) |
Frontier Dynamic Series (1) |
Frontier Long/Short Commodity Series (2) |
||||||||||||||||||||
| (Unaudited) | (Unaudited) | (Unaudited) | ||||||||||||||||||||
| 3/31/2010 | 3/31/2009 | 3/31/2010 | 3/31/2009 | 3/31/2010 | 3/31/2009 | |||||||||||||||||
| Investment Income: |
||||||||||||||||||||||
| Interest - net |
$ | 411,248 | $ | — | $ | 113,354 | $ | — | $ | 209,285 | $ | 367,274 | ||||||||||
| Total Income |
411,248 | — | 113,354 | — | 209,285 | 367,274 | ||||||||||||||||
| Expenses: |
||||||||||||||||||||||
| Incentive Fees |
186,224 | — | — | — | 78,102 | 675,735 | ||||||||||||||||
| Management Fees |
162,653 | — | — | — | 788,322 | 612,333 | ||||||||||||||||
| Service Fees - Class 1 |
238,169 | — | 20,650 | — | 322,150 | 350,260 | ||||||||||||||||
| Trading Fees |
440,692 | — | 166,373 | — | 92,890 | 88,283 | ||||||||||||||||
| Total Expenses |
1,027,738 | — | 187,023 | — | 1,281,464 | 1,726,611 | ||||||||||||||||
| Investment gain/(loss) - net |
(616,490 | ) | — | (73,669 | ) | — | (1,072,179 | ) | (1,359,337 | ) | ||||||||||||
| Realized and unrealized gain/(loss) on investments: |
||||||||||||||||||||||
| Net realized gain/(loss) on futures and forwards |
228,379 | — | — | — | (24,029,653 | ) | (4,491,202 | ) | ||||||||||||||
| Net change in open trade equity |
(296,899 | ) | — | — | — | 18,487,270 | 15,790,632 | |||||||||||||||
| Net unrealized gain/(loss) on swap contracts |
(252,378 | ) | — | (80,656 | ) | — | — | — | ||||||||||||||
| Net unrealized gain/(loss) on U.S. Treasury Securities |
40,511 | — | 17,531 | — | 55,320 | (111,792 | ) | |||||||||||||||
| Trading commissions |
(7,379 | ) | — | — | — | (444,193 | ) | (388,487 | ) | |||||||||||||
| Net change in inter-series payables |
102,443 | — | 129,208 | — | — | — | ||||||||||||||||
| Equity in earnings/(loss) from unconsolidated trading companies |
536,753 | — | — | — | 2,685,078 | — | ||||||||||||||||
| Net gain/(loss) on investments |
351,430 | — | 66,083 | — | (3,246,178 | ) | 10,799,151 | |||||||||||||||
| NET INCREASE/(DECREASE) IN CAPITAL RESULTING FROM OPERATIONS |
$ | (265,060 | ) | $ | — | $ | (7,586 | ) | $ | — | $ | (4,318,357 | ) | $ | 9,439,814 | |||||||
| Less: Operations attributable to Non-controlling interests |
3,341 | — | — | — | (2,913,121 | ) | 7,195,521 | |||||||||||||||
| NET INCREASE/(DECREASE) IN CAPITAL RESULTING FROM OPERATIONS ATTRIBUTABLE TO CONTROLLING INTERESTS |
$ | (268,401 | ) | $ | — | $ | (7,586 | ) | $ | — | $ | (1,405,236 | ) | $ | 2,244,293 | |||||||
| NET INCOME/(LOSS) PER UNIT |
||||||||||||||||||||||
| Class 1 |
$ | (1.31 | ) | N/A | $ | (0.82 | ) | N/A | $ | (2.61 | ) | $ | 3.75 | |||||||||
| Class 1a |
N/A | N/A | N/A | N/A | $ | (2.18 | ) | N/A | ||||||||||||||
| Class 2 |
$ | (0.91 | ) | N/A | $ | (0.43 | ) | N/A | $ | (2.00 | ) | $ | 4.92 | |||||||||
| Class 2a |
N/A | N/A | N/A | N/A | $ | (1.80 | ) | N/A | ||||||||||||||
| Class 3 |
N/A | N/A | N/A | N/A | $ | (2.01 | ) | N/A | ||||||||||||||
| (1) | The Frontier Diversified Series and Frontier Dynamic Series began trading operations on June 9, 2009 |
| (2) | Frontier Long/Short Commodity Series Class 3 Units began trading on May 29, 2009 and Class 1a and 2a Units began trading on June 8, 2009 |
The accompanying notes are an integral part of these financial statements.
14
Table of Contents
The Frontier Fund
Statements of Operations
For the Three Months Ended March 31, 2010 and 2009
| Frontier Masters Series (1) | Balanced Series (2) | Campbell/Graham/Tiverton Series | |||||||||||||||||||||
| (Unaudited) | (Unaudited) | (Unaudited) | |||||||||||||||||||||
| 3/31/2010 | 3/31/2009 | 3/31/2010 | 3/31/2009 | 3/31/2010 | 3/31/2009 | ||||||||||||||||||
| Investment Income: |
|||||||||||||||||||||||
| Interest - net |
$ | 210,672 | $ | — | $ | 205,160 | $ | 99,001 | $ | (1,116 | ) | $ | 144,150 | ||||||||||
| Total Income |
210,672 | — | 205,160 | 99,001 | (1,116 | ) | 144,150 | ||||||||||||||||
| Expenses: |
|||||||||||||||||||||||
| Incentive Fees |
— | — | 953,481 | 2,116,645 | — | (2,140 | ) | ||||||||||||||||
| Management Fees |
202,282 | — | 357,992 | 396,634 | 581,891 | 565,467 | |||||||||||||||||
| Service Fees - Class 1 |
109,428 | — | 2,103,922 | 2,071,543 | 491,969 | 525,404 | |||||||||||||||||
| Trading Fees |
299,172 | — | 420,281 | 542,600 | 92,520 | 113,272 | |||||||||||||||||
| Total Expenses |
610,882 | — | 3,835,676 | 5,127,422 | 1,166,380 | 1,202,003 | |||||||||||||||||
| Investment gain/(loss) - net |
(400,210 | ) | — | (3,630,516 | ) | (5,028,421 | ) | (1,167,496 | ) | (1,057,853 | ) | ||||||||||||
| Realized and unrealized gain/(loss) on investments: |
|||||||||||||||||||||||
| Net realized gain/(loss) on futures and forwards |
— | — | (2,506,318 | ) | 12,416,600 | 161,369 | (647,824 | ) | |||||||||||||||
| Net change in open trade equity |
— | — | (3,314,706 | ) | (12,470,529 | ) | 483,809 | (186,103 | ) | ||||||||||||||
| Net unrealized gain/(loss) on swap contracts |
439,498 | — | 1,238,580 | (682,685 | ) | — | — | ||||||||||||||||
| Net unrealized gain/(loss) on U.S. Treasury Securities |
13,931 | — | 203,977 | (615,021 | ) | 53,177 | (156,440 | ) | |||||||||||||||
| Trading commissions |
— | — | (690,898 | ) | (256,770 | ) | (6,528 | ) | (73,854 | ) | |||||||||||||
| Net change in inter-series receivables |
— | — | 222,412 | (745,512 | ) | — | — | ||||||||||||||||
| Net change in inter-series payables |
(125,024 | ) | — | — | — | — | — | ||||||||||||||||
| Equity in earnings/(loss) from unconsolidated trading companies |
519,264 | — | 4,581,509 | 6,910,179 | (1,869,295 | ) | (517,237 | ) | |||||||||||||||
| Net gain/(loss) on investments |
847,669 | — | (265,444 | ) | 4,556,262 | (1,177,468 | ) | (1,581,458 | ) | ||||||||||||||
| NET INCREASE/(DECREASE) IN CAPITAL RESULTING FROM OPERATIONS |
$ | 447,459 | $ | — | $ | (3,895,960 | ) | $ | (472,159 | ) | $ | (2,344,964 | ) | $ | (2,639,311 | ) | |||||||
| Less: Operations attributable to Non-controlling interests |
— | — | (1,886,626 | ) | (719,247 | ) | 177,897 | (555,054 | ) | ||||||||||||||
| NET INCREASE/(DECREASE) IN CAPITAL RESULTING FROM OPERATIONS ATTRIBUTABLE TO CONTROLLING INTERESTS |
$ | 447,459 | $ | — | $ | (2,009,334 | ) | $ | 247,088 | $ | (2,522,861 | ) | $ | (2,084,257 | ) | ||||||||
| NET INCOME/(LOSS) PER UNIT |
|||||||||||||||||||||||
| Class 1 |
$ | 0.24 | N/A | $ | (0.73 | ) | $ | 0.04 | $ | (3.40 | ) | $ | (2.91 | ) | |||||||||
| Class 1a |
N/A | N/A | $ | (0.84 | ) | $ | (0.23 | ) | N/A | N/A | |||||||||||||
| Class 2 |
$ | 0.66 | N/A | $ | 0.17 | $ | 1.10 | $ | (3.07 | ) | $ | (2.37 | ) | ||||||||||
| Class 2a |
N/A | N/A | $ | (0.07 | ) | $ | 0.65 | N/A | N/A | ||||||||||||||
| Class 3a |
N/A | N/A | $ | (0.06 | ) | N/A | N/A | N/A | |||||||||||||||
| (1) | The Frontier Masters Series began trading operations on June 9, 2009 |
| (2) | The Balanced Series Class 3 Units began trading on June 3, 2009 |
The accompanying notes are an integral part of these financial statements.
15
Table of Contents
The Frontier Fund
Statements of Operations
For the Three Months Ended March 31, 2010 and 2009
| Currency Series | Long Only Commodity Series |
Managed Futures Index Series |
||||||||||||||||||||||
| (Unaudited) | (Unaudited) | (Unaudited) | ||||||||||||||||||||||
| 3/31/2010 | 3/31/2009 | 3/31/2010 | 3/31/2009 | 3/31/2010 | 3/31/2009 | |||||||||||||||||||
| Investment Income: |
||||||||||||||||||||||||
| Interest - net |
$ | 37,458 | $ | 18,768 | $ | 23,024 | $ | 18,837 | $ | 10,876 | $ | 14,579 | ||||||||||||
| Total Income |
37,458 | 18,768 | 23,024 | 18,837 | 10,876 | 14,579 | ||||||||||||||||||
| Expenses: |
||||||||||||||||||||||||
| Management Fees |
40,076 | 42,024 | 14,222 | 11,995 | 26,254 | 16,985 | ||||||||||||||||||
| Service Fees - Class 1 |
58,039 | 84,714 | 17,184 | 15,386 | 8,781 | 10,412 | ||||||||||||||||||
| Trading Fees |
25,893 | 44,207 | 5,331 | 4,851 | 6,034 | 4,246 | ||||||||||||||||||
| Total Expenses |
124,008 | 170,945 | 36,737 | 32,232 | 41,069 | 31,643 | ||||||||||||||||||
| Investment gain/(loss) - net |
(86,550 | ) | (152,177 | ) | (13,713 | ) | (13,395 | ) | (30,193 | ) | (17,064 | ) | ||||||||||||
| Realized and unrealized gain/(loss) on investments: |
||||||||||||||||||||||||
| Net realized gain/(loss) on futures and forwards |
53,107 | 35,441 | — | — | — | — | ||||||||||||||||||
| Net realized gain/(loss) on swap contracts |
— | — | (173,729 | ) | (226,246 | ) | — | — | ||||||||||||||||
| Net change in open trade equity |
45,474 | (150,507 | ) | — | — | — | — | |||||||||||||||||
| Net unrealized gain/(loss) on swap contracts |
470,359 | (1,247,364 | ) | — | — | — | — | |||||||||||||||||
| Net unrealized gain/(loss) on U.S. Treasury Securities |
17,325 | (57,479 | ) | 3,896 | (6,742 | ) | 2,804 | (6,689 | ) | |||||||||||||||
| Net change in inter-series payables |
(329,038 | ) | 745,512 | — | — | |||||||||||||||||||
| Equity in earnings/(loss) from unconsolidated trading companies |
— | — | (42,112 | ) | (202,010 | ) | ||||||||||||||||||
| Net gain/(loss) on investments |
257,227 | (674,397 | ) | (169,833 | ) | (232,988 | ) | (39,308 | ) | (208,699 | ) | |||||||||||||
| NET INCREASE/(DECREASE) IN CAPITAL RESULTING FROM OPERATIONS |
$ | 170,677 | $ | (826,574 | ) | $ | (183,546 | ) | $ | (246,383 | ) | $ | (69,501 | ) | $ | (225,763 | ) | |||||||
| NET INCOME/(LOSS) PER UNIT |
||||||||||||||||||||||||
| Class 1 |
$ | 1.50 | $ | (5.56 | ) | $ | (3.39 | ) | $ | (4.27 | ) | $ | (1.00 | ) | $ | (8.50 | ) | |||||||
| Class 2 |
$ | 2.45 | $ | (5.55 | ) | $ | (3.24 | ) | $ | (4.18 | ) | $ | (0.48 | ) | $ | (8.37 | ) | |||||||
The accompanying notes are an integral part of these financial statements.
16
Table of Contents
The Frontier Fund
Statements of Operations
For the Three Months Ended March 31, 2010 and 2009
| Winton Series | Winton/Graham Series | |||||||||||||||
| (Unaudited) | (Unaudited) | |||||||||||||||
| 3/31/2010 | 3/31/2009 | 3/31/2010 | 3/31/2009 | |||||||||||||
| Investment Income: |
||||||||||||||||
| Interest - net |
$ | 28,507 | $ | 204,074 | $ | 82,233 | $ | 99,515 | ||||||||
| Total Income |
28,507 | 204,074 | 82,233 | 99,515 | ||||||||||||
| Expenses: |
||||||||||||||||
| Incentive Fees |
— | (21,347 | ) | — | (5,804 | ) | ||||||||||
| Management Fees |
376,880 | 390,305 | 466,582 | 277,272 | ||||||||||||
| Service Fees - Class 1 |
352,366 | 450,660 | 338,601 | 298,184 | ||||||||||||
| Trading Fees |
70,214 | 97,591 | 70,617 | 55,514 | ||||||||||||
| Total Expenses |
799,460 | 917,209 | 875,800 | 625,166 | ||||||||||||
| Investment gain/(loss) - net |
(770,953 | ) | (713,135 | ) | (793,567 | ) | (525,651 | ) | ||||||||
| Realized and unrealized gain/(loss) on investments: |
||||||||||||||||
| Net realized gain/(loss) on futures and forwards |
— | 1,156,575 | (3,421,744 | ) | — | |||||||||||
| Net change in open trade equity |
— | (2,377,832 | ) | 1,210,211 | — | |||||||||||
| Net unrealized gain/(loss) on U.S. Treasury Securities |
51,806 | (150,984 | ) | 50,683 | (100,294 | ) | ||||||||||
| Trading commissions |
— | (21,271 | ) | (130,261 | ) | — | ||||||||||
| Equity in earnings/(loss) from unconsolidated trading companies |
3,579,444 | — | 1,833,589 | (824,616 | ) | |||||||||||
| Net gain/(loss) on investments |
3,631,250 | (1,393,512 | ) | (457,522 | ) | (924,910 | ) | |||||||||
| NET INCREASE/(DECREASE) IN CAPITAL RESULTING FROM OPERATIONS |
$ | 2,860,297 | $ | (2,106,647 | ) | $ | (1,251,089 | ) | $ | (1,450,561 | ) | |||||
| Less: Operations attributable to Non-controlling interests |
— | (554,904 | ) | (973,416 | ) | — | ||||||||||
| NET INCREASE/(DECREASE) IN CAPITAL RESULTING FROM OPERATIONS ATTRIBUTABLE TO CONTROLLING INTERESTS |
$ | 2,860,297 | $ | (1,551,743 | ) | $ | (277,673 | ) | $ | (1,450,561 | ) | |||||
| NET INCOME/(LOSS) PER UNIT |
||||||||||||||||
| Class 1 |
$ | 5.78 | $ | (2.98 | ) | $ | (0.59 | ) | $ | (6.12 | ) | |||||
| Class 2 |
$ | 7.41 | $ | (2.18 | ) | $ | 0.26 | $ | (3.10 | ) | ||||||
The accompanying notes are an integral part of these financial statements.
17
Table of Contents
Statements of Changes in Owners’ Capital
For the Three Months Ended March 31, 2010
| Frontier Diversified Series (1) | Frontier Dynamic Series (1) | ||||||||||||||||||||||||||||||||||||||||||
| (Unaudited) | (Unaudited) | ||||||||||||||||||||||||||||||||||||||||||
| Class 1 | Class 1 | Class 2 | Class 2 | Non-Controlling Interests |
Total | Class 1 | Class 1 | Class 2 | Class 2 | Total | |||||||||||||||||||||||||||||||||
| Managing Owner |
Limited Owners |
Managing Owner |
Limited Owners |
Managing Owner |
Limited Owners |
Managing Owner |
Limited Owners |
||||||||||||||||||||||||||||||||||||
| Capital (Net Asset Value), December 31, 2009 |
$ | 26,621 | $ | 32,933,919 | $ | 543,790 | $ | 22,811,789 | $ | — | $ | 56,316,119 | $ | 25,142 | $ | 581,113 | $ | 25,370 | $ | 265,292 | $ | 896,917 | |||||||||||||||||||||
| Sale of Units |
— | 21,396,967 | 345,000 | 12,827,650 | — | 34,569,617 | — | 180,700 | — | 81,667 | 262,367 | ||||||||||||||||||||||||||||||||
| Redemption of Units |
— | (308,919 | ) | — | (150,640 | ) | — | (459,559 | ) | — | (56,228 | ) | — | — | (56,228 | ) | |||||||||||||||||||||||||||
| Change in control of ownership - Trading Companies |
— | — | — | — | 49,234 | 49,234 | — | — | — | — | — | ||||||||||||||||||||||||||||||||
| Contributions |
— | — | — | — | — | — | — | — | — | — | — | ||||||||||||||||||||||||||||||||
| Distributions |
— | — | — | — | — | — | — | — | — | — | — | ||||||||||||||||||||||||||||||||
| Operations attributable to Non-controlling interests |
— | — | — | — | 3,341 | 3,341 | — | — | — | — | — | ||||||||||||||||||||||||||||||||
| Net increase/(decrease) in Owners’ Capital resulting from operations |
(361 | ) | (112,196 | ) | (393 | ) | (155,451 | ) | — | (268,401 | ) | (224 | ) | (6,517 | ) | (119 | ) | (726 | ) | (7,586 | ) | ||||||||||||||||||||||
| Capital (Net Asset Value), March 31, 2010 |
$ | 26,260 | $ | 53,909,771 | $ | 888,397 | $ | 35,333,348 | $ | 52,575 | $ | 90,210,351 | $ | 24,918 | $ | 699,068 | $ | 25,251 | $ | 346,233 | $ | 1,095,470 | |||||||||||||||||||||
| Capital - Units, December 31, 2009 |
275 | 340,214 | 5,562 | 233,312 | — | 579,363 | 275 | 6,356 | 275 | 2,876 | 9,782 | ||||||||||||||||||||||||||||||||
| Sale of Units |
— | 227,630 | 3,610 | 133,057 | — | 364,297 | — | 1,981 | — | 895 | 2,876 | ||||||||||||||||||||||||||||||||
| Redemption of Units |
— | (3,281 | ) | — | (1,581 | ) | — | (4,862 | ) | — | (622 | ) | — | — | (622 | ) | |||||||||||||||||||||||||||
| Capital - Units, March 31, 2010 |
275 | 564,563 | 9,172 | 364,788 | — | 938,798 | 275 | 7,715 | 275 | 3,771 | 12,036 | ||||||||||||||||||||||||||||||||
| (2 | ) | (2 | ) | (2 | ) | (2 | ) | ||||||||||||||||||||||||||||||||||||
| Net asset value per unit at December 31, 2009 or start of operations |
$ | 96.80 | $ | 97.77 | $ | 91.43 | $ | 92.25 | |||||||||||||||||||||||||||||||||||
| Change in net asset value per unit for three months ended March 31, 2010 |
(1.31 | ) | (0.91 | ) | (0.82 | ) | (0.43 | ) | |||||||||||||||||||||||||||||||||||
| Net asset value per unit at March 31, 2010 |
$ | 95.49 | $ | 96.86 | $ | 90.61 | $ | 91.82 | |||||||||||||||||||||||||||||||||||
| (1) | The Frontier Diversified Series and Dynamic Series began trading operations on June 9, 2009 |
| (2) | Values are for both Managing Owners and Limited Owners |
The accompanying notes are an integral part of these financial statements.
18
Table of Contents
The Frontier Fund
Statements of Changes in Owners’ Capital
For the Three Months Ended March 31, 2010
| Frontier Long/Short Commodity Series | ||||||||||||||||||||||||||||||||||||||||
| (Unaudited) | ||||||||||||||||||||||||||||||||||||||||
| Class 1 | Class 2 | Class 3 (1) | Class 1a (2) | Class 1a (2) | Class 2a (2) | Class 2a (2) | Non-Controlling Interests |
Total | ||||||||||||||||||||||||||||||||
| Limited Owners |
Managing Owner |
Limited Owners |
Limited Owners |
Managing Owner |
Limited Owners |
Managing Owner |
Limited Owners |
|||||||||||||||||||||||||||||||||
| Capital (Net Asset Value), December 31, 2009 |
$ | 45,759,225 | $ | 1,089,327 | $ | 13,896,776 | $ | 6,140,056 | $ | 27,911 | $ | 1,064,105 | $ | 28,183 | $ | 848,349 | $ | (286,801 | ) | $ | 68,567,131 | |||||||||||||||||||
| Sale of Units |
33,460 | — | — | 4,961,732 | — | 697,792 | — | 488,729 | — | 6,181,713 | ||||||||||||||||||||||||||||||
| Redemption of Units |
(5,735,673 | ) | — | (390,579 | ) | (239,501 | ) | — | (7,501 | ) | — | — | — | (6,373,254 | ) | |||||||||||||||||||||||||
| Change in control of ownership - Trading Companies |
— | — | — | — | — | — | — | 3,199,922 | 3,199,922 | |||||||||||||||||||||||||||||||
| Contributions |
— | — | — | — | — | — | — | — | — | — | ||||||||||||||||||||||||||||||
| Distributions |
— | — | — | — | — | — | — | — | — | — | ||||||||||||||||||||||||||||||
| Operations attributable to Non-controlling interests |
— | — | — | — | — | — | — | — | (2,913,121 | ) | (2,913,121 | ) | ||||||||||||||||||||||||||||
| Net increase/(decrease) in Owners’ Capital resulting from operations attributable to controlling interests |
(1,146,346 | ) | (17,153 | ) | (223,967 | ) | 721 | (600 | ) | (14,198 | ) | (495 | ) | (3,198 | ) | — | (1,405,236 | ) | ||||||||||||||||||||||
| Capital (Net Asset Value), March 31, 2010 |
$ | 38,910,666 | $ | 1,072,174 | $ | 13,282,230 | $ | 10,863,008 | $ | 27,311 | $ | 1,740,198 | $ | 27,688 | $ | 1,333,880 | $ | — | $ | 67,257,155 | ||||||||||||||||||||
| Capital - Units, December 31, 2009 |
402,206 | 8,544 | 109,000 | 48,162 | 275 | 10,484 | 275 | 8,278 | — | 587,224 | ||||||||||||||||||||||||||||||
| Sale of Units |
301 | — | — | 40,340 | — | 7,114 | — | 4,970 | — | 52,725 | ||||||||||||||||||||||||||||||
| Redemption of Units |
(52,465 | ) | — | (3,153 | ) | (1,932 | ) | — | (76 | ) | — | — | — | (57,626 | ) | |||||||||||||||||||||||||
| Capital - Units, March 31, 2010 |
350,042 | 8,544 | 105,847 | 86,570 | 275 | 17,522 | 275 | 13,248 | — | 582,323 | ||||||||||||||||||||||||||||||
| (3 | ) | (3 | ) | (3 | ) | |||||||||||||||||||||||||||||||||||
| Net asset value per unit at December 31, 2009 or start of operations |
$ | 113.77 | $ | 127.49 | $ | 127.49 | $ | 101.49 | $ | 102.48 | ||||||||||||||||||||||||||||||
| Change in net asset value per unit for three months ended March 31, 2010 |
(2.61 | ) | (2.00 | ) | (2.01 | ) | (2.18 | ) | (1.80 | ) | ||||||||||||||||||||||||||||||
| Net asset value per unit at March 31, 2010 |
$ | 111.16 | $ | 125.49 | $ | 125.48 | $ | 99.31 | $ | 100.68 | ||||||||||||||||||||||||||||||
| (1) | Long/Short Series Class 3 began trading operations on May 30, 2009 |
| (2) | Long/Short Series Class 1a and 2a began trading operations on June 9, 2009 |
| (3) | Values are for both Managing Owner and Limited Owners |
The accompanying notes are an integral part of these financial statements.
19
Table of Contents
The Frontier Fund
Statements of Changes in Owners’ Capital
For the Three Months Ended March 31, 2010
| Frontier Masters Series (1) | ||||||||||||||||||
| (Unaudited) | ||||||||||||||||||
| Class 1 | Class 1 | Class 2 | Class 2 | Total | ||||||||||||||
| Managing Owner |
Limited Owners |
Managing Owner |
Limited Owners |
|||||||||||||||
| Capital (Net Asset Value), December 31, 2009 |
$ | 25,977 | $ | 14,697,353 | $ | 210,351 | $ | 8,353,506 | $ | 23,287,187 | ||||||||
| Sale of Units |
— | 7,376,112 | 185,000 | 11,067,613 | 18,628,725 | |||||||||||||
| Redemption of Units |
— | (21,328 | ) | — | (187,148 | ) | (208,476 | ) | ||||||||||
| Change in control of ownership - Trading Companies |
— | — | — | — | — | |||||||||||||
| Contributions |
— | — | — | — | — | |||||||||||||
| Distributions |
— | — | — | — | — | |||||||||||||
| Operations attributable to Non-controlling interests |
— | — | — | — | — | |||||||||||||
| Net increase/(decrease) in Owners’ Capital resulting from operations attributable to controlling interests |
67 | 159,299 | 4,607 | 283,486 | 447,459 | |||||||||||||
| Capital (Net Asset Value), March 31, 2010 |
$ | 26,044 | $ | 22,211,436 | $ | 399,958 | $ | 19,517,457 | $ | 42,154,895 | ||||||||
| Capital - Units, December 31, 2009 |
275 | 155,589 | 2,206 | 87,587 | 245,657 | |||||||||||||
| Sale of Units |
— | 79,172 | 1,959 | 117,614 | 198,745 | |||||||||||||
| Redemption of Units |
— | (228 | ) | — | (1,956 | ) | (2,184 | ) | ||||||||||
| Capital - Units, March 31, 2010 |
275 | 234,533 | 4,165 | 203,245 | 442,218 | |||||||||||||
| (3 | ) | (3 | ) | |||||||||||||||
| Net asset value per unit at December 31, 2009 or beginning of operations |
$ | 94.46 | $ | 95.37 | ||||||||||||||
| Change in net asset value per unit for three months ended March 31, 2010 |
0.24 | 0.66 | ||||||||||||||||
| Net asset value per unit at March 31, 2010 |
$ | 94.70 | $ | 96.03 | ||||||||||||||
| Balanced Series | ||||||||||||||||||||||||||||||||||||
| (Unaudited) | ||||||||||||||||||||||||||||||||||||
| Class 1 | Class 1a | Class 2 | Class 2a | Class 3a (2) | Non-Controlling Interests |
Total | ||||||||||||||||||||||||||||||
| Limited Owners |
Limited Owners |
Managing Owner |
Limited Owners |
Managing Owner |
Limited Owners |
Limited Owners |
||||||||||||||||||||||||||||||
| Capital (Net Asset Value), December 31, 2009 |
$ | 286,024,307 | $ | 9,150,114 | $ | 3,697,180 | $ | 73,674,986 | $ | 145,517 | $ | 3,153,049 | $ | 1,170,746 | $ | 27,918,797 | $ | 404,934,696 | ||||||||||||||||||
| Sale of Units |
176,783 | 15,991 | — | 7,265 | — | — | 1,712,203 | — | 1,912,242 | |||||||||||||||||||||||||||
| Redemption of Units |
(6,482,776 | ) | (2,214,384 | ) | (1,250,000 | ) | (1,678,030 | ) | — | (76,758 | ) | (87,309 | ) | — | (11,789,257 | ) | ||||||||||||||||||||
| Change in control of ownership - Trading Companies |
— | — | — | — | — | — | — | (12,065,559 | ) | (12,065,559 | ) | |||||||||||||||||||||||||
| Contributions |
— | — | — | — | — | — | — | — | — | |||||||||||||||||||||||||||
| Distributions |
— | — | — | — | — | — | — | — | — | |||||||||||||||||||||||||||
| Operations attributable to Non-controlling interests |
— | — | — | — | — | — | — | (1,886,626 | ) | (1,886,626 | ) | |||||||||||||||||||||||||
| Net increase/(decrease) in Owners’ Capital resulting from operations attributable to controlling interests |
(1,910,985 | ) | (104,023 | ) | (50,049 | ) | 40,821 | (86 | ) | (5,686 | ) | 20,674 | — | (2,009,334 | ) | |||||||||||||||||||||
| Capital (Net Asset Value), March 31, 2010 |
$ | 277,807,329 | $ | 6,847,698 | $ | 2,397,131 | $ | 72,045,042 | $ | 145,431 | $ | 3,070,605 | $ | 2,816,314 | $ | 13,966,612 | $ | 379,096,162 | ||||||||||||||||||
| Capital - Units, December 31, 2009 |
2,412,953 | 86,734 | 26,596 | 529,981 | 1,237 | 26,811 | 9,955 | — | 3,094,267 | |||||||||||||||||||||||||||
| Sale of Units |
1,534 | 155 | — | 52 | — | — | 14,755 | — | 16,496 | |||||||||||||||||||||||||||
| Redemption of Units |
(56,306 | ) | (21,459 | ) | (9,373 | ) | (12,401 | ) | — | (685 | ) | (749 | ) | — | (100,973 | ) | ||||||||||||||||||||
| Capital - Units, March 31, 2010 |
2,358,181 | 65,430 | 17,223 | 517,632 | 1,237 | 26,126 | 23,961 | — | 3,009,790 | |||||||||||||||||||||||||||
| (3 | ) | (3 | ) | |||||||||||||||||||||||||||||||||
| Net asset value per unit at December 31, 2009 or beginning of operations |
$ | 118.54 | $ | 105.50 | $ | 139.01 | $ | 117.60 | $ | 117.60 | ||||||||||||||||||||||||||
| Change in net asset value per unit for three months ended March 31, 2010 |
(0.73 | ) | (0.84 | ) | 0.17 | (0.07 | ) | (0.06 | ) | |||||||||||||||||||||||||||
| Net asset value per unit at March 31, 2010 |
$ | 117.81 | $ | 104.66 | $ | 139.18 | $ | 117.53 | $ | 117.54 | ||||||||||||||||||||||||||
| (1) | The Frontier Masters Series began trading operations on June 9, 2009 |
| (2) | Balanced Series Class 3a began trading operations on June 4, 2009 |
| (3) | Values are for both Managing Owner and Limited Owners |
The accompanying notes are an integral part of these financial statements.
20
Table of Contents
The Frontier Fund
Statements of Changes in Owners’ Capital
For the Three Months Ended March 31, 2010
| Campbell/Graham/Tiverton Series | Currency Series | |||||||||||||||||||||||||||||||||||
| (Unaudited) | (Unaudited) | |||||||||||||||||||||||||||||||||||
| Class 1 | Class 2 | Non- Controlling Interests |
Total | Class 1 | Class 2 | Total | ||||||||||||||||||||||||||||||
| Limited Owners |
Managing Owner |
Limited Owners |
Limited Owners |
Managing Owner |
Limited Owners |
|||||||||||||||||||||||||||||||
| Capital (Net Asset Value), December 31, 2009 |
$ | 69,447,366 | $ | 125,510 | $ | 9,789,484 | $ | — | $ | 79,362,360 | $ | 7,934,382 | $ | 574,384 | $ | 1,699,362 | $ | 10,208,128 | ||||||||||||||||||
| Sale of Units |
39,414 | — | — | — | 39,414 | 17,133 | — | 17,133 | ||||||||||||||||||||||||||||
| Redemption of Units |
(1,659,964 | ) | — | (739,151 | ) | — | (2,399,115 | ) | (307,455 | ) | (500,000 | ) | (938,466 | ) | (1,745,921 | ) | ||||||||||||||||||||
| Change in control of ownership - Trading Companies |
— | — | — | (4,603,732 | ) | (4,603,732 | ) | — | — | — | — | |||||||||||||||||||||||||
| Contributions |
— | — | — | 700,000 | 700,000 | — | — | — | — | |||||||||||||||||||||||||||
| Distributions |
— | — | — | — | — | — | — | — | — | |||||||||||||||||||||||||||
| Operations attributable to Non-controlling interests |
— | — | — | 177,897 | 177,897 | — | — | — | — | |||||||||||||||||||||||||||
| Net increase/(decrease) in Owners’ Capital resulting from operations attributable to controlling interests |
(2,264,276 | ) | (3,176 | ) | (255,409 | ) | — | (2,522,861 | ) | 148,612 | (2,651 | ) | 24,716 | 170,677 | ||||||||||||||||||||||
| Capital (Net Asset Value), March 31, 2010 |
$ | 65,562,540 | $ | 122,334 | $ | 8,794,924 | $ | (3,725,835 | ) | $ | 70,753,963 | $ | 7,792,672 | $ | 71,733 | $ | 785,612 | $ | 8,650,017 | |||||||||||||||||
| Capital - Units, December 31, 2009 |
663,631 | 1,036 | 80,841 | — | 745,508 | 101,722 | 6,289 | 18,605 | 126,616 | |||||||||||||||||||||||||||
| Sale of Units |
386 | — | — | — | 386 | 220 | — | — | 220 | |||||||||||||||||||||||||||
| Redemption of Units |
(16,455 | ) | — | (6,328 | ) | — | (22,783 | ) | (3,924 | ) | (5,524 | ) | (10,229 | ) | (19,677 | ) | ||||||||||||||||||||
| Capital - Units, March 31, 2010 |
647,562 | 1,036 | 74,513 | — | 723,111 | 98,018 | 765 | 8,376 | 107,159 | |||||||||||||||||||||||||||
| (1 | ) | (1 | ) | |||||||||||||||||||||||||||||||||
| Net asset value per unit at December 31, 2009 |
$ | 104.65 | $ | 121.10 | $ | 78.00 | $ | 91.34 | ||||||||||||||||||||||||||||
| Change in net asset value per unit for three months ended March 31, 2010 |
(3.40 | ) | (3.07 | ) | 1.50 | 2.45 | ||||||||||||||||||||||||||||||
| Net asset value per unit at March 31, 2010 |
$ | 101.25 | $ | 118.03 | $ | 79.50 | $ | 93.79 | ||||||||||||||||||||||||||||
| (1) | Values are for both Managing Owner and Limited Owners |
The accompanying notes are an integral part of these financial statements.
21
Table of Contents
Statements of Changes in Owners’ Capital
For the Three Months Ended March 31, 2010
| Long Only Commodity Series | Managed Futures Index Series | |||||||||||||||||||||||||||||||
| (Unaudited) | (Unaudited) | |||||||||||||||||||||||||||||||
| Class 1 | Class 2 | Total | Class 1 | Class 2 | Total | |||||||||||||||||||||||||||
| Limited Owners |
Managing Owner |
Limited Owners |
Limited Owners |
Managing Owner |
Limited Owners |
|||||||||||||||||||||||||||
| Capital (Net Asset Value), December 31, 2009 |
$ | 3,711,581 | $ | 133,513 | $ | 821,231 | $ | 4,666,325 | $ | 1,831,435 | $ | 259,205 | $ | 1,682,569 | $ | 3,773,209 | ||||||||||||||||
| Sale of Units |
233 | — | — | 233 | — | 2,000,000 | — | 2,000,000 | ||||||||||||||||||||||||
| Redemption of Units |
(222,156 | ) | — | (22,533 | ) | (244,689 | ) | (80,973 | ) | — | (19,713 | ) | (100,686 | ) | ||||||||||||||||||
| Net increase/(decrease) in Owners’ Capital resulting from operations |
(150,012 | ) | (4,781 | ) | (28,753 | ) | (183,546 | ) | (15,782 | ) | (47,009 | ) | (6,710 | ) | (69,501 | ) | ||||||||||||||||
| Capital (Net Asset Value), March 31, 2010 |
$ | 3,339,646 | $ | 128,732 | $ | 769,945 | $ | 4,238,323 | $ | 1,734,680 | $ | 2,212,196 | $ | 1,656,146 | $ | 5,603,022 | ||||||||||||||||
| Capital - Units, December 31, 2009 |
44,405 | 1,479 | 9,095 | 54,979 | 16,274 | 2,137 | 13,874 | 32,285 | ||||||||||||||||||||||||
| Sale of Units |
3 | — | — | 3 | — | 16,177 | — | 16,177 | ||||||||||||||||||||||||
| Redemption of Units |
(2,767 | ) | — | (252 | ) | (3,019 | ) | (722 | ) | — | (164 | ) | (886 | ) | ||||||||||||||||||
| Capital - Units, March 31, 2010 |
41,641 | 1,479 | 8,843 | 51,963 | 15,552 | 18,314 | 13,710 | 47,576 | ||||||||||||||||||||||||
| (1 | ) | (1 | ) | |||||||||||||||||||||||||||||
| Net asset value per unit at December 31, 2009 |
$ | 83.59 | $ | 90.30 | $ | 112.54 | $ | 121.28 | ||||||||||||||||||||||||
| Change in net asset value per unit for three months ended March 31, 2010 |
(3.39 | ) | (3.24 | ) | (1.00 | ) | (0.48 | ) | ||||||||||||||||||||||||
| Net asset value per unit at March 31, 2010 |
$ | 80.20 | $ | 87.06 | $ | 111.54 | $ | 120.80 | ||||||||||||||||||||||||
| (1) | Values are for both Managing Owner and Limited Owners |
The accompanying notes are an integral part of these financial statements.
22
Table of Contents
The Frontier Fund
Statements of Changes in Owners’ Capital
For the Three Months Ended March 31, 2010
| Winton Series | Winton/Graham Series | ||||||||||||||||||||||||||||||||||
| (Unaudited) | (Unaudited) | ||||||||||||||||||||||||||||||||||
| Class 1 | Class 2 | Total | Class 1 | Class 2 | Non- Controlling Interests |
Total | |||||||||||||||||||||||||||||
| Limited Owners |
Managing Owner |
Limited Owners |
Limited Owners |
Managing Owner |
Limited Owners |
||||||||||||||||||||||||||||||
| Capital (Net Asset Value), December 31, 2009 |
$ | 48,198,317 | $ | 455,282 | $ | 9,748,580 | $ | 58,402,179 | $ | 48,168,395 | $ | 54,990 | $ | 12,467,488 | $ | 7,343,585 | $ | 68,034,458 | |||||||||||||||||
| Sale of Units |
63,725 | — | — | 63,725 | 36,273 | — | — | — | 36,273 | ||||||||||||||||||||||||||
| Redemption of Units |
(1,626,579 | ) | (250,000 | ) | (30,111 | ) | (1,906,690 | ) | (1,572,406 | ) | — | (281,214 | ) | — | (1,853,620 | ) | |||||||||||||||||||
| Change in control of ownership - Trading Companies |
— | — | — | — | — | — | — | — | — | ||||||||||||||||||||||||||
| Contributions |
— | — | — | — | — | — | — | 600,000 | 600,000 | ||||||||||||||||||||||||||
| Distributions |
— | — | — | — | — | — | — | — | — | ||||||||||||||||||||||||||
| Operations attributable to Non-controlling interests |
— | — | — | — | — | — | — | (973,416 | ) | (973,416 | ) | ||||||||||||||||||||||||
| Net increase/(decrease) in Owners’ Capital resulting from operations attributable to controlling interests |
2,305,399 | 805 | 554,093 | 2,860,297 | (298,726 | ) | 111 | 20,942 | — | (277,673 | ) | ||||||||||||||||||||||||
| Capital (Net Asset Value), March 31, 2010 |
$ | 48,940,862 | $ | 206,087 | $ | 10,272,562 | $ | 59,419,511 | $ | 46,333,536 | $ | 55,101 | $ | 12,207,216 | $ | 6,970,169 | $ | 65,566,022 | |||||||||||||||||
| Capital - Units, December 31, 2009 |
409,951 | 3,499 | 74,930 | 488,380 | 437,653 | 428 | 97,106 | — | 535,187 | ||||||||||||||||||||||||||
| Sale of Units |
540 | — | — | 540 | 341 | — | — | — | 341 | ||||||||||||||||||||||||||
| Redemption of Units |
(13,726 | ) | (2,000 | ) | (227 | ) | (15,953 | ) | (14,744 | ) | — | (2,218 | ) | — | (16,962 | ) | |||||||||||||||||||
| Capital - Units, March 31, 2010 |
396,765 | 1,499 | 74,703 | 472,967 | 423,250 | 428 | 94,888 | — | 518,566 | ||||||||||||||||||||||||||
| (1 | ) | (1 | ) | ||||||||||||||||||||||||||||||||
| Net asset value per unit at December 31, 2009 |
$ | 117.57 | $ | 130.10 | $ | 110.06 | $ | 128.39 | |||||||||||||||||||||||||||
| Change in net asset value per unit for three months ended March 31, 2010 |
5.78 | 7.41 | (0.59 | ) | 0.26 | ||||||||||||||||||||||||||||||
| Net asset value per unit at March 31, 2010 |
$ | 123.35 | $ | 137.51 | $ | 109.47 | $ | 128.65 | |||||||||||||||||||||||||||
| (1) | Values are for both Managing Owner and Limited Owners |
The accompanying notes are an integral part of these financial statements.
23
Table of Contents
As of March 31, 2010 (Unaudited)
1. Organization
The Frontier Fund (the “Trust”), was formed as a Delaware statutory trust on August 8, 2003, with separate Series of Units. The Trust’s term will expire on December 31, 2053 (unless terminated earlier in certain circumstances). The Trust is a multi-advisor commodity pool as described in Commodity Futures Trading Commission, or CFTC Regulation § 4.1 0(d)(2).
The Trust has eleven (11) separate and distinct Series of Units issued and outstanding: Frontier Diversified Series, Frontier Dynamic Series, Frontier Long/Short Commodity Series, Frontier Masters Series, Balanced Series, Campbell/Graham/Tiverton Series, Currency Series, Long Only Commodity Series, Managed Futures Index Series, Winton Series and Winton/Graham Series (each a “Series” and collectively, the “Series”). The Trust may issue additional Series of Units. The Units of each Series are separated into different sub-classes of Units. The Trust, with respect to each Series:
| • | engages in the speculative trading of a diversified portfolio of futures, forward (including interbank foreign currencies), options contracts and other derivative instruments (including swap contracts) may, from time to time, engages in cash and spot transactions; |
| • | allocates funds to an affiliated limited liability trading company or companies (“Trading Company”). Except as otherwise described in these notes, each Trading Company has one-year renewable contracts with its own independent commodity trading advisor(s), or each, a Trading Advisor, that will manage all or a portion of such Trading Company’s assets, make the trading decisions for the assets of each Series vested in such Trading Company. Each Trading Company will segregate its assets from any other Trading Company; |
| • | maintains separate, distinct records for each Series, and accounts for the assets of each Series separately from the other Series. |
| • | calculates the Net Asset Value (“NAV”) of its Units for each Series separately from the other Series; |
| • | has an investment objective of increasing the value of each Series’ Units over the long term (capital appreciation), while controlling risk and volatility; further, to offer exposure to the investment programs of individual Trading Advisors and to specific instruments (currencies); and |
| • | maintains each Series of Units in different sub-classes including—Class 1, Class 1a, Class 2, Class 2a, Class 3, and Class 3a. Investors who have purchased Class 1 or Class 1 a Units of any Series are charged a service fee of up to three percent (3.0%) annually of the NAV of each Unit purchased, for the benefit of Selling Agents selling such Class 1 or Class 1a Units. The initial service fee, which is amortized monthly at an annual rate of up to three percent (3.0%) of the average daily NAV of Class 1 or Class 1 a of such Series, is prepaid to Equinox Fund Management, LLC (the “Managing Owner”) by each Series, and paid to the selling agents by the Managing Owner in the month following sale; provided, however, that investors who redeem all or a portion of their Class 1 or Class 1 a Units of any Series during the first twelve (12) months following the effective date of their purchase are subject to a redemption fee of up to three percent (3.0%) of the NAV at which such investor redeemed to reimburse the Trust for the then-unamortized balance of the prepaid initial service fee. With respect to Class 2 and Class 2a Units of any Series, the Managing Owner pays an ongoing service fee to Selling Agents of up to one half percent (0.5%) annually of the NAV of each Class 2 or Class 2a Unit (of which 0.25% will be charged to Limited Owners holding Class 2 Units of the Frontier Diversified Series, Frontier Dynamic Series and Frontier Masters Series or Class 2a Units of the Frontier Long/Short Commodity Series) sold until such Class 2 or Class 2a Units which are subject to the fee limitation are reclassified as Class 3 or Class 3a Units of the applicable Series for administrative purposes. The Managing Owner may also pay Selling Agents certain additional fees and expenses for administrative and other services rendered and expenses incurred by such Selling Agents. |
| • | All payments made to Selling Agents who are members of the Financial Industry Regulatory Authority, Inc. (“FINRA”) and their associated persons that constitute underwriting compensation will be subject to the limitations set forth in Rule 2310 (formerly Rule 2810) of the Conduct Rules of FINRA (“Rule 2310”). An investor’s Class 1 Units or Class 2 Units of any Series, or Class 1 a Units or Class 2a Units of the Frontier Long/Short Commodity Series or Balanced Series will be classified as Class 3 Units of such Series, or Class 3a Units of the Frontier Long/Short Commodity Series or Balanced Series, as applicable for administrative purposes as of any business day when the Managing Owner determines, in its sole discretion, that the service fee limit with respect to such Units has been reached. |
24
Table of Contents
| • | Units of any Class in a Series may be redeemed, in whole or in part, on a daily basis, at the then current NAV per Unit for such Series on the day of the week after the date the Managing Owner is in receipt of a redemption request for at least one (1) Business Day to be received by the Managing Owner prior to 4:00 PM in New York. |
As of March 31, 2010, the Trust, with respect to the Frontier Diversified Series, Frontier Dynamic Series, Frontier Masters Series, Campbell/Graham/Tiverton Series, Currency Series, Long Only Commodity Series, Managed Futures Index Series, Winton Series and Winton/Graham Series separates Units into three separate Classes—Class 1, Class 2, and Class 3. The Trust, with respect to the Balanced Series, and Frontier Long/Short Commodity Series separates Units into six separate Classes – Class 1, Class 2, Class 3, Class 1a, Class 2a and Class 3a. It is expected that between 10% and 30% of each Series’ assets normally will be invested in one or more Trading Companies to be committed as margin for trading positions, but from time to time these percentages may be substantially more or less. The remainders of each Series’ assets are maintained at the Trust level for cash management. Each of the respective Series has invested monies into pooled cash management assets which have included purchases of certificates of deposit, custom time deposits and U.S. Treasury securities. Each Series’ ownership in these investments is based on its percentage ownership in the pooled cash management assets on the reporting date.
As of March 31, 2010, each of the Frontier Dynamic Series, Long Only Commodity Series, Managed Futures Index Series and Winton Series has invested a portion of its assets in a single Trading Company, and a single Trading Advisor manages 100% of the assets invested in each such Trading Company, except the Trading Company for the Frontier Dynamic Series and for the Long Only Commodity Series allocate assets only to Swaps. The Currency Series invests a portion of its assets in a single Trading Company, which allocates assets to one Trading Advisor and one Swap. The Frontier Long/Short Commodity Series invests its assets in a single Trading Company and has multiple Trading Advisors that manage the assets invested in such Trading Company. Each of the Frontier Diversified Series, Frontier Masters Series, Balanced Series, Campbell/Graham/Tiverton Series, and Winton/Graham Series has invested a portion of its assets in several different Trading Companies and has multiple Trading Advisors that manage the assets invested in such Trading Companies.
2. Significant Accounting Policies
The following are the significant accounting policies of the Trust.
Basis of presentation—The financial statements include the accounts of the Trust and were prepared without audit according to the rules and regulations of the SEC. The Trust follows accounting standards set by the Financial Accounting Standards Board (“FASB”). The FASB sets generally accepted accounting principles (“GAAP”) that the Trust follows to ensure consistent reporting. References to GAAP issued by the FASB in these footnotes are to the FASB Accounting Standards Codification, (the “Codification” or “ASC”). Certain information and footnote disclosures normally included in the financial statements prepared in accordance with GAAP may be omitted pursuant to such rules and regulations. In our opinion, the accompanying interim, unaudited, financial statements contain all adjustments (consisting of normal recurring accruals) necessary and adequate disclosures to present fairly the financial position as of March 31, 2010 and the results of operations for the three months ended March 31, 2010, and 2009.
These financial statements should be read in conjunction with the audited financial statements and notes thereto included in our 2009 Annual Report on Form 10-K as filed with the SEC.
Consolidation—The Series, through investing in the Trading Companies, authorize certain Trading Advisors to place trades and manage assets at pre-determined investment levels. The Trading Companies were organized by the Managing Owner for the purpose of investing in commodities interests and derivative instruments, and have no operating income or expenses, except for trading income and expenses, all of which is allocated to the Series. Trading Companies in which a Series has a majority equity interest are consolidated by such Series. The equity interest held by other Series of the Trust is shown as non-controlling interests in the statements of financial condition. Investments in Trading Companies in which a Series does not have a controlling or majority interest are carried in the statement of financial condition of such Series at fair value. Fair value represents the proportionate share of the equity of a Series in a Trading Company.
The consolidated financial statements of the Frontier Diversified Series include the assets, liabilities and earnings of its wholly-owned trading company, Frontier Trading Company X, LLC and its majority owned trading company, Beach Horizon Trading Company – Horizon Program, LLC.
The consolidated financial statements of the Frontier Dynamic Series include the assets, liabilities and earnings of its wholly- owned trading company, Frontier Trading Company XII, LLC.
25
Table of Contents
The consolidated financial statements of the Frontier Long/Short Commodity Series include the earnings of its majority owned trading company, Frontier Trading Company VII, LLC through January 31, 2010.
The consolidated financial statements of the Frontier Masters Series include the assets, liabilities and earnings of its wholly-owned trading company, Frontier Trading Company XI, LLC.
The consolidated financial statements of the Balanced Series include the assets, liabilities and earnings of its majority owned Trading Companies, Frontier Trading Company I, LLC, Frontier Trading Company IX, LLC, Frontier Trading Company XV, LLC, QIM Trading Company-Global Program, LLC, Winton Trading Company-Diversified Program, LLC, Cantab Trading Company-Aristarchus Program, LLC and Tiverton Trading Company-Discretionary Program, LLC, as well as earnings of Frontier Trading Company VI, LLC through March 19, 2010 and earnings from Frontier Trading Company XIV through January 25, 2010.
The consolidated financial statements of the Campbell/Graham/Tiverton Series include the assets, liabilities and earnings of its majority owned trading company, Frontier Trading Company VI, LLC and the earnings from this trading company after March 19, 2010.
The consolidated financial statements of the Currency Series include the assets, liabilities and earnings of its wholly owned trading company, Frontier Trading Company III, LLC.
The consolidated financial statements of the Long Only Commodity Series include the assets and liabilities of its wholly- owned trading company, Frontier Trading Company VIII, LLC.
The consolidated financial statements of the Winton/Graham Series include the assets, liabilities and earnings of its majority owned trading company, Frontier Trading Company V, LLC.
Use of Estimates—The preparation of financial statements in conformity with generally accepted accounting principles may require the Managing Owner to make estimates and assumptions that affect the reported amounts of assets and liabilities and disclosure of contingent assets and liabilities at the date of the financial statements and the reported amounts of revenue and expenses during the reporting period. Swap contracts may require significant estimates. Swap contracts are reported at fair value. Certain fair values are based on daily reports from the swap counterparty that may be corroborated against independent valuation/rate of return information published and available on a daily recurring frequency. Other swap contracts fair values are based upon returns/values that are provided on less than a daily frequency from the swap counterparty, require additional internal financial modeling to develop pricing, and these swaps may not be corroborated against independent valuation/rate of return information published and available on a daily recurring frequency. Actual results could differ from those estimates.
Cash and Cash Equivalents—Cash and cash equivalents include cash and overnight investments in interest-bearing demand deposits with banks and cash managers with maturities of three months or less. The Trust maintains deposits with high quality financial institutions in amounts that are in excess of federally insured limits.
Interest Income—Aggregate interest income from all sources, including assets held at clearing brokers, up to two percentage points of the aggregate percentage yield (annualized) is paid to the Managing Owner by the Balanced Series (Class 1 and Class 2 only), Campbell/Graham/Tiverton Series, Currency Series, Winton Series and Winton/Graham Series. For the Frontier Diversified Series, Frontier Dynamic Series, Frontier Long/Short Commodity Series, Frontier Masters Series, Balanced Series (Class 1a, Class 2a and Class 3a only), Long Only Commodity Series and Managed Futures Index Series, 20% of the total interest allocated to each Series is paid to the Managing Owner. All interest not paid to the Managing Owner is interest income to the Series.
U.S. Treasury Securities, Custom Time Deposits and certain demand deposits are pooled for purposes of maximizing returns on these assets to investors of all Series. Interest income from pooled cash management assets is recognized on the accrual basis and allocated daily to each Series based upon its daily proportion of ownership of the pool. Interest income from demand deposits segregated by Series is allocated to the respective Series.
U.S. Treasury Securities—U.S. Treasury Securities are allocated to each Series based on their percentage ownership in the pooled cash management assets as of the reporting date. They are reported at fair value as Level 1 inputs under ASC 820, Fair Value Measurements and Disclosures. Accrued interest is reported on the Statements of Financial Condition as interest receivable.
Custom Time Deposits—Custom time deposits are structured deposit agreements with U.S. Bank National Association that earn a guaranteed fixed interest rate between 2.17% and 3.75% and will mature six months from the deposit date and are subject to automatic six-month rollovers through October 2013. Interest is paid monthly or at least every six months. Unscheduled withdrawals will be subject to certain penalties and other costs up to 1.0% of the amount deposited if withdrawn within the first six months from the deposit date. Custom time deposits were purchased on September 15, 2009, October 30, 2008 and October 21, 2008. The withdrawal fee is set at 0.225% for the period from six months to one year subsequent to the deposit date and decreases by .05% increments for each year thereafter through the maturity date. Custom time deposits are allocated to each Series based on their percentage ownership in the pooled cash management assets as of the reporting date. The Trust values the custom time deposits at face value plus accrued interest as it is considered a deposit account under paragraph 7.31 of the Investment Company Audit Guide, and accordingly, this deposit is not subject to ASC 820.
26
Table of Contents
Swaps—Certain Series of the Trust strategically invest a portion or all of their assets in total return Swaps, selected at the direction of the Managing Owner. Swaps are privately negotiated contracts designed to provide investment returns linked to those produced by one or more investment products or indices. In a typical Swap, two parties agree to exchange the returns (or differentials in rates of return) earned or realized on one or more particular predetermined investments or instruments. The gross returns to be exchanged or “swapped” between the parties are calculated with respect to a “notional amount” (i.e., the amount of value of the underlying asset used in computing the particular interest rate, return, or other amount to be exchanged) in a particular investment, or in a “basket” of securities. The Trust valued the Swaps at fair value and reports these instruments as Level 3 inputs under ASC 820.
Receivable From Futures Commission Merchants—The Trust deposits assets with a broker subject to CFTC regulations and various exchange and broker requirements. Margin requirements are satisfied by the deposit of cash with such broker. The Trust earns interest income on its assets deposited with the broker.
Revenue recognition—Futures, options on futures, forward and swap contracts are recorded on a trade date basis and realized gains or losses are recognized when contracts are liquidated. Unrealized gains or losses on open contracts (the difference between contract trade price and market price) are reported in the statement of financial condition as a net unrealized gain or loss, as there exists a right of offset of unrealized gains or losses in accordance with FASB ASC 815, Derivatives and Hedging (“ASC 815”).
Any change in net unrealized gain or loss from the preceding period is reported in the statement of operations. Fair value of exchange-traded contracts is based upon exchange settlement prices. Fair value of non-exchange-traded contracts is based on third party quoted dealer values on the Interbank market. For U.S. Treasury Securities, interest is recognized in the period earned and the instruments are marked-to-market daily based on third party information. Certificates of Deposit and Custom Time Deposits are valued at face value plus accrued interest and the interest income is recognized in the period earned. Transaction costs are recognized as incurred and reflected separately in the Statement of Operations.
Allocation of Earnings—Each Series of the Trust maintains different sub-classes of Units including—Class 1, Class 2, Class 3, Class 1 a, Class 2a and Class 3a). All classes have identical voting, dividend, liquidation and other rights and the same terms and conditions, except that fees charged to a Class or Series differ as described below. Revenues, expenses (other than expenses attributable to a specific class), and realized and unrealized trading profits and losses of each Series are allocated daily to Class 1, Class 1 a, Class 2, Class 2a, Class 3 and Class 3a Units based on each Class’ respective owners’ capital balances.
Each Series allocates funds to an affiliated Trading Company, or Companies, of the Trust. Each Trading Company allocates all of its daily trading profits or losses to the Series in proportion to each Series’ ownership interest in the Trading Company, adjusted on a daily basis. As of March 31, 2010, the value of all open contracts and cash held at clearing brokers is similarly allocated to the Series in proportion to each Series’ funds allocated to the Trading Company, or Companies.
Inter-Series Receivables/Payables—The Balanced Series, for the purposes of diversification of investments and trading advisors through the other Series’ access to trading companies in which the Balanced Series does not have a direct interest, advances funds to the Currency Series, Frontier Diversified Series, Frontier Dynamic Series and Frontier Masters Series. The amount of the funds advanced by the Balanced Series to each of the Currency Series, Frontier Diversified Series, Frontier Dynamic Series and Frontier Masters Series participates on a pari passu basis with the Class 2 Units of such investee Series. The Balanced Series and investee Series reflect the changes in values of these investments as “net change in inter-series receivables/payables” in the Statements of Operations. The Balanced Series is subject to the same allocations of income and fees as the Limited Owners of such Series. As a result of fees charged by the investee Series, fees are not charged by the Balanced Series on the capital allocated to advances in affiliated Series, and the Managing Owner monitors such allocations so that aggregate fees of the investee Series on the Balanced Series advances do not exceed the allowable fees of the Balanced Series as provided in the Trust’s Prospectus. Pertaining to interest credited to the investee Series, interest is not credited to the Balanced Series on the capital allocated to its inter-series advances to avoid the duplication of interest.
Foreign Currency Transactions—The Trust’s functional currency is the U.S. Dollar, however, it transacts business in currencies other than the U.S. Dollar. Assets and liabilities denominated in currencies other than the U.S. Dollar are translated into U.S. Dollars at the rates in effect at the date of the statement of financial condition. Income and expense items denominated in currencies other than the U.S. Dollar are translated into U.S. Dollars at the rates in effect during the period. Gains and losses resulting from the translation to U.S. Dollars are reported in income.
27
Table of Contents
Investments and Swaps— The Trust records investment transactions on trade date and all investments are recorded at fair value in its financial statements, with changes in fair value reported as a component of realized and unrealized gains/(losses) on investments in the Statements of Operations. Generally, fair values will be based on quoted market prices; however, in certain circumstances, significant judgments and estimates may be required in determining fair value in the absence of an active market closing price. As of March 31, 2010 all investments in futures and forward contracts were based on quoted market prices.
Income Taxes—The Trust applies the provisions of ASC 740 Income Taxes (“ASC 740”), which provides guidance for how uncertain tax positions should be recognized, measured, presented and disclosed in the financial statements. This interpretation also provides guidance on derecognition, classification, interest and penalties, accounting in interim periods and disclosure. ASC 740 requires the evaluation of tax positions taken or expected to be taken in the course of preparing the Trust’s financial statements to determine whether the tax positions are “more-likely-than-not” of being sustained by the applicable tax authority. Tax positions with respect to tax at the Trust’s level not deemed to meet the “more-likely-than-not” threshold would be recorded as a tax benefit or expense in the current year. The Managing Owner has concluded there is no tax expense, interest or penalties to be recorded by the Trust for the years ended December 31, 2009 and December 31, 2008. The 2006 through 2009 tax years generally remain subject to examination by U.S. federal and most state tax authorities.
In the opinion of the Managing Owner, (i) the Trust is treated as a partnership for Federal income tax purposes and, assuming that at least 90% of the gross income of the Trust constitutes “qualifying income” within the meaning of Section 7704(d) of the Code, the Trust is not a publicly traded partnership treated as a corporation, and (ii) the discussion set forth in the Prospectus under the heading “Federal Income Tax Consequences” correctly summarizes the material Federal income tax consequences as of the date of the Prospectus to potential U.S. Limited Owners of the purchase, ownership and disposition of Units of the Trust.
Fees and Expenses—All management fees, incentive fees, and service fees of the Trust are paid to the Managing Owner. Additionally, the trading fees are paid to the Managing Owner. It is the responsibility of the Managing Owner to pay all Trading Advisor management and incentive fees, Selling Agent Service fees and all other operating expenses and continuing offering costs of the Trust.
Service Fees—The Trust maintains each Series of Units in different sub-classes including—Class 1, Class 1a, Class 2, Class 2a, Class 3, and Class 3a. Investors who have purchased Class 1 or Class 1a Units of any Series are charged a service fee of up to three percent (3.0%) annually of the NAV of each Unit purchased, for the benefit of Selling Agents selling such Class 1 or Class 1a Units. The initial service fee, which is amortized monthly at an annual rate of up to three percent (3.0%) of the average daily NAV of Class 1 or Class 1a of such Series, is prepaid to Equinox Fund Management, LLC (the “Managing Owner”) by each Series, and paid to the selling agents by the Managing Owner in the month following sale; provided, however, that investors who redeem all or a portion of their Class 1 or Class 1a Units of any Series during the first twelve (12) months following the effective date of their purchase are subject to a redemption fee of up to three percent (3.0%) of the NAV at which such investor redeemed to reimburse the Trust for the then-unamortized balance of the prepaid initial service fee. With respect to Class 2 and Class 2a Units of any Series, the Managing Owner pays an ongoing service fee to Selling Agents of up to one half percent (0.5%) annually of the NAV of each Class 2 or Class 2a Unit (of which 0.25% will be charged to Limited Owners holding Class 2 Units of the Frontier Diversified Series, Frontier Dynamic Series and Frontier Masters Series or Class 2a Units of the Frontier Long/Short Commodity Series) sold until such Class 2 or Class 2a Units which are subject to the fee limitation are reclassified as Class 3 or Class 3a Units of the applicable Series for administrative purposes. The Managing Owner may also pay Selling Agents certain additional fees and expenses for administrative and other services rendered and expenses incurred by such Selling Agents.
These service fees are part of the offering costs of the Trust, which include registration and filing fees, legal and blue sky expenses, accounting and audit, printing, marketing support and other offering costs which are born by the Managing Owner. With respect to the service fees, the initial service fee (for the first 12 months) relating to a purchase of Class 1 and Class 1a Units by an investor is prepaid by the Managing Owner to the relevant selling agent in the month following such purchase and is reimbursed for such payment by the Series monthly in arrears in an amount based upon a corresponding percentage of NAV, calculated daily. Consequently, the Managing Owner bears the risk of the downside and enjoys the benefit of the upside potential of any difference between the amount of the initial service fee prepaid by it and the amount of the reimbursement thereof, which may result from variations in NAV over the following 12 months.
Pending Owner Additions—Funds received for new subscriptions and for additions to existing owner interests are recorded as capital additions at the NAV per unit of the second business day following receipt.
Statement of Cash Flows—ASC 230—formerly recognized as Statement of Financial Accounting Standards, Statements of Cash Flows – Exemption of Certain Enterprises and Classification of Cash Flows from Certain Securities Acquired for Resale, allows certain entities an exemption from presenting statements of cash flows. Accordingly, the Trust has elected not to provide statements of cash flows as permitted by FASB ASC 230.
28
Table of Contents
Recently Adopted Accounting Pronouncements— In June 2009, the FASB issued ASC 860, Transfers and Servicing (“ASC 860”) formerly recognized as SFAS No. 166, Accounting for Transfers of Financial Assets. ASC 860 requires more information about transfers of financial assets and where companies have continuing exposure to the risk related to transferred financial assets. ASC 860 eliminates the concept of a qualifying special purpose entity, changes the requirements for derecognizing financial assets and requires additional disclosure. This Statement is effective as of the beginning of each reporting entity’s first annual reporting period that begins after November 15, 2009, for interim periods within that first annual reporting period, and for interim and annual reporting periods thereafter. Earlier application is prohibited. The recognition and measurement provisions of this Statement shall be applied to transfers that occur on or after the effective date. The adoption of ASC 860 did not have a material effect on the financial statements of the Series.
In February 2010, the FASB issued Accounting Standards Update (“ASU”) 2010-10, Consolidation (Topic 810: Amendments for Certain Investment Funds). ASU 2010-10 defers the effective date of the amendments to the consolidation requirements made by ASC 810 to a reporting entity’s interest in certain types of entities. FASB concluded that entities that may meet conditions of the deferral include mutual funds, hedge funds, real estate investment funds, private equity funds and venture capital funds. The deferral is intended to allow more time for the FASB to develop consistent guidance on principal and agent relationships as part of their joint consolidation project. The amendments in this update are effective as of the beginning of a reporting entity’s first annual period that begins after November 15, 2009, and for interim periods within that first annual reporting period. The effective date coincides with the effective date for the Statement 167 amendments to ASC 810. Early application is not permitted. The adoption of ASU 2010-10 did not have a material effect on the financial statements of the Series.
In February 2010, the FASB issued ASU 2010-09, Subsequent Events (ASC 855): Amendments to Certain Recognition and Disclosure Requirements. The amendments within ASU 2010-09 were issued by FASB due to questions that were raised in practice that the requirements to disclose the date that the financial statements are issued potentially conflict with some of the SEC’s guidance. FASB’s update addresses both the interaction of the requirements of this Topic with the SEC’s reporting requirements and the intended breadth of the reissuance disclosure related to subsequent events. All of the amendments in this update are effective upon issuance of the final update, except for the use of the issued date for conduit debt obligors which is effective for interim or annual periods ending after June 15, 2010. The adoption of ASU 2010-09 did not have a material effect on the financial statements of the Series.
In January 2010, the FASB issued ASU 2010-06, Fair Value Measurements and Disclosures (ASC 820): Improving Disclosures about Fair Value Measurements. ASU 2010-06 adds new disclosure requirements about transfers into and out of Levels 1 and 2 and separate disclosures about purchases, sales, issuances and settlements in the reconciliation for fair value measurements using significant unobservable inputs (Level 3). The update also clarifies existing disclosure requirements related to the levels of disaggregation for fair value measurement and inputs and valuation techniques used to measure fair value. The amended guidance is effective for financial statements for fiscal years and interim periods beginning after December 15, 2009 except for disclosures about purchases, sales, issuances and settlements in the rollforward of activity in Level 3 fair value measurements, which are effective for fiscal years beginning after December 15, 2010 and for interim periods within those fiscal years. The adoption of ASU 2010-06 did not have a material effect on the financial statements of the Series.
In January 2010, the FASB issued ASU 2010-02, Consolidation (ASC 810): Accounting and Reporting for Decreases in Ownership of a Subsidiary – a Scope Clarification. The objective of ASU 2010-02 is to address implementation issues related to changes in ownership provisions. This ASU clarifies that decreases in ownership provisions within ASC 810 applies to (a) a subsidiary or group of assets that is a business or nonprofit activity, (b) a subsidiary that is a business or nonprofit activity that is transferred to an equity method investee or joint venture, and (c) an exchange of a group of assets that constitutes a business or nonprofit activity for a noncontrolling interest in an entity. This ASU also expands disclosure requirements for the deconsolidation of a subsidiary or derecognition of a group of assets within the scope of ASC 810. The amendments in this update are effective beginning in the first interim or annual reporting period ending on or after December 15, 2009. The adoption of ASU 2010-02 did not have a material effect on the financial statements of the Series.
Reclassification—Certain amounts in the financial statements have been reclassified to conform to the 2010 presentation. These reclasses have no impact on Owners’ Capital or NAV.
3. Fair Value Measurements
In connection with the valuation of investments the Series apply ASC 820. ASC 820 provides clarification that when a quoted price in an active market for the identical asset or liability is not available, a reporting entity is required to measure fair value using certain techniques. ASC 820 also clarifies that when estimating the fair value of an asset or liability, a reporting entity is not required to include a separate input or adjustment to other inputs relating to the existence of a restriction that prevents the transfer of an asset or liability. ASC 820 also clarifies that both a quoted price in an active market for the identical asset or liability at the measurement date and the quoted price for the identical asset or liability when traded as an asset in an active market when no adjustments to the quoted price of the asset are required are Level 1 fair value measurements.
Level 1 Inputs
Unadjusted quoted prices in active markets for identical financial assets that the reporting entity has the ability to access at the measurement date.
29
Table of Contents
Level 2 Inputs
Inputs other than quoted prices included in Level 1 that are observable for the financial asset or liabilities, either directly or indirectly. These might include quoted prices for similar financial assets in active markets, quoted prices for identical or similar financial assets in markets that are not active, inputs other than quoted prices that are observable for the financial asset or inputs that are derived principally from or corroborated by market data by correlation or other means.
Level 3 Inputs
Unobservable inputs for determining the fair value of financial assets that reflect an entity’s own assumptions about the assumptions that market participants would use in pricing the financial asset.
The Trust uses the following methodologies to value instruments within its financial asset portfolio at fair value:
Trading Securities. These instruments include U.S. Treasury Securities and Open Trade Equity Positions (Futures Contracts and Currency Forwards) that are actively traded on public markets with quoted pricing for corroboration. U.S. Treasury Securities, Futures Contracts, and Currency Forward are reported at fair value using Level 1 inputs. Trading Securities instruments further include Open Trade Equity that are quoted prices for identical or similar assets that are not traded on active markets. Trading Options are reported at fair value using Level 2 inputs.
Swap Contracts. Certain Swap Contracts are reported utilizing Level 2 inputs. These Swap Contracts are reported at fair value based on daily reports from the swap counterparty that may be corroborated against independent valuation/rate of return information published and available on a daily recurring frequency. Other Swap Contracts are reported utilizing Level 3 Inputs. These Swap Contracts are reported at fair value based upon returns/values that are provided on less than a daily frequency from the swap counterparty, require additional internal financial modeling to develop pricing, and these swaps may not be corroborated against independent valuation/rate of return information published and available on a daily recurring frequency.
Investment in Unconsolidated Trading Companies. This investment represents the fair value of the allocation of cash, futures, forwards and options to each respective Series relative to its trading allocations from unconsolidated Trading Companies.
The Trust, under the same management as the Trading Companies, has the benefit of full look through to the assets underlying the positions listed in the following table as “Investment in Unconsolidated Trading Companies”, and as such maintains this line item as the same Level 1 input as the majority of the underlying positions on the financial statements of the Trading Companies. There have been no transfers made between level 1 and level 2.
30
Table of Contents
The following table summarizes the instruments that comprise the Trust’s financial asset portfolio, by Series, measured at fair value on a recurring basis as of March 31, 2010 and December 31, 2009, segregated by the level of valuation inputs within the fair value hierarchy utilized to measure fair value:
| March 31, 2010 |
Level 1 Inputs | Level 2 Inputs | Level 3 Inputs | Total Fair Value | ||||||||
| Frontier Diversified Series |
||||||||||||
| Open Trade Equity |
$ | 159,905 | $ | — | $ | — | $ | 159,905 | ||||
| Swap Contracts |
— | — | 8,298,263 | 8,298,263 | ||||||||
| Investment in Unconsolidated Trading Companies |
4,455,202 | — | — | 4,455,202 | ||||||||
| U.S. Treasury Securities |
13,290,966 | — | — | 13,290,966 | ||||||||
| Frontier Dynamic Series |
||||||||||||
| Swap Contracts |
— | — | 9,946,597 | 9,946,597 | ||||||||
| Investment in Unconsolidated Trading Companies |
— | — | — | — | ||||||||
| U.S. Treasury Securities |
2,834,169 | — | — | 2,834,169 | ||||||||
| Frontier Long Short Commodity Series |
||||||||||||
| Investment in Unconsolidated Trading Companies |
47,361,560 | — | — | 47,361,560 | ||||||||
| U.S. Treasury Securities |
3,067,961 | — | — | 3,067,961 | ||||||||
| Frontier Masters Series |
||||||||||||
| Swap Contracts |
— | — | 16,476,361 | 16,476,361 | ||||||||
| Investment in Unconsolidated Trading Companies |
1,802,062 | — | — | 1,802,062 | ||||||||
| U.S. Treasury Securities |
6,462,251 | — | — | 6,462,251 | ||||||||
| Balanced Series |
||||||||||||
| Open Trade Equity |
12,940,196 | 935,474 | — | 13,875,670 | ||||||||
| Swap Contracts |
— | 42,259,114 | 42,259,114 | |||||||||
| Investment in Unconsolidated Trading Companies |
4,792,969 | — | — | 4,792,969 | ||||||||
| U.S. Treasury Securities |
29,087,972 | — | — | 29,087,972 | ||||||||
| Campbell/Graham/Tiverton Series |
||||||||||||
| Open Trade Equity |
741,959 | — | — | 741,959 | ||||||||
| Investment in Unconsolidated Trading Companies |
15,320,530 | — | — | 15,320,530 | ||||||||
| U.S. Treasury Securities |
6,718,537 | — | — | 6,718,537 | ||||||||
| Currency Series |
||||||||||||
| Open Trade Equity |
64,940 | — | — | 64,940 | ||||||||
| Swap Contracts |
— | — | 5,463,318 | 5,463,318 | ||||||||
| U.S. Treasury Securities |
2,264,361 | — | — | 2,264,361 | ||||||||
| Long Only Commodity Series |
||||||||||||
| Swap Contracts |
— | 405,105 | — | 405,105 | ||||||||
| Investment in Unconsolidated Trading Companies |
— | — | — | — | ||||||||
| U.S. Treasury Securities |
560,516 | — | — | 560,516 | ||||||||
| Managed Futures Index Series |
||||||||||||
| Investment in Unconsolidated Trading Companies |
3,634,198 | — | — | 3,634,198 | ||||||||
| U.S. Treasury Securities |
293,685 | — | — | 293,685 | ||||||||
| Winton Series |
||||||||||||
| Open Trade Equity |
— | — | — | — | ||||||||
| Investment in Unconsolidated Trading Companies |
15,713,090 | — | — | 15,713,090 | ||||||||
| U.S. Treasury Securities |
6,656,099 | — | — | 6,656,099 | ||||||||
| Winton/Graham Series |
||||||||||||
| Open Trade Equity |
2,020,400 | — | — | 2,020,400 | ||||||||
| Investment in Unconsolidated Trading Companies |
2,722,660 | — | — | 2,722,660 | ||||||||
| U.S. Treasury Securities |
7,019,263 | — | — | 7,019,263 | ||||||||
31
Table of Contents
| December 31, 2009 |
Level 1 Inputs | Level 2 Inputs | Level 3 Inputs | Total Fair Value |
|||||||||||
| Frontier Diversified Series |
|||||||||||||||
| Swap Contracts |
$ | — | $ | — | $ | 8,550,639 | $ | 8,550,639 | |||||||
| Investment in Unconsolidated Trading Companies |
3,966,809 | — | — | 3,966,809 | |||||||||||
| U.S. Treasury Securities |
7,765,643 | — | — | 7,765,643 | |||||||||||
| Frontier Dynamic Series |
|||||||||||||||
| Swap Contracts |
— | — | 10,027,253 | 10,027,253 | |||||||||||
| Investment in Unconsolidated Trading Companies |
— | — | — | — | |||||||||||
| U.S. Treasury Securities |
2,739,153 | — | — | 2,739,153 | |||||||||||
| Frontier Long Short Commodity Series |
|||||||||||||||
| Open Trade Equity |
(480,880 | ) | (37,610 | ) | — | (518,490 | ) | ||||||||
| Investment in Unconsolidated Trading Companies |
1,357,682 | — | — | 1,357,682 | |||||||||||
| U.S. Treasury Securities |
6,554,990 | — | — | 6,554,990 | |||||||||||
| Frontier Masters Series |
|||||||||||||||
| Swap Contracts |
— | — | 15,972,156 | 15,972,156 | |||||||||||
| Investment in Unconsolidated Trading Companies |
1,282,798 | — | — | 1,282,798 | |||||||||||
| U.S. Treasury Securities |
3,383,444 | — | — | 3,383,444 | |||||||||||
| Balanced Series |
|||||||||||||||
| Open Trade Equity |
12,632,550 | (1,698,904 | ) | — | 10,933,646 | ||||||||||
| Swap Contracts |
— | — | 41,020,535 | 41,020,535 | |||||||||||
| Investment in Unconsolidated Trading Companies |
303,102 | — | — | 303,102 | |||||||||||
| U.S. Treasury Securities |
31,833,998 | — | — | 31,833,998 | |||||||||||
| Campbell/Graham/Tiverton Series |
|||||||||||||||
| Open Trade Equity |
— | — | — | — | |||||||||||
| Investment in Unconsolidated Trading Companies |
30,057,520 | — | — | 30,057,520 | |||||||||||
| U.S. Treasury Securities |
7,367,693 | — | — | 7,367,693 | |||||||||||
| Currency Series |
|||||||||||||||
| Open Trade Equity |
19,263 | 201 | — | 19,464 | |||||||||||
| Swap Contracts |
— | — | 4,992,959 | 4,992,959 | |||||||||||
| U.S. Treasury Securities |
2,514,501 | — | — | 2,514,501 | |||||||||||
| Long Only Commodity Series |
|||||||||||||||
| Swap Contracts |
— | 584,391 | — | 584,391 | |||||||||||
| Investment in Unconsolidated Trading Companies |
— | — | — | — | |||||||||||
| U.S. Treasury Securities |
571,339 | — | — | 571,339 | |||||||||||
| Managed Futures Index Series |
|||||||||||||||
| Investment in Unconsolidated Trading Companies |
975,271 | — | — | 975,271 | |||||||||||
| U.S. Treasury Securities |
417,851 | — | — | 417,851 | |||||||||||
| Winton Series |
|||||||||||||||
| Open Trade Equity |
— | ||||||||||||||
| Investment in Unconsolidated Trading Companies |
11,033,691 | — | — | 11,033,691 | |||||||||||
| U.S. Treasury Securities |
7,125,185 | — | — | 7,125,185 | |||||||||||
| Winton/Graham Series |
|||||||||||||||
| Open Trade Equity |
810,189 | — | — | 810,189 | |||||||||||
| Investment in Unconsolidated Trading Companies |
2,889,071 | — | — | 2,889,071 | |||||||||||
| U.S. Treasury Securities |
7,598,224 | — | — | 7,598,224 | |||||||||||
32
Table of Contents
The changes in Level 3 assets measured at fair value on a recurring basis are summarized in the following tables. Swap Contract asset gains and losses (realized/unrealized) included in earnings are classified in “realized and unrealized gain (loss) on investments – net unrealized gain/(loss) on swap contracts” on the consolidated statement of operations. During the three months ended March 31, 2010, all identified Level 3 assets are components of the Frontier Diversified Series, Frontier Dynamic Series, Frontier Masters Series, Balanced Series and the Currency Series.
| Swap Contracts |
Frontier Diversified Series For The Three Months Ended March 31, 2010 |
Frontier Dynamic Series For The Three Months Ended March 31, 2010 |
Frontier Masters Series For The Three Months Ended March 31, 2010 | ||||||||
| Balance of recurring Level 3 assets as of December 31, 2009 |
$ | 8,550,641 | $ | 10,027,253 | $ | 15,972,157 | |||||
| Total gains or losses (realized/unrealized): |
|||||||||||
| Included in earnings-realized |
— | — | — | ||||||||
| Included in earnings-unrealized |
(252,378 | ) | (80,656 | ) | 439,498 | ||||||
| Purchases, sales, issuances, and settlements, net |
— | — | 65,306 | ||||||||
| Transfers in and/or out of Level 3 |
— | — | — | ||||||||
| Balance of recurring Level 3 assets as of March 31, 2010 |
$ | 8,298,263 | $ | 9,946,597 | $ | 16,476,961 | |||||
| Swap Contracts |
Balanced Series For The Three Months Ended March 31, 2010 |
Currency Series For The Three Months Ended March 31, 2010 |
|||||||||
| Balance of recurring Level 3 assets as of December 31, 2009 |
$ | 41,020,534 | $ | 4,992,959 | |||||||
| Total gains or losses (realized/unrealized): |
|||||||||||
| Included in earnings-realized |
— | — | |||||||||
| Included in earnings-unrealized |
1,238,580 | 470,359 | |||||||||
| Included in other comprehensive income |
— | — | |||||||||
| Purchases, sales, issuances, and settlements, net |
— | — | |||||||||
| Transfers in and/or out of Level 3 |
— | — | |||||||||
| Balance of recurring Level 3 assets as of March 31, 2010 |
$ | 42,259,114 | $ | 5,463,318 | |||||||
33
Table of Contents
| Swap Contracts |
Frontier Diversified Series For The Twelve Months Ended December 31, 2009 |
Frontier Dynamic Series For The Twelve Months Ended December 31, 2009 |
Frontier Masters Series For The Twelve Months Ended December 31, 2009 |
|||||||||
| Balance of recurring Level 3 assets as of January 1, 2009 |
$ | — | $ | — | $ | — | ||||||
| Total gains or losses (realized/unrealized): |
||||||||||||
| Included in earnings-realized |
— | — | — | |||||||||
| Included in earnings-unrealized |
(1,707,778 | ) | (2,247,497 | ) | (1,864,032 | ) | ||||||
| Purchases, sales, issuances, and settlements, net |
10,258,417 | 12,274,765 | 17,836,189 | |||||||||
| Transfers in and/or out of Level 3 |
— | — | — | |||||||||
| Balance of recurring Level 3 assets as of December 31, 2009 |
$ | 8,550,639 | $ | 10,027,253 | $ | 15,972,157 | ||||||
| Swap Contracts |
Balanced Series For The Twelve Months Ended December 31, 2009 |
Currency Series For The Twelve Months Ended December 31, 2009 |
||||||||||
| Balance of recurring Level 3 assets as of January 1, 2009 |
$ | 53,072,355 | $ | 9,122,123 | ||||||||
| Total gains or losses (realized/unrealized): |
||||||||||||
| Included in earnings-realized |
— | — | ||||||||||
| Included in earnings-unrealized |
(12,051,820 | ) | (4,129,164 | ) | ||||||||
| Purchases, sales, issuances, and settlements, net |
— | — | ||||||||||
| Transfers in and/or out of Level 3 |
— | — | ||||||||||
| Balance of recurring Level 3 assets as of December 31, 2009 |
$ | 41,020,535 | $ | 4,992,959 | ||||||||
4. Swaps
In addition to authorizing Trading Advisors to manage pre-determined investment levels of futures and forward contracts, certain Series of the Trust will strategically invest a portion or all of their assets in total return Swaps, selected at the direction of the Managing Owner. Swaps are privately negotiated contracts designed to provide investment returns linked to those produced by one or more investment products or indices. In a typical Swap, two parties agree to exchange the returns (or differentials in rates of return) earned or realized on one or more particular predetermined investments or instruments. The gross returns to be exchanged or “swapped” between the parties are calculated with respect to a “notional amount” (i.e., the amount or value of the underlying asset used in computing the particular interest rate, return, or other amount to be exchanged) in a particular investment, or in a “basket” of securities.
Each Series’ investment in Swaps will likely differ substantially over time due to cash flows, portfolio management decisions and market movements. For the Balanced Series, Currency Series, Frontier Diversified Series and Frontier Masters Series, the Swaps serve to diversify the investment holdings of each Series and are not used for hedging purposes.
The Managing Owner follows a procedure in selecting well-established financial institutions which the Managing Owner, in its sole discretion, considers to be reputable, reliable, financially responsible and well established to act as swap counterparties. The procedure includes due diligence review of documentation on all new and existing financial institution counterparties prior to initiation of the relationship, and quarterly ongoing review during the relationship, to ensure that counterparties meet the Managing Owner’s minimum credit requirements, the counterparty average rating being no less than an investment grade rating as defined by the rating agencies. As of March 31, 2010, approximately 10.5% of the Trust’s assets were deposited with over-the-counter counterparties in order to initiate and maintain Swaps.
34
Table of Contents
The Balanced Series, Currency Series, Frontier Diversified Series, Frontier Dynamic Series and Frontier Masters Series strategically invest assets in one or more Swaps linked to certain underlying investments or indices at the direction of the Managing Owner. The Trading Company in which the assets of these Series will be invested will not own any of the investments or indices referenced by any Swap entered into by these Series. In addition, neither the swap counterparty to the Trading Company of these Series nor any advisor referenced by any such Swap is a Trading Advisor to these Series.
The Long Only Commodity Series, through the Trading Company in which the assets of the Long Only Commodity Series have been allocated, have entered into various Swaps with one or more swap counterparties. The Swaps enable the Long Only Commodity Series to earn returns similar to returns (less the fees and expenses of the Long Only Commodities Series, including the expenses associated with the Swaps) of the Reuters/Jefferies CRB Index (the “RJ/CRB Index”), and the Jefferies Commodity Performance Index (the “JCPI”). Specifically, the Trading Company, which will hold the assets allocable to the Long Only Commodity Series, will enter into Swaps linked to the RJ/CRB Index and the JCPI at the direction of the Managing Owner.
The Trust has invested in the following Swaps as of March 31, 2010 and December 31, 2009:
| Option Basket Frontier Diversified Series |
Option Basket Frontier Dynamic Series |
Option Basket Frontier Masters Series |
Option Basket Balanced Series | ||||||||||||
| Series: |
Diversified | Dynamic | Masters | Balanced | |||||||||||
| Counterparty |
Company D | Company E | Company F | Company A | |||||||||||
| Notional Amount |
$ | 18,837,577 | $ | 30,862,619 | $ | 16,539,938 | $ | 97,148,337 | |||||||
| Termination Date |
6/6/2014 | 6/6/2014 | 6/6/2014 | 11/6/2012 | |||||||||||
| Investee Returns |
Total Returns | Total Returns | Total Returns | Total Returns | |||||||||||
| Realized Gain/(Loss) |
$ | 0 | $ | 0 | $ | 0 | $ | 0 | |||||||
| Unrealized Gain/(Loss) |
$ | (252,378 | ) | $ | (80,656 | ) | $ | 439,498 | $ | 1,238,580 | |||||
| Fair Value as of 3/31/2010 |
$ | 8,298,263 | $ | 9,946,597 | $ | 16,476,961 | $ | 42,259,114 | |||||||
| Option Basket Currency Series |
Reuters/Jefferies CRB Index |
Jefferies Commodity Performance Index |
|||||||||||||
|
Series: |
Currency | Long/Only | Long/Only | ||||||||||||
| Counterparty |
Company B | Company C | Company C | ||||||||||||
| Notional Amount |
$ | 15,900,347 | $ | 2,200,000 | $ | 2,200,000 | |||||||||
| Termination Date |
1/26/2013 | 2/28/2011 | 2/28/2011 | ||||||||||||
| Investee Returns |
Total Returns | Total Returns | Total Returns | ||||||||||||
| Realized Gain/(Loss) |
$ | 0 | $ | (85,685 | ) | $ | (88,044 | ) | |||||||
| Unrealized Gain/(Loss) |
$ | 470,359 | $ | 0 | $ | 0 | |||||||||
| Fair Value as of 3/31/2010 |
$ | 5,463,318 | $ | 207,542 | $ | 197,563 | |||||||||
35
Table of Contents
| Option Basket Frontier Diversified Series |
Option Basket Frontier Dynamic Series |
Option Basket Frontier Masters Series |
Option Basket Balanced Series |
|||||||||||||
| Series: |
Diversified | Dynamic | Masters | Balanced | ||||||||||||
| Counterparty |
Company D | Company E | Company F | Company A | ||||||||||||
| Notional Amount |
$ | 22,760,455 | $ | 25,875,001 | $ | 15,927,157 | $ | 129,084,678 | ||||||||
| Termination Date |
6/6/2014 | 6/6/2014 | 6/6/2014 | 11/6/2012 | ||||||||||||
| Investee Returns |
Total Returns | Total Returns | Total Returns | Total Returns | ||||||||||||
| Realized Gain/(Loss) |
$ | 0 | $ | 0 | $ | 0 | $ | 0 | ||||||||
| Unrealized Gain/(Loss) |
$ | (1,707,778 | ) | $ | (2,247,497 | ) | $ | (1,864,032 | ) | $ | (12,051,820 | ) | ||||
| Fair Value as of 12/31/2009 |
$ | 8,550,639 | $ | 10,027,253 | $ | 15,972,156 | $ | 41,020,535 | ||||||||
| Option Basket Currency Series |
Reuters/Jefferies CRB Index |
Jefferies Commodity Performance Index |
||||||||||||||
|
Series: |
Currency | Long/Only | Long/Only | |||||||||||||
| Counterparty |
Company B | Company C | Company C | |||||||||||||
| Notional Amount |
$ | 15,426,942 | $ | 2,300,000 | $ | 2,300,000 | ||||||||||
| Termination Date |
1/26/2013 | 2/26/2010 | 2/26/2010 | |||||||||||||
| Investee Returns |
Total Returns | Total Returns | Total Returns | |||||||||||||
| Realized Gain/(Loss) |
$ | 0 | $ | 420,073 | $ | 463,827 | ||||||||||
| Unrealized Gain/(Loss) |
$ | (4,129,164 | ) | $ | 0 | $ | 0 | |||||||||
| Fair Value as of 12/31/2009 |
$ | 4,992,959 | $ | 278,645 | $ | 305,746 | ||||||||||
5. Investments in Unconsolidated Trading Companies
Investments in unconsolidated trading companies represent cash and open trade equity invested in the Trading Companies by each Series and cumulative trading profits or losses allocated to each Series by the Trading Companies. Trading Companies allocate trading profits or losses on the basis of the proportion of each Series’ capital allocated for trading to each respective Trading Company, which bears no relationship to the amount of cash invested by a Series in the Trading Company.
The following table summarizes the Balanced Series, Winton Series, Campbell/Graham/Tiverton Series, Winton/Graham Series, Frontier Long/Short Commodity Series, Managed Futures Index Series, Frontier Diversified Series, and Frontier Masters Series investments in unconsolidated Trading Companies as of March 31, 2010 and December 31, 2009.
36
Table of Contents
| As of March 31, 2010 | As of December 31, 2009 | |||||||||||
| Percentage of Series Net Assets Invested in Trading Co. |
Fair Value | Percentage of Series Net Assets Invested in Trading Co. |
Fair Value | |||||||||
| Trading Company | ||||||||||||
| Balanced Series — |
||||||||||||
| Frontier Trading Companies II and XII |
0.07 | % | $ | 303,102 | ||||||||
| Frontier Trading Companies II, VI, VII and XIV |
1.55 | % | $ | 4,792,969 | ||||||||
| Winton Series — |
||||||||||||
| Frontier Trading Company II |
26.44 | % | $ | 15,713,090 | 18.89 | % | $ | 11,033,691 | ||||
| Campbell/Graham/Tiverton Series — |
||||||||||||
| Frontier Trading Companies V, VI and XV |
37.87 | % | $ | 30,057,520 | ||||||||
| Frontier Trading Companies V and XV |
21.65 | % | $ | 15,320,530 | ||||||||
| Winton/Graham Series — |
||||||||||||
| Frontier Trading Company II |
4.09 | % | $ | 2,722,660 | 4.25 | % | $ | 2,889,071 | ||||
| Frontier Long/Short Commodity Series — |
||||||||||||
| Frontier Trading Company XIII |
1.98 | % | $ | 1,357,682 | ||||||||
| Frontier Trading Companies I and VII |
70.42 | % | $ | 47,361,560 | ||||||||
| Managed Futures Index Series — |
||||||||||||
| Frontier Trading Company IX |
64.86 | % | $ | 3,634,198 | 25.85 | % | $ | 975,271 | ||||
| Frontier Diversified Series — |
||||||||||||
| Frontier Trading Companies I, II, V, VI, VII, XIII, XIV and XV |
5.90 | % | $ | 3,966,809 | ||||||||
| Frontier Trading Companies I, II, V, VI, VII, IX, XIV and XV |
4.41 | % | $ | 4,455,202 | ||||||||
| Frontier Masters Series — |
||||||||||||
| Frontier Trading Companies II, XIV and XV |
2.98 | % | $ | 1,802,062 | 3.09 | % | $ | 1,282,798 | ||||
37
Table of Contents
The following tables summarize the Balanced Series, Winton Series, Campbell/Graham/Tiverton Series, Winton/Graham Series, Frontier Long/Short Commodity Series, Managed Futures Index Series, Frontier Diversified Series and Frontier Masters Series equity in earnings from Trading Companies for the three months ended March 31, 2010 and 2009.
| Three Months Ended March 31, 2010 | Three Months Ended March 31, 2009 | |||||||||||||||||||||||||||||||
| Trading Commissions |
Realized Gain/(Loss) |
Change in Unrealized Gain/(Loss) |
Net Income (Loss) |
Trading Commissions |
Realized Gain/(Loss) |
Change in Unrealized Gain/(Loss) |
Net Income (Loss) |
|||||||||||||||||||||||||
| Trading Company | ||||||||||||||||||||||||||||||||
| Balanced Series — |
||||||||||||||||||||||||||||||||
| Frontier Trading Company II LLC |
$ | (16,240 | ) | $ | 548,815 | $ | 1,792,632 | $ | 2,325,207 | $ | (5,363 | ) | $ | 320,736 | $ | (600,715 | ) | $ | (285,342 | ) | ||||||||||||
| Frontier Trading Company VI LLC |
(1,391 | ) | 34,402 | 103,106 | 136,117 | — | — | — | — | |||||||||||||||||||||||
| Frontier Trading Company VII, LLC |
(939,573 | ) | 3,999,869 | (1,214,636 | ) | 1,845,660 | (247,289 | ) | (4,416,913 | ) | 11,859,723 | 7,195,521 | ||||||||||||||||||||
| Frontier Trading Company XIV, LLC |
(19,921 | ) | (1,654,972 | ) | 1,949,418 | 274,525 | ||||||||||||||||||||||||||
| Total |
$ | (977,125 | ) | $ | 2,928,114 | $ | 2,630,520 | $ | 4,581,509 | $ | (252,652 | ) | $ | (4,096,177 | ) | $ | 11,259,008 | $ | 6,910,179 | |||||||||||||
| Winton Series — |
||||||||||||||||||||||||||||||||
| Frontier Trading Company II LLC |
$ | (22,493 | ) | $ | 822,527 | $ | 2,779,410 | 3,579,444 | $ | — | $ | — | $ | — | $ | — | ||||||||||||||||
| Campbell/Graham/Tiverton Series — |
||||||||||||||||||||||||||||||||
| Frontier Trading Company I LLC |
$ | — | $ | — | $ | — | $ | — | $ | (14,679 | ) | $ | 3,050,980 | $ | (3,444,303 | ) | $ | (408,002 | ) | |||||||||||||
| Frontier Trading Company V LLC |
(55,971 | ) | (1,504,714 | ) | 479,857 | (1,080,828 | ) | — | — | — | — | |||||||||||||||||||||
| Frontier Trading Company VI LLC |
(21,105 | ) | (1,829,237 | ) | 523,687 | (1,326,655 | ) | (5,323 | ) | 249,100 | (353,012 | ) | (109,235 | ) | ||||||||||||||||||
| Frontier Trading Company XV, LLC |
(29,361 | ) | 1,620,250 | (1,052,701 | ) | 538,188 | — | — | — | — | ||||||||||||||||||||||
| Total |
$ | (106,437 | ) | $ | (1,713,701 | ) | $ | (49,157 | ) | $ | (1,869,295 | ) | $ | (20,002 | ) | $ | 3,300,080 | $ | (3,797,315 | ) | $ | (517,237 | ) | |||||||||
| Winton/Graham Series — |
||||||||||||||||||||||||||||||||
| Frontier Trading Company II LLC |
$ | (11,430 | ) | $ | 415,871 | $ | 1,429,148 | $ | 1,833,589 | $ | (3,949 | ) | $ | 120,938 | $ | (386,551 | ) | $ | (269,562 | ) | ||||||||||||
| Frontier Trading Company V LLC |
— | — | — | — | (33,767 | ) | (411,214 | ) | (110,073 | ) | (555,054 | ) | ||||||||||||||||||||
| Total |
$ | (11,430 | ) | $ | 415,871 | $ | 1,429,148 | $ | 1,833,589 | $ | (37,716 | ) | $ | (290,276 | ) | $ | (496,624 | ) | $ | (824,616 | ) | |||||||||||
| Frontier Long/Short Commodity Series — |
||||||||||||||||||||||||||||||||
| Frontier Trading Company I LLC |
$ | (7,281 | ) | $ | (98,340 | ) | $ | 150,816 | $ | 45,195 | $ | — | $ | — | $ | — | $ | — | ||||||||||||||
| Frontier Trading Companies VII, LLC |
(206,138 | ) | (7,302,413 | ) | 10,148,434 | 2,639,883 | — | — | — | — | ||||||||||||||||||||||
| Total |
$ | (213,419 | ) | $ | (7,400,753 | ) | $ | 10,299,250 | $ | 2,685,078 | $ | — | $ | — | $ | — | $ | — | ||||||||||||||
| Managed Futures Index Series — |
||||||||||||||||||||||||||||||||
| Frontier Trading Company IX, LLC |
$ | (4,443 | ) | $ | (197,046 | ) | $ | 159,377 | $ | (42,112 | ) | $ | (1,732 | ) | $ | (118,203 | ) | $ | (82,075 | ) | $ | (202,010 | ) | |||||||||
| Frontier Diversified Series — |
||||||||||||||||||||||||||||||||
| Frontier Trading Company I LLC |
$ | (47,394 | ) | $ | (408,216 | ) | $ | (29,209 | ) | $ | (484,819 | ) | $ | — | $ | — | $ | — | $ | — | ||||||||||||
| Frontier Trading Company II LLC |
(3,274 | ) | 112,394 | 472,581 | 581,701 | |||||||||||||||||||||||||||
| Frontier Trading Company V LLC |
(3,109 | ) | (3,451 | ) | 113,972 | 107,412 | — | — | — | — | ||||||||||||||||||||||
| Frontier Trading Company VI LLC |
(2,698 | ) | (187,306 | ) | 106,599 | (83,405 | ) | — | — | — | — | |||||||||||||||||||||
| Frontier Trading Company VII, LLC |
(160,104 | ) | 805,428 | (116,023 | ) | 529,301 | — | — | — | — | ||||||||||||||||||||||
| Frontier Trading Company IX, LLC |
(2,580 | ) | (127,624 | ) | (43,862 | ) | (174,066 | ) | — | — | — | — | ||||||||||||||||||||
| Frontier Trading Company XIV, LLC |
(9,837 | ) | (837,101 | ) | 647,939 | (198,999 | ) | — | — | — | — | |||||||||||||||||||||
| Frontier Trading Company XV, LLC |
(13,309 | ) | 735,469 | (462,532 | ) | 259,628 | — | — | — | — | ||||||||||||||||||||||
| Total |
$ | (242,305 | ) | $ | 89,593 | $ | 689,465 | $ | 536,753 | $ | — | $ | — | $ | — | $ | — | |||||||||||||||
| Frontier Masters Series — |
||||||||||||||||||||||||||||||||
| Frontier Trading Company II LLC |
$ | (3,682 | ) | $ | 130,796 | $ | 492,077 | $ | 619,191 | $ | — | $ | — | $ | — | $ | — | |||||||||||||||
| Frontier Trading Company XIV, LLC |
(15,970 | ) | (1,374,664 | ) | 1,039,716 | (350,918 | ) | — | — | — | — | |||||||||||||||||||||
| Frontier Trading Company XV, LLC |
(12,872 | ) | 713,735 | (449,872 | ) | 250,991 | — | — | — | — | ||||||||||||||||||||||
| Total |
$ | (32,524 | ) | $ | (530,133 | ) | $ | 1,081,921 | $ | 519,264 | $ | — | $ | — | $ | — | $ | — | ||||||||||||||
38
Table of Contents
The statements of financial condition as of March 31, 2010 and December 31, 2009 and the Condensed Statement of Income for the three months ended March 31, 2010 and 2009 for the unconsolidated Trading Companies are as follows:
| Statements of Financial Condition -March 31, 2010 | Frontier Trading Company II LLC |
Frontier Trading Company VII LLC |
Frontier Trading Company IX LLC |
Beach Horizon Trading Co.- Horizon Program, LLC |
Frontier Trading Company XIV LLC |
Frontier Trading Company XV LLC |
QIM Trading Company- Global Program, LLC |
Winton Trading Co.- Diversified Program, LLC |
Cantab Trading Co.- Aristarchus Program, LLC |
Tiverton Trading Co.- Discretionary Program, LLC | |||||||||||||||||||||||||||||
| Cash held at futures commission merchants |
$ | 17,473,197 | $ | 43,228,692 | $ | 2,775,666 | $ | 1,313,431 | $ | 11,422,541 | $ | 16,511,336 | $ | 1,434,584 | $ | 1,780,207 | $ | 4,929,165 | $ | 607,561 | |||||||||||||||||||
| Open trade equity |
7,457,594 | (1,299,599 | ) | 650,318 | 159,905 | 410,495 | 10,044,272 | 9,237 | 402,973 | 328,055 | 184,397 | ||||||||||||||||||||||||||||
| Total assets |
$ | 24,930,791 | $ | 41,929,093 | $ | 3,425,984 | $ | 1,473,336 | $ | 11,833,036 | $ | 26,555,608 | $ | 1,443,821 | $ | 2,183,180 | $ | 5,257,220 | $ | 791,958 | |||||||||||||||||||
| Members’ equity |
$ | 24,930,791 | $ | 41,929,093 | $ | 3,425,984 | $ | 1,473,336 | $ | 11,833,036 | $ | 26,555,608 | $ | 1,443,821 | $ | 2,183,180 | $ | 5,257,220 | $ | 791,958 | |||||||||||||||||||
| Condensed Statement of Income - For the Three Months Ended March 31, 2010 |
|||||||||||||||||||||||||||||||||||||||
| Interest income |
$ | (45 | ) | $ | (80 | ) | $ | 1,040 | $ | (239 | ) | $ | (6,868 | ) | $ | (833 | ) | $ | (183 | ) | $ | (105 | ) | $ | (261 | ) | $ | — | |||||||||||
| Net realized gain on investments, less commissions |
1,973,283 | (10,670,808 | ) | (1,069,251 | ) | 221,001 | (4,998,026 | ) | 8,056,868 | (292,655 | ) | 259,495 | 301,672 | 16,525 | |||||||||||||||||||||||||
| Change in open trade equity |
6,965,848 | 12,612,195 | 612,084 | (296,899 | ) | 2,909,320 | (5,301,720 | ) | 9,237 | 402,497 | 328,055 | 6,981 | |||||||||||||||||||||||||||
| Net income |
$ | 8,939,086 | $ | 1,941,307 | $ | (456,127 | ) | $ | (76,137 | ) | $ | (2,095,574 | ) | $ | 2,754,315 | $ | (283,601 | ) | $ | 661,887 | $ | 629,466 | $ | 23,506 | |||||||||||||||
| Statements of Financial Condition -December 31, 2009 | Frontier Trading Company V LLC |
Frontier Trading Company VI LLC |
Frontier Trading Company IX, LLC |
||||||||||||||||||||||||||||||||||||
|
Cash held at futures commission merchants |
$ | 13,010,250 | $ | 12,801,718 | $ | 1,135,385 | |||||||||||||||||||||||||||||||||
|
Open trade equity |
810,189 | (767,235 | ) | 38,234 | |||||||||||||||||||||||||||||||||||
|
Total assets |
$ | 13,820,439 | $ | 12,034,483 | $ | 1,173,619 | |||||||||||||||||||||||||||||||||
|
Members’ equity |
$ | 13,820,439 | $ | 12,034,483 | $ | 1,173,619 | |||||||||||||||||||||||||||||||||
|
Condensed Statement of Income - For the Three Months Ended March 31, 2009 |
|||||||||||||||||||||||||||||||||||||||
|
Interest income |
$ | 1,781 | $ | 8,663 | $ | 2,563 | |||||||||||||||||||||||||||||||||
| Net realized gain on investments, less commissions |
(721,678 | ) | 491,120 | (348,820 | ) | ||||||||||||||||||||||||||||||||||
| Change in open trade equity |
(186,103 | ) | (416,822 | ) | (247,416 | ) | |||||||||||||||||||||||||||||||||
| Net income |
$ | (906,000 | ) | $ | 82,961 | $ | (593,673 | ) | |||||||||||||||||||||||||||||||
39
Table of Contents
The Frontier Fund
6. Transactions with Affiliates
The Managing Owner contributes funds to the Trust in order to have a 1% interest in the aggregate capital, profits and losses of all Series and in return will receive units designated as general units in the Series in which the Managing Owner invests such funds. The general units may only be purchased by the Managing Owner and may be subject to no advisory fees or advisory fees at reduced rates. Otherwise, the general units hold the same rights as the limited units. The Managing Owner is required to maintain at least a 1% interest (“Minimum Purchase Commitment”) in the aggregate capital, profits and losses of all Series so long as it is acting as the Managing Owner of the Trust. Such contribution was made by the Managing Owner before trading commenced for the Trust and will be maintained throughout the existence of the Trust, and the Managing Owner will make such purchases as are necessary to effect this requirement. Additionally, the Managing Owner agreed with certain regulatory bodies to maintain a 1% interest specifically in the Balanced Series Class 1 a Units and Balanced Series Class 2a Units, aggregated, and each of the Long Only Commodity Series, Frontier Long/Short Commodity Series, Managed Futures Index Series, Frontier Diversified Series, Frontier Dynamic Series and Frontier Masters Series. The 1% interest in these specific Series is included in computing the Minimum Purchase Commitment in aggregate capital. In addition to the General Units the Managing Owner receives in respect of its Minimum Purchase Commitment, the Managing Owner may purchase Limited Units in any Series as a Limited Owner. Principals of the Managing Owner or affiliates are allowed to own beneficial interests in the Trust, as well. All Units purchased by the Managing Owner are held for investment purposes only and not for resale. The Managing Owner may make purchases or redemptions at any time on the same terms as any Limited Owner. The Trust has and will continue to have certain relationships with the Managing Owner and its affiliates.
The Balanced Series, in order to make investments in the Currency Series, Frontier Diversified Series, Frontier Dynamic Series and Frontier Masters Series, advances funds to such Series, for the purpose of investing in the respective Trading Company for such Series on behalf of the Balanced Series.
The following table summarizes the Balanced Series advances to and reductions from the Currency Series, Frontier Diversified Series, Frontier Dynamic Series and Frontier Masters Series of the Trust for the three months ending March 31, 2010.
Balanced Series
Summary by Quarter
2010
| Currency Series | Frontier Diversified Series |
Frontier Dynamic Series |
Frontier Masters Series |
Total | |||||||||||||
| Inter-series receivables January 1, 2010 |
$ | 12,266,758 | $ | 10,962,073 | $ | 27,676,116 | $ | 18,184,135 | $ | 69,089,082 | |||||||
| Additions during period |
— | — | — | — | — | ||||||||||||
| Reduction during period |
— | — | — | — | — | ||||||||||||
| Earnings on inter-series receivables |
329,038 | (102,443 | ) | (129,208 | ) | 125,024 | 222,411 | ||||||||||
| Inter-series receivables March 31, 2010 |
$ | 12,595,796 | $ | 10,859,630 | $ | 27,546,908 | $ | 18,309,159 | $ | 69,311,493 | |||||||
Each Series of Units pays to the Managing Owner a monthly management fee equal to a certain percentage of such Series’ assets, calculated on a daily basis. The annual rate of the management fee is 0.5% for the Balanced Series, 2.0% for the Winton Series, Currency Series, Long Only Commodity Series, Frontier Long/Short Commodity Series Class 1 a and Class 2a, Managed Futures Index Series, Frontier Diversified Series, Frontier Dynamic Series and Frontier Masters Series, 2.5% for the Winton/Graham Series and Campbell/Graham/Tiverton Series, and 3.5% for the Frontier Long/Short Commodity Series Class 1 and Class 2. The Managing Owner may pay all or a portion of such management fees to the Trading Advisor(s) for such Series.
40
Table of Contents
In connection with each Series’ trading activities, each Series of Units pays to the Managing Owner a monthly trading fee of up to 0.75% of such Series’ NAV annually.
Some Series pay to the Managing Owner an incentive fee of a certain percentage of new net trading profits generated by such Series, monthly or quarterly. Because the Balanced Series, Winton/Graham Series, Campbell/Graham/Tiverton Series, Currency Series and Frontier Long/Short Commodity Series may each employ multiple Trading Advisors, these Series will pay the Managing Owner a monthly incentive fee calculated on a Trading Advisor by Trading Advisor basis. It is therefore possible that in any given period the Balanced Series or the Frontier Long/Short Commodity Series may pay incentive fees to the Managing Owner for one or more Trading Advisors while each of these Series as a whole experiences losses. The incentive fee is 25% for the Balanced Series and the Frontier Diversified Series and 20% for the Winton Series Currency Series, Winton/Graham Series Campbell/Graham/Tiverton Series, Frontier Long/Short Commodity Series, Frontier Dynamic Series and Frontier Masters Series. There is no incentive fee for the Long Only Commodity Series or the Managed Futures Index Series. The Managing Owner may pay all or a portion of such incentive fees to the Trading Advisor(s) for such Series.
In addition, with respect to Class 1 and Class 1 a Units of each Series, as applicable, the Series pays monthly or quarterly to the Managing Owner a service fee at an annualized rate, as described in more detail above, which the Managing Owner pays to selling agents of the Trust. The following table summarizes fees earned by the Managing Owner three months ended March 31, 2010 and 2009.
| Series: Three Months Ended March 31, 2010 |
Management Fee | Trading Fee | Incentive Fee | Service Fee | |||||||||
| Frontier Diversified |
$ | 162,653 | $ | 440,692 | $ | 186,224 | $ | 238,169 | |||||
| Frontier Dynamic |
— | 166,373 | — | 20,650 | |||||||||
| Frontier Long/Short Commodity |
788,322 | 92,890 | 78,102 | 322,150 | |||||||||
| Frontier Masters |
202,282 | 299,172 | — | 109,428 | |||||||||
| Balanced |
357,992 | 420,281 | 953,481 | 2,103,922 | |||||||||
| Campbell/Graham/Tiverton |
581,891 | 92,520 | — | 491,969 | |||||||||
| Currency |
40,076 | 25,893 | — | 58,039 | |||||||||
| Long Only Commodity |
14,222 | 5,331 | — | 17,184 | |||||||||
| Managed Futures Index |
26,254 | 6,034 | — | 8,781 | |||||||||
| Winton |
376,880 | 70,214 | — | 352,366 | |||||||||
| Winton/Graham |
466,582 | 70,617 | — | 338,601 | |||||||||
| Series: Three Months Ended March 31, 2009 |
Management Fee | Trading Fee | Incentive Fee | Service Fee | |||||||||
| Frontier Diversified |
$ | — | $ | — | $ | — | $ | — | |||||
| Frontier Dynamic |
— | — | — | — | |||||||||
| Frontier Long/Short Commodity |
612,333 | 88,283 | 675,735 | 350,260 | |||||||||
| Frontier Masters |
— | — | — | — | |||||||||
| Balanced |
396,634 | 542,600 | 2,116,645 | 2,071,543 | |||||||||
| Campbell/Graham/Tiverton |
565,467 | 113,272 | (2,140 | ) | 525,404 | ||||||||
| Currency |
42,024 | 44,207 | — | 84,714 | |||||||||
| Long Only Commodity |
11,995 | 4,851 | — | 15,386 | |||||||||
| Managed Futures Index |
16,985 | 4,246 | — | 10,412 | |||||||||
| Winton |
390,305 | 97,591 | (21,347 | ) | 450,660 | ||||||||
| Winton/Graham |
277,272 | 55,514 | (5,804 | ) | 298,184 | ||||||||
41
Table of Contents
The following table summarizes fees payable to the Managing Owner as of March 31, 2010.
| Series: | Management Fee | Trading Fee | Incentive Fee | Service Fee | ||||||||
| Frontier Diversified |
$ | 29,044 | $ | 67,272 | $ | 184,448 | $ | 1,188 | ||||
| Frontier Dynamic |
— | 18,087 | — | — | ||||||||
| Frontier Long/Short Commodity |
52,202 | 6,445 | 54,927 | 42,018 | ||||||||
| Frontier Masters |
20,547 | 39,304 | 10,304 | 1,830 | ||||||||
| Balanced |
111,759 | 15,468 | 663,718 | 265,569 | ||||||||
| Campbell/Graham/Tiverton |
52,197 | 7,019 | — | 62,478 | ||||||||
| Currency |
5,475 | 3,309 | — | 11,520 | ||||||||
| Long Only Commodity |
4,948 | 1,790 | — | 5,460 | ||||||||
| Managed Futures Index |
10,403 | 2,375 | — | 2,248 | ||||||||
| Winton |
42,315 | 6,816 | — | 60,209 | ||||||||
| Winton/Graham |
48,855 | 7,118 | — | 47,858 | ||||||||
| The following table summarizes fees payable to the Managing Owner as of December 31, 2009. | ||||||||||||
| Series: | Management Fee | Trading Fee | Incentive Fee | Service Fee | ||||||||
| Frontier Diversified |
$ | 28,225 | $ | 73,768 | $ | 132,434 | $ | 607 | ||||
| Frontier Dynamic |
— | 28,591 | — | — | ||||||||
| Frontier Long/Short Commodity |
144,346 | 15,480 | 278,267 | 63,507 | ||||||||
| Frontier Masters |
29,929 | 40,976 | — | 1,313 | ||||||||
| Balanced |
208,736 | 103,317 | 1,306,596 | 85,599 | ||||||||
| Campbell/Graham/Tiverton |
94,011 | 17,084 | — | 86,041 | ||||||||
| Currency |
8,537 | 5,570 | — | 13,629 | ||||||||
| Long Only Commodity |
4,891 | 1,904 | — | 5,301 | ||||||||
| Managed Futures Index |
7,105 | 1,636 | — | 2,083 | ||||||||
| Winton |
63,259 | 13,271 | — | 74,866 | ||||||||
| Winton/Graham |
79,384 | 12,080 | — | 52,712 | ||||||||
With respect to the service fees, the initial service fee (for the first 12 months) relating to a sale of the Units is prepaid by the Managing Owner by each Series, and paid to the selling agents by the Managing Owner in the month following the sale. Since the Managing Owner is prepaying the initial service fee for the first year and is being reimbursed for such payment by the Series monthly in arrears based upon a corresponding percentage of NAV, it bears the risk of the downside and enjoys the benefit of the upside potential of any difference between the amount of the initial service fee prepaid by it and the amount of the reimbursement thereof which may result from variations in NAV over the following 12 months. For the three months ended March 31, 2010, due to variations in NAVs, amounts paid or payable to the Managing Owner for the difference in monthly service fees from the prepaid initial service fees was $236 for the Managed Futures Index Series, $3,785 for the Winton Series and $1,409 for the Frontier Masters Series. For the three months ended March 31, 2010, amounts received or receivable from the Managing Owner for the difference in monthly service fees from prepaid initial service fees was $26,014 for the Balanced Series, $42 for the Currency Series, $4,150 for the Winton/Graham Series, $1,844 for the Campbell/Graham/Tiverton Series, $6,777 for the Long Only Commodity Series, $156 for the Frontier Long/Short Commodity Series, $260 for the Frontier Diversified Series and $3,706 for the Frontier Dynamic Series.
42
Table of Contents
Aggregate interest income from all sources, including assets held at clearing brokers, up to 2% (annualized) is paid to the Managing Owner by the Balanced Series (Class 1 and Class 2 only), Campbell/Graham/Tiverton Series, Currency Series, Winton Series, and Winton/Graham Series. In addition, if interest rates fall below 0.75% (calculated daily based on each Series’ NAV), the Managing Owner will be paid the difference between the Trust’s annualized interest income allocated to the foregoing Series and 0.75%. For the Frontier Diversified Series, Frontier Dynamic Series, Frontier Long/Short Commodity Series, Frontier Masters Series, Balanced Series (Class 1 a and Class 2a only), Long Only Commodity Series and Managed Futures Index Series, 20% of the total interest allocated to each Series is paid to the Managing Owner. During the three months ended March 31, 2010 and March 31, 2009, the Trust paid $2,450,329 and $2,627,597, respectively of such interest income to the Managing Owner.
The Managing Owner pays to The Bornhoft Group Corporation, an affiliate of the Trust, a monthly fee of 0.25% (annualized) of the NAV of the Trust, for services in connection with the daily valuation of each Series and Class. The amount paid under this agreement was $458,095 and $396,399, respectively for the three months ended March 31, 2010 and 2009. Additionally, The Bornhoft Group Corporation provides office space to the Managing Owner, prorates office expenses, and advances certain direct expenses on behalf of the Managing Owner. Under this agreement, the Managing Owner reimbursed The Bornhoft Group Corporation $63,694 and $151,011, respectively for the three months ended March 31, 2010 and 2009.
Solon Capital, LLC, an affiliate of the Trust, provides product development and marketing services. For these services, the Managing Owner paid Solon Capital, LLC, $824,571and $713,519, respectively for the three months ended March 31, 2010 and 2009.
Equinox Distributors, Inc. (“EDI”), a wholly-owned subsidiary of the Managing Owner, served as wholesaler of the Trust until the termination of the agreement to provide such wholesaling services on April 21, 2009. Its results are consolidated with the results of the Managing Owner. On April 21, 2009, Bornhoft Group Securities Corporation, an affiliate of the Managing Owner, entered into an agreement to provide wholesaling services to the Trust.
7. Financial Highlights
The following information presents the financial highlights of the Fund for the three months ended March 31, 2010 and 2009. This data has been derived from information presented in the financial statements.
43
Table of Contents
| Frontier Diversified |
Frontier Dynamic | Frontier Long/Short | ||||||||||||||||||||||||||||||||||
| Class 1 | Class 2 | Class 1 | Class 2 | Class 1 | Class 2 | Class 3 | Class 1a | Class 2a | ||||||||||||||||||||||||||||
| Per unit operating performance (1) |
||||||||||||||||||||||||||||||||||||
| Net asset value, December 31, 2009 |
$ | 96.80 | $ | 97.77 | $ | 91.43 | $ | 92.25 | $ | 113.77 | $ | 127.49 | $ | 127.49 | $ | 101.49 | $ | 102.48 | ||||||||||||||||||
| Net operating results: |
||||||||||||||||||||||||||||||||||||
| Interest income |
0.56 | 0.57 | 10.01 | 10.12 | 0.35 | 0.39 | 0.39 | 0.31 | 0.31 | |||||||||||||||||||||||||||
| Expenses |
(1.59 | ) | (1.09 | ) | (17.33 | ) | (14.85 | ) | (2.39 | ) | (1.78 | ) | (1.78 | ) | (2.13 | ) | (1.42 | ) | ||||||||||||||||||
| Net gain/(loss) on investments, net of non-controlling interests |
(0.28 | ) | (0.39 | ) | 6.50 | 4.30 | (0.57 | ) | (0.61 | ) | (0.62 | ) | (0.36 | ) | (0.69 | ) | ||||||||||||||||||||
| Net income/(loss) |
(1.31 | ) | (0.91 | ) | (0.82 | ) | (0.43 | ) | (2.61 | ) | (2.00 | ) | (2.01 | ) | (2.18 | ) | (1.80 | ) | ||||||||||||||||||
| Net asset value, March 31, 2010 |
$ | 95.49 | $ | 96.86 | $ | 90.61 | $ | 91.82 | $ | 111.16 | $ | 125.49 | $ | 125.48 | $ | 99.31 | $ | 100.68 | ||||||||||||||||||
| Ratios to average net assets (3) |
||||||||||||||||||||||||||||||||||||
| Net investment gain/(loss) |
-4.41 | % | -2.22 | % | -32.76 | % | -20.93 | % | -7.52 | % | -4.54 | % | -4.54 | % | -7.52 | % | -4.54 | % | ||||||||||||||||||
| Expenses before incentive fees |
5.73 | % | 3.54 | % | 77.49 | % | 65.66 | % | 8.32 | % | 5.34 | % | 5.34 | % | 8.32 | % | 5.34 | % | ||||||||||||||||||
| Expenses after incentive fees |
6.82 | % | 4.63 | % | 77.49 | % | 65.66 | % | 8.79 | % | 5.81 | % | 5.81 | % | 8.79 | % | 5.81 | % | ||||||||||||||||||
| Total return before incentive fees (2) |
0.01 | % | -0.35 | % | -0.95 | % | -0.26 | % | -2.58 | % | -1.54 | % | 0.13 | % | -1.00 | % | -0.20 | % | ||||||||||||||||||
| Total return after incentive fees (2) |
-0.26 | % | -0.62 | % | -0.95 | % | -0.26 | % | -2.70 | % | -1.66 | % | 0.01 | % | -1.12 | % | -0.32 | % | ||||||||||||||||||
| Frontier Masters |
Balanced | Campbell/ Graham/Tiverton |
||||||||||||||||||||||||||||||||||
| Class 1 | Class 2 | Class 1 | Class 1a | Class 2 | Class 2a | Class 3a | Class 1 | Class 2 | ||||||||||||||||||||||||||||
| Per unit operating performance (1) |
||||||||||||||||||||||||||||||||||||
| Net asset value, December 31, 2009 |
$ | 94.46 | $ | 95.37 | $ | 118.54 | $ | 105.50 | $ | 139.01 | $ | 117.60 | $ | 117.60 | $ | 104.65 | $ | 121.10 | ||||||||||||||||||
| Net operating results: |
||||||||||||||||||||||||||||||||||||
| Interest income |
0.58 | 0.59 | 0.07 | 0.06 | 0.08 | 0.06 | 0.06 | (0.00 | ) | (0.00 | ) | |||||||||||||||||||||||||
| Expenses |
(1.95 | ) | (1.40 | ) | (1.40 | ) | (1.25 | ) | (0.65 | ) | (0.55 | ) | (0.55 | ) | (1.65 | ) | (1.04 | ) | ||||||||||||||||||
| Net gain/(loss) on investments, net of non-controlling interests |
1.61 | 1.47 | 0.60 | 0.35 | 0.74 | 0.42 | 0.43 | (1.75 | ) | (2.03 | ) | |||||||||||||||||||||||||
| Net income/(loss) |
0.24 | 0.66 | (0.73 | ) | (0.84 | ) | 0.17 | (0.07 | ) | (0.06 | ) | (3.40 | ) | (3.07 | ) | |||||||||||||||||||||
| Net asset value, March 31, 2010 |
$ | 94.70 | $ | 96.03 | $ | 117.81 | $ | 104.66 | $ | 139.18 | $ | 117.53 | $ | 117.54 | $ | 101.25 | $ | 118.03 | ||||||||||||||||||
| Ratios to average net assets (3) |
||||||||||||||||||||||||||||||||||||
| Net investment gain/(loss) |
-5.96 | % | -3.51 | % | -4.71 | % | -4.71 | % | -1.71 | % | -1.71 | % | -1.71 | % | -6.62 | % | -3.62 | % | ||||||||||||||||||
| Expenses before incentive fees |
8.50 | % | 6.05 | % | 3.87 | % | 3.87 | % | 0.87 | % | 0.87 | % | 0.87 | % | 6.61 | % | 3.61 | % | ||||||||||||||||||
| Expenses after incentive fees |
8.50 | % | 6.05 | % | 4.94 | % | 4.94 | % | 1.94 | % | 1.94 | % | 1.94 | % | 6.61 | % | 3.61 | % | ||||||||||||||||||
| Total return before incentive fees (2) |
0.88 | % | 1.86 | % | -0.43 | % | -0.96 | % | 0.25 | % | 0.08 | % | 1.77 | % | -3.41 | % | -2.78 | % | ||||||||||||||||||
| Total return after incentive fees (2) |
0.88 | % | 1.86 | % | -0.69 | % | -1.22 | % | -0.01 | % | -0.18 | % | 1.50 | % | -3.41 | % | -2.78 | % | ||||||||||||||||||
| Currency | Long Only | Managed Futures Index |
Winton | Winton/Graham | ||||||||||||||||||||||||||||||||||||
| Class 1 | Class 2 | Class 1 | Class 2 | Class 1 | Class 2 | Class 1 | Class 2 | Class 1 | Class 2 | |||||||||||||||||||||||||||||||
| Per unit operating performance (1) |
||||||||||||||||||||||||||||||||||||||||
| Net asset value, December 31, 2009 |
$ | 78.00 | $ | 91.34 | $ | 83.59 | $ | 90.30 | $ | 112.54 | $ | 121.28 | $ | 117.57 | $ | 130.10 | $ | 110.06 | $ | 128.39 | ||||||||||||||||||||
| Net operating results: |
||||||||||||||||||||||||||||||||||||||||
| Interest income |
0.32 | 0.38 | 0.42 | 0.46 | 0.25 | 0.27 | 0.06 | 0.06 | 0.15 | 0.18 | ||||||||||||||||||||||||||||||
| Expenses |
(1.15 | ) | (0.67 | ) | (0.76 | ) | (0.39 | ) | (1.29 | ) | (0.79 | ) | (1.79 | ) | (1.01 | ) | (1.77 | ) | (1.16 | ) | ||||||||||||||||||||
| Net gain/(loss) on investments, net of non-controlling interests |
2.33 | 2.74 | (3.05 | ) | (3.31 | ) | 0.04 | 0.04 | 7.51 | 8.36 | 1.03 | 1.24 | ||||||||||||||||||||||||||||
| Net income/(loss) |
1.50 | 2.45 | (3.39 | ) | (3.24 | ) | (1.00 | ) | (0.48 | ) | 5.78 | 7.41 | (0.59 | ) | 0.26 | |||||||||||||||||||||||||
| Net asset value, March 31, 2010 |
$ | 79.50 | $ | 93.79 | $ | 80.20 | $ | 87.06 | $ | 111.54 | $ | 120.80 | $ | 123.35 | $ | 137.51 | $ | 109.47 | $ | 128.65 | ||||||||||||||||||||
| Ratios to average net assets (3) |
||||||||||||||||||||||||||||||||||||||||
| Net investment gain/(loss) |
-4.28 | % | -1.28 | % | -1.68 | % | 0.32 | % | -3.75 | % | -1.75 | % | -5.94 | % | -2.94 | % | -6.20 | % | -3.20 | % | ||||||||||||||||||||
| Expenses before incentive fees |
5.97 | % | 2.97 | % | 3.81 | % | 1.80 | % | 4.65 | % | 2.64 | % | 6.14 | % | 3.14 | % | 6.77 | % | 3.77 | % | ||||||||||||||||||||
| Expenses after incentive fees |
5.97 | % | 2.97 | % | 3.81 | % | 1.80 | % | 4.65 | % | 2.64 | % | 6.14 | % | 3.14 | % | 6.77 | % | 3.77 | % | ||||||||||||||||||||
| Total return before incentive fees (2) |
1.89 | % | 1.89 | % | -4.31 | % | -3.67 | % | -0.89 | % | -1.69 | % | 4.84 | % | 5.50 | % | -0.65 | % | 0.18 | % | ||||||||||||||||||||
| Total return after incentive fees (2) |
1.89 | % | 1.89 | % | -4.31 | % | -3.67 | % | -0.89 | % | -1.69 | % | 4.84 | % | 5.50 | % | -0.65 | % | 0.18 | % | ||||||||||||||||||||
| (1) | Interest income and expenses per unit are calculated by dividing these amounts by the weighted average number of units outstanding during the period. The net gain/(loss) on investments, net of minority interests is a balancing amount necessary to reconcile the change in net asset value per unit with the other per unit information. |
| (2) | Computed using weighted average net assets outstanding during the period. An owner’s total returns may vary from the above returns based on the timing of contributions and withdrawals. Total returns are not annualized. |
| (3) | Annualized |
44
Table of Contents
| Balanced | Winton | |||||||||||||||||||||||
| Class 1 | Class 1a | Class 2 | Class 2a | Class 1 | Class 2 | |||||||||||||||||||
| Per unit operating performance (1) |
||||||||||||||||||||||||
| Net asset value, December 31, 2008 |
$ | 125.17 | $ | 112.09 | $ | 142.44 | $ | 121.30 | $ | 130.41 | $ | 140.04 | ||||||||||||
| Net operating results: |
||||||||||||||||||||||||
| Interest income |
0.04 | 0.03 | 0.04 | 0.03 | 0.37 | 0.39 | ||||||||||||||||||
| Expenses |
(2.02 | ) | (1.81 | ) | (1.24 | ) | (1.06 | ) | (1.79 | ) | (0.90 | ) | ||||||||||||
| Net gain/(loss) on investments, net of minority interests |
2.02 | 1.55 | 2.30 | 1.67 | (1.55 | ) | (1.67 | ) | ||||||||||||||||
| Net income |
0.04 | (0.23 | ) | 1.10 | 0.65 | (2.98 | ) | (2.18 | ) | |||||||||||||||
| Net asset value, March 31, 2009 |
$ | 125.21 | $ | 111.86 | $ | 143.54 | $ | 121.95 | $ | 127.43 | $ | 137.86 | ||||||||||||
| Ratios to average net assets (3) |
||||||||||||||||||||||||
| Net investment gain/(loss) |
-6.38 | % | -6.38 | % | -3.38 | % | -3.38 | % | -4.46 | % | -1.47 | % | ||||||||||||
| Expenses before incentive fees |
4.07 | % | 4.07 | % | 1.07 | % | 1.07 | % | 5.72 | % | 2.72 | % | ||||||||||||
| Expenses after incentive fees |
6.49 | % | 6.49 | % | 3.49 | % | 3.49 | % | 5.60 | % | 2.60 | % | ||||||||||||
| Total return before incentive fees (2) |
0.53 | % | 0.23 | % | 1.22 | % | 0.86 | % | -2.28 | % | -1.59 | % | ||||||||||||
| Total return after incentive fees (2) |
-0.07 | % | -0.37 | % | 0.63 | % | 0.26 | % | -2.25 | % | -1.56 | % | ||||||||||||
| Campbell/Graham/ Tiverton |
Currency | Winton/Graham | ||||||||||||||||||||||
| Class 1 | Class 2 | Class 1 | Class 2 | Class 1 | Class 2 | |||||||||||||||||||
| Per unit operating performance (1) |
||||||||||||||||||||||||
| Net asset value, December 31, 2008 |
$ | 110.54 | $ | 124.14 | $ | 96.19 | $ | 109.30 | $ | 116.18 | $ | 131.49 | ||||||||||||
| Net operating results: |
||||||||||||||||||||||||
| Interest income |
0.20 | 0.22 | 0.12 | 0.14 | 0.21 | 0.24 | ||||||||||||||||||
| Expenses |
(1.75 | ) | (1.05 | ) | (1.25 | ) | (0.64 | ) | (1.54 | ) | (0.78 | ) | ||||||||||||
| Net gain/(loss) on investments, net of minority interests |
(1.36 | ) | (1.54 | ) | (4.43 | ) | (5.05 | ) | (1.73 | ) | (1.96 | ) | ||||||||||||
| Net income |
(2.91 | ) | (2.37 | ) | (5.56 | ) | (5.55 | ) | (3.06 | ) | (2.50 | ) | ||||||||||||
| Net asset value, March 31, 2009 |
$ | 107.63 | $ | 121.77 | $ | 90.63 | $ | 103.75 | $ | 113.12 | $ | 128.99 | ||||||||||||
| Ratios to average net assets (3) |
||||||||||||||||||||||||
| Net investment gain/(loss) |
-5.71 | % | -2.71 | % | -4.92 | % | -1.92 | % | -4.67 | % | -1.68 | % | ||||||||||||
| Expenses before incentive fees |
6.46 | % | 3.46 | % | 5.45 | % | 2.45 | % | 5.45 | % | 2.46 | % | ||||||||||||
| Expenses after incentive fees |
6.44 | % | 3.44 | % | 5.45 | % | 2.45 | % | 5.41 | % | 2.42 | % | ||||||||||||
| Total return before incentive fees (2) |
-2.66 | % | -2.24 | % | -5.94 | % | -5.22 | % | -2.92 | % | -1.91 | % | ||||||||||||
| Total return after incentive fees (2) |
-2.66 | % | -2.24 | % | -5.94 | % | -5.22 | % | -2.91 | % | -1.90 | % | ||||||||||||
| Long Only Commodity |
Long/Short Commodity |
Managed Futures Index |
||||||||||||||||||||||
| Class 1 | Class 2 | Class 1 | Class 2 | Class 1 | Class 2 | |||||||||||||||||||
| Per unit operating performance (1) |
||||||||||||||||||||||||
| Net asset value, December 31, 2008 |
$ | 70.31 | $ | 74.46 | $ | 100.39 | $ | 109.28 | $ | 132.18 | $ | 139.70 | ||||||||||||
| Net operating results: |
||||||||||||||||||||||||
| Interest income |
0.32 | 0.34 | 0.64 | 0.69 | 0.53 | 0.56 | ||||||||||||||||||
| Expenses |
(0.61 | ) | (0.30 | ) | (3.14 | ) | (2.60 | ) | (1.41 | ) | (0.82 | ) | ||||||||||||
| Net gain/(loss) on investments, net of minority interests |
(3.98 | ) | (4.22 | ) | 6.26 | 6.83 | (7.62 | ) | (8.11 | ) | ||||||||||||||
| Net income |
(4.27 | ) | (4.18 | ) | 3.75 | 4.92 | (8.50 | ) | (8.37 | ) | ||||||||||||||
| Net asset value, March 31, 2009 |
$ | 66.04 | $ | 70.28 | $ | 104.14 | $ | 114.20 | $ | 123.68 | $ | 131.33 | ||||||||||||
| Ratios to average net assets (3) |
||||||||||||||||||||||||
| Net investment gain/(loss) |
-1.78 | % | 0.21 | % | -9.89 | % | -6.89 | % | -2.77 | % | -0.77 | % | ||||||||||||
| Expenses before incentive fees |
3.74 | % | 1.75 | % | 7.78 | % | 4.78 | % | 4.46 | % | 2.46 | % | ||||||||||||
| Expenses after incentive fees |
3.74 | % | 1.75 | % | 12.39 | % | 9.40 | % | 4.46 | % | 2.46 | % | ||||||||||||
| Total return before incentive fees (2) |
-6.43 | % | -5.76 | % | 4.76 | % | 5.51 | % | -6.49 | % | -6.36 | % | ||||||||||||
| Total return after incentive fees (2) |
-6.43 | % | -5.76 | % | 3.63 | % | 4.38 | % | -6.49 | % | -6.36 | % | ||||||||||||
| (1) | Interest income and expenses per unit are calculated by dividing these amounts by the weighted average number of units outstanding during the period. The net gain/(loss) on investments, net of minority interests is a balancing amount necessary to reconcile the change in net asset value per unit with the other per unit information. |
| (2) | Computed using weighted average net assets outstanding during the period. An owner’s total returns may vary from the above returns based on the timing of contributions and withdrawals. Total returns are not annualized. |
| (3) | Annualized |
45
Table of Contents
8. Derivative Instruments and Hedging Activities
The Trust’s primary business is to engage in speculative trading of a diversified portfolio of futures, forwards (including interbank foreign currencies), options contracts and other derivative instruments (including swap contracts). It does not enter into or hold positions for hedging purposes as defined under ASC 815. The detail of the fair value of the Trust’s derivatives by instrument types as of March 31, 2010 is included in the Condensed Schedules of Investments. See Note 4 for further disclosure related to the Trust’s positions in swap contracts. For the three months ended March 31, 2010, the monthly average of futures contracts bought for the Trust was approximately 272,500 and sold for the Trust was approximately 224,000. The following tables summarize the trading revenues for the three months ended March 31, 2010 and March 31, 2009 approximately by sector:
Realized Trading Revenue from Futures, Forwards and Options
for the Three Months Ended March 31, 2010 (1)
| Type of contract |
Frontier Diversified Series |
Frontier Long/Short Series |
Balanced Series | |||||||||
| Metals |
$ | 258,000 | $ | 334,220 | $ | 374,458 | ||||||
| Currencies |
166,672 | 619,216 | (1,298,920 | ) | ||||||||
| Energies |
(49,028 | ) | (32,272,413 | ) | (1,598,523 | ) | ||||||
| Agriculturals |
(329,169 | ) | 6,407,717 | 762,699 | ||||||||
| Interest rates |
189,130 | (497,654 | ) | 856,573 | ||||||||
| Stock indices |
(7,226 | ) | 1,379,261 | (1,602,605 | ) | |||||||
| Realized trading income/(loss)(2) |
$ | 228,379 | $ | (24,029,653 | ) | $ | (2,506,318 | ) | ||||
| Type of contract |
Campbell/Graham/ Tiverton Series |
Currency Series | Winton/Graham Series |
|||||||||
| Metals |
$ | (835,404 | ) | $ | — | $ | (113,313 | ) | ||||
| Currencies |
(120,581 | ) | 53,107 | (331,781 | ) | |||||||
| Energies |
(235,518 | ) | — | (428,330 | ) | |||||||
| Agriculturals |
159,729 | — | (805,010 | ) | ||||||||
| Interest rates |
1,647,114 | — | 285,564 | |||||||||
| Stock indices |
(453,971 | ) | — | (2,028,874 | ) | |||||||
| Realized trading income/(loss)(2) |
$ | 161,369 | $ | 53,107 | $ | (3,421,744 | ) | |||||
46
Table of Contents
Net Change in Open Trade Equity from Futures, Forwards and Options
for the Three Months Ended March 31, 2010 (1)
| Type of contract |
Frontier Diversified Series |
Frontier Long/Short Series |
Balanced Series | |||||||||
| Metals |
$ | 51,877 | $ | 282,667 | $ | (4,830,625 | ) | |||||
| Currencies |
(702,063 | ) | (69,820 | ) | 993,140 | |||||||
| Energies |
279,557 | 24,029,704 | 1,109,173 | |||||||||
| Agriculturals |
17,063 | (5,585,339 | ) | (2,100,138 | ) | |||||||
| Interest rates |
(31,191 | ) | (201,571 | ) | 3,153,317 | |||||||
| Stock indices |
87,858 | 31,629 | (1,639,573 | ) | ||||||||
| Unrealized trading income/(loss)(3) |
$ | (296,899 | ) | $ | 18,487,270 | $ | (3,314,706 | ) | ||||
| Type of contract |
Campbell/Graham/ Tiverton Series |
Currency Series |
Winton/Graham Series |
|||||||||
| Metals |
$ | 82,658 | $ | — | $ | (476,149 | ) | |||||
| Currencies |
(114,470 | ) | 45,474 | 871,782 | ||||||||
| Energies |
44,851 | — | 291,161 | |||||||||
| Agriculturals |
(8,737 | ) | — | 18,075 | ||||||||
| Interest rates |
798,468 | — | 369,020 | |||||||||
| Stock indices |
(318,961 | ) | — | 136,322 | ||||||||
| Unrealized trading income/(loss)(3) |
$ | 483,809 | $ | 45,474 | $ | 1,210,211 | ||||||
| (1) | The Frontier Diversified Series, Frontier Masters Series, Campbell/Graham/Tiverton Series, Winton Series and Managed Futures Index Series participate in trading activities through equity in earnings/(loss) from trading companies. The Long Only Commodity Series participates in trading activities through realized gain/(loss) on swap contracts. Long/Short Series deconsolidated Frontier Trading Company VII, LLC as of January 30, 2010, and thereafter participates in trading activities through equity in earnings(loss) from the trading company. Balanced Series deconsolidated Frontier Trading Company VI, LLC, XIII, LLC and XIV, LLC as of March 22, 2010, January 4, 2010 and January 26, 2010, respectively, and thereafter participates in trading activities through equity in earnings(loss) from the trading companies. |
| (2) | In the Statements of Operations under Net realized gain(loss) on futures and forwards. |
| (3) | In the Statements of Operations under Net change in open trade equity. |
47
Table of Contents
Realized Trading Revenue from Futures, Forwards and Options
for the Three Months Ended March 31, 2009 (1)
| Type of contract |
Frontier Long/Short Series |
Balanced Series | Campbell/Graham/ Tiverton Series |
|||||||||
| Metals |
$ | (2,530,654 | ) | $ | 3,158,520 | $ | 140,834 | |||||
| Currencies |
376,634 | 2,319,036 | (590,804 | ) | ||||||||
| Energies |
(2,150,832 | ) | (3,011,667 | ) | 205,049 | |||||||
| Agriculturals |
(571,687 | ) | 4,294,327 | (323,855 | ) | |||||||
| Interest rates |
87,258 | (6,604,058 | ) | 236,683 | ||||||||
| Stock indices |
298,079 | 12,260,442 | (315,731 | ) | ||||||||
| Realized trading income/(loss)(2) |
$ | (4,491,202 | ) | $ | 12,416,600 | $ | (647,824 | ) | ||||
| Type of contract |
Currency Series | Winton Series | ||||||||||
| Metals |
$ | — | $ | 158,876 | ||||||||
| Currencies |
35,441 | (519,739 | ) | |||||||||
| Energies |
— | 326,673 | ||||||||||
| Agriculturals |
— | (18,023 | ) | |||||||||
| Interest rates |
— | 737,302 | ||||||||||
| Stock indices |
— | 471,486 | ||||||||||
| Realized trading income/(loss)(2) |
$ | 35,441 | $ | 1,156,575 | ||||||||
48
Table of Contents
Net Change in Open Trade Equity from Futures, Forwards and Options
for the Three Months Ended March 31, 2009(1)
| Type of contract |
Frontier Long/ Short Series |
Balanced Series | Campbell/Graham/ Tiverton Series |
|||||||||
| Metals |
$ | 2,937,692 | $ | (5,751,066 | ) | $ | 192,288 | |||||
| Currencies |
(26,155 | ) | (6,071,909 | ) | (95,636 | ) | ||||||
| Energies |
10,677,761 | (277,526 | ) | (2,143 | ) | |||||||
| Agriculturals |
1,849,323 | 227,496 | (42,618 | ) | ||||||||
| Interest rates |
977 | (1,762,726 | ) | (305,210 | ) | |||||||
| Stock indices |
351,034 | 1,165,202 | 67,216 | |||||||||
| Unrealized trading income/(loss)(3) |
$ | 15,790,632 | $ | (12,470,529 | ) | $ | (186,103 | ) | ||||
| Type of contract |
Currency Series | Winton Series | ||||||||||
| Metals |
$ | — | $ | (4,058,434 | ) | |||||||
| Currencies |
(150,507 | ) | 7,599,199 | |||||||||
| Energies |
— | 151,499 | ||||||||||
| Agriculturals |
— | 1,143,515 | ||||||||||
| Interest rates |
— | (7,677,706 | ) | |||||||||
| Stock indices |
— | 464,095 | ||||||||||
| Unrealized trading income/(loss)(3) |
$ | (150,507 | ) | $ | (2,377,832 | ) | ||||||
| (1) | Winton/Graham Series and Managed Futures Index Series participate in trading activities through equity in earnings/(loss) from trading companies. |
The Long Only Commodity Series participates in trading activities through realized gain/(loss) on swap contracts.
| (2) | In the Statements of Operations under Net realized gain(loss) on futures and forwards. |
| (3) | In the Statements of Operations under Net change in open trade equity. |
49
Table of Contents
9. Trading Activities and Related Risks
The purchase and sale of futures and options on futures contracts require margin deposits with Futures Commission Merchants (each, an “FCM”). Additional deposits may be necessary for any loss on contract value. The Commodity Exchange Act requires an FCM to segregate all customer transactions and assets from the FCM’s proprietary activities. A customer’s cash and other property (for example, U.S. Treasury bills) deposited with an FCM are considered commingled with all other customer funds subject to the FCM’s segregation requirements. In the event of an FCM’s insolvency, recovery may be limited to a pro rata share of segregated funds available. It is possible that the recovered amount could be less than the total of cash and other property deposited.
The term “off-balance sheet risk” refers to an unrecorded potential liability that, even though it does not appear on the Statement of Financial Condition, may result in future obligation or loss in excess of the amount paid by the Series for a particular investment. Each Trading Company expects to trade in futures, options, forward and swap contracts and will therefore be a party to financial instruments with elements of off-balance sheet market and credit risk. In entering into these contracts, there exists a market risk that such contracts may be significantly influenced by market conditions, such as interest rate volatility, resulting in such contracts being less valuable. If the markets should move against all of the futures positions held by a Trading Company in respect of any Series at the same time, and if the Trading Advisor(s) of such Trading Company are unable to offset such futures interests positions, such Trading Company could lose all of its assets and the holders of Units of such Series would realize a 100% loss. The Managing Owner will seek to minimize market risk through real-time monitoring of open positions and the level of diversification of each Trading Advisor’s portfolio. It is anticipated that any Trading Advisor’s margin-to-equity ratio will typically not exceed approximately 35% although the actual ratio could be higher or lower from time to time.
In addition to market risk, trading futures, forward and swap contracts entails credit risk in that a counterparty will not be able to meet its obligations to a Trading Company. The counterparty for futures contracts traded in the United States and on most foreign exchanges is the clearinghouse associated with such exchange. In general, clearinghouses are backed by the corporate members of the clearinghouse who are required to share any financial burden resulting from the non-performance by one of their members and, as such, should significantly reduce this credit risk. In cases where the clearinghouse is not backed by the clearing members, like some foreign exchanges, it is normally backed by a consortium of banks or other financial institutions. Some non-U.S. exchanges, in contrast to U.S. exchanges, are principals’ markets in which performance is the responsibility only of the individual counterparty with whom the Trading Company has entered into the transaction, and not of the exchange or clearing corporation. In these kinds of markets, there is risk of bankruptcy or other failure or refusal to perform by the counterparty.
In the case of forward contracts traded on the interbank market and swaps, neither is traded on exchanges. The counterparty is generally a single bank or other financial institution, rather than a group of financial institutions; thus there may be a greater counterparty credit risk. The Managing Owner expects the Trading Advisors to trade only with those counterparties which it believes to be creditworthy. All positions of each Trading Company will be valued each day on a mark-to-market basis. There can be no assurance that any clearing member, clearinghouse or other counterparty will be able to meet its obligations to any Trading Company.
The Managing Owner has established procedures to actively monitor and minimize market and credit risks. The Limited Owners bear the risk of loss only to the extent of the market value of their respective investments and, in certain specific circumstances, distributions and redemptions received.
10. Indemnifications
The Trust has entered into agreements, which provide for the indemnification of futures clearing brokers, currency trading companies, and commodity trading advisors, among others, against losses, costs, claims and liabilities arising from the performance of their individual obligations under such agreements, except for gross negligence or bad faith. The Trust has had no prior claims or payments pursuant to these agreements. The Trust’s individual maximum exposure under these arrangements is unknown, as this would involve future claims that may be made against the Trust that have not yet occurred. However, based on experience the Trust expects the risk of loss to be remote.
50
Table of Contents
11. Subsequent Events
The Trust has evaluated the need to disclose events subsequent to the balance sheet date through the filing date of this 10-Q and have the following events to report:
None.
| Item 2. | MANAGEMENT’S DISCUSSION AND ANALYSIS OF FINANCIAL CONDITION AND RESULTS OF OPERATIONS |
Introduction
The following discussion and tables should be read in conjunction with our unaudited consolidated financial statements and notes thereto included in this quarterly report and our 2009 Annual Report on Form 10-K for the year ended December 31, 2009.
Overview
The Frontier Fund (the “Trust”), is a Delaware statutory trust formed on August 8, 2003. The Trust is a multi-advisor commodity pool, as described in CFTC Regulation § 4.1 0(d)(2). The Trust is authorized to issue multiple Series of Units, pursuant to the requirements of the Trust Act. The assets of each Series are held and accounted for in separate and distinct records separately from the assets of other Series. The Trust is managed by the Managing Owner, and its term will expire on December 31, 2053 (unless terminated earlier in certain circumstances).
The Trust, with respect to each Series of Units, engages in the speculative trading of a diversified portfolio of futures, forward (including interbank foreign currencies) and options contracts and other derivative instruments (including Swaps) and may, from time to time, engage in cash and spot transactions and allocates funds to an affiliated limited liability trading company (each a “Trading Company”). Each Trading Company has one-year renewable contracts with its own independent Trading Advisor(s) that will manage all or a portion of the applicable Trading Company’s assets, and make the trading decisions for the assets of each Series vested in such Trading Company (other than the Frontier Dynamic and the Long Only Commodity Series which allocate assets only to Swaps). The assets of each Trading Company will be segregated from the assets of each other Trading Company. The Trust has an investment objective of increasing the value of the Units over the long term (capital appreciation), while controlling risk and volatility; further, to offer exposure to the investment programs of individual Trading Advisors and to specific instruments (currencies).
As of March 31, 2010 the Trust had eleven separate Series of Units issued and outstanding: the Frontier Diversified Series, Frontier Dynamic Series, Frontier Long/Short Commodity Series, Frontier Masters Series, Balanced Series, Campbell/Graham/Tiverton Series, Currency Series, Long Only Commodity Series, Managed Futures Index Series, Winton Series and Winton/Graham Series. Each Series of Units has between three and six separate classes issued and/or outstanding—Class 1, Class 2, Class 3, Class 1a, Class 2a, and Class 3a.
Critical Accounting Policies and Estimates
The financial statements of the Trust in this Quarterly Report on Form 10-Q have not been audited by an independent registered public accounting firm, but in the opinion of management, reflect all adjustments necessary for a fair presentation of the Trust’s financial position and results of operations. The financial statements have been prepared in accordance with accounting principles generally accepted in the United States of America (“GAAP”). These interim financial statements have been prepared in accordance with the instructions to Form 10-Q and Rule 10-01 of Regulation S-X and serve to update the Trust’s 2009 Annual Report on Form 10-K (“Form 10-K”). These financial statements do not include all of the information and notes necessary to constitute a complete set of financial statements under GAAP applicable to annual periods. Accordingly, they should be read in conjunction with the financial information contained in the Form 10-K. In the opinion of management, all adjustments necessary for a fair presentation have been included. The results of operations for the interim periods disclosed herein are not necessarily indicative of results that may be expected for the full year or any future period.
51
Table of Contents
The Trust’s critical accounting policies and related estimates and judgments underlying the financial statements are as identified below.
Investment and Swap Transactions and Valuation—The Trust records investment transactions on a trade date basis and all investments are recorded at fair value in its financial statements, with changes in fair value reported as a component of Trading Profits (Losses) and unrealized equity in earnings on investments in each Series in the Statements of Operations. Generally, fair values are based on quoted market prices; however, in certain circumstances, significant judgments and estimates may be required in determining fair value in the absence of an active market closing price.
Allocation of Trading Profits or Losses—Each Series of the Trust has three or six classes of Units – Class 1, Class 2, Class 3, Class 1a, Class 2a and Class 3a). All classes have identical voting, dividend, liquidation and other rights and the same terms and conditions, except that Class 1 and 1 a Units of each Series bear certain expenses related to the servicing of such Units. Revenues, expenses (other than expenses attributable to a specific class), and realized and unrealized trading profits and losses of each Series are allocated daily to Class 1, Class 1a, Class 2, Class 2a, Class 3 and Class 3a Units based on each Class’ respective owners’ capital balances.
Each Series allocates funds to a Trading Company, or Trading Companies, which allocate all of their daily trading profits or losses to the Series in proportion to each Series’ funds allocated to the Trading Company, adjusted on a daily basis. As of March 31, 2010, the value of all open contracts and cash held at clearing brokers is similarly allocated to the Series in proportion to each Series’ funds allocated to the Trading Company, or Trading Companies.
Interest Income—Interest income from all sources, including assets held at clearing brokers and cash and cash equivalents held at banks, is aggregated and allocated across all Series in proportion to their daily NAV, including the effects of inter-series advances and excluding non-controlling interests.
In applying these policies, the Managing Owner may make judgments that can frequently require estimates about matters that are inherently uncertain.
Investment Transactions and Valuation
The Managing Owner has evaluated the nature and type of transactions processed and estimates that it makes in preparing the Trust’s financial statements and related disclosures and has adopted ASC 820, and implemented the framework for measuring fair value for assets and liabilities.
The Trust utilizes valuation techniques that are consistent with the market approach per the requirement of ASC 820 for the valuation of futures (exchange traded) contracts, currencies, forward (non-exchange traded) contracts, swap contracts and other non- cash assets. The market approach uses prices and other relevant information generated by market transactions involving identical or comparable assets or liabilities. The Trust applies the valuation techniques in a consistent manner for each asset or liability. The Trust records all investments at fair value in its Statement of Financial Condition, with changes in fair value reported as a component of realized and unrealized gain/(loss) on investments in the Statements of Operations.
Inputs to valuation techniques refer to the assumptions that market participants would use in pricing the assets or liabilities. Inputs may be observable, meaning those that reflect the assumptions market participants would use in pricing the financial asset or liability based on market data obtained from independent sources, or unobservable, meaning those that reflect the reporting entity’s own assumptions about the assumptions market participants would use in pricing the financial asset or liability based on the best information available in the circumstances.
In addition, the Trust monitors counterparty credit risk and incorporates any identified risk factors when assigning input levels to underlying financial assets or liabilities. In that regard ASC 820 establishes a fair value hierarchy for valuation inputs that gives the highest priority to quoted prices in active markets for identical financial assets and the lowest priority to unobservable inputs. A full disclosure of the fair value hierarchy is presented in Note 3 of the financial statements—Fair Value Measurements.
52
Table of Contents
Custom Time Deposits and Certificates of Deposit
Custom time deposits and certificates of deposit are allocated to each Series based on the Series’ percentage ownership in the pooled cash management assets as of the reporting date. The Trust values the custom time deposits at face value plus accrued interest as it is considered a deposit account under paragraph 7.23 of the Investment Company Audit Guide, and accordingly, this deposit is not subject to fair value measurements under ASC 820. The Trust values the certificates of deposit at face value plus accrued interest and reports these instruments as Level 2 inputs under ASC 820.
Liquidity and Capital Resources
The Trust will raise additional capital only through the sale of Units offered pursuant to the continuing offering, and does not intend to raise any capital through borrowing. Due to the nature of the Trust’s business, it makes no capital expenditures and has no capital assets that are not operating capital or assets.
The Managing Owner is responsible for the payment of all of the ordinary expenses associated with the organization of the Trust and the offering of each Series of Units, except for the initial and ongoing service fee, if any, and no Series will be required to reimburse these expenses. As a result, 100% of each Series’ offering proceeds are initially available for that Series’ trading activities.
A portion of each Trading Company’s assets is used as margin to maintain that Trading Company’s forward currency contract positions, and another portion is deposited in cash in segregated accounts in the name of each Trading Company maintained for each Trading Company at the clearing brokers in accordance with CFTC segregation requirements. At March 31, 2010, cash deposited at the clearing brokers was $1,313,431 for the Frontier Diversified Series, $58,389,722 for the Balanced Series, $10,960,925 for the Campbell/Graham/Tiverton Series, $792,732 for the Currency Series and $15,859,715 for the Winton/Graham Series. At December 31, 2009, cash deposited at the clearing brokers was $23,781,708 for the Frontier Long/Short Commodity Series, $71,161,299 for the Balanced Series, $489,483 for the Currency Series and $13,010,250 for the Winton/Graham Series. The clearing brokers are expected to credit each Trading Company with approximately 80%-100% of the interest earned on its average net assets on deposit with the clearing brokers each week. Currently, this amount is estimated to be 0.20%. In an attempt to increase interest income earned, the Managing Owner also may invest the non-margin assets in U.S. government securities which include any security issued or guaranteed as to principal or interest by the United States, or by a person controlled by or supervised by and acting as an instrumentality of the government of the United States pursuant to authority granted by Congress or any certificate of deposit for any of the foregoing, including U.S. treasury bonds, U.S. treasury bills and issues of agencies of the U.S. government, and certain cash items such as money market funds, certificates of deposit (under nine months) and time deposits. Aggregate interest income from all sources, including assets held at clearing brokers, up to 2% (annualized) is paid to the Managing Owner by the Balanced Series (Class 1 and Class 2 only), Campbell/Graham/Tiverton Series, Currency Series, Winton Series, and Winton/Graham Series. For the Frontier Diversified Series, Frontier Dynamic Series, Frontier Long/Short Commodity Series, Frontier Masters Series, Balanced Series (Class 1 a and Class 2a only), Long Only Commodity Series and Managed Futures Index Series, 20% of the total interest allocated to each Series is paid to the Managing Owner.
Approximately 10% to 20% of the Trust’s assets are expected to be committed as required margin for futures contracts and forward and options trading and held by the respective broker, although the amount committed may vary significantly. Such assets are maintained in the form of cash or U.S. Treasury bills in segregated accounts with the futures broker pursuant to the Commodity Exchange Act and regulations thereunder. Approximately 2% to 6% of the Trust’s assets are expected to be deposited with over-the- counter counterparties in order to initiate and maintain forward and swap contracts. Such assets are not held in segregation or otherwise regulated under the Commodity Exchange Act, unless such over-the-counter counterparty is registered as a futures commission merchant. These assets are held in either U.S. government securities or short-term time deposits with U.S.-regulated bank affiliates of the over-the-counter counterparties. The remaining approximately 74% to 88% of the Trust’s assets will normally be invested in cash equivalents and short-term investments, such as money market funds, and time deposits and held by the clearing broker, the over-the-counter counterparties and by U.S. Federally chartered banks. As of March 31, 2010, total cash and cash equivalents and custom time deposits held at banking institutions were $74,860,165 for the Frontier Diversified Series, $15,880,958 for the Frontier Dynamic Series, $17,034,658 for the Frontier Long/Short Commodity Series, $36,038,297 for the Frontier Masters Series $162,632,239 for the Balanced Series, $37,336,469 for the Campbell/Graham/Tiverton Series, $12,735,803 for the Currency Series, $3,284,762 for the Long Only Commodity Series, $1,695,648 for the Managed Futures Index Series, $37,211,464 for the Winton Series and $39,086,371 for the Winton/Graham Series. As of December 31, 2009, total cash and cash equivalents and custom time deposits held at banking institutions were $47,895,580 for the Frontier Diversified Series, $15,802,320 for the Frontier Dynamic Series, $37,789,611 for the Frontier Long/Short Commodity Series, $22,701,439 for the Frontier Masters Series, $182,088,771 for the Balanced Series, $42,271,337 for the Campbell/Graham/Tiverton Series, $14,473,172 for the Currency Series, $3,515,966 for the Long Only Commodity Series, $2,397,492 for the Managed Futures Index Series, $40,520,486 for the Winton Series and $43,718,386 for the Winton/Graham Series.
53
Table of Contents
Off-Balance Sheet Risk
The term “off-balance sheet risk” refers to an unrecorded potential liability that, even though it does not appear on the balance sheet, may result in future obligation or loss. Each Trading Company trades in futures, forward and swap contracts and is therefore a party to financial instruments with elements of off-balance sheet market and credit risk. In entering into these contracts there exists a market risk that such contracts may be significantly influenced by market conditions, such as interest rate volatility, resulting in such contracts being less valuable. If the markets should move against all of the futures interests positions held by a Trading Company in respect of any Series at the same time, and if the Trading Advisor(s) of such Trading Company are unable to offset such futures interests positions, such Trading Company could lose all of its assets and the holders of Units of such Series would realize a 100% loss. The Managing Owner seeks to minimize market risk through real-time monitoring of open positions and the level of diversification of each Trading Advisor’s portfolio. It is anticipated that any Trading Advisor’s margin-to-equity ratio will typically not exceed approximately 35% although the actual ratio could be higher or lower from time to time.
In addition to market risk, trading futures, forward and swap contracts entails credit risk which is the risk that a counterparty will not be able to meet its obligations to a Trading Company. The counterparty for futures contracts traded in the United States and on most foreign exchanges is the clearinghouse associated with such exchange. In general, clearinghouses are backed by the corporate members of the clearinghouse who are required to share any financial burden resulting from the non-performance by one of their members and, as such, should significantly reduce this credit risk. In cases where the clearinghouse is not backed by the clearing members, like some foreign exchanges, it is normally backed by a consortium of banks or other financial institutions. Some non-U.S. exchanges, in contrast to U.S. exchanges are principals’ markets in which performance is the responsibility only of the individual counterparty with whom the Trading Company has entered into the transaction with and not of the exchange or clearing corporation. In these kinds of markets, there is risk of bankruptcy or other failure or refusal to perform by the counterparty.
In the case of forward contracts traded on the interbank market and swaps, neither is traded on an exchange. The counterparty is generally a single bank or other financial institution, rather than a group of financial institutions; thus, there may be a greater counterparty credit risk. The Managing Owner expects the Trading Advisors to trade only with those counterparties which it believes to be creditworthy. All positions of each Trading Company are valued each day on a mark-to-market basis. There can be no assurance that any clearing member, clearinghouse or other counterparty will be able to meet its obligations to any Trading Company.
The Trust has entered into agreements, which provide for the indemnification of futures clearing brokers, currency trading companies, and commodity trading advisors, among others, against losses, costs, claims and liabilities arising from the performance of their individual obligations under such agreements, except for gross negligence or bad faith. The Trust has had no prior claims or payments pursuant to these agreements. The Trust’s individual maximum exposure under these arrangements is unknown, as this would involve future claims that may be made against the Trust that have not yet occurred. However, based on experience the Trust expects the risk of loss to be remote.
Results of Operations
Three Months Ended March 31, 2010 Compared to Three Months Ended March 31, 2009.
Market Conditions for Three Months Ended March 31, 2010
January 2010
Interest Rates
The Federal Open Market Committee (FOMC) decided in January to maintain the target range for the federal funds rate at 0% to 1/4 %. The FOMC anticipates that economic conditions, including low rates of resource utilization, subdued inflation trends, and stable inflation expectations, are likely to warrant exceptionally low levels of the federal funds rate for an extended period. U.S. and European interest rate futures, across the curve, climbed steadily during January to finish higher.
54
Table of Contents
Currencies
The U.S. Dollar index continued to strengthen during January, finishing up 2.0% for the month. The Euro and the British Pound weakened against the U.S. Dollar, down 3.2% and 1.2%, respectively. The Japanese Yen strengthened against the U.S. Dollar, up 3.1%. The Canadian Dollar and the Australian Dollar weakened against their U.S. counterpart finishing lower by 1.6% and 1.5%, respectively.
Stock Indices
Most of the major U.S. and European stock indices reversed their upward trend to finish lower for January. The Dow Jones Industrial Average (DJIA), the S&P 500 Index and the NASDAQ Composite Index weakened by 3.5%, 3.7% and 5.4%, respectively, for the month. In Europe, FTSE index futures dropped 4.9%, CAC-40 futures finished lower by 6.3% and DAX index futures were down 6.9% for the month.
Energy
Most energy futures weakened in January. Crude oil futures finished lower by 8.9% settling at $73/bbl. Gasoline, heating oil and natural gas futures also dropped, down 7.6%, 9.8% and 7.2%, respectively for the month.
Metals
Gold futures continued to drop during the month, finishing lower by 1.3% at $1,084/oz. Silver futures also weakened, down 3.9% in January. Platinum and palladium futures strengthened during the month, finishing up 2.4% and 0.9%, respectively. Copper reversed its upward trend since September 2009 to finish lower by 8.9% for the month.
Agriculturals
The soybean complex dropped sharply in January. Soybean oil, soybeans and soybean meal dropped 11.4%, 12.9% and 10.6% respectively. Corn and wheat futures also dropped, down 14.0% and 12.5% in January. Cotton futures reversed its upward trend since September 2009 to finish lower by 8.7%. Sugar futures continued to climb, up 10.9% for January.
February 2010
Interest Rates
Global markets were jolted by events from the East and the West during February, both of which point towards a tightening of deflationary pressures on a large part of the world’s economy. The ongoing fiscal crisis in Greece dominated the markets until mid month. European Union leaders declared that the European Union (“EU”) member states would do whatever was required to preserve the Euro. Chinese monetary authorities announced mid month a surprise further tightening of monetary policy to prevent overheating and cool asset inflation. For the second time in a month, Chinese banks’ reserve requirements were increased to restrain their loan growth, which has fueled a potential new bubble. Being one of the largest economies in the world, behind the U.S. and Japan, China’s requirement on bank reserves could have a constraining effect on the market. U.S. and European interest rate futures, across the curve, finished slightly up for the month.
Currencies
The U.S. dollar index continued to strengthen during February, finishing up 1.1% for the month. The difficulties facing Greece and other European borrowers with large budget deficits put downward pressure on the Euro. The Euro continued to weaken against the U.S. Dollar, down 1.7% for the month. The Japanese Yen strengthened against the U.S. Dollar, up 1.5%. The Canadian Dollar and the Australian Dollar also strengthened against their U.S. counterpart, finishing higher by 1.8% and 1.3%, respectively, in February. The British Pound weakened against the U.S. Dollar, down 4.6% for the month.
Stock Indices
Most of the major U.S. and European stock indices finished higher in February. The DJIA, the S&P 500 Index and the NASDAQ Composite Index strengthened by 2.6%, 2.9% and 4.2%, respectively, for the month. In Europe, FTSE index futures finished higher by 4.8%, CAC-40 futures finished up by 0.4% and DAX index futures strengthened by 0.8%.
55
Table of Contents
Energy
Most energy futures strengthened in February. Crude oil futures finished higher by 8.6% settling at $79.66/bbl. Gasoline and heating oil futures also strengthened, up 8.2% and 6.0%, respectively, for the month. Natural gas futures finished the month lower by 6.0%.
Metals
The recent crises in the Euro zone and increasing inflation expectations have been contributing to the rise in precious metal prices in February. Gold futures finished up 3.2% at $1,119/oz in February. Silver futures strengthened by 1.9%. Platinum, palladium and copper futures also strengthened during the month, finishing up 2.3%, 5.0% and 7.1%, respectively.
Agriculturals
The soybean complex finished higher in February. Corn and wheat futures also strengthened, up 5.8% and 6.3% for the month. Sugar futures reversed its upward trend, finishing lower by 17.5%. Cocoa futures also weakened during the month, down 9.7%. Cotton rallied during the February, finishing up 16.7%.
March 2010
Interest Rates
Some degree of optimism about the U.S. economy has resurfaced. Recent U.S. data suggests that economic activity has continued to strengthen and that the labor market is stabilizing. Household spending is expanding at a moderate rate, yet constrained by high unemployment, modest income growth, lower housing wealth, and tight credit. Business spending on equipment and software has risen significantly. However, employers remain reluctant to add to payrolls. To provide support to mortgage lending and housing markets the Federal Reserve has been purchasing $1.25 trillion of agency mortgage-backed securities and about $175 billion of agency debt over the last year. These purchases are coming to an end, as the last transactions were executed in March. The ongoing fiscal crisis in Greece continued to put pressure on Greek government bonds in March. Disagreement among Euro-zone countries over the implementation of the aid program contributed to the sharp yield increase on the 10-year Greek government bond. Some economists say the sharp rise in borrowing costs is contributing to a spiral that could eventually force Greece to a default. U.S. interest rate futures, across the curve, finished down for the month. European interest rate futures finished the month higher.
Currencies
The U.S. Dollar index continued to strengthen during March, finishing up 0.9% for the month. The Euro and the British Pound continued to weaken against the U.S. Dollar, down 0.9% and 0.4%, respectively, for the month. The Japanese Yen weakened as well against the U.S. Dollar, down 4.8%. The Canadian Dollar and the Australian Dollar continued to strengthened against their U.S. counterpart, finishing higher by 3.6% and 2.4%, respectively, in March.
Stock Indices
Most of the major U.S. and European stock indices finished higher in March. The DJIA, the S&P 500 Index and the NASDAQ Composite Index strengthened by 5.1%, 5.9% and 7.1%, respectively, for the month. In Europe, FTSE index futures finished higher by 6.3%, CAC-40 futures finished up by 7.2% and DAX index futures strengthened by 9.8%.
Energy
Most energy futures strengthened in March. Crude oil futures finished higher by 4.7% settling at $83.76/bbl. Gasoline and heating oil futures also strengthened, up 5.2% and 6.4%, respectively, for the month. Natural gas plummeted in March, finishing lower by 20.7%.
Metals
Gold futures finished slightly down in March, 0.5% at $1,114/oz. Silver futures strengthened by 6.1%. Platinum, palladium and copper futures also strengthened during the month, finishing up 6.6%, 10.7% and 8.2%, respectively.
56
Table of Contents
Agriculturals
Rough rice, corn and wheat futures weakened significantly in March, down 11.2%, 13.2% and 11.3%, respectively, for the month. Sugar futures dropped significantly, finishing lower by 29.7%. Live cattle and feeder cattle futures, that have been on an upward trend since December last year, continued to strengthen, up 3.5% and 9.2%, respectively, for March.
Market Conditions for Three Months Ended March 31, 2009
January 2009
Interest Rates
The Federal Open Market Committee decided to keep its target range for the federal funds rate at 0 to 0.25 percent in January, as economic data suggested that the economy has weakened further. The Federal Open Market Committee continued to purchase large quantities of agency debt and mortgage-backed securities to provide support to the mortgage and housing markets, and announced that it will employ all available tools to promote sustainable economic growth, including possibly purchasing long-term U.S. Treasury notes. U.S. interest rate futures, as well as European interest rate futures, finished mixed for the month.
Currencies
The U.S. Dollar strengthened against most other major currencies in January. The U.S. Dollar Index recouped the December loss and finished the month up 5.8%. The Euro and the British Pound weakened against the U.S. Dollar, finishing lower by -8.3% and -0.6% respectively for the month. The Australian Dollar and the Canadian Dollar also weakened again their U.S. counterpart, finishing down 9.6% and 0.7% respectively. The Swiss Franc weakened against the U.S. Dollar, down 7.7% and the Japanese Yen gained against the U.S. dollar, up 0.9%.
Stock Indices
All major U.S. and European stock indices weakened in January. The Dow Jones Industrial Average (DJIA) finished the month down 8.8%, and the S&P 500 Index and NASDAQ Composite Index dropped 8.6% and 6.4% respectively in January. The DJIA, S&P 500 Index and NASDAQ Composite Index have dropped 30.7%, 35.6% and 37.6% respectively since August 2008. In Europe, FTSE index futures finished down 6.8%, CAC-40 futures dropped 8.4% and DAX index futures finished lower by 10.3% for the month.
Energy
Crude oil futures for March delivery finished the month down 14.2%. Crude oil futures have dropped more than 60.7% since August last year. Natural gas futures and heating oil futures for March delivery dropped as well, finishing lower by 21.9% and 2.3%. Gasoline futures prices finished the month up 14.3%.
Metals
Gold futures for April delivery finished up 4.9% settling at $928/oz. Silver, platinum and palladium futures also finished higher, up 11.2%, 5.3% and 2.4% respectively. Copper futures finished higher by 4.1%.
Agriculturals
Corn and wheat futures for March delivery weakened in January, finishing down 6.9% and 7.0% respectively. Rough rice futures dropped sharply during the month, finishing lower by 22.8%. Soybean oil futures dropped 2.6% and soybean futures for March delivery finished the month unchanged. Cocoa futures and coffee futures for March 2009 delivery finished the month higher by 4.0% and 6.1% respectively. Lumber futures continued its downward path finishing lower by 21.1% for the month.
February 2009
Interest Rates
European rate futures continued to climb on bad news regarding toxic assets in European banks, U.S. rate futures were flat to slightly down. There is general consensus that much of the bad news about U.S. banks has already been addressed, while Europe is still to deal with its toxic asset problems.
Currencies
The U.S. Dollar strengthened against most other major currencies in February. The U.S. Dollar Index continued its January gains and finished February up 2.3%. The Euro and the British Pound continued their declines against the U.S. Dollar, finishing lower by 1.2% and 1.6% respectively for the month.
Stock Indices
All major U.S. and European stock indices continued their dramatic declines in February, as the new U.S. administration struggled with resolving the complex economic issues before the nation, and passed a huge spending bill in an attempt to stimulate the economy. The DJIA plummeted 11.7%, with global markets responding to the economic downturn.
Energy
Crude oil and natural gas futures continued their declines in February on continuing weak demand.
Metals
Gold futures for April delivery finished up 1.5% for the month. Silver, platinum and palladium futures also finished higher, up 4.2%, 9.5% and .66% respectively. Copper futures finished higher by 3.7%.
Agriculturals
Corn and wheat futures for May continued their declines in February, finishing down 8.0% and 10.2% respectively. The soybean complex was down for the month, with meats mixed. With the softs, sugar showed a 5.6% gain, and cotton, coffee, and cocoa showing substantial declines.
March 2009
Interest Rates
The Federal Open Market Committee decided on March 18th to maintain the target range for the federal funds rate at 0 to 0.25 %, and anticipates that the weak economic conditions are likely to warrant exceptionally low levels of the federal funds rate for an extended period of time. To support the mortgage lending and housing markets, the Federal Open Market Committee decided to increase the size of the Federal Reserve’s balance sheet further by purchasing an additional $750 billion of agency mortgage-backed securities, bringing its total purchases of these securities to up to $1.25 trillion this year. In addition, the Committee decided to increase its purchases of agency debt this year to a total of $200 billion and to purchase up to $300 billion of longer-term Treasury securities over the next six months. U.S. interest rate futures, as well as European interest rate futures, finished higher for the month.
Currencies
The U.S. Dollar weakened against most other major currencies in March. The U.S. Dollar Index finished the month down 2.7%. The Euro and the Swiss Franc strengthened against the U.S. Dollar, finishing up 4.6% and 2.7% respectively. The Australian Dollar and the Canadian Dollar also strengthened against their U.S. counterpart, finishing up 8.2% and 1.2% respectively. The Japanese Yen weakened against the U.S. Dollar, down 1.4% and British Pound finished the month nearly unchanged against the U.S. Dollar.
Stock Indices
All major U.S. and European stock indices strengthened in March. The DJIA finished the month up 7.7%, and the S&P 500 Index and NASDAQ Composite Index gained 8.5% and 10.9% respectively. In Europe, FTSE index futures finished up 3.6%, CAC-40 futures gained 4.6% and DAX index futures finished higher by 6.5% for the month.
Energy
Crude oil futures, heating oil futures and gasoline futures for May delivery finished the month up 5.9%, 7.1% and 3.6% respectively. Natural gas futures finished the month down 11.7%.
Metals
Gold futures for June delivery finished the month down 2.1% settling at $925/oz. Silver futures also finished lower for the month, down 1.0%. Platinum, palladium and copper futures finished higher in March, up 3.6%, 11.8% and 19.9% respectively.
Agriculturals
Corn and soybean futures for May delivery strengthened in March, finishing up 12.7% and 9.2% respectively. Cotton, cocoa and coffee futures for May delivery finished the month higher by 7.4%, 8.4% and 3.4% respectively. Live cattle and lean hogs finished the month slightly down.
Frontier Diversified Series
2010
The Frontier Diversified Series began trading operations on June 9, 2009. The Frontier Diversified Series – Class 1 NAV lost 1.4% for the three months ended March 31, 2010, net of fees and expenses; the Frontier Diversified Series – Class 2 NAV lost 0.9% for the three months ended March 31, 2010, net of fees and expenses.
For the period ended March 31, 2010 the Frontier Diversified Series recorded a net gain on investments of $351,430, net interest of $411,248, and total expenses of $1,027,738, resulting in a net decrease in Owners’ capital from operations of $268,401 after non-controlling interests of ($3,341). The NAV per Unit, Class 1, decreased from $96.80 at December 31, 2009, to $95.49 as of March 31, 2010. The NAV per Unit, Class 2, decreased from $97.77 at December 31, 2009, to $96.86 as of March 31, 2010. Total Class 1 subscriptions and redemptions for the period were $21,396,967 and $308,919, respectively. Total Class 2 subscriptions and redemptions for the period were $13,172,650 and $150,640, respectively. Ending capital at March 31, 2010, was $53,936,031 for Class 1 and $36,221,745 for Class 2. Ending capital at December 31, 2009, was $32,960,540 for Class 1 and $23,355,579 for Class 2. The Frontier Diversified Series may have both long and short exposure to the Interest Rates, Currencies, Stock Indices, Energies, Metals, and Commodities sectors. See comments above under Market Conditions for Three Months Ended March 31, 2010, for additional information regarding these sectors.
Sector Attribution for the Frontier Diversified Series
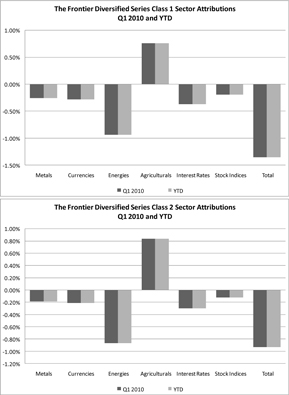
57
Table of Contents
Frontier Dynamic Series
2010
The Frontier Dynamic Series began trading operations on June 9, 2009. The Frontier Dynamic Series – Class 1 NAV lost 0.9% for the three months ended March 31, 2010, net of fees and expenses; the Frontier Dynamic Series – Class 2 NAV lost 0.5% for the three months ended March 31, 2010, net of fees and expenses.
For the period ended March 31, 2010 the Frontier Dynamic Series recorded a net gain on investments of $66,083, net interest of $113,354, and total expenses of $187,023, resulting in a net decrease in Owners’ capital from operations of $7,586. The NAV per Unit, Class 1, decreased from $91.43 at December 31, 2009, to $90.61 as of March 31, 2010. The NAV per Unit, Class 2, decreased from $92.25 at December 31, 2009, to $91.82 as of March 31, 2010. Total Class 1 subscriptions and redemptions for the period were $180,700 and $56,228, respectively. Total Class 2 subscriptions for the period were $81,667. There were no redemptions. Ending capital at March 31, 2010, was $723,986 for Class 1 and $371,484 for Class 2. Ending capital at December 31, 2009, was $606,255 for Class 1 and $290,662 for Class 2.
The Frontier Dynamic Series may have both long and short exposure to the Interest Rates, Currencies, Stock Indices, Energies, Metals, and Commodities sectors. See comments above under Market Conditions for Three Months Ended March 31, 2010, for additional information regarding these sectors.
The Dynamic Series invests in an option market basket of which the underlying investments are not transparent to the Trust. Therefore there are no Sector Attribution charts for the Dynamic Series.
Frontier Long/Short Commodity Series
2010
The Frontier Long/Short Commodity Series – Class 1 NAV lost 2.3% for the three months ended March 31, 2010, net of fees and expenses; the Frontier Long/Short Commodity Series – Class 2 NAV lost 1.6% for the three months ended March 31, 2010, net of fees and expenses; the Frontier Long/Short Commodity Series – Class 3 NAV lost 1.6% for the three months ended March 31, 2010, net of fees and expenses; the Frontier Long/Short Commodity Series – Class 1 a NAV lost 2.1% for the three months ended March 31, 2010, net of fees and expenses; the Frontier Long/Short Commodity Series – Class 2a NAV lost 1.8% for the three months ended March 31, 2010, net of fees and expenses.
For the three months ended March 31, 2010, the Frontier Long/Short Commodity Series recorded net loss on investments of $3,246,178, net interest of $209,285, and total expenses of $1,281,464, resulting in a net decrease in Owners’ capital from operations of $1,405,236 after non-controlling interests of $2,913,121. The NAV per Unit, Class 1, decreased from $113.77 at December 31, 2009, to $111.16 as of March 31, 2010. The NAV per Unit, Class 2, decreased from $127.49 at December 31, 2009, to $125.49 as of March 31, 2010. The NAV per Unit, Class 3, decreased from $127.49 at December 31, 2009, to $125.48 as of March 31, 2010. The NAV per Unit, Class 1a, decreased from $101.49 at December 31, 2009, to $99.31 as of March 31, 2010. The NAV per Unit, Class 2a, decreased from $102.48 at December 31, 2009, to $100.68 as of March 31, 2010. Total Class 1 subscriptions and redemptions for the three months were $33,460 and $5,735,673, respectively. Total Class 2 redemptions for the three months were $390,579. There were no subscriptions. Total Class 3 subscriptions and redemptions for the three months were $4,961,732 and $239,501, respectively. Total Class 1a subscriptions and redemptions for the three months were $697,792 and $7,501, respectively. Total Class 2a subscriptions for the three months were $488,729. There were no redemptions. Ending capital at March 31, 2010, was $38,910,666 for Class 1, $14,354,404 for Class 2, $10,863,008 for Class 3, $1,767,509 for Class 1a and $1,361,568 for Class 2a. Ending capital at December 31, 2009, was $45,759,225 for Class 1, $14,986,103 for Class 2, $6,140,056 for Class 3, $1,092,016 for Class 1a and $876,532 for Class 2a.
The Frontier Long/Short Commodity Series may have both long and short exposure to the Interest Rates, Currencies, Stock Indices, Energies, Metals, and Commodities sectors, although the majority of the exposure will typically be in the Energies, Metals, and Commodities sectors. See comments above under Market Conditions for Three Months Ended March 31, 2010, for additional information regarding these sectors.
58
Table of Contents
Sector Attribution for the Frontier Long/Short Commodity Series
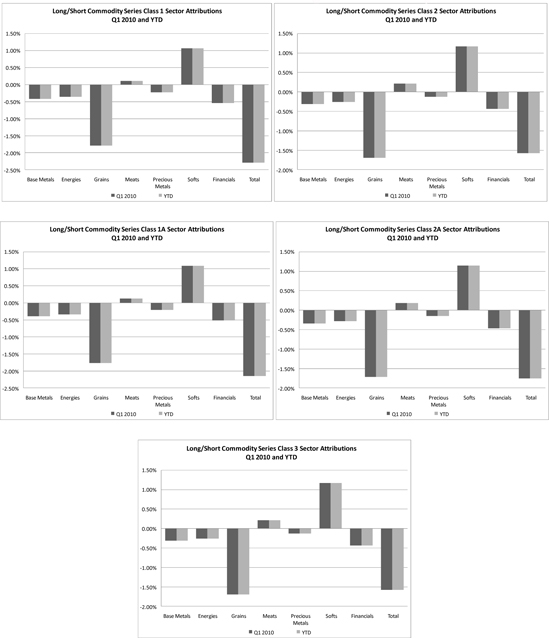
2009
The Long/Short Commodity Series – Class 1 NAV gained 3.7% for the three months ended March 31, 2009, net of fees and expenses; the Long/Short Commodity Series – Class 2 NAV gained 4.5% for the three months ended March 31, 2009, net of fees and expenses.
For the three months ended March 31, 2009, the Long/Short Commodity Series recorded net gain on investments of $10,799,151, net interest of $367,274, and total expenses of $1,726,611, resulting in a net increase in Owners’ capital from operations of $2,244,293 after minority interests of ($7,195,521). The NAV per Unit, Class 1, increased from $100.39 at December 31, 2008, to
59
Table of Contents
$104.14 as of March 31, 2009. The NAV per Unit, Class 2, increased from $109.28 at December 31, 2008, to $114.20 as of March 31, 2009. Total Class 1 subscriptions and redemptions for the three months were $3,407,247 and $3,226,448, respectively. Total Class 2 subscriptions and redemptions for the three months were $1,726,240 and $517,325, respectively. Ending capital at March 31, 2009, was $48,425,691 for Class 1 and $12,940,611 for Class 2. Ending capital at December 31, 2008, was $46,525,406 for Class 1 and $11,206,889 for Class 2.
The Long/Short Commodity Series may have both long and short exposure to the Interest Rates, Currencies, Stock Indices, Energies, Metals, and Commodities sectors, although the majority of the exposure will typically be in the Energies, Metals, and Commodities sectors. See comments above under Market Conditions for Three Months Ended March 31, 2009, for additional information regarding these sectors.
Sector Attribution for the Frontier Long/Short Commodity Series
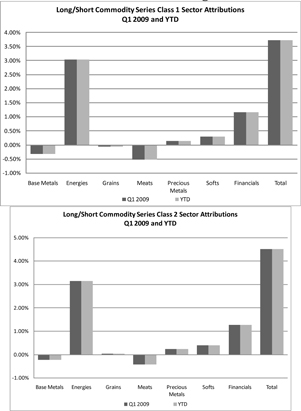
Frontier Masters Series
2010
The Frontier Masters Series began trading operations on June 9, 2009. The Frontier Masters Series – Class 1 NAV gained 0.3% for the three months ended March 31, 2010, net of fees and expenses; the Frontier Masters Series – Class 2 NAV gained 0.7% for the period ended March 31, 2010, net of fees and expenses.
For the period ended March 31, 2010 the Frontier Masters Series recorded a net gain on investments of $847,669, net interest of $210,672, and total expenses of $610,882, resulting in a net increase in Owners’ capital from operations of $447,459. The NAV per Unit, Class 1, increased from $94.46 at December 31, 2009, to $94.70 as of March 31, 2010. The NAV per Unit, Class 2, increased from $95.37 at December 31, 2009, to $96.03 as of March 31, 2010. Total Class 1 subscriptions and redemptions for the period were $7,376,112 and $21,328, respectively. Total Class 2 subscriptions and redemptions for the period were $11,252,613 and $187,148, respectively. Ending capital at March 31, 2010, was $11,118,740 for Class 1 and $19,917,415 for Class 2. Ending capital at December 31, 2009, was $14,723,330 for Class 1 and $8,563,857 for Class 2.
60
Table of Contents
The Frontier Masters Series may have both long and short exposure to the Interest Rates, Currencies, Stock Indices, Energies, Metals, and Commodities sectors. See comments above under Market Conditions for Three Months Ended March 31, 2010, for additional information regarding these sectors.
61
Table of Contents
Sector Attribution for the Frontier Masters Series
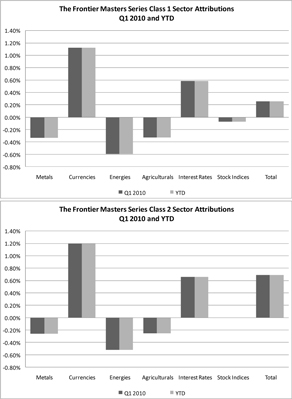
Balanced Series
2010
The Balanced Series – Class 1 NAV lost 0.6% for the three months ended March 31, 2010, net of fees and expenses; the Balanced Series – Class 1a NAV lost 0.8% for the three months ended March 31, 2010, net of fees and expenses; the Balanced Series – Class 2 NAV gained 0.1% for the three months ended March 31, 2010, net of fees and expenses; the Balanced Series – Class 2a NAV lost 0.1% for the three months ended March 31, 2010, net of fees and expenses; the Balanced Series – Class 3a NAV lost 0.1% for the three months ended March 31, 2010, net of fees and expenses.
For the three months ended March 31, 2010, the Balanced Series recorded net loss on investments of $265,444, net interest of $205,160, and total expenses of $3,835,676, resulting in a net decrease in Owners’ capital from operations of $2,009,334 after non- controlling interests of $ 1,886,626. The NAV per Unit, Class 1, decreased from $118.54 at December 31, 2009, to $117.81 at March 31, 2010. For Class 1 a, the NAV per Unit decreased from $105.50 at December 31, 2009, to $104.66 at March 31, 2010. The NAV per Unit, Class 2, increased from $139.01 at December 31, 2009, to $139.18 at March 31, 2010. For Class 2a, the NAV per Unit decreased from $117.60 at December 31, 2009, to $117.53 at September 30, 2009. For Class 3a, the NAV per Unit decreased from $117.60 at December 31, 2009, to $117.54 at March 31, 2010. Total Class 1 subscriptions and redemptions for the three months were $176,783 and $6,482,776, respectively. Total Class 1a subscriptions and redemptions for the three month period were $15,991 and $2,214,384, respectively. Total Class 2 subscriptions and redemptions for the three months were $7,265 and $2,928,030, respectively. Total Class 2a redemptions for the three month period were $76,758. There were no subscriptions. Total Class 3a subscriptions and redemptions for the period were $1,712,203 and $87,309, respectively. Ending capital at March 31, 2010, was $277,807,329 for Class 1, $6,847,698 for Class 1a, $74,442,173 for Class 2, $3,216,036 for Class 2a and $2,816,314 for Class 3a. At December 31, 2009, ending capital was $286,024,307 for Class 1, $9,150,114 for Class 1a, $77,372,166 for Class 2, $3,298,566 for Class 2a, and $1,170,746 for Class 3a.
The Balanced Series may have both long and short exposure to the Interest Rates, Currencies, Stock Indices, Energies, Metals, and Commodities sectors. See comments above under Market Conditions for Three Months Ended March 31, 2010, for additional information regarding these sectors.
62
Table of Contents
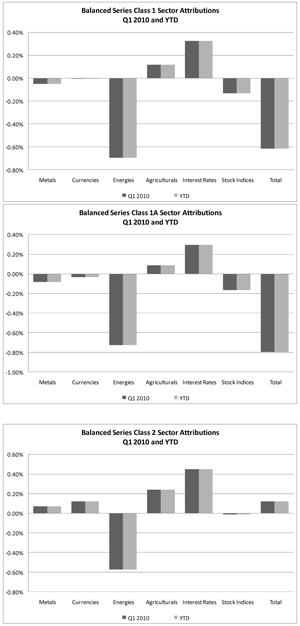
63
Table of Contents
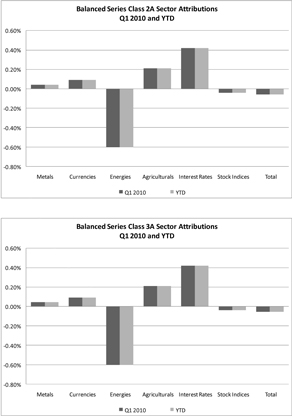
2009
The Balanced Series – Class 1 NAV neither gained nor lost for the three months ended March 31, 2009, net of fees and expenses; the Balanced Series – Class 1a NAV lost 0.2% for the three months ended March 31, 2009, net of fees and expenses; the Balanced Series – Class 2 NAV gained 0.8% for the three months ended March 31, 2009, net of fees and expenses; the Balanced Series – Class 2a NAV gained 0.5% for the three months ended March 31, 2009, net of fees and expenses.
For the three months ended March 31, 2009, the Balanced Series recorded net gain on investments of $4,556,262, net interest of $99,001, and total expenses of $5,127,422, resulting in a net increase in Owners’ capital from operations of $247,088 after minority interests of $ 719,247. The NAV per Unit, Class 1, increased from $125.17 at December 31, 2008, to $125.21 at March 31, 2009. For Class 1a, the NAV per Unit decreased from $112.09 at December 31, 2008, to $111.86 at March 31, 2009. The NAV per Unit, Class 2, increased from $142.44 at December 31, 2008, to $143.54 March 31, 2009. For Class 2a, the NAV per Unit increased from $121.30 at December 31, 2008, to $121.95 at March 31, 2009. Total Class 1 subscriptions and redemptions for the three months were $39,926,756 and $8,463,922, respectively. Total Class 1a subscriptions and redemptions for the three month period were $1,900,154 and $233,504, respectively. Total Class 2 subscriptions and redemptions for the three months were $13,084,122 and $2,664,595, respectively. Total Class 2a subscriptions and redemptions for the three month period were $463,000 and $24,423, respectively. Ending capital at March 31, 2009, was $287,834,027 for Class 1, $9,770,203 for Class 1a, $77,983,054 for Class 2 and $2,330,389 for Class 2a. At December 31, 2008, ending capital was $256,550,829 for Class 1, $8,136,165 for Class 1a, $67,109,662 for Class 2 and $1,886,351 for Class 2a.
The Balanced Series may have both long and short exposure to the Interest Rates, Currencies, Stock Indices, Energies, Metals, and Commodities sectors. See comments above under Market Conditions for Three Months Ended March 31, 2009, for additional information regarding these sectors.
64
Table of Contents
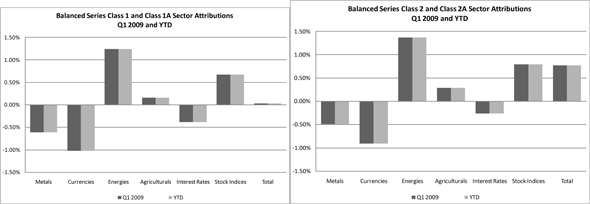
Campbell/Graham/Tiverton Series
2010
The Campbell/Graham/Tiverton Series – Class 1 NAV lost 3.2% for the three months ended March 31, 2010, net of fees and expenses; the Campbell/Graham/Tiverton Series – Class 2 NAV lost 2.5% for the three months ended March 31, 2010, net of fees and expenses.
For the three months ended March 31, 2010, the Campbell/Graham/Tiverton Series recorded net loss on investments of $1,177,468, net interest of ($1,116), and total expenses of $1,166,380, resulting in a net decrease in Owners’ capital from operations of $2,522,861 after non-controlling interests of ($177,897). The NAV per Unit, Class 1, decreased from $104.65 at December 31, 2009, to $101.25 as of March 31, 2010. The NAV per Unit, Class 2, decreased from $121.10 at December 31, 2009, to $118.03 as of March 31, 2010. Total Class 1 subscriptions and redemptions for the three months ended March 31, 2010, were $39,414 and $1,659,964, respectively. Total Class 2 redemptions for the three months ended March 31, 2010, were $739,151. There were no subscriptions. Ending capital at March 31, 2010, was $65,562,540 for Class 1 and $8,917,258 for Class 2. Ending capital at December 31, 2009, was $69,447,366 for Class 1 and $9,914,994 for Class 2.
The Campbell/Graham/Tiverton Series may have both long and short exposure to the Interest Rates, Currencies, Stock Indices, Energies, Metals, and Commodities sectors. See comments above under Market Conditions for Three Months Ended March 31, 2010, for additional information regarding these sectors.
65
Table of Contents
Sector Attribution for the Campbell/Graham/Tiverton Series
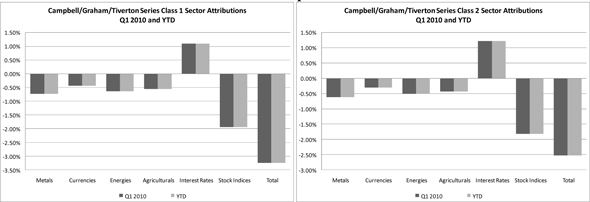
2009
The Campbell/Graham/Tiverton Series – Class 1 NAV lost 2.6% for the three months ended March 31, 2009, net of fees and expenses; the Campbell/Graham/Tiverton Series – Class 2 NAV lost 1.9% for the three months ended March 31, 2009, net of fees and expenses.
For the three months ended March 31, 2009, the Campbell/Graham/Tiverton Series recorded net loss on investments of $1,581,458, net interest of $144,150, and total expenses of $1,202,003, resulting in a net decrease in Owners’ capital from operations of $2,084,257 after minority interests of $555,054. The NAV per Unit, Class 1, decreased from $110.54 at December 31, 2008, to $107.63 as of March 31, 2009. The NAV per Unit, Class 2, decreased from $124.14 at December 31, 2008, to $121.77 as of March 31, 2009. Total Class 1 subscriptions for the three months ended March 31, 2009, were $5,956,208 and redemptions were $1,699,409. Total Class 2 subscriptions and redemptions for the three months ended March 31, 2009, were $2,622,444, and $578,007, respectively. Ending capital at March 31, 2009, was $72,323,161 for Class 1 and $9,658,747 for Class 2. Ending capital at December 31, 2008, was $69,957,155 for Class 1 and $7,807,774 for Class 2.
The Campbell/Graham/Tiverton Series may have both long and short exposure to the Interest Rates, Currencies, Stock Indices, Energies, Metals, and Commodities sectors. See comments above under Market Conditions for Three Months Ended March 31, 2009, for additional information regarding these sectors.
Sector Attribution for the Campbell/Graham Series
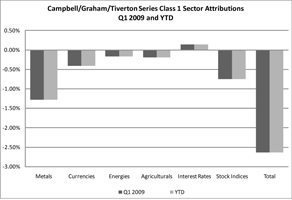
66
Table of Contents
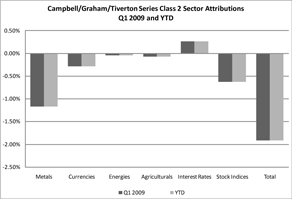
Currency Series
2010
The Currency Series – Class 1 NAV gained 1.9% for the three months ended March 31, 2010, net of fees and expenses; the Currency Series – Class 2 NAV gained 2.7% for the three months ended March 31, 2010, net of fees and expenses.
For the three months ended March 31, 2010, the Currency Series recorded net gain on investments of $257,227, net interest of $37,458, and total expenses of $124,008, resulting in a net increase in Owners’ capital from operations of $170,677. The NAV per Unit, Class 1, increased from $78.00 at December 31, 2009, to $79.50 as of March 31, 2010. The NAV per Unit, Class 2, increased from $91.34 at December 31, 2009, to $93.79 as of March 31, 2010. Total Class 1 subscriptions and redemptions for the three months ending March 31, 2010 were $17,133, and $307,455, respectively. Total Class 2 redemptions for the three months ending March 31, 2010, was $1,438,466. There were no subscriptions. Ending capital at March 31, 2010, was $7,792,672 for Class 1 and $857,345 for Class 2. Ending capital at December 31, 2009, was $7,934,382 for Class 1 and $2,273,746 for Class 2.
The Currency Series may have both long and short exposure to the Currencies sector only. See comments above under Market Conditions for Three Months Ended March 31, 2010, for additional information regarding these sectors.
Because all returns are from the Currencies sector, there are no Sector Attribution charts for the Currency
Series. 2009
The Currency Series – Class 1 NAV lost 5.8% for the three months ended March 31, 2009, net of fees and expenses; the Currency Series – Class 2 NAV lost 5.1% for the three months ended March 31, 2009, net of fees and expenses.
For the three months ended March 31, 2009, the Currency Series recorded net loss on investments of $674,397, net interest of $18,768, and total expenses of $170,945, resulting in a net decrease in Owners’ capital from operations of $826,574. The NAV per Unit, Class 1, decreased from $96.19 at December 31, 2008, to $90.63 as of March 31, 2009. The NAV per Unit, Class 2, decreased from $109.30 at December 31, 2008, to $103.75 as of March 31, 2009. Total Class 1 subscriptions and redemptions for the three months ending March 31, 2009 were $299,089, and $619,586, respectively. Total Class 2 subscriptions and redemptions for the three months ending March 31, 2009, were $37,000 and $124,876, respectively. Ending capital at March 31, 2009, was $10,900,210 for Class 1 and $2,711,628 for Class 2. Ending capital at December 31, 2008, was $11,900,185 for Class 1 and $2,946,600 for Class 2.
The Currency Series may have both long and short exposure to the Currencies sector only. See comments above under Market Conditions for Three Months Ended March 31, 2009, for additional information regarding these sectors.
Because all returns are from the Currencies sector, there are no Sector Attribution charts for the Currency Series.
67
Table of Contents
Long Only Commodity Series
2010
The Long Only Commodity Series – Class 1 NAV lost 4.1% for the three months ended March 31, 2010, net of fees and expenses; the Long Only Commodity Series – Class 2 NAV lost 3.6% for the three months ended March 31, 2010, net of fees and expenses.
For the three months ended March 31, 2010, the Long Only Commodity Series recorded net loss on investments of $169,833, net interest of $23,024, and total expenses of $36,737, resulting in a net increase in Owners’ capital from operations of $183,546. The NAV per Unit, Class 1, decreased from $83.59 at December 31, 2009 to $80.20 as of March 31, 2010. The NAV per Unit, Class 2, decreased from $90.30 at December 31, 2009, to $87.06 as of March 31, 2010. Total Class 1 subscriptions and redemptions for the three months were $233 and $222,156, respectively. Total Class redemptions for the three months were $22,533. There were no subscriptions. Ending capital at March 31, 2010, was $3,339,646 for Class 1 and $449,339 for Class 2. Ending capital at December 31, 2009, was $3,711,581 for Class 1 and $954,744 for Class 2.
The Long Only Commodity Series may have long-only exposure in the Energies, Metals, and Commodities sectors. See comments above under Market Conditions for Three Months Ended March 31, 2010, for additional information regarding these sectors.
The Long Only Commodity Series invests approximately equally in the Jefferies Commodity Performance Index and the Reuters/Jefferies CRB Index. There are no Sector Attribution charts for the Long Only Commodity Series.
2009
The Long Only Commodity Series – Class 1 NAV lost 6.1% for the three months ended March 31, 2009, net of fees and expenses; the Long Only Commodity Series – Class 2 NAV lost 5.6% for the three months ended March 31, 2009, net of fees and expenses.
For the three months ended March 31, 2009, the Long Only Commodity Series recorded net loss on investments of $232,988, net interest of $18,837, and total expenses of $32,232, resulting in a net decrease in Owners’ capital from operations of $246,383. The NAV per Unit, Class 1, decreased from $70.31 at December 31, 2008 to $66.04 as of March 31, 2009. The NAV per Unit, Class 2, decreased from $74.46 at December 31, 2008, to $70.28 as of March 31, 2009. Total Class 1 subscriptions and redemptions for the three months were $312,915 and $209,374, respectively. Total Class 2 subscriptions and redemptions for the three months were $69,800 and $45,052, respectively. Ending capital at March 31, 2009, was $3,156,061 for Class 1 and $768,318 for Class 2. Ending capital at December 31, 2008, was $3,254,226 for Class 1 and $788,247 for Class 2
The Long Only Commodity Series may have long-only exposure in the Energies, Metals, and Commodities sectors. See comments above under Market Conditions for Three Months Ended March 31, 2009, for additional information regarding these sectors.
The Long Only Commodity Series invests approximately equally in the Jefferies Commodity Performance Index and the Reuters/Jefferies CRB Index. There are no Sector Attribution charts for the Long Only Commodity Series.
Managed Futures Index Series
2010
The Managed Futures Index Series – Class 1 NAV lost 0.9% for the three months ended March 31, 2010, net of fees and expenses; the Managed Futures Index Series – Class 2 NAV lost 0.4% for the three months ended March 31, 2010, net of fees and expenses.
For the three months ended March 31, 2010 the Managed Futures Index Series recorded a net loss on investments of $39,308, net interest of $10,876, and total expenses of $41,069, resulting in a net decrease in Owners’ capital from operations of $69,501. The NAV per Unit, Class 1, decreased from $112.54 at December 31, 2009, to $111.54 as of March 31, 2010. The NAV per
68
Table of Contents
Unit, Class 2, decreased from $121.28 at December 31, 2009, to $120.80 as of March 31, 2010. Total Class 1 redemptions for the three months were $80,973. There were no subscriptions. Total Class 2 subscriptions and redemptions for the three months were $2,000,000 and $19,713, respectively. Ending capital at March 31, 2010, was $1,734,680 for Class 1 and $3,868,342 for Class 2. Ending capital at December 31, 2009, was $1,831,435 for Class 1 and $1,941,774 for Class 2.
The Managed Futures Index Series may have both long and short exposure to the Interest Rates, Currencies, Stock Indices, Energies, Metals, and Commodities sectors. See comments above under Market Conditions for Three Months Ended March 31, 2010, for additional information regarding these sectors.
69
Table of Contents
Sector Attribution for the Managed Futures Index Series
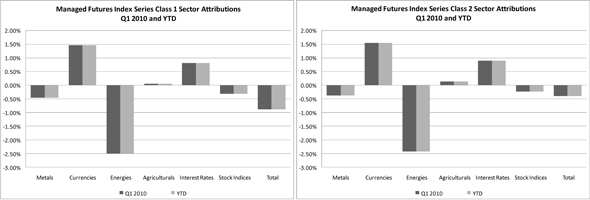
2009
The Managed Futures Index Series – Class 1 NAV lost 6.4% for the three months ended March 31, 2009, net of fees and expenses; the Managed Futures Index Series – Class 2 NAV lost 6.0% for the three months ended March 31, 2009, net of fees and expenses.
For the three months ended March 31, 2009 the Managed Futures Index Series recorded a net loss on investments of $208,699, net interest of $14,579, and total expenses of $31,643, resulting in a net decrease in Owners’ capital from operations of $225,763. The NAV per Unit, Class 1, decreased from $132.18 at December 31, 2008, to $123.68 as of March 31, 2009. The NAV per Unit, Class 2, decreased from $139.70 at December 31, 2008, to $131.33 as of March 31, 2009. Total Class 1 subscriptions and redemptions for the three months were $368,574 and $482,939, respectively. Total Class 2 subscriptions and redemptions for the three months were $678,638. There were no redemptions. Ending capital at March 31, 2009, was $2,015,785 for Class 1 and $1,725,776 for Class 2. Ending capital at December 31, 2008, was $2,266,977 for Class 1 and $1,136,074 for Class 2.
The Managed Futures Index Series may have both long and short exposure to the Interest Rates, Currencies, Stock Indices, Energies, Metals, and Commodities sectors. See comments above under Market Conditions for Three Months Ended March 31, 2009, for additional information regarding these sectors.
Sector Attribution for the Managed Futures Index Series
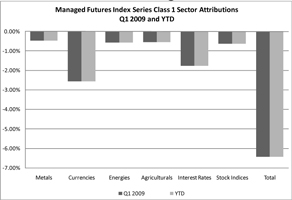
70
Table of Contents
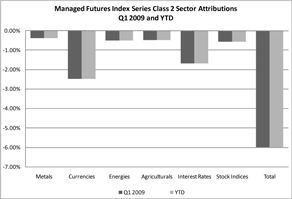
71
Table of Contents
Winton Series
2010
The Winton Series – Class 1 NAV gained 4.9% for the three months ended March 31, 2010, net of fees and expenses; the Winton Series – Class 2 NAV gained 5.7% for the three months ended March 31, 2010, net of fees and expenses.
For the three months ended March 31, 2010, the Winton Series recorded net gain on investments of $3,631,250, net interest of $28,507, and total expenses of $799,460, resulting in a net increase in Owners’ capital from operations of $2,860,297. The NAV per Unit, Class 1, increased from $117.57 at December 31, 2009, to $123.35 as of March 31, 2010. The NAV per Unit, Class 2, increased from $130.10 at December 31, 2009, to $137.51 as of March 31, 2010. Total Class 1 subscriptions for the three months were $63,725 and redemptions were $1,626,579. Total Class 2 redemptions for the three month period were $280,111. There were no subscriptions. Ending capital at March 31, 2010, was $48,940,862 for Class 1 and $10,478,649 for Class 2. Ending capital at December 31, 2009, was $48,198,317 for Class 1 and $10,203,862 for Class 2.
The Winton Series may have both long and short exposure to the Interest Rates, Currencies, Stock Indices, Energies, Metals, and Commodities sectors. See comments above under Market Conditions for Three Months Ended March 31, 2010, for additional information regarding these sectors.
Sector Attribution for the Winton Series
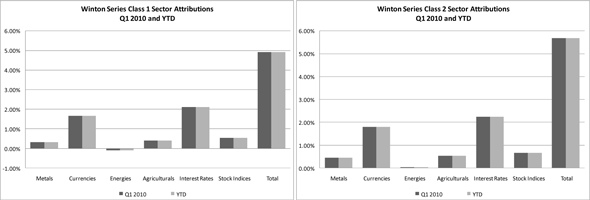
2009
The Winton Series – Class 1 NAV lost 2.3% for the three months ended March 31, 2009, net of fees and expenses; the Winton Series – Class 2 NAV lost 1.6% for the three months ended March 31, 2009, net of fees and expenses.
For the three months ended March 31, 2009, the Winton Series recorded net loss on investments of $1,393,512, net interest of $204,074, and total expenses of $917,209, resulting in a net decrease in Owners’ capital from operations of $1,551,743 after minority interests of 554,904. The NAV per Unit, Class 1, decreased from $130.41 at December 31, 2008, to $127.43 as of March 31, 2009. The NAV per Unit, Class 2, decreased from $140.04 at December 31, 2008, to $137.86 as of March 31, 2009. Total Class 1 subscriptions for the three months were $79,311 and redemptions were $2,061,117. Total Class 2 subscriptions and redemptions for the three month period were $0, and $115,823, respectively. Ending capital at March 31, 2009, was $58,931,735 for Class 1 and $11,445,919 for Class 2. Ending capital at December 31, 2008, was $62,283,659 for Class 1 and $11,743,367 for Class 2.
The Winton Series may have both long and short exposure to the Interest Rates, Currencies, Stock Indices, Energies, Metals, and Commodities sectors. See comments above under Market Conditions for Three Months Ended March 31, 2009, for additional information regarding these sectors.
72
Table of Contents
Sector Attribution for the Winton Series
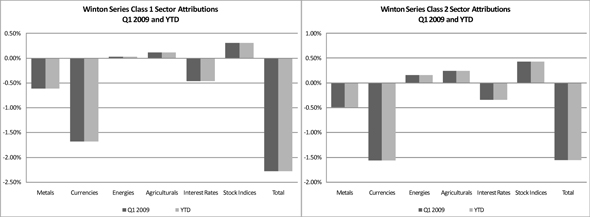
Winton/Graham Series
2010
The Winton/Graham Series – Class 1 NAV lost 0.5% for the three months ended March 31, 2010, net of fees and expenses; the Winton/Graham Series – Class 2 NAV gained 0.2% for the three months ended March 31, 2010, net of fees and expenses.
For the three months ended March 31, 2010, the Winton/Graham Series recorded net loss on investments of $457,522, net interest of $82,233, and total expenses of $875,800, resulting in a net decrease in Owners’ capital from operations of $277,673, after non-controlling interest of $973,416. The NAV per Unit, Class 1, decreased from $ 110.06 at December 31, 2009, to $109.47 as of March 31, 2010. The NAV per Unit, Class 2, increased from $128.39 at December 31, 2009, to $128.65 as of March 31, 2010. Total Class 1 subscriptions and redemptions for the three months were $36,273 and $1,572,406, respectively. Total Class 2 redemptions for the three months were $281,214. There were no subscriptions. Ending capital at March 31, 2010, was $46,333,536 for Class 1 and $12,262,317 for Class 2. Ending capital at December 31, 2009, was $48,168,395 for Class 1 and $12,522,478 for Class 2.
The Winton/Graham Series may have both long and short exposure to the Interest Rates, Currencies, Stock Indices, Energies, Metals, and Commodities sectors. See comments above under Market Conditions for Three Months Ended March 31, 2010, for additional information regarding these sectors.
Sector Attribution for the Winton/Graham Series
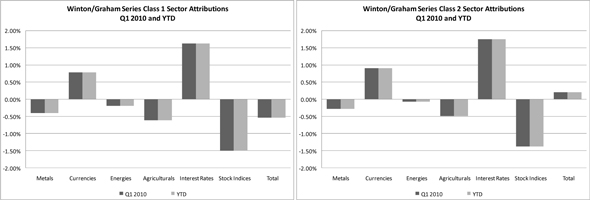
73
Table of Contents
2009
The Winton/Graham Series – Class 1 NAV lost 2.6% for the three months ended March 31, 2009, net of fees and expenses; the Winton/Graham Series – Class 2 NAV lost 1.9% for the three months ended March 31, 2009, net of fees and expenses.
For the three months ended March 31, 2009, the Winton/Graham Series recorded net loss on investments of $924,910, net interest of $99,515, and total expenses of $625,166, resulting in a net decrease in Owners’ capital from operations of $1,450,561. The NAV per Unit, Class 1, decreased from $ 116.18 at December 31, 2008, to $113.12 as of March 31, 2009. The NAV per Unit, Class 2, decreased from $131.49 at December 31, 2008, to $128.99 as of March 31, 2009. Total Class 1 subscriptions and redemptions for the three months were $11,305,029 and $1,361,605, respectively. Total Class 2 subscriptions and redemptions for the three months were $360,401 and $419,044, respectively. Ending capital at March 31, 2009, was $44,529,423 for Class 1 and $14,100,026 for Class 2. Ending capital at December 31, 2008, was $35,760,835 for Class 1 and $14,434,394 for Class 2.
The Winton/Graham Series may have both long and short exposure to the Interest Rates, Currencies, Stock Indices, Energies, Metals, and Commodities sectors. See comments above under Market Conditions for Three Months Ended March 31, 2009, for additional information regarding these sectors.
Sector Attribution for the Winton/Graham Series
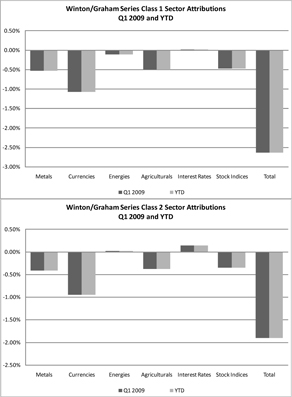
74
Table of Contents
Contractual Obligations
None.
| ITEM 3. | QUANTITATIVE AND QUALITATIVE DISCLOSURES ABOUT MARKET RISK |
The Series are speculative commodity pools. The market sensitive instruments which are held by the Trading Companies in which the Series are invested are acquired for speculative trading purposes, and all or a substantial amount of the Series’ assets are subject to the risk of trading loss. Unlike an operating company, the risk of market sensitive instruments is integral, not incidental, to the Series’ main line of business.
Market movements result in frequent changes in the fair market value of each Trading Company’s open positions and, consequently, in each Series of the Trust’s earnings and cash flow. The Trading Companies’ and consequently the Series’ market risk is influenced by a wide variety of factors, including the level and volatility of exchange rates, interest rates, equity price levels, the market value of financial instruments and contracts, the diversification effects among the open positions and the liquidity of the markets in which trades are made.
Each Trading Company rapidly acquires and liquidates both long and short positions in a wide range of different markets. Consequently, it is not possible to predict how a particular future market scenario will affect performance, and the past performance for any Series is not necessarily indicative of the future results of such Series.
The Trading Companies’ and consequently the Series’ primary market risk exposures as well as the strategies used and to be used by the Trading Advisors for managing such exposures are subject to numerous uncertainties, contingencies and risks, any one of which could cause the actual results of the Trust’s and the Managing Owner’s risk controls to differ materially from the objectives of such strategies. Government interventions, defaults and expropriations, illiquid markets, the emergence of dominant fundamental factors, political upheavals, changes in historical price relationships, an influx of new market participants, increased regulation and many other factors could result in material losses as well as in material changes to the risk exposures and the risk management strategies of the Trading Companies and consequently the Trust. There can be no assurance that the Trading Companies’ current market exposure and/or risk management strategies will not change materially or that any such strategies will be effective in either the short- or longterm. Investors must be prepared to lose all or substantially all of their investment in a Series.
Quantitative Market Risk
Trading Risk
The Series’ approximate risk exposure in the various market sectors traded by its trading advisors is quantified below in terms of value at risk. Due to the Series’ mark-to-market accounting, any loss in the fair value of the Series’ (through the Trading Companies) open positions is directly reflected in the Series’ earnings, realized or unrealized.
Exchange maintenance margin requirements have been used by the Trust as the measure of its value at risk. Maintenance margin requirements are set by exchanges to equal or exceed the maximum losses reasonably expected to be incurred in the fair value of any given contract in 95% to 99% of any one-day interval. The maintenance margin levels are established by brokers, dealers and exchanges using historical price studies as well as an assessment of current market volatility and economic fundamentals to provide a probabilistic estimate of the maximum expected near-term one-day price fluctuation. Maintenance margin has been used rather than the more generally available initial margin, because initial margin includes a credit risk component that is not relevant to value at risk.
In the case of market sensitive instruments that are not exchange-traded, including currencies and some energy products and metals, the margin requirements for the equivalent futures positions have been used as value at risk. In those cases in which a futures- equivalent margin is not available, dealers’ margins have been used.
In the case of contracts denominated in foreign currencies, the value at risk figures include foreign currency margin amounts converted into U.S. Dollars with an incremental adjustment to reflect the exchange rate risk inherent to the Series, which is valued in U.S. Dollars, in expressing value at risk in a functional currency other than U.S. Dollars.
In quantifying each Series’ value at risk, 100% positive correlation in the different positions held in each market risk category has been assumed. Consequently, the margin requirements applicable to the open contracts have simply been aggregated to determine each trading category’s aggregate value at risk. The diversification effects resulting from the fact that the Series’ positions held through the Trading Companies are rarely, if ever, 100% positively correlated have not been reflected.
75
Table of Contents
Value at Risk by Market Sectors
The following table presents the trading value at risk associated with each Series’ exposure to open positions (as held by the Trading Companies) by market sector as of March 31, 2010 and December 31, 2009. All open position trading risk exposures of the Series have been included in calculating the figures set forth below.
Frontier Diversified Series: (1)
| MARKET SECTOR |
March 31, 2010 | December 31, 2009 | ||||||||||
| VALUE AT RISK |
% OF TOTAL CAPITALIZATION |
VALUE AT RISK |
% OF TOTAL CAPITALIZATION |
|||||||||
| Interest Rates |
$ | 1,320,031 | 1.3 | % | $ | 810,969 | 1.2 | % | ||||
| Currencies |
$ | 1,210,978 | 1.2 | % | $ | 635,006 | 0.9 | % | ||||
| Stock Indices |
$ | 2,159,187 | 2.1 | % | $ | 1,117,679 | 1.7 | % | ||||
| Metals |
$ | 572,902 | 0.6 | % | $ | 219,940 | 0.3 | % | ||||
| Agriculturals/Softs |
$ | 1,703,900 | 1.7 | % | $ | 757,524 | 1.1 | % | ||||
| Energy |
$ | 2,588,848 | 2.6 | % | $ | 385,978 | 0.6 | % | ||||
| Total: |
$ | 9,555,846 | 9.5 | % | $ | 3,927,096 | 5.8 | % | ||||
76
Table of Contents
Frontier Dynamic Series: (2)
| MARKET SECTOR |
March 31, 2010 | December 31, 2009 | ||||||||||
| VALUE AT RISK |
% OF TOTAL CAPITALIZATION |
VALUE AT RISK |
% OF TOTAL CAPITALIZATION |
|||||||||
| Interest Rates |
$ | — | 0 | % | $ | — | 0 | % | ||||
| Currencies |
$ | — | 0 | % | $ | — | 0 | % | ||||
| Stock Indices |
$ | — | 0 | % | $ | — | 0 | % | ||||
| Metals |
$ | — | 0 | % | $ | — | 0 | % | ||||
| Agriculturals/Softs |
$ | — | 0 | % | $ | — | 0 | % | ||||
| Energy |
$ | — | 0 | % | $ | — | 0 | % | ||||
| Total: |
$ | — | 0 | % | $ | — | 0 | % | ||||
Frontier Long/Short Commodity Series:
| MARKET SECTOR |
March 31, 2010 | December 31, 2009 | ||||||||||
| VALUE AT RISK |
% OF TOTAL CAPITALIZATION |
VALUE AT RISK |
% OF TOTAL CAPITALIZATION |
|||||||||
| Interest Rates |
$ | 303,162 | 0.5 | % | $ | 458,373 | 0.7 | % | ||||
| Currencies |
$ | 168,226 | 0.3 | % | $ | 123,312 | 0.2 | % | ||||
| Stock Indices |
$ | 344,395 | 0.5 | % | $ | 214,885 | 0.3 | % | ||||
| Metals |
$ | 277,912 | 0.4 | % | $ | 739,536 | 1.1 | % | ||||
| Agriculturals/Softs |
$ | 4,563,397 | 6.8 | % | $ | 3,885,971 | 5.6 | % | ||||
| Energy |
$ | 13,092,345 | 19.5 | % | $ | 2,532,008 | 3.7 | % | ||||
| Total: |
$ | 18,749,437 | 28.0 | % | $ | 7,954,085 | 11.6 | % | ||||
Frontier Masters Series: (3)
| MARKET SECTOR |
March 31, 2010 | December 31, 2009 | ||||||||||
| VALUE AT RISK |
% OF TOTAL CAPITALIZATION |
VALUE AT RISK |
% OF TOTAL CAPITALIZATION |
|||||||||
| Interest Rates |
$ | 482,592 | 1.7 | % | $ | 362,224 | 1.3 | % | ||||
| Currencies |
$ | 560,443 | 2.0 | % | $ | 273,070 | 1.0 | % | ||||
| Stock Indices |
$ | 472,449 | 1.6 | % | $ | 317,394 | 1.1 | % | ||||
| Metals |
$ | 158,853 | 0.6 | % | $ | 91,585 | 0.3 | % | ||||
| Agriculturals/Softs |
$ | 139,070 | 0.5 | % | $ | 186,311 | 0.7 | % | ||||
| Energy |
$ | 108,156 | 0.4 | % | $ | 65,552 | 0.2 | % | ||||
| Total: |
$ | 1,921,563 | 6.8 | % | $ | 1,296,136 | 4.6 | % | ||||
77
Table of Contents
Balanced Series: (4), (5)
| March 31, 2010 | December 31, 2009 | |||||||||||
| MARKET SECTOR |
VALUE AT RISK |
% OF TOTAL CAPITALIZATION |
VALUE AT RISK |
% OF TOTAL CAPITALIZATION |
||||||||
| Interest Rates |
$ | 6,038,957 | 1.7 | % | $ | 8,664,284 | 2.3 | % | ||||
| Currencies |
$ | 5,064,550 | 1.4 | % | $ | 6,765,682 | 1.8 | % | ||||
| Stock Indices |
$ | 13,272,981 | 3.6 | % | $ | 14,042,370 | 3.7 | % | ||||
| Metals |
$ | 2,753,230 | 0.8 | % | $ | 1,954,885 | 0.5 | % | ||||
| Agriculturals/Softs |
$ | 8,952,425 | 2.5 | % | $ | 6,682,314 | 1.8 | % | ||||
| Energy |
$ | 12,746,064 | 3.5 | % | $ | 3,315,748 | 0.9 | % | ||||
| Total: |
$ | 48,828,207 | 13.5 | % | $ | 41,461,283 | 11.0 | % | ||||
Campbell/Graham/Tiverton Series:
| March 31, 2010 | December 31, 2009 | |||||||||||
| MARKET SECTOR |
VALUE AT RISK |
% OF TOTAL CAPITALIZATION |
VALUE AT RISK |
% OF TOTAL CAPITALIZATION |
||||||||
| Interest Rates |
$ | 3,159,961 | 4.2 | % | $ | 1,896,966 | 2.4 | % | ||||
| Currencies |
$ | 4,117,114 | 5.5 | % | $ | 2,228,877 | 2.8 | % | ||||
| Stock Indices |
$ | 2,534,897 | 3.4 | % | $ | 1,163,045 | 1.5 | % | ||||
| Metals |
$ | 357,258 | 0.5 | % | $ | 195,419 | 0.2 | % | ||||
| Agriculturals/Softs |
$ | 992,788 | 1.3 | % | $ | 755,928 | 1.0 | % | ||||
| Energy |
$ | 430,053 | 0.6 | % | $ | 133,992 | 0.2 | % | ||||
| Total: |
$ | 11,592,071 | 15.5 | % | $ | 6,374,227 | 8.1 | % | ||||
Currency Series: (6)
| March 31, 2010 | December 31, 2009 | |||||||||||
| MARKET SECTOR |
VALUE AT RISK |
% OF TOTAL CAPITALIZATION |
VALUE AT RISK |
% OF TOTAL CAPITALIZATION |
||||||||
| Interest Rates |
$ | — | 0 | % | $ | — | 0 | % | ||||
| Currencies |
$ | 551,339 | 2.6 | % | $ | 166,661 | 0.7 | % | ||||
| Stock Indices |
$ | — | 0 | % | $ | — | 0 | % | ||||
| Metals |
$ | — | 0 | % | $ | — | 0 | % | ||||
| Agriculturals/Softs |
$ | — | 0 | % | $ | — | 0 | % | ||||
| Energy |
$ | — | 0 | % | $ | — | 0 | % | ||||
| Total: |
$ | 551,339 | 2.6 | % | $ | 166,661 | 0.7 | % | ||||
78
Table of Contents
Long Only Commodity Series:
| March 31, 2010 | December 31, 2009 | |||||||||||
| MARKET SECTOR |
VALUE AT RISK |
% OF TOTAL CAPITALIZATION |
VALUE AT RISK |
% OF TOTAL CAPITALIZATION |
||||||||
| Interest Rates |
$ | — | 0.0 | % | $ | — | 0.0 | % | ||||
| Currencies |
$ | — | 0.0 | % | $ | — | 0.0 | % | ||||
| Stock Indices |
$ | — | 0.0 | % | $ | — | 0.0 | % | ||||
| Metals |
$ | 105,600 | 2.5 | % | $ | 110,400 | 2.4 | % | ||||
| Agriculturals/Softs |
$ | 149,600 | 3.5 | % | $ | 156,400 | 3.4 | % | ||||
| Energy |
$ | 184,800 | 4.4 | % | $ | 193,200 | 4.1 | % | ||||
| Total: |
$ | 440,000 | 10.4 | % | $ | 460,000 | 9.9 | % | ||||
Managed Futures Index Series:
| March 31, 2010 | December 31, 2009 | |||||||||||
| MARKET SECTOR |
VALUE AT RISK |
% OF TOTAL CAPITALIZATION |
VALUE AT RISK |
% OF TOTAL CAPITALIZATION |
||||||||
| Interest Rates |
$ | 193,967 | 3.5 | % | $ | 85,348 | 2.3 | % | ||||
| Currencies |
$ | 189,881 | 3.4 | % | $ | 87,620 | 2.3 | % | ||||
| Stock Indices |
$ | 96,402 | 1.7 | % | $ | 95,314 | 2.5 | % | ||||
| Metals |
$ | 12,508 | 0.2 | % | $ | 5,542 | 0.1 | % | ||||
| Agriculturals/Softs |
$ | 39,121 | 0.7 | % | $ | 33,252 | 0.9 | % | ||||
| Energy |
$ | 18,629 | 0.3 | % | $ | 14,409 | 0.4 | % | ||||
| Total: |
$ | 550,508 | 9.8 | % | $ | 321,485 | 8.5 | % | ||||
Winton Series:
| MARKET SECTOR |
March 31, 2010 | December 31, 2009 | ||||||||||
| VALUE AT RISK |
% OF TOTAL CAPITALIZATION |
VALUE AT RISK |
% OF TOTAL CAPITALIZATION |
|||||||||
| Interest Rates |
$ | 1,558,959 | 2.6 | % | $ | 1,363,844 | 2.3 | % | ||||
| Currencies |
$ | 2,665,362 | 4.5 | % | $ | 1,337,445 | 2.3 | % | ||||
| Stock Indices |
$ | 1,431,932 | 2.4 | % | $ | 1,365,395 | 2.3 | % | ||||
| Metals |
$ | 398,684 | 0.7 | % | $ | 353,132 | 0.6 | % | ||||
| Agriculturals/Softs |
$ | 566,744 | 1.0 | % | $ | 577,065 | 1.0 | % | ||||
| Energy |
$ | 260,174 | 0.4 | % | $ | 60,996 | 0.1 | % | ||||
| Total: |
$ | 6,881,855 | 11.6 | % | $ | 5,057,877 | 8.6 | % | ||||
79
Table of Contents
Winton/Graham Series:
| March 31, 2010 | December 31, 2009 | |||||||||||
| MARKET SECTOR |
VALUE AT RISK |
% OF TOTAL CAPITALIZATION |
VALUE AT RISK |
% OF TOTAL CAPITALIZATION |
||||||||
| Interest Rates |
$ | 2,759,774 | 4.7 | % | $ | 1,816,487 | 3.0 | % | ||||
| Currencies |
$ | 4,415,246 | 7.5 | % | $ | 2,252,403 | 3.7 | % | ||||
| Stock Indices |
$ | 2,821,687 | 4.8 | % | $ | 1,411,504 | 2.3 | % | ||||
| Metals |
$ | 374,426 | 0.6 | % | $ | 335,103 | 0.6 | % | ||||
| Agriculturals/Softs |
$ | 1,176,249 | 2.0 | % | $ | 975,542 | 1.6 | % | ||||
| Energy |
$ | 479,322 | 0.8 | % | $ | 148,812 | 0.2 | % | ||||
| Total: |
$ | 12,026,704 | 20.4 | % | $ | 6,939,851 | 11.4 | % | ||||
| (1) | As of March 31, 2010 and December 31, 2009, a portion of the assets of the Frontier Diversified Series was invested in an Option basket of futures contracts with a notional value of $18,837,577 and $22,760,455, respectively. Margin information is not available for this contract therefore no value at risk calculations were included in the table for this investment. |
| (2) | As of March 31, 2010 and December 31, 2009, a portion of the assets of the Frontier Dynamic Series was invested in an Option basket of futures contracts with a notional value of $30,862,619 and $25,875,001, respectively. Margin information is not available for this contract therefore no value at risk calculations were included in the table for this investment. |
| (3) | As of March 31, 2010 and December 31, 2009, a portion of the assets of the Frontier Masters Series was invested in an Option basket of futures contracts with a notional value of $16,539,938 and $15,972,157, respectively. Margin information is not available for this contract therefore no value at risk calculations were included in the table for this investment. |
| (4) | As of March 31, 2010 and December 31, 2009, a portion of the assets of the Balanced Series was invested in the Currency Series, Frontier Diversified Series, Frontier Dynamic Series and Frontier Masters Series. The Balanced Series effective ownership in these Series as of March 31, 2010 was 59.3%, 10.8%, 96.2% and 30.3%, respectively. As of December 31, 2009 the Balanced Series effective ownership was 54.6%, 16.3%, 66.7% and 63.6%, respectively. Including its investment in this Series, total value at risk for the Balanced Series would be $50,764,222, or 13.9% of capitalization as of March 31, 2010 and $43,016,998, or 11.4% of capitalization as of December 31, 2009. |
| (5) | As of March 31, 2010 and December 31, 2009, a portion of the assets of the Balanced Series was invested in an Option basket of futures contracts with a notional value of $97,148,337 and $129,084,678, respectively. Margin information is not available for this contract therefore no value at risk calculations were included in the table for this investment. |
| (6) | As of March 31, 2010 and December 31, 2009, a portion of the assets of the Currency Series was invested in an Option basket of futures contracts with a notional value of $15,900,347 and $15,426,942, respectively. Margin information is not available for this contract therefore no value at risk calculations were included in the table for this investment. |
Material Limitations on Value at Risk as an Assessment of Market Risk
The face value of the market sector instruments held on behalf of the Series is typically many times the applicable maintenance margin requirement, which generally ranges between approximately 1 % and 10% of the contract’s face value, as well as many times the capitalization of the Series. The magnitude of each Series’ open positions creates a risk of loss not typically found in most other investment vehicles. Because of the size of their positions, certain market conditions, although unusual, but historically recurring from time to time, could cause a Series to incur severe losses over a short period of time. The value at risk tables above, as well as the past performance of the Series, gives no indication of this risk of loss.
Non-Trading Risk
The Series have non-trading market risk on their foreign cash balances not needed for margin. However, these balances, as well as the market risk they represent, are immaterial. The Series also have non-trading market risk as a result of investing a portion of their available assets in U.S. government securities which include any security issued or guaranteed as to principal or interest by the United States, or by a person controlled by or supervised by and acting as an instrumentality of the government of the United States pursuant to authority granted by Congress of the United States or any certificate of deposit for any of the foregoing, including U.S. treasury bonds, U.S. treasury bills and issues of agencies of the U.S. government, and certain cash items such as money market funds, certificates of deposit (under nine months) and time deposits. The market risk represented by these investments is also immaterial.
Qualitative Market Risk
The following are the primary trading risk exposures of the Series of the Trust as of March 31, 2010, by market sector.
80
Table of Contents
Interest rates
Interest rate risk is one of the principal market exposures of each Series. Interest rate movements directly affect the price of interest rate futures positions held and indirectly the value of a Trading Company’s stock index and currency positions. Interest rate movements in one country as well as relative interest rate movements between countries materially impact profitability. The primary interest rate exposure is to interest rate fluctuations in the United States and the other G-7 countries. However, the Trading Companies also may take futures positions on the government debt of smaller nations. The Managing Owner anticipates that G-7 interest rates will remain the primary market exposure of each Trading Company and accordingly of each Series for the foreseeable future. The changes in interest rates which are expected to have the most effect on the Series are changes in long-term, as opposed to short-term rates. Most of the speculative positions to be held by the Trading Companies will be in medium- to long-term instruments. Consequently, even a material change in short-term rates is expected to have little effect on the Series if the medium- to long-term rates remain steady. Aggregate interest income from all sources, including assets held at clearing brokers, up to 2% (annualized) is paid to the Managing Owner by the Balanced Series (Class 1 and Class 2 only), Winton Series, Campbell/Graham/Tiverton Series, Currency Series and Winton/Graham Series. For the Balanced Series (Class 1a and Class 2a only), Long Only Commodity Series, Frontier Long/Short Commodity Series, Managed Futures Index Series, Frontier Diversified Series, Frontier Dynamic Series and Frontier Masters Series, 20% of the total interest allocated to each Series is paid to the Managing Owner. In addition, if interest rates fall below 0.75%, the Managing Owner is paid the difference between the Trust’s annualized interest income that is allocated to each of such Series and 0.75%. Interest income above what is paid to the Managing Owner is retained by the Series.
Currencies
Exchange rate risk is a significant market exposure of each Series of the Trust in general and the Currency Series in particular. For each Series of the Trust in general, and the Currency Series in particular, currency exposure is to exchange rate fluctuations, primarily fluctuations that disrupt the historical pricing relationships between different currencies and currency pairs. These fluctuations are influenced by interest rate changes as well as political and general economic conditions. The Trading Advisors on behalf of a Series trade in a large number of currencies, including cross-rates, which are positions between two currencies other than the U.S. Dollar. The Managing Owner does not anticipate that the risk profile of the Series’ currency sector will change significantly in the future.
Stock Indices
For each Series (other than the Currency Series), its primary equity exposure is equity price risk in the G-7 countries as well as other smaller jurisdictions. Each Series of the Trust (other than the Currency Series) is primarily exposed to the risk of adverse price trends or static markets in the major U.S., European and Japanese indices.
Metals
For each Series (other than the Currency Series), its metals market exposure is fluctuations in the price of both precious metals, including gold and silver, as well as base metals including aluminum, copper, nickel and zinc. Some metals, such as gold, are used as surrogate stores of value, in place of hard currency, and thus have an associated currency or interest rate risk associated with them relative to their price in a specific currency. Other metals, such as silver, platinum, copper and steel, have substantial industrial applications, and may be subject to forces affecting industrial production and demand.
Agriculturals/Softs
Each Series (other than the Currency Series) may also invest in raw commodities and may thus have exposure to agricultural price movements, which are often directly affected by severe or unexpected weather conditions or by political events in countries that comprise significant sources of commodity supply.
Energy
For each Series (other than the Currency Series), its primary energy market exposure is in oil, gas and other energy product price movements, often resulting from political developments and ongoing conflicts in the Middle East. Oil and gas prices can be volatile and substantial profits and losses have been and are expected to continue to be experienced in this market.
Other Trading Risks
As a result of leverage, small changes in the price of a Trading Company’s positions may result in substantial losses for a Series. Futures, forwards and options are typically traded on margin. This means that a small amount of capital can be used to invest in contracts of much greater total value. The resulting leverage means that a relatively small change in the market price of a contract can produce a substantial loss. Like other leveraged investments, any purchase or sale of a contract may result in losses in excess of the amount invested in that contract. The Trading Companies may lose more than their initial margin deposits on a trade.
The Trading Companies’ trading is subject to execution risks. Market conditions may make it impossible for the Trading Advisors to
81
Table of Contents
execute a buy or sell order at the desired price, or to close out an open position. Daily price fluctuation limits are established by the exchanges and approved by the CFTC. When the market price of a contract reaches its daily price fluctuation limit, no trades can be executed at prices outside the limit. The holder of a contract may therefore be locked into an adverse price movement for several days or more and lose considerably more than the initial margin put up to establish the position. Thinly traded or illiquid markets also can make it difficult or impossible to execute trades.
The Trading Advisors’ positions are subject to speculative limits. The CFTC and domestic exchanges have established speculative position limits on the maximum futures position which any person, or group of persons acting in concert, may hold or control in particular futures contracts or options on futures contracts traded on U.S. commodity exchanges. Under current regulations, other accounts of the Trading Advisors are combined with the positions held by them on behalf of the applicable Trading Company for position limit purposes. This trading could preclude additional trading in these commodities by the Trading Advisors for the accounts of the Series.
Systematic strategies do not consider fundamental types of data and do not have the benefit of discretionary decision making. The assets of the Series are allocated to Trading Advisors that rely on technical, systematic strategies that do not take into account factors external to the market itself (although certain of these strategies may have minor discretionary elements incorporated into their systematic strategy). The widespread use of technical trading systems frequently results in numerous trading advisors attempting to execute similar trades at or about the same time, altering trading patterns and affecting market liquidity. Furthermore, the profit potential of trend-following systems may be diminished by the changing character of the markets, which may make historical price data (on which technical programs are based) only marginally relevant to future market patterns. Systematic strategies are developed on the basis of a statistical analysis of market prices. Consequently, any factor external to the market itself that dominates prices that a discretionary decision maker may take into account may cause major losses for a systematic strategy. For example, a pending political or economic event may be very likely to cause a major price movement, but a systematic strategy may continue to maintain positions indicated by its trading method that might incur major losses if the event proved to be adverse.
However, because certain of the Trading Advisors’ strategies involve some discretionary aspects in addition to their technical factors, certain of the Trading Advisors may occasionally use discretion in investing the assets of a Series. For example, the Trading Advisors often use discretion in selecting contracts and markets to be followed. In exercising such discretion, such Trading Advisor may take positions opposite to those recommended by the Trading Advisor’s trading system or signals. Discretionary decision making may also result in a Trading Advisor failing to capitalize on certain price trends or making unprofitable trades in a situation where another trader relying solely on a systematic approach might not have done so. Furthermore, such use of discretion may not enable the relevant Series of the Trust to avoid losses, and in fact, such use of discretion may cause such Series to forego profits which it may have otherwise earned had such discretion not been used.
Qualitative Disclosures Regarding Means of Managing Risk Exposure
The means by which the Managing Owner attempts to manage the risk of the Trust’s open positions is essentially the same in all market categories traded. The Managing Owner applies risk management policies to trading which generally are designed to limit the total exposure of assets under management. In addition, the Managing Owner follows diversification guidelines which are often formulated in terms of the balanced volatility between markets and correlated groups.
| ITEM 4T. | CONTROLS AND PROCEDURES |
Evaluation of disclosure controls and procedures
Under the supervision and with the participation of the management of the Managing Owner, including its Chief Executive Officer and Chief Financial Officer, the Trust evaluated the effectiveness of the design and operation of the disclosure controls and procedures (as defined in Rule 13(a)-1 5(e) under the Securities Exchange Act of 1934, as amended (the “Exchange Act”), for the Trust and each Series as of March 31, 2010 (the “Evaluation Date”). Any control system, no matter how well designed and operated, can provide only reasonable (not absolute) assurance that its objectives will be met. Furthermore, no evaluation of controls can provide absolute assurance that all control issues and instances of fraud, if any, have been detected. Based upon our evaluation, the Chief Executive Officer and Chief Financial Officer of the Managing Owner concluded that, as of the Evaluation Date, the disclosure controls and procedures for the Trust and each Series were effective to provide reasonable assurance that they are timely alerted to the material information relating to the Trust and each Series required to be included in the Trust’s periodic SEC filings.
Changes in Internal Control Over Financial Reporting
There were no changes made in internal controls during this reporting period that have materially affected or are reasonably likely to materially affect the internal controls over financial reporting for the Trust or any Series.
82
Table of Contents
Scope of Exhibit 31 Certifications
The certifications of the Chief Executive Officer and the Chief Financial Officer of the Managing Owner included as Exhibits 31.1 and 31.2, respectively, to this Form 10-Q apply not only to the Trust as a whole but also to each Series individually.
83
Table of Contents
PART II. OTHER INFORMATION
| ITEM 1. | LEGAL PROCEEDINGS. |
None
| ITEM 1A. | RISK FACTORS. |
The section entitled “Risk Factors” beginning on page 21 of Amendment No. 1 to the Registration Statement on Form S-1 (File No. 333-164629) is incorporated by reference into this section.
| ITEM 2. | UNREGISTERED SALES OF EQUITY SECURITIES AND USE OF PROCEEDS. |
The following table provides information regarding the sale of unregistered Units by the Registrant for the three months ended March 31, 2010. The number of Units listed below for each transaction is the aggregate number of Units in the particular Series of the Trust purchased in such transaction. The consideration listed below for each transaction is, except as otherwise noted, the aggregate amount of cash paid for the Units purchased. For each transaction reported below, the price per Unit was NAV per Unit at the time of the transaction and the Managing Owner of the Trust was the purchaser of the Units. No underwriting discount or sales commission was paid or received with respect to any of the transactions reported below. The Registrant claims an exemption from registration of each of the transactions listed below under Section 4(2) of the Securities Act, as a sale by an issuer not involving a public offering.
| SERIES |
DATE | UNITS | CONSIDERATION | ||||
| FRONTIER DIVERSIFIED SERIES - 2 |
MARCH 15, 2010 | 2,313.8647 | $ | 220,000 | |||
| FRONTIER MASTERS SERIES - 2 |
MARCH 15, 2010 | 1,907.3053 | $ | 180,000 | |||
| FRONTIER DIVERSIFIED SERIES - 2 |
MARCH 30, 2010 | 1,296.3849 | $ | 125,000 | |||
| FRONTIER MASTERS SERIES - 2 |
MARCH 30, 2010 | 52.0983 | $ | 5,000 | |||
| ITEM 3. | DEFAULTS UPON SENIOR SECURITIES. |
None
| ITEM 4. | OTHER INFORMATION. |
None
| ITEM 5. | EXHIBITS. |
Exhibits (numbered in accordance with Item 601 of Regulation S-K)
| 4.1 |
Declaration of Trust and Amended and Restated Trust Agreement of the Registrant (annexed to the prospectus as Exhibit A) **** | |
| 31.1 | Certification of Principal Executive Officer of the Managing Owner pursuant to Rules 1 3a-14(a) and 15(d)-14(a) of the Securities Exchange Act of 1934 (furnished herewith) | |
| 31.2 | Certification of Principal Executive Officer of the Managing Owner pursuant to Rules 1 3a-14(a) and 1 5(d)-14(a) of the Securities Exchange Act of 1934 (furnished herewith) | |
| 32.1 | Certification pursuant to 18 U.S.C. Section 1350, as enacted by Section 906 of The Sarbanes- Oxley Act of 2002. (furnished herewith) | |
| 32.2 | Certification pursuant to 18 U.S.C. Section 1350, as enacted by Section 906 of The Sarbanes- Oxley Act of 2002. (furnished herewith) | |
84
Table of Contents
| 32.3 |
Certification pursuant to 18 U.S.C. Section 1350, as enacted by Section 906 of The Sarbanes- Oxley Act of 2002. (furnished herewith) | |
| 32.4 |
Certification pursuant to 18 U.S.C. Section 1350, as enacted by Section 906 of The Sarbanes- Oxley Act of 2002. (furnished herewith) | |
| 32.5 |
Certification pursuant to 18 U.S.C. Section 1350, as enacted by Section 906 of The Sarbanes- Oxley Act of 2002. (furnished herewith) | |
| 32.6 |
Certification pursuant to 18 U.S.C. Section 1350, as enacted by Section 906 of The Sarbanes- Oxley Act of 2002. (furnished herewith) | |
| 32.7 |
Certification pursuant to 18 U.S.C. Section 1350, as enacted by Section 906 of The Sarbanes- Oxley Act of 2002. (furnished herewith) | |
| 32.8 |
Certification pursuant to 18 U.S.C. Section 1350, as enacted by Section 906 of The Sarbanes- Oxley Act of 2002. (furnished herewith) | |
| 32.9 |
Certification pursuant to 18 U.S.C. Section 1350, as enacted by Section 906 of The Sarbanes- Oxley Act of 2002. (furnished herewith) | |
| 32.10 |
Certification pursuant to 18 U.S.C. Section 1350, as enacted by Section 906 of The Sarbanes- Oxley Act of 2002. (furnished herewith) | |
| 32.11 |
Certification pursuant to 18 U.S.C. Section 1350, as enacted by Section 906 of The Sarbanes- Oxley Act of 2002. (furnished herewith) | |
| 32.12 |
Certification pursuant to 18 U.S.C. Section 1350, as enacted by Section 906 of The Sarbanes- Oxley Act of 2002. (furnished herewith) | |
| **** | Previously filed as like-numbered exhibit to the initial filing or the first pre-effective amendment or the second, fourth or fifth post-effective amendment to Registration Statement No. 333-140240 and incorporated by reference herein. |
85
Table of Contents
Pursuant to the requirements of the Securities Exchange Act of 1934, the registrant has duly caused this report to be signed on its behalf by the undersigned thereunto duly authorized.
| The Frontier Fund | ||||
| (Registrant) | ||||
| Date: May 12, 2010 | ||||
| By: | /s/ ROBERT J. ENCK | |||
| Robert J. Enck | ||||
| President and Chief Executive Officer of Equinox Fund Management, LLC, the Managing Owner of The Frontier Fund | ||||
86
Table of Contents
SIGNATURES
Pursuant to the requirements of the Securities Exchange Act of 1934, the registrant has duly caused this report to be signed on its behalf by the undersigned thereunto duly authorized.
| Balanced Series, | ||||
| a Series of The Frontier Fund | ||||
| (Registrant) | ||||
| Date: May 12, 2010 | ||||
| By: | /s/ ROBERT J. ENCK | |||
| Robert J. Enck | ||||
| President and Chief Executive Officer of Equinox Fund Management, LLC, the Managing Owner of The Frontier Fund | ||||
87
Table of Contents
SIGNATURES
Pursuant to the requirements of the Securities Exchange Act of 1934, the registrant has duly caused this report to be signed on its behalf by the undersigned thereunto duly authorized.
| Winton/Graham Series, | ||||
| a Series of The Frontier Fund | ||||
| (Registrant) | ||||
| Date: May 12, 2010 | By: | /s/ ROBERT J. ENCK | ||
| Robert J. Enck | ||||
| President and Chief Executive Officer of Equinox Fund Management, LLC, the Managing Owner of The Frontier Fund | ||||
88
Table of Contents
SIGNATURES
Pursuant to the requirements of the Securities Exchange Act of 1934, the registrant has duly caused this report to be signed on its behalf by the undersigned thereunto duly authorized.
| Winton Series, | ||||
| a Series of The Frontier Fund | ||||
| (Registrant) | ||||
| Date: May 12, 2010 | ||||
| By: | /s/ ROBERT J. ENCK | |||
| Robert J. Enck | ||||
| President and Chief Executive Officer of Equinox Fund Management, LLC, the Managing Owner of The Frontier Fund | ||||
89
Table of Contents
SIGNATURES
Pursuant to the requirements of the Securities Exchange Act of 1934, the registrant has duly caused this report to be signed on its behalf by the undersigned thereunto duly authorized.
| Campbell/Graham/Tiverton Series, a Series of The Frontier Fund | ||||
| (Registrant) | ||||
| Date: May 12, 2010 | By: | /s/ ROBERT J. ENCK | ||
| Robert J. Enck | ||||
| President and Chief Executive Officer of Equinox Fund Management, LLC, the Managing Owner of The Frontier Fund | ||||
90
Table of Contents
SIGNATURES
Pursuant to the requirements of the Securities Exchange Act of 1934, the registrant has duly caused this report to be signed on its behalf by the undersigned thereunto duly authorized.
| Currency Series, | ||||
| a Series of The Frontier Fund | ||||
| (Registrant) | ||||
| Date: May 12, 2010 | ||||
| By: | /s/ ROBERT J. ENCK | |||
| Robert J. Enck | ||||
| President and Chief Executive Officer of Equinox Fund Management, LLC, the Managing Owner of The Frontier Fund | ||||
91
Table of Contents
SIGNATURES
Pursuant to the requirements of the Securities Exchange Act of 1934, the registrant has duly caused this report to be signed on its behalf by the undersigned thereunto duly authorized.
| Long Only Commodity Series, a Series of The Frontier Fund | ||||
| (Registrant) | ||||
| Date: May 12, 2010 | By: | /s/ ROBERT J. ENCK | ||
| Robert J. Enck | ||||
| President and Chief Executive Officer of Equinox Fund Management, LLC, the Managing Owner of The Frontier Fund | ||||
92
Table of Contents
SIGNATURES
Pursuant to the requirements of the Securities Exchange Act of 1934, the registrant has duly caused this report to be signed on its behalf by the undersigned thereunto duly authorized.
| Frontier Long/Short Commodity Series, a Series of The Frontier Fund | ||||
| (Registrant) | ||||
| Date: May 12, 2010 | By: | /s/ ROBERT J. ENCK | ||
| ` | Robert J. Enck | |||
| President and Chief Executive Officer of Equinox Fund Management, LLC, the Managing Owner of The Frontier Fund | ||||
93
Table of Contents
SIGNATURES
Pursuant to the requirements of the Securities Exchange Act of 1934, the registrant has duly caused this report to be signed on its behalf by the undersigned thereunto duly authorized.
| Managed Futures Index Series, a Series of The Frontier Fund | ||||
| (Registrant) | ||||
| Date: May 12, 2010 | By: | /s/ ROBERT J. ENCK | ||
| Robert J. Enck | ||||
| President and Chief Executive Officer of Equinox Fund Management, LLC, the Managing Owner of The Frontier Fund | ||||
94
Table of Contents
SIGNATURES
Pursuant to the requirements of the Securities Exchange Act of 1934, the registrant has duly caused this report to be signed on its behalf by the undersigned thereunto duly authorized.
| Frontier Diversified Series, | ||||
| a Series of The Frontier Fund | ||||
| (Registrant) | ||||
| Date: May 12, 2010 | ||||
| By: | /s/ ROBERT J. ENCK | |||
| Robert J. Enck | ||||
| President and Chief Executive Officer of Equinox Fund Management, LLC, the Managing Owner of The Frontier Fund | ||||
95
Table of Contents
SIGNATURES
Pursuant to the requirements of the Securities Exchange Act of 1934, the registrant has duly caused this report to be signed on its behalf by the undersigned thereunto duly authorized.
| Frontier Dynamic Series, | ||||
| a Series of The Frontier Fund | ||||
| (Registrant) | ||||
| Date: May 12, 2010 | ||||
| By: | /s/ ROBERT J. ENCK | |||
| Robert J. Enck | ||||
| President and Chief Executive Officer of Equinox Fund Management, LLC, the Managing Owner of The Frontier Fund | ||||
96
Table of Contents
SIGNATURES
Pursuant to the requirements of the Securities Exchange Act of 1934, the registrant has duly caused this report to be signed on its behalf by the undersigned thereunto duly authorized.
| Frontier Masters Series, | ||||
| a Series of The Frontier Fund | ||||
| (Registrant) | ||||
| Date: May 12, 2010 | ||||
| By: | /s/ ROBERT J. ENCK | |||
| Robert J. Enck | ||||
| President and Chief Executive Officer of Equinox Fund Management, LLC, the Managing Owner of The Frontier Fund | ||||
97
Table of Contents
SUBSIDIARIES OF REGISTRANT
| Name |
State of Incorporation | Name Under Which Such Subsidiary Does Business | ||
| Frontier Trading Company I LLC |
Delaware | Same | ||
| Frontier Trading Company II LLC |
Delaware | Same | ||
| Frontier Trading Company III LLC |
Delaware | Same | ||
| Frontier Trading Company V LLC |
Delaware | Same | ||
| Frontier Trading Company VI, LLC |
Delaware | Same | ||
| Frontier Trading Company VII, LLC |
Delaware | Same | ||
| Frontier Trading Company VIII, LLC |
Delaware | Same | ||
| Frontier Trading Company IX, LLC |
Delaware | Same | ||
| Frontier Trading Company X, LLC |
Delaware | Same | ||
| Frontier Trading Company XI, LLC |
Delaware | Same | ||
| Frontier Trading Company XII, LLC |
Delaware | Same | ||
| Beach Horizon Trading Company – Horizon Program, LLC |
Delaware | Same | ||
| Frontier Trading Company XIV, LLC |
Delaware | Same | ||
| Frontier Trading Company XV, LLC |
Delaware | Same | ||
| QIM Trading Company – Global Program, LLC |
Delaware | Same | ||
| Winton Trading Company – Diversified Program, LLC |
Delaware | Same | ||
| Cantab Trading Company – Aristarchus Program, LLC |
Delaware | Same | ||
| Tiverton Trading Company – Discretionary Program, LLC |
Delaware | Same | ||
98