Attached files
| file | filename |
|---|---|
| 8-K - FORM 8-K - Energy Future Holdings Corp /TX/ | d8k.htm |
 EFH Corp.
2010 Spring Investor Meetings
Discussion Deck
May 2010
Exhibit 99.1 |
 1
Safe Harbor Statement
This
presentation
contains
forward-looking
statements,
which
are
subject
to
various
risks
and
uncertainties.
Discussion
of
risks
and
uncertainties
that
could
cause
actual
results
to
differ
materially
from
management's
current
projections,
forecasts,
estimates
and
expectations
is
contained
in
EFH Corp.'s filings with the Securities and Exchange Commission (SEC).
Regulation G
This
presentation
includes
certain
non-GAAP
financial
measures.
A
reconciliation
of
these
measures
to
the
most
directly
comparable
GAAP
measures is included in the appendix to this presentation.
|
 2
2
nd
largest
competitive
electric generator in US
Largest lignite/coal and
nuclear baseload
generation fleet in Texas
Low-cost lignite reserves
Largest T&D utility in
Texas
High-growth service
territory
Constructive regulatory
regime
Largest retail
electricity provider in
Texas
Strong customer value
proposition
The largest power generator, retail electricity provider and transmission &
distribution utility in Texas.
Energy Future Holdings Overview |
 3
28%
68%
4%
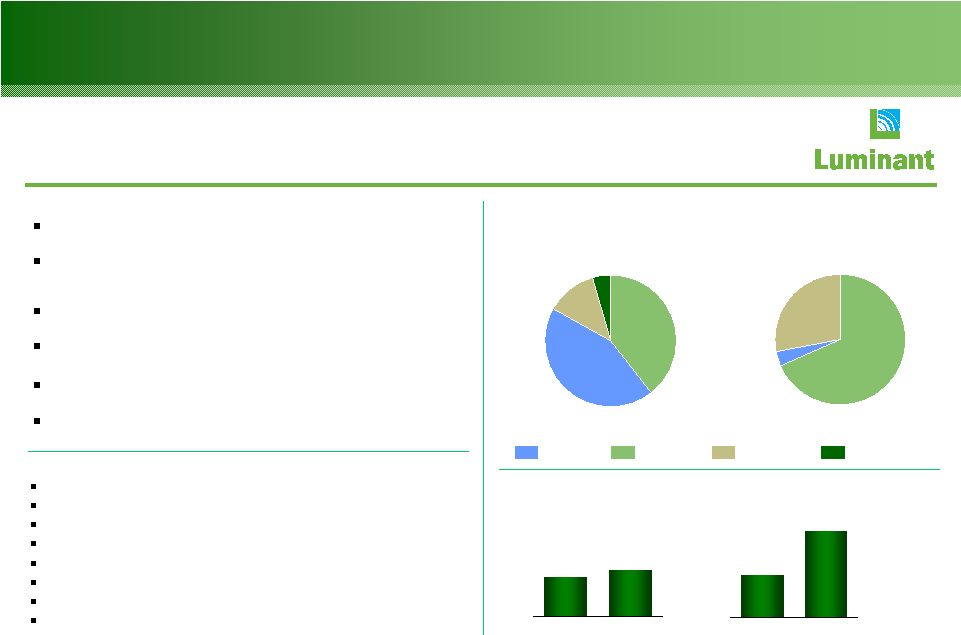
Luminant Overview
Business Profile
Generation
Baseload around-the-clock assets that dispatch at low heat rate
levels
~1,400 MW of new coal-fueled capacity achieved substantial
completion in 2009 and ~800 MW expected to achieve substantial
completion in mid-2010
Low-cost
lignite
reserves
-
Luminant
mines
~20
million
tons
of
lignite annually
Liquidity-light natural gas hedging program designed to provide
cash flow security
Voluntary
SO
²
and
NO
x
emissions
reduction
program
expected
to
reduce emissions below US averages
Comanche Peak expansion through Mitsubishi partnership may
provide a low-cost nuclear growth option
13%
39%
44%
4%
Coal
Gas
Nuclear
Generating
capacity
¹
As of 3/31/10; MW
Total
generation
²
3/31/10
³
;
GWh
18,319 MW
70,735 GWh
New Build-Coal
Safety
Wholesale power prices
Baseload reliability
Mining operations
Fuel costs
O&M costs
Operational excellence/continuous improvement
Stable competitive market
Value Drivers
1.50
1.27
Lignite
Delivered
PRB
2.79
1.38
Lignite
Delivered
PRB
Lignite/coal vs. PRB fuel cost
4
07-09 Average; $/MMBtu
13E; $/MMBtu
Installed nameplate capacity. Includes ~800 MW of new coal-fueled generation under
construction, 1,953 MW of mothballed gas plant capacity, 655 MW of gas plant capacity currently
in Reliability Must Run (RMR) status with ERCOT and 1,856 MW of gas plant capacity (1,933 MW of installed nameplate capacity) related to four gas units that Luminant
expects to mothball in September 2010.
Excludes purchased power
Twelve months ended 3/31/10
Total lignite and PRB fuel expense excluding emissions
1
2
3
4
Luminant is the largest power generator in Texas. |
 4
Luminant Areas of Focus –
2010
Safety
Industry leading performance at plants and mines
Operations
Ramp up performance of Sandow 5 and Oak Grove 1 and mid-year substantial
completion of Oak Grove 2
Top decile/quartile availability at Comanche Peak and existing coal plants
Further embed “Luminant Operating System”
and drive improvement through Balance
of Plant initiative
Drive continuous improvement at mines
Development
Continue to advance Comanche Peak 3 & 4 options
Explore opportunities for new technologies, including wind, solar, next generation
coal and new demand sources such as plug-in hybrid electric vehicles
(PHEV) Risk Management
Continue effective and efficient hedging program that is intended to secure cash
flows |
  5
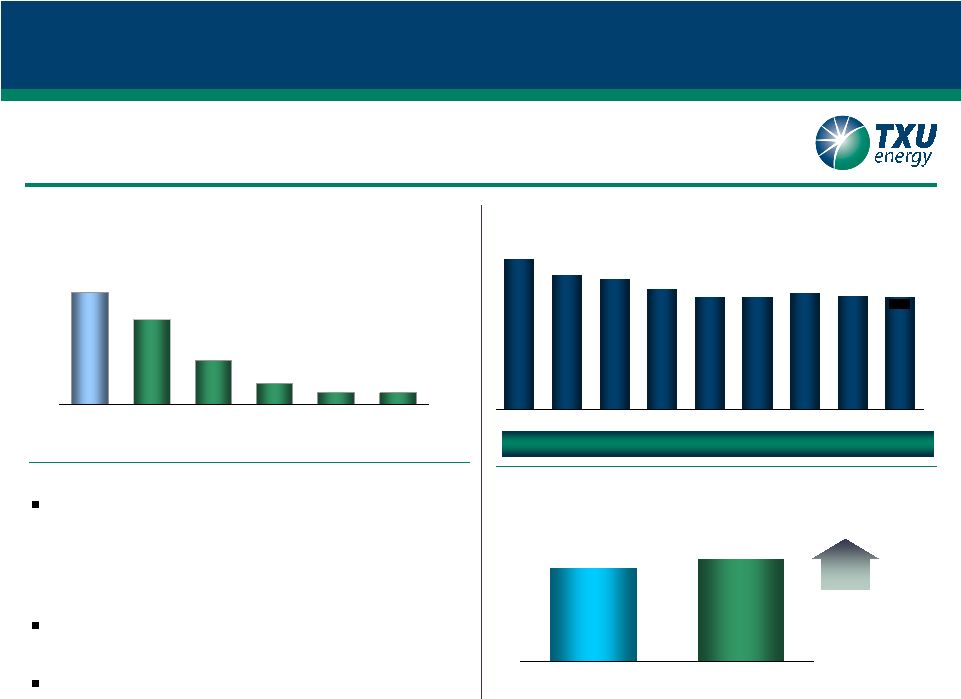
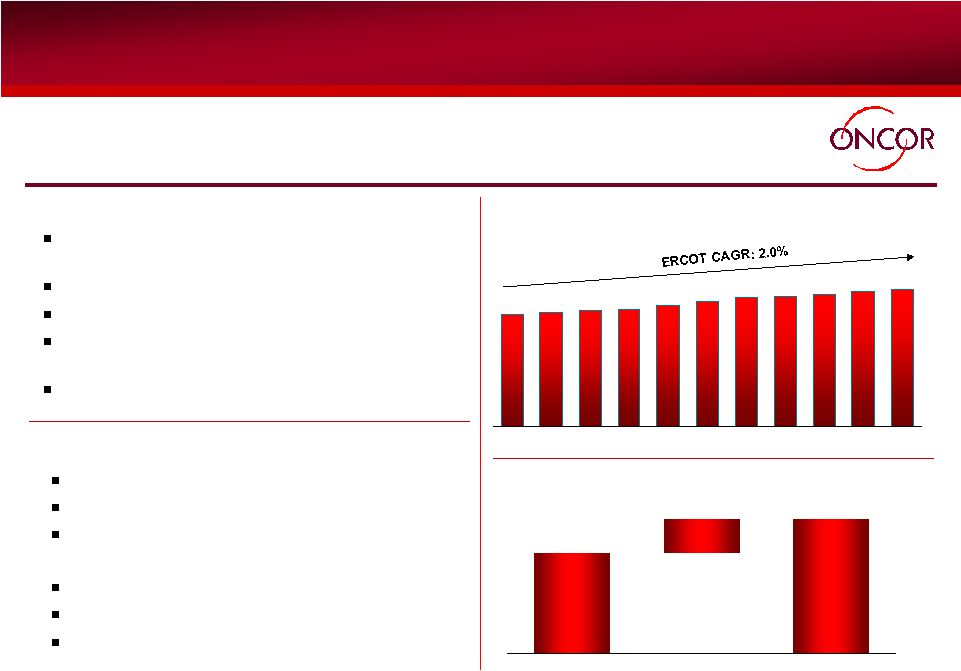
TXU Energy Overview
TXU Energy is the largest electricity retailer in Texas.
Value Drivers
Strong customer value proposition
•
High brand recognition in Texas competitive areas
•
Competitive retail offers
•
Innovative products and services
•
Committed to low-income customer assistance
•
Latest Customer Care Platform (SAP)
Balance Sheet
•
Combined TCEH risk management and liquidity
efficient capital structure
Margins (5–10% net)
1.8
0.7
0.4
0.2
0.2
1.4
TXU Energy
Reliant
Direct
Energy
Stream
Energy
Ambit
First Choice
Source: Latest available company filings, TXU Energy estimates.
Business Profile
Residential customers/meters
At 3/31/10; millions
Sources: NERC, ERCOT
2.0
1.8
US Average
ERCOT
11%
TXU Energy total residential customers
2002-2009 & 3/31/10; end of period, thousands
1,849
1,862
1,914
1,850
1,982
2,145
2,207
2,477
1,856
2002
2003
2004
2005
2006
2007
2008
2009
3/31/10
TXU Energy has maintained market share since 2006.
Projected annual demand growth
US avg. and ERCOT; CAGR (2008A-2018E) |
  6
TXU Energy Areas of Focus –
2010
Profitable Growth
Deliver customer-based value proposition
Expand profitable residential market share and add profitable business
markets customers
Customer Care Transformation
Enhance customer experience through effective utilization of people, process
and technology
Risk Management
Accurate forecasting of customer needs
Active management and monitoring of procurement position to align with
changing market conditions |
 7
T&D
CREZ
Total
Supportive regulatory environment
10.25% authorized ROE
Expedited capital expenditure recovery
(transmission and AMS)
Low operating costs per customer
Strong demand growth vs. US average
Top quartile reliability (SAIDI) and safety
Oncor Overview
Value Drivers
Business Profile
Oncor is the largest transmission & distribution utility in Texas.
6
th
largest
US
transmission
&
distribution
company
Low costs and high reliability
No commodity position
Accelerated recovery of investments in
advanced meters and transmission
$1.3
billion
¹
CREZ
investment
Sources: ERCOT, CDR Report, December 2009
Projected peak demand growth
08-18E; GW
5.2
1.3
3.9
Capital expenditure estimates
08–12E;
$ billions
Based on ERCOT estimates. As a result of the selection of final routes for 3 default and 9
priority lines and additional costs not included in original ERCOT estimates, Oncor estimates that
the cost of these projects will exceed the ERCOT estimate by $220 million.
Minimum capital spending of $3.6 billion over a five-year period, including AMS
1
2
²
62
64
65
67
69
71
72
73
75
76
63
2008A
2009A
2010E
2011E
2012E
2013E
2014E
2015E
2016E
2017E
2018E |
 8
Oncor Areas of Focus –
2010
Safety and reliability
AMS
Full deployment of advanced meters expected by 2012 (over 900,000
meters installed through April 2010)
Capital investment of ~$690 million
Recovery through monthly surcharge over 11 years, began January 2009
(~$2.19 per month for average residential customer)
CREZ
Obtain CCNs
for remaining subsequent projects
Continue construction, engineering, right-of-way acquisition and other
permitting activities
On-time completion of projects |
 Appendix –
Additional Slides and
Regulation G Reconciliations
9 |
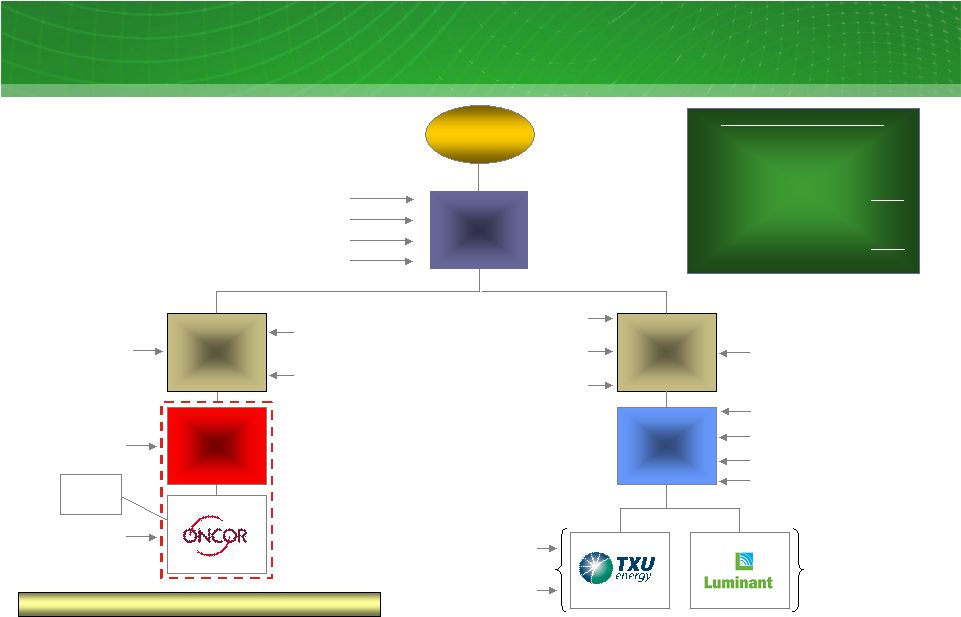 10
EFH Corp. Debt Structure
1
Summary
diagram
includes
unamortized
discounts
and
premiums
and
excludes
subsidiaries
of
EFH
that
are
not
subsidiaries
of
Energy
Future
Intermediate
Holding
Company
or
Energy
Future
Competitive
Holdings
Company,
including
TXU
Receivables
Company,
which
buys
receivables
from
TXU
Energy
and
sells
undivided
interests
in
such
receivables
under
the
TXU
receivables
program.
2
March 31, 2010 balances adjusted to include the effects of a debt repurchase and
debt exchanges in April 2010 that resulted in the issuance of an additional $66 million of EFH Corp. 10% Senior Secured Notes and
acquisition of $5 million of EFH Corp. 10.875% Notes, $75 million of EFH Corp.
11.25/12.00% PIK Toggle Notes and $17 million of TCEH 10.50/11.25% PIK Toggle Notes.
3
Excludes short term borrowings related to the accounts receivables program.
4
Other
debt
includes
a
financing
lease
of
an
indirect
subsidiary
of
EFH
as
well
as
a
capital
lease
for
IT
equipment
at
EFH.
5
Includes
securitization
bonds
issued
by
Oncor
Electric
Delivery
Transmission
Bond
Company
LLC
and
Oncor’s
Revolving
Credit
Facility
that
had
a
balance
of
$756
million
as
of
March
31,
2010.
6
Cash
and
cash
equivalents
and
restricted
cash
(non
regulated)
as
of
March
31,
2010.
Investor Group
EFH
$1.9 billion Pre-Merger Notes
Guarantor of $0.7
billion EFH Senior
Secured Notes
$5.8 billion of debt
5
Energy Future
Intermediate
Holding
Company
Energy Future
Competitive
Holdings
Company
TCEH
Oncor Electric
Delivery Holdings
Ring-fenced entities
Guarantor of $6.8 billion TCEH Cash
Pay/PIK Toggle Notes and $4.5 billion
EFH
Cash
Pay/PIK
Toggle
Notes
Guarantor of TCEH Sr. Secured
Facilities and Commodity
Collateral Posting Facility (CCP)
$0.1 billion of Pre-Merger Notes
Guarantors of $6.8 billion
TCEH Cash Pay/PIK
Toggle Notes
Guarantors of TCEH Sr.
Secured Facilities and CCP
$6.8 billion TCEH Cash Pay/PIK
Toggle Notes
$21.6 billion Sr. Secured Facilities
~20%
Minority
Investor
$4.5 billion EFH Cash Pay/PIK Toggle Notes
$1.5 billion of other debt
$0.0 billion of CCP
Debt Outstanding ($ billions)
As of 3/31/10 Pro-forma
2
EFH
$ 7.2
EFIH
0.2
EFCH
0.1
TCEH
3
29.9
Total debt (non regulated)
37.4
Cash and cash equivalents
6
(1.3)
Restricted cash
6
(1.2)
Net debt (non regulated)
$34.9
EFH
Corp.
debt
structure
1
As of 3/31/10 Pro-forma
2
;
$ billions
As of March 31, 2010, the EFH Corp. leverage ratio was 9.1x
$0.7 billion EFH Senior Secured Notes
$0.2 billion Senior
Secured Notes
Guarantor of $4.5
billion EFH Cash Pay/
PIK Toggle Notes
Guarantor of $0.7 billion EFH
Senior Secured Notes
$0.09
Other
debt
4 |
 11
TCEH Amendments/Consents
In Q3 2009, TCEH received positive support (60%+ vote) from its
secured lenders to amend its Credit Agreement.
These amendments provide additional debt capacity to de-lever
TCEH and provide a vehicle for 2014 TCEH maturity extensions.
Credit Agreement Amendments
Ability to Extend Revolver/Term Loan B
Ability to use unlimited 1st lien Post 2014 bonds and loans to retire
Term Loan B at par
Trade
$1.25
billion
1st
lien
Accordion
for
additional
$4
billion
2nd
lien capacity at TCEH for refinancing purposes
Exclude 2nd lien debt at TCEH from Maintenance Covenant
calculation
Allow for up to $750 million 1st lien Secured Bond Offering under
Accordion |
 12
EFH Corp. and EFIH Exchange Offers
In November 2009, EFH Corp. and EFIH completed a SEC-registered
debt-for-debt exchange.
Exchange Offer Summary
In the exchange, EFH Corp. sought to issue up to an aggregate
$3.0 billion of new EFH Corp. and EFIH 9.75% Senior Secured
Notes due 2019 for ~$4.5 billion aggregate EFH Corp. Legacy
notes and EFH and TCEH Cash-Pay/PIK Toggle Notes (LBO
notes)
Ultimately, ~$350 million of Legacy and LBO notes was
exchanged for ~$250 million aggregate new EFH Corp. and EFIH
9.75% Senior Secured Notes |
 13
EFH Corp. New Financing Accomplished
In January 2010, EFH Corp. successfully issued $500 million of
Senior Secured Notes maturing in 2020 in a private offering.
New Debt Issuance Summary
10% coupon, EFH Corp. Senior Secured Notes due 2020, priced
at par
The initial $300 million offering was upsized to $500 million
Proceeds from this offer will be used for general or other
corporate purposes, including working capital needs,
investment in business initiatives, capital expenditures and
prepayment or repurchase of outstanding debt |
 14
EFH Corp. Exchanges and Purchases
In March and April 2010, EFH Corp. completed the following debt-
for-debt exchanges and open market repurchases.
March
Issued $34 million EFH Corp. 10% Senior Secured Notes due 2020
in exchange for $20 million EFH Corp. PIK Toggle Notes and $27
million TCEH PIK Toggle Notes, capturing $13 million of discount
April
Purchased $5 million EFH Corp. 10.875% Cash-Pay Notes for $3.8
million cash from the net proceeds of the January 2010 $500 million
issuance, capturing ~$1 million of discount
Issued $66 million aggregate EFH Corp. 10% Senior Secured Notes
due 2020 in exchange for $75 million aggregate EFH Corp. PIK
Toggle Notes and $17 million aggregate TCEH PIK Toggle Notes,
capturing $26 million of discount
EFH Corp. continually seeks opportunities to enhance its financial
flexibility. |
 15
B+ (+2)
B+ (+2)
Caa3 (-2)
Sr. Secured
Fitch
S&P
Moody’s
EFIH
B+ (+2)
B+ (+2)
Caa3 (-2)
Sr. Secured
Stable
Stable
Stable
Oncor Outlook
Negative
Negative
Negative
EFH Outlook
AAA
BBB+ (+8)
BBB+ (+8)
CCC (-2)
CCC (-2)
CCC (-2)
B+ (+2)
CCC (-2)
CCC (-2)
CCC (-2)
B-
(0)
B-
AAA
BBB (+7)
BBB-
(+6)
CCC (-2)
CCC (-2)
B-
(0)
B+ (+2)
CCC (-2)
CCC (-2)
CCC (-2)
B (+1)
B-
Aaa
Baa1 (+9)
Caa3 (-2)
Caa3 (-2)
Caa2 (-1)
B1 (+3)
Caa3 (-2)
Caa3 (-2)
Caa3 (-2)
Caa3 (-2)
Caa1
Secured Notes
Oncor Issuer Rating
EFH Issuer Rating
Unsecured
Cash Pay/PIK Toggle
Credit Facilities (secured)
EFCH
Sr. Unsec
(Pre–merger)
Cash Pay/PIK Toggle
EFH Corp.
TCEH
Secured
Oncor Transition Bonds
Pre-merger
PCRBs
Issuer / Security
Issuer/Debt Ratings Summary
Indicates change in rating since 1/31/10
Issuer/Debt ratings for EFH Corp. and its subsidiaries
As of 4/30/10; rating agencies credit ratings
Note: Parenthetical amounts represent change in ratings notches from EFH Issuer
Rating. |
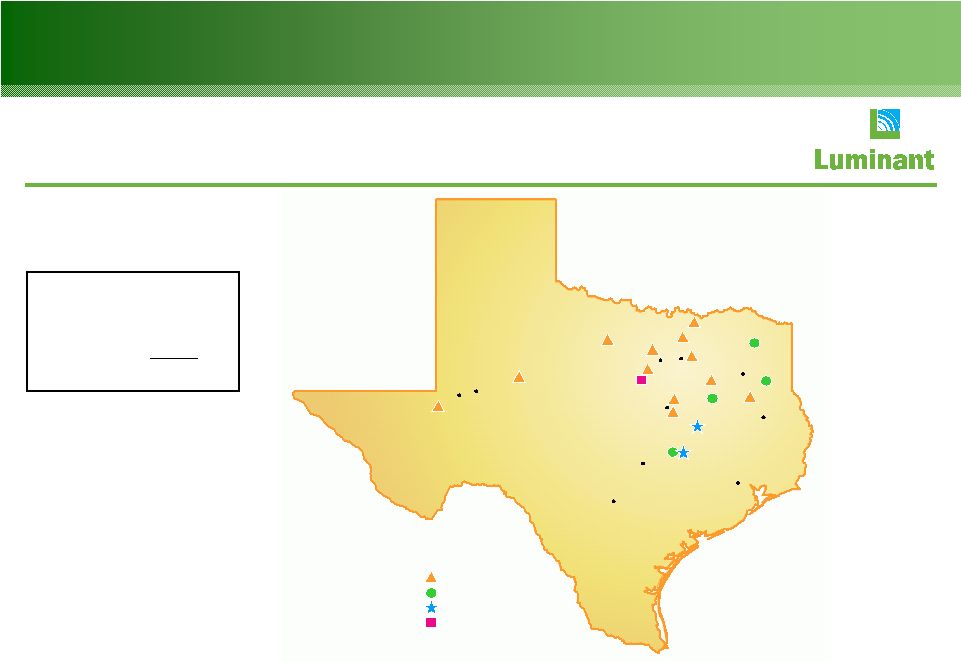 16
Luminant Generation Facilities
Generation capacity in ERCOT
At 3/31/10; MW
Nuclear
2,300 MW
Lignite/coal
7,217
Lignite –
new
1
800
Natural gas
2
8,002
Total
18,319 MW
HOUSTON
SAN ANTONIO
AUSTIN
WACO
MIDLAND
LUFKIN
ODESSA
DALLAS
TYLER
FORT
WORTH
Power Plants
Natural gas
Lignite/coal
Lignite, new build
Nuclear
1
Represents approximately 800 MW of new lignite-fueled generation
under construction that is expected to achieve substantial completion in mid-2010.
2
Includes seven mothballed units (1,953 MW) not currently available for
dispatch, 655 MW for two units currently in RMR status with ERCOT and 1,856 MW of gas plant capacity (1,933 MW
of installed nameplate capacity) related to four gas units that
Luminant expects to mothball in September 2010. |
 17
0
4
8
12
16
0
10
20
30
40
50
60
70
80
Cummulative
MWs
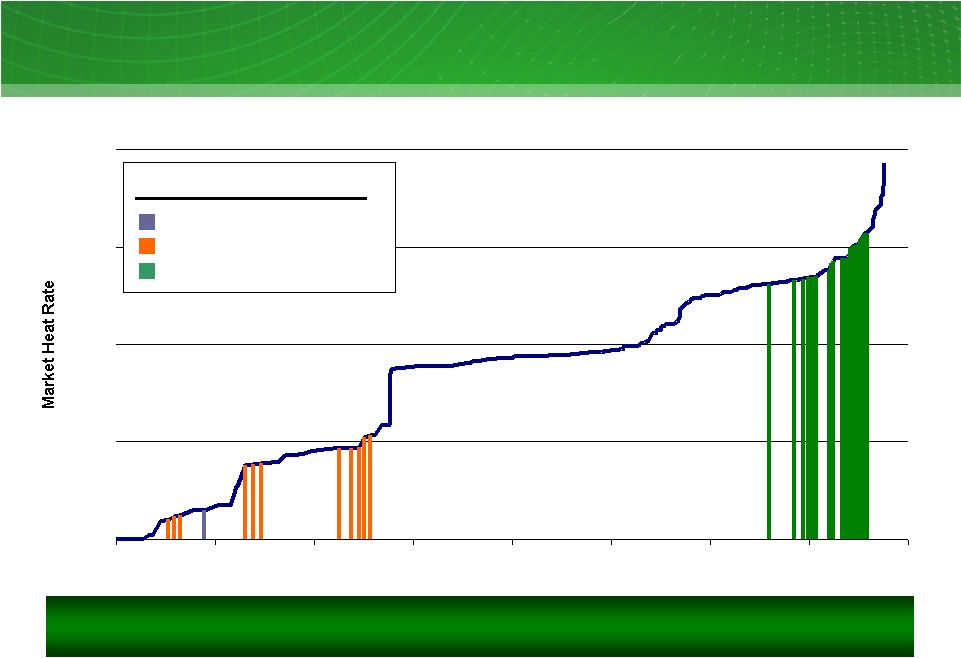
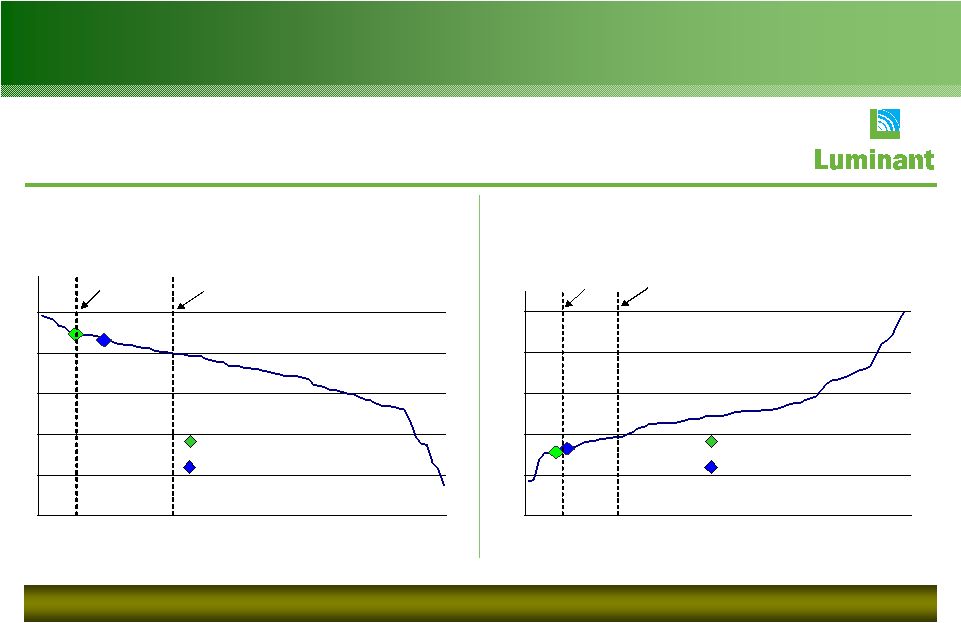
1
Summer
2010
ERCOT
supply
stack
-
indicative
Luminant
plants
are
typically
on
the
“book-ends”
of
the
supply
stack.
ERCOT’s
marginal price is set by natural gas in most hours of the year.
Luminant nuclear plant
Luminant lignite/coal plants
Luminant
gas
plants
¹
Legend
ERCOT Supply Stack
1
Excludes 1,953 MW of mothballed gas plant capacity. Includes 655 MW of gas plant capacity
currently in RMR status with ERCOT and 1,856 MW of gas plant capacity (1,933 MW of installed
nameplate capacity) related to four gas units that Luminant expects to mothball in September 2010.
Sources: ERCOT and Energy Velocity ®,
Ventyx |
 18
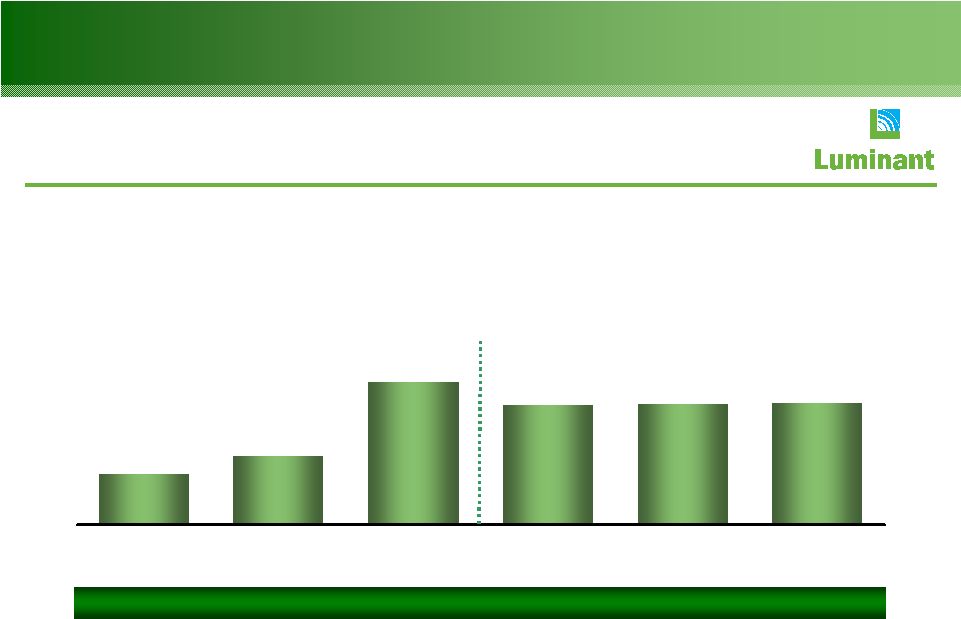
Existing Fleet Baseload
Capital Expenditures
234
318
660
556
560
566
02–03
04–05
06–07
08
09
10E
Baseload
capital
expenditures
1
02–09; 10E; $ millions
Merger Close
1
Baseload capital expenditures excluding any capital expenditures for development of Oak Grove and
Sandow 5, new mine development, environmental retrofit program and other development related
capital expenditures. Includes new build sustaining capital expenditures for Oak Grove and Sandow 5 for
2010 only.
Luminant needs to drive sustained high performance at the optimal investment level.
|
 19
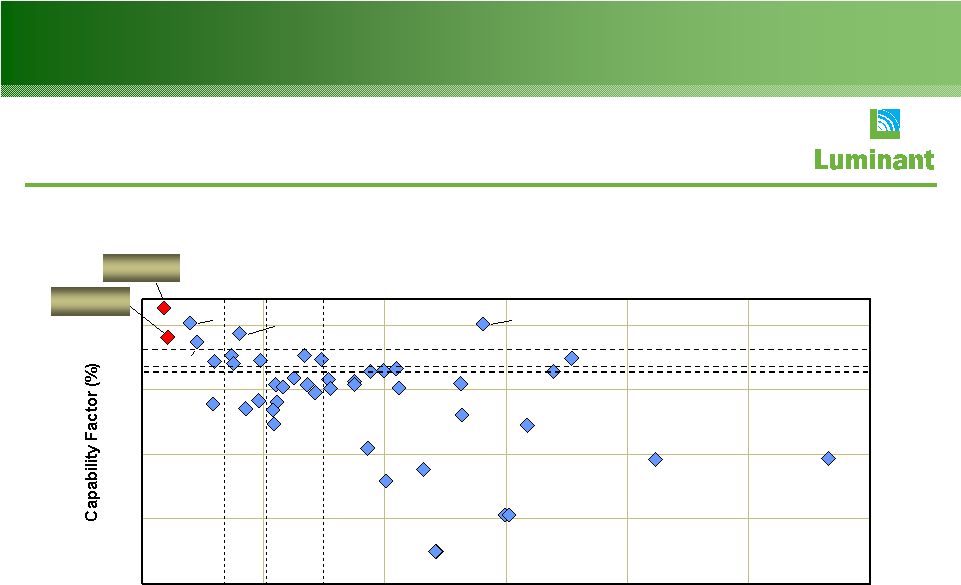
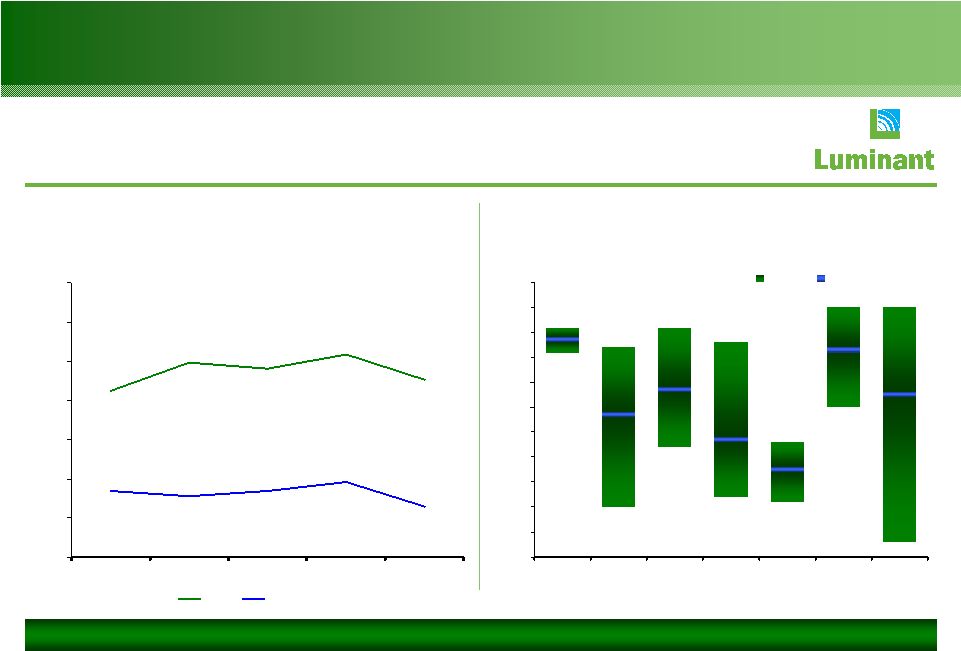
Nuclear Reliability And Cost Benchmarks
1
Benchmarking peer set defined as 18 month fuel cycle U.S. nuclear plants (42 plants
/ 66 units BWR & PWR) 2
Source: EUCG May 2009 release for cost and WANO for Capability Factors
3
2007
$/MWh
adjusted
for
steam
generator
replacement
75
80
85
90
95
10
15
20
25
30
35
40
$/MWh
Braidwood
Byron
STP
Decile
Quartile
Median
Decile
Quartile
Median
Nuclear capability factor & O&M
06–08 percent and $/MWh
Ginna
CPNPP 06-08
94.07
CPNPP 09
96.3 |
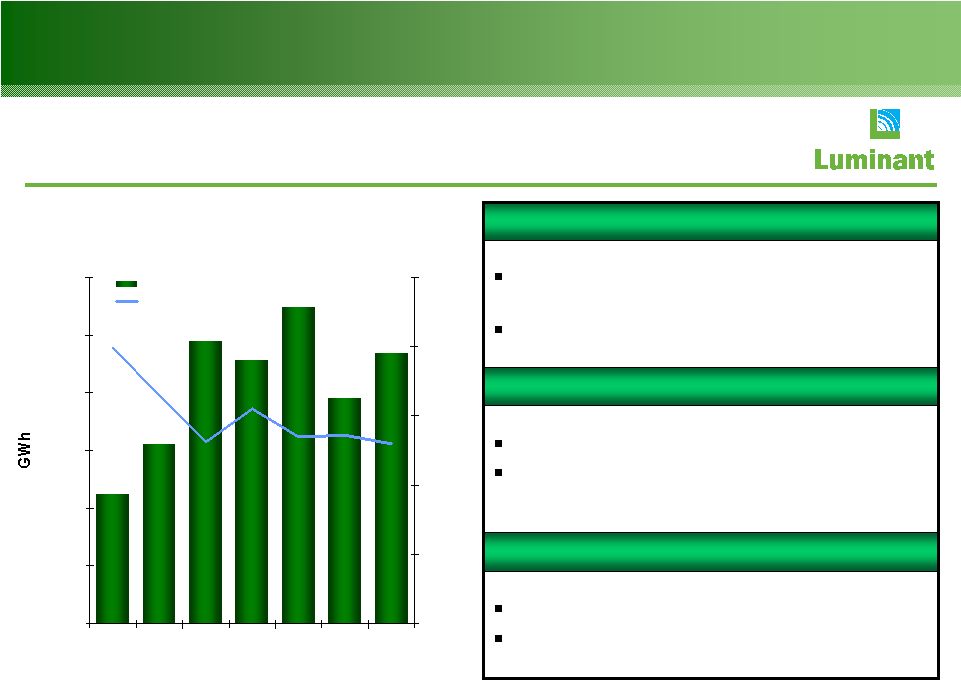
 20
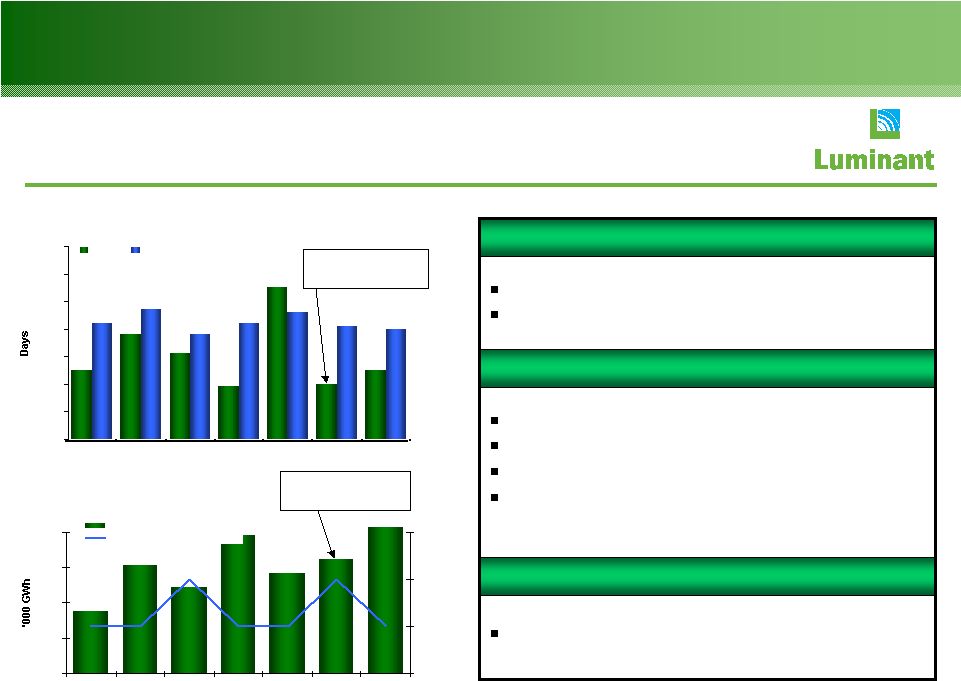
Impact of Refueling Outages
Avg. nuclear
fleet
refueling
outage
duration
¹
-
18
month cycle units
03-09; days
Nuclear fleet output
03-09; thousand GWh
2010 outage was 24 days
2010 Refueling Outage Impact
2008 reflects 2 refueling outages
2008 outages were 19 days and 21 days
2009 outage was 25 days
2009 generation includes 110 GWh
ERCOT-driven backdown
2008-2009 Refueling Outage Impact
18 months
Duration: ~18-25 days
Nuclear Refueling Cycle
World record steam
generator outage
World record steam
generator outage
0
10
20
30
40
50
60
70
2003
2004
2005
2006
2007
2008
2009
²
EFH
Industry
16
17
18
19
20
2003
2004
2005
2006
2007
2008
2009
0
1
2
3
EFH
# of Refueling Outages
2005 and 2008 were dual refueling outage years; this graph shows the average outage duration for each
of those years. Industry based on early release data from Electric Utility Cost Group (EUCG)
1
2 |
 21
$0.00
$2.00
$4.00
$6.00
$8.00
$10.00
40
50
60
70
80
90
High-Performance Coal Operator
Luminant
vs.
US
coal
fleet
net
capacity
factors
¹
Percent
Top decile
84.7%
Top quartile
79.8%
Luminant vs. US coal fleet O&M
$/MWh
Top decile
3.3
Top quartile
4.0
Luminant has industry leading performance relative to other coal-fueled
generators. Luminant 06–08 fleet avg. = 84.7 %
Luminant 08 fleet = 83.2%
Source: GKS
Luminant 06–08 fleet avg. = 3.11
Luminant 08 fleet = 3.29
1
Benchmarking net capacity factors based on GADS.
Luminant
09 fleet = 81.4%
Luminant
09 fleet = 3.74 |
 22
High-Performance Coal Operator
65%
70%
75%
80%
85%
90%
95%
100%
2004
2005
2006
2007
2008
EFH
Industry
Consistent high performance
Average
coal
fleet
capacity
factor
¹
04-08; percent
Range
of
coal
unit
2-year
capacity
factors
²
04-08; percent
45%
50%
55%
60%
65%
70%
75%
80%
85%
90%
95%
100%
EFH (9)
AYE (10)
DYN (4)
EIX (8)
MIR (2)
NRG (9)
RRI (6)
Operator (# of Units)
Range
5 Yr Average
Based on unscrubbed merchant units greater than 450 MW. Industry total excludes EFH plants.
2
Includes merchant units greater than 450 MW.
Source: Velocity Suite (Energy Velocity)
1 |
 23
Coal Fleet Output
41,000
42,000
43,000
44,000
45,000
46,000
47,000
2003
2004
2005
2006
2007
2008
2009
0
50
100
150
200
250
Net Gen
# of PO Days
2009 reflects 130 planned outages days
2009 average major outage duration was
45 days
2009 Planned Outage Impact
2008 reflects 136 planned outages days
2008 average major outage duration was
48 days
2008 Planned Outage Impact
3 or 4 year overhaul cycle depending on
unit
Duration is scope dependent
Coal Fleet Planned Outage Cycle
Coal fleet output
03-09; GWh
1
1
2009 includes 1,443 GWh of new build generation (Sandow 5 and Oak Grove 1 units).
|
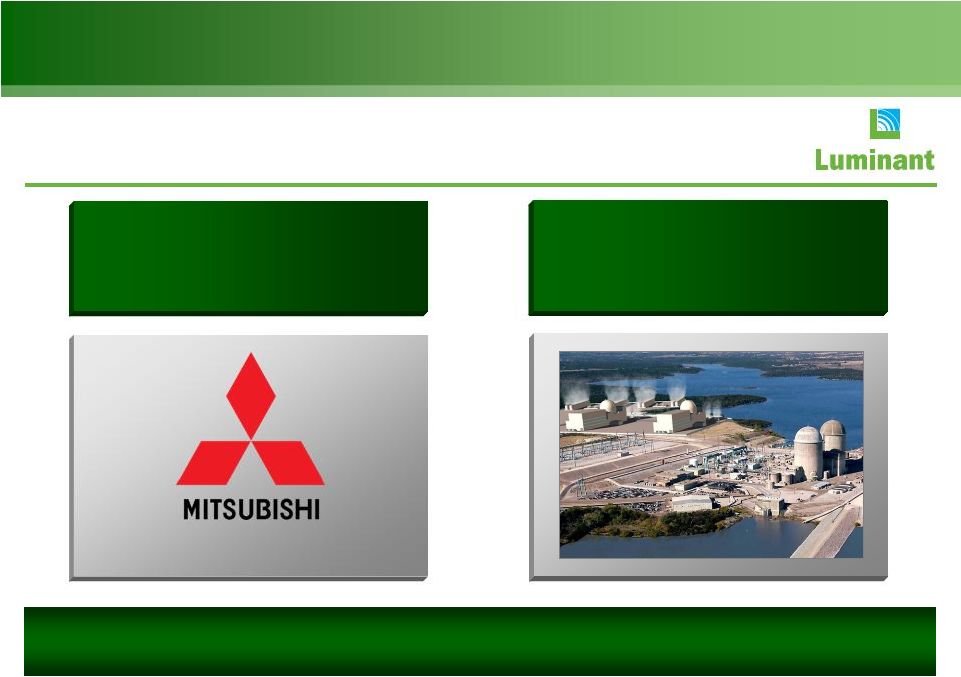 24
Nuclear Expansion
HEAVY INDUSTRIES, LTD.
Luminant is pursuing the construction of a next-generation nuclear
facility by
…
Project includes two nuclear generation units each having approximately 1,700 MW
(gross) capacity, and is currently ranked 5th (first alternate) for DOE
grants. …partnering with
…partnering with
a world-class
a world-class
equipment provider…
equipment provider…
…
…
and leveraging existing
and leveraging existing
site, water rights and
site, water rights and
leadership team.
leadership team. |
 25
0
10,000
20,000
30,000
40,000
50,000
60,000
70,000
0
4
8
12
16
20
0
500
1,000
1,500
2,000
2,500
3,000
3,500
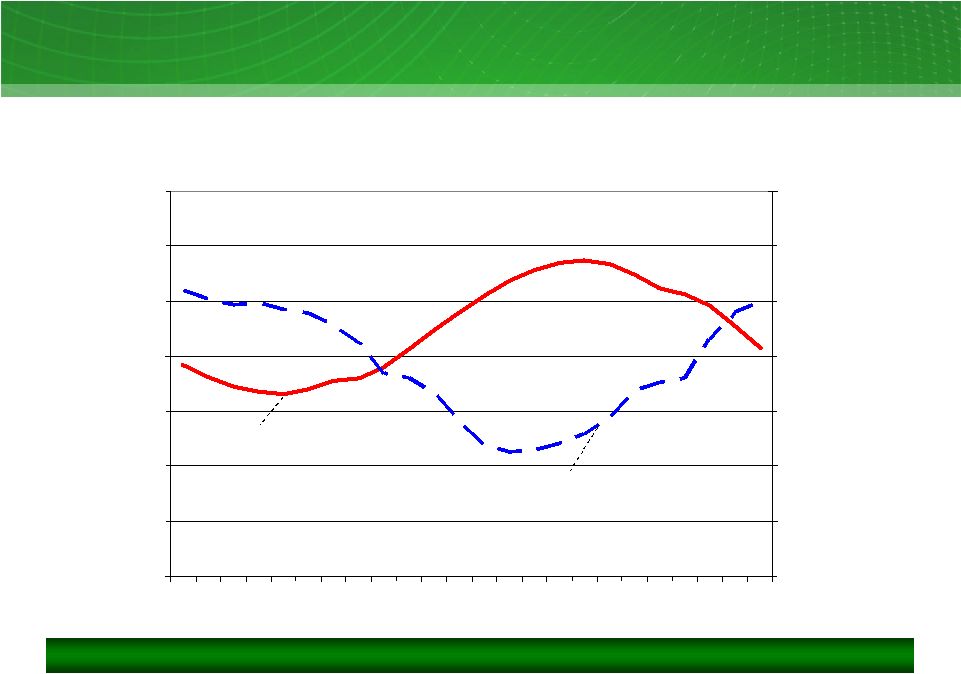
ERCOT Average Daily Profile of Load and Wind
Source: ERCOT
ERCOT average daily profile of load and wind output
August 09; mixed measures
Wind operating characteristics necessitate additional resources for
reliability. Average
Load
Average
Wind Output
Hour
Load
(aMW)
Wind Output
(MW) |
 26
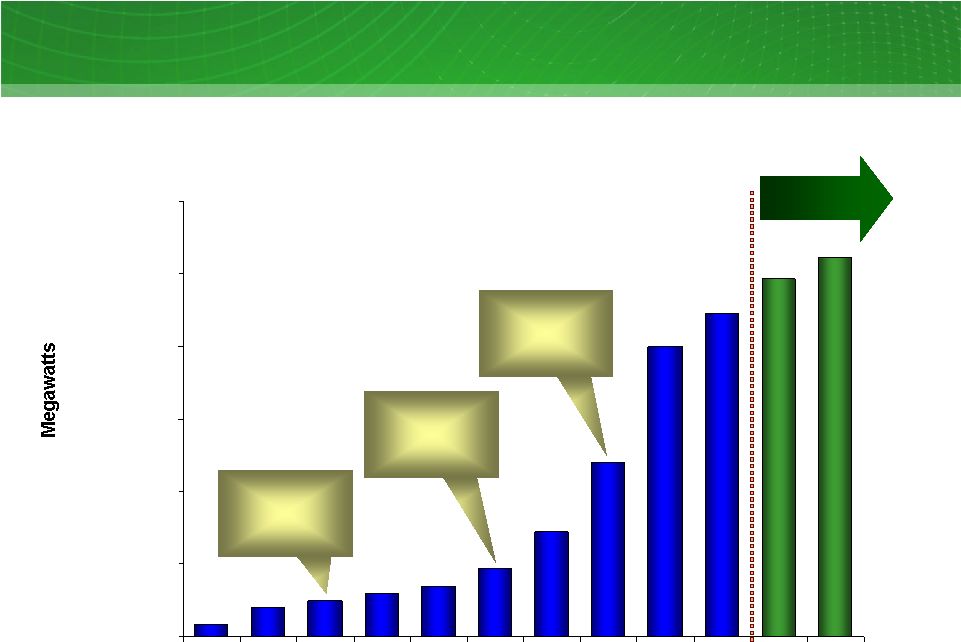
Texas Wind Additions
0
2,000
4,000
6,000
8,000
10,000
12,000
Pre 01
01
02
03
04
05
06
07
08
09
10E
11E
RPS
¹
Target
of 2,880 MW
by 2009
RPS
¹
Target
of 5,880 MW
by 2015
CREZs
Designated
ERCOT
SGIA
²
Cumulative wind capacity additions in Texas
Pre-01 -
09;10E -
11E; MW
1
Renewable Portfolio Standard
2
Signed Generation Interconnect Agreement
Source: ERCOT
–
January
2010
System
Planning
Report
to
the
Reliability
and Operations Subcommittee |
 27
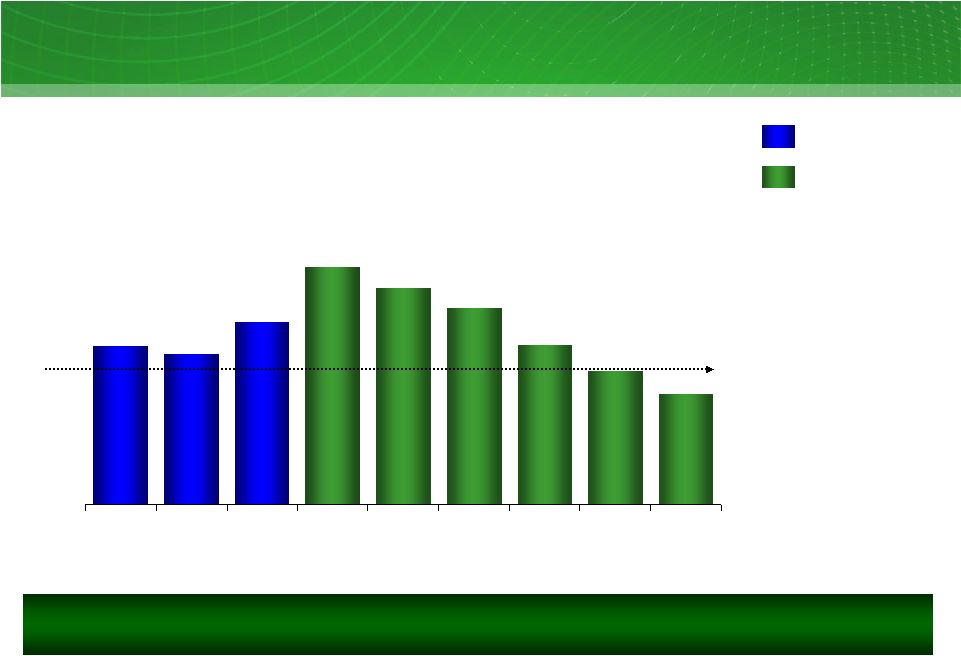
ERCOT Reserve Margins
ERCOT reserve margin
07-09; 10E-15E; percent
15
14
17
22
20
18
15
12
10
0
5
10
15
20
25
07
08
09
10E
11E
12E
13E
14E
15E
December
2009
²
1
Source: ERCOT (reserve margin projection prior to summer peak and based on the
reserve margin formula in effect at the time) 2
Source: ERCOT CDR as of December 2009
The ERCOT market currently appears to be reasonably positioned to support
Texas’
needs through 2013.
Year
Targeted minimum
reserve margin is 12.5%
Actuals
¹
% |
 28
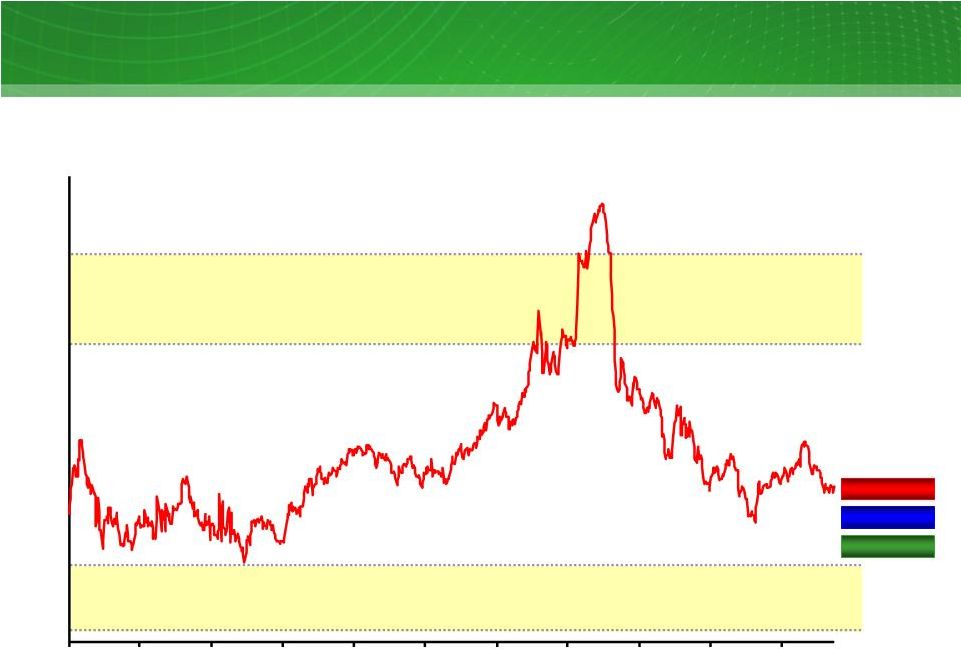
Historical Forward NYMEX Natural Gas Prices
2014 Historical NYMEX Gas Prices
$/MMBtu
Potential Future Hedge Range
(at Current Friction Costs)?
Potential Buyback Gas Hedge Range?
Cal14: $7.16
CERA: $6.75
Ventyx: $7.05
Illustrative example
5.0
6.0
7.0
8.0
9.0
10.0
11.0
Jan-06
May-06
Sep-06
Jan-07
May-07
Sep-07
Jan-08
May-08
Sep-08
Jan-09
May-09 |
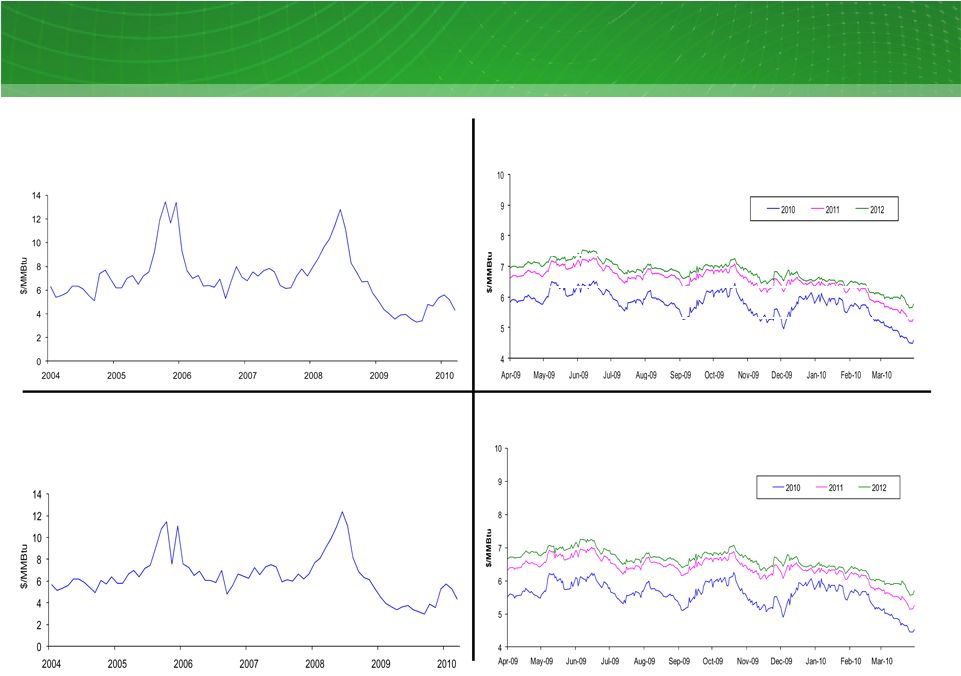 29
29
Houston
Ship
Channel
settled
natural
gas
prices
¹
Jan 04-Mar 10; $/MMBtu
Market Price Snapshot
NYMEX
forward
natural
gas
prices
2,3
2010-2012; $/MMBtu
NYMEX
settled
natural
gas
prices
¹
Jan 04-Mar 10; $/MMBtu
Houston
Ship
Channel
forward
natural
gas
prices
2,3
2010-2012; $/MMBtu
1
Settled prices are monthly averages
2
Forward
prices
reflect
market
observable
quotes
during
the
12
months
ended
March
31,
2010
for
the
following
delivery
periods:
2010,
2011
and
2012
3
2010 represents weighted average of settled NYMEX or HSC prices and balance of year
forward prices $/
MMBtu |
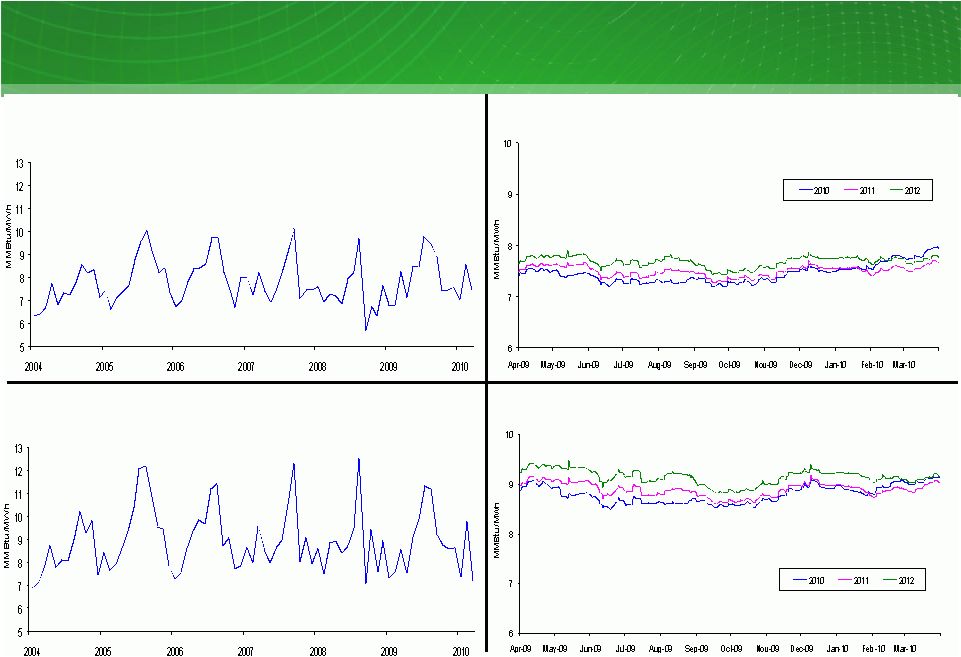 30
30
Market Price Snapshot
ERCOT
North
Zone
7x24
settled
heat
rate
1,2
Jan 04-Mar 10; MMBtu/MWh
ERCOT
North
Zone
7x24
forward
heat
rate
1,3,4
2010-2012; MMBtu/MWh
ERCOT
North
Zone
5x16
forward
heat
rate
1,3,4
2010-2012; MMBtu/MWh
ERCOT
North
Zone
5x16
settled
heat
rate
1,2
Jan 04-Mar 10; MMBtu/MWh
1
Market heat rate calculated by dividing 7x24 and 5x16 power prices, as appropriate,
by Houston Ship Channel natural gas prices 2
Settled prices are monthly averages
3
Forward prices reflect market observable quotes during the 12 months ended March
31, 2010 for the following delivery periods: 2010, 2011 and 2012 4
2010 represents weighted average of settled North Zone 7x24 or 5x16 heat rates and
balance of year forward heat rates |
  31
Mass Media in Market
Outdoor –
Spanish Language
Outdoor –
English Language
Print –
English Language
TXU Energy Marketing Campaign |
 32
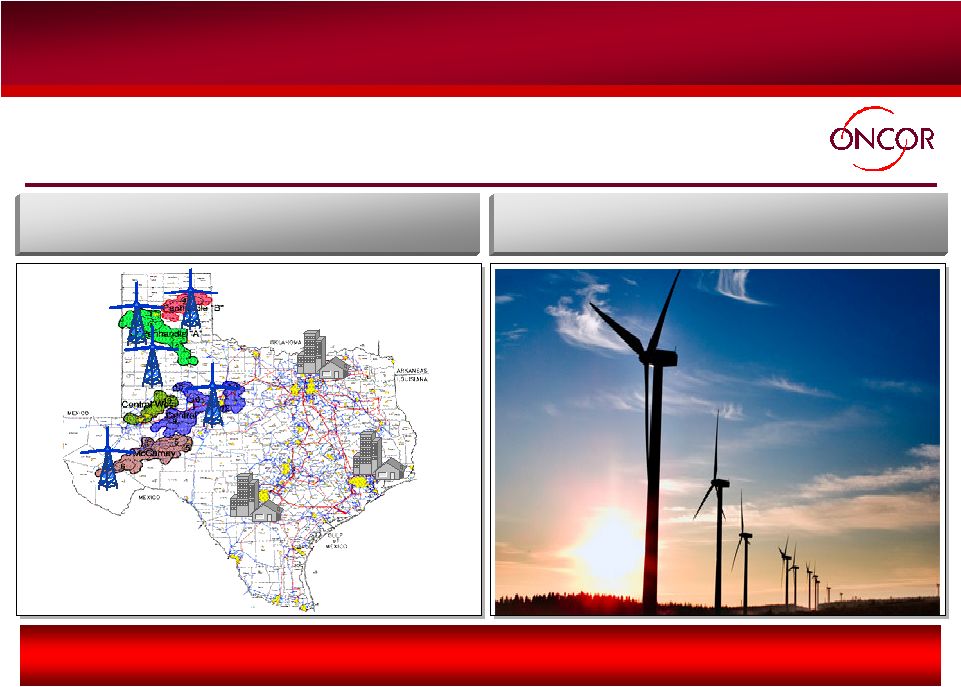
New Oncor Infrastructure
…to support the continued buildout of
…to
support the continued buildout of to support the continued
buildout of wind capacity in Texas
wind capacity in Texas
Oncor’s investment in CREZ will receive accelerated recovery,
consistent with other transmission investment, mitigating regulatory delay.
Oncor
expects
to
invest
~$1.3
billion
on
new
CREZ-related transmission lines…
1
Based on ERCOT estimates. As a result of the selection of final routes for 3 default and 9
priority lines and additional costs not included in original ERCOT estimates, Oncor estimates
that the cost of these projects will exceed the ERCOT estimate by $220 million.
1 |
 33
Oncor Demand-Side Management
Oncor is leading the largest advanced metering initiatives deployment in the US with
a commitment to have 3.4 million meters installed by 2012 (over 900,000 meters
installed through April 2010)
Oncor recovers its investment through a
PUC -approved surcharge
Customer monitoring of consumption
“Smart”
appliances
Dynamic pricing
Oncor’s
energy
efficiency
filing
has
been
approved
and
is
reflected
in
rates.
Oncor to deploy ~$690 million of capital
for advanced metering
initiatives…
…that will
enable key DSM initiatives 1
Public Utility Commission of Texas.
1 |
 34
Table 1: EFH Corp. Net Debt Reconciliation
As of March 31, 2010 Pro-forma
$ millions
34,902
(1,152)
(1,328)
37,382
36,879
250
253
3/31/10
(27)
-
4
(31)
(31)
-
-
Pro-forma
Adjust.
34,875
Net debt
(1,152)
Restricted cash
(1,324)
Cash and cash equivalents
Less:
36,848
Long-term debt, less amounts due currently
253
Short-term borrowings
250
Long-term debt due currently
37,351
Total debt
3/31/10
Pro-forma
Description
1
Pro-forma adjustment reflects the April issuance of $66 million EFH Corp. 10%
Senior Secured Notes due 2020 in exchange for $92 million of EFH Corp. and
TCEH PIK Toggle Notes and $5 million of EFH Corp. 10.875% Cash Pay Notes purchased
for $3.8 million cash. 2
Excludes $393 million at TXU Receivables Company related to the accounts receivable
securitization program. 1
2
1 |
 35
Table 1: TCEH Total Debt Reconciliation
As of March 31, 2010 Pro-forma
$ millions
29,909
29,424
232
253
3/31/10
(17)
(17)
-
-
Pro-forma
Adjust.
29,407
Long-term debt, less amounts due currently
253
Short-term borrowings
232
Long-term debt due currently
29,892
Total debt
3/31/10
Pro-forma
Description
1
Pro-forma adjustment reflects the April issuance of EFH Corp. 10% Senior
Secured Notes due 2020 in exchange for $17 million of TCEH Toggle Notes.
2
Excludes $393 million at TXU Receivables Company related to the accounts receivable
securitization program. 1
2
1 |
 36
Table 3: Oncor Total Debt Reconciliation
As of March 31, 2010
$ millions
4,972
Long-term debt, less amounts due currently
756
Short-term borrowings
109
Long-term debt due currently
5,837
Total debt
3/31/10
Description |
 37
EFH Corp. Investor Relations Contacts
Rima Hyder
Director, Investor Relations
214-812-5090
rima.hyder@energyfutureholdings.com
Bill Huber
Investor Relations Manager
214-812-2480
william.huber@energyfutureholdings.com |