Attached files
| file | filename |
|---|---|
| 10-Q - FORM 10-Q - CRAWFORD & CO | g22680e10vq.htm |
| EX-15 - EX-15 - CRAWFORD & CO | g22680exv15.htm |
| EX-32.1 - EX-32.1 - CRAWFORD & CO | g22680exv32w1.htm |
| EX-31.2 - EX-31.2 - CRAWFORD & CO | g22680exv31w2.htm |
| EX-31.1 - EX-31.1 - CRAWFORD & CO | g22680exv31w1.htm |
| EX-99.1 - EX-99.1 - CRAWFORD & CO | g22680exv99w1.htm |
| EX-32.2 - EX-32.2 - CRAWFORD & CO | g22680exv32w2.htm |
| EXCEL - IDEA: XBRL DOCUMENT - CRAWFORD & CO | Financial_Report.xls |
Exhibit 99.2

| First Quarter 2010 Earnings Conference Call Monday, May 10, 2010 |
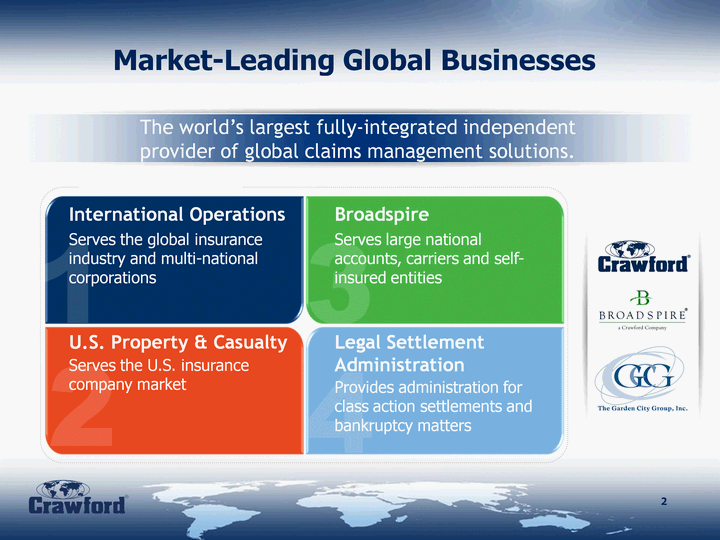
| 2 Market-Leading Global Businesses The world's largest fully-integrated independent provider of global claims management solutions. International Operations U.S. Property & Casualty Broadspire Legal Settlement Administration Serves the global insurance industry and multi-national corporations Serves the U.S. insurance company market Serves large national accounts, carriers and self- insured entities Provides administration for class action settlements and bankruptcy matters |
| 3 Forward-looking Statements and Segment Operating Earnings Forward Looking Statements: This presentation contains forward-looking statements, including statements about the future financial condition, results of operations and earnings outlook of Crawford & Company. Statements, both qualitative and quantitative, that are not statements of historical fact may be "forward-looking" statements as defined in the Private Securities Litigation Reform Act of 1995 and other securities laws. Forward-looking statements involve a number of risks and uncertainties that could cause actual results to differ materially from historical experience or Crawford & Company's present expectations. Accordingly, no one should place undue reliance on forward-looking statements, which speak only as of the date on which they are made. Crawford & Company does not undertake to update forward-looking statements to reflect the impact of circumstances or events that may arise or not arise after the date the forward-looking statements are made. Results for any interim period presented herein are not necessarily indicative of results to be expected for the full year or for any other future period. For further information regarding Crawford & Company, and the risks and uncertainties involved in forward-looking statements, please read Crawford & Company's reports filed with the United States Securities and Exchange Commission and available at www.sec.gov or in the Investor Relations section of Crawford & Company's website at www.crawfordandcompany.com. Segment Operating Earnings: Under the Financial Accounting Standards Board's Accounting Standards Codification Topic 280, "Segment Reporting," segment operating earnings is the primary measure used by the Company to evaluate the results of each of its four operating segments. Segment operating earnings exclude income taxes, interest expense, amortization of customer- relationship intangible assets, stock option expense, earnings or loss attributable to non-controlling interests, and certain other nonrecuring gains and expenses. Non-GAAP Financial Information: For additional information about certain non-GAAP financial information presented herein, see the Appendix following this presentation. |

| Welcome and opening comments Highlights of 2010 first quarter Industry and economic context Business performance Business segment operating results 2010 focus Today's Agenda 4 |
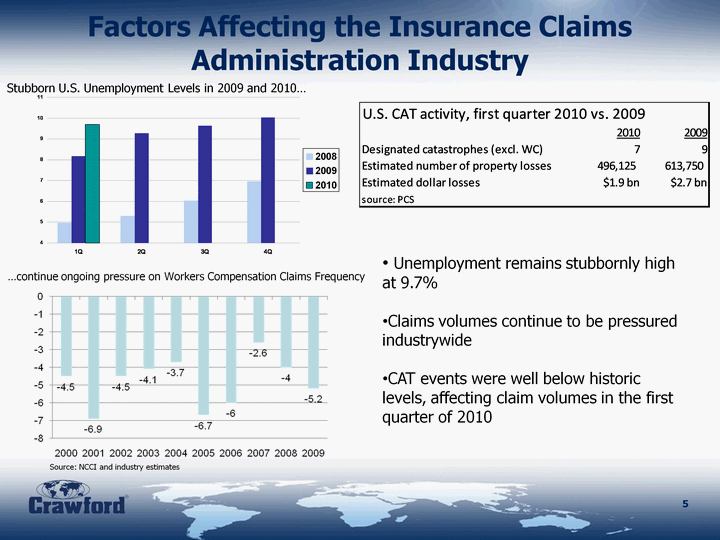
| Factors Affecting the Insurance Claims Administration Industry 5 ...continue ongoing pressure on Workers Compensation Claims Frequency 1Q 2Q 3Q 4Q 2008 4.97 5.3 6.03 6.97 2009 8.17 9.27 9.63 10.03 2010 9.7 Stubborn U.S. Unemployment Levels in 2009 and 2010... Unemployment remains stubbornly high at 9.7% Claims volumes continue to be pressured industrywide CAT events were well below historic levels, affecting claim volumes in the first quarter of 2010 Source: NCCI and industry estimates |
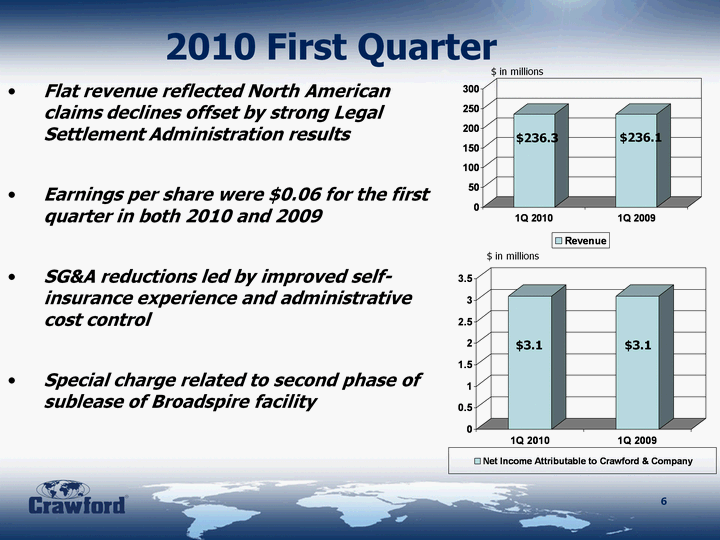
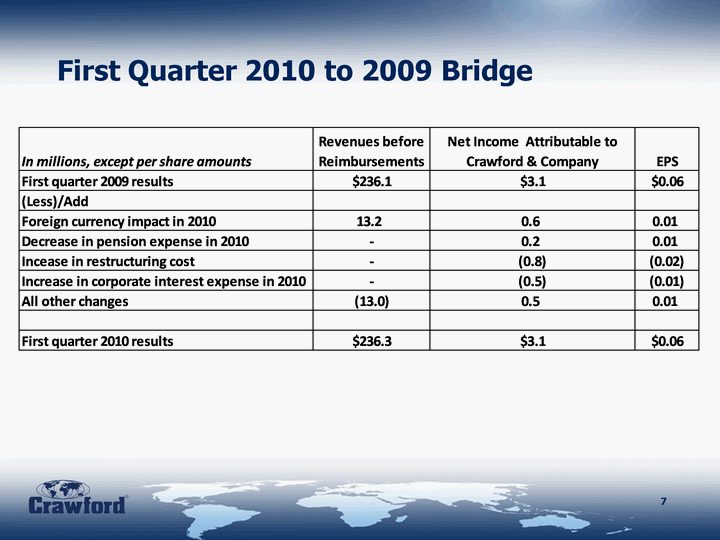
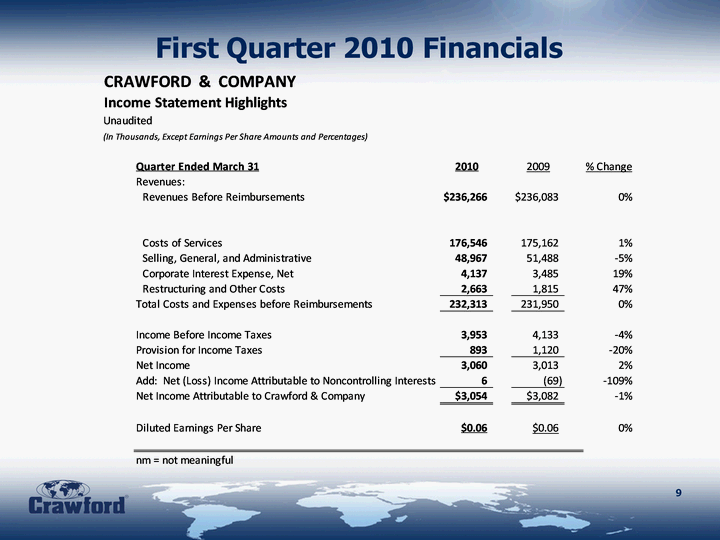
| 2010 First Quarter Flat revenue reflected North American claims declines offset by strong Legal Settlement Administration results Earnings per share were $0.06 for the first quarter in both 2010 and 2009 SG&A reductions led by improved self- insurance experience and administrative cost control Special charge related to second phase of sublease of Broadspire facility 1Q 2010 1Q 2009 Revenue 236.3 236.1 $ in millions 1Q 2010 1Q 2009 Net Income Attributable to Crawford & Company 3.1 3.1 $ in millions $236.3 $236.1 $3.1 $3.1 6 |
| First Quarter 2010 to 2009 Bridge 7 |

| First Quarter 2010 Financial Review |
| 9 First Quarter 2010 Financials |
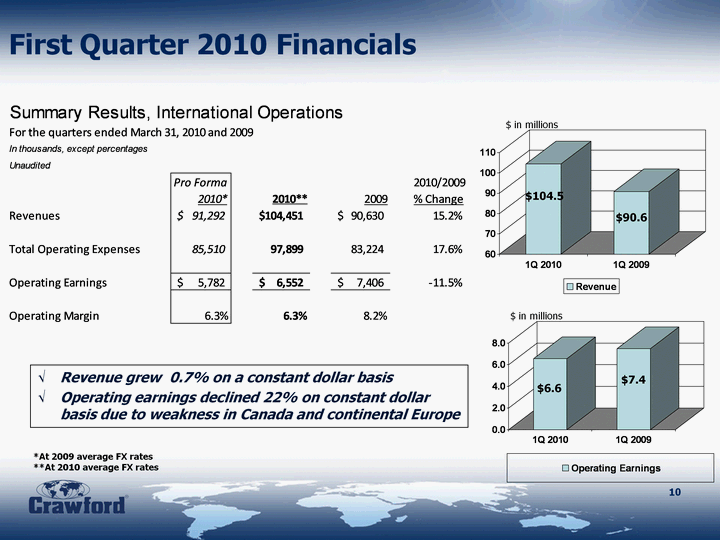
| 1Q 2010 1Q 2009 Revenue 104.451 90.872 Revenue at 2008 FX rates 1.223 1Q 2010 1Q 2009 Operating Earnings 6.552 7.465 Operating Earnings at 2008 FX rates 1 $ in millions $ in millions First Quarter 2010 Financials $104.5 $90.6 $7.4 Revenue grew 0.7% on a constant dollar basis Operating earnings declined 22% on constant dollar basis due to weakness in Canada and continental Europe $6.6 *At 2009 average FX rates **At 2010 average FX rates 10 |
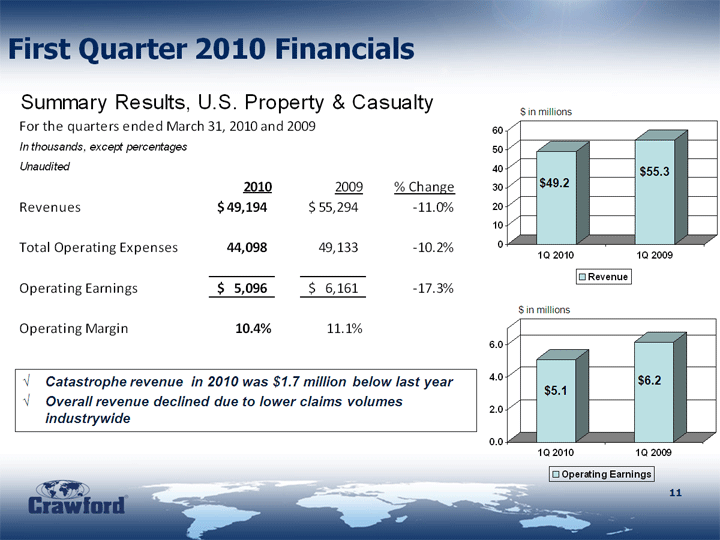
| 1Q 2010 1Q 2009 Revenue 49.194 55.052 1Q 2010 1Q 2009 Operating Earnings 5.096 6.17 $ in millions $ in millions $55.3 $49.2 $6.2 $5.1 Catastrophe revenue in 2010 was $1.7 million below last year Overall revenue declined due to lower claims volumes industrywide First Quarter 2010 Financials 11 |
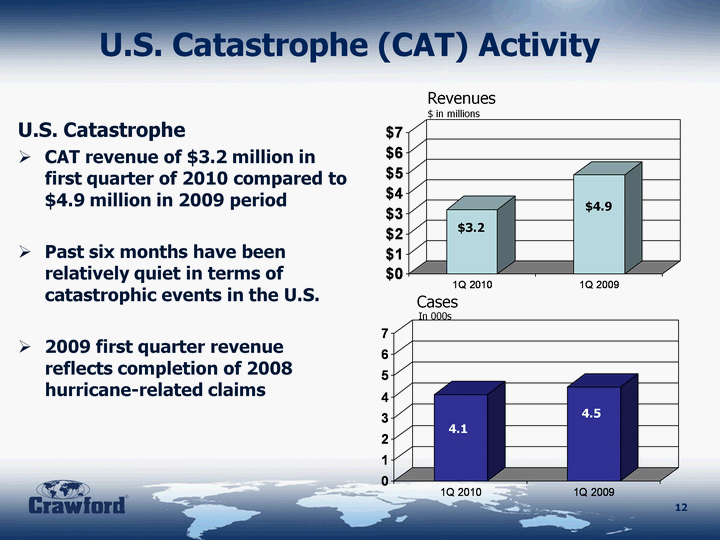
| 12 U.S. Catastrophe (CAT) Activity 1Q 2010 1Q 2009 1Q 2010 1Q 2009 Revenues 3.2 4.9 Revenues North $3.2 $4.9 $ in millions Revenues In 000s U.S. Catastrophe CAT revenue of $3.2 million in first quarter of 2010 compared to $4.9 million in 2009 period Past six months have been relatively quiet in terms of catastrophic events in the U.S. 2009 first quarter revenue reflects completion of 2008 hurricane- related claims Cases 4.5 4.1 |
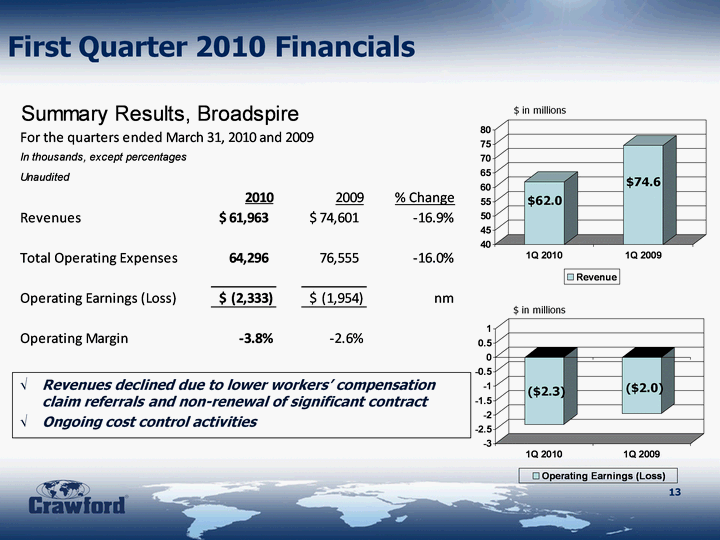
| 1Q 2010 1Q 2009 Revenue 61.963 74.601 1Q 2010 1Q 2009 Operating Earnings (Loss) -2.333 -1.954 $ in millions $ in millions $62.0 $74.6 ($2.3) ($2.0) Revenues declined due to lower workers' compensation claim referrals and non-renewal of significant contract Ongoing cost control activities First Quarter 2010 Financials 13 |
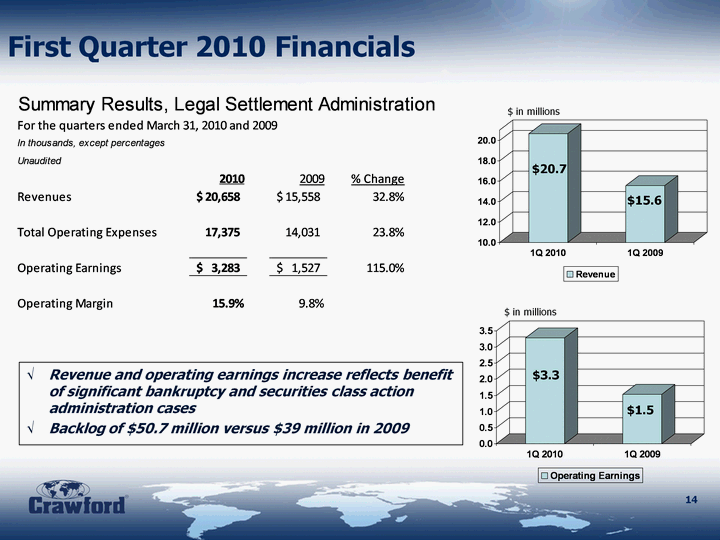
| 14 1Q 2010 1Q 2009 Revenue 20.658 15.558 1Q 2010 1Q 2009 Operating Earnings 3.283 1.527 $ in millions $ in millions $20.7 $15.6 $1.5 $3.3 Revenue and operating earnings increase reflects benefit of significant bankruptcy and securities class action administration cases Backlog of $50.7 million versus $39 million in 2009 First Quarter 2010 Financials |
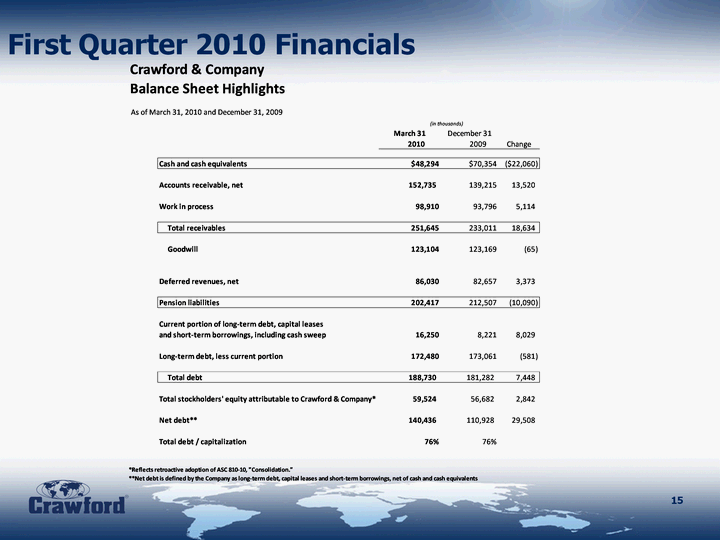
| 15 First Quarter 2010 Financials |
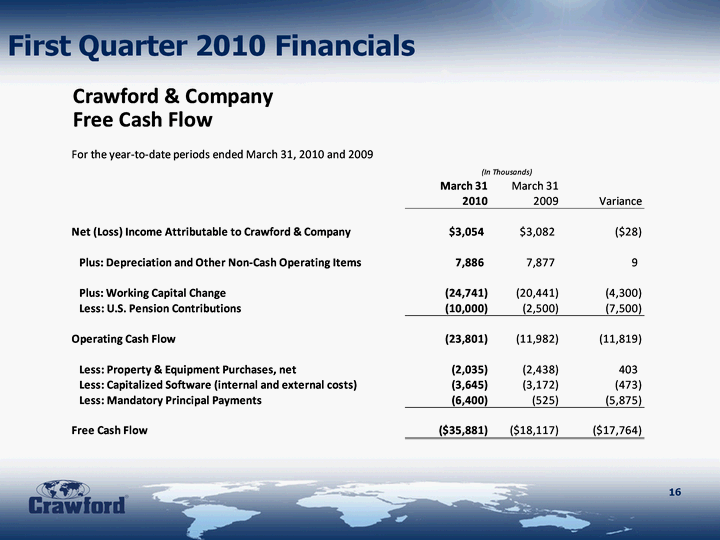
| First Quarter 2010 Financials 16 |
| 2010 Focus |
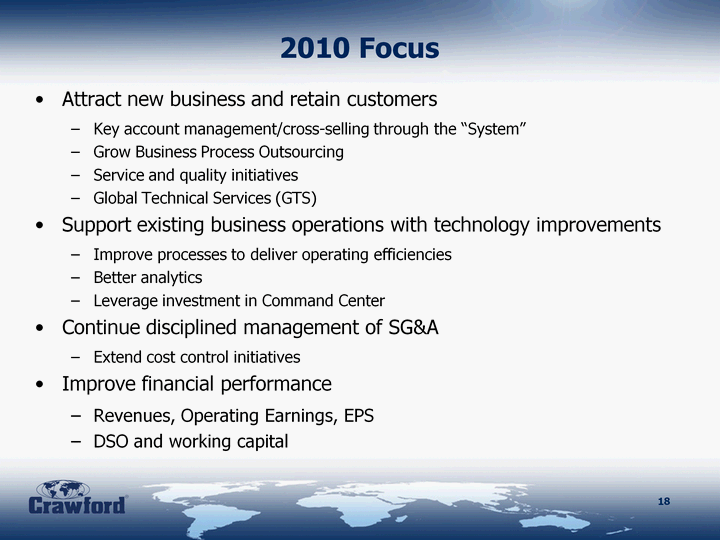
| 2010 Focus Attract new business and retain customers Key account management/cross-selling through the "System" Grow Business Process Outsourcing Service and quality initiatives Global Technical Services (GTS) Support existing business operations with technology improvements Improve processes to deliver operating efficiencies Better analytics Leverage investment in Command Center Continue disciplined management of SG&A Extend cost control initiatives Improve financial performance Revenues, Operating Earnings, EPS DSO and working capital 18 |
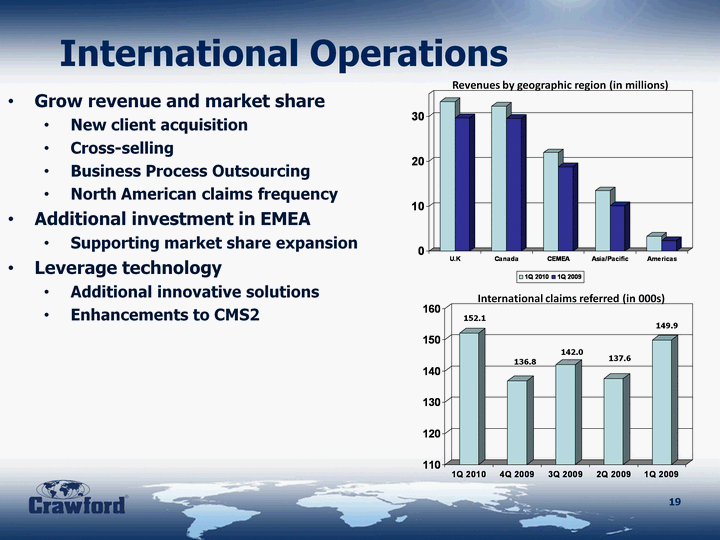
| International Operations 1Q 2010 4Q 2009 3Q 2009 2Q 2009 1Q 2009 International Claims 152.1 136.8 142 137.6 149.9 International claims referred (in 000s) 142.0 Grow revenue and market share New client acquisition Cross-selling Business Process Outsourcing North American claims frequency Additional investment in EMEA Supporting market share expansion Leverage technology Additional innovative solutions Enhancements to CMS2 137.6 149.9 152.1 136.8 19 U.K Canada CEMEA Asia/Pacific Americas 1Q 2010 33.312 32.309 21.946 13.485 3.399 1Q 2009 29.648 29.566 18.845 10.177 2.394 Revenues by geographic region (in millions) |
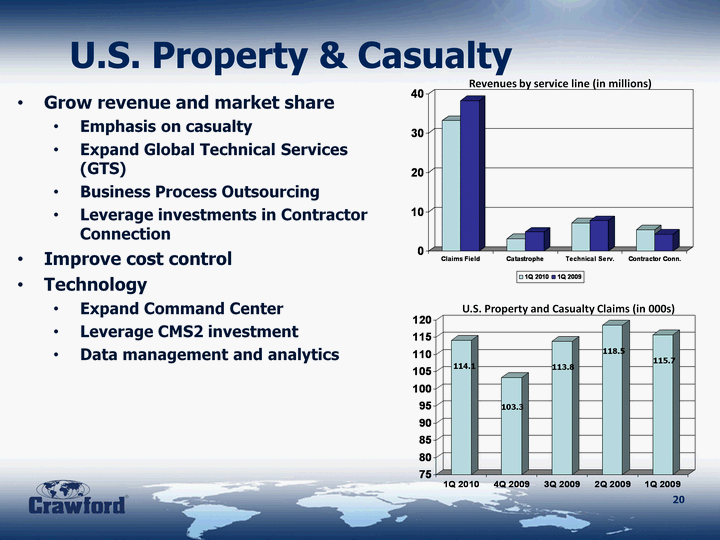
| U.S. Property & Casualty 1Q 2010 4Q 2009 3Q 2009 2Q 2009 1Q 2009 U.S. P&C Claims 114.1 103.3 113.8 118.5 115.7 CAT claims 12.5 6.5 U.S. Property and Casualty Claims (in 000s) 113.8 118.5 115.7 114.1 103.3 Grow revenue and market share Emphasis on casualty Expand Global Technical Services (GTS) Business Process Outsourcing Leverage investments in Contractor Connection Improve cost control Technology Expand Command Center Leverage CMS2 investment Data management and analytics 20 Claims Field Catastrophe Technical Serv. Contractor Conn. 1Q 2010 33.202 3.234 7.25 5.508 1Q 2009 38.273 4.908 7.776 4.337 Revenues by service line (in millions) |
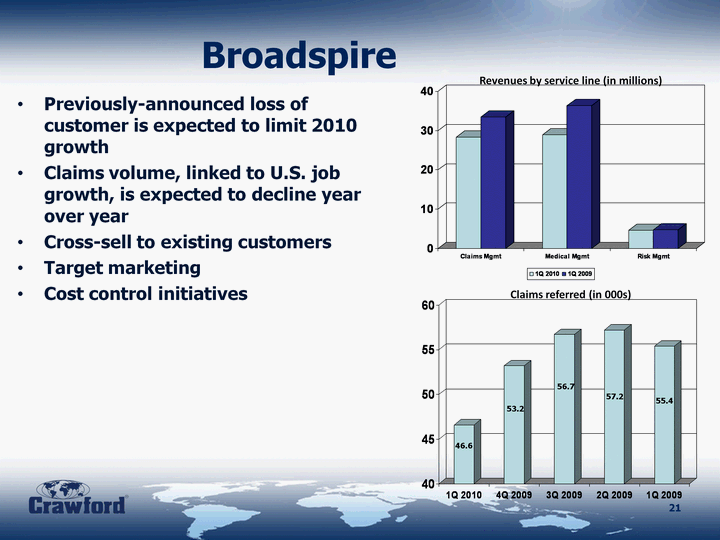
| Broadspire 1Q 2010 4Q 2009 3Q 2009 2Q 2009 1Q 2009 Broadspire Claims 46.6 53.2 56.7 57.2 55.4 Claims referred (in 000s) 56.7 57.2 55.4 46.6 53.2 Previously-announced loss of customer is expected to limit 2010 growth Claims volume, linked to U.S. job growth, is expected to decline year over year Cross-sell to existing customers Target marketing Cost control initiatives 21 Claims Mgmt Medical Mgmt Risk Mgmt 1Q 2010 28.281 29.011 4.671 1Q 2009 33.487 36.364 4.75 Revenues by service line (in millions) |
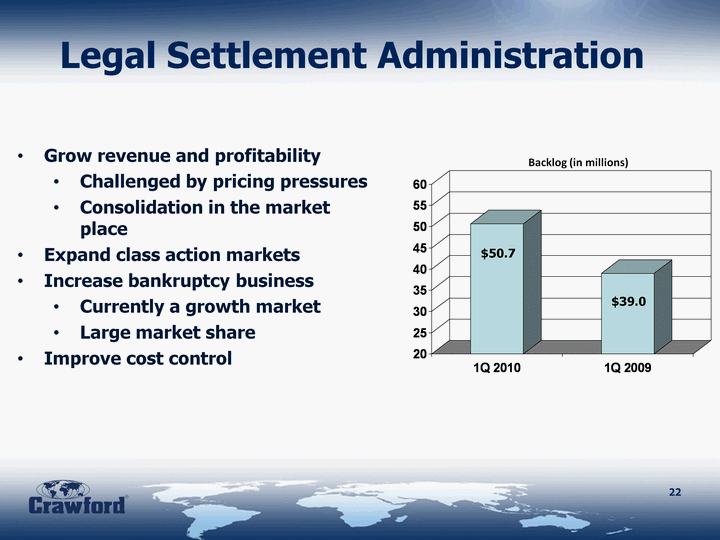
| Legal Settlement Administration Backlog (in millions) $50.7 $39.0 Grow revenue and profitability Challenged by pricing pressures Consolidation in the market place Expand class action markets Increase bankruptcy business Currently a growth market Large market share Improve cost control 22 |
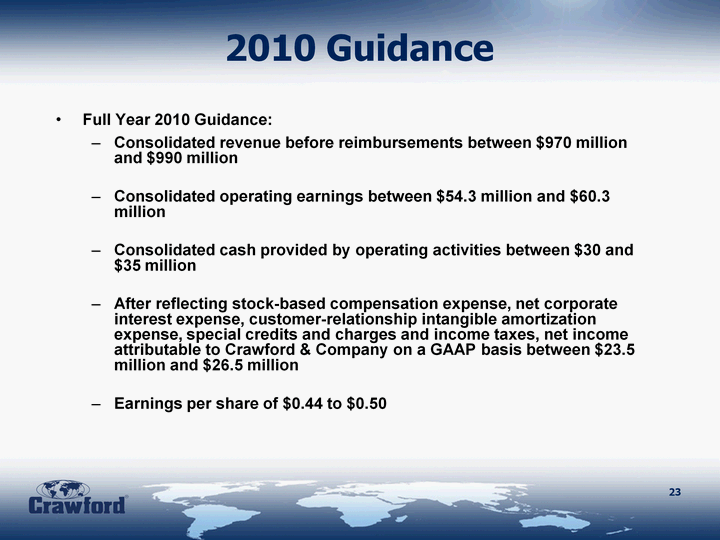
| 2010 Guidance Full Year 2010 Guidance: Consolidated revenue before reimbursements between $970 million and $990 million Consolidated operating earnings between $54.3 million and $60.3 million Consolidated cash provided by operating activities between $30 and $35 million After reflecting stock-based compensation expense, net corporate interest expense, customer-relationship intangible amortization expense, special credits and charges and income taxes, net income attributable to Crawford & Company on a GAAP basis between $23.5 million and $26.5 million Earnings per share of $0.44 to $0.50 23 |

| First Quarter 2010 Earnings Conference Call Monday, May 10, 2010 |
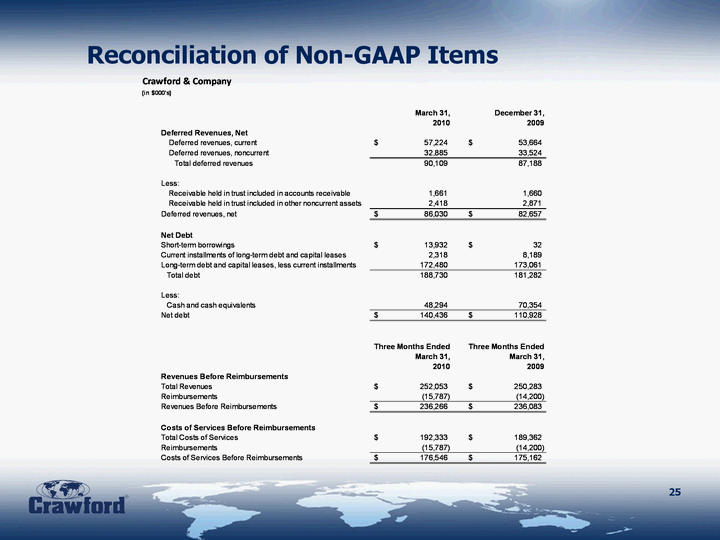
| Reconciliation of Non-GAAP Items 25 |
