Attached files
| file | filename |
|---|---|
| EX-99.2 - EX-99.2 - ACNB CORP | a10-9671_1ex99d2.htm |
| 8-K - 8-K - ACNB CORP | a10-9671_18k.htm |
Exhibit 99.1
|
|
ACNB Corporation Annual Meeting of Shareholders May 4, 2010 |
|
|
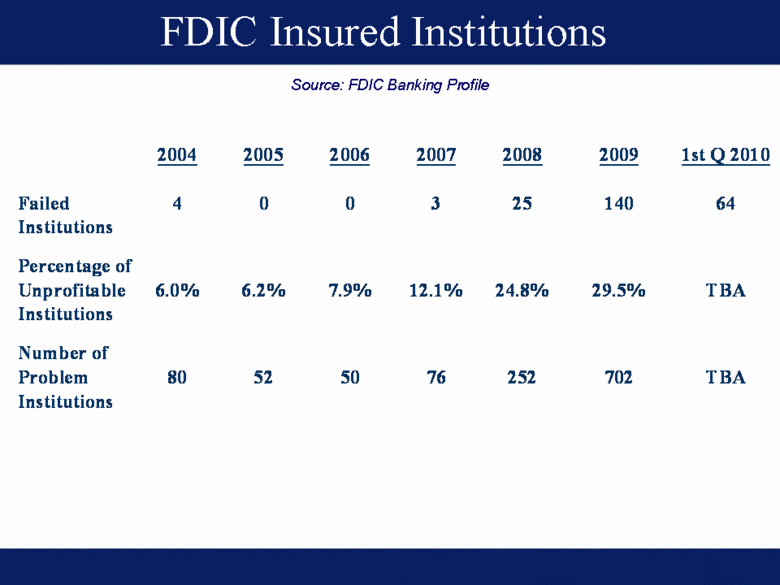
FDIC Insured Institutions Source: FDIC Banking Profile 2004 2005 2006 2007 2008 2009 1st Q 2010 Failed 4 0 0 3 25 140 64 Institutions Percentage of Unprofitable 6.0% 6.2% 7.9% 12.1% 24.8% 29.5% TBA Institutions Number of Problem 80 52 50 76 252 702 TBA Institutions |
|
|
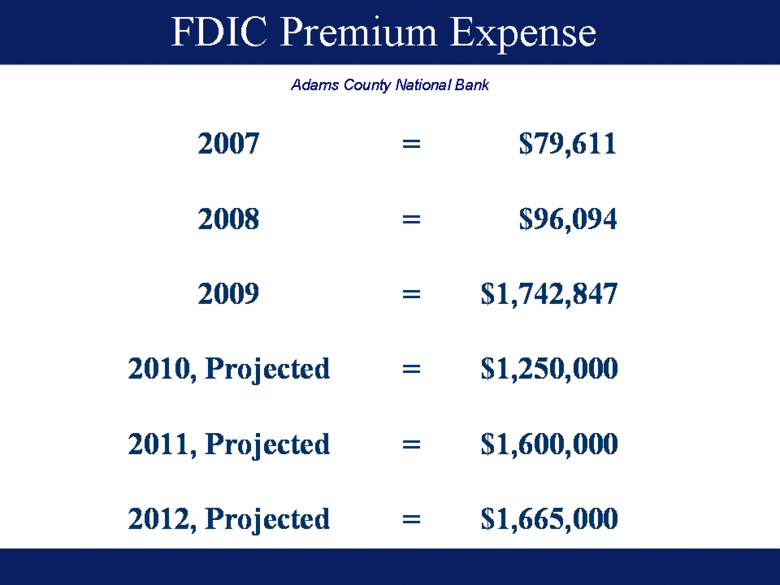
FDIC Premium Expense Adams County National Bank 2007 = $79,611 2008 = $96,094 2009 = $1,742,847 2010, Projected = $1,250,000 2011, Projected = $1,600,000 2012, Projected = $1,665,000 |
|
|
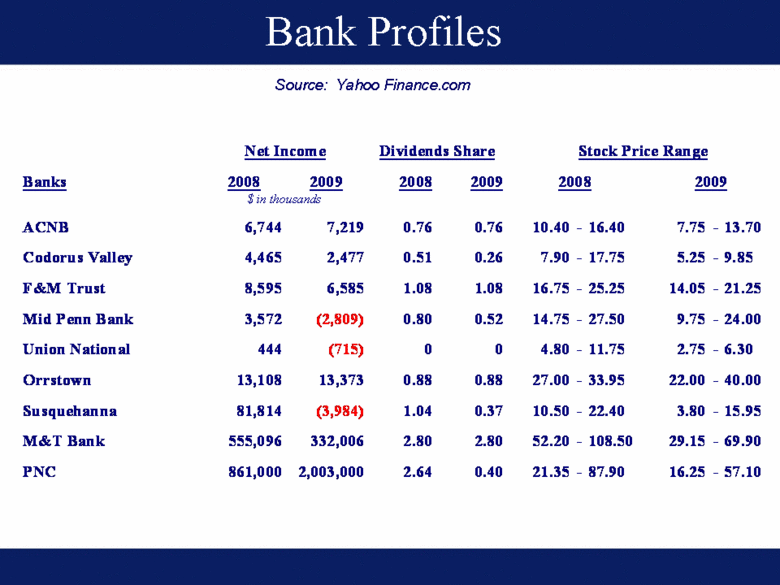
Bank Profiles Source: Yahoo Finance.com Banks 2008 2009 2008 2009 ACNB 6,744 7,219 0.76 0.76 10.40 - 16.40 7.75 - 13.70 Codorus Valley 4,465 2,477 0.51 0.26 7.90 - 17.75 5.25 - 9.85 F&M Trust 8,595 6,585 1.08 1.08 16.75 - 25.25 14.05 - 21.25 Mid Penn Bank 3,572 (2,809) 0.80 0.52 14.75 - 27.50 9.75 - 24.00 Union National 444 (715) 0 0 4.80 - 11.75 2.75 - 6.30 Orrstown 13,108 13,373 0.88 0.88 27.00 - 33.95 22.00 - 40.00 Susquehanna 81,814 (3,984) 1.04 0.37 10.50 - 22.40 3.80 - 15.95 M&T Bank 555,096 332,006 2.80 2.80 52.20 - 108.50 29.15 - 69.90 PNC 861,000 2,003,000 2.64 0.40 21.35 - 87.90 16.25 - 57.10 $ in thousands 2008 2009 Stock Price Range Net Income Dividends Share |
|
|
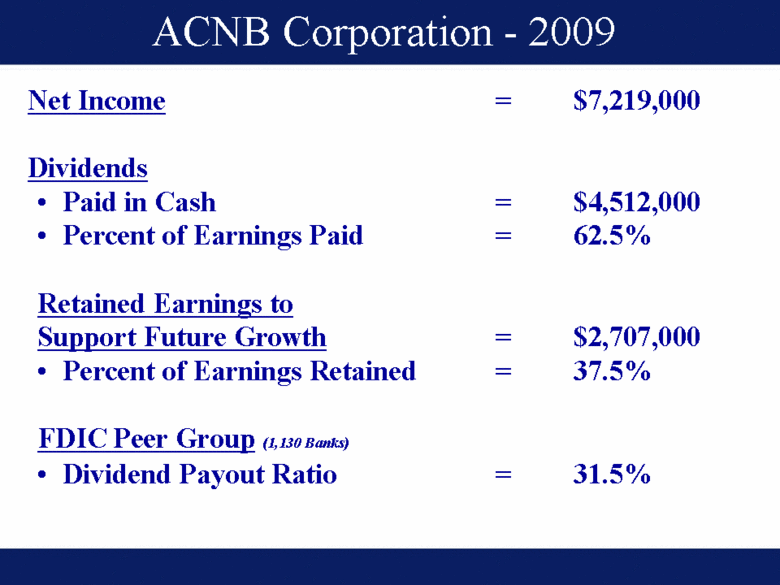
ACNB Corporation - 2009 Net Income = $7,219,000 Dividends Paid in Cash = $4,512,000 Percent of Earnings Paid = 62.5% Retained Earnings to Support Future Growth = $2,707,000 Percent of Earnings Retained = 37.5% FDIC Peer Group (1,130 Banks) Dividend Payout Ratio = 31.5% |
|
|
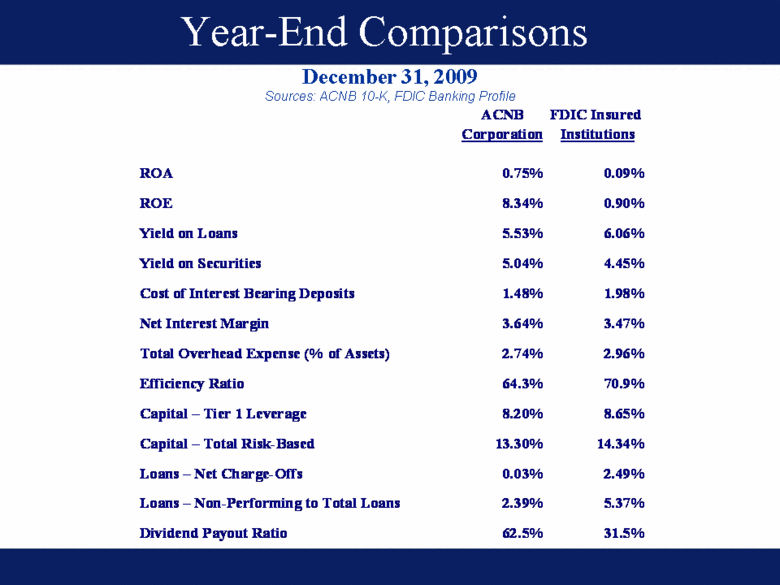
Year-End Comparisons December 31, 2009 Sources: ACNB 10-K, FDIC Banking Profile ACNB FDIC Insured Corporation Institutions ROA 0.75% 0.09% ROE 8.34% 0.90% Yield on Loans 5.53% 6.06% Yield on Securities 5.04% 4.45% Cost of Interest Bearing Deposits 1.48% 1.98% Net Interest Margin 3.64% 3.47% Total Overhead Expense (% of Assets) 2.74% 2.96% Efficiency Ratio 64.3% 70.9% Capital – Tier 1 Leverage 8.20% 8.65% Capital – Total Risk-Based 13.30% 14.34% Loans – Net Charge-Offs 0.03% 2.49% Loans – Non-Performing to Total Loans 2.39% 5.37% Dividend Payout Ratio 62.5% 31.5% |
|
|
ACNB Corporation David W. Cathell EVP, Treasurer & Chief Financial Officer |
|
|
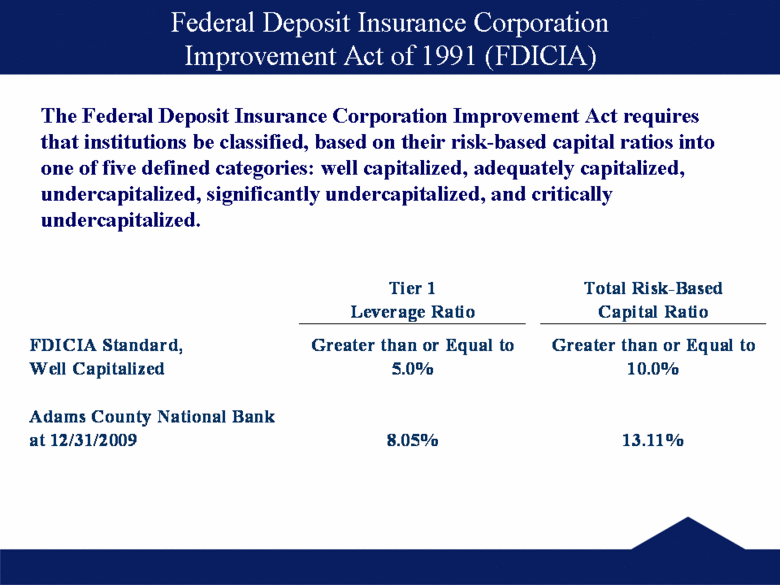
Federal Deposit Insurance Corporation Improvement Act of 1991 (FDICIA) The Federal Deposit Insurance Corporation Improvement Act requires that institutions be classified, based on their risk-based capital ratios into one of five defined categories: well capitalized, adequately capitalized, undercapitalized, significantly undercapitalized, and critically undercapitalized. Tier 1 Total Risk-Based Leverage Ratio Capital Ratio FDICIA Standard, Greater than or Equal to Greater than or Equal to Well Capitalized 5.0% 10.0% Adams County National Bank at 12/31/2009 8.05% 13.11% |
|
|
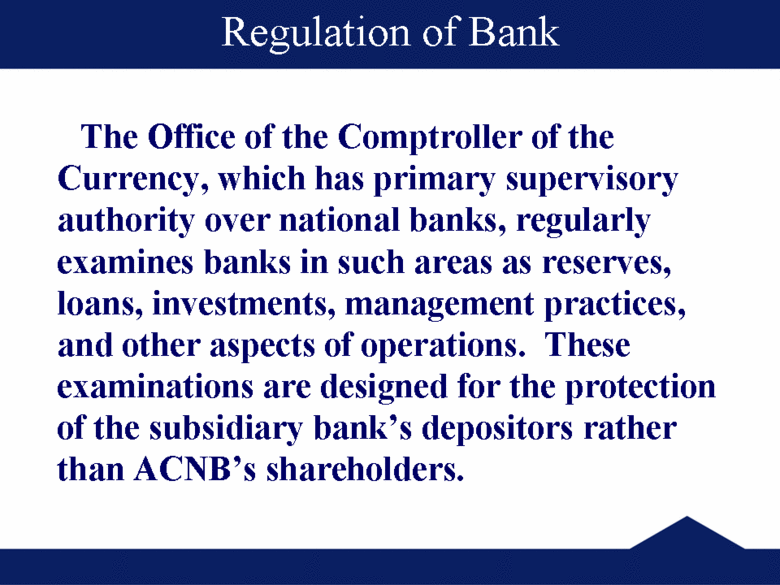
Regulation of Bank The Office of the Comptroller of the Currency, which has primary supervisory authority over national banks, regularly examines banks in such areas as reserves, loans, investments, management practices, and other aspects of operations. These examinations are designed for the protection of the subsidiary bank’s depositors rather than ACNB’s shareholders. |
|
|
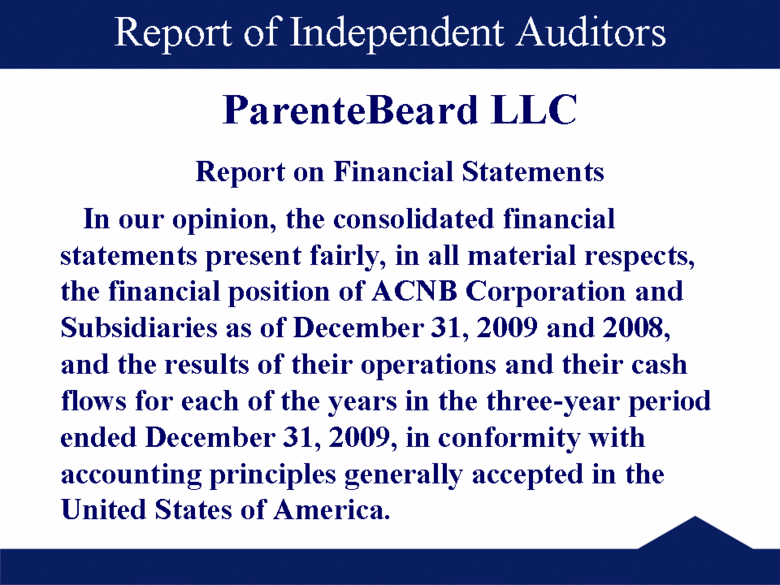
In our opinion, the consolidated financial statements present fairly, in all material respects, the financial position of ACNB Corporation and Subsidiaries as of December 31, 2009 and 2008, and the results of their operations and their cash flows for each of the years in the three-year period ended December 31, 2009, in conformity with accounting principles generally accepted in the United States of America. ParenteBeard LLC Report on Financial Statements Report of Independent Auditors |
|
|
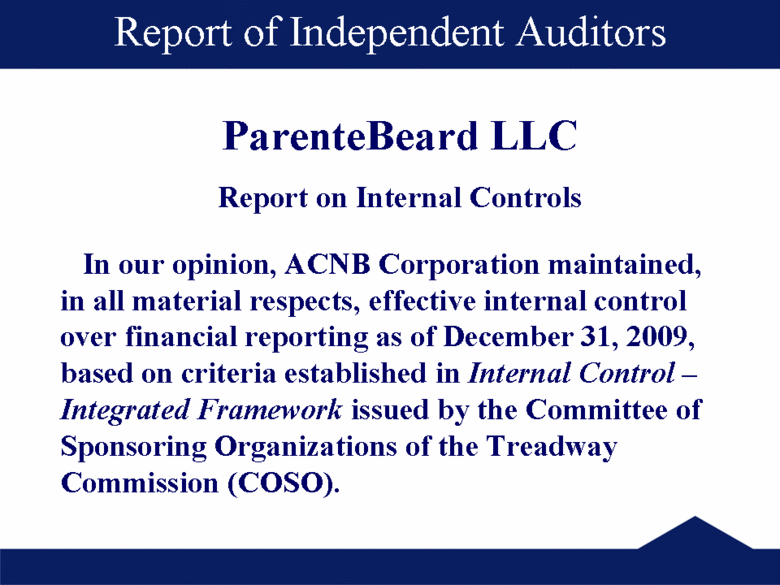
ParenteBeard LLC Report on Internal Controls Report of Independent Auditors In our opinion, ACNB Corporation maintained, in all material respects, effective internal control over financial reporting as of December 31, 2009, based on criteria established in Internal Control – Integrated Framework issued by the Committee of Sponsoring Organizations of the Treadway Commission (COSO). |
|
|
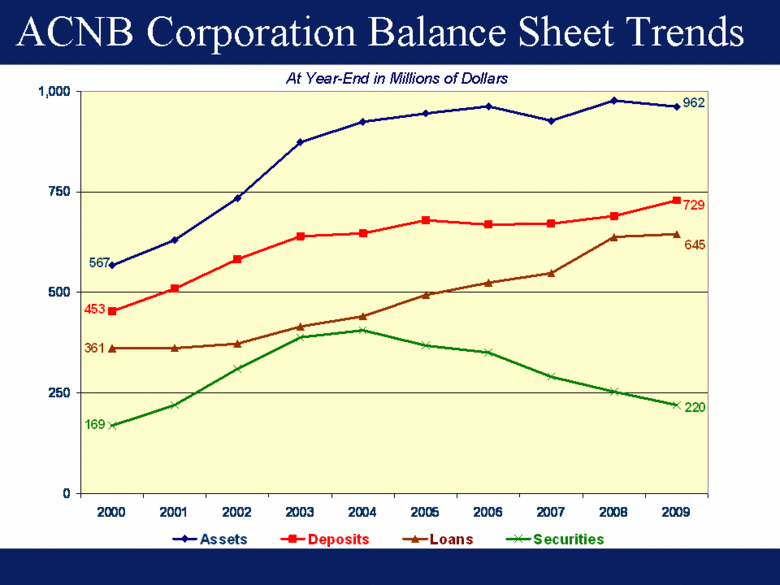
ACNB Corporation Balance Sheet Trends At Year-End in Millions of Dollars 0 250 500 750 1,000 2000 2001 2002 2003 2004 2005 2006 2007 2008 2009 Assets Deposits Loans Securities 567 169 361 453 220 645 729 962 |
|
|
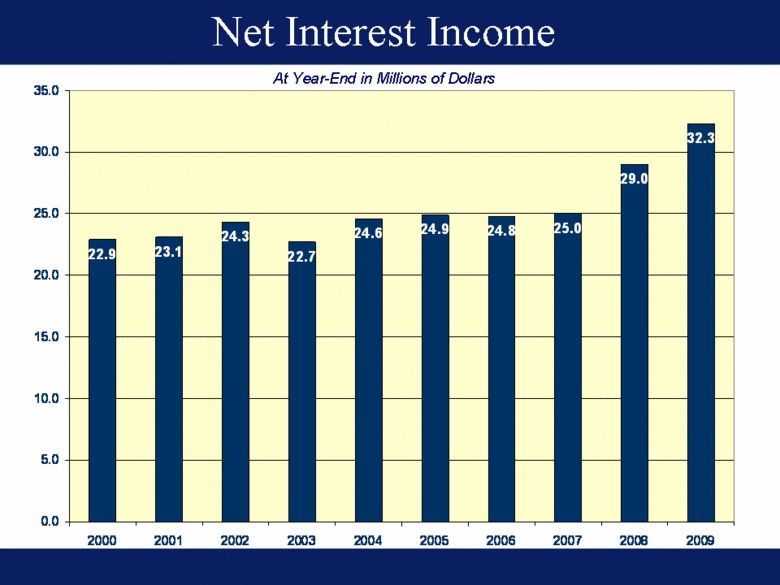
Net Interest Income At Year-End in Millions of Dollars 22.9 23.1 24.3 22.7 24.6 24.9 24.8 25.0 29.0 32.3 0.0 5.0 10.0 15.0 20.0 25.0 30.0 35.0 2000 2001 2002 2003 2004 2005 2006 2007 2008 2009 |
|
|
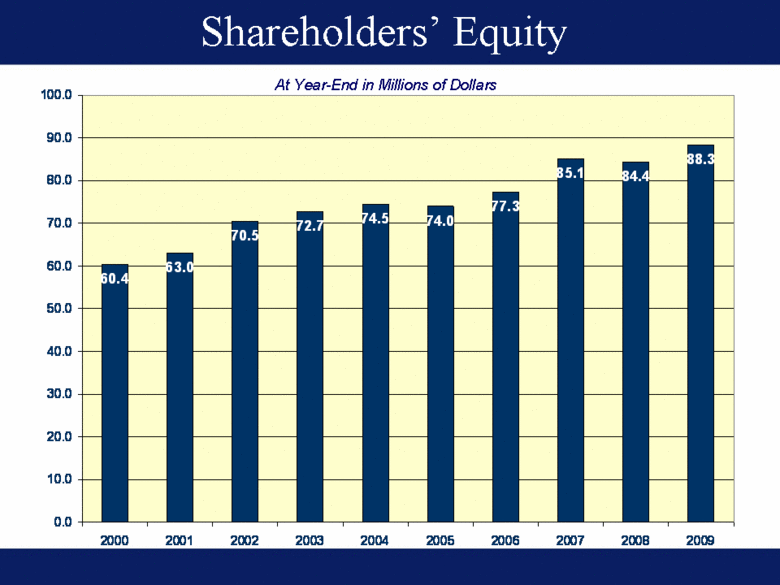
Shareholders’ Equity At Year-End in Millions of Dollars 60.4 63.0 70.5 72.7 74.5 74.0 77.3 85.1 84.4 88.3 0.0 10.0 20.0 30.0 40.0 50.0 60.0 70.0 80.0 90.0 100.0 2000 2001 2002 2003 2004 2005 2006 2007 2008 2009 |
|
|
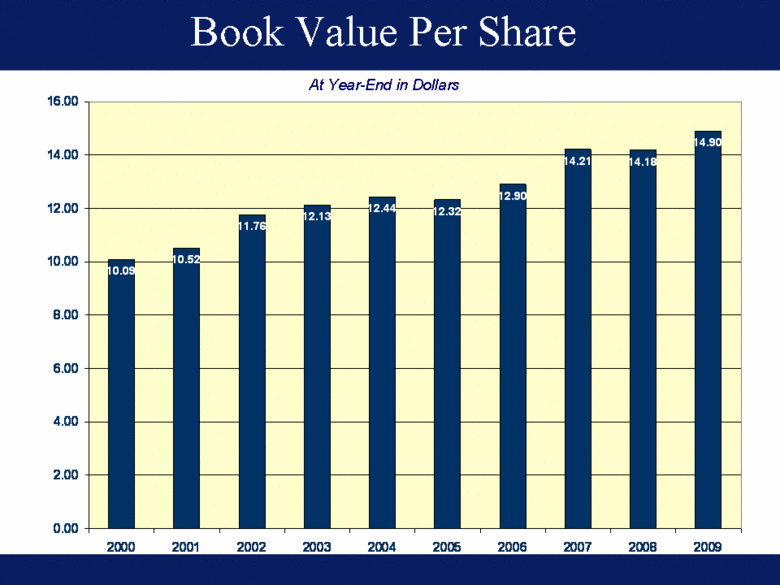
Book Value Per Share At Year-End in Dollars 10.09 10.52 11.76 12.13 12.44 12.32 12.90 14.21 14.18 14.90 0.00 2.00 4.00 6.00 8.00 10.00 12.00 14.00 16.00 2000 2001 2002 2003 2004 2005 2006 2007 2008 2009 |
|
|
ADAMS COUNTY NATIONAL BANK James P. Helt EVP/Banking Services |
|
|
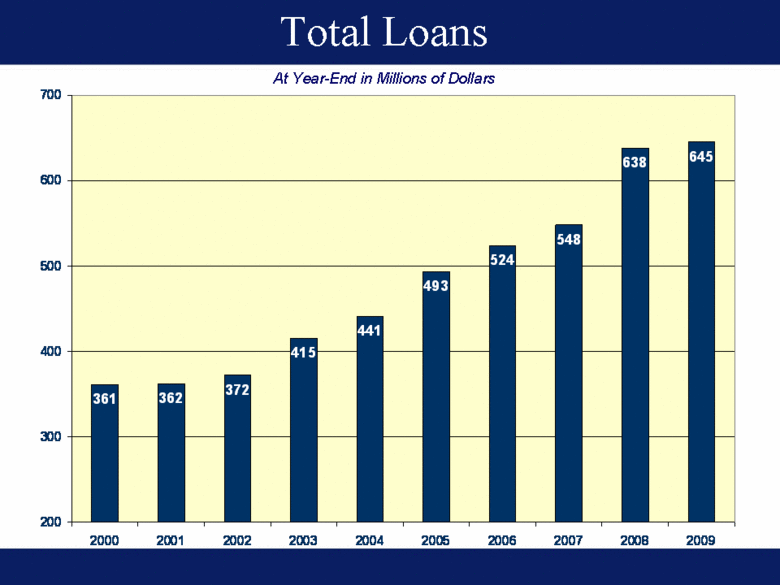
Total Loans At Year-End in Millions of Dollars 361 362 372 415 441 493 524 548 638 645 200 300 400 500 600 700 2000 2001 2002 2003 2004 2005 2006 2007 2008 2009 |
|
|
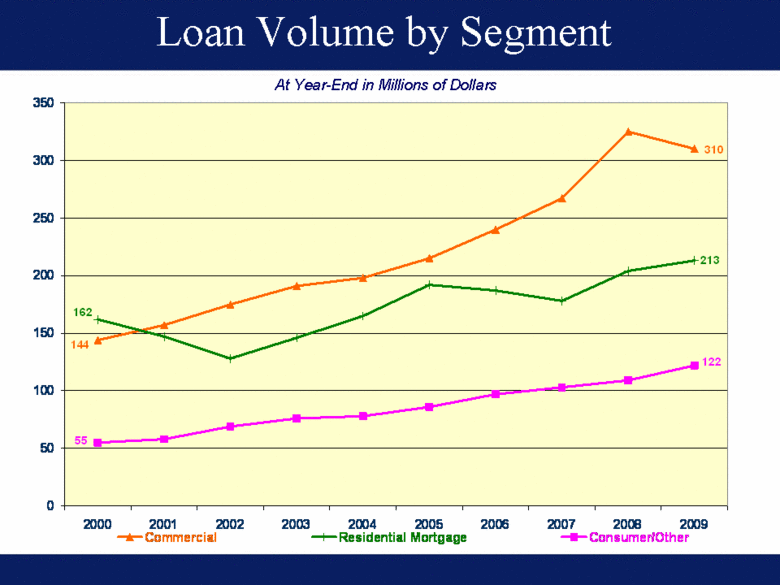
Loan Volume by Segment At Year-End in Millions of Dollars 310 144 213 162 122 55 0 50 100 150 200 250 300 350 2000 2001 2002 2003 2004 2005 2006 2007 2008 2009 Commercial Residential Mortgage Consumer/Other |
|
|
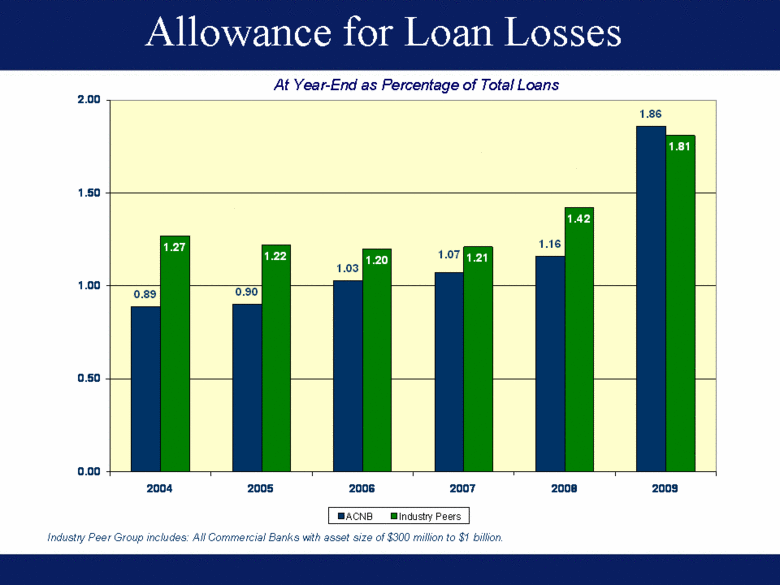
Allowance for Loan Losses At Year-End as Percentage of Total Loans Industry Peer Group includes: All Commercial Banks with asset size of $300 million to $1 billion. 0.89 0.90 1.03 1.16 1.86 1.27 1.22 1.20 1.21 1.42 1.81 1.07 0.00 0.50 1.00 1.50 2.00 2004 2005 2006 2007 2008 2009 ACNB Industry Peers |
|
|
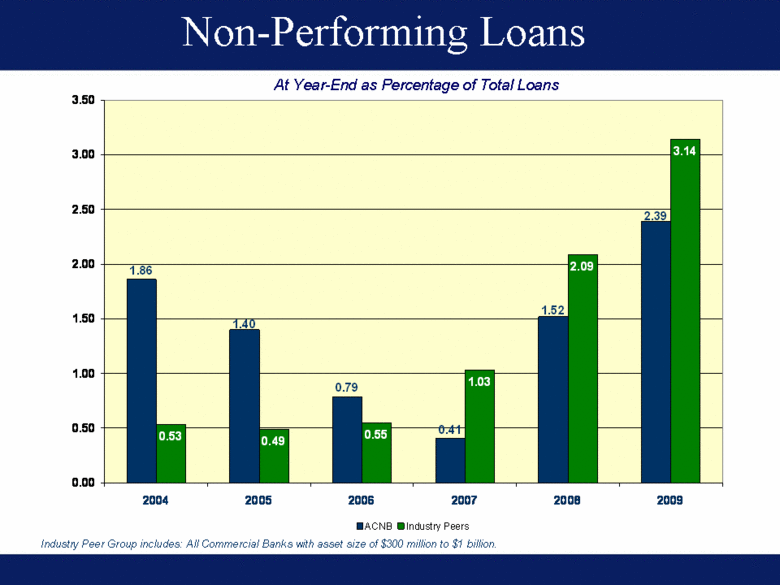
Non-Performing Loans At Year-End as Percentage of Total Loans Industry Peer Group includes: All Commercial Banks with asset size of $300 million to $1 billion. 0.53 0.49 0.55 1.03 2.09 3.14 1.52 0.41 0.79 1.40 1.86 2.39 0.00 0.50 1.00 1.50 2.00 2.50 3.00 3.50 2004 2005 2006 2007 2008 2009 ACNB Industry Peers |
|
|
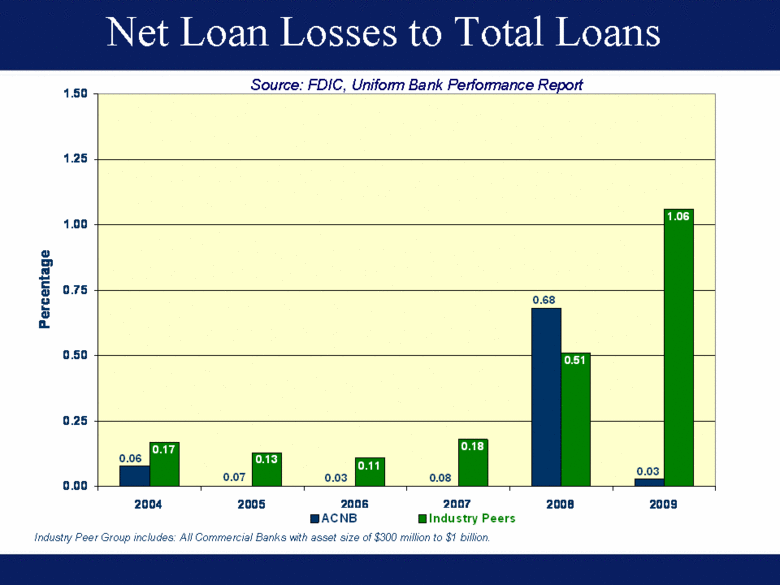
Net Loan Losses to Total Loans Industry Peer Group includes: All Commercial Banks with asset size of $300 million to $1 billion. Source: FDIC, Uniform Bank Performance Report 0.07 0.06 0.03 0.08 0.68 0.03 0.11 0.13 0.17 0.18 1.06 0.51 0.00 0.25 0.50 0.75 1.00 1.25 1.50 2004 2005 2006 2007 2008 2009 Percentage ACNB Industry Peers |
|
|
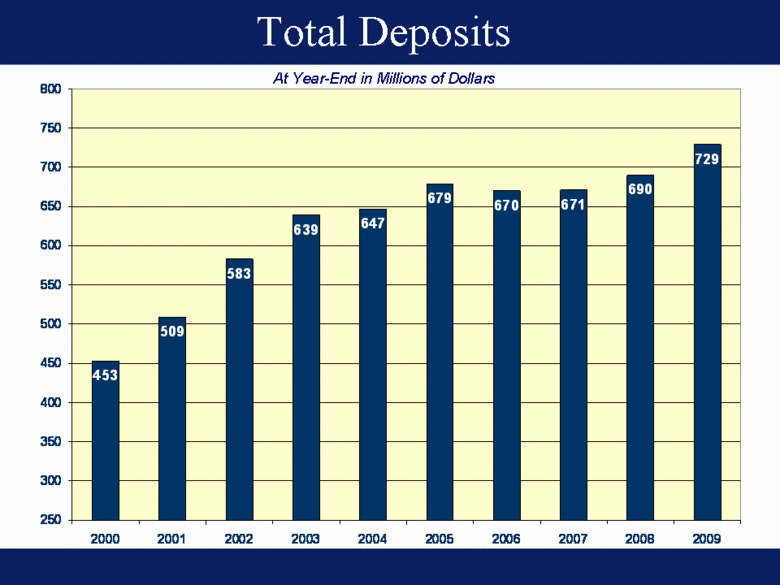
Total Deposits At Year-End in Millions of Dollars 453 509 583 639 647 679 670 671 690 729 250 300 350 400 450 500 550 600 650 700 750 800 2000 2001 2002 2003 2004 2005 2006 2007 2008 2009 |
|
|
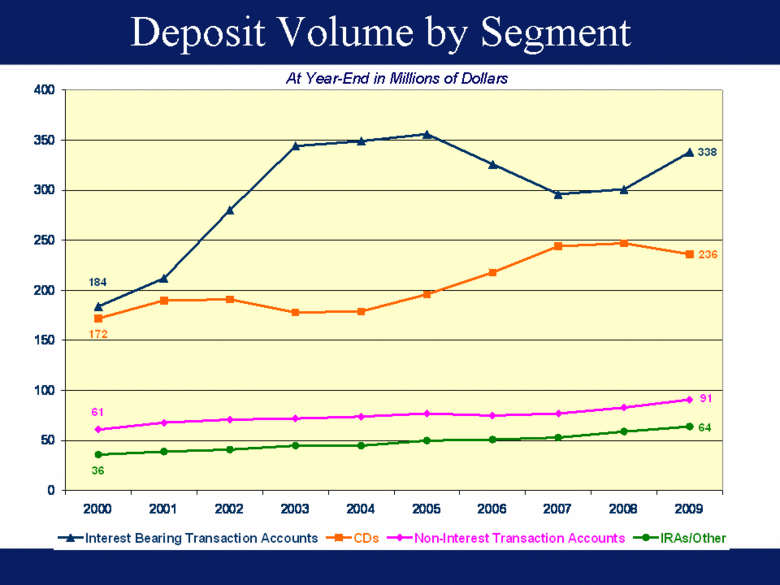
Deposit Volume by Segment At Year-End in Millions of Dollars 172 61 36 338 184 236 91 64 0 50 100 150 200 250 300 350 400 2000 2001 2002 2003 2004 2005 2006 2007 2008 2009 Interest Bearing Transaction Accounts CDs Non-Interest Transaction Accounts IRAs/Other |
|
|
ADAMS COUNTY NATIONAL BANK Lynda L. Glass EVP & Chief Operating Officer |
|
|
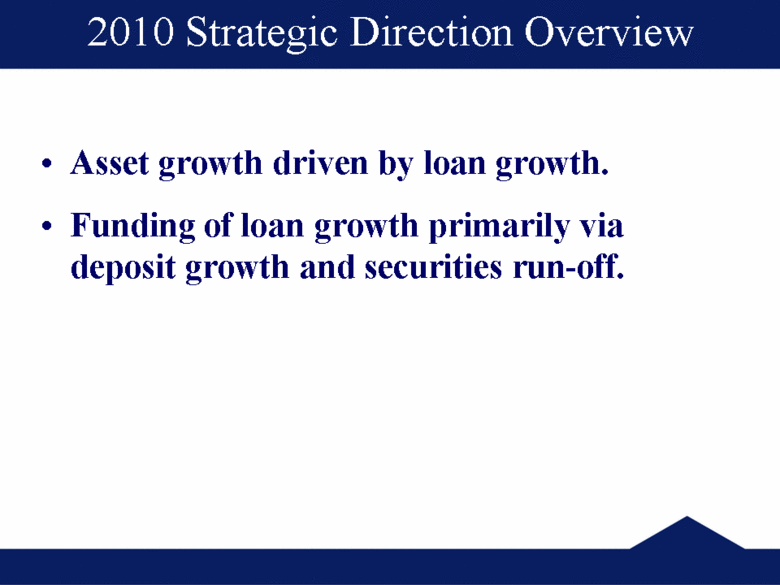
2010 Strategic Direction Overview Asset growth driven by loan growth. Funding of loan growth primarily via deposit growth and securities run-off. |
|
|
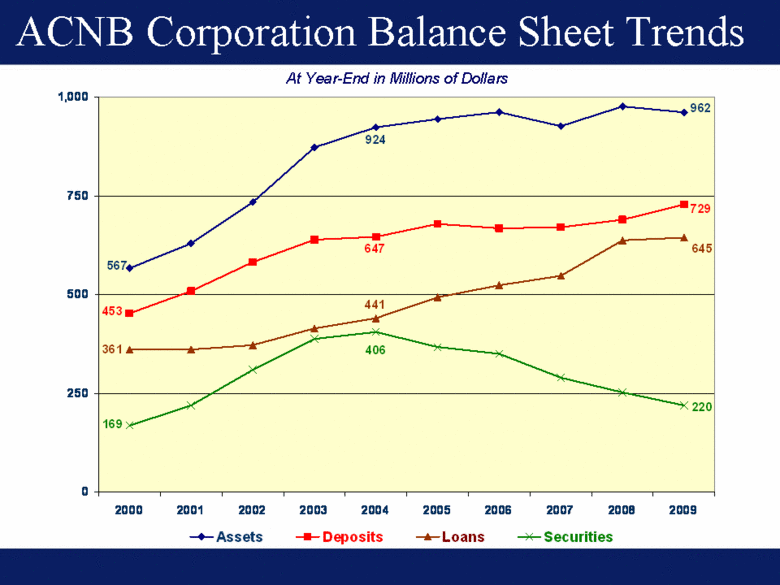
ACNB Corporation Balance Sheet Trends At Year-End in Millions of Dollars 0 250 500 750 1,000 2000 2001 2002 2003 2004 2005 2006 2007 2008 2009 Assets Deposits Loans Securities 567 169 361 453 220 645 729 962 924 647 441 406 |
|
|
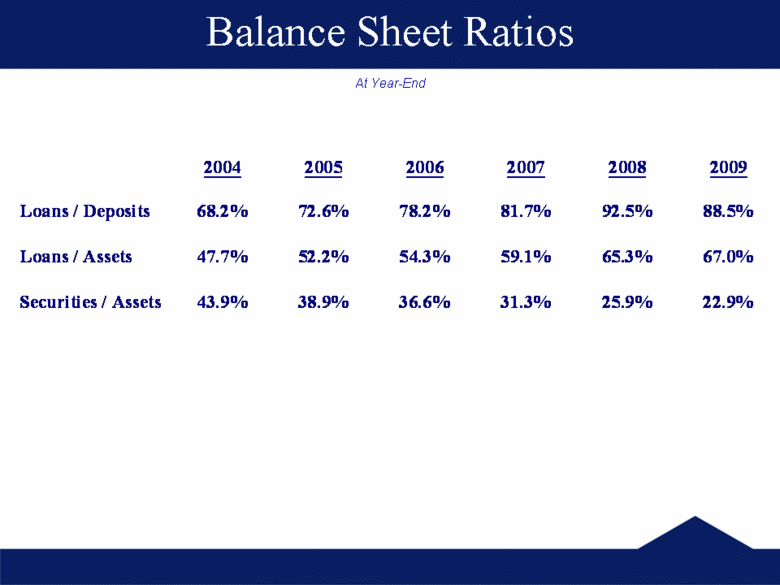
Balance Sheet Ratios At Year-End 2004 2005 2006 2007 2008 2009 Loans / Deposits 68.2% 72.6% 78.2% 81.7% 92.5% 88.5% Loans / Assets 47.7% 52.2% 54.3% 59.1% 65.3% 67.0% Securities / Assets 43.9% 38.9% 36.6% 31.3% 25.9% 22.9% |
|
|
Key Strategic Investments People Technology |
|
|
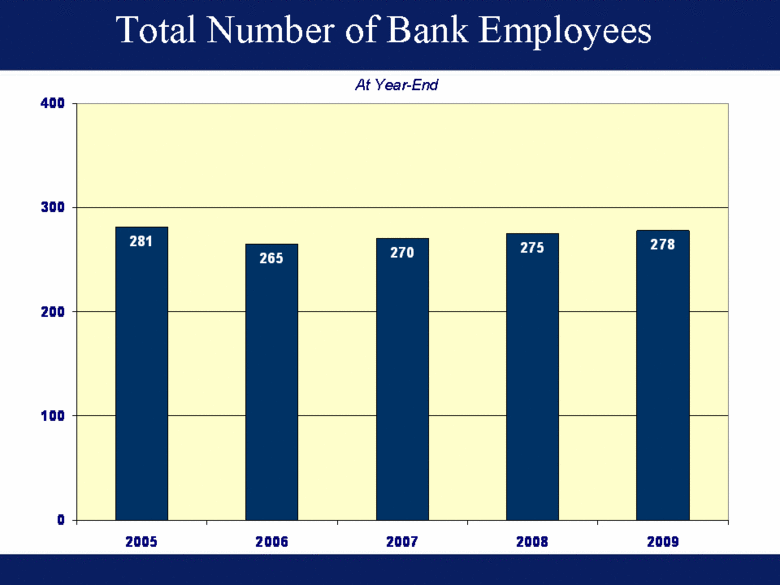
Total Number of Bank Employees At Year-End 281 265 270 275 278 0 100 200 300 400 2005 2006 2007 2008 2009 |
|
|
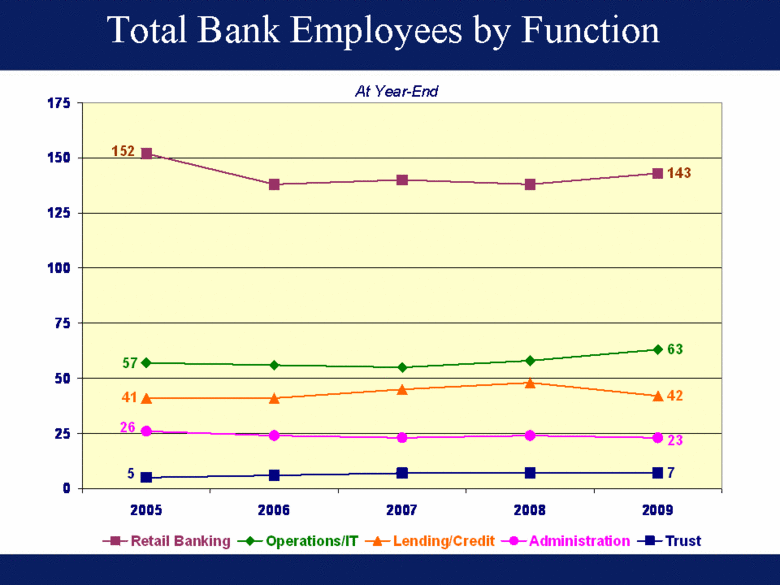
Total Bank Employees by Function At Year-End 63 42 7 152 143 57 41 23 26 5 0 25 50 75 100 125 150 175 2005 2006 2007 2008 2009 Retail Banking Operations/IT Lending/Credit Administration Trust |
|
|
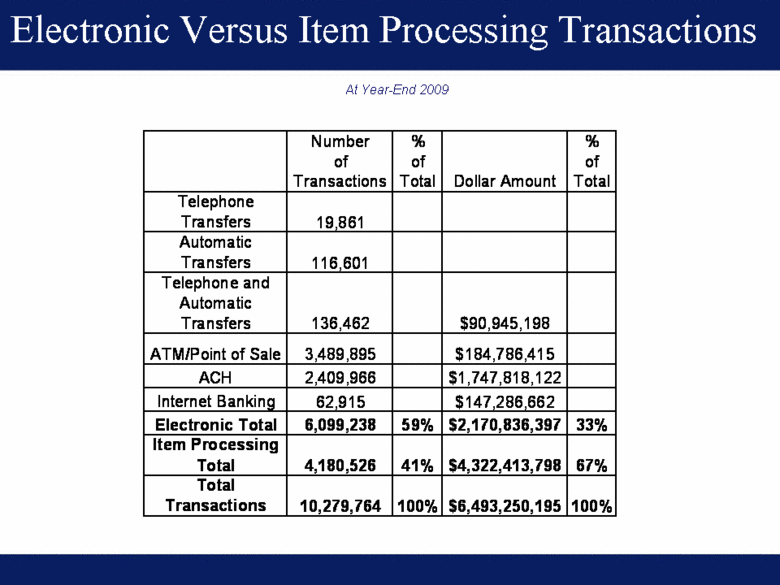
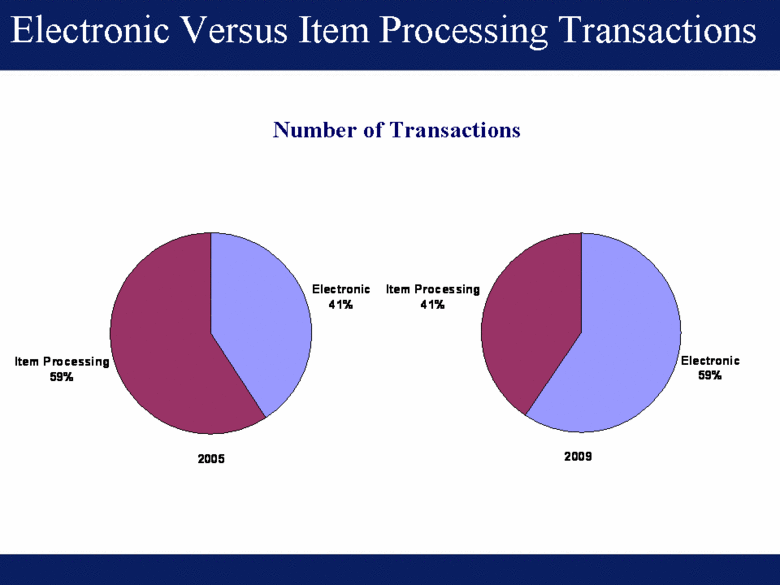
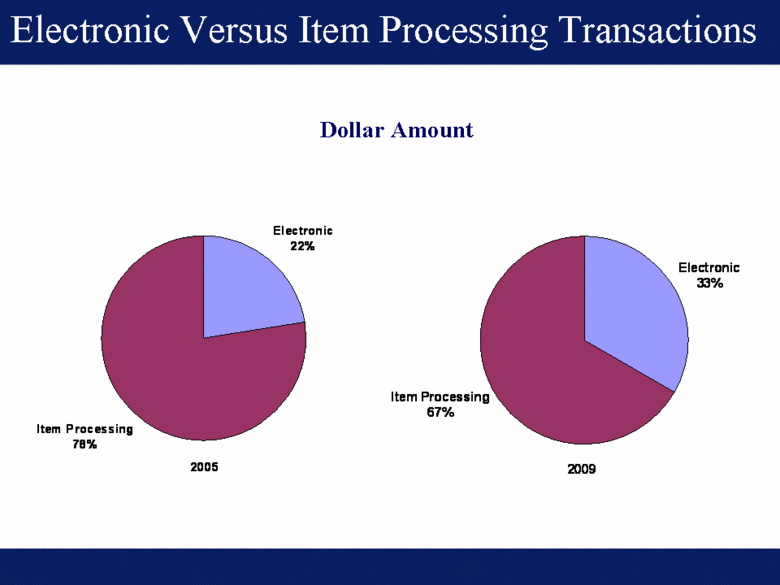
Electronic Versus Item Processing Transactions At Year-End 2009 Number of Transactions % of Total Dollar Amount % of Total Telephone Transfers 19,861 Automatic Transfers 116,601 Telephone and Automatic Transfers 136,462 $90,945,198 ATM/Point of Sale 3,489,895 $184,786,415 ACH 2,409,966 $1,747,818,122 Internet Banking 62,915 $147,286,662 Electronic Total 6,099,238 59% $2,170,836,397 33% Item Processing Total 4,180,526 41% $4,322,413,798 67% Total Transactions 10,279,764 100% $6,493,250,195 100% |
|
|
Electronic Versus Item Processing Transactions Number of Transactions 2005 Electronic 41% Item Processing 59% 2009 Electronic 59% Item Processing 41% |
|
|
Electronic Versus Item Processing Transactions Dollar Amount 2009 Item Processing 67% Electronic 33% Item Processing 78% 2005 Electronic 22% |
|
|
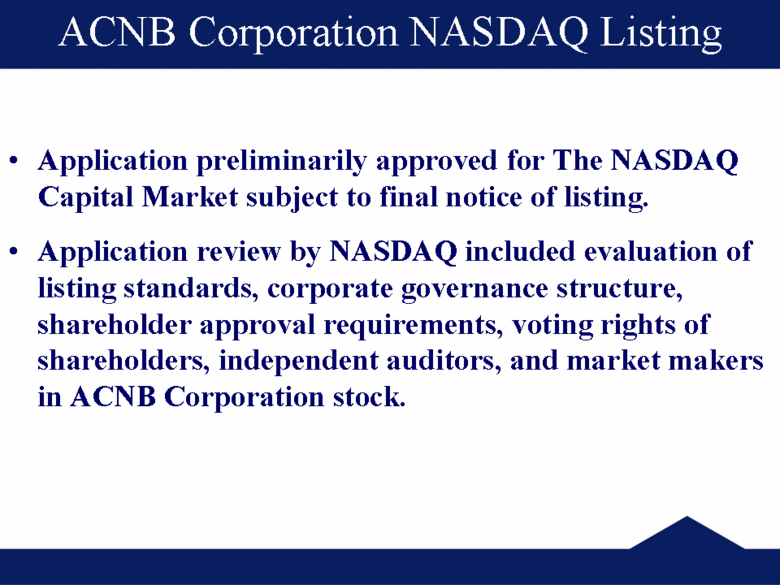
ACNB Corporation NASDAQ Listing Application preliminarily approved for The NASDAQ Capital Market subject to final notice of listing. Application review by NASDAQ included evaluation of listing standards, corporate governance structure, shareholder approval requirements, voting rights of shareholders, independent auditors, and market makers in ACNB Corporation stock. |
|
|
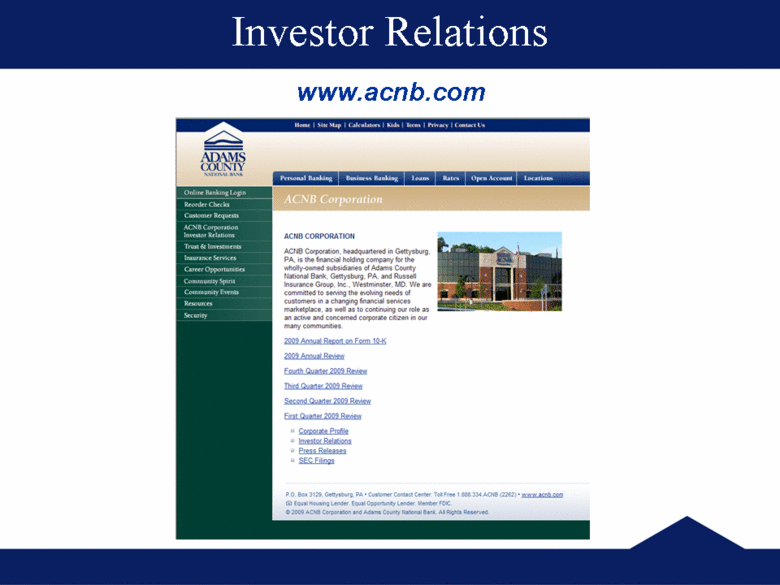
www.acnb.com Investor Relations |
|
|
RUSSELL INSURANCE GROUP A Subsidiary of ACNB Corporation Frank C. Russell, Jr. President & CEO |
|
|
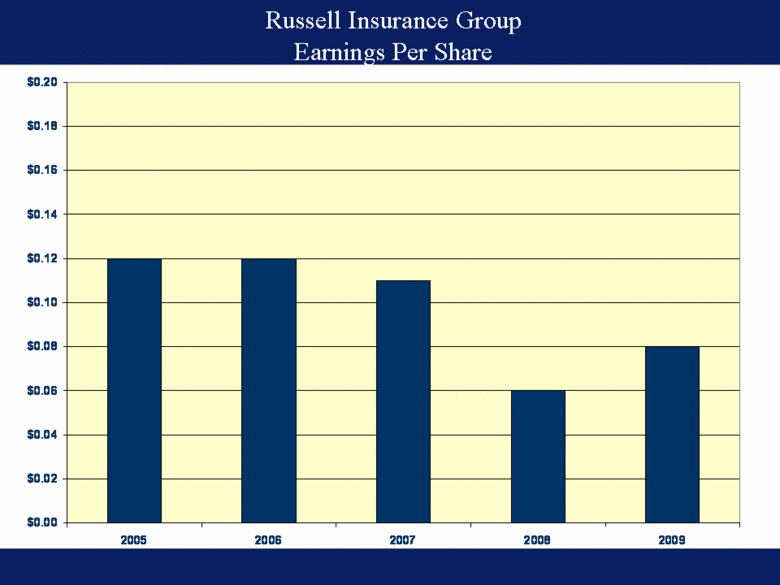
Russell Insurance Group Earnings Per Share $0.00 $0.02 $0.04 $0.06 $0.08 $0.10 $0.12 $0.14 $0.16 $0.18 $0.20 2005 2006 2007 2008 2009 |
|
|
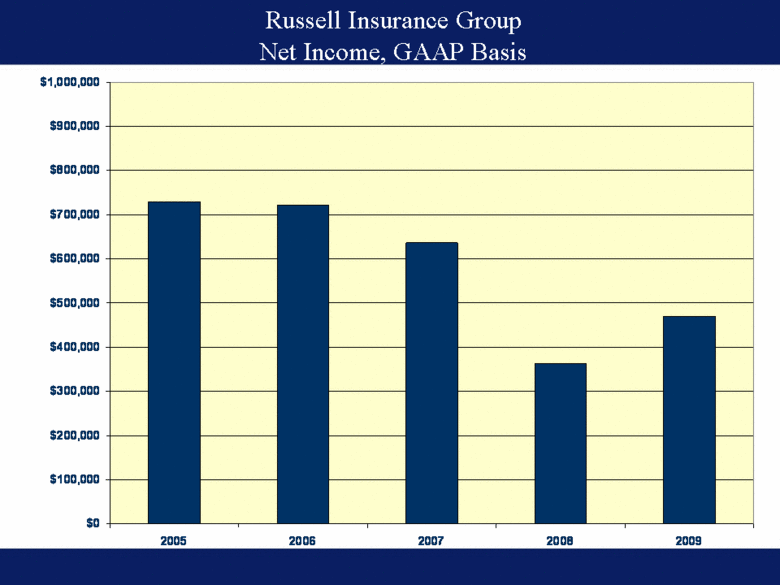
Russell Insurance Group Net Income, GAAP Basis $0 $100,000 $200,000 $300,000 $400,000 $500,000 $600,000 $700,000 $800,000 $900,000 $1,000,000 2005 2006 2007 2008 2009 |
|
|
ADAMS COUNTY NATIONAL BANK Paul H. Ketterman, Jr. SVP & Senior Trust Officer |
|
|
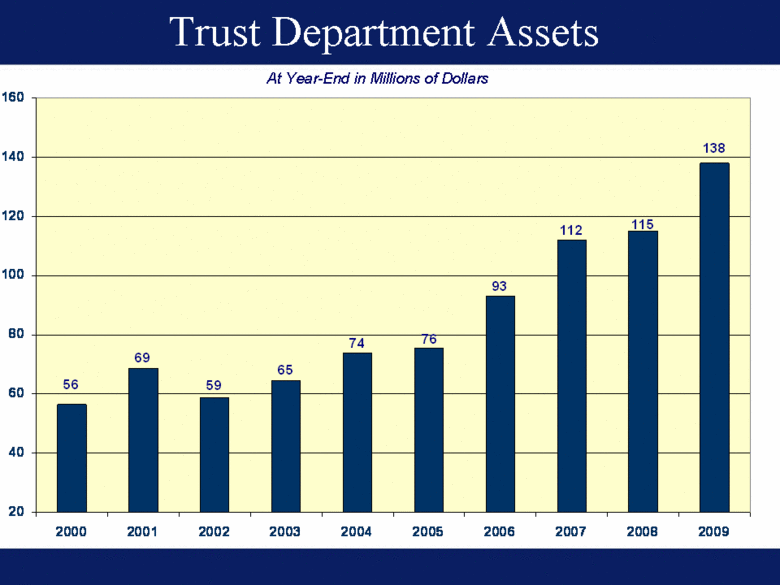
Trust Department Assets At Year-End in Millions of Dollars 138 93 74 76 65 59 69 56 115 112 20 40 60 80 100 120 140 160 2000 2001 2002 2003 2004 2005 2006 2007 2008 2009 |
|
|
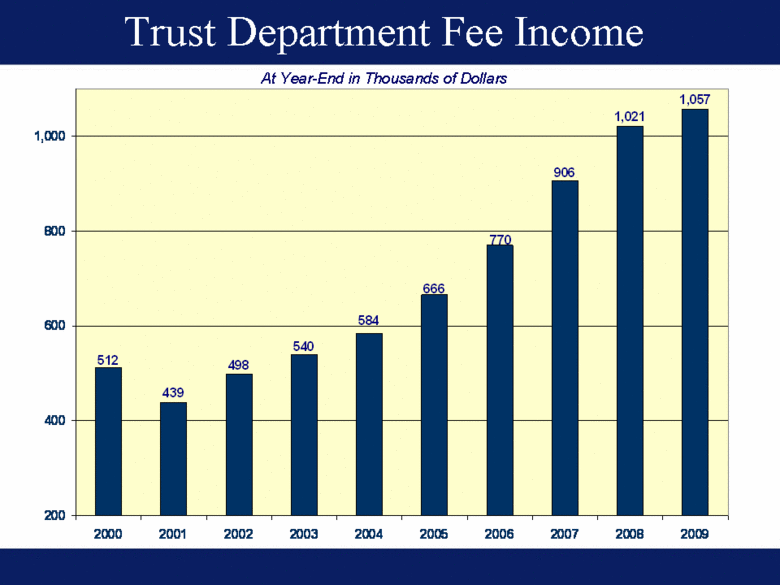
Trust Department Fee Income At Year-End in Thousands of Dollars 512 439 498 540 906 1,021 1,057 770 584 666 200 400 600 800 1,000 2000 2001 2002 2003 2004 2005 2006 2007 2008 2009 |
|
|
[LOGO] ACNB Corporation |

