Attached files
Table of Contents
UNITED STATES SECURITIES AND EXCHANGE COMMISSION
Washington, D.C. 20549
FORM 10-K
| (Mark One) | ||
| x |
ANNUAL REPORT PURSUANT TO SECTION 13 OR 15(d) OF THE SECURITIES EXCHANGE ACT OF 1934 | |
| For the fiscal year ended March 31, 2010 | ||
| OR | ||
| ¨ |
TRANSITION REPORT PURSUANT TO SECTION 13 OR 15(d) OF THE SECURITIES EXCHANGE ACT OF 1934 | |
| For the transition period from to | ||
Commission file number 001-16393
BMC Software, Inc.
(Exact name of registrant as specified in its charter)
| Delaware | 74-2126120 | |
| (State or other jurisdiction of incorporation or organization) |
(I.R.S. Employer Identification No.) | |
| 2101 CityWest Boulevard Houston, Texas |
77042-2827 (Zip Code) | |
| (Address of principal executive offices) | ||
Registrant’s telephone number, including area code (713) 918-8800
Securities registered pursuant to Section 12(b) of the Act:
| Title of each class |
Name of each exchange on which registered | |
| Common Stock, par value $.01 per share |
The NASDAQ Stock Market LLC |
Securities registered pursuant to section 12(g) of the Act: None
Indicate by check mark if the registrant is a well-known seasoned issuer, as defined in Rule 405 of the Securities Act.
Yes x No ¨
Indicate by check mark if the registrant is not required to file reports pursuant to Section 13 or Section 15(d) of the Act.
Yes ¨ No x
Indicate by check mark whether the registrant: (1) has filed all reports required to be filed by Section 13 or 15(d) of the Securities Exchange Act of 1934 during the preceding 12 months (or for such shorter period that the registrant was required to file such reports), and (2) has been subject to such filing requirements for the past 90 days.
Yes x No ¨
Indicate by check mark whether the registrant has submitted electronically and posted on its corporate Web site, if any, every Interactive Data File required to be submitted and posted pursuant to Rule 405 of Regulation S-T (§232.405 of this chapter) during the preceding 12 months (or for such shorter period that the registrant was required to submit and post such files).
Yes x No ¨
Indicate by check mark if disclosure of delinquent filers pursuant to Item 405 of Regulation S-K (§229.405 of this chapter) is not contained herein, and will not be contained, to the best of registrant’s knowledge, in definitive proxy or information statements incorporated by reference in Part III of this Form 10-K or any amendment to this Form 10-K. ¨
Indicate by check mark whether the registrant is a large accelerated filer, an accelerated filer, a non-accelerated filer, or a smaller reporting company. See the definitions of “large accelerated filer,” “accelerated filer” and “smaller reporting company” in Rule 12b-2 of the Exchange Act.
| Large accelerated filer x |
Accelerated filer ¨ | |
|
Non-accelerated filer ¨ (Do not check if a smaller reporting company) |
Smaller reporting company ¨ |
Indicate by check mark whether the registrant is a shell company (as defined in Rule 12b-2 of the Act).
Yes ¨ No x
The aggregate market value of voting and non-voting common equity held by non-affiliates of the registrant was approximately $6,865,673,000 at September 30, 2009 based upon the closing sale price of the Common Stock on the New York Stock Exchange reported on such date.
As of May 3, 2010, there were outstanding 181,523,000 shares of Common Stock, par value $.01, of the registrant.
DOCUMENTS INCORPORATED BY REFERENCE:
Portions of the registrant’s Proxy Statement relating to its 2010 Annual Stockholders Meeting, to be filed subsequently are incorporated by reference into Part III.
Table of Contents
This Annual Report on Form 10-K (Report) contains certain forward-looking statements within the meaning of Section 27A of the Securities Act of 1933, as amended, and Section 21E of the Securities Exchange Act of 1934, as amended, which are identified by the use of the words “believe,” “expect,” “anticipate,” “estimate,” “will,” “contemplate,” “would” and similar expressions that contemplate future events. Such forward-looking statements are based on management’s reasonable current assumptions and expectations. Numerous important factors, risks and uncertainties affect our operating results, including, without limitation, those contained in this Report, and could cause our actual results, levels of activity, performance or achievement to differ materially from the results expressed or implied by these or any other forward-looking statements made by us or on our behalf. There can be no assurance that future results will meet expectations. You should pay particular attention to the important risk factors and cautionary statements described in the section of this Report entitled Risk Factors. You should also carefully review the cautionary statements described in the other documents we file from time to time with the Securities and Exchange Commission (SEC), specifically our Quarterly Reports on Form 10-Q and our Current Reports on Form 8-K. We undertake no obligation to update any forward-looking statements. Information contained on our website is not part of this Report.
BMC, BMC Software and the BMC Software logo are the exclusive properties of BMC Software, Inc., are registered with the U.S. Patent and Trademark Office, and may be registered or pending registration in other countries. All other BMC trademarks, service marks, and logos may be registered or pending registration in the U.S. or in other countries. All other trademarks or registered trademarks are the property of their respective owners.
ITIL® is a registered trademark, and a registered community trademark of the Office of Government Commerce (OGC), and is registered in the U.S. Patent and Trademark Office, and is used here by BMC Software, Inc., under license from and with the permission of OGC.
IT Infrastructure Library® is a registered trademark of the Office of Government Commerce and is used here by BMC Software, Inc., under license from and with the permission of OGC.
DB2, IMS and IBM are trademarks or registered trademarks of International Business Machines Corporation in the United States, other countries, or both. Java is the trademark or registered trademark of Sun Microsystems, Inc. in the U.S. and other countries.
2
Table of Contents
PART I
Overview
BMC Software is one of the world’s largest software vendors. We provide systems management, service management and automation solutions primarily for large enterprises. Our extensive portfolio of software solutions spans mainframe, distributed and virtualized systems, applications, databases and IT process management functions. We also provide our customers with maintenance and support for our products and perform services for software implementation, integration, IT process design and re-engineering and education. We were organized as a Texas corporation in 1980 and were reincorporated in Delaware in July 1988. Our principal corporate offices are located at 2101 CityWest Boulevard, Houston, Texas 77042-2827. Our main telephone number is (713) 918-8800, and our primary internet address is http://www.bmc.com. Our internet website and the information contained therein or connected thereto are not intended to be incorporated into this Annual Report on Form 10-K.
We file annual, quarterly and current reports, proxy statements and other information with the SEC. These filings and all related amendments are available free of charge at http://www.bmc.com/investors. We post all of our SEC documents to our website as soon as reasonably practicable after such material is electronically filed with, or furnished to, the SEC. Our corporate governance guidelines and the charters of the Board of Directors committees are also available at http://www.bmc.com, as is our Professional Conduct Policy and Code of Ethics, as amended from time to time. Printed copies of each of these documents are available to stockholders upon request by contacting our investor relations department at (800) 841-2031 ext. 4525 or via email at investor@bmc.com.
Strategy
Our strategy is to be the leader in providing enterprise-class software solutions and services that improve IT efficiency and value. We believe “Business runs on IT” and that by helping our customers run their IT organizations smarter, faster and stronger, their businesses can thrive. With our solutions and services, which help businesses deal with multiple key internal initiatives including virtualization and cloud computing, IT service management, IT Infrastructure Library® (ITIL®) adoption, data center consolidation, IT governance, risk and compliance, mainframe cost optimization and proactive operations, our customers are able to reduce the cost of managing IT, reduce risk and drive business profit.
Responding to the needs of IT executives to reduce costs, increase business competitive advantage, improve service quality, manage risk and provide greater transparency, we provide solutions that enable Business Service Management (BSM), which we define as a unified platform for simplifying and automating the management of IT. Our BSM approach resonates powerfully with customers and results in substantial savings and value created through improved IT operational efficiency and the ability to rapidly address changing business needs. We have developed our BSM platform so that it can be adopted both universally and incrementally. To accomplish this, we provide integrated products and solution areas that are proven disciplines for BSM implementation (see the “Solutions and Products” section below). Our current BSM offering represents a substantial expansion from our initial delivery of BSM solutions. This has been accomplished through internal development, strategic acquisitions and by partnering with leading technology providers. We are committed to further enhancing our BSM platform in order to help our customers better manage their diverse infrastructure and automate IT management processes in today’s hybrid IT environment – across mainframe, distributed, virtual and cloud computing resources. We are also committed to providing customer choice by delivering our products and solutions through a combination of on-premise delivery, managed services providers and software-as-a-service.
Helping to enable our unified platform for BSM, we provide a family of shared foundational technologies called BMC Atrium that unifies data and processes from disparate management tools and also discovers, models, visualizes and assigns priorities to business services so that IT can have a common view of how IT resources and functions support business priorities. One of the key components of BMC Atrium is the BMC Atrium
3
Table of Contents
Configuration Management Database (CMDB). The BMC Atrium CMDB is an open-architected, federated, intelligent data repository that simplifies the management of IT configurations and delivers accurate visibility into the dependencies between business services, users and IT infrastructure across both mainframe and distributed environments. Along with other components of BMC Atrium, the BMC Atrium CMDB enables a Configuration Management System that ensures a consistent approach to managing IT processes, such as incident, problem, change, configuration, asset and event management.
To help clients, we offer education and consulting services that include both industry best practices and our own best practices and deliver them through a comprehensive methodology that is focused on customer value realization. Our BSM solutions are designed to support repeatable best practices, including those found in ITIL®, the most widely adopted IT-related best practices framework. We have also broadly trained our customer-facing organizations on ITIL® best practices and provide ITIL® education and certification to customers and partners through our professional services organization.
As part of our BSM strategy, we also differentiate our approach by supporting mainframe environments. A substantial portion of the world’s most valuable computer data resides on mainframes. Our ability to integrate the mainframe into BSM offers financial services, telecommunications, transportation and other industries significant benefits. Mainframes remain important to our larger enterprise customers as they continue to be one of the most cost effective and scalable platforms for IT service delivery.
Our forward-looking vision calls for the evolution of our products and solutions to provide Dynamic BSM, which we characterize as the on-demand provisioning and management of services using new computing platforms found in today’s hybrid data center. With Dynamic BSM, our customers will be able to dynamically align the IT supply chain with business demand in real time and optimize resources through tiered classes of services and policy-based automation. In addition to our own efforts, we are also working closely with other leading technology providers in the hardware, networking, managed services and software-as-a-service markets to deliver on this vision.
Solutions and Products
We are organized into two software business segments: Enterprise Service Management (ESM) and Mainframe Service Management (MSM). This structure provides the focus required to align our resources and product development efforts to meet the demands of the dynamic markets we serve. Our management reviews the results of our business using these segments. For financial information related to these two segments, see Note 13 to the accompanying consolidated financial statements.
Our ESM segment consists of our solutions and related professional services in the following IT management areas:
| • | Service Assurance — Our service assurance offerings manage IT functions and processes such as event management, service impact management and capacity management and provide proactive analytics to help IT identify issues before end users are affected by performance problems. Our solutions prioritize IT events based on business impact and help determine the right corrective actions to quickly restore services to the business. We were one of the first IT management leaders to bring business relevance to IT component events in this important market segment for our business. |
| • | Service Automation — Our service automation offerings manage IT functions and processes such as server and application provisioning, the management of configuration settings and changes, as well as compliance with configuration policies. Our solutions in this area help IT manage increasing complexity to support rapidly changing business needs. This market segment continues to attract significant customer interest due to the pervasive need for organizations to automate manually-intensive and time-consuming processes in order to achieve greater operational efficiency. The application automation solutions from our December 2009 acquisition of Phurnace Software, Inc. (Phurnace Software) are included in this solution area. |
4
Table of Contents
| • | Service Support — Our service support offerings manage IT functions and processes such as the service desk, incident management, service request management, problem management, asset configuration management, service level management, change and release management and identity management. These solutions, built around the industry leading service desk, manage and improve customer service as perceived by business end users. They drive improvements in efficiency through application of best practices (such as ITIL® ) and drive down costs by helping end users solve their own problems, reduce the number of calls to the service desk and track the status of IT requests. We also offer solutions to manage various business functions in IT such as financial planning and budgeting, project and portfolio management, supplier management, service cost management and IT controls. |
| • | BMC Atrium — Our BMC Atrium offering provides a family of shared foundational technologies that unifies data and processes from disparate management tools and also discovers, models, visualizes and assigns priorities to business services. It includes our BMC Atrium CMDB, a widely implemented and industry-leading CMDB. Our BMC Atrium solution also includes asset and application dependency discovery and mapping, process and task workflow orchestration, service level management and dashboard and analytic reporting solutions. The discovery solutions from our October 2009 acquisition of Tideway Systems Limited (Tideway Systems) are included in this solution area. |
Our professional services organization consists of a worldwide team of experienced software consultants who provide implementation, integration, IT process design and re-engineering and education services related to our products and the IT functions and processes they help to manage. By easing the implementation of our products, these services help our customers realize value more quickly. By improving the overall customer experience, we believe that these services also drive future software license transactions with customers.
Our MSM segment addresses IT requirements for mainframe data and performance management, middleware management, job scheduling and enterprise workload automation. These solutions, tightly integrated with the BMC Atrium CMDB, help our customers consistently meet service objectives while lowering the cost of mainframe management and scheduling operations by: (i) increasing the availability of their critical business applications; (ii) reducing their hardware resource requirements; (iii) managing ever increasing data, transaction and task volumes with the same or reduced staff; and (iv) mitigating the risk and cost associated with regulatory compliance issues facing mainframe and job scheduling organizations. Our MSM solutions are organized into two areas:
| • | Data and Performance Management — Our mainframe data and performance management solutions ensure the availability and reliability of the business critical data, applications and systems that support the bottom line for many of the largest companies worldwide. These solutions help customers optimize the performance, facilitate the administration and enhance the recoverability of the corporate data housed in IBM’s DB2® and IMS™ databases. Our MainView product line delivers business-centric systems management, intelligent optimization and capacity management for an extensive array of mainframe infrastructure components. Our MainView AutoOperator products enable automation of comprehensive monitoring, problem diagnosis and resolution through real-time execution of pre-defined tasks. The MainView architecture facilitates seamless integration of the entire product line for faster problem resolution; and tight integration with BMC Atrium ensures the mainframe is managed in accordance with business service priorities. Our August 2009 acquisition of MQSoftware, Inc. (MQSoftware) expanded our MSM portfolio to include solutions for transaction management and the management of the important application middleware layer, which is pervasive in today’s enterprise IT environments. |
| • | Enterprise Scheduling and Output Management — Our Control-M product line provides a comprehensive set of features which enable data centers to automate their increasingly complex workloads and critical business processes. Our Control-M product line orchestrates and optimizes dispersed and disparate management processes across multiple locations and platforms and provides the facilities to centrally monitor and manage workload elements required to support the batch portion of the organization’s business services. Our Control-D product line automates the difficult task of managing the life cycle of mainframe output reports with facilities which include report decollation, distribution, bundling, viewing, archival and deletion. |
5
Table of Contents
Sales and Marketing
We market and sell our products in most major world markets directly through our sales force and indirectly through channel partners including resellers, distributors and systems integrators. Our sales force includes an inside sales division which provides a channel for additional sales to existing customers and the expansion of our customer base.
International Operations
We are a global company that conducts sales, sales support, professional services, product development and support, marketing and product distribution services from numerous international offices. In addition to our sales offices located in major economic centers around the world, we also conduct development activities in the United States, India and Israel, as well as in small offices in other locations. Product manufacturing and distribution are based in Houston, Texas, with European manufacturing and distribution based in Dublin, Ireland. We plan to continue to look for opportunities to efficiently expand our operations in international locations that offer highly talented resources as a way to maximize our global competitiveness.
Software Licenses
We license our software under both perpetual and term license models for customer on-premise use. Under perpetual license arrangements, our customers receive the perpetual license right to use our software, and related maintenance and support services are generally purchased on an annual basis. Under term license arrangements, our customers receive license rights to use our software along with bundled maintenance and support services for the term of the contract. The majority of our contracts provide customers with the right to use one or more of our products up to a specific license capacity. Capacity can be measured in many ways, including mainframe computing capacity, number of servers, number of users or number of gigabytes, among others. Certain of our enterprise license agreements stipulate that customers can exceed pre-determined base capacity levels, in which case additional fees are specified in the license agreement. Such fees are typically paid on an annual basis in the form of an incremental “true-up” payment. In the absence of such an arrangement, customers are not entitled to use the products on additional capacity in excess of the original license rights.
For qualifying transactions we offer extended payment terms for our solutions under a financing program. We believe that by offering such financing we allow our customers to better manage their IT expenditures and cash flows. Our financing program is discussed in further detail below under Management’s Discussion and Analysis of Financial Condition and Results of Operations — Liquidity and Capital Resources.
Our license revenue comprised 39.7%, 37.9% and 37.4% of our total revenue in fiscal 2010, 2009 and 2008, respectively. For a discussion of our revenue recognition policies and the impact of our licensing models on revenue, see Management’s Discussion and Analysis of Financial Condition and Results of Operations — Critical Accounting Policies and Estimates — Revenue Recognition and Note 1 to the accompanying consolidated financial statements.
Software-as-a-Service
During the latter part of fiscal 2010, we announced multiple new on-demand software-as-a-service (SaaS) offerings within our ESM segment. These offerings provide management solutions through a hosted service rather than a traditional on-premise license model and allow our customers to obtain the benefits of these solutions with reduced infrastructure and setup requirements, leading to faster deployment. These offerings will be sold as either annual or multi-year subscriptions with pricing generally based on the number of users. We also offer customer on-boarding and other related services for these offerings. Our first SaaS customer agreements were executed at the end of our fourth fiscal quarter and did not contribute any revenue to our fiscal 2010 results.
6
Table of Contents
Maintenance and Support Services
Maintenance and support enrollment entitles software license customers to technical support services, including telephone and internet support and problem resolution services, and the right to receive unspecified product upgrades, maintenance releases and patches released during the term of the support period on a when-and-if-available basis. Maintenance and support service fees are an important source of recurring revenue, and we invest significant resources to provide maintenance and support services. Revenue from maintenance and support services comprised 53.6%, 54.4% and 55.9% of our total revenue in fiscal 2010, 2009 and 2008, respectively.
Professional Services
Our professional services group consists of a worldwide team of experienced software consultants who provide implementation, integration and education services related to our products. By easing the implementation of our products, these services help our customers accelerate the time to value. By improving the overall customer experience, we believe that these services also drive future software license transactions with customers. Revenue from professional services comprised 6.8%, 7.7% and 6.7% of our total revenue in fiscal 2010, 2009 and 2008, respectively.
Research and Development
We conduct research and development activities in various locations throughout the world. During fiscal 2010, 2009 and 2008, we incurred research and development expenses of $195.6 million, $222.0 million and $209.4 million, respectively. These costs relate primarily to personnel and related costs incurred to conduct product development activities. Although we develop many of our products internally, we may acquire technology through business combinations or through licensing from third parties when appropriate. Our expenditures on research and development activities during the last three fiscal years are further discussed below under Management’s Discussion and Analysis of Financial Condition and Results of Operations — Research and Development Expenses.
Seasonality
We tend to experience a higher volume of transactions and associated revenue in the quarter ended December 31, which is our third fiscal quarter, and the quarter ended March 31, which is our fourth fiscal quarter, as a result of our customers’ spending patterns and our annual sales quota incentives. As a result of this seasonality for license transactions and timing of related payments, we tend to have greater operating cash flow in our fourth quarter.
Competition
The enterprise management software business is highly competitive. Both our ESM and MSM businesses compete against a number of competitors, including large vendors who compete with us at a strategic solution level and across multiple product lines as well as smaller, niche competitors who compete against individual products of ours. Our largest competitors are International Business Machines Corporation (IBM), CA, Inc. (CA) and Hewlett-Packard Company (HP). Although we believe we are uniquely positioned to offer BSM solutions to customers, several of our major competitors also market BSM-like solutions and we anticipate continued competition in the BSM marketplace. There are currently between 50 and 100 companies we consider to be directly competitive with one or more of our enterprise software solutions. Some of these companies have substantially larger operations than ours in the specific markets in which we compete. In addition, the software industry is experiencing continued consolidation.
Customers
Our solutions are used by some of the largest, most demanding IT organizations in the world including over 16,000 companies and 90% of the Fortune 100. Our software products are generally used in a broad range of industries, businesses and applications. Our customers include manufacturers, telecommunication companies,
7
Table of Contents
financial service providers, educational institutions, retailers, distributors, hospitals, service providers, government agencies and channel partners including resellers, distributors and system integrators. Our ten largest customers comprised less than 15% of our total revenue in each of fiscal 2010, 2009 and 2008. No single customer accounted for a material portion of our revenue during any of the past three fiscal years.
Intellectual Property
We primarily distribute our products in object code form and rely upon contract, trade secret, copyright and patent laws to protect our intellectual property. The license agreements under which customers use our products restrict the customer’s use to its own operations and prohibit disclosure to third parties. We distribute certain of our products on a shrink-wrap basis and the enforceability of such restrictions in a shrink-wrap license is unproven in certain jurisdictions. Also, notwithstanding these restrictions, it is possible for other persons to obtain copies of our products in object code form. We expect that obtaining such copies would have limited value without access to the product’s source code, which we keep highly confidential. In addition, we employ protective measures such as CPU dependent passwords, expiring passwords and time-based software trials.
Employees
At March 31, 2010, we had approximately 6,100 full-time employees. We expect that our continued success will depend in part on our ability to attract and retain highly skilled technical, sales, marketing and management personnel.
We operate in a dynamic environment that involves numerous risks and uncertainties. The following section describes some of the risks that may adversely affect our business, financial condition, operating results and cash flows; these are not necessarily listed in terms of their importance or level of risk.
Weakened economic conditions and uncertainty could adversely affect our operating results.
Our overall performance depends in part on worldwide economic conditions. The United States and other key international economies have experienced a prolonged downturn as a result of a multitude of factors, including, but not limited to, turmoil in the credit and financial markets, concerns regarding the stability and viability of major financial institutions, declines in gross domestic product, increases in unemployment and volatility in commodity prices and worldwide stock markets. The severity or length of time these economic and financial market conditions may persist is unknown. During challenging and uncertain economic times and in tight credit markets, many customers may delay or reduce technology purchases. Contract negotiations may become more protracted or difficult if customers institute additional internal approvals for software purchases or require more negotiation of contract terms and conditions. These economic conditions could result in reductions in sales of our products, longer sales cycles, difficulties in collection of accounts receivable or delayed payments, slower adoption of new technologies and increased price competition. In addition, continued deterioration of the global credit markets could adversely impact our ability to complete sales of our solutions and services, including maintenance and support renewals, or the value of our financial assets. Any of these events would likely harm our business, financial condition, operating results and cash flows.
We may announce lower than expected revenue, bookings, earnings or operating cash flows.
Our ability to accurately and consistently predict revenue, bookings, earnings and operating cash flows within narrow ranges is weakened by two principal factors:
| • | first, a significant portion of our transactions close during the final days of each quarter; this pattern is evident in all product lines and among all sales channels; and |
8
Table of Contents
| • | second, even after contracts have been executed, extensive analysis is required before the timing of revenue recognition can be reliably determined; this timing reflects both the complexity of the revenue recognition rules applicable to software and the effect that the various license types and other terms and conditions can have when these rules are applied. |
Numerous other factors, some listed below, also have potential to adversely affect our financial results:
| • | the possibility that our customers may defer or limit purchases as a result of reduced information technology budgets or reduced data processing capacity demand; |
| • | customers may require additional levels of internal approval prior to finalizing software purchases or renewals, which could lengthen the sales cycle and delay bookings and the resultant cash flows; |
| • | we may be required to defer more license revenue than we anticipate if our mix of complex transactions or contracts with terms and conditions requiring deferral of license revenue is greater than we plan for; |
| • | our inability to adapt our solutions to customers’ needs in a market space defined by constant technological change; |
| • | our inability to satisfy increased customer demands for our technical support services may adversely affect our relationship with our customers; |
| • | uncertain timing of orders and delivery of products to our customers and channel partners; |
| • | potential losses on investments, foreign exchange exposures or contracts, or other losses from financial instruments we may hold that are exposed to market losses; |
| • | unexpected changes or significant fluctuations in foreign currency exchange rates; |
| • | higher than expected operating expenses; |
| • | an unexpected increase in weighted average shares outstanding due to much higher than expected exercises of stock options or a sudden and significant increase in our stock price causing our fully diluted weighted average shares outstanding to increase, either of which could cause reported earnings per share to decline; |
| • | unintended consequences of our use of open source software could unintentionally limit the use of our intellectual property and require us to comply with open source licensing requirements; |
| • | we may be affected by the timing of large, multi-product transactions or become dependent upon such transactions; |
| • | changes in our pricing and distribution terms and/or those of our competitors; and |
| • | the possibility that our business will be adversely affected as a result of the threat of significant external events that increase global economic uncertainty. |
Investors should not rely on the results of prior periods as an indication of our future performance. Our operating expense levels are based, in significant part, on our expectations of future revenue. If we have a shortfall in revenue in any given quarter, we will not be able to proportionally reduce our operating expenses for that quarter in response to such a shortfall. Therefore, any significant shortfall in revenue will likely have an immediate adverse effect on our operating results for that quarter and could cause our stock price to decline. In addition, our ability to maintain or expand our operating margins may be limited given economic and competitive conditions, and we therefore could be reliant upon our ability to continually identify and implement operational improvements in order to maintain or reduce expense levels. There can be no assurance that we will be able to maintain or expand our current operating margins in the future.
We may have difficulty achieving our cash flow from operations goals.
Our quarterly cash flow from operations is and has been volatile. If our cash generated from operations in some future period is materially less than the market expects, our stock price could decline. Factors that could adversely affect our cash flow from operations in the future include: lengthening sales cycles; a reduction in the
9
Table of Contents
size of transactions; the timing of transaction completion, billings and associated cash collections within a particular period; longer customer payment terms; an increase in late payments by customers; an increase in uncollectible accounts receivable; increased expenses; reduced net earnings; a significant shift from multi-year committed contracts to short-term contracts; a reduced ability to transfer finance receivables to third parties; an increase in contracts where internal costs such as sales commissions are paid upfront but payments from customers are collected over time; reduced renewal rates for maintenance; an increase in cash taxes; payments for legal actions, costs, fees or settlements; restructuring payments; the impact of changing foreign exchange rates; and reduced yields on investments and cash and cash equivalents.
Maintenance revenue could decline.
Maintenance revenue has increased in each of the last three fiscal years as a result of acquisitions and the continuing growth in the base of installed products and the processing capacity on which they run. Maintenance fees generally increase as the licensed capacity increases; consequently, we generally receive higher absolute maintenance fees with new license and maintenance agreements and as existing customers license our products for additional processing capacity. Price competition on enterprise transactions can lead to increased discounting for higher levels of supplemental processing capacity; the maintenance fees on a per unit of capacity basis are typically reduced in enterprise license agreements. In addition, customers are generally entitled to reduced annual maintenance fees for entering into long-term maintenance contracts. Declines in our license bookings, increases in the proportion of long-term maintenance contracts and/or increased discounting could lead to declines in our maintenance revenue growth rates. Should customers migrate from systems and applications which our products support or find alternatives to our products, increased cancellations could lead to declines in our maintenance revenue. As maintenance revenue makes up a substantial portion of our total revenue, any decline in our maintenance revenue could have a material adverse effect on our business, financial condition, operating results and cash flows.
Competition from large, powerful multi-line and small, agile single-line competitors could have a negative impact on our business and financial results.
Some of our largest competitors, including IBM, CA and HP, have significant scale advantages. With scale comes a large installed base of customers in particular market niches, as well as the ability to develop and market software competitive with ours. Some of these competitors can also bundle hardware, software and services together, which is a disadvantage for us since we do not provide hardware and have fewer services offerings. Competitive products are also offered by numerous independent software companies that specialize in specific aspects of the highly fragmented software industry. Some, like Microsoft Corporation (Microsoft), Oracle Corporation (Oracle), and SAP AG (SAP) are the leading developers and vendors in their specialized markets. In addition, new companies enter the market on a frequent and regular basis, offering products that compete with some individual products offered by us. Market entrants utilizing alternative business models such as software-as-a-service, cloud computing or open source software also compete against us. Other data center vendors may expand into systems management to complement their existing offerings. Additionally, many customers historically have developed their own products that compete with those offered by us. Competition from any of these sources can result in price reductions or displacement of our products, which could have a material adverse effect on our business, financial condition, operating results and cash flows.
Industry consolidation could affect prices or demand for our products.
The IT industry and the market for our systems management products are very competitive due to a variety of factors. As the enterprise systems software market matures, it is consolidating. This trend could create opportunities for larger companies, such as IBM, HP, Microsoft, Oracle and other large enterprise software and hardware companies, to increase their market share through the acquisition of companies that dominate certain lucrative market niches or that have loyal installed customer bases. In doing so, these competitors may be able to reduce prices on software that competes with our solutions, in part by leveraging their larger economies of scale. We expect this trend towards consolidation to continue as companies attempt to maintain or extend their market and competitive positions in the rapidly changing software industry and as companies are acquired or are unable
10
Table of Contents
to continue operations. This industry consolidation may result in stronger competitors that are better able to compete as sole-source vendors for customers. This could lead to more variability in our operating results due to lengthening of the customer evaluation process, increased pricing pressure and/or loss of business to these larger competitors, which may materially and adversely affect our business, financial condition, operating results and cash flows.
Our products must remain compatible with ever-changing operating and database environments.
IBM, HP, Microsoft and Oracle are by far the largest suppliers of systems and database software and, in some cases, are the manufacturers of the computer hardware systems used by most of our customers. Historically, operating and database system developers have modified or introduced new operating systems, database systems, systems software and computer hardware. Such new products could incorporate features which perform functions currently performed by our products or could require substantial modification of our products to maintain compatibility with these companies’ hardware or software. There can be no assurance that we will be able to adapt our products and our business to changes introduced by hardware manufacturers and operating and database system software developers. Operating and database system software developers have in the past provided us with early access to versions of their software, before making such software generally available, to have input into the functionality and to ensure that we can adapt our software to exploit new functionality in these systems. Some companies, however, may adopt more restrictive policies in the future or impose unfavorable terms and conditions for such access. These restrictions may result in higher research and development costs for us in connection with the enhancement and modification of our existing products and the development of new products. Failure to adapt our products in a timely manner to changes in operating and database systems or customer decisions to forego the use of our products in favor of those with comparable functionality contained either in the hardware or operating system could have a material adverse effect on our business, financial condition, operating results and cash flows.
Future product development is dependent upon access to and reliability of third party software products.
Certain of our software products contain components developed and maintained by third party software vendors. We expect that we may have to incorporate software from third party vendors in our future products. We may not be able to replace the functionality provided by the third party software currently offered with our products if that software becomes obsolete, defective or incompatible with future versions of our products or is not adequately maintained or updated, or if our relationship with the third party vendor terminates. Any significant interruption in the availability of these third party software products on commercially acceptable terms or defects in these products could delay development of future products or enhancement of future products and could have a material adverse effect on our business, financial condition, operating results and cash flows.
Future product development is dependent on adequate research and development resources.
In order to remain competitive, we must continue to develop new products and enhancements to our existing products. This is particularly true as we further expand our BSM capabilities. Maintaining adequate research and development resources, such as the appropriate talent and development technology, to meet the demands of the market is essential. Failure to do so could present an advantage to our competitors. Further, if we are unable to develop products internally due to certain constraints, such as high employee turnover, lack of management ability, or a lack of other development resources, it may force us to expand into a certain market or strategy via an acquisition for which we could potentially pay too much or unsuccessfully integrate into our operations.
Growing market acceptance of “open source” software could cause a decline in our revenue and operating margins.
Growing market acceptance of open source software has presented both benefits and challenges to the commercial software industry in recent years. “Open source” software is made widely available by its authors and is licensed “as is” for a nominal fee or, in some cases, at no charge. As the use of open source software
11
Table of Contents
becomes more widespread, certain open source technology could become competitive with our proprietary technology, which could cause sales of our products to decline or force us to reduce the fees we charge for our products, which could have a material adverse impact on our revenue and operating margins.
Discovery of errors in our software could adversely affect our earnings.
The software products we offer are inherently complex. Despite testing and quality control, we cannot be certain that errors will not be found in current versions, new versions or enhancements of our products after commencement of commercial delivery. If new or existing customers have difficulty deploying our products or require significant amounts of customer support, our operating margins could be harmed. Moreover, we could face possible claims and higher development costs if our software contains undetected errors or if we fail to meet our customers’ expectations. With our BSM strategy, these risks increase because we are combining already complex products to create solutions that are even more complicated than the aggregation of their product components. Significant technical challenges could also arise with our products because our customers purchase and deploy our products across a variety of computer platforms and integrate them with a number of third party software applications and databases. These combinations increase our risk further because in the event of a system-wide failure, it may be difficult to determine which product is at fault; thus, we may be harmed by the failure of another supplier’s products. As a result of the foregoing, we could experience:
| • | loss of or delay in revenue and loss of market share; |
| • | loss of customers; |
| • | damage to our reputation; |
| • | failure to achieve market acceptance; |
| • | diversion of development resources; |
| • | increased service and warranty costs; |
| • | legal actions by customers against us which could, whether or not successful, increase costs and distract our management; and |
| • | increased insurance costs. |
We are subject to risks associated with our third-party distribution channels.
A portion of our revenue is derived from the sale of our products and services through distribution channels such as resellers and system integrators. In addition, we maintain strategic agreements with hardware vendors permitting them to sell our software solutions as part of their hardware systems. Conducting business through indirect distribution channels presents a number of risks, including:
| • | our indirect channel partners typically can cease marketing our products and services with limited or no notice and with little or no penalty; |
| • | we may not be able to replace existing or recruit additional indirect channel partners if we lose any of our existing ones; |
| • | our existing indirect channel partners may not be able to effectively sell new products and services that we may introduce; |
| • | we do not have direct control over the business practices, compliance programs and processes or risk management policies adopted by our indirect channel partners and they may engage in inappropriate practices without our knowledge; |
| • | our indirect channel partners may also offer competitive products and services and as such, may not give priority to the marketing of our products and services as compared to our competitors’ products; |
12
Table of Contents
| • | we may face conflicts between the activities of our indirect channels and our direct sales and marketing activities; |
| • | our indirect channel partners may experience financial difficulties that may impact their ability to market our products and may lead to delays, or even default, in their payment obligations to us; and |
| • | we also depend on our indirect channel partners for accurate and timely reporting of our channel sales; any disruption, delay or under-reporting by our indirect channel partners could have an adverse effect on our bookings, revenues and cash flows. |
Changes to our sales organization can be disruptive and may negatively impact our results of operations.
From time to time, we make significant changes in the organizational structure and compensation plans of our sales organizations. To the extent that we experience turnover within our direct sales force or sales management, there is a risk that the productivity of our sales force would be negatively impacted which could lead to revenue declines. Turnover within our sales force can require significant severance expense and cause disruption in sales cycles leading to delay or loss of business. In addition, it can take time to implement new sales management plans and to effectively recruit and train new sales representatives. We review and modify our compensation plans for the sales organization periodically. As in most years, we have made changes for fiscal 2011 that are intended to align with our business objectives. Changes to our sales compensation plans could make it difficult for us to attract and retain top sales talent.
Risks related to business combinations.
As part of our overall strategy, we have acquired or invested in, and likely will continue to acquire or invest in, complementary companies, products and technologies. Risks commonly encountered in such transactions include:
| • | the inability to retain and integrate key technical, sales and managerial personnel; |
| • | the difficulty of assimilating the personnel, culture and operations of the combined companies, including back-office functions and systems, such as accounting, human resources and others, into our own back-office functions and systems; |
| • | the risk that we may not be able to integrate the acquired technologies or products with our current products and technologies; |
| • | the potential disruption of our ongoing business, including potential distraction of management from other objectives, opportunities and risks; |
| • | the inability of management to maximize our financial and strategic position through the successful integration of acquired businesses; |
| • | the potential that our policies, procedures and controls are not applied to the acquired entity in a timely manner following the acquisition; |
| • | the potential degradation of relationships with the acquired entity’s customers, partners or vendors, creating challenges for us to meet the objectives of the acquisition; |
| • | the potential failure of our pre-acquisition due diligence to identify technology issues, such as problems with software code, architecture or functionality, intellectual property ownership issues, employment or management issues, customer or partner issues, errors or irregularities in the accounting or financial reporting of the target, unknown liabilities of the target, legal contingencies or other issues; |
| • | the risk that revenue from acquired companies, products and technologies do not meet our expectations; |
13
Table of Contents
| • | the risk that our use of cash to pay for acquisitions may limit other potential uses of our cash, including stock repurchases; similarly, the risk that existing stockholders could be diluted and earnings per share may decrease if we were to issue a significant amount of equity securities as full or partial consideration in future acquisitions; and |
| • | the risk that our chosen strategy leading to the acquisition was not the appropriate strategy or that our resources would have been better utilized developing technology via internal product development. |
In order for us to maximize the return on our investments in acquired companies, the products of these entities must be integrated with our existing products and strategies. These integrations can be difficult and unpredictable, especially given the complexity of software and that acquired technology is typically developed independently and may not have been designed to integrate with our products. The difficulties are compounded when the products involved are well-established because compatibility with the existing base of installed products must be preserved. Successful integration also requires coordination of different development and engineering teams. This too can be difficult and unpredictable because of possible cultural conflicts and different opinions on technical decisions and product roadmaps. There can be no assurance that we will be successful in our product integration efforts or that we will realize the expected benefits.
Changes in tax law, changes in our effective tax rates or unanticipated exposure to additional income tax liabilities could affect our profitability and financial condition.
We carry out our business operations through entities in the United States and multiple foreign jurisdictions. As such, we are required to file corporate income tax returns that are subject to United States, state and foreign tax laws. The United States, state and foreign tax liabilities are determined, in part, by the amount of operating profit generated in these different taxing jurisdictions. Our effective tax rate, earnings and operating cash flows could be adversely affected by changes in the mix of operating profits generated in countries with higher statutory tax rates as well as by the positioning of our cash balances globally. Our effective tax rate is also impacted by the portion of our foreign earnings in jurisdictions having different corporate tax rates than the United States when we deem such earnings to be indefinitely reinvested in such jurisdictions. If we were to determine that these foreign earnings were not indefinitely reinvested, our effective tax rate and earnings could be adversely impacted. Similarly, if statutory tax rates or tax bases were to increase or if changes in tax laws, regulations or interpretations were made that impact us directly, our effective tax rate, earnings and operating cash flows could be adversely impacted. We are also required to evaluate the realizability of our deferred tax assets. This evaluation requires that our management assess the positive and negative evidence regarding sources of future taxable income. If management’s assessment regarding the realizability of our deferred tax assets changes, we will be required to increase our valuation allowance, which will negatively impact our effective tax rate and earnings. We are also subject to routine corporate income tax audits in multiple jurisdictions. Our provision for income taxes includes amounts intended to satisfy income tax assessments that may result from the examination of our corporate tax returns that have been filed in these jurisdictions. The amounts ultimately paid upon resolution of these examinations could be materially different from the amounts included in the provision for income taxes and result in additional tax expense and operating cash outflows.
Enforcement of our intellectual property rights.
We rely on a combination of copyrights, patents, trademarks, trade secrets, confidentiality procedures and contractual procedures to protect our intellectual property rights. Despite our efforts to protect our intellectual property rights, it may be possible for unauthorized third parties to misappropriate, copy or pirate certain portions of our products or to reverse engineer or obtain and use technology or other information that we regard as proprietary. There can also be no assurance that our intellectual property rights would survive a legal challenge as to their validity or provide significant protection for us, and any such legal actions could become costly. In addition, the laws or practices of certain countries do not protect our proprietary rights to the same extent as do the laws of the United States. Accordingly, there can be no assurance that we will be able to protect our proprietary technology against unauthorized third party copying or use, which could adversely affect our competitive position and revenue.
14
Table of Contents
Third parties may claim that our software products or services infringe on their intellectual property rights, exposing us to litigation that, regardless of merit, may be costly to defend.
Our success and ability to compete are also dependent upon our ability to operate without infringing upon the proprietary rights of others. Third parties may claim that our current or future products infringe upon their intellectual property rights. Any such claim, with or without merit, could have a significant effect on our business and financial results. Any future third party claim could be time consuming, divert management’s attention from our business operations and result in substantial litigation costs, including any monetary damages and customer indemnification obligations, which may result from such claims. In addition, parties making these claims may be able to obtain injunctive or other equitable relief affecting our ability to license the products that incorporate the challenged intellectual property. As a result of such claims, we may be required to obtain licenses from third parties, develop alternative technology or redesign our products. We cannot be sure that such licenses would be available on terms acceptable to us, if at all. If a successful claim is made against us and we are unable to develop or license alternative technology, our business, financial condition, operating results and cash flows could be materially adversely affected.
Risks related to global operations.
We derive a substantial portion of our revenues from, and have significant operations in, jurisdictions outside of the United States. Our international operations include software development, sales, customer support, professional services and shared administrative service centers.
We are subject to a variety of risks and challenges in managing an organization operating in various countries, including:
| • | difficulties in staffing and managing international operations, including compliance with local labor and employment laws; |
| • | possible non-compliance with our professional conduct policy and code of ethics; |
| • | longer payment cycles; |
| • | increased financial accounting and reporting burdens and complexities; |
| • | adverse tax consequences; |
| • | adverse impact of inflation; |
| • | changes in foreign currency exchange rates; |
| • | potential impact from volatile or sluggish local economies or global macroeconomic conditions; |
| • | loss of proprietary information, including intellectual property, due to piracy, misappropriation or weaker laws regarding intellectual property protection; |
| • | the need to localize our products; |
| • | lack of appropriate local infrastructure to carry out operations; |
| • | political unrest or terrorism, particularly in areas in which we have employees and facilities; |
| • | potential vulnerability to computer system, internet or other systemic attacks, such as denial of service, viruses or other malware which may be caused by criminals, terrorists or other sophisticated organizations; |
| • | compliance with a wide variety of complex laws, regulations and treaties including unexpected changes in (or new) legislative or regulatory requirements, early termination of contracts with government agencies, audits, investigations, sanctions or penalties; |
| • | licenses, tariffs and other trade barriers; and |
| • | natural disaster or disease. |
15
Table of Contents
U.S. and international laws and regulations that apply to our international operations are complex and increase our cost of doing business in foreign jurisdictions. U.S. laws and regulations applicable to our international operations include the Foreign Corrupt Practices Act and export control laws. International laws and regulations include local laws which also prohibit corrupt payments to governmental officials, data privacy requirements, labor relations laws, tax laws, anti-competition regulations, import and trade restrictions and export requirements. We have adopted and implemented policies and procedures designed to promote compliance with U.S. laws and the laws of the jurisdictions in which we operate. Violations of these laws and regulations could result in criminal or civil fines against us, our officers or our employees; restrictions on the conduct of our business; harm to our brand or reputation; and delays in potential acquisitions. Such violations could result in penalties and other restrictions that may, under certain circumstances, materially and adversely impact our operating results and financial condition.
The unique risks of operating in a particular country may require us to adopt a different business approach or strategy in that particular country which could increase our cost of doing business or limit the type of business activities we can perform in such country. In addition, if we suffer a business disruption due to any of the risks listed above and do not have in place or are not able to implement adequate response plans, our ability to support customers and maintain normal business operations for a significant length of time could be hindered such that our competitive position could be significantly impacted. Furthermore, our financial condition could be adversely impacted if our costs to recover escalate due to such recovery occurring over a protracted period.
We maintain a significant presence in India, Israel and other emerging market countries, conducting substantial software development and support, marketing operations, IT operations and certain financial operations. Accordingly, we are directly affected by economic, political, physical and electrical infrastructure and military conditions in these countries. Any major hostilities or the interruption or curtailment of trade between these countries and their present trading partners could materially adversely affect our business, financial condition, operating results and cash flows. We maintain contingency and business continuity plans for all significant locations, and to date, various regional conflicts or other local economic or political issues have not caused any major adverse impact on our operations in these countries. Should we be unable to conduct operations in these regions in the future, and our contingency and business continuity plans are unsuccessful, our business could be adversely affected. Furthermore, as the software and technology labor market in these countries has developed at a rapid pace, with many multi-national companies competing for talent, there is a risk that wage and attrition rates will rise faster than we have anticipated which could lead to operational issues.
We face exposure to foreign currency exchange rates.
We conduct significant transactions, including intercompany transactions, in currencies other than the United States dollar or the functional operating currency of the transactional entities, and our global subsidiaries maintain significant net assets that are denominated in currencies other than the functional operating currencies of these entities. Accordingly, changes in the value of major foreign currencies, particularly the Euro, British pound, Indian rupee, Israeli shekel and Brazilian real, relative to the United States dollar can significantly affect our revenues and operating results due to transactional and translational remeasurement that is reflected in our earnings. While we maintain a hedging program to hedge certain transactional exposures in foreign currencies in an attempt to mitigate foreign currency exchange rate risks, this program may not fully mitigate all such risk. We may also experience foreign currency exchange rate gains and losses where it is not cost effective to hedge foreign currencies in part or in full. Additionally, our efforts under this program may not be successful if we were to fail to properly detect or manage foreign currency exchange rate exposures, which could also adversely impact our operating results.
We may lose key personnel, may not be able to hire enough qualified personnel or may fail to integrate replacement personnel.
Much of our future success depends on the continued service and availability of skilled personnel, including sales, technical and marketing resources and the availability of skilled contract labor. Experienced personnel in the information technology industry are in high demand and competition for their talents is intense. Changing
16
Table of Contents
demographics and labor work force trends may result in a loss of knowledge and skills as experienced workers retire. Effective succession planning is also important to our long-term success. Failure to ensure effective transfer of knowledge and smooth transitions involving key employees could hinder our strategic planning and execution. In addition, acquisitions could cause us to lose key personnel of the acquired companies or our personnel. With rare exceptions, we do not have long-term employment agreements with our employees. Further, certain of our key personnel receive a total compensation package that includes equity awards. New regulations, volatility in the stock market and other factors could diminish our use, and/or the value, of our equity awards, putting us at a competitive disadvantage or forcing us to use more cash compensation.
In addition, we continually focus on improving our cost structure. We have been hiring personnel in countries where advanced technical expertise is available at lower costs and we frequently utilize contract labor for short-term needs. When we make adjustments to our workforce, we may incur expenses associated with workforce reductions that delay the benefit of a more efficient workforce structure. We may also experience increased competition for employees in these countries as the trend toward globalization continues which may affect our employee retention efforts, increase our dependence on contract labor and/or increase our expenses in an effort to offer a competitive compensation program for full-time employees.
We have also undertaken restructurings over the past several years to improve our cost structure involving significant reductions in our workforce, relocation of job functions to overseas locations and changes to our organizational structure. We will continue to make organizational changes aimed at improving our operating margins and driving operating efficiencies. Some of these changes may result in future workforce reductions or rebalancing actions. These efforts place a strain on our management, administrative, technical, operational and financial infrastructure.
If we fail to manage these changes effectively, it could adversely affect our ability to manage our business and our operating results.
There are risks associated with our outstanding indebtedness.
In June 2008, we issued $300.0 million of senior unsecured notes due 2018 (the Notes), and we may incur additional indebtedness in the future. Our ability to pay interest and repay the principal on our indebtedness is dependent upon our ability to manage our business operations and the other factors discussed in this section. There can be no assurance that we will be able to manage any of these risks successfully. In addition, changes by any rating agency to our outlook or credit rating could negatively affect the value and liquidity of both our debt and equity securities.
Our business and products are dependent on the use of IT systems.
Our IT systems and related software applications are integral to our business. Computer programmers and hackers may be able to penetrate our network security and misappropriate, copy or pirate our confidential information or that of third parties, create system disruptions or cause interruptions or shutdowns of our internal systems and services. Also, a number of web sites have been subject to denial of service attacks, where a web site is bombarded with information requests eventually causing the web site to overload, resulting in a delay or disruption of service. If successful, any of these events could damage our computer systems or those of our customers and could disrupt or prevent us from providing timely maintenance and support for our products. Computer programmers and hackers also may be able to develop and deploy viruses, worms and other malicious software programs that attack our products or otherwise exploit any security vulnerabilities of our products. The costs to us to eliminate or alleviate security problems, bugs, viruses, worms, malicious software programs and security vulnerabilities could be significant, and the efforts to address these problems could result in interruptions, delays, cessation of service and loss of existing or potential customers and may impede our sales, manufacturing, distribution and other critical functions.
In the course of our regular business operations and providing maintenance support services to our customers, we process and transmit proprietary information and sensitive or confidential data, including personal
17
Table of Contents
information of employees, customers and others. Breaches in security could expose us, our customers or the individuals affected to a risk of loss or misuse of this information, resulting in potential regulatory actions, litigation and potential liability for us, as well as the loss of existing or potential customers and damage to our brand and reputation.
Despite network security, disaster recovery and systems management measures in place, we may encounter unexpected general system outages or failures that may affect our ability to conduct research and development, provide maintenance and support of our products, manage our contractual arrangements, accurately and efficiently maintain our books and records, record our transactions, provide critical information to our management and prepare our financial statements. Additionally, these unexpected systems outages or failures may require additional personnel and financial resources, disrupt our business or cause delays in the reporting of our financial results. We may also be required to modify, enhance, upgrade or implement new systems, procedures and controls to reflect changes in our business or technological advancements, which could cause us to incur additional costs and require additional management attention, placing burdens on our internal resources. We also outsource certain IT-related functions to third parties that are responsible for maintaining their own network security, disaster recovery and systems management procedures. If we, or our third party IT vendors, fail to manage our IT systems and related software applications effectively, it could adversely affect our business operations, operating results and cash flows.
Our offerings of software-as-a-service (SaaS) bring new business and operational risks.
During the latter part of fiscal 2010, we announced multiple new offerings of SaaS. The offerings provide our customers with existing and new software management through a hosted service as opposed to traditional software deployments. There is a risk that our SaaS offerings may reduce demand for licenses and maintenance of our traditional software products which could impact our revenue and/or operating margins. There is also a risk that our internal development teams could find it difficult or costly to support both traditional software installed by customers and software delivered as a service. To the extent that our new SaaS offerings are defective or there are disruptions to our services, demand for our SaaS offerings could diminish and we could be subject to substantial liability. In addition, interruptions or delays in service from our third party service delivery hosts could impair the delivery of our services and harm our business. If we or our third party service delivery hosts experience security breaches and unauthorized access is obtained to a customer’s data or our data, our services may be perceived as not being secure, customers may curtail or stop using our services and we may incur significant legal and financial exposure and liabilities.
ITEM 1B. Unresolved Staff Comments
None.
18
Table of Contents
Our headquarters are located in Houston, Texas, where we lease approximately 570,000 square feet of office space. We also maintain software development and sales organizations in various locations around the world where we lease the necessary facilities. A summary of our principal leased properties currently in use is as follows:
| Location |
Approximate Area (sq. ft.) |
Lease Expiration | ||
| Houston, Texas |
570,000 | June 30, 2021 | ||
| Pune, India |
162,000 | September 30, 2014 | ||
| Austin, Texas |
106,000 | December 31, 2013 | ||
| Tel Aviv, Israel |
69,000 | July 10, 2012 | ||
| San Jose, California |
62,000 | May 31, 2019 | ||
| Amsterdam, The Netherlands |
52,000 | June 30, 2010 | ||
| Egham, United Kingdom |
47,000 | April 26, 2019 | ||
| Milan, Italy |
34,000 | January 1, 2012 | ||
| Lexington, Massachusetts |
32,000 | February 28, 2013 | ||
| McLean, Virginia |
28,000 | November 30, 2013 |
In November 2009, a lawsuit was filed against a number of software companies, including us, by Achates Reference Publishing, Inc. in the United States District Court for the Eastern District of Texas, Marshall Division. The complaint seeks monetary damages in unspecified amounts and permanent injunction based upon claims for alleged patent infringement. We intend to vigorously defend this matter. However, we cannot predict the timing and ultimate outcome of this matter.
On July 15, 2004, we acquired Marimba, Inc., and Marimba is now a wholly-owned subsidiary of BMC. In 2001, a class action complaint alleging violations of the federal securities laws was filed in the United States District Court for the Southern District of New York naming as defendants Marimba, certain of Marimba’s officers and directors, and certain underwriters of Marimba’s initial public offering. An amended complaint was filed on April 19, 2002. Marimba and certain of its officers and directors are named in the suit pursuant to Section 11 of the Securities Act of 1933 and Section 10(b) of the Securities Exchange Act of 1934 on the basis of an alleged failure to disclose the underwriters’ alleged compensation and manipulative practices in connection with Marimba’s initial public offering. Similar complaints have been filed against over 300 other issuers that have had initial public offerings since 1998. The individual officer and director defendants entered into tolling agreements and, pursuant to a Court Order dated October 9, 2002, were dismissed from the litigation without prejudice. On February 19, 2003, the Court granted a Motion to Dismiss the Rule 10b-5 claims against 116 defendants, including Marimba. On June 30, 2003, the Marimba Board of Directors approved a proposed partial settlement with the plaintiffs in this matter. The settlement would have provided, among other things, a release of Marimba and of the individual officer and director defendants for the alleged wrongful conduct in the Amended Complaint in exchange for a guarantee from Marimba’s insurers regarding recovery from the underwriter defendants and other non-monetary consideration. While the partial settlement was pending approval, the plaintiffs continued to litigate against the underwriter defendants. The district court directed that the litigation proceed within a number of “focus cases” rather than in all of the 310 cases that have been consolidated. The Marimba case is not one of these focus cases. On October 13, 2004, the district court certified the focus cases as class actions. The underwriter defendants appealed that ruling, and on December 5, 2006, the Court of Appeals for the Second Circuit reversed the district court’s class certification decision. On April 6, 2007, the Second Circuit denied plaintiffs’ petition for rehearing. In light of the Second Circuit opinion, liaison counsel for all issuer defendants, including Marimba, informed the District Court that the settlement could not be approved, because the defined settlement class, like the litigation class, could not be certified. On June 25, 2007, the Court
19
Table of Contents
entered an order terminating the settlement agreement. On August 14, 2007, the plaintiffs filed their second consolidated amended class action complaints against the focus cases and on September 27, 2007, again moved for class certification. On November 12, 2007, certain of the defendants in the focus cases moved to dismiss the second consolidated amended class action complaints. On March 26, 2008, the Court denied the motions to dismiss except as to Section 11 claims raised by those plaintiffs who sold their securities for a price in excess of the initial offering price and those who purchased outside the previously certified class period. On October 3, 2008, plaintiffs submitted a proposed order withdrawing the class certification motion without prejudice. On April 2, 2009, a stipulation and agreement of settlement between the plaintiffs, issuer defendants and underwriter defendants was submitted to the United States District Court for the Southern District of New York (the Court) for preliminary approval. This settlement requires no financial contribution from Marimba or us. The Court granted the plaintiffs’ motion for preliminary approval and preliminarily certified the settlement classes on June 10, 2009. The settlement “fairness” hearing was held on September 10, 2009. The Court granted the plaintiffs’ motion for final approval of the settlement and certified the settlement classes on October 5, 2009. The Court determined that the settlement is fair to the class members, approved the settlement and dismissed, with prejudice, the case against Marimba and its individual defendants. Notices of appeal of the opinion granting final approval have been filed. Due to the inherent uncertainties of litigation and because the settlement remains subject to appeal, the ultimate outcome of the matter is uncertain.
We are subject to various other legal proceedings and claims, either asserted or unasserted, which arise in the ordinary course of business. We do not believe that the outcome of any of these matters will have a material adverse effect on our consolidated financial position, results of operations or cash flows.
ITEM 4. (Removed and Reserved)
20
Table of Contents
PART II
| ITEM 5. | Market for Registrant’s Common Equity, Related Stockholder Matters and Issuer Purchases of Equity Securities |
Our common stock is listed on the NASDAQ Stock Market and trades under the symbol BMC. On May 3, 2010, there were 700 holders of record of our common stock.
The following table sets forth the high and low intra-day sales prices per share of our common stock for the periods indicated:
| Price Range of Common Stock | ||||||
| High | Low | |||||
| FISCAL 2010 |
||||||
| Fourth Quarter |
$ | 40.87 | $ | 35.55 | ||
| Third Quarter |
$ | 40.73 | $ | 35.65 | ||
| Second Quarter |
$ | 39.00 | $ | 31.00 | ||
| First Quarter |
$ | 35.76 | $ | 31.18 | ||
| FISCAL 2009 |
||||||
| Fourth Quarter |
$ | 33.99 | $ | 24.76 | ||
| Third Quarter |
$ | 29.48 | $ | 20.58 | ||
| Second Quarter |
$ | 37.37 | $ | 27.69 | ||
| First Quarter |
$ | 40.87 | $ | 30.06 | ||
We have never declared or paid dividends to BMC Software stockholders. We do not intend to pay any cash dividends in the foreseeable future. We currently intend to retain any future earnings otherwise available for cash dividends on the common stock for use in our operations, for acquisitions and for common stock repurchases. See Management’s Discussion and Analysis of Financial Condition and Results of Operations — Liquidity and Capital Resources.
21
Table of Contents
The graph below shows the relative investment performance of our common stock, the S&P 500 index and the S&P Systems Software Index for the last five years, assuming reinvestment of dividends at date of payment into the common stock of the indices. The following graph is presented pursuant to SEC rules and is not meant to be an indication of our future performance.
COMPARISON OF 5 YEAR CUMULATIVE TOTAL RETURN*
Among BMC Software, Inc., The S&P 500 Index
and The S&P Systems Software Index
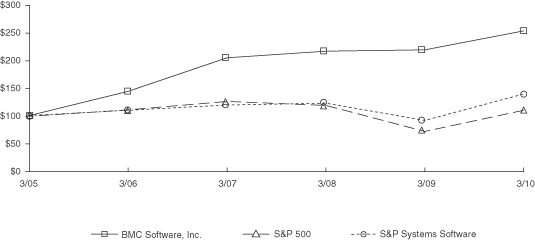
| * | $100 invested on March 31, 2005 in stock or index, including reinvestment of dividends. |
ISSUER PURCHASES OF EQUITY SECURITIES
| Period |
Total Number of Shares Purchased(1) |
Average Price Paid per Share |
Total Number of Shares Purchased as Part of a Publicly Announced Program(2) |
Total Dollar Value of Shares Purchased as Part of a Publicly Announced Program(2) |
Approximate Dollar Value of Shares that may yet be Purchased Under the Program(2) | ||||||||
| January 1-31, 2010 |
364,769 | $ | 39.33 | 363,389 | $ | 14,292,373 | $ | 130,514,495 | |||||
| February 1-28, 2010 |
881,645 | $ | 36.85 | 759,568 | 27,991,675 | $ | 102,522,820 | ||||||
| March 1-31, 2010 |
859,040 | $ | 38.17 | 858,285 | 32,758,536 | $ | 69,764,284 | ||||||
| Quarterly Total |
2,105,454 | $ | 37.88 | 1,981,242 | $ | 75,042,584 | $ | 69,764,284 | |||||
| Fiscal 2010 Total |
7,895,620 | $ | 36.52 | 7,531,728 | $ | 275,070,032 | $ | 69,764,284 | |||||
| (1) | Includes 124,212 and 363,892 shares of our common stock withheld by us to satisfy employee withholding obligations during the quarter and year ended March 31, 2010, respectively. |
| (2) | Our Board of Directors had previously authorized a total of $3.0 billion to repurchase common stock. At March 31, 2010, approximately $69.8 million remains authorized in this stock repurchase program and the program does not have an expiration date. In April 2010, our Board of Directors authorized an additional $1.0 billion to repurchase stock. |
Information regarding our equity compensation plans at March 31, 2010 is incorporated by reference into Item 12. Security Ownership of Certain Beneficial Owners and Management and Related Stockholder Matters.
22
Table of Contents
ITEM 6. Selected Financial Data
The following selected consolidated financial data presented for, and at the end of, each of the years in the five-year period ended March 31, 2010, are derived from our consolidated financial statements. The following business combinations during the five-year period ended March 31, 2010 were accounted for under the acquisition method of accounting, and, accordingly, the financial results of these acquired businesses have been included in our financial results below from the indicated acquisition dates: Phurnace Software in December 2009, Tideway Systems in October 2009, MQSoftware in August 2009, BladeLogic, Inc. (BladeLogic) in April 2008, Emprisa Networks, Inc. (Emprisa) in October 2007, RealOps, Inc. (RealOps) in July 2007, ProactiveNet, Inc. (ProactiveNet) in June 2007 and Identify Software Ltd. in May 2006.
The operating results for fiscal 2010, 2009, 2008, 2007 and 2006 below include charges for severance, exit costs and related charges of $3.0 million, $33.5 million, $14.7 million, $44.6 million and $41.0 million, respectively. During fiscal 2010, 2009, 2008 and 2007, we incurred $88.9 million, $82.0 million, $66.6 million and $41.6 million of share-based compensation expenses, respectively, following the adoption of accounting standards, effective April 1, 2006, requiring compensation expense associated with share-based awards to be recognized in the consolidated statements of operations. During fiscal 2010, we recorded a net tax benefit of approximately $30.0 million associated with a settlement with the United States Internal Revenue Service (IRS) related to prior year tax matters. During fiscal 2009, we wrote off acquired in-process research and development of $50.3 million in connection with our acquisition of BladeLogic. During fiscal 2006, we incurred $35.5 million of income tax expense related to the repatriation of foreign earnings.
The selected consolidated financial data should be read in conjunction with the consolidated financial statements at March 31, 2010 and 2009, and for each of the three years in the period ended March 31, 2010, the accompanying notes and the report of the independent registered public accounting firm thereon, which are included elsewhere in this Annual Report on Form 10-K.
| Year Ended March 31, | |||||||||||||||
| 2010 | 2009 | 2008 | 2007 | 2006 | |||||||||||
| (In millions, except per share data) | |||||||||||||||
| Statement of Operations Data: |
|||||||||||||||
| Total revenue |
$ | 1,911.2 | $ | 1,871.9 | $ | 1,731.6 | $ | 1,580.4 | $ | 1,498.4 | |||||
| Operating income |
$ | 506.1 | $ | 367.8 | $ | 357.5 | $ | 207.3 | $ | 128.5 | |||||
| Net earnings |
$ | 406.1 | $ | 238.1 | $ | 313.6 | $ | 215.9 | $ | 102.0 | |||||
| Basic earnings per share |
$ | 2.21 | $ | 1.27 | $ | 1.59 | $ | 1.05 | $ | 0.47 | |||||
| Diluted earnings per share |
$ | 2.17 | $ | 1.25 | $ | 1.56 | $ | 1.02 | $ | 0.47 | |||||
| Shares used in computing basic earnings per share |
183.1 | 187.1 | 194.8 | 204.2 | 216.0 | ||||||||||
| Shares used in computing diluted earnings per share |
186.8 | 190.2 | 199.6 | 210.1 | 218.8 | ||||||||||
| At March 31, | |||||||||||||||
| 2010 | 2009 | 2008 | 2007 | 2006 | |||||||||||
| (In millions) | |||||||||||||||
| Balance Sheet Data: |
|||||||||||||||
| Cash and cash equivalents |
$ | 1,368.6 | $ | 1,023.3 | $ | 1,288.3 | $ | 883.5 | $ | 905.9 | |||||
| Investments |
127.9 | 145.9 | 186.9 | 623.6 | 437.8 | ||||||||||
| Working capital |
543.9 | 227.2 | 514.0 | 556.6 | 304.0 | ||||||||||
| Total assets |
4,137.6 | 3,697.5 | 3,345.5 | 3,260.0 | 3,210.9 | ||||||||||
| Long-term borrowings |
340.9 | 313.6 | 9.2 | 3.3 | 9.0 | ||||||||||
| Deferred revenue |
1,823.1 | 1,787.9 | 1,779.4 | 1,729.0 | 1,628.3 | ||||||||||
| Stockholders’ equity |
1,387.7 | 1,048.5 | 994.5 | 1,049.1 | 1,098.8 | ||||||||||
23
Table of Contents
ITEM 7. Management’s Discussion and Analysis of Financial Condition and Results of Operations
This Management’s Discussion and Analysis (MD&A) of Financial Condition and Results of Operations should be read in conjunction with our consolidated financial statements and notes thereto which appear elsewhere in this Annual Report on Form 10-K. The following discussion contains forward-looking statements that are subject to risks and uncertainties. Actual results may differ substantially from those referred to herein due to a number of factors, including but not limited to risks described in the section entitled Risk Factors and elsewhere in this Annual Report on Form 10-K.
Unless indicated otherwise, results of operations data in this MD&A are presented in accordance with United States generally accepted accounting principles (GAAP). Additionally, in an effort to provide investors with additional information regarding our results of operations, certain non-GAAP financial measures including non-GAAP operating income, non-GAAP net earnings and non-GAAP diluted earnings per share are provided in this MD&A. See Non-GAAP Financial Measures and Reconciliations below for an explanation of our use of non-GAAP financial measures and reconciliations to their corresponding measures calculated in accordance with GAAP.
Overview
Our fiscal 2010 financial performance in terms of revenue, operating income, diluted earnings per share and operating cash flows was in line with our annual expectations. Select operating metrics for fiscal 2010 included:
| • | Total bookings, which represents the contract value of new transactions that we closed and recorded, was $1,946.4 million, representing an increase of $66.0 million, or 3.5%, over fiscal 2009. On a year over year basis, this increase was reflective of a $132.6 million, or 13.4%, increase in bookings in the second half of our fiscal year, offset by a $66.6 million, or 7.5%, decrease in bookings in the first half of our fiscal year. The year over year bookings increase in the second half of our fiscal year was attributable to bookings increases in our MSM and ESM segments of $76.2 million, or 19.9%, and $56.4 million, or 9.3%, respectively, while the year over year bookings decrease in the first half of our fiscal year was attributable primarily to a $65.4 million, or 12.3%, decrease in our ESM segment. |
| • | Total revenue was $1,911.2 million, representing an increase of $39.3 million, or 2.1%, over fiscal 2009. This increase was reflective of license and maintenance revenue increases of $48.7 million, or 6.9%, and $5.9 million, or 0.6%, respectively, offset by a decrease in professional services revenue of $15.3 million, or 10.6%. On a segment basis, total MSM revenue increased by $23.7 million, or 3.2%, and total ESM revenue increased by $15.6 million, or 1.4%, over fiscal 2009. |
| • | Operating income was $506.1 million, representing an increase of $138.3 million, or 37.6%, over fiscal 2009. Non-GAAP operating income was $674.5 million, representing an increase of $62.2 million, or 10.2%, over fiscal 2009. |
| • | Net earnings was $406.1 million, representing an increase of $168.0 million, or 70.6%, over fiscal 2009. Non-GAAP net earnings was $496.0 million, representing an increase of $64.8 million, or 15.0%, over fiscal 2009. |
| • | Diluted earnings per share was $2.17, representing an increase of $0.92, or 73.6%, over fiscal 2009. Non-GAAP diluted earnings per share was $2.66, representing an increase of $0.39, or 17.2%, over fiscal 2009. |
| • | Cash flows from operations were $635.4 million, representing an increase of $55.7 million, or 9.6%, over fiscal 2009. |
| • | We closed out the year with a strong balance sheet at March 31, 2010, including $1.5 billion in cash, cash equivalents and investments and $1.8 billion in deferred revenue. |
24
Table of Contents
We continue to invest internally and externally to enhance our technology leadership, including in the areas of cloud computing, virtualization and software-as-a-service. Select initiatives in fiscal 2010 included:
| • | We released multiple significant new product enhancements in each of our businesses, including significant new releases of our service automation, service assurance and service support solutions in our ESM business and new MSM solutions to support IBM’s IMS V11 high-performance application and data server; |
| • | We completed two strategic acquisitions in our ESM business and one in our MSM business for total purchase consideration of $94.3 million; and |
| • | We announced multiple new on-demand SaaS offerings that leverage our IT service desk leadership through new distribution channels. |
We also continue to enhance shareholder value by returning cash to shareholders through our stock repurchase program. During fiscal 2010, we repurchased approximately 7.5 million shares for a total value of $275.1 million. Additionally, in April 2010, our Board of Directors authorized an additional $1.0 billion to repurchase stock.
It is important for our investors to understand that a significant portion of our operating expenses is fixed in the short-term and we plan a portion of our expense run-rate based on our expectations of future revenue. In addition, a significant amount of our license transactions are completed during the final weeks and days of each quarter and, therefore, we generally do not know whether revenue has met our expectations until after the end of the quarter. If a shortfall in revenue were to occur in any given quarter, there would be an immediate, and possibly significant, impact to our overall earnings and, most likely, our stock price.
Because our software solutions are designed for and marketed to companies looking to improve the management of their IT infrastructure and processes, demand for our products, and therefore our financial results, are dependent upon corporations continuing to value such solutions and to invest in such technology. There are a number of trends that have historically influenced demand for IT management software, including, among others, business demands placed on IT, computing capacity within IT departments, complexity of IT systems and IT operational costs. Our financial results are also influenced by many economic and industry conditions, including, but not limited to, general economic and market conditions in the United States and other economies in which we market products, changes in foreign currency exchange rates, general levels of corporate spending, IT budgets, the competitiveness of the IT management software and solutions industry, the adoption rate for BSM and the stability of the mainframe market.
Acquisitions
We have consummated multiple acquisitions of businesses in recent years. Each of these acquisitions has been accounted for using the acquisition method of accounting. Accordingly, the financial results for these entities have been included in our consolidated financial results since the applicable acquisition dates.
Fiscal 2010 Acquisitions
During fiscal 2010, we completed the acquisitions of MQSoftware, a leading provider of middleware and enterprise application transaction management software, Tideway Systems, a leading provider of IT discovery solutions, and Phurnace Software, a leading developer of software that automates the deployment and configuration of business-critical Java™ EE applications, for combined purchase consideration of $94.3 million.
Fiscal 2009 Acquisition
In April 2008, we acquired BladeLogic, a leading provider of data center automation software, through the successful completion of a tender offer for approximately $834 million in cash, excluding acquisition costs. The BladeLogic acquisition expands our offerings for server provisioning, application release management, as well as configuration automation and compliance.
25
Table of Contents
Fiscal 2008 Acquisitions
During fiscal 2008, we acquired all of the issued and outstanding capital stock of ProactiveNet, RealOps, and Emprisa Networks for total cash consideration of $117.4 million including direct acquisition costs. ProactiveNet is a provider of an advanced “early warning system” for the IT market. This acquisition advances the solutions available for our customers looking to align IT services to business priorities. RealOps is a leading provider of run book automation software. This acquisition enables us to provide a robust platform for IT process design and execution. Emprisa is a leading provider of network configuration automation software. This acquisition expands our ability to include the configuration of network devices in our service automation offering.
Historical Information
Historical performance should not be viewed as indicative of future performance, as there can be no assurance that operating income or net earnings will be sustained at these levels. For a discussion of factors affecting operating results, see the Risk Factors section above.
Results of Operations
The following table sets forth, for the fiscal years indicated, the percentages that selected items in the accompanying consolidated statements of operations bear to total revenue.
| Percentage of Total Revenue for the Year Ended March 31, |
|||||||||
| 2010 | 2009 | 2008 | |||||||
| Revenue: |
|||||||||
| License |
39.7 | % | 37.9 | % | 37.4 | % | |||
| Maintenance |
53.6 | % | 54.4 | % | 55.9 | % | |||
| Professional services |
6.8 | % | 7.7 | % | 6.7 | % | |||
| Total revenue |
100.0 | % | 100.0 | % | 100.0 | % | |||
| Operating expenses: |
|||||||||
| Cost of license revenue |
6.0 | % | 6.3 | % | 5.8 | % | |||
| Cost of maintenance revenue |
8.3 | % | 8.9 | % | 9.8 | % | |||
| Cost of professional services revenue |
7.2 | % | 7.6 | % | 7.2 | % | |||
| Selling and marketing expenses |
29.1 | % | 28.9 | % | 30.5 | % | |||
| Research and development expenses |
10.2 | % | 11.9 | % | 12.1 | % | |||
| General and administrative expenses |
10.8 | % | 10.6 | % | 12.1 | % | |||
| In-process research and development |
— | % | 2.7 | % | 0.2 | % | |||
| Amortization of intangible assets |
1.7 | % | 1.8 | % | 0.9 | % | |||
| Severance, exit costs and related charges |
0.2 | % | 1.8 | % | 0.8 | % | |||
| Total operating expenses |
73.5 | % | 80.4 | % | 79.4 | % | |||
| Operating income |
26.5 | % | 19.6 | % | 20.6 | % | |||
| Other income (loss), net: |
|||||||||
| Interest and other income, net |
0.8 | % | 1.4 | % | 4.3 | % | |||
| Interest expense |
(1.1 | )% | (0.9 | )% | (0.1 | )% | |||
| Gain (loss) on investments, net |
0.2 | % | (0.7 | )% | 0.2 | % | |||
| Total other income (loss), net |
(0.1 | )% | (0.2 | )% | 4.4 | % | |||
| Earnings before income taxes |
26.4 | % | 19.4 | % | 25.1 | % | |||
| Provision for income taxes |
5.1 | % | 6.7 | % | 7.0 | % | |||
| Net earnings |
21.2 | % | 12.7 | % | 18.1 | % | |||
26
Table of Contents
Revenue
The following table provides information regarding software license and software maintenance revenue for fiscal 2010, 2009 and 2008.
Software License Revenue
| Percentage Change | |||||||||||||||
| Year Ended March 31, | 2010 Compared to 2009 |
2009 Compared to 2008 |
|||||||||||||
| 2010 | 2009 | 2008 | |||||||||||||
| (In millions) | |||||||||||||||
| Enterprise Service Management |
$ | 462.2 | $ | 434.9 | $ | 349.3 | 6.3 | % | 24.5 | % | |||||
| Mainframe Service Management |
296.2 | 274.8 | 298.3 | 7.8 | % | (7.9 | )% | ||||||||
| Total software license revenue |
$ | 758.4 | $ | 709.7 | $ | 647.6 | 6.9 | % | 9.6 | % | |||||
Software Maintenance Revenue
| Percentage Change | |||||||||||||||
| Year Ended March 31, | 2010 Compared to 2009 |
2009 Compared to 2008 |
|||||||||||||
| 2010 | 2009 | 2008 | |||||||||||||
| (In millions) | |||||||||||||||
| Enterprise Service Management |
$ | 550.9 | $ | 547.3 | $ | 514.2 | 0.7 | % | 6.4 | % | |||||
| Mainframe Service Management |
472.8 | 470.5 | 453.5 | 0.5 | % | 3.7 | % | ||||||||
| Total software maintenance revenue |
$ | 1,023.7 | $ | 1,017.8 | $ | 967.7 | 0.6 | % | 5.2 | % | |||||
Total Software Revenue
| Percentage Change | |||||||||||||||
| Year Ended March 31, | 2010 Compared to 2009 |
2009 Compared to 2008 |
|||||||||||||
| 2010 | 2009 | 2008 | |||||||||||||
| (In millions) | |||||||||||||||
| Enterprise Service Management |
$ | 1,013.1 | $ | 982.2 | $ | 863.5 | 3.1 | % | 13.7 | % | |||||
| Mainframe Service Management |
769.0 | 745.3 | 751.8 | 3.2 | % | (0.9 | )% | ||||||||
| Total software revenue |
$ | 1,782.1 | $ | 1,727.5 | $ | 1,615.3 | 3.2 | % | 6.9 | % | |||||
Software License Revenue
License revenue was $758.4 million, $709.7 million and $647.6 million for fiscal 2010, 2009 and 2008, respectively.
License revenue in fiscal 2010 increased by $48.7 million, or 6.9%, over fiscal 2009. This increase was attributable to license revenue increases in both our MSM and ESM segments, as further discussed below. Recognition of license revenue in fiscal 2010 that was deferred in prior periods increased by $66.3 million over fiscal 2009. Of the license revenue transactions recorded, the percentage of license revenue recognized upfront declined slightly to 48% for fiscal 2010 as compared to 50% in fiscal 2009. During fiscal 2010, we closed 129 transactions with license values over $1 million, with a total license value of $358.6 million, compared with 135 transactions with license values over $1 million, with a total license value of $364.3 million, in fiscal 2009.
License revenue in fiscal 2009 increased by $62.1 million, or 9.6%, over fiscal 2008. This increase was attributable to a license revenue increase in the ESM segment, partially offset by a license revenue decrease in the MSM segment, as further discussed below. Recognition of license revenue in fiscal 2009 that was deferred in
27
Table of Contents
prior periods increased by $25.7 million over fiscal 2008. Of the license revenue transactions recorded, the percentage of license revenue recognized upfront remained constant at 50% during fiscal 2009 and 2008. During fiscal 2009, we closed 135 transactions with license values over $1 million, with a total license value of $364.3 million, compared with 94 transactions with license values over $1 million, with a total license value of $278.1 million, in fiscal 2008.
ESM license revenue was $462.2 million, or 60.9%, $434.9 million, or 61.3%, and $349.3 million, or 53.9%, of our total license revenue for fiscal 2010, 2009 and 2008, respectively. ESM license revenue in fiscal 2010 increased by $27.3 million, or 6.3%, over fiscal 2009, primarily due to an increase in the recognition of previously deferred license revenue, partially offset by a decrease in the amount of upfront license revenue recognized in connection with new transactions. The decrease in upfront license revenue recognized in fiscal 2010 was attributable to a decrease in ESM license transaction bookings and a slightly higher percentage of license transaction bookings that were recognized ratably over the underlying contractual maintenance terms rather than as upfront revenue. ESM license revenue in fiscal 2009 increased by $85.6 million, or 24.5%, over fiscal 2008, primarily due to increased demand for our BSM solutions, inclusive of incremental revenue resulting from our acquisition of BladeLogic in April 2008 and our fiscal 2008 acquisitions, as well as an increase in the recognition of previously deferred license revenue year over year, partially offset by an increase in the level of new license transactions with revenue being deferred into future periods. ESM license revenue contributed by BladeLogic products amounted to $57.5 million in fiscal 2009.
MSM license revenue was $296.2 million, or 39.1%, $274.8 million, or 38.7%, and $298.3 million, or 46.1%, of our total license revenue for fiscal 2010, 2009 and 2008, respectively. MSM license revenue in fiscal 2010 increased by $21.4 million, or 7.8%, over fiscal 2009, primarily due to a fiscal 2010 increase in the recognition of previously deferred license revenue and an increase in the amount of upfront license revenue recognized in connection with new transactions. MSM license revenue in fiscal 2009 decreased $23.5 million, or 7.9%, from fiscal 2008, primarily due to a decrease in the volume of new license transactions executed, partially offset by an increase in the recognition of previously deferred license revenue year over year.
For fiscal 2010, 2009 and 2008, our recognized license revenue was impacted by the changes in our deferred license revenue balance as follows:
| Year Ended March 31, | ||||||||||||
| 2010 | 2009 | 2008 | ||||||||||
| (In millions) | ||||||||||||
| Deferrals of license revenue |
$ | (398.9 | ) | $ | (383.2 | ) | $ | (347.2 | ) | |||
| Recognition from deferred license revenue |
390.5 | 324.2 | 298.5 | |||||||||
| Impact of foreign currency exchange rate changes |
(4.9 | ) | 3.5 | (2.3 | ) | |||||||
| Net increase in deferred license revenue |
$ | (13.3 | ) | $ | (55.5 | ) | $ | (51.0 | ) | |||
| Deferred license revenue balance at end of year |
$ | 624.2 | $ | 610.9 | $ | 555.4 | ||||||
The primary reasons for license revenue deferrals include, but are not limited to, customer transactions that include products for which the maintenance pricing is based on a combination of undiscounted license list prices, net license fees or discounted license list prices, certain arrangements that include unlimited licensing rights, time-based licenses that are recognized over the term of the arrangement, customer transactions that include products with differing maintenance periods and other transactions for which we do not have or are not able to determine vendor-specific objective evidence of the fair value of the maintenance and/or professional services. The contract terms and conditions that result in deferral of revenue recognition for a given transaction result from arm’s length negotiations between us and our customers. We anticipate our transactions will continue to include such contract terms that result in deferral of the related license revenue as we expand our offerings to meet customers’ product, pricing and licensing needs.
Once it is determined that license revenue for a particular contract must be deferred, based on the contractual terms and application of revenue recognition policies to those terms, we recognize such license revenue either
28
Table of Contents
ratably over the term of the contract or when the revenue recognition criteria are met. Because of this, we generally know the timing of the subsequent recognition of license revenue at the time of deferral. Therefore, the amount of license revenue to be recognized out of the deferred revenue balance in each future quarter is generally predictable, and our total license revenue to be recognized each quarter becomes more predictable as a larger percentage of that revenue comes from the deferred license revenue balance. At March 31, 2010, the deferred license revenue balance was $624.2 million. As additional license revenue is deferred in future periods, the amounts to be recognized in future periods will increase. Estimated deferred license revenue that we expect to recognize in future periods at March 31, 2010 is (in millions):
| Fiscal 2011 |
$ | 319.0 | |
| Fiscal 2012 |
173.7 | ||
| Fiscal 2013 and thereafter |
131.5 | ||
| $ | 624.2 | ||
Software Maintenance Revenue
Maintenance revenue was $1,023.7 million, $1,017.8 million and $967.7 million for fiscal 2010, 2009 and 2008, respectively. Maintenance revenue in fiscal 2010 increased by $5.9 million, or 0.6%, over fiscal 2009, and in fiscal 2009 increased by $50.1 million, or 5.2%, over fiscal 2008. These increases were attributable to increases in both ESM and MSM maintenance revenue, as discussed below.
ESM maintenance revenue was $550.9 million, or 53.8%, $547.3 million, or 53.8%, and $514.2 million, or 53.1%, of our total maintenance revenue for fiscal 2010, 2009 and 2008, respectively. ESM maintenance revenue in fiscal 2010 increased by $3.6 million, or 0.7%, over fiscal 2009, and in fiscal 2009 increased by $33.1 million, or 6.4%, over fiscal 2008. These year over year increases were attributable primarily to the expansion of our installed ESM customer license base, including incremental maintenance revenue resulting from our acquisition of BladeLogic in April 2008. Maintenance revenue contributed by BladeLogic products was $17.3 million in fiscal 2009.
MSM maintenance revenue was $472.8 million, or 46.2%, $470.5 million, or 46.2%, and $453.5 million, or 46.9%, of our total maintenance revenue for fiscal 2010, 2009 and 2008, respectively. MSM maintenance revenue in fiscal 2010 increased by $2.3 million, or 0.5%, over fiscal 2009, and in fiscal 2009 increased by $17.0 million, or 3.7%, over fiscal 2008. These year over year increases were attributable primarily to the expansion of our installed MSM customer license base and increasing capacities of the current installed base.
At March 31, 2010, the deferred maintenance revenue balance was $1,179.6 million. As new customers are added and/or current contracts are renewed and additional maintenance revenue is deferred in future periods, the amounts to be recognized in future periods will increase. Estimated deferred maintenance revenue that we expect to recognize in future periods at March 31, 2010 is (in millions):
| Fiscal 2011 |
$ | 637.6 | |
| Fiscal 2012 |
304.0 | ||
| Fiscal 2013 and thereafter |
238.0 | ||
| $ | 1,179.6 | ||
29
Table of Contents
Domestic vs. International Revenue
| Year Ended March 31, | Percentage Change | ||||||||||||||
| 2010 Compared to 2009 |
2009 Compared to 2008 |
||||||||||||||
| 2010 | 2009 | 2008 | |||||||||||||
| (In millions) | |||||||||||||||
| License: |
|||||||||||||||
| Domestic |
$ | 390.3 | $ | 361.7 | $ | 306.2 | 7.9 | % | 18.1 | % | |||||
| International |
368.1 | 348.0 | 341.4 | 5.8 | % | 1.9 | % | ||||||||
| Total license revenue |
758.4 | 709.7 | 647.6 | 6.9 | % | 9.6 | % | ||||||||
| Maintenance: |
|||||||||||||||
| Domestic |
561.4 | 555.5 | 525.5 | 1.1 | % | 5.7 | % | ||||||||
| International |
462.3 | 462.3 | 442.2 | — | 4.5 | % | |||||||||
| Total maintenance revenue |
1,023.7 | 1,017.8 | 967.7 | 0.6 | % | 5.2 | % | ||||||||
| Professional services: |
|||||||||||||||
| Domestic |
59.8 | 62.8 | 47.1 | (4.8 | )% | 33.3 | % | ||||||||
| International |
69.3 | 81.6 | 69.2 | (15.1 | )% | 17.9 | % | ||||||||
| Total professional services revenue |
129.1 | 144.4 | 116.3 | (10.6 | )% | 24.2 | % | ||||||||
| Total revenue |
$ | 1,911.2 | $ | 1,871.9 | $ | 1,731.6 | 2.1 | % | 8.1 | % | |||||
We estimate that the effect of foreign currency exchange rate fluctuations on our international revenue resulted in an approximate $3.3 million increase in total fiscal 2010 revenue as compared to fiscal 2009 and an approximate $9.0 million reduction in total fiscal 2009 revenue as compared to fiscal 2008, on a constant currency basis.
Domestic License Revenue
Domestic license revenue was $390.3 million, or 51.5%, $361.7 million, or 51.0%, and $306.2 million, or 47.3%, of our total license revenue for fiscal 2010, 2009 and 2008, respectively.
Domestic license revenue in fiscal 2010 increased by $28.6 million, or 7.9%, over fiscal 2009, due to a $15.8 million increase in MSM license revenue and a $12.8 million increase in ESM license revenue.
Domestic license revenue in fiscal 2009 increased by $55.5 million, or 18.1%, over fiscal 2008, due to a $66.2 million increase in ESM license revenue, including incremental license revenue of $40.5 million resulting from our acquisition of BladeLogic, offset by a $10.7 million decrease in MSM license revenue.
International License Revenue
International license revenue was $368.1 million, or 48.5%, $348.0 million, or 49.0%, and $341.4 million, or 52.7%, of our total license revenue for fiscal 2010, 2009 and 2008, respectively.
International license revenue in fiscal 2010 increased by $20.1 million, or 5.8%, over fiscal 2009, due to a $14.6 million increase in ESM license revenue and a $5.5 million increase in MSM license revenue. The ESM license revenue increase was attributable to a $10.4 million increase in our Asia Pacific market and a $6.5 million increase in our Canada market, partially offset by a combined $2.3 million net decrease in our other international markets. The MSM license revenue increase was attributable primarily to increases of $4.5 million and $1.3 million in our Latin America and Canada markets, respectively, partially offset by a net decrease of $0.3 million in our other international markets.
30
Table of Contents
International license revenue in fiscal 2009 increased by $6.6 million, or 1.9%, over fiscal 2008, due to a $19.4 million increase in ESM license revenue, including incremental license revenue of $17.0 million resulting from our acquisition of BladeLogic, offset by a $12.8 million decrease in MSM license revenue. The ESM license revenue increase was attributable to a $15.5 million increase in our Europe, Middle East and Africa (EMEA) market, principally due to incremental revenue resulting from our acquisition of BladeLogic, and a $6.0 million increase in our Asia Pacific market, partially offset by a $2.1 million net decrease in our other international markets. The MSM license revenue decrease was attributable primarily to decreases of $7.2 million and $5.7 million in our EMEA and Latin American markets, respectively.
Domestic Maintenance Revenue
Domestic maintenance revenue was $561.4 million, or 54.8%, $555.5 million, or 54.6%, and $525.5 million, or 54.3%, of our total maintenance revenue for fiscal 2010, 2009 and 2008, respectively.
Domestic maintenance revenue in fiscal 2010 increased by $5.9 million, or 1.1%, over fiscal 2009, due to a $5.7 million increase in MSM maintenance revenue and a $0.2 million increase in ESM maintenance revenue.
Domestic maintenance revenue in fiscal 2009 increased by $30.0 million, or 5.7%, over fiscal 2008, due to a $22.9 million increase in ESM maintenance revenue, including incremental maintenance revenue of $14.1 million resulting from our acquisition of BladeLogic, and a $7.1 million increase in MSM maintenance revenue.
International Maintenance Revenue
International maintenance revenue was $462.3 million, or 45.2%, $462.3 million, or 45.4%, and $442.2 million, or 45.7%, of our total maintenance revenue for fiscal 2010, 2009 and 2008, respectively.
International maintenance revenue in fiscal 2010 was flat with fiscal 2009, due to a $3.5 million increase in ESM maintenance revenue, offset by a $3.5 million decrease in MSM maintenance revenue. The ESM maintenance revenue increase was attributable to increases of $2.2 million and $1.3 million in our Asia Pacific and Canada markets, respectively. The MSM maintenance revenue decrease was attributable to a $9.1 million decrease in our EMEA market, partially offset by an increase of $3.2 million in our Latin America market and a $2.4 million combined net increase in our other international markets.
International maintenance revenue in fiscal 2009 increased by $20.1 million, or 4.5%, over fiscal 2008, due to a $10.2 million increase in ESM maintenance revenue, including incremental ESM maintenance revenue of $3.2 million resulting from our acquisition of BladeLogic, and a $9.9 million increase in MSM maintenance revenue. The ESM maintenance revenue increase was attributable primarily to increases of $9.2 million and $1.1 million in our EMEA and Asia Pacific markets, respectively. The MSM maintenance revenue increase was attributable to increases of $7.1 million and $4.5 million in our EMEA and Latin American markets, respectively, partially offset by a $1.7 million net decrease in our other international markets.
Professional Services Revenue
Professional services revenue in fiscal 2010 decreased by $15.3 million, or 10.6%, from fiscal 2009, which is reflective of a $3.0 million, or 4.8%, decrease in domestic professional services revenue and a $12.3 million, or 15.1%, decrease in international professional services revenue. These decreases were attributable to decreases in implementation, consulting and education services revenue period over period.
Professional services revenue in fiscal 2009 increased by $28.1 million, or 24.2%, over fiscal 2008, which is reflective of a $15.7 million, or 33.3%, increase in domestic professional services revenue and a $12.4 million, or 17.9%, increase in international professional services revenue. These increases were attributable to increases in implementation and consulting services, principally related to growth in BSM solution sales and inclusive of incremental professional services revenue resulting from our acquisition of BladeLogic in fiscal 2009.
31
Table of Contents
Operating Expenses
| Percentage Change | |||||||||||||||
| Year Ended March 31, | 2010 Compared to 2009 |
2009 Compared to 2008 |
|||||||||||||
| 2010 | 2009 | 2008 | |||||||||||||
| (In millions) | |||||||||||||||
| Cost of license revenue |
$ | 115.5 | $ | 117.1 | $ | 100.4 | (1.4 | )% | 16.6 | % | |||||
| Cost of maintenance revenue |
158.3 | 166.3 | 168.9 | (4.8 | )% | (1.5 | )% | ||||||||
| Cost of professional services revenue |
137.4 | 141.6 | 125.1 | (3.0 | )% | 13.2 | % | ||||||||
| Selling and marketing expenses |
556.2 | 541.5 | 527.4 | 2.7 | % | 2.7 | % | ||||||||
| Research and development expenses |
195.6 | 222.0 | 209.4 | (11.9 | )% | 6.0 | % | ||||||||
| General and administrative expenses |
206.4 | 197.7 | 209.4 | 4.4 | % | (5.6 | )% | ||||||||
| In-process research and development |
— | 50.3 | 4.0 | (100.0 | )% | * | |||||||||
| Amortization of intangible assets |
32.7 | 34.1 | 14.8 | (4.1 | )% | 130.4 | % | ||||||||
| Severance, exit costs and related charges |
3.0 | 33.5 | 14.7 | (91.0 | )% | 127.9 | % | ||||||||
| Total operating expenses |
$ | 1,405.1 | $ | 1,504.1 | $ | 1,374.1 | (6.6 | )% | 9.5 | % | |||||
| * | not meaningful |
We estimate that the effect of foreign currency exchange rate fluctuations on our international operating expenses resulted in an approximate $5.4 million reduction in fiscal 2010 operating expenses as compared to fiscal 2009 and an approximate $28.0 million reduction in fiscal 2009 operating expenses as compared to fiscal 2008, on a constant currency basis.
Cost of License Revenue
Cost of license revenue consists primarily of the amortization of capitalized software costs for internally developed products, the amortization of acquired technology for products acquired through business combinations, license-based royalties to third parties and production and distribution costs for initial product licenses. For fiscal 2010, 2009 and 2008, cost of license revenue was $115.5 million, or 6.0%, $117.1 million, or 6.3%, and $100.4 million, or 5.8%, of total revenue, respectively, and 15.2%, 16.5% and 15.5% of license revenue, respectively.
Cost of license revenue in fiscal 2010 decreased by $1.6 million, or 1.4%, from fiscal 2009. This decrease was attributable primarily due to the reduction in amortization of acquired technology in connection with earlier acquisitions that became fully amortized, partially offset by an increase in amortization of acquired technology in connection with fiscal 2009 and fiscal 2010 acquisitions.
Cost of license revenue in fiscal 2009 increased by $16.7 million, or 16.6%, over fiscal 2008. This increase was attributable primarily to a $16.9 million increase in the amortization of acquired technology related to fiscal 2008 and 2009 acquisitions.
Cost of Maintenance Revenue
Cost of maintenance revenue consists primarily of the costs associated with customer support and research and development personnel that provide maintenance, enhancement and support services to our customers. For fiscal 2010, 2009 and 2008, cost of maintenance revenue was $158.3 million, or 8.3%, $166.3 million, or 8.9%, and $168.9 million, or 9.8%, of total revenue, respectively, and 15.5%, 16.3% and 17.5% of maintenance revenue, respectively.
Cost of maintenance revenue in fiscal 2010 decreased by $8.0 million, or 4.8%, from fiscal 2009. This decrease was attributable to a $2.9 million reduction in personnel and related costs, including third party subcontracting fees, and a $1.3 million decrease in facility cost allocations, both associated with a decrease in
32
Table of Contents
resources dedicated to maintenance projects and a year over year decrease in customer support headcount, a $1.4 million decrease in share-based compensation expense and a net $2.4 million decrease in other expenses.
Cost of maintenance revenue in fiscal 2009 decreased by $2.6 million, or 1.5%, from fiscal 2008. This decrease was attributable to a $1.8 million decrease in third party outsourcing costs and a $0.8 million net decrease in other expenses.
Cost of Professional Services Revenue
Cost of professional services revenue consists primarily of salaries, related personnel costs and third party fees associated with implementation, integration and education services that we provide to our customers and the related infrastructure to support this business. For fiscal 2010, 2009 and 2008, cost of professional services revenue was $137.4 million, or 7.2%, $141.6 million, or 7.6%, and $125.1 million, or 7.2%, of total revenue, respectively, and 106.4%, 98.1% and 107.6% of professional services revenue, respectively.
Cost of professional services revenue in fiscal 2010 decreased by $4.2 million, or 3.0%, from fiscal 2009. This decrease was attributable primarily to a $9.8 million decrease in third party subcontracting fees, offset by a $5.8 million increase in professional services enablement personnel costs.
Cost of professional services revenue in fiscal 2009 increased by $16.5 million, or 13.2%, over fiscal 2008. This increase was attributable primarily to a $10.1 million increase in professional services enablement personnel costs, a $3.5 million increase in third party subcontracting fees and a $2.1 million increase in share-based compensation expense. The increases in personnel and third party costs were associated primarily with a larger volume of BSM implementations, including incremental costs associated with our acquisition of BladeLogic.
Selling and Marketing Expenses
Selling and marketing expenses consist primarily of salaries, related personnel costs, sales commissions and costs associated with advertising, marketing, industry trade shows and sales seminars. For fiscal 2010, 2009 and 2008, selling and marketing expenses were $556.2 million, or 29.1%, $541.5 million, or 28.9%, and $527.4 million, or 30.5%, of total revenue, respectively.
Selling and marketing expenses in fiscal 2010 increased by $14.7 million, or 2.7%, over fiscal 2009. This increase was attributable to a $17.8 million increase in sales personnel costs, primarily due to an increase in variable compensation expense attributable to increased revenue as well as an increase in sales personnel headcount, and a $2.8 million increase in share-based compensation expense, partially offset by a $5.0 million decrease in marketing campaign expenditures and a net $0.9 million decrease in other expenses.
Selling and marketing expenses in fiscal 2009 increased by $14.1 million, or 2.7%, over fiscal 2008. This increase was attributable to a $13.1 million increase in sales personnel costs, primarily due to an increase in variable compensation expense attributable to increased revenue and to our acquisition of BladeLogic, and a $6.9 million increase in share-based compensation expense, partially offset by a $5.9 million decrease in marketing campaign expenditures.
Research and Development Expenses
Research and development expenses consist primarily of salaries and personnel costs related to software developers and development support personnel, including software programmers, testing and quality assurance personnel and writers of technical documentation, such as product manuals and installation guides. These expenses also include computer hardware and software costs, telecommunications costs and personnel costs associated with our development and production labs. For fiscal 2010, 2009 and 2008, research and development expenses were $195.6 million, or 10.2%, $222.0 million, or 11.9%, and $209.4 million, or 12.1%, of total revenue, respectively.
33
Table of Contents
Research and development expenses in fiscal 2010 decreased by $26.4 million, or 11.9%, from fiscal 2009. This decrease was attributable to a $13.4 million increase in research and development costs allocated to software development projects that were capitalized, a $6.3 million decrease in research and development personnel and related costs, including third party subcontracting fees, and a $5.2 million decrease in facility cost allocations, both associated primarily with lower average headcount levels and a higher percentage of headcount in lower cost regions, and a $2.8 million decrease in share-based compensation expense, partially offset by a net increase of $1.3 million in other expenses.
Research and development expenses in fiscal 2009 increased by $12.6 million, or 6.0%, over fiscal 2008. This increase was attributable primarily to a $9.6 million increase in research and development personnel and related costs, resulting principally from our acquisition of BladeLogic, and a $2.5 million increase in share-based compensation expense.
General and Administrative Expenses
General and administrative expenses consist primarily of salaries and related personnel costs of executive management, finance and accounting, facilities management, legal and human resources. Other costs included in general and administrative expenses include fees paid for outside accounting and legal services, consulting projects and insurance. During fiscal 2010, 2009 and 2008, general and administrative expenses were $206.4 million, or 10.8%, $197.7 million, or 10.6%, and $209.4 million, or 12.1%, of total revenue, respectively.
General and administrative expenses in fiscal 2010 increased by $8.7 million, or 4.4%, over fiscal 2009. This increase was attributable to a $6.7 million increase in share-based compensation expense and a $2.0 million net increase in other expenses.
General and administrative expenses in fiscal 2009 decreased by $11.7 million, or 5.6%, from fiscal 2008. This decrease was attributable to a $10.8 million decrease in personnel and related costs and a $4.9 million decrease in professional services and consulting fees, partially offset by a $2.1 million increase in share-based compensation expense and a $1.9 million net increase in other expenses.
In-Process Research and Development
The amounts allocated to in-process research and development (IPR&D) represent the estimated fair values, based on risk-adjusted cash flows and historical costs expended, related to acquired core research and development projects that were incomplete and had neither reached technological feasibility nor been determined to have an alternative future use pending achievement of technological feasibility at the date of acquisition. During fiscal 2009, we expensed acquired IPR&D totaling $50.3 million in connection with our acquisition of BladeLogic. During fiscal 2008, we expensed IPR&D totaling $4.0 million in connection with our fiscal 2008 business acquisitions. Beginning in fiscal 2010, under the new accounting guidance for business combinations, acquired IPR&D is no longer immediately expensed upon acquisition, but rather is capitalized as an indefinite-lived intangible asset and evaluated for impairment during the development period.
Amortization of Intangible Assets
Amortization of intangible assets consists primarily of the amortization of finite-lived acquired technology and customer relationships in connection with acquisitions consummated in current and prior years. Amortization of intangible assets in fiscal 2010 decreased by $1.4 million, or 4.1%, from fiscal 2009. This decrease was attributable to a $4.5 million reduction in amortization associated with intangible assets acquired in connection with earlier acquisitions that became fully amortized, partially offset by $3.1 million in additional amortization associated with intangible assets acquired in connection with our fiscal 2010 and 2009 acquisitions. Amortization of intangible assets in fiscal 2009 increased by $19.3 million, or 130.4%, over fiscal 2008. This increase was attributable to $27.7 million in additional amortization associated with intangible assets acquired in connection
34
Table of Contents
with our fiscal 2009 and 2008 acquisitions, partially offset by an $8.4 million reduction in amortization associated with intangible assets acquired in connection with earlier acquisitions that became fully amortized.
Severance, Exit Costs and Related Charges
We have undertaken various restructuring and process improvement initiatives in recent years through the realignment of resources to focus on growth areas and the simplification, standardization and automation of key business processes. Additionally, we undertook general workforce reductions in fiscal 2009 and 2010, principally as a result of macroeconomic conditions. Related to these collective actions, we recorded charges of $3.0 million, $33.5 million, and $14.7 million in fiscal 2010, 2009 and 2008, respectively. These expenses were attributable primarily to identified workforce reductions and associated cash separation packages paid or accrued by us. While we will reduce future operating expenses as a result of these actions, we anticipate that these reductions will be substantially offset by incremental personnel-related expenses due to headcount growth in strategic areas. We will continue to evaluate additional actions that may be necessary in the future to achieve our business goals.
Other Income (Loss), Net
Other income (loss), net, consists primarily of interest earned, realized gains and losses on investments and interest expense on our Notes and capital leases.
Other income (loss), net, for fiscal 2010 and 2009 was a loss of $1.9 million and $3.9 million, respectively. This change was attributable primarily to an increase of $9.8 million related to gains on investments in our deferred compensation program and the non-recurrence of $8.4 million in charges related to the write-down of certain non-marketable equity investments in the prior year period, principally offset by a $15.0 million decrease in interest income resulting from lower average investment yields on a slightly higher average investment balance.
Other income (loss), net, for fiscal 2009 and 2008 was a loss of $3.9 million and income of $76.9 million, respectively. This change was attributable to a $42.1 million decrease in interest income, resulting from lower average investment yields on lower average investment balances, a $15.9 million increase in interest expense related to our Notes issued in fiscal 2009, $8.4 million in charges related to the write-down of certain non-marketable equity investments, a $7.8 million increase in losses related to investments in our deferred compensation program, $5.3 million of expense from the impact of foreign currency exchange rates and a $1.3 million net decrease in other items.
Provision for Income Taxes
We recorded income tax expense of $98.1 million, $125.8 million and $120.8 million in fiscal 2010, 2009 and 2008, respectively, resulting in an effective tax rate of 19.5%, 34.6% and 27.8%, respectively. The effective tax rate is impacted primarily by the worldwide mix of consolidated earnings before taxes and our policy of indefinitely re-investing earnings from certain low tax jurisdictions, additional accruals and changes in estimates related to our uncertain tax positions, benefits associated with income attributable to both domestic production activities and the extraterritorial income exclusion and prior to fiscal 2010, the non-deductible write-off of IPR&D expense associated with certain acquisitions. During fiscal 2010, we recorded a net tax benefit of approximately $30.0 million associated with a settlement with the IRS related to prior year tax matters, resulting in a decrease in the effective tax rate in fiscal 2010 compared to fiscal 2009. The effective tax rate in fiscal 2009 increased by 6.6% over fiscal 2008 as a result of our $50.3 million write-off of IPR&D expense in connection with the BladeLogic acquisition, which was not deductible for tax purposes.
Non-GAAP Financial Measures and Reconciliations
In an effort to provide investors with additional information regarding our results as determined by GAAP, we disclose various non-GAAP financial measures in our quarterly earnings press releases and other public disclosures. The primary non-GAAP financial measures we focus on are: (i) non-GAAP operating income, (ii) non-GAAP net earnings, and (iii) non-GAAP diluted earnings per share. Each of these financial measures
35
Table of Contents
excludes the impact of certain items and therefore has not been calculated in accordance with GAAP. These non-GAAP financial measures exclude share-based compensation expense; the amortization of intangible assets; charges related to IPR&D; severance, exit costs and related charges; as well as the related tax impacts of these items; and the impact of certain discrete tax items. Each of the non-GAAP adjustments is described in more detail below. A reconciliation of each of these non-GAAP financial measures to its most comparable GAAP financial measure is also included below.
We believe that these non-GAAP financial measures provide meaningful supplemental information regarding our operating results because they exclude amounts that BMC management and the Board of Directors do not consider part of operating results when assessing the performance of the organization and measuring the results of the Company’s performance. We believe that inclusion of these non-GAAP financial measures provides consistency and comparability with past reports of financial results. BMC management and the Board of Directors use these non-GAAP financial measures to evaluate the Company’s performance and for forecasting purposes, as well as the allocation of future capital investments, and they are key variables in determining management incentive compensation. Accordingly, we believe these non-GAAP financial measures are useful to investors in allowing for greater transparency of supplemental information used by management in its financial and operational decision-making.
While we believe that these non-GAAP financial measures provide useful supplemental information, there are limitations associated with the use of these non-GAAP financial measures. These non-GAAP financial measures are not prepared in accordance with GAAP, do not reflect a comprehensive system of accounting and may not be completely comparable to similarly titled measures of other companies due to potential differences in the exact method of calculation between companies. Items such as share-based compensation expense; the amortization of intangible assets; charges related to IPR&D; severance, exit costs and related charges and certain discrete tax items that are excluded from our non-GAAP financial measures can have a material impact on net earnings. As a result, these non-GAAP financial measures have limitations and should not be considered in isolation from, or as a substitute for, net earnings, cash flow from operations or other measures of performance prepared in accordance with GAAP. We compensate for these limitations by using these non-GAAP financial measures as supplements to GAAP financial measures and by reviewing the reconciliations of the non-GAAP financial measures to their most comparable GAAP financial measure. Investors are encouraged to review the reconciliations of these non-GAAP financial measures to their most comparable GAAP financial measures below.
For a detailed explanation of the adjustments made to comparable GAAP financial measures, the reasons why management uses these measures and the usefulness of these measures, see items (1) – (6) below.
| Year Ended March 31, | |||||||||
| 2010 | 2009 | 2008 | |||||||
| (In millions) | |||||||||
| Operating income: |
|||||||||
| GAAP operating income |
$ | 506.1 | $ | 367.8 | $ | 357.5 | |||
| Share-based compensation expense(1) |
88.9 | 82.0 | 66.6 | ||||||
| Amortization of intangible assets(2) |
76.5 | 78.7 | 42.4 | ||||||
| Severance, exit costs and related charges(3) |
3.0 | 33.5 | 14.7 | ||||||
| In-process research and development(4) |
— | 50.3 | 4.0 | ||||||
| Non-GAAP operating income |
$ | 674.5 | $ | 612.3 | $ | 485.2 | |||
36
Table of Contents
| Year Ended March 31, | ||||||||||||
| 2010 | 2009 | 2008 | ||||||||||
| (In millions) | ||||||||||||
| Net earnings: |
||||||||||||
| GAAP net earnings |
$ | 406.1 | $ | 238.1 | $ | 313.6 | ||||||
| Share-based compensation expense(1) |
88.9 | 82.0 | 66.6 | |||||||||
| Amortization of intangible assets(2) |
76.5 | 78.7 | 42.4 | |||||||||
| Severance, exit costs and related charges(3) |
3.0 | 33.5 | 14.7 | |||||||||
| In-process research and development(4) |
— | 50.3 | 4.0 | |||||||||
| Provision for income taxes on above pre-tax non-GAAP adjustments(5) |
(48.5 | ) | (58.2 | ) | (41.8 | ) | ||||||
| Certain discrete tax items(6) |
(30.0 | ) | 6.8 | — | ||||||||
| Non-GAAP net earnings |
$ | 496.0 | $ | 431.2 | $ | 399.5 | ||||||
| Year Ended March 31, | ||||||||||||
| 2010 | 2009 | 2008 | ||||||||||
| Diluted earnings per share*: |
||||||||||||
| GAAP diluted earnings per share |
$ | 2.17 | $ | 1.25 | $ | 1.57 | ||||||
| Share-based compensation expense(1) |
0.48 | 0.43 | 0.33 | |||||||||
| Amortization of intangible assets(2) |
0.41 | 0.41 | 0.21 | |||||||||
| Severance, exit costs and related charges(3) |
0.02 | 0.18 | 0.07 | |||||||||
| In-process research and development(4) |
— | 0.26 | 0.02 | |||||||||
| Provision for income taxes on above pre-tax non-GAAP adjustments(5) |
(0.26 | ) | (0.31 | ) | (0.21 | ) | ||||||
| Certain discrete tax items(6) |
(0.16 | ) | 0.04 | — | ||||||||
| Non-GAAP diluted earnings per share* |
$ | 2.66 | $ | 2.27 | $ | 2.00 | ||||||
| * | Non-GAAP diluted earnings per share is computed independently for each period presented. The sum of GAAP diluted earnings per share and non-GAAP adjustments per share may not equal non-GAAP diluted earnings per share due to rounding differences. |
| (1) | Share-based compensation expense. Our non-GAAP financial measures exclude the compensation expenses required to be recorded by GAAP for equity awards to employees and directors. Management and the Board of Directors believe it is useful in evaluating the Company’s and our management teams’ and business units’ performance during a particular time period to review the supplemental non-GAAP financial measures, which exclude expenses related to share-based compensation, because these costs are generally fixed at the time an award is granted, are then expensed over several years and generally cannot be changed or influenced by management once granted. Accordingly, our operational managers are evaluated based on the operating expenses exclusive of share-based compensation expenses and including such charges would hamper investors’ ability to evaluate the performance of our management in the manner in which management evaluates performance. Accordingly, management and the Board of Directors do not consider these costs for purposes of evaluating the performance of the business, and they exclude such costs when evaluating the performance of the Company, our business units and management teams, including the determination of management incentive compensation, and when making decisions to allocate resources among business units. |
| (2) | Amortization of intangible assets. Our non-GAAP financial measures exclude costs associated with the amortization of intangible assets, which are included in cost of license revenue and amortization of intangible assets in our consolidated statements of operations. Management and the Board of Directors believe it is useful in evaluating the Company’s and our management teams’ and business units’ performance during a particular time period to review the supplemental non-GAAP financial measures, which exclude amortization of intangible assets, because these costs are fixed at the time of an acquisition, are then amortized over a period of several years after the acquisition and generally cannot be changed or influenced by management after the acquisition. Accordingly, management and the Board of Directors do |
37
Table of Contents
| not consider these costs for purposes of evaluating the performance of the business during the applicable time period after the acquisition, and they exclude such costs when evaluating the performance of the Company, our business units and management teams, including the determination of management incentive compensation, and when making decisions to allocate resources among business units. |
| (3) | Severance, exit costs and related charges. Our non-GAAP financial measures exclude severance, exit costs and related charges, primarily consisting of severance costs associated with position eliminations and lease abandonment costs, and any subsequent changes in estimates. Management and the Board of Directors believe it is useful, when evaluating corporate and business unit performance during a particular time period, to review financial measures excluding these restructuring costs because corporate management is also evaluated, and various corporate resource allocation decisions are made, based on operating expenses exclusive of such charges. We believe that the inclusion of such charges would hinder investors’ ability to evaluate the performance of our business in the manner in which management evaluates corporate performance, and thus such charges are excluded from our non-GAAP financial measures. |
| (4) | In-process research and development. Our non-GAAP financial measures exclude IPR&D charges recorded in prior year periods. These amounts represent the estimated fair value of core research and development projects that were incomplete as of the respective dates of acquisition and had neither reached technological feasibility nor been determined to have alternative future uses pending achievement of technological feasibility upon further development. Such amounts were required to be expensed by us as of the date of the respective acquisition under the accounting rules in place in prior years. Because the costs are fixed at the time of acquisition and are not subject to management influence, management does not consider these costs in evaluating the performance of the Company, our business units and management teams, including the determination of management incentive compensation, nor when it allocates resources among the business units. We believe excluding these items is useful to investors because it facilitates comparisons to our historical operating results without being affected by our acquisition history and the results of other companies in our industry, which have their own unique acquisition histories. |
| (5) | Provision for income taxes on above pre-tax non-GAAP adjustments. Our non-GAAP financial measures exclude the tax impact of the above pre-tax non-GAAP adjustments. This amount is calculated using the tax rates of each country to which these pre-tax non-GAAP adjustments relate. Management excludes the non-GAAP measures on a net-of-tax basis in evaluating our performance. Therefore, we exclude the tax impact of these charges when presenting non-GAAP financial measures. |
| (6) | Certain discrete tax items. Our non-GAAP financial measures exclude: (i) in fiscal 2010, a $30.0 million net tax benefit associated with an IRS settlement related to prior year tax matters, and (ii) in fiscal 2009, $6.8 million of tax expense associated with an intercompany transfer of IPR&D in connection with the acquisition of BladeLogic. Management excludes the impact of these items when evaluating the performance of the Company, our business units and management teams, including the determination of management incentive compensation, and when making decisions to allocate resources. Therefore, we exclude these items when presenting non-GAAP financial measures. |
Liquidity and Capital Resources
At March 31, 2010, we had $1.5 billion in cash, cash equivalents and investments, approximately 42% of which was held by our international subsidiaries and was largely generated from our international operations. Our international operations have generated $318.6 million of earnings that we have determined will be invested indefinitely in those operations. Were such earnings to be repatriated, we would incur a United States federal income tax liability that is not currently accrued in our financial statements. We also had outstanding letters of credit, performance bonds and similar instruments related to various customer, facilities and other obligations at March 31, 2010 of approximately $43.6 million.
38
Table of Contents
At March 31, 2010, we held auction rate securities with a par value of $67.3 million, of which securities with a par value of $50.7 million were classified as available-for-sale and a par value of $16.6 million were classified as trading. The total estimated fair value was $60.5 million and $60.0 million at March 31, 2010 and 2009, respectively. Our auction rate securities consist entirely of bonds issued by public agencies that are backed by student loans with at least a 97% guarantee by the federal government under the United States Department of Education’s Federal Family Education Loan Program. All of these bonds are currently rated investment grade by Moody’s or Standard and Poor’s. Auctions for these securities began failing in early 2008 and have continued to fail, resulting in our continuing to hold such securities and the issuers paying interest at the maximum contractual rates. We do not believe that any of the underlying issuers of these auction rate securities are presently at risk or that the underlying credit quality of the assets backing the auction rate security investments has been impacted by the reduced liquidity of these investments. Based on our current ability to access cash and other short-term investments, our expected operating cash flows, and other sources of cash that we expect to be available, we do not anticipate the recent lack of liquidity of these investments to have a material impact on our business strategy, financial condition, results of operations or cash flows. Additionally, in November 2008, we entered into a put agreement with a bank from which we have acquired certain auction rate securities with a remaining par value of $16.6 million and an estimated fair value of $15.5 million at March 31, 2010. Under the terms of the agreement, we have the ability to put these auction rate securities to the bank at par value at any time during the period beginning June 30, 2010 and ending June 30, 2012. The bank also has the right to repurchase these auction rate securities at par value on or before June 30, 2010.
We believe that our existing cash and investment balances and funds generated from operating activities will be sufficient to meet our working and other capital requirements for the foreseeable future. In the normal course of business, we evaluate the merits of acquiring technology or businesses, or establishing strategic relationships with or investing in these businesses. We may elect to use available cash and investments to fund such activities in the future. In the event additional needs for cash arise, we might find it advantageous to utilize third party financing sources based on factors such as our then available cash and its source (i.e., cash held in the United States versus international locations), the cost of financing and our internal cost of capital.
We may from time to time seek to repurchase or retire securities, including outstanding borrowings and equity securities, in open market repurchases, unsolicited or solicited privately negotiated transactions or in such other manner as will comply with the provisions of the Securities Exchange Act of 1934 and the rules and regulations thereunder. Such repurchases or exchanges, if any, will depend on a number of factors, including, but not limited to, prevailing market conditions, our liquidity requirements and contractual restrictions, if applicable. The amount of repurchases, which is subject to management discretion, may be material and may change from period to period.
Our cash flows during fiscal 2010, 2009 and 2008 were:
| Year Ended March 31, | ||||||||||||
| 2010 | 2009 | 2008 | ||||||||||
| (In millions) | ||||||||||||
| Net cash provided by operating activities |
$ | 635.4 | $ | 579.7 | $ | 593.7 | ||||||
| Net cash provided by (used in) investing activities |
(159.3 | ) | (851.9 | ) | 221.4 | |||||||
| Net cash provided by (used in) financing activities |
(158.7 | ) | 57.4 | (438.2 | ) | |||||||
| Effect of exchange rate changes on cash and cash equivalents |
27.9 | (50.2 | ) | 27.9 | ||||||||
| Net increase (decrease) in cash and cash equivalents |
$ | 345.3 | $ | (265.0 | ) | $ | 404.8 | |||||
Cash Flows from Operating Activities
Our primary method for funding operations and growth has been through cash flows generated from operating activities. Net cash provided by operating activities in fiscal 2010 increased by $55.7 million from fiscal 2009, attributable primarily to an increase in net earnings before non-cash expenses (principally depreciation,
39
Table of Contents
amortization, share-based compensation expense and IPR&D), partially offset by the net impact of working capital changes. Net cash provided by operating activities in fiscal 2009 decreased by $14.0 million from fiscal 2008, attributable primarily to a net reduction in cash receipts on our receivables, offset by a net increase in net earnings before non-cash expenses (principally depreciation, amortization, share-based compensation expense and IPR&D) and other working capital changes.
Cash Flows from Investing Activities
Net cash used in investing activities in fiscal 2010 decreased by $692.6 million from fiscal 2009. This decrease was attributable primarily to cash expended in the prior year period for our acquisition of BladeLogic and a year over year increase in proceeds from maturities and sales of investments, partially offset by a year over year increase in investment purchases. Net cash used in investing activities was $851.9 million in fiscal 2009, as compared to net cash provided by investing activities of $221.4 million in fiscal 2008. This difference was attributable primarily to cash expended in fiscal 2009 for our acquisition of BladeLogic and a year over year decrease in proceeds from maturities and sales of investments, partially offset by year over year decreases in investment purchases and purchases of property and equipment.
Cash Flows from Financing Activities
Net cash used in financing activities in fiscal 2010 was $158.7 million as compared to net cash provided by financing activities of $57.4 million in fiscal 2009. This difference was attributable primarily to a net decrease in proceeds from borrowings related primarily to the issuance of our Notes in the prior year period, partially offset by a year over year decrease in treasury stock purchases. Net cash provided by financing activities was $57.4 million in fiscal 2009, as compared to net cash used in financing activities of $438.2 million in fiscal 2008. This difference was attributable primarily to net proceeds received related to the issuance of our Notes in fiscal 2009 and a year over year decrease in treasury stock purchases, partially offset by a decrease in proceeds from stock option exercises, an increase in stock repurchases to satisfy withholding obligations and an increase in payments under borrowing and capital lease obligations.
Finance Receivables
We provide financing on a portion of our sales transactions to customers that meet our specified standards of creditworthiness. Our practice of providing financing at reasonable market interest rates enhances our competitive position. We participate in established programs with third party financial institutions and sell a significant portion of our finance receivables to such institutions on a non-recourse basis, enabling us to collect cash sooner and fully transfer credit risk of customer default to third party financial institutions. We record transfers of finance receivables to third party financial institutions as sales of such finance receivables when we have surrendered control of such receivables (including determining that such assets have been isolated beyond our reach and the reach of our creditors) and when we do not have significant continuing involvement in the generation of cash flows due the financial institutions. During fiscal 2010, 2009 and 2008, we transferred $208.8 million, $149.7 million and $267.5 million, respectively, of such receivables through these programs.
Treasury Stock Purchased
Our Board of Directors had previously authorized a total of $3.0 billion to repurchase common stock. During fiscal 2010, we purchased 7.5 million shares for $275.1 million. From the inception of the stock repurchase authorization through March 31, 2010, we have purchased 122.3 million shares for $2.9 billion. At March 31, 2010, there was $69.8 million remaining in the stock repurchase program, which does not have an expiration date. In April 2010, our Board of Directors authorized an additional $1.0 billion to repurchase stock. In addition, during fiscal 2010 we repurchased 0.4 million shares for $13.0 million to satisfy employee tax withholding obligations upon the lapse of restrictions on nonvested stock grants. The repurchase of stock will continue to be funded primarily with cash generated from domestic operations and, therefore, affects our overall domestic versus international liquidity balances.
40
Table of Contents
See Item 5. Market for Registrant’s Common Equity, Related Stockholder Matters and Issuer Purchases of Equity Securities above for a monthly detail of treasury stock purchases for the quarter ended March 31, 2010.
Contractual Obligations
The following is a summary of our contractual obligations at March 31, 2010:
| Payments Due by Period | |||||||||||||||
| Less Than 1 Year |
1-3 Years | 3-5 Years | After 5 Years |
Total | |||||||||||
| (In millions) | |||||||||||||||
| Senior unsecured notes(1) |
$ | 21.8 | $ | 43.5 | $ | 43.5 | $ | 368.8 | $ | 477.6 | |||||
| Capital lease obligations(1) |
8.3 | 6.0 | 1.9 | — | 16.2 | ||||||||||
| Operating lease obligations |
39.2 | 56.5 | 32.5 | 14.0 | 142.2 | ||||||||||
| Purchase obligations(2) |
14.4 | 8.8 | 0.1 | — | 23.3 | ||||||||||
| Other long-term liabilities reflected on the balance sheet(1) |
15.5 | 25.8 | 12.2 | — | 53.5 | ||||||||||
| Total contractual obligations(3)(4) |
$ | 99.2 | $ | 140.6 | $ | 90.2 | $ | 382.8 | $ | 712.8 | |||||
| (1) | Represents contractual amounts due, including interest. |
| (2) | Represents obligations under agreements with non-cancelable terms to purchase goods or services. The agreements are enforceable and legally binding, and contain specific terms, including quantities to be purchased and the timing of the purchase. |
| (3) | Total does not include contractual obligations recorded on the balance sheet as current liabilities, other than capital lease obligations and other long-term liabilities above. |
| (4) | We are unable to make a reasonably reliable estimate as to when cash settlement with taxing authorities will occur for our unrecognized tax benefits due to the uncertainties related to these tax matters. Therefore, our liability for unrecognized tax benefits of $144.1 million, including interest and penalties, is not included in the table above. |
Critical Accounting Policies and Estimates
The preparation of our consolidated financial statements requires us to make estimates and judgments that affect the reported amounts of assets, liabilities, revenue and expenses. On an on-going basis, we make and evaluate estimates and judgments, including those related to revenue recognition, capitalized software development costs, share-based compensation, goodwill and intangible assets, valuation of investments and accounting for income taxes. We base our estimates on historical experience and various other assumptions that are believed to be reasonable under the circumstances; the results of which form the basis for making judgments about amounts and timing of revenue and expenses, the carrying values of assets and the recorded amounts of liabilities that are not readily apparent from other sources. Actual results may differ from these estimates and such estimates may change if the underlying conditions or assumptions change. We have discussed the development and selection of the critical accounting policies with the Audit Committee of our Board of Directors, and the Audit Committee has reviewed the related disclosures below.
Revenue Recognition
Software license revenue is recognized when persuasive evidence of an arrangement exists, delivery of the product has occurred, the fee is fixed or determinable, collection is probable and vendor-specific objective evidence (VSOE) of the fair value of undelivered elements exists. As substantially all of our software licenses are sold in multiple-element arrangements that include either maintenance or both maintenance and professional services, we use the residual method to determine the amount of license revenue to be recognized. Under the residual method, consideration is allocated to undelivered elements based upon VSOE of the fair value of those elements, with the residual of the arrangement fee allocated to and recognized as license revenue. We have
41
Table of Contents
established VSOE of the fair value of maintenance through independent maintenance renewals as well as, for certain new product offerings, management approved maintenance pricing which is evidenced by contractually stated maintenance renewal rates. These demonstrate a consistent relationship of pricing maintenance as a percentage of either the net license fee or the discounted or undiscounted license list price. VSOE of the fair value of professional services is established based on daily rates when sold on a stand-alone basis.
We are unable to establish VSOE of fair value for all undelivered elements in certain arrangements that include multiple software products for which the associated maintenance pricing is based on a combination of undiscounted license list prices, net license fees or discounted license list prices. We are also unable to establish VSOE of fair value for all undelivered elements in certain arrangements that include unlimited licensing rights and certain arrangements that contain rights to future unspecified software products as part of the maintenance offering. If VSOE of fair value of one or more undelivered elements does not exist, license revenue is deferred and recognized upon delivery of those elements or when VSOE of fair value exists for all remaining undelivered elements, or if the deferral is due to the factors described above, license revenue is recognized ratably over the longest expected delivery period of undelivered elements in the arrangement, which is typically the longest maintenance term.
In our time-based license agreements, we are unable to establish VSOE of fair value for undelivered maintenance elements because the contractual maintenance terms in these arrangements are the same duration as the license terms and VSOE of fair value of maintenance cannot be established. Accordingly, license fees in time-based license arrangements are recognized ratably over the term of the arrangements.
Maintenance revenue is recognized ratably over the terms of the maintenance arrangements, which primarily range from one to three years.
Professional services revenue, which principally relates to implementation, integration and training services associated with our products, is derived under both time-and-material and fixed fee arrangements and in most instances is recognized on a proportional performance basis. If no discernable customer deliverable exists until the completion of the professional services, we apply the completed performance method and defer the recognition of professional services revenue until completion of the services, which is typically evidenced by a signed completion letter from the customer. Services that are sold in connection with software license arrangements generally qualify for separate accounting from the license elements because they do not involve significant production, modification or customization of our products and are not otherwise considered to be essential to the functionality of such products. In arrangements where the professional services do not qualify for separate accounting from the license elements, the combined software license and professional services revenue are recognized based on contract accounting using either the percentage-of-completion or completed-contract method.
We also execute arrangements through resellers, distributors and systems integrators (collectively, channel partners) in which the channel partners act as the principals in the transactions with the end users of our products and services. In license arrangements with channel partners, title and risk of loss pass to the channel partners upon execution of our arrangements with them and the delivery of our products to the channel partner. We recognize revenue from transactions with channel partners on a net basis (the amount actually received by us from the channel partners) when all other revenue recognition criteria are satisfied. We do not offer right of return, product rotation or price protection to any of our channel partners.
Revenue from license and maintenance transactions that are financed are generally recognized in the same manner as those requiring current payment, as we have a history of offering installment contracts to customers and successfully enforcing original payment terms without making concessions. In arrangements where the fees are not considered to be fixed or determinable, we recognize revenue when payments become due under the arrangement. If we determine that a transaction is not probable of collection or a risk of concession exists, we do not recognize revenue in excess of the amount of cash received.
42
Table of Contents
We are required to charge certain taxes on our revenue transactions. These amounts are not included in revenue. Instead, we record a liability when the amounts are collected and relieve the liability when payments are made to the applicable government agency.
In our consolidated statements of operations, revenue is categorized as license, maintenance and professional services revenue. We allocate revenue from arrangements containing multiple elements to each of these categories based on the VSOE of fair value for elements in each revenue arrangement and the application of the residual method for arrangements in which we have established VSOE of fair value for all undelivered elements. In arrangements where we are not able to establish VSOE of fair value for all undelivered elements, we first allocate revenue to any undelivered elements for which VSOE of fair value has been established, then allocate revenue to any undelivered elements for which VSOE of fair value has not been established based upon management’s best estimate of fair value of those undelivered elements and apply a residual method to determine the license fee. Management’s best estimate of fair value of undelivered elements for which VSOE of fair value has not been established is based upon the VSOE of similar offerings and other objective criteria.
Capitalized Software Development Costs
Costs of internally developed software are expensed until the technological feasibility of the software product has been established. Thereafter, software development costs are capitalized until the product’s general availability to customers in accordance with accounting standards. Judgment is involved in determining the point at which technological feasibility is reached. If different judgments were made, they could result in a different amount of costs that are capitalized. Capitalized software development costs are then amortized over the product’s estimated economic life beginning at the date of general availability of the product to our customers. We evaluate our capitalized software development costs at each balance sheet date to determine if the unamortized balance related to any given product exceeds the estimated net realizable value of that product. Any such excess is written off through accelerated amortization in the quarter in which it is identified. Determining net realizable value requires that we make estimates and use judgment in quantifying the appropriate amount to write off, if any. Actual amounts realized from the sales of software products could differ from our estimates. Also, any future changes to our product portfolio could result in significant increases to our cost of license revenue as a result of the write-off of capitalized software development costs.
Share-Based Compensation
Share-based compensation cost is measured at the grant date based on the fair value of the award and is recognized as expense on a straight-line basis over the requisite service period, which is generally the vesting period.
We estimate the fair value of stock options and employee stock purchase plan shares using the Black-Scholes option pricing model. We utilize Monte Carlo simulation models to estimate the fair value of certain market performance-based stock awards and the intrinsic value at the date of grant as an estimate of fair value for nonvested stock awards. The fair values of share-based awards determined on the date of grant using a fair value model are impacted by our stock price as well as assumptions regarding a number of complex and subjective variables. These variables include our expected stock price volatility and risk-free interest rate over the expected term of the awards, as well as a set of peer companies’ expected stock price volatilities used in our Monte Carlo simulation models.
We estimate the volatility of our common stock by using a combination of historical volatility and implied volatility derived from market traded options for our stock, as we believe that the combined volatility is more representative of future stock price trends than either historical or implied volatility alone. We estimate the expected term of options granted using the simplified method allowed by relevant accounting standards, due to changes in vesting terms and contractual lives of our current options compared to our historical grants. We base
43
Table of Contents
the risk-free interest rate on zero-coupon yields implied from United States Treasury issues with maturities similar to the expected term of the options. We do not anticipate paying any cash dividends in the foreseeable future and therefore use an expected dividend yield of zero in the option pricing model. We are required to estimate forfeitures at the time of grant and revise those estimates in subsequent periods if actual forfeitures differ from those estimates. We use historical data to estimate prevesting option forfeitures and record share-based compensation expense for those awards that are expected to vest.
In addition, we estimate expected achievement of performance measures in determining the expected timing of vesting of our performance-based nonvested stock awards.
We record deferred tax assets for share-based awards that result in deductions on our income tax returns, based on the amount of share-based compensation recognized and the statutory tax rate in the jurisdiction in which we will receive a tax deduction. Differences between the deferred tax assets recognized for financial reporting purposes and the actual tax deduction reported on our income tax returns are recorded in additional paid-in capital. If the tax deduction is less than the deferred tax asset, such shortfalls reduce our pool of excess tax benefits. If the pool of excess tax benefits is reduced to zero, then subsequent shortfalls would increase our income tax expense.
If we use different assumptions for estimating share-based compensation expense in future periods or if actual forfeitures differ materially from our estimated forfeitures, the amount of such expense recorded in future periods may differ significantly from what we have recorded in the current period.
Goodwill and Intangible Assets
When we acquire a business, a portion of the purchase price is typically allocated to acquired technology and other identifiable intangible assets, such as customer relationships. The excess of our cost over the fair value of the net tangible and identifiable intangible assets acquired is recorded as goodwill. The amounts allocated to acquired technology and other intangible assets represent our estimates of their fair values at the acquisition date. The fair values are primarily estimated using the expected present value of future cash flows method of applying the income approach, which requires us to project the related future revenue and expenses and apply an appropriate discount rate. We amortize the acquired technology and other intangible assets with finite lives over their estimated useful lives. All goodwill is tested for impairment annually or when events or changes in circumstances indicate that the fair value has been reduced below carrying value. When conducting impairment assessments, we are required to estimate future cash flows.
The estimates used in valuing all intangible assets are based upon assumptions believed to be reasonable but which are inherently uncertain and unpredictable. Assumptions may be incomplete or inaccurate, and unanticipated events and circumstances may occur. Accordingly, actual results may differ from the projected results used to determine fair value and to estimate useful lives. Incorrect estimates of fair value and/or useful lives could result in future impairment charges and those charges could be material to our results of operations.
Valuation of Investments
Our investments consist of debt and equity securities. We classify our investments in equity securities that have readily determinable fair values and all debt securities as held-to-maturity, available-for-sale or trading at acquisition and reevaluate such classification at each subsequent balance sheet date. We do not have any investments classified as held-to-maturity at March 31, 2010 or 2009. Our investments are recorded at fair value in the consolidated balance sheets. Unrealized gains or losses on available-for-sale securities are recorded, net of tax, as a component of accumulated other comprehensive income (loss), unless an impairment is considered to be other-than-temporary. Other-than-temporary unrealized losses on available-for-sale securities are generally recorded in gain (loss) on investments, net, in the consolidated statements of operations unless certain criteria are met. In addition, unrealized gains and losses on trading securities and all realized gains and losses are recorded in
44
Table of Contents
gain (loss) on investments, net, in the consolidated statements of operations. We account for our investments in non-marketable equity securities where we do not have significant influence and that do not have a readily determinable fair value under the cost method of accounting. We regularly analyze our portfolio of available-for-sale and cost method investments for other-than-temporary declines in fair value. This analysis requires significant judgment as well as the use of estimates and assumptions. The primary factors considered when determining if a charge must be recorded because a decline in the fair value of an investment is other-than-temporary include whether: (i) the fair value of the investment is significantly below our cost basis; (ii) the financial condition of the issuer of the security has deteriorated; (iii) if a debt security, it is probable that we will be unable to collect all amounts due according to the contractual terms of the security; (iv) the decline in fair value has existed for an extended period of time; (v) if a debt security, such security has been downgraded by a rating agency; and (vi) whether we have the intent and ability to retain the investment for a period of time sufficient to allow for any anticipated recovery in fair value. We have investment policies which are designed to ensure that our assets are invested in capital-preserving securities. However, from time to time, issuer-specific and market-specific events could warrant a write down for an other-than-temporary decline in fair value.
At March 31, 2010, we held auction rate securities with a par value of $67.3 million and an estimated fair value of $60.5 million. Our auction rate securities consist entirely of bonds issued by public agencies that are backed by student loans with at least a 97% guarantee by the federal government under the United States Department of Education’s Federal Family Education Loan Program. All of these bonds are currently rated investment grade by Moody’s or Standard and Poor’s. Auctions for these securities began failing in early 2008 and have continued to fail, resulting in our continuing to hold such securities and the issuers paying interest at the maximum contractual rates. We do not believe that any of the underlying issuers of these auction rate securities are presently at risk or that the underlying credit quality of the assets backing the auction rate security investments has been impacted by the reduced liquidity of these investments. Due to the illiquidity in the auction rate securities market caused by failed auctions, we estimated the fair value of these securities using internally developed models of the expected cash flows of the securities which incorporate assumptions about the cash flows of the underlying student loans and estimates of the rate of return required by investors, which includes an adjustment to reflect a lack of liquidity in the market for these securities.
As the vast majority of our investments are investment-grade securities, we anticipate that any future impairment charges related to these investments will not have a material adverse effect on our financial position or results of operations. Investments in debt and equity securities with a fair value below our cost at March 31, 2010 are discussed in greater detail in Note 3 to the accompanying consolidated financial statements.
Accounting for Income Taxes
Income tax expense or benefit is recognized for the amount of taxes payable or refundable for the current year’s results and for deferred tax assets and liabilities related to the future tax consequences of events that have been recognized in our consolidated financial statements or tax returns. Significant judgment is required in determining our worldwide income tax provision. In the ordinary course of a global business, there are many transactions and calculations where the ultimate tax outcome is uncertain. Some of these uncertainties arise as a consequence of revenue sharing and cost reimbursement arrangements among related entities and the process of identifying items of revenue and expense that qualify for preferential tax treatment. We are subject to corporate income tax audits in multiple jurisdictions and our income tax expense includes amounts intended to satisfy income tax assessments that may result from the examination of our tax returns that have been filed in these jurisdictions. Although we believe that our estimates are reasonable, the final tax outcome of these matters could be different from that which is reflected in our historical income tax provisions and accruals. Such differences could have a material effect on our income tax provision and net income in the period in which such determination is made.
Our effective tax rate includes the impact of certain undistributed foreign earnings for which no United States taxes have been provided because such earnings are planned to be indefinitely reinvested outside the United States. Remittances of foreign earnings to the United States are planned based on projected cash flow, working
45
Table of Contents
capital and investment needs of foreign and domestic operations. Based on these assumptions, we estimate the amount that will be distributed to the United States and provide United States federal taxes on these amounts. Material changes in our estimates could impact our effective tax rate.
In order for us to realize our deferred tax assets, we must be able to generate sufficient taxable income in those jurisdictions where the deferred tax assets are located. We consider future market growth, forecasted earnings, future taxable income, the mix of earnings in the jurisdictions in which we operate and prudent and feasible tax planning strategies in determining the need for a valuation allowance. In the event we were to determine that we would not be able to realize all or part of our net deferred tax assets in the future, an adjustment to the deferred tax assets would be charged to earnings in the period in which we make such determination.
Recently Adopted Accounting Pronouncements
In July 2009, the Financial Accounting Standards Board (FASB) released the final version of its new “Accounting Standards Codification” (Codification) as the single authoritative source for GAAP. While not intended to change GAAP, the Codification significantly changed the way in which the accounting literature is organized, combining all authoritative standards into a comprehensive, topically organized database. All existing accounting standard documents were superseded and all other accounting literature not included in the Codification is considered nonauthoritative, other than guidance issued by the SEC. The Codification was effective for interim and annual periods ending on or after September 15, 2009. We adopted the Codification in our interim financial statements for the second quarter of fiscal 2010, which had no impact on our financial position, results of operations or cash flows.
In April 2009, the FASB issued guidance for estimating fair value when the volume or level of activity in a market for an asset or liability has decreased significantly. This guidance also provides information on identifying circumstances that indicate a transaction is not orderly (i.e., a forced liquidation or distressed sale). This guidance was effective for us beginning in fiscal 2010 and did not have a material impact on our financial position, results of operations or cash flows.
In April 2009, the FASB issued guidance that applies to investments in debt securities for which other-than-temporary impairments may be recorded. If an entity’s management asserts that it does not have the intent to sell a debt security and it is more likely than not that it will not be required to sell the security before recovery of its cost basis, then an entity may separate other-than temporary impairments into two components: (i) the amount related to credit losses (recorded in earnings) and (ii) all other amounts (recorded in other comprehensive income). This guidance was effective for us beginning in fiscal 2010 and did not have a material impact on our financial position, results of operations or cash flows.
In April 2009, the FASB issued guidance that requires disclosures about fair value of financial instruments in interim financial statements. This guidance was effective for us beginning in fiscal 2010, and because it applies only to financial statement disclosures, it had no impact on our financial position, results of operations or cash flows.
In June 2008, the FASB issued guidance clarifying that unvested share-based payment awards with a right to receive nonforfeitable dividends are participating securities and providing information on how to allocate earnings to participating securities to allow computation of basic and diluted earnings per share using the two-class method. This guidance was effective for us beginning in fiscal 2010 and requires retrospective application for periods prior to the effective date. The adoption of this guidance did not have a material impact on our computation of earnings per share.
In April 2008, the FASB issued guidance that amends the factors that should be considered in developing renewal or extension assumptions used to determine the useful life of a recognized intangible asset. This guidance was effective for us beginning in fiscal 2010 and did not have a material impact on our financial position, results of operations or cash flows.
46
Table of Contents
In December 2007, the FASB issued a revision to previously issued accounting literature which changes the accounting for business combinations including: (i) the measurement of acquirer shares issued in consideration for a business combination, (ii) the recognition of contingent consideration, (iii) the accounting for preacquisition gain and loss contingencies, (iv) the recognition of capitalized IPR&D, (v) the accounting for acquisition-related restructuring costs, (vi) the treatment of acquisition-related transaction costs, and (vii) the recognition of changes in the acquirer’s income tax valuation allowance. We began applying this guidance prospectively to all business combinations beginning in fiscal 2010. The impact of adoption on our financial position, results of operations or cash flows is dependent upon the nature and terms of business combinations that we consummate.
In September 2006, the FASB issued a new accounting standard which defines fair value, establishes a framework for measuring fair value and expands disclosures about fair value measurements. In February 2008, the FASB delayed the effective date of this standard to April 1, 2009 for all non-financial assets and non-financial liabilities, except those that are recognized or disclosed at fair value in the financial statements on a recurring basis (that is, at least annually). We adopted the new standard relating to assets and liabilities recognized or disclosed in the financial statements at fair value on a recurring basis on April 1, 2008, and on April 1, 2009 with regard to non-financial assets and non-financial liabilities. The adoption of these provisions did not have a material impact on our financial position, results of operations or cash flows.
New Accounting Pronouncements Not Yet Adopted
In October 2009, the FASB issued new revenue recognition guidance for arrangements that include both software and non-software related deliverables. This guidance requires entities to allocate the overall consideration to each deliverable by using a best estimate of the selling price of individual deliverables in the arrangement in the absence of VSOE or other third party evidence of the selling price. Additionally, the guidance modifies the manner in which the transaction consideration is allocated across the separately identified deliverables by no longer permitting the residual method of allocating arrangement consideration. The new guidance is effective for us in the first quarter of fiscal 2012 interim financial statements, with earlier adoption permitted. We are currently evaluating the impact of adopting this new guidance on our consolidated financial statements.
In June 2009, the FASB issued new guidance on accounting for transfers of financial assets, which amended previous GAAP literature. The amendment includes: (i) elimination of the qualifying special-purpose entity concept, (ii) a new unit of account definition that must be met for transfers of portions of financial assets to be eligible for sale accounting, (iii) clarifications and changes to the derecognition criteria for a transfer to be accounted for as a sale, (iv) a change to the amount of recognized gain or loss on a transfer of financial assets accounted for as a sale when beneficial interests are received by the transferor, and (v) extensive new disclosures. This guidance is effective for us beginning in fiscal 2011 and is not expected to have a material effect on our financial position, results of operations or cash flows.
ITEM 7A. Quantitative and Qualitative Disclosures About Market Risk
We are exposed to a variety of risks, including foreign currency exchange rate fluctuations, the impact of changes in interest rates on our investments and long-term borrowings and changes in market prices of our debt and equity securities. In the normal course of business, we employ established policies and procedures to manage these risks including the use of derivative instruments.
The hypothetical changes noted in the sections immediately below are based on sensitivity analyses performed at March 31, 2010. Actual results could differ materially.
Foreign Currency Exchange Rate Risk
We use derivatives to hedge those current net assets and liabilities that, when re-measured in accordance with United States generally accepted accounting principles, impact our consolidated statement of operations. Foreign currency forward contracts are utilized in these hedging programs. All foreign currency forward contracts entered
47
Table of Contents
into by us are components of hedging programs and are entered into for the sole purpose of hedging an existing exposure, not for speculation or trading purposes. Gains and losses on these foreign currency forward contracts would generally be offset by corresponding gains and losses on the net foreign currency assets and liabilities that they hedge, resulting in immaterial net gains or losses overall on the hedged exposures. When hedging balance sheet exposures, all gains and losses on foreign currency forward contracts are recognized in other income (loss) in the same period as when the gains and losses on re-measurement of the foreign currency denominated assets and liabilities occur. All settlements of gains and losses related to foreign currency forward contracts are included in cash flows from operating activities in the consolidated statements of cash flows. Our hedging programs reduce, but do not always entirely eliminate, the impact of foreign currency exchange rate movements. If we did not hedge against foreign currency exchange rate movement, a hypothetical increase or decrease of 10% in exchange rates would result in an increase or decrease in earnings before taxes of approximately $7.6 million. This amount represents the exposure related to balance sheet re-measurement only and assumes that all currencies move in the same direction at the same time relative to the United States dollar.
We do not currently hedge currency risk related to anticipated revenue or expenses denominated in foreign currencies.
The notional amounts at contract exchange rates of our foreign currency forward contracts outstanding were:
| Notional Amount | ||||||
| March 31, | ||||||
| 2010 | 2009 | |||||
| (In millions) | ||||||
| Foreign Currency Forward Contracts (Receive United States dollar/pay foreign currency) |
||||||
| Euro |
$ | 98.2 | $ | 132.8 | ||
| Brazilian real |
24.9 | 3.6 | ||||
| Australian dollar |
15.4 | 3.8 | ||||
| South Korean won |
6.0 | 9.4 | ||||
| Chinese yuan renminbi |
4.6 | 8.0 | ||||
| New Zealand dollar |
4.5 | 2.5 | ||||
| Swiss franc |
2.6 | 4.5 | ||||
| British pound |
— | 29.4 | ||||
| Other |
14.7 | 19.5 | ||||
| Total |
$ | 170.9 | $ | 213.5 | ||
| Foreign Currency Forward Contracts (Pay United States dollar/receive foreign currency) |
||||||
| Israeli shekel |
$ | 78.0 | $ | — | ||
| Indian rupee |
11.5 | 24.3 | ||||
| Mexican peso |
1.5 | 11.5 | ||||
| Other |
4.5 | 1.7 | ||||
| Total |
$ | 95.5 | $ | 37.5 | ||
Interest Rate Risk
We adhere to a conservative investment policy, whereby our principal concern is the preservation of liquid funds. Cash, cash equivalents and investments were approximately $1.5 billion at March 31, 2010, which consisted of $1.4 billion in cash and cash equivalents and the remaining balance consisted primarily of different types of investment-grade debt securities. Although our portfolio is subject to fluctuations in interest rates and market conditions, we classify most of our investments as “available-for-sale,” which provides that no gain or loss on any security would actually be recognized in earnings unless the instrument was sold or any loss in value
48
Table of Contents
was deemed to be other-than-temporary. A hypothetical 100 basis point increase in annual interest rates would result in an approximate $15.0 million increase in earnings before taxes related to our cash, cash equivalents and investments.
Market Risk
The carrying value and fair value of our Notes at March 31, 2010, were $298.5 million and $338.1 million, respectively. The fair value was based upon market prices of our Notes. If market interest rates increased by 100 basis points and assuming all other variables were held constant, we estimate the fair value of our Notes would decrease by approximately $19.9 million.
At March 31, 2010, we held auction rate securities with a par value of $67.3 million and an estimated fair value of $60.5 million. For further information, refer to Item 7. Management’s Discussion and Analysis of Financial Condition and Results of Operations — Liquidity and Capital Resources. We may incur additional temporary unrealized losses or other-than-temporary impairments in the future if current market conditions were to persist and we are unable to recover the cost of our auction rate securities.
ITEM 8. Financial Statements and Supplementary Data
The response to this item is submitted as a separate section of this Report. See Item 15. Exhibits and Financial Statement Schedules.
ITEM 9. Changes in and Disagreements With Accountants on Accounting and Financial Disclosure
None.
ITEM 9A. Controls and Procedures
Disclosure Controls and Procedures
Based on management’s evaluation (with the participation of our Chief Executive Officer (CEO) and Chief Financial Officer (CFO)), as of the end of the period covered by this report, our CEO and CFO have concluded that our disclosure controls and procedures (as defined in Rule 13a-15(e) and Rule 15d-15(e) under the Securities Exchange Act of 1934, as amended (the Exchange Act)), are effective.
Changes in Internal Control Over Financial Reporting
There was no change to our internal control over financial reporting identified in connection with the evaluation required by paragraph (d) of Rule 13a-15 and Rule 15d-15 under the Exchange Act that occurred during our fourth fiscal quarter that has materially affected, or is reasonably likely to materially affect, our internal control over financial reporting.
Management’s Report on Internal Control Over Financial Reporting
Our management is responsible for establishing and maintaining adequate internal control over financial reporting (as defined in Rule 13a-15(f) and Rule 15d-15(f) under the Exchange Act) to provide reasonable assurance regarding the reliability of our financial reporting and the preparation of financial statements for external purposes in accordance with United States generally accepted accounting principles.
Management assessed our internal control over financial reporting as of March 31, 2010, the end of our fiscal year. Management based its assessment on criteria established in Internal Control — Integrated Framework issued by the Committee of Sponsoring Organizations of the Treadway Commission. Management’s assessment
49
Table of Contents
included evaluation of elements such as the design and operating effectiveness of key financial reporting controls, process documentation, accounting policies and our overall control environment.
Based on our assessment, management has concluded that our internal control over financial reporting was effective as of March 31, 2010, the end of our fiscal year. We reviewed the results of management’s assessment with the Audit Committee of our Board of Directors.
The effectiveness of our internal control over financial reporting at March 31, 2010 has been audited by Ernst & Young LLP, the independent registered public accounting firm who has also audited our consolidated financial statements. Ernst & Young LLP’s report on our internal control over financial reporting is included below.
50
Table of Contents
Report of Independent Registered Public Accounting Firm
The Board of Directors and Stockholders of BMC Software, Inc.
We have audited the internal control over financial reporting of BMC Software, Inc. (the “Company”) at March 31, 2010, based on criteria established in Internal Control — Integrated Framework issued by the Committee of Sponsoring Organizations of the Treadway Commission (the “COSO criteria”). The Company’s management is responsible for maintaining effective internal control over financial reporting, and for its assessment of the effectiveness of internal control over financial reporting included in the accompanying Management’s Report on Internal Control over Financial Reporting. Our responsibility is to express an opinion on the Company’s internal control over financial reporting based on our audit.
We conducted our audit in accordance with the standards of the Public Company Accounting Oversight Board (United States). Those standards require that we plan and perform the audit to obtain reasonable assurance about whether effective internal control over financial reporting was maintained in all material respects. Our audit included obtaining an understanding of internal control over financial reporting, assessing the risk that a material weakness exists, testing and evaluating the design and operating effectiveness of internal control based on the assessed risk, and performing such other procedures as we considered necessary in the circumstances. We believe that our audit provides a reasonable basis for our opinion.
A company’s internal control over financial reporting is a process designed to provide reasonable assurance regarding the reliability of financial reporting and the preparation of financial statements for external purposes in accordance with generally accepted accounting principles. A company’s internal control over financial reporting includes those policies and procedures that (1) pertain to the maintenance of records that, in reasonable detail, accurately and fairly reflect the transactions and dispositions of the assets of the company; (2) provide reasonable assurance that transactions are recorded as necessary to permit preparation of financial statements in accordance with generally accepted accounting principles, and that receipts and expenditures of the company are being made only in accordance with authorizations of management and directors of the company; and (3) provide reasonable assurance regarding prevention or timely detection of unauthorized acquisition, use, or disposition of the company’s assets that could have a material effect on the financial statements.
Because of its inherent limitations, internal control over financial reporting may not prevent or detect misstatements. Also, projections of any evaluation of effectiveness to future periods are subject to the risk that controls may become inadequate because of changes in conditions, or that the degree of compliance with the policies or procedures may deteriorate.
In our opinion, the Company maintained, in all material respects, effective internal control over financial reporting as of March 31, 2010, based on the COSO criteria.
We also have audited, in accordance with the standards of the Public Company Accounting Oversight Board (United States), the consolidated balance sheets of the Company at March 31, 2010 and 2009, and the related consolidated statements of operations, stockholders’ equity and comprehensive income, and cash flows of the Company for each of the three years in the period ended March 31, 2010, and our report dated May 7, 2010 expressed an unqualified opinion thereon.
/s/ Ernst & Young LLP
Houston, Texas
May 7, 2010
51
Table of Contents
None.
PART III
ITEM 10. Directors, Executive Officers and Corporate Governance
The information required by this item will be included in our definitive Proxy Statement in connection with our 2010 Annual Meeting of Stockholders (the 2010 Proxy Statement), which will be filed with the SEC within 120 days after the end of the fiscal year ended March 31, 2010, under the headings “Proposal One: Election of Directors,” “Executive Officers” and “Section 16(a) Beneficial Ownership Reporting Compliance” and is incorporated herein by reference.
ITEM 11. Executive Compensation
The information required by this item will be set forth in the 2010 Proxy Statement under the headings “Compensation of Directors,” “Compensation Discussion and Analysis,” “Executive Compensation” and “Compensation Committee Interlocks and Insider Participation” and is incorporated herein by reference.
ITEM 12. Security Ownership of Certain Beneficial Owners and Management and Related Stockholder Matters
The information required by this item will be set forth in the 2010 Proxy Statement under the headings “Security Ownership of Certain Beneficial Owners,” “Security Ownership of Management” and “Equity Compensation Plans” and is incorporated herein by reference.
ITEM 13. Certain Relationships and Related Transactions, and Director Independence
The information required by this item will be set forth in the 2010 Proxy Statement under the headings “Independence of Directors” and “Related Person Transactions and Procedures” and is incorporated herein by reference.
ITEM 14. Principal Accountant Fees and Services
The information required by this item will be set forth in the 2010 Proxy Statement under the heading “Fees Paid to Ernst & Young” and is incorporated herein by reference.
52
Table of Contents
ITEM 15. Exhibits and Financial Statement Schedules
Documents filed as a part of this Report
1. The following consolidated financial statements of BMC Software, Inc. and subsidiaries and the related reports of the independent registered public accounting firm are filed herewith:
| Page Number | ||
| 58 | ||
| Consolidated Financial Statements: |
||
| 59 | ||
| Consolidated Statements of Operations for the years ended March 31, 2010, 2009 and 2008 |
60 | |
| 61 | ||
| Consolidated Statements of Cash Flows for the years ended March 31, 2010, 2009 and 2008 |
62 | |
| 63 | ||
2. All schedules have been omitted because they are inapplicable, not required, or the information is included elsewhere in the consolidated financial statements or notes thereto.
3. The following Exhibits are filed with this Report or incorporated by reference as set forth below:
| Exhibit Number |
||||
| 3.1 | — | Restated Certificate of Incorporation of the Company; incorporated by reference to Exhibit 1.2 to our Registration Statement on Form 8-A filed August 26, 1988. | ||
| 3.2 | — | Certificate of Amendment of Restated Certificate of Incorporation; incorporated by reference to Exhibit 3.2 to our Annual Report on Form 10-K for the year ended March 31, 1997. | ||
| 3.3 | — | Certificate of Amendment of Restated Certificate of Incorporation filed November 30, 1999; incorporated by reference to Exhibit 3.3 to our Annual Report on Form 10-K for the year ended March 31, 2002. | ||
| *3.4 | — | Amended and Restated Bylaws of the Company. | ||
| 4.1 | — | Indenture, dated at June 4, 2008, between BMC Software, Inc. and Wells Fargo Bank, N.A., as trustee; incorporated by reference to Exhibit 4.1 to our Current Report on Form 8-K filed June 4, 2008. | ||
| 4.2 | — | Supplemental Indenture, dated at June 4, 2008, between BMC Software, Inc. and Wells Fargo Bank, N.A., as trustee, including the form of the 7.25% Note due 2018; incorporated by reference to Exhibit 4.2 to our Current Report on Form 8-K filed June 4, 2008. | ||
| 10.1(a) | — | BMC Software, Inc. 1994 Employee Incentive Plan (conformed version inclusive of amendments); incorporated by reference to Exhibit 10.1 to our Quarterly Report on Form 10-Q for the quarter ended December 31, 2008. | ||
| 10.1(b) | — | Second Amendment to the BMC Software, Inc. 1994 Employee Incentive Plan; incorporated by reference to Exhibit 10.1(b) to our Annual Report on Form 10-K for the year ended March 31, 2009 (the 2009 10-K). | ||
53
Table of Contents
| Exhibit Number |
||||
| 10.2(a) | — | BMC Software, Inc. 1994 Non-employee Directors’ Stock Option Plan; incorporated by reference to Exhibit 10.8(a) to our Annual Report on Form 10-K for the year ended March 31, 2005 (the 1995 10-K). | ||
| 10.2(b) | — | Form of Stock Option Agreement employed under BMC Software, Inc. 1994 Non-employee Directors’ Stock Option Plan; incorporated by reference to Exhibit 10.8(b) to the 1995 10-K. | ||
| 10.3 | — | Form of Indemnification Agreement among the Company and its directors and executive officers; incorporated by reference to Exhibit 10.11 to the 1995 10-K. | ||
| 10.4 | — | BMC Software, Inc. 2000 Employee Stock Incentive Plan (conformed version inclusive of amendments); incorporated by reference to Exhibit 10.4 to our Quarterly Report on Form 10-Q for the quarter ended December 31, 2008. | ||
| 10.5 | — | Amended and Restated BMC Software, Inc. Executive Deferred Compensation Plan; incorporated by reference to Exhibit 10.5(d) to our Quarterly Report on Form 10-Q for the quarter ended September 30, 2008. | ||
| 10.6 | — | Executive Employment Agreement between BMC Software, Inc. and Robert E. Beauchamp; incorporated by reference to Exhibit 10.6 to our Current Report on Form 8-K filed November 24, 2008. | ||
| 10.7 | — | Form of Nonemployee Director Stock Option Agreement employed under BMC Software, Inc. 1994 Employee Incentive Plan for nonemployee directors; incorporated by reference to Exhibit 10.7 to the 2009 10-K. | ||
| 10.8(a) | — | BMC Software, Inc. 2002 Nonemployee Director Stock Option Plan; incorporated by reference to Appendix B to our 2002 Proxy Statement filed with the SEC on Schedule 14A. | ||
| 10.8(b) | — | Form of Stock Option Agreement employed under BMC Software, Inc. 2002 Nonemployee Director Stock Option Plan; incorporated by reference to Exhibit 10.8(b) to our Annual Report on Form 10-K for the year ended March 31, 2003. | ||
| 10.9 | — | BMC Software, Inc. 2002 Employee Incentive Plan (conformed version inclusive of amendments); incorporated by reference to Exhibit 10.9 to our Quarterly Report on Form 10-Q for the quarter ended December 31, 2008. | ||
| 10.10 | — | BMC Software, Inc. Short-term Incentive Performance Award Program (as amended and restated); incorporated by reference to Exhibit 10.10 to our Quarterly Report on Form 10-Q for the quarter ended September 30, 2009. | ||
| 10.11 | — | BMC Software, Inc. Long-term Incentive Performance Award Program (as amended and restated); incorporated by reference to Exhibit 10.11 to our Quarterly Report on Form 10-Q for the quarter ended September 30, 2009. | ||
| 10.12 | — | Executive Employment Agreement between BMC Software, Inc. and Stephen B. Solcher; incorporated by reference to Exhibit 10.12 to our Current Report on Form 8-K filed November 24, 2008. | ||
| 10.13(a) | — | BladeLogic, Inc. 2007 Stock Option and Incentive Plan; incorporated by reference to Exhibit 10.5 to the BladeLogic, Inc. Registration Statement on Form S-1 (Registration No. 333-141915). | ||
| 10.13(b) | — | First Amendment to BladeLogic, Inc. 2007 Stock Option and Incentive Plan; incorporated by reference to Exhibit 10.34(b) to our Quarterly Report on Form 10-Q for the quarter ended December 31, 2008. | ||
54
Table of Contents
| Exhibit Number |
||||
| 10.14 | — | Form of Stock Option Agreement employed under BMC Software, Inc. 1994 Employee Incentive Plan utilized for senior executive officers; incorporated by reference to Exhibit 10.14 to our Current Report on Form 8-K filed November 1, 2004. | ||
| 10.15 | — | Form of Restricted Stock Agreement employed under BMC Software, Inc. 1994 Employee Incentive Plan utilized for senior executive officers; incorporated by reference to Exhibit 10.15 to our Current Report on Form 8-K filed November 1, 2004. | ||
| 10.16 | — | Executive Employment Agreement between BMC Software, Inc. and Denise M. Clolery; incorporated by reference to Exhibit 10.16 to our Quarterly Report on Form 10-Q for the quarter ended December 31, 2008. | ||
| 10.17 | — | Executive Employment Agreement between BMC Software, Inc. and Hollie S. Castro; incorporated by reference to Exhibit 10.17 to our Quarterly Report on Form 10-Q for the quarter ended September 30, 2009. | ||
| 10.18 | — | Executive Employment Agreement between BMC Software, Inc. and James W. Grant, Jr.; incorporated by reference to Exhibit 10.18 to our Current Report on Form 8-K filed November 24, 2008. | ||
| 10.19 | — | Form of Stock Option Award Agreement employed under BladeLogic, Inc. 2007 Stock Option and Incentive Plan utilized for senior executive officers; incorporated by reference to Exhibit 10.19 to the 2009 10-K. | ||
| 10.20 | — | Form of Performance-Based Restricted Stock Award Agreement employed under BMC Software, Inc. 1994 Employee Incentive Plan utilized for senior executive officers; incorporated by reference to Exhibit 10.20 to our Current Report on Form 8-K filed on June 12, 2006. | ||
| 10.21 | — | Form of Restricted Stock Unit Award Agreement employed under BladeLogic, Inc. 2007 Stock Option and Incentive Plan utilized for senior executive officers; incorporated by reference to Exhibit 10.21 to the 2009 10-K. | ||
| 10.22 | — | Executive Employment Agreement between BMC Software, Inc. and William Miller; incorporated by reference to Exhibit 10.22 to our Quarterly Report on Form 10-Q for the quarter ended December 31, 2008. | ||
| 10.23 | — | Form of Stock Option Agreement employed under BMC Software, Inc. 2007 Incentive Plan utilized for senior executive officers; incorporated by reference to Exhibit 10.23 to the Company’s Quarterly Report on Form 10-Q for the quarter ended December 31, 2007. | ||
| 10.24 | — | Form of Performance-Based Restricted Stock Award Agreement employed under BMC Software, Inc. 2007 Incentive Plan utilized for senior executive officers; incorporated by reference to Exhibit 10.24 to our Quarterly Report on Form 10-Q for the quarter ended December 31, 2007. | ||
| 10.25 | — | Form of Time-Based Restricted Stock Award Agreement employed under BMC Software, Inc. 2007 Incentive Plan utilized for senior executive officers; incorporated by reference to Exhibit 10.25 to our Quarterly Report on Form 10-Q for the quarter ended December 31, 2007. | ||
| 10.27 | — | Executive Employment Agreement between BMC Software, Inc. and John McMahon; incorporated by reference to Exhibit 10.27 to our Quarterly Report on Form 10-Q for the quarter ended December 31, 2008. | ||
| 10.28 | — | Form of Performance-Based Restricted Stock Unit Award Agreement employed under BMC Software, Inc. 2007 Incentive Plan utilized for senior executive officers; incorporated by reference to Exhibit 10.28 to our Current Report on Form 8-K filed June 12, 2008. | ||
55
Table of Contents
| Exhibit Number |
||||
| 10.29 | — | Form of Time-Based Restricted Stock Unit Award Agreement employed under BMC Software, Inc. 2007 Incentive Plan utilized for senior executive officers; incorporated by reference to Exhibit 10.29 to our Current Report on Form 8-K filed June 12, 2008. | ||
| 10.30 | — | Performance-Based Restricted Stock Unit Award Agreement for Robert E. Beauchamp; incorporated by reference to Exhibit 10.30 to our Current Report on Form 8-K filed August 20, 2008. | ||
| 10.31 | — | Executive Employment Agreement between BMC Software, Inc. and D. Stephen Goddard; incorporated by reference to Exhibit 10.31 to our Quarterly Report on Form 10-Q for the quarter ended December 31, 2008. | ||
| 10.32 | — | Executive Employment Agreement between BMC Software, Inc. and T. Cory Bleuer; incorporated by reference to Exhibit 10.32 to our Quarterly Report on Form 10-Q for the quarter ended December 31, 2008. | ||
| 10.33 | — | BMC Software, Inc. 2007 Incentive Plan (as amended); incorporated by reference to Annex A to our Definitive Proxy Statement on Schedule 14A dated June 24, 2009. | ||
| 10.34 | — | Amendment to Executive Employment Agreement between BMC Software, Inc. and Robert E. Beauchamp; incorporated by reference to Exhibit 10.34 to our Current Report on Form 8-K filed May 3, 2010. | ||
| 10.35 | — | Amendment to Executive Employment Agreement between BMC Software, Inc. and Stephen B. Solcher; incorporated by reference to Exhibit 10.35 to our Current Report on Form 8-K filed May 3, 2010. | ||
| 10.36 | — | Amendment to Executive Employment Agreement between BMC Software, Inc. and James W. Grant; incorporated by reference to Exhibit 10.36 to our Current Report on Form 8-K filed May 3, 2010. | ||
| 10.37 | — | Amendment to Executive Employment Agreement between BMC Software, Inc. and John D. McMahon; incorporated by reference to Exhibit 10.37 to our Current Report on Form 8-K filed May 3, 2010. | ||
| 10.38 | — | Amendment to Executive Employment Agreement between BMC Software, Inc. and William D. Miller; incorporated by reference to Exhibit 10.38 to our Current Report on Form 8-K filed May 3, 2010. | ||
| 10.39 | — | Amendment to Executive Employment Agreement between BMC Software, Inc. and D. Stephen Goddard; incorporated by reference to Exhibit 10.39 to our Current Report on Form 8-K filed May 3, 2010. | ||
| 10.40 | — | Amendment to Executive Employment Agreement between BMC Software, Inc. and T. Cory Bleuer; incorporated by reference to Exhibit 10.40 to our Current Report on Form 8-K filed May 3, 2010. | ||
| *21.1 | — | Subsidiaries of the Company. | ||
| *23.1 | — | Consent of Independent Registered Public Accounting Firm. | ||
| *31.1 | — | Certification of Chief Executive Officer of BMC Software, Inc. pursuant to Section 302 of the Sarbanes-Oxley Act of 2002. | ||
| *31.2 | — | Certification of Chief Financial Officer of BMC Software, Inc. pursuant to Section 302 of the Sarbanes-Oxley Act of 2002. | ||
| *32.1 | — | Certification of Chief Executive Officer of BMC Software, Inc. pursuant to 18 U.S.C. Section 1350. | ||
56
Table of Contents
| Exhibit Number |
||||
| *32.2 | — | Certification of Chief Financial Officer of BMC Software, Inc. pursuant to 18 U.S.C. Section 1350. | ||
| *101.INS | — | XBRL Instance Document. | ||
| *101.SCH | — | XBRL Taxonomy Extension Schema Document. | ||
| *101.CAL | — | XBRL Taxonomy Extension Calculation Linkbase Document. | ||
| *101.LAB | — | XBRL Taxonomy Extension Label Linkbase Document. | ||
| *101.PRE | — | XBRL Taxonomy Extension Presentation Linkbase Document. | ||
| *101.DEF | — | XBRL Taxonomy Extension Definition Linkbase Document. | ||
| * | Filed herewith |
Note: The Amended and Restated Bylaws will not be effective unless and until an amendment to the Company’s Restated Certificate of Incorporation is approved at the upcoming 2010 Annual Meeting of Shareholders and filed with the Secretary of State of the State of Delaware.
57
Table of Contents
REPORT OF INDEPENDENT REGISTERED PUBLIC ACCOUNTING FIRM
The Board of Directors and Stockholders of BMC Software, Inc.
We have audited the accompanying consolidated balance sheets of BMC Software, Inc. (the “Company”) as of March 31, 2010 and 2009, and the related consolidated statements of operations, stockholders’ equity and comprehensive income, and cash flows for each of the three years in the period ended March 31, 2010. These financial statements are the responsibility of the Company’s management. Our responsibility is to express an opinion on these financial statements based on our audits.
We conducted our audits in accordance with the standards of the Public Company Accounting Oversight Board (United States). Those standards require that we plan and perform the audit to obtain reasonable assurance about whether the financial statements are free of material misstatement. An audit includes examining, on a test basis, evidence supporting the amounts and disclosures in the financial statements. An audit also includes assessing the accounting principles used and significant estimates made by management, as well as evaluating the overall financial statement presentation. We believe that our audits provide a reasonable basis for our opinion.
In our opinion, the consolidated financial statements referred to above present fairly, in all material respects, the consolidated financial position of the Company at March 31, 2010 and 2009, and the consolidated results of its operations and its cash flows for each of the three years in the period ended March 31, 2010, in conformity with U.S. generally accepted accounting principles.
As discussed in Note 8 to the consolidated financial statements, the Company adopted, effective April 1, 2007, Financial Accounting Standards Board Interpretation No. 48, Accounting for Uncertainty in Income Taxes (codified primarily in FASB ASC Topic 740, Income Taxes).
We also have audited, in accordance with the standards of the Public Company Accounting Oversight Board (United States), the Company’s internal control over financial reporting as of March 31, 2010, based on criteria established in Internal Control — Integrated Framework issued by the Committee of Sponsoring Organizations of the Treadway Commission, and our report dated May 7, 2010 expressed an unqualified opinion thereon.
/s/ Ernst & Young LLP
Houston, Texas
May 7, 2010
58
Table of Contents
CONSOLIDATED BALANCE SHEETS
| March 31, | ||||||||
| 2010 | 2009 | |||||||
| (In millions, except per share data) | ||||||||
| ASSETS | ||||||||
| Current assets: |
||||||||
| Cash and cash equivalents |
$ | 1,368.6 | $ | 1,023.3 | ||||
| Short-term investments |
65.5 | 73.6 | ||||||
| Trade accounts receivable, net |
212.3 | 217.8 | ||||||
| Trade finance receivables, net |
117.7 | 99.3 | ||||||
| Deferred tax assets |
53.7 | 68.0 | ||||||
| Other current assets |
87.2 | 78.5 | ||||||
| Total current assets |
1,905.0 | 1,560.5 | ||||||
| Property and equipment, net |
95.0 | 103.0 | ||||||
| Software development costs |
145.5 | 122.6 | ||||||
| Long-term investments |
62.4 | 72.3 | ||||||
| Long-term trade finance receivables, net |
122.6 | 92.1 | ||||||
| Intangible assets, net |
158.8 | 189.9 | ||||||
| Goodwill |
1,365.6 | 1,288.7 | ||||||
| Other long-term assets |
282.7 | 268.4 | ||||||
| Total assets |
$ | 4,137.6 | $ | 3,697.5 | ||||
| LIABILITIES AND STOCKHOLDERS’ EQUITY | ||||||||
| Current liabilities: |
||||||||
| Trade accounts payable |
$ | 37.5 | $ | 48.9 | ||||
| Finance payables |
23.0 | 13.7 | ||||||
| Accrued liabilities |
324.7 | 293.4 | ||||||
| Deferred revenue |
975.9 | 977.3 | ||||||
| Total current liabilities |
1,361.1 | 1,333.3 | ||||||
| Long-term deferred revenue |
847.2 | 810.6 | ||||||
| Long-term borrowings |
340.9 | 313.6 | ||||||
| Other long-term liabilities |
200.7 | 191.5 | ||||||
| Total liabilities |
2,749.9 | 2,649.0 | ||||||
| Commitments and contingencies |
||||||||
| Stockholders’ equity: |
||||||||
| Preferred stock, $.01 par value, 1.0 shares authorized, none issued and outstanding |
— | — | ||||||
| Common stock, $.01 par value, 600.0 shares authorized, 249.1 shares issued |
2.5 | 2.5 | ||||||
| Additional paid-in capital |
965.4 | 881.2 | ||||||
| Retained earnings |
2,389.3 | 1,985.4 | ||||||
| Accumulated other comprehensive income (loss) |
5.4 | (25.5 | ) | |||||
| 3,362.6 | 2,843.6 | |||||||
| Treasury stock, at cost (67.2 and 64.4 shares) |
(1,974.9 | ) | (1,795.1 | ) | ||||
| Total stockholders’ equity |
1,387.7 | 1,048.5 | ||||||
| Total liabilities and stockholders’ equity |
$ | 4,137.6 | $ | 3,697.5 | ||||
The accompanying notes are an integral part of these consolidated financial statements.
59
Table of Contents
CONSOLIDATED STATEMENTS OF OPERATIONS
| Year Ended March 31, | ||||||||||||
| 2010 | 2009 | 2008 | ||||||||||
| (In millions, except per share data) | ||||||||||||
| Revenue: |
||||||||||||
| License |
$ | 758.4 | $ | 709.7 | $ | 647.6 | ||||||
| Maintenance |
1,023.7 | 1,017.8 | 967.7 | |||||||||
| Professional services |
129.1 | 144.4 | 116.3 | |||||||||
| Total revenue |
1,911.2 | 1,871.9 | 1,731.6 | |||||||||
| Operating expenses: |
||||||||||||
| Cost of license revenue |
115.5 | 117.1 | 100.4 | |||||||||
| Cost of maintenance revenue |
158.3 | 166.3 | 168.9 | |||||||||
| Cost of professional services revenue |
137.4 | 141.6 | 125.1 | |||||||||
| Selling and marketing expenses |
556.2 | 541.5 | 527.4 | |||||||||
| Research and development expenses |
195.6 | 222.0 | 209.4 | |||||||||
| General and administrative expenses |
206.4 | 197.7 | 209.4 | |||||||||
| In-process research and development |
— | 50.3 | 4.0 | |||||||||
| Amortization of intangible assets |
32.7 | 34.1 | 14.8 | |||||||||
| Severance, exit costs and related charges |
3.0 | 33.5 | 14.7 | |||||||||
| Total operating expenses |
1,405.1 | 1,504.1 | 1,374.1 | |||||||||
| Operating income |
506.1 | 367.8 | 357.5 | |||||||||
| Other income (loss), net: |
||||||||||||
| Interest and other income, net |
15.9 | 26.5 | 74.7 | |||||||||
| Interest expense |
(21.3 | ) | (17.0 | ) | (1.1 | ) | ||||||
| Gain (loss) on investments, net |
3.5 | (13.4 | ) | 3.3 | ||||||||
| Total other income (loss), net |
(1.9 | ) | (3.9 | ) | 76.9 | |||||||
| Earnings before income taxes |
504.2 | 363.9 | 434.4 | |||||||||
| Provision for income taxes |
98.1 | 125.8 | 120.8 | |||||||||
| Net earnings |
$ | 406.1 | $ | 238.1 | $ | 313.6 | ||||||
| Basic earnings per share |
$ | 2.21 | $ | 1.27 | $ | 1.59 | ||||||
| Diluted earnings per share |
$ | 2.17 | $ | 1.25 | $ | 1.56 | ||||||
| Shares used in computing basic earnings per share |
183.1 | 187.1 | 194.8 | |||||||||
| Shares used in computing diluted earnings per share |
186.8 | 190.2 | 199.6 | |||||||||
The accompanying notes are an integral part of these consolidated financial statements.
60
Table of Contents
CONSOLIDATED STATEMENTS OF STOCKHOLDERS’ EQUITY AND COMPREHENSIVE INCOME
Years Ended March 31, 2010, 2009 and 2008
| Accumulated
Other Comprehensive Income (Loss) |
|||||||||||||||||||||||||||||
| Common Stock Shares |
Amount | Additional Paid-in Capital |
Retained Earnings |
Foreign Currency Translation Adjustment |
Unrealized Gain (Loss) on Securities Available for Sale, Net of Taxes |
Treasury Stock, at Cost |
Total Stockholders’ Equity |
||||||||||||||||||||||
| (In millions) | |||||||||||||||||||||||||||||
| Balance, March 31, 2007 |
249.1 | $ | 2.5 | $ | 679.4 | $ | 1,478.0 | $ | (8.8 | ) | $ | (0.5 | ) | $ | (1,101.5 | ) | $ | 1,049.1 | |||||||||||
| Comprehensive income: |
|||||||||||||||||||||||||||||
| Net earnings |
— | — | — | 313.6 | — | — | — | 313.6 | |||||||||||||||||||||
| Foreign currency translation adjustment, net of taxes of $4.0 |
— | — | — | — | 31.3 | — | — | 31.3 | |||||||||||||||||||||
| Unrealized gain on securities available for sale, net of taxes of $1.0 |
— | — | — | — | — | — | — | — | |||||||||||||||||||||
| Realized gain on securities available for sale, net of taxes of $1.4 |
— | — | — | — | — | (2.3 | ) | — | (2.3 | ) | |||||||||||||||||||
| Total comprehensive income |
342.6 | ||||||||||||||||||||||||||||
| Adoption of accounting standards for uncertain tax positions |
— | — | — | (37.1 | ) | — | — | — | (37.1 | ) | |||||||||||||||||||
| Treasury stock purchases |
— | — | — | — | — | — | (579.6 | ) | (579.6 | ) | |||||||||||||||||||
| Shares issued/forfeited for share-based compensation |
— | — | 11.9 | (1.4 | ) | — | — | 113.6 | 124.1 | ||||||||||||||||||||
| Share-based compensation expense |
— | — | 69.7 | — | — | — | — | 69.7 | |||||||||||||||||||||
| Tax benefit of share-based compensation expense |
— | — | 25.7 | — | — | — | — | 25.7 | |||||||||||||||||||||
| Balance, March 31, 2008 |
249.1 | $ | 2.5 | $ | 786.7 | $ | 1,753.1 | $ | 22.5 | $ | (2.8 | ) | $ | (1,567.5 | ) | $ | 994.5 | ||||||||||||
| Comprehensive income: |
|||||||||||||||||||||||||||||
| Net earnings |
— | — | — | 238.1 | — | — | — | 238.1 | |||||||||||||||||||||
| Foreign currency translation adjustment, net of taxes of $9.5 |
— | — | — | — | (39.9 | ) | — | — | (39.9 | ) | |||||||||||||||||||
| Unrealized loss on securities available for sale, net of taxes of $4.2 |
— | — | — | — | — | (10.7 | ) | — | (10.7 | ) | |||||||||||||||||||
| Realized loss on securities available for sale, net of taxes of $0.3 |
— | — | — | — | — | 5.4 | — | 5.4 | |||||||||||||||||||||
| Total comprehensive income |
192.9 | ||||||||||||||||||||||||||||
| Treasury stock purchases |
— | — | — | — | — | — | (346.2 | ) | (346.2 | ) | |||||||||||||||||||
| Shares issued/forfeited for share-based compensation |
— | — | (9.8 | ) | (5.8 | ) | — | — | 118.6 | 103.0 | |||||||||||||||||||
| Share-based compensation expense |
— | — | 81.0 | — | — | — | — | 81.0 | |||||||||||||||||||||
| Tax benefit of share-based compensation expense |
— | — | 23.3 | — | — | — | — | 23.3 | |||||||||||||||||||||
| Balance, March 31, 2009 |
249.1 | $ | 2.5 | $ | 881.2 | $ | 1,985.4 | $ | (17.4 | ) | $ | (8.1 | ) | $ | (1,795.1 | ) | $ | 1,048.5 | |||||||||||
| Comprehensive income: |
|||||||||||||||||||||||||||||
| Net earnings |
— | — | — | 406.1 | — | — | — | 406.1 | |||||||||||||||||||||
| Foreign currency translation adjustment, net of taxes of $8.4 |
— | — | — | — | 27.8 | — | — | 27.8 | |||||||||||||||||||||
| Unrealized gain on securities available for sale, net of taxes of $1.4 |
— | — | — | — | — | 3.1 | — | 3.1 | |||||||||||||||||||||
| Total comprehensive income |
— | — | — | — | — | — | 437.0 | ||||||||||||||||||||||
| Treasury stock purchases |
— | — | — | — | — | — | (288.1 | ) | (288.1 | ) | |||||||||||||||||||
| Shares issued/forfeited for share-based compensation |
— | — | (16.9 | ) | (2.2 | ) | — | — | 108.3 | 89.2 | |||||||||||||||||||
| Share-based compensation expense |
— | — | 89.3 | — | — | — | — | 89.3 | |||||||||||||||||||||
| Tax benefit of share-based compensation expense |
— | — | 11.8 | — | — | — | — | 11.8 | |||||||||||||||||||||
| Balance, March 31, 2010 |
249.1 | $ | 2.5 | $ | 965.4 | $ | 2,389.3 | $ | 10.4 | $ | (5.0 | ) | $ | (1,974.9 | ) | $ | 1,387.7 | ||||||||||||
The accompanying notes are an integral part of these consolidated financial statements.
61
Table of Contents
CONSOLIDATED STATEMENTS OF CASH FLOWS
| Year Ended March 31, | ||||||||||||
| 2010 | 2009 | 2008 | ||||||||||
| (In millions) | ||||||||||||
| Cash flows from operating activities: |
||||||||||||
| Net earnings |
$ | 406.1 | $ | 238.1 | $ | 313.6 | ||||||
| Adjustments to reconcile net earnings to net cash provided by operating activities: |
||||||||||||
| In-process research and development |
— | 50.3 | 4.0 | |||||||||
| Depreciation and amortization |
175.8 | 182.8 | 152.1 | |||||||||
| Deferred income tax provision (benefit) |
28.2 | 3.1 | (76.2 | ) | ||||||||
| Share-based compensation expense |
88.9 | 82.0 | 66.6 | |||||||||
| Loss (gain) on investments, net |
(3.5 | ) | 13.4 | (3.3 | ) | |||||||
| Changes in operating assets and liabilities, net of acquisitions: |
||||||||||||
| Trade accounts receivable |
9.4 | 16.5 | (21.0 | ) | ||||||||
| Trade finance receivables |
(47.8 | ) | (46.0 | ) | 109.1 | |||||||
| Trade accounts payable |
(12.5 | ) | 4.9 | (11.1 | ) | |||||||
| Finance payables |
8.1 | 9.3 | (34.6 | ) | ||||||||
| Deferred revenue |
30.5 | 0.8 | 48.2 | |||||||||
| Other operating assets and liabilities |
(47.8 | ) | 24.5 | 46.3 | ||||||||
| Net cash provided by operating activities |
635.4 | 579.7 | 593.7 | |||||||||
| Cash flows from investing activities: |
||||||||||||
| Proceeds from maturities/sales of investments |
367.0 | 194.2 | 728.7 | |||||||||
| Purchases of investments |
(330.8 | ) | (173.5 | ) | (289.3 | ) | ||||||
| Cash paid for acquisitions, net of cash acquired, and other investments |
(92.3 | ) | (783.7 | ) | (114.8 | ) | ||||||
| Capitalization of software development costs |
(81.0 | ) | (67.3 | ) | (68.2 | ) | ||||||
| Purchases of property and equipment |
(22.1 | ) | (28.0 | ) | (38.4 | ) | ||||||
| Other investing activities |
(0.1 | ) | 6.4 | 3.4 | ||||||||
| Net cash provided by (used in) investing activities |
(159.3 | ) | (851.9 | ) | 221.4 | |||||||
| Cash flows from financing activities: |
||||||||||||
| Treasury stock acquired |
(275.1 | ) | (330.0 | ) | (579.6 | ) | ||||||
| Repurchases of stock to satisfy employee tax withholding obligations |
(13.0 | ) | (16.2 | ) | — | |||||||
| Proceeds from stock option exercises and other |
89.2 | 101.8 | 124.1 | |||||||||
| Excess tax benefit from share-based compensation expense |
13.7 | 24.1 | 23.9 | |||||||||
| Repayments of borrowings and capital lease obligations |
(15.5 | ) | (17.9 | ) | (6.6 | ) | ||||||
| Proceeds from borrowings, net of issuance costs |
42.0 | 295.6 | — | |||||||||
| Net cash provided by (used in) financing activities |
(158.7 | ) | 57.4 | (438.2 | ) | |||||||
| Effect of exchange rate changes on cash and cash equivalents |
27.9 | (50.2 | ) | 27.9 | ||||||||
| Net change in cash and cash equivalents |
345.3 | (265.0 | ) | 404.8 | ||||||||
| Cash and cash equivalents, beginning of year |
1,023.3 | 1,288.3 | 883.5 | |||||||||
| Cash and cash equivalents, end of year |
$ | 1,368.6 | $ | 1,023.3 | $ | 1,288.3 | ||||||
| Supplemental disclosure of cash flow information: |
||||||||||||
| Cash paid for interest |
$ | 23.0 | $ | 11.7 | $ | 1.1 | ||||||
| Cash paid for income taxes, net of amounts refunded |
$ | 89.8 | $ | 69.3 | $ | 62.0 | ||||||
The accompanying notes are an integral part of these consolidated financial statements.
62
Table of Contents
NOTES TO CONSOLIDATED FINANCIAL STATEMENTS
(1) Summary of Significant Accounting Policies
Nature of Operations
BMC Software, Inc. (collectively, we, us, our, the Company or BMC) develops software that provides system and service management solutions primarily for large enterprises. We market and sell our products in most major world markets directly through our sales force and indirectly through channel partners, including resellers, distributors and systems integrators. We also provide maintenance and support for our products and perform software implementation, integration and education services for our customers.
Basis of Presentation
The accompanying consolidated financial statements include our accounts and the accounts of our subsidiaries. All significant intercompany balances and transactions have been eliminated in consolidation. We have evaluated subsequent events through the date the financial statements were issued. Certain reclassifications have been made to the prior years’ financial statements to conform to the current year’s presentation.
Use of Estimates
The preparation of financial statements in conformity with United States generally accepted accounting principles (GAAP) requires management to make estimates and assumptions that affect the reported amounts of assets and liabilities, the reported amounts of revenue and expenses during the reporting period and the disclosure of contingent assets and liabilities at the date of the financial statements. Actual results could differ from those estimates.
Cash and Cash Equivalents
We consider investments with an original maturity of three months or less when purchased to be cash equivalents. At March 31, 2010 and 2009, our cash equivalents were comprised primarily of money-market funds and United States Treasury securities. Our cash equivalents are subject to potential credit risk. Our cash management and investment policies restrict investments to investment grade, highly liquid securities. The carrying value of cash and cash equivalents approximates fair value.
Investments
We classify our investments in equity securities that have readily determinable fair values and all debt securities as held-to-maturity, available-for-sale or trading at acquisition and reevaluate such classification at each subsequent balance sheet date. We do not have any investments classified as held-to-maturity at March 31, 2010 or 2009. Our investments are recorded at fair value in the consolidated balance sheets. Unrealized gains and losses on available-for-sale securities are recorded, net of tax, as a component of accumulated other comprehensive income (loss), unless an impairment is considered to be other-than-temporary. Other-than-temporary unrealized losses on available-for-sale securities are generally recorded in gain (loss) on investments, net, in the consolidated statements of operations unless certain criteria are met. The primary factors considered when determining if a charge must be recorded because a decline in the fair value of an investment is other-than-temporary include whether: (i) the fair value of the investment is significantly below our cost basis; (ii) the financial condition of the issuer of the security has deteriorated; (iii) if a debt security, it is probable that we will be unable to collect all amounts due according to the contractual terms of the security; (iv) the decline in fair value has existed for an extended period of time; (v) if a debt security, such security has been downgraded by a rating agency; and (vi) whether we have the intent and ability to retain the investment for a period of time sufficient to allow for any anticipated recovery in fair value. In addition, unrealized gains and losses on trading
63
Table of Contents
BMC SOFTWARE, INC.
NOTES TO CONSOLIDATED FINANCIAL STATEMENTS
securities and all realized gains and losses are recorded in gain (loss) on investments, net, in the consolidated statements of operations. Realized and unrealized gains and losses are calculated using the specific identification method. Investments with maturities of twelve months or less are classified as short-term investments. Investments with maturities of more than twelve months are classified as long-term investments.
We account for investments in non-marketable equity securities where we do not have significant influence and that do not have a readily determinable fair value under the cost method of accounting and these investments are included in other long-term assets. In fiscal 2009, we recorded an $8.4 million impairment charge in connection with the write-down of certain non-marketable equity investments to their estimated fair values.
Refer to Note 3 for further information regarding auction rate securities held by us.
Receivables
In the ordinary course of business, we extend credit to our customers on both trade and financed terms. Trade and finance receivables are recorded at their outstanding principal balances, adjusted for interest receivable to date, if applicable, and adjusted by the allowance for doubtful accounts. Interest income on finance receivables is recognized using the effective interest method and is presented as interest and other income, net, in the consolidated statements of operations. Interest income on these financed receivables was $11.4 million, $9.6 million and $11.3 million in fiscal 2010, 2009 and 2008, respectively. In estimating the allowance for doubtful accounts, we consider the length of time receivable balances have been outstanding, historical collection experience, current economic conditions and customer-specific information. When we ultimately conclude that a receivable is uncollectible, the balance is charged against the allowance for doubtful accounts. At March 31, 2010 and 2009, the allowance for doubtful trade accounts receivable was $2.2 million and $3.6 million and the allowance for doubtful trade finance receivables was $0.4 million and $0.6 million, respectively. During fiscal 2010, 2009 and 2008, the provision (benefit) for bad debts was $(0.3) million, $3.8 million and $0.9 million and the amounts charged against the allowance for doubtful accounts were $1.3 million, $2.9 million and $0.5 million, respectively.
A substantial portion of our trade finance receivables are transferred to financial institutions on a non-recourse basis. We utilize wholly-owned finance subsidiaries in these finance receivables transfers. These entities are consolidated into our financial position and results of operations. We account for such transfers as sales in accordance with applicable accounting rules pertaining to the transfer of financial assets and the sale of future revenue when we have surrendered control of such receivables (including determining that such assets have been isolated beyond our reach and the reach of our creditors) and when we do not have significant continuing involvement in the generation of cash flows due the financial institutions. During fiscal 2010, 2009 and 2008, we transferred $208.8 million, $149.7 million and $267.5 million, respectively, of such receivables through these programs. Finance receivables are typically transferred within three months after origination and the outstanding principal balance at the time of transfer typically approximates fair value.
Long-Lived Assets
Property and Equipment
Property and equipment are stated at cost. Depreciation on property and equipment, with the exception of leasehold improvements, is recorded using the straight-line method over the estimated useful lives of the assets, which range from three to ten years. Leasehold improvements are depreciated using the straight-line method over the shorter of the lease term or the estimated respective useful lives of the assets, which range from three to ten years.
64
Table of Contents
BMC SOFTWARE, INC.
NOTES TO CONSOLIDATED FINANCIAL STATEMENTS
Costs incurred to develop internal-use software during the application development stage are capitalized, stated at cost, and amortized using the straight-line method over the estimated useful lives of the assets, which range from three to seven years. Application development stage costs generally include costs associated with internal-use software configuration, coding, installation and testing. Costs of significant upgrades and enhancements that result in additional functionality are also capitalized, whereas costs incurred for maintenance and minor upgrades and enhancements are expensed as incurred.
Software Development Costs
Costs of software developed internally for licensing to third parties are expensed until the technological feasibility of the software product has been established. Thereafter, software development costs are capitalized through the general release of the software products and subsequently reported at the lower of unamortized cost or net realizable value. Capitalized software development costs are amortized on a straight-line basis over the products’ respective estimated economic lives, which are typically three years. The amortization of capitalized software development costs, including amounts accelerated for products that were not expected to generate sufficient future revenue to realize their carrying values, is included in cost of license revenue in the consolidated statements of operations. During fiscal 2010, 2009 and 2008, amounts capitalized were $85.9 million, $72.5 million and $71.8 million, respectively, amounts amortized were $63.1 million, $62.9 million and $64.5 million, respectively, and the change in foreign currency exchange rates increased (decreased) capitalized software development costs by $0.1 million, $(0.4) million and $2.0 million, respectively. Amounts capitalized during fiscal 2010 and 2009 included $2.3 million and $1.7 million, respectively, of capitalized interest.
Intangible Assets
Intangible assets consist principally of acquired technology and customer relationships recorded in connection with our business combinations. The amounts allocated to these intangible assets represent our estimates of their fair values at the acquisition date. The fair values are primarily estimated using the expected present value of future cash flows method of applying the income approach. Intangible assets are stated at cost and amortized on a straight-line basis over their respective estimated economic lives ranging from one to four years.
Goodwill
Goodwill represents the excess of the purchase price over the fair value of net assets acquired, including identifiable intangible assets, in connection with our business combinations. Upon acquisition, goodwill is assigned to the reporting unit that is expected to benefit from the synergies of the business combination, which is the reporting unit to which the related acquired technology is assigned. A reporting unit is the operating segment, or a business unit one level below that operating segment, for which discrete financial information is prepared and regularly reviewed by segment management. Each of our business segments is considered a reporting unit. We test goodwill for impairment as of January 1 of each fiscal year or more frequently if events or changes in circumstances indicate that the asset might be impaired. Our impairment test is based on a comparison of the estimated fair value of the reporting units, determined using a combination of the income and market approaches on an invested capital basis, to their respective carrying values (including goodwill) as of the date of the impairment test.
Impairment
In addition to our goodwill impairment testing, as noted above, we also review our other long-lived assets for impairment whenever events or changes in business circumstances indicate that the carrying amount of the assets may not be fully recoverable or that the useful lives of these assets are no longer appropriate. Each impairment test is based on a comparison of the undiscounted future cash flows to the recorded value of the asset. If an impairment is indicated, the asset is written down to its estimated fair value.
65
Table of Contents
BMC SOFTWARE, INC.
NOTES TO CONSOLIDATED FINANCIAL STATEMENTS
Foreign Currency Translation and Risk Management
We operate globally and transact business in various foreign currencies. The functional currency for many of our foreign subsidiaries is the respective local currency. Financial statements of these foreign operations are translated into United States dollars using the currency exchange rates in effect at the balance sheet dates. Revenue and expenses of these subsidiaries are translated using rates that approximate those in effect during the period. Translation adjustments are included in accumulated other comprehensive income (loss) within stockholders’ equity. The substantial majority of our revenue derived from customers outside of the United States is billed in local currencies from regional headquarters, for which the functional currency is the United States dollar. Foreign currency transaction gains or losses are included in interest and other income, net.
To minimize the risk from changes in foreign currency exchange rates, we have established a program that utilizes foreign currency forward contracts to offset the risks associated with the effects of certain foreign currency exposures. Gains or losses on our foreign currency exposures are offset by gains or losses on the foreign currency forward contracts entered into under this program. Our foreign currency exposures relate primarily to certain foreign currency denominated assets and liabilities. Our foreign currency forward contracts generally have terms of one month or less and are entered into at the prevailing market exchange rate at the end of each month. We do not use foreign currency forward contracts for speculative purposes. While these foreign currency forward contracts are utilized to hedge foreign currency exposures, they are not formally designated as hedges, and therefore, the changes in the fair values of these derivatives are recognized currently in earnings. We record these foreign currency forward contracts at fair value as either assets or liabilities depending on the net settlement position of the foreign currency forward contracts with each respective counterparty at the balance sheet date. All settlements of gains and losses related to the foreign currency forward contracts are included in cash flow from operating activities in the consolidated statements of cash flow.
Revenue Recognition
Software license revenue is recognized when persuasive evidence of an arrangement exists, delivery of the product has occurred, the fee is fixed or determinable, collection is probable and vendor-specific objective evidence (VSOE) of the fair value of undelivered elements exists. As substantially all of our software licenses are sold in multiple-element arrangements that include either maintenance or both maintenance and professional services, we use the residual method to determine the amount of license revenue to be recognized. Under the residual method, consideration is allocated to undelivered elements based upon VSOE of the fair value of those elements, with the residual of the arrangement fee allocated to and recognized as license revenue. We have established VSOE of the fair value of maintenance through independent maintenance renewals as well as, for certain new product offerings, management approved maintenance pricing which is evidenced by contractually stated maintenance renewal rates. These demonstrate a consistent relationship of pricing maintenance as a percentage of either the net license fee or the discounted or undiscounted license list price. VSOE of the fair value of professional services is established based on daily rates when sold on a stand-alone basis.
We are unable to establish VSOE of fair value for all undelivered elements in certain arrangements that include multiple software products for which the associated maintenance pricing is based on a combination of undiscounted license list prices, net license fees or discounted license list prices. We are also unable to establish VSOE of fair value for all undelivered elements in certain arrangements that include unlimited licensing rights and certain arrangements that contain rights to future unspecified software products as part of the maintenance offering. If VSOE of fair value of one or more undelivered elements does not exist, license revenue is deferred and recognized upon delivery of those elements or when VSOE of fair value exists for all remaining undelivered elements, or if the deferral is due to the factors described above, license revenue is recognized ratably over the longest expected delivery period of undelivered elements in the arrangement, which is typically the longest maintenance term.
66
Table of Contents
BMC SOFTWARE, INC.
NOTES TO CONSOLIDATED FINANCIAL STATEMENTS
In our time-based license agreements, we are unable to establish VSOE of fair value for undelivered maintenance elements because the contractual maintenance terms in these arrangements are the same duration as the license terms, and VSOE of fair value of maintenance cannot be established. Accordingly, license fees in time-based license arrangements are recognized ratably over the term of the arrangements.
Maintenance revenue is recognized ratably over the terms of the maintenance arrangements, which primarily range from one to three years.
Professional services revenue, which principally relates to implementation, integration and training services associated with our products, is derived under both time-and-material and fixed fee arrangements and in most instances is recognized on a proportional performance basis. If no discernable customer deliverable exists until the completion of the professional services, we apply the completed performance method and defer the recognition of professional services revenue until completion of the services, which is typically evidenced by a signed completion letter from the customer. Services that are sold in connection with software license arrangements generally qualify for separate accounting from the license elements because they do not involve significant production, modification or customization of our products and are not otherwise considered to be essential to the functionality of such products. In arrangements where the professional services do not qualify for separate accounting from the license elements, the combined software license and professional services revenue are recognized based on contract accounting using either the percentage-of-completion or completed-contract method.
We also execute arrangements through resellers, distributors and systems integrators (collectively, channel partners) in which the channel partners act as the principals in the transactions with the end users of our products and services. In license arrangements with channel partners, title and risk of loss pass to the channel partners upon execution of our arrangements with them and the delivery of our products to the channel partner. We recognize revenue from transactions with channel partners on a net basis (the amount actually received by us from the channel partners) when all other revenue recognition criteria are satisfied. We do not offer right of return, product rotation or price protection to any of our channel partners.
Revenue from license and maintenance transactions that are financed are generally recognized in the same manner as those requiring current payment, as we have a history of offering installment contracts to customers and successfully enforcing original payment terms without making concessions. In arrangements where the fees are not considered to be fixed or determinable, we recognize revenue when payments become due under the arrangement. If we determine that a transaction is not probable of collection or a risk of concession exists, we do not recognize revenue in excess of the amount of cash received.
We are required to charge certain taxes on our revenue transactions. These amounts are not included in revenue. Instead, we record a liability when the amounts are collected and relieve the liability when payments are made to the applicable government agency.
In our consolidated statements of operations, revenue is categorized as license, maintenance and professional services revenue. We allocate revenue from arrangements containing multiple elements to each of these categories based on the VSOE of fair value for elements in each revenue arrangement and the application of the residual method for arrangements in which we have established VSOE of fair value for all undelivered elements. In arrangements where we are not able to establish VSOE of fair value for all undelivered elements, we first allocate revenue to any undelivered elements for which VSOE of fair value has been established, then allocate revenue to any undelivered elements for which VSOE of fair value has not been established based upon management’s best estimate of fair value of those undelivered elements and apply a residual method to determine
67
Table of Contents
BMC SOFTWARE, INC.
NOTES TO CONSOLIDATED FINANCIAL STATEMENTS
the license fee. Management’s best estimate of fair value of undelivered elements for which VSOE of fair value has not been established is based upon the VSOE of similar offerings and other objective criteria.
Cost of License and Maintenance Revenue
Cost of license revenue is primarily comprised of the amortization of capitalized software costs for internally developed products, the amortization of acquired technology for products acquired through business combinations, license-based royalties to third parties and production and distribution costs for initial product licenses.
Cost of maintenance revenue is primarily comprised of the costs associated with the customer support and research and development personnel that provide maintenance, enhancement and support services to our customers.
Sales Commissions
We pay commissions, including sales bonuses, to our direct sales force related to revenue transactions under sales compensation plans established annually. We defer the portion of commissions that are directly related to license and maintenance revenue that is deferred. After initial deferral, these commissions are recognized as selling and marketing expenses in the consolidated statements of operations over the terms of the related customer contracts, in proportion to the recognition of the associated revenue. The commission payments, which are typically paid in full in the month following execution of the customer contracts, are a direct and incremental cost of the revenue arrangements. Deferred commissions as of March 31, 2010 and 2009 were $61.6 million and $61.4 million, respectively.
Share-Based Compensation
Compensation cost for share-based awards is recognized only for those awards that are expected to vest. We use the straight-line attribution method to allocate share-based compensation costs over the service period of the award.
Refer to Note 9 for further information regarding share-based compensation.
Recently Adopted Accounting Pronouncements
In July 2009, the Financial Accounting Standards Board (FASB) released the final version of its new “Accounting Standards Codification” (Codification) as the single authoritative source for GAAP. While not intended to change GAAP, the Codification significantly changed the way in which the accounting literature is organized, combining all authoritative standards into a comprehensive, topically organized database. All existing accounting standard documents were superseded and all other accounting literature not included in the Codification is considered nonauthoritative, other than guidance issued by the SEC. The Codification was effective for interim and annual periods ending on or after September 15, 2009. We adopted the Codification in our interim financial statements for the second quarter of fiscal 2010, which had no impact on our financial position, results of operations or cash flows.
In April 2009, the FASB issued guidance for estimating fair value when the volume or level of activity in a market for an asset or liability has decreased significantly. This guidance also provides information on identifying circumstances that indicate a transaction is not orderly (i.e., a forced liquidation or distressed sale). This guidance was effective for us beginning in fiscal 2010 and did not have a material impact on our financial position, results of operations or cash flows.
68
Table of Contents
BMC SOFTWARE, INC.
NOTES TO CONSOLIDATED FINANCIAL STATEMENTS
In April 2009, the FASB issued guidance that applies to investments in debt securities for which other-than-temporary impairments may be recorded. If an entity’s management asserts that it does not have the intent to sell a debt security and it is more likely than not that it will not be required to sell the security before recovery of its cost basis, then an entity may separate other-than temporary impairments into two components: (i) the amount related to credit losses (recorded in earnings) and (ii) all other amounts (recorded in other comprehensive income). This guidance was effective for us beginning in fiscal 2010 and did not have a material impact on our financial position, results of operations or cash flows.
In April 2009, the FASB issued guidance that requires disclosures about fair value of financial instruments in interim financial statements. This guidance was effective for us beginning in fiscal 2010, and because it applies only to financial statement disclosures, it had no impact on our financial position, results of operations or cash flows.
In June 2008, the FASB issued guidance clarifying that unvested share-based payment awards with a right to receive nonforfeitable dividends are participating securities and providing information on how to allocate earnings to participating securities to allow computation of basic and diluted earnings per share using the two-class method. This guidance was effective for us beginning in fiscal 2010 and requires retrospective application for periods prior to the effective date. The adoption of this guidance did not have a material impact on our computation of earnings per share. Refer to Note 11 for further information related to our computation of earnings per share.
In April 2008, the FASB issued guidance that amends the factors that should be considered in developing renewal or extension assumptions used to determine the useful life of a recognized intangible asset. This guidance was effective for us beginning in fiscal 2010 and did not have a material impact on our financial position, results of operations or cash flows.
In December 2007, the FASB issued a revision to previously issued accounting literature which changes the accounting for business combinations including: (i) the measurement of acquirer shares issued in consideration for a business combination, (ii) the recognition of contingent consideration, (iii) the accounting for preacquisition gain and loss contingencies, (iv) the recognition of capitalized in-process research and development (IPR&D), (v) the accounting for acquisition-related restructuring costs, (vi) the treatment of acquisition-related transaction costs, and (vii) the recognition of changes in the acquirer’s income tax valuation allowance. We began applying this guidance prospectively to all business combinations beginning in fiscal 2010. The impact of adoption on our financial position, results of operations or cash flows is dependent upon the nature and terms of business combinations that we consummate.
In September 2006, the FASB issued a new accounting standard which defines fair value, establishes a framework for measuring fair value and expands disclosures about fair value measurements. In February 2008, the FASB delayed the effective date of this standard to April 1, 2009 for all non-financial assets and non-financial liabilities, except those that are recognized or disclosed at fair value in the financial statements on a recurring basis (that is, at least annually). We adopted the new standard relating to assets and liabilities recognized or disclosed in the financial statements at fair value on a recurring basis on April 1, 2008, and on April 1, 2009 with regard to non-financial assets and non-financial liabilities. The adoption of these provisions did not have a material impact on our financial position, results of operations or cash flows.
(2) Business Combinations
Fiscal 2010 Acquisitions
During fiscal 2010, we completed the acquisitions of MQSoftware, Inc., a provider of middleware and enterprise application transaction management software, Tideway Systems Limited, a provider of IT discovery solutions, and Phurnace Software, Inc., a developer of software that automates the deployment and configuration
69
Table of Contents
BMC SOFTWARE, INC.
NOTES TO CONSOLIDATED FINANCIAL STATEMENTS
of business-critical Java EE applications, for combined purchase consideration of $94.3 million. The purchase consideration was allocated to acquired assets and assumed liabilities under the current accounting requirements for business combinations adopted April 1, 2009, consisting primarily of approximately $36.3 million of acquired technology and $9.4 million of customer relationships, with weighted average economic lives of approximately three years, in addition to other tangible assets and liabilities. These acquisitions resulted in a preliminary allocation of $62.3 million to goodwill, of which $13.8 million was assigned to the Mainframe Service Management (MSM) segment and $48.5 million was assigned to the Enterprise Service Management (ESM) segment. We are in the process of finalizing our assessment of the fair value of certain acquired assets and assumed liabilities, principally related to tax loss carryforwards and other deferred tax attributes, and will adjust the purchase price allocations when finalized. The operating results of the acquired companies have been included in our consolidated financial statements since the respective acquisition dates. Pro forma information is not included because the acquired companies’ operations would not have materially impacted our consolidated operating results.
Fiscal 2009 Acquisition
In April 2008, we completed the acquisition of all of the outstanding common shares of BladeLogic, Inc. (BladeLogic), a provider of data center automation software, for $28 per share. In addition, outstanding and unvested options to acquire the common stock of BladeLogic and other share-based awards were converted pursuant to the terms of the transaction into options to purchase our common stock and other share-based awards, respectively. BladeLogic’s operating results have been included in our consolidated financial statements since the acquisition date as part of our ESM segment. This acquisition expands our offerings for server provisioning, application release management, automation and compliance.
The acquisition of BladeLogic’s outstanding common stock and other equity instruments resulted in total purchase consideration of $854.0 million, including approximately $19.9 million of direct acquisition costs. The estimated fair values of the acquired assets and assumed liabilities at the date of acquisition were:
| April 18, 2008 |
||||
| (In millions) | ||||
| Cash and cash equivalents |
$ | 73.3 | ||
| Trade accounts receivable |
27.0 | |||
| Deferred tax assets |
36.5 | |||
| Other current assets |
1.5 | |||
| Property and equipment |
1.4 | |||
| Intangible assets |
214.8 | |||
| In-process research and development |
50.3 | |||
| Goodwill |
557.3 | |||
| Total assets |
962.1 | |||
| Current liabilities |
(14.3 | ) | ||
| Deferred tax liabilities |
(86.8 | ) | ||
| Deferred revenue |
(7.0 | ) | ||
| Total liabilities |
(108.1 | ) | ||
| Net assets acquired |
$ | 854.0 | ||
Factors that contributed to a purchase price that resulted in goodwill include, but are not limited to, the retention of research and development personnel with the skills to develop future BladeLogic technology, support personnel to provide maintenance services related to BladeLogic products and a trained sales force capable of
70
Table of Contents
BMC SOFTWARE, INC.
NOTES TO CONSOLIDATED FINANCIAL STATEMENTS
selling current and future BladeLogic products and the opportunity to cross-sell our products and BladeLogic products to existing customers. We believe that this acquisition will help us remain competitive in the Business Service Management market and improve the results of operations for our ESM segment. The goodwill resulting from the transaction was assigned to the ESM segment and is not expected to be deductible for tax purposes.
The acquired identifiable intangible assets consisted of:
| Fair Value | Useful Life in Years | ||||
| (In millions) | |||||
| Customer contracts and relationships |
$ | 113.9 | 4 | ||
| Developed product technology |
100.7 | 4 | |||
| Trademarks and tradenames |
0.2 | 1 | |||
| Total identifiable intangible assets |
$ | 214.8 | |||
Approximately $50.3 million of the purchase price was allocated to purchased IPR&D and was expensed at the acquisition date. The amounts allocated to IPR&D represent the estimated fair values, based on risk-adjusted cash flows and historical costs expended, related to core research and development projects that were incomplete and had neither reached technological feasibility nor been determined to have an alternative future use pending achievement of technological feasibility at the date of acquisition. The IPR&D relates primarily to the development of a major new release to an existing core product that was released in the fourth quarter of fiscal 2009.
The results of operations of BladeLogic are included in our consolidated statements of operations prospectively from April 18, 2008. The unaudited pro forma combined historical results of us and BladeLogic for fiscal 2009 and 2008, giving effect to the acquisition assuming the transaction was consummated at the beginning of each period presented, were:
| Year Ended March 31, | ||||||
| 2009 | 2008 | |||||
| (Unaudited) (In millions, except per share amounts) | ||||||
| Pro Forma Combined: |
||||||
| Revenue |
$ | 1,873.5 | $ | 1,802.1 | ||
| Net earnings |
278.3 | 236.8 | ||||
| Basic earnings per share |
1.48 | 1.20 | ||||
| Diluted earnings per share |
1.46 | 1.18 | ||||
The pro forma combined historical results prior to the date of acquisition do not reflect any cost savings or other synergies resulting from the transaction, are provided for informational purposes only and are not necessarily indicative of the combined results of operations for future periods or the results that actually would have been realized had the acquisition occurred at the beginning of each specified period. Pro forma net earnings for the year ended March 31, 2009 exclude the IPR&D charge of $50.3 million.
Fiscal 2008 Acquisitions
During fiscal 2008, we acquired all of the issued and outstanding capital stock of ProactiveNet, Inc., RealOps, Inc. and Emprisa Networks, Inc. for total cash consideration of $117.4 million including direct acquisition costs. The results of operations of these businesses have been included in our consolidated financial statements since the dates of the respective acquisitions. In connection with these acquisitions, we recorded intangible assets
71
Table of Contents
BMC SOFTWARE, INC.
NOTES TO CONSOLIDATED FINANCIAL STATEMENTS
consisting primarily of $29.4 million of acquired technology and $9.8 million of customer relationships, with weighted-average economic lives of approximately three and five years, respectively, in addition to other tangible assets and liabilities and wrote-off $4.0 million of IPR&D at the respective acquisition dates. These acquisitions resulted in a total of $61.4 million of goodwill that was assigned to the ESM segment, of which $12.6 million is expected to be deductible for tax purposes. The operating results of the acquired companies have been included in our consolidated financial statements since the respective acquisition dates.
(3) Financial Instruments
We measure certain financial instruments at fair value on a recurring basis using the following valuation techniques:
(A) Market approach – Uses prices and other relevant information generated by market transactions involving identical or comparable assets or liabilities.
(B) Income approach – Uses valuation techniques to convert future estimated cash flows to a single present amount based on current market expectations about those future amounts, using present value techniques.
The fair values of our financial instruments were determined using the following input levels and valuation techniques at March 31, 2010:
| Fair Value Measurements at Reporting Date Using | Valuation Technique |
|||||||||||||||
| Total | Quoted Prices in Active Markets for Identical Assets (Level 1) |
Significant Other Observable Inputs (Level 2) |
Significant Unobservable Inputs (Level 3) |
|||||||||||||
| (In millions) | ||||||||||||||||
| Assets |
||||||||||||||||
| Cash equivalents |
||||||||||||||||
| Money-market funds |
$ | 757.6 | $ | 757.6 | $ | — | $ | — | A | |||||||
| United States Treasury securities |
200.0 | 200.0 | — | — | A | |||||||||||
| Certificates of deposit |
12.6 | 12.6 | — | — | A | |||||||||||
| Short-term and long-term investments |
||||||||||||||||
| United States Treasury securities |
50.0 | 50.0 | — | — | A | |||||||||||
| Auction rate securities |
60.5 | — | — | 60.5 | B | |||||||||||
| Mutual funds and other |
17.4 | 17.4 | — | — | A | |||||||||||
| Foreign currency forward contracts |
3.5 | — | 3.5 | — | A | |||||||||||
| Auction rate securities put option |
1.1 | — | — | 1.1 | B | |||||||||||
| Total |
$ | 1,102.7 | $ | 1,037.6 | $ | 3.5 | $ | 61.6 | ||||||||
| Liabilities |
||||||||||||||||
| Foreign currency forward contracts |
$ | (1.0 | ) | $ | — | $ | (1.0 | ) | $ | — | A | |||||
| Total |
$ | (1.0 | ) | $ | — | $ | (1.0 | ) | $ | — | ||||||
Level 1 classification is applied to any asset or liability that has a readily available quoted market price from an active market where there is significant transparency in the executed/quoted price.
Level 2 classification is applied to assets and liabilities that have evaluated prices where the data inputs to these valuations are observable either directly or indirectly, but do not represent quoted market prices from an active market.
Level 3 classification is applied to assets and liabilities when prices are not derived from existing market data and requires us to develop our own assumptions about how market participants would price the asset or liability.
72
Table of Contents
BMC SOFTWARE, INC.
NOTES TO CONSOLIDATED FINANCIAL STATEMENTS
The following table summarizes the activity in Level 3 financial instruments:
| Year Ended March 31, | |||||||||||||||||||||||
| 2010 | 2009 | ||||||||||||||||||||||
| Auction Rate Securities |
Put Option |
Total | Auction Rate Securities |
Put Option |
Total | ||||||||||||||||||
| (In millions) | |||||||||||||||||||||||
| Balance at the beginning of year |
$ | 60.0 | $ | 2.0 | $ | 62.0 | $ | 68.9 | $ | — | $ | 68.9 | |||||||||||
| Redemption of auction rate securities |
(4.9 | ) | — | (4.9 | ) | — | — | — | |||||||||||||||
| Gain (loss) related to put option included in interest and other income, net |
— | (0.9 | ) | (0.9 | ) | — | 2.0 | 2.0 | |||||||||||||||
| Change in unrealized gain (loss) included in interest and other income, net |
0.9 | — | 0.9 | (2.0 | ) | — | (2.0 | ) | |||||||||||||||
| Change in unrealized gain (loss) included in other comprehensive income |
4.5 | — | 4.5 | (6.9 | ) | — | (6.9 | ) | |||||||||||||||
| Balance at the end of year |
$ | 60.5 | $ | 1.1 | $ | 61.6 | $ | 60.0 | $ | 2.0 | $ | 62.0 | |||||||||||
Investments
Our cash, cash equivalents and investments were comprised of the following at March 31, 2010 and 2009:
| March 31, | ||||||||||||||||||
| 2010 | 2009 | |||||||||||||||||
| Cash and Cash Equivalents |
Short-term Investments |
Long-term Investments |
Cash and Cash Equivalents |
Short-term Investments |
Long-term Investments | |||||||||||||
| (In millions) | ||||||||||||||||||
| Measured at fair value: |
||||||||||||||||||
| Available-for-sale |
||||||||||||||||||
| United States Treasury securities |
$ | 200.0 | $ | 50.0 | $ | — | $ | 276.2 | $ | 35.0 | $ | — | ||||||
| Certificates of deposit |
12.6 | — | — | 24.9 | 38.6 | — | ||||||||||||
| Auction rate securities |
— | — | 45.0 | — | — | 44.3 | ||||||||||||
| Trading |
||||||||||||||||||
| Mutual funds and others |
— | — | 17.4 | — | — | 12.3 | ||||||||||||
| Auction rate securities |
— | 15.5 | — | — | — | 15.7 | ||||||||||||
| Total debt and equity investments measured at fair value |
212.6 | 65.5 | 62.4 | 301.1 | 73.6 | 72.3 | ||||||||||||
| Other measurement basis: |
||||||||||||||||||
| Cash on hand |
398.4 | — | — | 227.3 | — | — | ||||||||||||
| Money-market funds |
757.6 | — | — | 494.9 | — | — | ||||||||||||
| Total cash, cash equivalents and investments |
$ | 1,368.6 | $ | 65.5 | $ | 62.4 | $ | 1,023.3 | $ | 73.6 | $ | 72.3 | ||||||
| Amounts included in accumulated other comprehensive income from available-for-sale securities (pre-tax): |
||||||||||||||||||
| Unrealized losses* |
$ | — | $ | — | $ | 5.7 | $ | — | $ | — | $ | 10.2 | ||||||
| * | The unrealized losses on available-for-sale securities at March 31, 2010 and 2009 relate to the auction rate securities. |
73
Table of Contents
BMC SOFTWARE, INC.
NOTES TO CONSOLIDATED FINANCIAL STATEMENTS
The following summarizes the contractual underlying maturities of our available-for-sale investments in debt securities:
| Year Ended March 31, | ||||||||||||
| 2010 | 2009 | |||||||||||
| Cost | Fair Value |
Cost | Fair Value | |||||||||
| (In millions) | ||||||||||||
| Due in one year or less |
$ | 262.6 | $ | 262.6 | $ | 374.7 | $ | 374.7 | ||||
| Due after ten years |
50.7 | 45.0 | 54.5 | 44.3 | ||||||||
Proceeds from the sale of available-for-sale securities, gross realized gains and gross realized losses were:
| Year Ended March 31, | |||||||||||
| 2010 | 2009 | 2008 | |||||||||
| (In millions) | |||||||||||
| Proceeds from sales |
$ | — | $ | 153.2 | $ | 207.5 | |||||
| Gross realized gains |
— | 1.6 | 4.8 | ||||||||
| Gross realized losses |
— | (2.6 | ) | (1.2 | ) | ||||||
At March 31, 2010, we held auction rate securities with a par value of $67.3 million, of which securities with a par value of $50.7 million were classified as available-for-sale and a par value of $16.6 million were classified as trading. The total estimated fair value of our auction rate securities was $60.5 million and $60.0 million at March 31, 2010 and 2009, respectively. Our auction rate securities consist entirely of bonds issued by public agencies that are backed by student loans with at least a 97% guarantee by the federal government under the United States Department of Education’s Federal Family Education Loan Program. All of these bonds are currently rated investment grade by Moody’s or Standard and Poor’s. Auctions for these securities began failing in early 2008 and have continued to fail, resulting in our continuing to hold such securities and the issuers paying interest at the maximum contractual rates. We do not believe that any of the underlying issuers of these auction rate securities are presently at risk or that the underlying credit quality of the assets backing the auction rate security investments has been impacted by the reduced liquidity of these investments. Due to the illiquidity in the auction rate securities market caused by failed auctions, we estimated the fair value of these securities and the put option discussed below using internally developed models of the expected cash flows of the securities which incorporate assumptions about the expected cash flows of the underlying student loans and estimates of the rate of return required by investors, which includes an adjustment to reflect a lack of liquidity in the market for these securities.
In November 2008, we entered into a put agreement with a bank from which we have acquired certain auction rate securities with a remaining par value of $16.6 million and an estimated fair value of $15.5 million at March 31, 2010. Under the terms of the agreement, we have the ability to put these auction rate securities to the bank at par value at any time during the period beginning June 30, 2010 and ending June 30, 2012. The bank also has the right to repurchase these auction rate securities at par value on or before June 30, 2010. These auction rate securities have been classified as trading securities and, accordingly, any changes in the fair value of these securities are recognized in earnings. In addition, we have elected the option under GAAP to record the put option at fair value. The fair value adjustments to these auction rate securities and the related put option resulted in minimal net impact to the consolidated statements of operations for fiscal 2010 and 2009.
The unrealized loss on our available-for-sale auction rate securities, which have a fair value of $45.0 million at March 31, 2010, was $5.7 million at March 31, 2010 and was recorded in accumulated other comprehensive income (loss) as we believe the decline in fair value of these auction rate securities is temporary. In making this determination, we primarily considered the financial condition and near-term prospects of the issuers, the
74
Table of Contents
BMC SOFTWARE, INC.
NOTES TO CONSOLIDATED FINANCIAL STATEMENTS
probability scheduled cash flows will continue to be made and the likelihood we would be required to sell the investments before recovery of our cost basis. These available-for-sale auction rate securities have been in an unrealized loss position for greater than twelve months. Because of the uncertainty related to the timing of liquidity associated with these auction rate securities, these securities are classified as long-term investments at March 31, 2010 and 2009.
Derivative Financial Instruments
The fair value of our outstanding foreign currency forward contracts that closed in a gain position at March 31, 2010 and 2009 was $3.5 million and $0.7 million, respectively, and was recorded as other current assets in our consolidated balance sheets. The fair value of our outstanding foreign currency forward contracts that closed in a loss position at March 31, 2010 and 2009 was $1.0 million and $8.3 million, respectively, and was recorded as accrued liabilities in our consolidated balance sheets. The notional amounts at contract exchange rates of our foreign currency forward contracts outstanding were:
| Notional Amount | ||||||
| March 31, | ||||||
| 2010 | 2009 | |||||
| (In millions) | ||||||
| Foreign Currency Forward Contracts (Receive United States dollar/pay foreign currency) |
||||||
| Euro |
$ | 98.2 | $ | 132.8 | ||
| Brazilian real |
24.9 | 3.6 | ||||
| Australian dollar |
15.4 | 3.8 | ||||
| South Korean won |
6.0 | 9.4 | ||||
| Chinese yuan renminbi |
4.6 | 8.0 | ||||
| New Zealand dollar |
4.5 | 2.5 | ||||
| Swiss franc |
2.6 | 4.5 | ||||
| British pound |
— | 29.4 | ||||
| Other |
14.7 | 19.5 | ||||
| Total |
$ | 170.9 | $ | 213.5 | ||
| Foreign Currency Forward Contracts (Pay United States dollar/receive foreign currency) |
||||||
| Israeli shekel |
$ | 78.0 | $ | — | ||
| Indian rupee |
11.5 | 24.3 | ||||
| Mexican peso |
1.5 | 11.5 | ||||
| Other |
4.5 | 1.7 | ||||
| Total |
$ | 95.5 | $ | 37.5 | ||
The effect of the foreign currency forward contracts for the year ended March 31, 2010, 2009 and 2008 was a loss of $9.9 million, a gain of $26.4 million and a loss of $32.2 million, respectively, which, after including gains and losses on our foreign currency exposure, resulted in a loss of $2.2 million, a loss of $5.3 million and a gain of $0.5 million, respectively, recorded in interest and other income, net.
We are exposed to credit-related losses in the event of non-performance by counterparties to derivative financial instruments, but we do not expect any counterparties to fail to meet their obligations given their high credit ratings. In addition, we diversify this risk across several counterparties and utilize netting agreements to mitigate the counterparty credit risk.
75
Table of Contents
BMC SOFTWARE, INC.
NOTES TO CONSOLIDATED FINANCIAL STATEMENTS
Other Financial Instruments
The fair value of the senior unsecured notes due 2018 at March 31, 2010 and 2009, based on market prices, was $338.1 million and $275.1 million, respectively, compared to the carrying value of $298.5 million and $298.4 million, respectively.
The carrying values of all other financial instruments, consisting primarily of cash, money-market funds, trade and finance receivables, accounts payable and other borrowings, approximate their respective fair values.
(4) Property and Equipment
Property and equipment at March 31, 2010 and 2009 consisted of:
| March 31, | ||||||||
| 2010 | 2009 | |||||||
| (In millions) | ||||||||
| Computers, software, furniture and equipment |
$ | 493.8 | $ | 466.1 | ||||
| Leasehold improvements |
43.9 | 41.1 | ||||||
| Projects in progress |
4.8 | 6.3 | ||||||
| 542.5 | 513.5 | |||||||
| Less accumulated depreciation and amortization |
(447.5 | ) | (410.5 | ) | ||||
| Property and equipment, net |
$ | 95.0 | $ | 103.0 | ||||
Property and equipment includes computer equipment procured by us under capital lease arrangements with net book values of $13.7 million and $19.9 million (net of $12.9 million and $6.0 million in accumulated depreciation) at March 31, 2010 and 2009, respectively. Depreciation of capital lease equipment is included in depreciation expense. Depreciation expense recorded during fiscal 2010, 2009 and 2008 was $38.2 million, $42.4 million and $45.8 million, respectively.
(5) Intangible Assets and Goodwill
Intangible assets at March 31, 2010 and 2009 consisted of:
| March 31, | ||||||||||||
| 2010 | 2009 | |||||||||||
| Gross Carrying Amount |
Net Book Value |
Gross Carrying Amount |
Net Book Value | |||||||||
| (In millions) | ||||||||||||
| Acquired technology |
$ | 548.4 | $ | 88.7 | $ | 507.2 | $ | 96.5 | ||||
| Customer relationships |
254.3 | 70.1 | 243.2 | 93.4 | ||||||||
| Tradenames and trademarks |
29.3 | — | 29.1 | — | ||||||||
| Total intangible assets |
$ | 832.0 | $ | 158.8 | $ | 779.5 | $ | 189.9 | ||||
Amortization of acquired technology totaling $43.8 million, $44.6 million and $27.6 million was included in cost of license revenue in the consolidated statements of operations for fiscal 2010, 2009 and 2008, respectively. Amortization of other intangible assets is included in amortization of intangible assets in the consolidated statements of operations. The weighted average remaining life of acquired technology and customer relationships is approximately 1.8 years and 2.3 years at March 31, 2010 and 2009, respectively.
76
Table of Contents
BMC SOFTWARE, INC.
NOTES TO CONSOLIDATED FINANCIAL STATEMENTS
Future amortization expense associated with our intangible assets existing at March 31, 2010 is expected to be:
| Year Ending March 31, | |||
| (In millions) | |||
| 2011 |
$ | 76.4 | |
| 2012 |
69.6 | ||
| 2013 |
12.8 | ||
| $ | 158.8 | ||
The following table summarizes goodwill activity and ending goodwill balances by operating segment:
| Enterprise Service Management |
Mainframe Service Management |
Total | |||||||||
| (In millions) | |||||||||||
| Balance at March 31, 2008 |
$ | 684.5 | $ | 72.0 | $ | 756.5 | |||||
| Goodwill acquired during the year |
557.8 | — | 557.8 | ||||||||
| Effect of foreign currency exchange rate changes |
(25.6 | ) | — | (25.6 | ) | ||||||
| Balance at March 31, 2009 |
1,216.7 | 72.0 | 1,288.7 | ||||||||
| Goodwill acquired during the year |
48.5 | 13.8 | 62.3 | ||||||||
| Effect of foreign currency exchange rate changes |
14.6 | — | 14.6 | ||||||||
| Balance at March 31, 2010 |
$ | 1,279.8 | $ | 85.8 | $ | 1,365.6 | |||||
(6) Long-Term Borrowings
Long-term borrowings at March 31, 2010 and 2009 consisted of:
| March 31, | ||||||||
| 2010 | 2009 | |||||||
| (In millions) | ||||||||
| Senior unsecured notes due 2018 (net of $1.5 million and $1.6 million of unamortized discount at March 31, 2010 and 2009) |
$ | 298.5 | $ | 298.4 | ||||
| Capital leases and other obligations |
62.6 | 23.1 | ||||||
| Total |
361.1 | 321.5 | ||||||
| Less current maturities of capital leases and other obligations (included in accrued liabilities) |
(20.2 | ) | (7.9 | ) | ||||
| Long-term borrowings |
$ | 340.9 | $ | 313.6 | ||||
In June 2008, we issued $300.0 million of senior unsecured notes due in 2018 (the Notes). Net proceeds to us after original issuance discount and issuance costs amounted to $295.6 million, which were used for general corporate purposes. The Notes were issued at an original issuance discount of $1.8 million. The Notes bear interest at a rate of 7.25% per annum payable semi-annually in June and December of each year. The Notes are redeemable at our option at any time in whole or, from time to time, in part at a redemption price equal to the greater of: (i) 100% of the principal amount of the Notes to be redeemed, or (ii) the sum of the present values of the remaining scheduled payments of principal and interest discounted at the applicable United States Treasury rate plus 50 basis points, plus accrued and unpaid interest. The Notes are subject to the provisions of an indenture
77
Table of Contents
BMC SOFTWARE, INC.
NOTES TO CONSOLIDATED FINANCIAL STATEMENTS
which includes covenants limiting, among other things, the creation of liens securing indebtedness and sale-leaseback transactions. At March 31, 2010, we were in compliance with all such debt covenants.
(7) Deferred Revenue
Deferred revenue is comprised of deferred maintenance, license and professional services revenue. Deferred maintenance revenue is not recorded on arrangements with trade payment terms until the related maintenance fees have been collected. The components of deferred revenue at March 31, 2010 and 2009 were:
| March 31, | ||||||
| 2010 | 2009 | |||||
| (In millions) | ||||||
| Current: |
||||||
| Maintenance |
$ | 637.6 | $ | 637.6 | ||
| License |
319.0 | 322.2 | ||||
| Professional services |
19.3 | 17.5 | ||||
| Total current deferred revenue |
975.9 | 977.3 | ||||
| Long-term: |
||||||
| Maintenance |
542.0 | 521.5 | ||||
| License |
305.2 | 288.7 | ||||
| Professional services |
— | 0.4 | ||||
| Total long-term deferred revenue |
847.2 | 810.6 | ||||
| Total deferred revenue |
$ | 1,823.1 | $ | 1,787.9 | ||
(8) Income Taxes
The income tax provision for fiscal 2010, 2009 and 2008 consists of:
| Year Ended March 31, | ||||||||||||
| 2010 | 2009 | 2008 | ||||||||||
| (In millions) | ||||||||||||
| Current: |
||||||||||||
| Federal |
$ | 26.2 | $ | 62.8 | $ | 156.3 | ||||||
| State |
(0.5 | ) | 11.3 | 10.1 | ||||||||
| Foreign |
44.2 | 48.6 | 30.6 | |||||||||
| Total current |
69.9 | 122.7 | 197.0 | |||||||||
| Deferred: |
||||||||||||
| Federal |
24.6 | 33.3 | (65.0 | ) | ||||||||
| State |
4.3 | (4.0 | ) | (7.3 | ) | |||||||
| Foreign |
(0.7 | ) | (26.2 | ) | (3.9 | ) | ||||||
| Total deferred |
28.2 | 3.1 | (76.2 | ) | ||||||||
| Income tax provision |
$ | 98.1 | $ | 125.8 | $ | 120.8 | ||||||
The foreign income tax provision was based on foreign pre-tax earnings of $214.5 million, $173.0 million and $170.4 million for fiscal 2010, 2009 and 2008, respectively. The federal income tax provision includes the United States tax effects of certain foreign entities that are treated as a branch of the United States entity for tax purposes and therefore their earnings are included in the United States consolidated income tax return.
78
Table of Contents
BMC SOFTWARE, INC.
NOTES TO CONSOLIDATED FINANCIAL STATEMENTS
A reconciliation of income tax computed at the United States federal statutory rate of 35% to reported income tax expense for fiscal 2010, 2009 and 2008 follows (dollars in millions):
| Year Ended March 31, | |||||||||||||||||||||
| 2010 | 2009 | 2008 | |||||||||||||||||||
| Amount | Percent | Amount | Percent | Amount | Percent | ||||||||||||||||
| Expense computed at United States statutory rate |
$ | 176.5 | 35.0 | % | $ | 127.4 | 35.0 | % | $ | 152.0 | 35.0 | % | |||||||||
| Effect of foreign rate differentials |
(29.7 | ) | (5.9 | )% | (21.9 | ) | (6.0 | )% | (27.6 | ) | (6.4 | )% | |||||||||
| Extraterritorial income and production activities deductions |
(51.5 | ) | (10.2 | )% | (22.3 | ) | (6.1 | )% | (25.5 | ) | (5.8 | )% | |||||||||
| State income taxes, net of federal benefit |
3.1 | 0.6 | % | 4.7 | 1.3 | % | 1.8 | 0.4 | % | ||||||||||||
| In-process research and development |
— | — | 24.1 | 6.6 | % | 1.4 | 0.3 | % | |||||||||||||
| Other, net |
(0.3 | ) | — | 13.8 | 3.8 | % | 18.7 | 4.3 | % | ||||||||||||
| $ | 98.1 | 19.5 | % | $ | 125.8 | 34.6 | % | $ | 120.8 | 27.8 | % | ||||||||||
Deferred income taxes reflect the net tax effects of temporary differences between the carrying amounts of assets and liabilities recognized for financial reporting purposes and the related amounts recognized for income tax purposes. The significant components of deferred tax assets and liabilities at March 31, 2010 and 2009 were:
| March 31, | ||||||||
| 2010 | 2009 | |||||||
| (In millions) | ||||||||
| Deferred tax assets: |
||||||||
| Deferred revenue |
$ | 60.4 | $ | 69.6 | ||||
| Compensation plans |
49.2 | 39.4 | ||||||
| Property and equipment, net |
7.8 | 13.7 | ||||||
| Acquired intangible assets |
— | 11.7 | ||||||
| Net operating loss carryforwards |
36.0 | 46.1 | ||||||
| Tax credit carryforwards |
2.4 | 1.0 | ||||||
| Other |
75.2 | 76.4 | ||||||
| Total gross deferred tax asset |
231.0 | 257.9 | ||||||
| Valuation allowance |
(9.1 | ) | (21.2 | ) | ||||
| Total deferred tax asset |
221.9 | 236.7 | ||||||
| Deferred tax liabilities: |
||||||||
| Software development costs |
(54.0 | ) | (45.6 | ) | ||||
| Acquired intangible assets |
(5.5 | ) | — | |||||
| Other |
(49.0 | ) | (33.8 | ) | ||||
| Total deferred tax liability |
(108.5 | ) | (79.4 | ) | ||||
| Net deferred tax asset |
$ | 113.4 | $ | 157.3 | ||||
| As reported: |
||||||||
| Deferred tax assets |
$ | 53.7 | $ | 68.0 | ||||
| Other long-term assets |
$ | 80.0 | $ | 105.1 | ||||
| Accrued liabilities |
$ | (5.0 | ) | $ | (6.1 | ) | ||
| Other long-term liabilities |
$ | (15.3 | ) | $ | (9.7 | ) | ||
79
Table of Contents
BMC SOFTWARE, INC.
NOTES TO CONSOLIDATED FINANCIAL STATEMENTS
In evaluating our ability to realize our deferred tax assets, we consider all available evidence, both positive and negative, including our past operating results, reversals of existing temporary differences, tax planning strategies and forecasts of future taxable income. In considering these sources of taxable income, we must make certain assumptions and judgments that are based on the plans and estimates used to manage our underlying business. Changes in our assumptions, plans and estimates may materially impact income tax expense.
We maintain a valuation allowance against certain tax credits and net operating losses that we do not believe are more likely than not to be utilized in the future. The valuation allowance increased (decreased) by $(12.1) million, $(10.3) million and $16.3 million during fiscal 2010, 2009 and 2008, respectively. At March 31, 2010, we have federal net operating loss carryforwards of $70.6 million, state net operating loss carryforwards of $28.0 million and foreign net operating loss carryforwards of $11.7 million, which expire between 2015 and 2029. These tax credits and net operating losses have arisen from various acquisitions as well as from net operating losses generated in certain state and foreign jurisdictions. Certain of the net operating loss carryforward assets are subject to an annual limitation under Internal Revenue Code Section 382, but are expected to be fully realized.
Aggregate unremitted earnings of certain foreign subsidiaries for which United States federal income taxes have not been provided are $318.6 million at March 31, 2010. Deferred income taxes have not been provided on these earnings because we consider them to be indefinitely re-invested. If these earnings were repatriated to the United States or they were no longer determined to be indefinitely re-invested, we would have to record a tax liability for these earnings of approximately $77.6 million, assuming full utilization of the foreign tax credits associated with these earnings.
We carry out our business operations through legal entities in the United States and multiple foreign jurisdictions. These jurisdictions require that we file corporate income tax returns that are subject to United States, state and foreign tax laws. We are subject to routine corporate income tax audits in these multiple jurisdictions.
We adopted the current accounting standards for uncertain tax positions on April 1, 2007. The cumulative effect of this guidance was recorded at April 1, 2007 as a decrease to retained earnings of $37.1 million. The total amount of unrecognized tax benefits at March 31, 2010 and 2009 and April 1, 2007 was $106.4 million, $106.3 million and $82.2 million, respectively, of which $95.1 million, $88.9 million and $62.6 million, respectively, would impact our effective tax rate if recognized. We do not anticipate any significant changes in the total amount of unrecognized tax benefits to occur within the next twelve months.
Activity related to our unrecognized tax benefits consists of:
| Year Ended March 31, | ||||||||||||
| 2010 | 2009 | 2008 | ||||||||||
| (In millions) | ||||||||||||
| Beginning of year |
$ | 106.3 | $ | 111.6 | $ | 82.2 | ||||||
| Increases related to current year tax positions |
6.0 | 7.4 | 7.5 | |||||||||
| Decreases related to current year tax positions |
— | (0.5 | ) | — | ||||||||
| Increases related to prior year tax positions |
21.0 | 23.4 | 28.2 | |||||||||
| Decreases related to prior year tax positions |
(20.7 | ) | (25.8 | ) | — | |||||||
| Decreases related to settlements with taxing authorities |
(2.0 | ) | (5.4 | ) | (9.0 | ) | ||||||
| Decreases related to lapses of statutes of limitations |
(3.9 | ) | (1.4 | ) | (0.6 | ) | ||||||
| Impact of foreign currency exchange rate changes |
(0.3 | ) | (3.0 | ) | 3.3 | |||||||
| End of year |
$ | 106.4 | $ | 106.3 | $ | 111.6 | ||||||
80
Table of Contents
BMC SOFTWARE, INC.
NOTES TO CONSOLIDATED FINANCIAL STATEMENTS
We recognize interest and penalties related to uncertain tax positions in income tax expense. To the extent accrued interest and penalties do not ultimately become payable, amounts accrued will be reduced and reflected as a reduction of the overall income tax provision in the period that such determination is made. We recognized $2.4 million, $11.5 million and $10.1 million of interest and penalties during fiscal 2010, 2009 and 2008, respectively. The total amount of accrued interest and penalties related to uncertain tax positions was $37.7 million and $35.3 million at March 31, 2010 and 2009, respectively.
We file a federal income tax return in the United States as well as income tax returns in various local, state and foreign jurisdictions. Our tax years are closed with the United States Internal Revenue Service (IRS) through the tax year ended March 31, 2003, except to the extent of net operating loss carryforwards from fiscal 2003 to later years. During the fourth quarter of fiscal 2010 and early fiscal 2011, we settled all open issues with the IRS resulting from the audit of our tax years ended March 31, 2004 and 2005 and, during the fourth quarter of fiscal 2010, recorded a net tax benefit of approximately $30.0 million related to additional extraterritorial income deductions. During fiscal 2009, the IRS completed its examination of our federal income tax returns for the tax years ended March 31, 2006 and 2007 and issued a Revenue Agent Report (RAR) thereon. We have filed a protest letter contesting certain adjustments included in the RAR and are having settlement discussions with the IRS Office of Appeals. The IRS has also initiated an examination of our federal income tax return for the tax year ended March 31, 2008. In addition, certain tax years related to local, state, and foreign jurisdictions remain subject to examination. To provide for potential tax exposures, we maintain a liability for unrecognized tax benefits which we believe is adequate.
(9) Share-Based Compensation
We have various share-based compensation plans that authorize, among other types of awards, (i) the discretionary granting of stock options to purchase shares of our common stock, and (ii) the discretionary issuance of nonvested common stock awards directly in the form of time-based, market performance-based and performance-based nonvested stock and units. The share-based awards granted by us generally contain vesting provisions ranging from one to four years, and with respect to stock options granted by us, have a term of not more than ten years from the date of grant. Options granted to employees generally vest monthly over four years and have a term of six years. Options granted to non-employee board members become fully vested within one year from the date of grant and have terms of ten years with respect to grants through fiscal 2008 and six years for all subsequent grants.
We granted 0.2 million, 5.1 million and 5.1 million stock options and 3.0 million, 3.5 million and 0.8 million nonvested stock awards during fiscal 2010, 2009 and 2008, respectively. There were no significant modifications made to any share-based grants during these periods. At March 31, 2010, there were 16.7 million shares available for grant under our share-based compensation plans. However, to the extent that we issue nonvested stock awards from the 2007 and 1994 plans, the plans require us to reduce shares available for grant by a factor of 2.25 shares and 2.0 shares, respectively, for each nonvested stock award actually granted.
We also sponsor an employee stock purchase plan that permits eligible employees to acquire shares of our stock at a 15% discount to the lower of the market price of our common stock at the beginning or end of six-month offering periods.
Share-based compensation costs for stock options are based on the fair value calculated from the Black-Scholes option-pricing model on the date of grant for stock options and on the first day of the offering period for the employee stock purchase plan. The fair value of nonvested stock awards equals their intrinsic value on the
81
Table of Contents
BMC SOFTWARE, INC.
NOTES TO CONSOLIDATED FINANCIAL STATEMENTS
date of grant, except for certain market performance-based nonvested stock awards, for which the fair value is calculated using a Monte Carlo simulation model on the date of grant. The fair values of stock grants are amortized as compensation expense on a straight-line basis over the vesting period of the grants. Compensation expense recognized is shown in the operating activities section in the consolidated statements of cash flows.
We estimate the volatility of our stock price by using a combination of both historical volatility and implied volatility derived from traded options on our common stock in the marketplace. We believe that the combination of historical volatility and implied volatility provides a better estimate of future stock price volatility. The expected term of options granted has been derived from the simplified method allowed by relevant accounting standards, due to changes in vesting terms and contractual lives of current options compared to our historical grants. We base the estimate of the risk-free interest rate on the United States Treasury zero-coupon yield curve in effect at the time of grant. We have never paid cash dividends and do not currently intend to pay cash dividends; accordingly, we have assumed a dividend yield of zero.
We are required to estimate potential forfeitures of share-based awards and adjust compensation cost recorded accordingly. The estimate of forfeitures is adjusted over the requisite service period to the extent that actual forfeitures differ, or are expected to differ, from such estimates. Changes in estimated forfeitures are recognized through a cumulative catch-up adjustment in the period of change and thus impact the amount of share-based compensation expense to be recognized in future periods. There were no significant changes in estimated forfeitures in fiscal 2010, 2009 or 2008 as compared to estimates when the related expenses were originally recorded.
The fair value of share-based payments was estimated using the Black-Scholes and Monte Carlo simulation models with the following weighted-average assumptions:
| Year Ended March 31, | |||||||||
| 2010 | 2009 | 2008 | |||||||
| Expected volatility |
35 | % | 33 | % | 30 | % | |||
| Risk-free interest rate % |
2.0 | % | 2.9 | % | 4.9 | % | |||
| Expected term (in years) |
4 | 4 | 4 | ||||||
| Dividend yield |
— | — | — | ||||||
A summary of our stock compensation activity for fiscal 2010 follows:
| Stock Options |
Shares | Weighted- Average Exercise Price |
Weighted- Average Remaining Contractual Term |
Aggregate Intrinsic Value | |||||||
| (In millions) | (In years) | (In millions) | |||||||||
| Outstanding at March 31, 2009 |
17.1 | $ | 28 | 4 | $ | 126.5 | |||||
| Granted |
0.2 | 34 | |||||||||
| Exercised |
(3.8 | ) | 21 | ||||||||
| Cancelled or expired |
(1.4 | ) | 39 | ||||||||
| Outstanding at March 31, 2010 |
12.1 | $ | 29 | 4 | $ | 114.9 | |||||
| Vested at March 31, 2010 and expected to vest |
11.8 | $ | 29 | 4 | $ | 113.7 | |||||
| Exercisable at March 31, 2010 |
8.4 | $ | 27 | 3 | $ | 98.4 | |||||
82
Table of Contents
BMC SOFTWARE, INC.
NOTES TO CONSOLIDATED FINANCIAL STATEMENTS
| Nonvested Stock and Stock Units |
Shares | Weighted- Average Grant Date Fair Value |
Weighted- Average Remaining Vesting Term | |||||
| (In millions) | (In years) | |||||||
| Outstanding at March 31, 2009 |
3.9 | $ | 33 | 3 | ||||
| Granted |
3.0 | |||||||
| Vested |
(1.1 | ) | ||||||
| Cancelled or expired |
(0.5 | ) | ||||||
| Outstanding at March 31, 2010 |
5.3 | $ | 35 | 1 | ||||
Included in the table above were 0.1 million and 0.1 million performance-based nonvested stock awards and market performance-based nonvested stock awards, respectively, outstanding at March 31, 2010 granted to selected executives and other key employees. The performance-based nonvested stock awards, whose vesting is contingent upon us meeting certain profitability targets for fiscal 2010 and 2011, were valued based on the fair value of our common stock on the date of grant. The vesting of the market performance-based nonvested stock awards is contingent on our relative total shareholder return as compared to a set of peer companies over each performance period.
The following table summarizes weighted average grant date fair value and additional intrinsic value and vesting information:
| Year Ended March 31, | |||||||||
| 2010 | 2009 | 2008 | |||||||
| Weighted Average Fair Value |
|||||||||
| Per grant of stock options |
$ | 10 | $ | 11 | $ | 10 | |||
| Per grant of nonvested stock and stock units |
$ | 35 | $ | 33 | $ | 32 | |||
| Share-Based Payment and Stock Option Values |
|||||||||
| Intrinsic value of stock options exercised (millions) |
$ | 63.0 | $ | 70.4 | $ | 93.6 | |||
| Intrinsic value of nonvested stock and stock units that vested (millions) |
$ | 38.9 | $ | 55.3 | $ | 1.7 | |||
| Grant date fair value of nonvested stock and stock units that vested |
$ | 32 | $ | 23 | $ | 19 | |||
Our outstanding options at March 31, 2010 were (shares in millions):
| Outstanding Options | Exercisable Options | |||||||||||
| Range of Exercise Prices |
Shares | Weighted Average Exercise Price |
Weighted Average Remaining Contractual Life |
Shares | Weighted Average Exercise Price | |||||||
| $0.00 – 17.40 |
1.5 | $ | 14 | 4 | 1.4 | $ | 15 | |||||
| $17.41 – 19.93 |
1.7 | 19 | 3 | 1.7 | 19 | |||||||
| $19.94 – 25.41 |
1.3 | 22 | 3 | 1.0 | 22 | |||||||
| $25.42 – 31.69 |
0.8 | 28 | 5 | 0.6 | 28 | |||||||
| $31.70 – 32.15 |
2.6 | 32 | 3 | 1.6 | 32 | |||||||
| $32.16 – 36.84 |
0.8 | 35 | 4 | 0.5 | 36 | |||||||
| $36.85 – 39.30 |
3.3 | 39 | 4 | 1.5 | 39 | |||||||
| $39.31 – 47.34 |
0.1 | 45 | 1 | 0.1 | 45 | |||||||
We had approximately $192.2 million of total unrecognized compensation costs related to stock options, nonvested stock and nonvested stock units at March 31, 2010 that is expected to be recognized over a weighted-
83
Table of Contents
BMC SOFTWARE, INC.
NOTES TO CONSOLIDATED FINANCIAL STATEMENTS
average period of 3 years. Approximately $4.9 million, $5.2 million and $3.7 million of share-based compensation costs were capitalized as software development costs during fiscal 2010, 2009 and 2008, respectively.
We received cash of $79.1 million, $92.2 million and $115.7 million for the exercise of stock options during fiscal 2010, 2009 and 2008, respectively. Cash was not used to settle any equity instruments previously granted. We issue shares from treasury stock upon the exercise of stock options, upon the vesting of stock units and at the grant date for nonvested stock.
Share-based compensation expense was recognized in our consolidated statements of operations as follows:
| Year Ended March 31, | ||||||||||||
| 2010 | 2009 | 2008 | ||||||||||
| (In millions) | ||||||||||||
| Cost of license revenue |
$ | 2.5 | $ | 1.6 | $ | 0.8 | ||||||
| Cost of maintenance revenue |
7.9 | 9.3 | 8.3 | |||||||||
| Cost of professional services revenue |
3.9 | 3.2 | 1.1 | |||||||||
| Selling and marketing expenses |
31.6 | 28.8 | 21.9 | |||||||||
| Research and development expenses |
10.1 | 12.9 | 10.4 | |||||||||
| General and administrative expenses |
32.9 | 26.2 | 24.1 | |||||||||
| Total share-based compensation expense |
88.9 | 82.0 | 66.6 | |||||||||
| Income tax benefit |
(27.2 | ) | (25.2 | ) | (22.6 | ) | ||||||
| Total share-based compensation expense after taxes |
$ | 61.7 | $ | 56.8 | $ | 44.0 | ||||||
(10) Retirement Plans
We sponsor a 401(k) plan that is available to substantially all United States employees. The plan provides for an employer match element having annual per-employee limitations that we have changed and may change from time to time. The costs of our matching contributions amounted to $14.5 million, $13.1 million and $6.4 million during fiscal 2010, 2009 and 2008, respectively. Employees become 100% vested in the employer match contributions upon reaching two years of service from date of hire.
We also sponsor a non-qualified deferred compensation plan for certain eligible employees. At March 31, 2010 and 2009, $17.4 million and $12.3 million, respectively, is included in accrued liabilities, with a corresponding amount included in long-term investments, related to obligations under this plan and related investments held by us. Employees participating in this plan receive distributions of their respective balances based on predetermined payout schedules or other events, as defined by the plan.
(11) Stockholders’ Equity
Earnings Per Share
The two-class method is utilized for the computation of earnings per share (EPS). The two-class method requires a portion of net income be allocated to participating securities, which are unvested awards of share-based payments with nonforfeitable rights to receive dividends or dividend equivalents, if declared. Income allocated to these participating securities is excluded from net earnings allocated to common shares, as shown in the table below.
Basic earnings per share is computed by dividing net income allocated to common shares by the weighted average number of common shares outstanding during the period. Diluted earnings per share is computed by
84
Table of Contents
BMC SOFTWARE, INC.
NOTES TO CONSOLIDATED FINANCIAL STATEMENTS
dividing net income allocated to common shares by the weighted average number of common shares outstanding during the period, plus the dilutive effect of outstanding stock options and other dilutive securities using the treasury stock method.
The following table summarizes the basic and diluted EPS computations for fiscal 2010, 2009 and 2008:
| Year Ended March 31, | ||||||||||||
| 2010 | 2009 | 2008 | ||||||||||
| (In millions, except per share data) | ||||||||||||
| Basic earnings per share: |
||||||||||||
| Net earnings |
$ | 406.1 | $ | 238.1 | $ | 313.6 | ||||||
| Less earnings allocated to participating securities |
(0.8 | ) | (1.1 | ) | (3.3 | ) | ||||||
| Net earnings allocated to common shares |
$ | 405.3 | $ | 237.0 | $ | 310.3 | ||||||
| Weighted average number of common shares |
183.1 | 187.1 | 194.8 | |||||||||
| Basic earnings per share |
$ | 2.21 | $ | 1.27 | $ | 1.59 | ||||||
| Diluted earnings per share: |
||||||||||||
| Net earnings |
$ | 406.1 | $ | 238.1 | $ | 313.6 | ||||||
| Less earnings allocated to participating securities |
(0.8 | ) | (1.1 | ) | (3.2 | ) | ||||||
| Net earnings allocated to common shares |
$ | 405.3 | $ | 237.0 | $ | 310.4 | ||||||
| Weighted average number of common shares |
183.1 | 187.1 | 194.8 | |||||||||
| Incremental shares from assumed conversions of share-based awards |
3.7 | 3.1 | 4.8 | |||||||||
| Adjusted weighted average number of common shares |
186.8 | 190.2 | 199.6 | |||||||||
| Diluted earnings per share |
$ | 2.17 | $ | 1.25 | $ | 1.56 | ||||||
For the years ended March 31, 2010, 2009 and 2008, 5.2 million, 10.5 million and 6.0 million weighted average potential common shares, respectively, have been excluded from the calculation of diluted EPS as they were anti-dilutive.
Treasury Stock
Our Board of Directors had previously authorized a total of $3.0 billion to repurchase common stock. During fiscal 2010, 2009 and 2008, 7.5 million, 10.7 million and 18.2 million shares, respectively, were purchased for $275.1 million, $330.0 million, and $579.6 million, respectively, under these authorizations. At March 31, 2010, there was approximately $69.8 million remaining in this stock repurchase program, which does not have an expiration date. In April 2010, our Board of Directors authorized an additional $1.0 billion to repurchase stock. In addition, during fiscal 2010 and 2009, we repurchased 0.4 million shares and 0.4 million shares for $13.0 million and $16.2 million, respectively, to satisfy employee tax withholding obligations upon the lapse of restrictions on nonvested stock grants.
(12) Guarantees, Commitments and Contingencies
Guarantees
Under our standard software license agreements, we agree to indemnify, defend and hold harmless our licensees from and against certain losses, damages and costs arising from claims alleging the licensees’ use of
85
Table of Contents
BMC SOFTWARE, INC.
NOTES TO CONSOLIDATED FINANCIAL STATEMENTS
our software infringes the intellectual property rights of a third party. Also, under these standard license agreements, we represent and warrant to licensees that our software products operate substantially in accordance with published specifications.
Other guarantees include promises to indemnify, defend and hold harmless each of our executive officers, non-employee directors and certain key employees from and against losses, damages and costs incurred by each such individual in administrative, legal or investigative proceedings arising from alleged wrongdoing by the individual while acting in good faith within the scope of his or her job duties on our behalf.
We also had outstanding letters of credit, performance bonds and similar instruments related to various customer, facilities and other obligations at March 31, 2010 of approximately $43.6 million.
Historically, we have not incurred significant costs related to such indemnifications, warranties and guarantees. As such, and based on other factors, no provision or accrual for these items has been made.
Lease Commitments
We lease office space and equipment under various non-cancelable operating leases. Rent expense is recognized on a straight-line basis over the respective lease terms and amounted to $48.1 million, $57.5 million and $51.6 million during fiscal 2010, 2009 and 2008, respectively.
In fiscal 2007, we sold our headquarters campus and three surrounding undeveloped land parcels located in Houston, Texas for approximately $291.9 million in cash, net of closing costs. In connection with the sale of the buildings, we entered into a 15 year lease agreement for the occupied space which expires in June 2021, with the option to terminate the lease in June 2015 and options to renew the lease through June 2041 at market rates. Accordingly, we deferred and are amortizing the gain of approximately $24.2 million as a reduction to rent expense on a straight-line basis over the lease term. The lease agreement includes five scheduled rent increases over its term. Rent expense is being recognized on a straight-line basis over the lease term.
The following table summarizes future minimum lease payments to be made under non-cancelable operating leases and minimum sublease payments to be received under non-cancelable subleases at March 31, 2010:
| Year Ending March 31, |
||||
| (In millions) | ||||
| 2011 |
$ | 39.2 | ||
| 2012 |
31.6 | |||
| 2013 |
24.9 | |||
| 2014 |
20.1 | |||
| 2015 |
12.4 | |||
| 2016 and thereafter |
14.0 | |||
| Total minimum lease payments |
142.2 | |||
| Total minimum sublease payments |
(8.0 | ) | ||
| Total net minimum lease payments |
$ | 134.2 | ||
We have procured certain equipment under non-cancelable capital lease arrangements. The current and long-term portions of these capital lease obligations, which are included in accrued liabilities and long-term borrowings, respectively, in our consolidated balance sheets, were $7.2 million and $8.0 million, respectively, at March 31, 2010, and $6.8 million and $13.9 million, respectively, at March 31, 2009. At March 31, 2010, future minimum payments to be made under these capital leases are $7.6 million, $4.1 million, $1.6 million, $1.6 million and $0.3 million in fiscal 2011, 2012, 2013, 2014 and 2015, respectively.
86
Table of Contents
BMC SOFTWARE, INC.
NOTES TO CONSOLIDATED FINANCIAL STATEMENTS
Contingencies
We are subject to intellectual property claims and legal proceedings, including claims of alleged infringement of patents asserted by third parties against us in the form of claim letters. These claims are in various stages, may result in formal legal proceedings against us, and may not be fully resolved in the near future. We cannot predict the timing and ultimate outcome of such claims.
We are party to various labor claims brought by certain former international employees alleging that amounts are due such employees for unpaid commissions and other compensation. The claims are in various stages and are not expected to be fully resolved in the near future. We intend to vigorously contest all of the claims. However, the ultimate outcome of all of the claims cannot be estimated at this time.
In June 2006, we sought clarification from a Brazilian court as to whether a tax applies to the remittance of software payments from our Brazilian operations. The matter is currently being litigated in Brazilian courts. In February 2007, a law was enacted that clarified that this particular tax did not apply to the remittance of software payments, retroactive to January 1, 2006. We continue to pursue a favorable resolution on this matter for years prior to January 1, 2006. While we believe we will ultimately prevail based on the merits of our position, we cannot predict or estimate the timing or ultimate outcome of this matter.
In November 2009, a lawsuit was filed against a number of software companies, including us, by Achates Reference Publishing, Inc. in the United States District Court for the Eastern District of Texas, Marshall Division. The complaint seeks monetary damages in unspecified amounts and permanent injunction based upon claims for alleged patent infringement. We intend to vigorously defend this matter. However, we cannot predict the timing and ultimate outcome of this matter.
We are subject to various other legal proceedings and claims, either asserted or unasserted, which arise in the ordinary course of business. We do not believe that the outcome of any of these matters will have a material adverse effect on our financial position, results of operations or cash flows.
(13) Segment Reporting
We are organized into two business segments, ESM and MSM. The ESM segment derives its revenue from our service support, service assurance and service automation solutions, along with professional services revenue derived from consulting, implementation, integration and educational services related to our software products. The MSM segment derives its revenue from products for mainframe database management, monitoring and automation, enterprise scheduling and output management solutions.
Segment performance is measured based on segment operating income, reflecting segment revenue less direct and allocated indirect segment operating expenses. Direct segment operating expenses primarily include cost of revenue, selling and marketing, research and development and general and administrative expenses that can be specifically identified to a particular segment and are directly controllable by segment management, while allocated indirect segment operating expenses primarily include indirect costs within these operating expense categories that are not specifically identified to a particular segment or controllable by segment management. The indirect operating expenses are allocated to the segments based on budgeted bookings, revenue and other allocation methods that management believes to be reasonable. Our measure of segment operating income does not include the effect of share-based compensation expenses, amortization of acquired technology and other intangible assets, the write-off of purchased IPR&D or the costs associated with severance and exit activities described in Note 14, which are collectively included in unallocated operating expenses below. Assets and liabilities are reviewed by management at the consolidated level only.
87
Table of Contents
BMC SOFTWARE, INC.
NOTES TO CONSOLIDATED FINANCIAL STATEMENTS
The table below summarizes segment performance for fiscal 2010, 2009 and 2008. The prior year information has been reclassified to conform to our current segment reporting methodology.
| Year Ended March 31, 2010 |
Enterprise Service Management |
Mainframe Service Management |
Consolidated | |||||||
| (In millions) | ||||||||||
| Revenue: |
||||||||||
| License |
$ | 462.2 | $ | 296.2 | $ | 758.4 | ||||
| Maintenance |
550.9 | 472.8 | 1,023.7 | |||||||
| Professional services |
129.1 | — | 129.1 | |||||||
| Total revenue |
1,142.2 | 769.0 | 1,911.2 | |||||||
| Direct and allocated indirect segment operating expenses |
902.2 | 334.5 | 1,236.7 | |||||||
| Segment operating income |
240.0 | 434.5 | 674.5 | |||||||
| Unallocated operating expenses |
(168.4 | ) | ||||||||
| Other loss, net |
(1.9 | ) | ||||||||
| Earnings before income taxes |
$ | 504.2 | ||||||||
| Year Ended March 31, 2009 |
Enterprise Service Management |
Mainframe Service Management |
Consolidated | |||||||
| (In millions) | ||||||||||
| Revenue: |
||||||||||
| License |
$ | 434.9 | $ | 274.8 | $ | 709.7 | ||||
| Maintenance |
547.3 | 470.5 | 1,017.8 | |||||||
| Professional services |
144.4 | — | 144.4 | |||||||
| Total revenue |
1,126.6 | 745.3 | 1,871.9 | |||||||
| Direct and allocated indirect segment operating expenses |
938.0 | 321.6 | 1,259.6 | |||||||
| Segment operating income |
188.6 | 423.7 | 612.3 | |||||||
| Unallocated operating expenses |
(244.5 | ) | ||||||||
| Other loss, net |
(3.9 | ) | ||||||||
| Earnings before income taxes |
$ | 363.9 | ||||||||
| Year Ended March 31, 2008 |
Enterprise Service Management |
Mainframe Service Management |
Consolidated | |||||||
| (In millions) | ||||||||||
| Revenue: |
||||||||||
| License |
$ | 349.3 | $ | 298.3 | $ | 647.6 | ||||
| Maintenance |
514.2 | 453.5 | 967.7 | |||||||
| Professional services |
116.3 | — | 116.3 | |||||||
| Total revenue |
979.8 | 751.8 | 1,731.6 | |||||||
| Direct and allocated indirect segment operating expenses |
909.0 | 337.4 | 1,246.4 | |||||||
| Segment operating income |
70.8 | 414.4 | 485.2 | |||||||
| Unallocated operating expenses |
(127.7 | ) | ||||||||
| Other income, net |
76.9 | |||||||||
| Earnings before income taxes |
$ | 434.4 | ||||||||
88
Table of Contents
BMC SOFTWARE, INC.
NOTES TO CONSOLIDATED FINANCIAL STATEMENTS
Revenue from external customers and long-lived assets (excluding financial instruments and deferred tax assets) attributed to the United States, our corporate headquarters, and all other countries are:
| Year Ended March 31, | |||||||||
| 2010 | 2009 | 2008 | |||||||
| (In millions) | |||||||||
| Revenue: |
|||||||||
| United States |
$ | 1,011.5 | $ | 980.0 | $ | 878.8 | |||
| International |
899.7 | 891.9 | 852.8 | ||||||
| $ | 1,911.2 | $ | 1,871.9 | $ | 1,731.6 | ||||
| At March 31, | ||||||
| 2010 | 2009 | |||||
| (In millions) | ||||||
| Long-lived assets: |
||||||
| United States |
$ | 1,125.3 | $ | 1,094.9 | ||
| International |
701.0 | 669.5 | ||||
| $ | 1,826.3 | $ | 1,764.4 | |||
We do business with customers in a broad range of industries, including significant business with telecommunication companies, financial service providers, government agencies and service providers. Our ten largest customers comprised less than 15% of our total revenue in each of fiscal 2010, 2009 and 2008 and represented various industries. No single customer accounted for a material portion of our revenue during any of the past three fiscal years. At March 31, 2010 and 2009, approximately 42% and 37%, respectively, of our cash, cash equivalents and investments was held by our international subsidiaries.
(14) Severance, Exit Costs and Related Charges
We have undertaken various restructuring and process improvement initiatives in recent years through the realignment of resources to focus on growth areas and the simplification, standardization and automation of key business processes. These process and realignment initiatives include workforce reductions across all functions and geographies, and the affected employees were, or will be, provided cash separation packages. As part of these initiatives, we have also exited certain leases, reduced the square footage required to operate certain locations and relocated some operations to lower cost facilities. As a result of these initiatives, we identified for termination approximately 140 and 250 employees during fiscal 2009 and 2008, respectively.
Additionally, as a result of current economic conditions, we undertook a general workforce reduction of approximately 80 and 380 employees during fiscal 2010 and 2009, respectively. This general reduction was across all functions and geographies, and the affected employees were, or will be, provided cash separation packages.
89
Table of Contents
BMC SOFTWARE, INC.
NOTES TO CONSOLIDATED FINANCIAL STATEMENTS
Activity related to fiscal 2008, 2009 and 2010 restructuring actions is summarized as follows:
| Balance at April 1, 2007 |
Charged to Expense |
Adjustments to Estimates |
Foreign Exchange Adjustments |
Accretion | Cash Payments, Net of Sublease Income |
Balance at March 31, 2008 | ||||||||||||||||||
| (In millions) | ||||||||||||||||||||||||
| Process and realignment initiatives: |
||||||||||||||||||||||||
| Severance and related costs |
$ | 17.0 | $ | 17.5 | $ | (3.3 | ) | $ | 0.7 | $ | — | $ | (23.3 | ) | $ | 8.6 | ||||||||
| Facilities |
16.3 | 2.2 | (1.7 | ) | — | 0.5 | (9.7 | ) | 7.6 | |||||||||||||||
| Total accrued |
$ | 33.3 | $ | 19.7 | $ | (5.0 | ) | $ | 0.7 | $ | 0.5 | $ | (33.0 | ) | $ | 16.2 | ||||||||
| Balance at April 1, 2008 |
Charged to Expense |
Adjustments to Estimates |
Foreign Exchange Adjustments |
Accretion | Cash Payments, Net of Sublease Income |
Balance at March 31, 2009 | ||||||||||||||||||
| (In millions) | ||||||||||||||||||||||||
| Process and realignment initiatives: |
||||||||||||||||||||||||
| Severance and related costs |
$ | 8.6 | $ | 12.3 | $ | (3.6 | ) | $ | (0.6 | ) | $ | — | $ | (15.5 | ) | $ | 1.2 | |||||||
| Facilities |
7.6 | 6.0 | (0.4 | ) | — | 0.3 | (5.8 | ) | 7.7 | |||||||||||||||
| 16.2 | 18.3 | (4.0 | ) | (0.6 | ) | 0.3 | (21.3 | ) | 8.9 | |||||||||||||||
| General workforce reduction: |
||||||||||||||||||||||||
| Severance and related costs |
— | 20.3 | (1.1 | ) | 0.1 | — | (11.7 | ) | 7.6 | |||||||||||||||
| Total accrued |
$ | 16.2 | $ | 38.6 | $ | (5.1 | ) | $ | (0.5 | ) | $ | 0.3 | $ | (33.0 | ) | $ | 16.5 | |||||||
| Balance at April 1, 2009 |
Charged to Expense |
Adjustments to Estimates |
Foreign Exchange Adjustments |
Accretion | Cash Payments, Net of Sublease Income |
Balance at March 31, 2010 | ||||||||||||||||||
| (In millions) | ||||||||||||||||||||||||
| Process and realignment initiatives: |
||||||||||||||||||||||||
| Severance and related costs |
$ | 1.2 | $ | 0.2 | $ | (0.6 | ) | $ | — | $ | — | $ | (0.8 | ) | $ | — | ||||||||
| Facilities |
7.7 | 0.5 | (0.3 | ) | (0.1 | ) | 0.1 | (6.6 | ) | 1.3 | ||||||||||||||
| 8.9 | 0.7 | (0.9 | ) | (0.1 | ) | 0.1 | (7.4 | ) | 1.3 | |||||||||||||||
| General workforce reduction: |
||||||||||||||||||||||||
| Severance and related costs |
7.6 | 4.9 | (1.7 | ) | 0.3 | — | (10.2 | ) | 0.9 | |||||||||||||||
| Total accrued |
$ | 16.5 | $ | 5.6 | $ | (2.6 | ) | $ | 0.2 | $ | 0.1 | $ | (17.6 | ) | $ | 2.2 | ||||||||
The accruals for severance and related costs at March 31, 2010 represent the amounts to be paid to employees that have been terminated or identified for termination as a result of the initiatives described above. These amounts are expected to be paid during fiscal 2011. With respect to our general workforce reduction action in fiscal 2010, we expect to incur an additional charge for severance and related costs of approximately $0.7 million during fiscal 2011. We continue to review the impact of these actions and will determine if, based on future operating results, additional actions to reduce operating expenses are necessary. The amount of any potential future charges for such actions will depend upon the nature, timing, and extent of those actions.
The accruals for facilities costs at March 31, 2010 represent the remaining fair value of lease obligations for exited locations, as determined at the cease-use dates or lease modification dates of those facilities, net of estimated sublease income that could be reasonably obtained in the future, and will be paid out over the
90
Table of Contents
BMC SOFTWARE, INC.
NOTES TO CONSOLIDATED FINANCIAL STATEMENTS
remaining lease terms, the last of which ends in fiscal 2015. Projected sublease income is based on management’s estimates, which are subject to change. We may incur additional facilities charges subsequent to March 31, 2010 as a result of the initiatives described above. Accretion, representing the increase in the present value of facilities accruals over time, is included in our operating expenses.
(15) New Accounting Pronouncements Not Yet Adopted
In October 2009, the FASB issued new revenue recognition guidance for arrangements that include both software and non-software related deliverables, where certain of those deliverables are non-software related. This guidance requires entities to allocate the overall consideration to each deliverable by using a best estimate of the selling price of individual deliverables in the arrangement in the absence of VSOE or other third party evidence of the selling price. Additionally, the guidance modifies the manner in which the transaction consideration is allocated across the separately identified deliverables by no longer permitting the residual method of allocating arrangement consideration. The new guidance is effective for us in the first quarter of fiscal 2012 interim financial statements, with earlier adoption permitted. We are currently evaluating the impact of adopting this new guidance on our consolidated financial statements.
In June 2009, the FASB issued new guidance on accounting for transfers of financial assets, which amended previous GAAP literature. The amendment includes: (i) elimination of the qualifying special-purpose entity concept, (ii) a new unit of account definition that must be met for transfers of portions of financial assets to be eligible for sale accounting, (iii) clarifications and changes to the derecognition criteria for a transfer to be accounted for as a sale, (iv) a change to the amount of recognized gain or loss on a transfer of financial assets accounted for as a sale when beneficial interests are received by the transferor, and (v) extensive new disclosures. This guidance is effective for us beginning in fiscal 2011 and is not expected to have a material effect on our financial position, results of operations or cash flows.
(16) Quarterly Results (Unaudited)
The following table sets forth certain unaudited quarterly financial data for fiscal 2010 and 2009. This information has been prepared on the same basis as the accompanying consolidated financial statements and all necessary adjustments have been included in the amounts below to present fairly the selected quarterly information when read in conjunction with the accompanying consolidated financial statements and notes thereto.
| Fiscal 2010 | Fiscal 2009 | |||||||||||||||||||||||
| Quarter Ended | Quarter Ended | |||||||||||||||||||||||
| June 30, 2009 |
Sept. 30, 2009 |
Dec. 31, 2009 |
Mar. 31, 2010 |
June 30, 2008 |
Sept. 30, 2008 |
Dec. 31, 2008 |
Mar.
31, 2009 | |||||||||||||||||
| (In millions, except per share data) | ||||||||||||||||||||||||
| Total revenue |
$ | 450.0 | $ | 461.8 | $ | 508.1 | $ | 491.3 | $ | 437.5 | $ | 466.7 | $ | 488.4 | $ | 479.3 | ||||||||
| Gross profit |
$ | 351.4 | $ | 366.8 | $ | 403.7 | $ | 378.1 | $ | 334.2 | $ | 354.3 | $ | 385.2 | $ | 373.2 | ||||||||
| Operating income |
$ | 108.2 | $ | 134.8 | $ | 147.6 | $ | 115.5 | $ | 13.3 | $ | 105.5 | $ | 128.7 | $ | 120.3 | ||||||||
| Net earnings |
$ | 82.4 | $ | 94.2 | $ | 110.7 | $ | 118.8 | $ | 1.2 | $ | 69.8 | $ | 83.8 | $ | 83.3 | ||||||||
| Basic EPS |
$ | 0.45 | $ | 0.51 | $ | 0.60 | $ | 0.65 | $ | 0.01 | $ | 0.37 | $ | 0.45 | $ | 0.45 | ||||||||
| Diluted EPS |
$ | 0.44 | $ | 0.50 | $ | 0.59 | $ | 0.64 | $ | 0.01 | $ | 0.36 | $ | 0.44 | $ | 0.44 | ||||||||
| Shares used in computing basic EPS |
184.3 | 183.5 | 182.8 | 182.0 | 188.8 | 188.8 | 186.0 | 184.2 | ||||||||||||||||
| Shares used in computing diluted EPS |
187.9 | 187.0 | 186.5 | 185.7 | 192.9 | 192.2 | 188.3 | 186.9 | ||||||||||||||||
91
Table of Contents
BMC SOFTWARE, INC.
NOTES TO CONSOLIDATED FINANCIAL STATEMENTS
We incurred severance, exit costs and related charges totaling $1.0 million, $0.5 million, $1.0 million and $0.5 million during the quarters ended June 30, 2009, September 30, 2009, December 31, 2009 and March 31, 2010, respectively, and totaling $6.4 million, $1.5 million, $16.0 million, and $9.6 million during the quarters ended June 30, 2008, September 30, 2008, December 31, 2008 and March 31, 2009, respectively. Refer to Note 14 for further information. We recorded a $50.3 million charge for purchased IPR&D of BladeLogic during the quarter ended June 30, 2008, as further discussed in Note 2, and an $8.4 million impairment charge in connection with the write-down of certain non-marketable equity investments to their fair values during the quarter ended December 31, 2008. We recorded a net tax benefit of $30.0 million related to the settlement of certain tax matters during the quarter ended March 31, 2010 as further discussed in Note 8.
92
Table of Contents
SIGNATURES
Pursuant to the requirements of Section 13 or 15(d) of the Securities Exchange Act of 1934, the registrant has duly caused this report to be signed on its behalf by the undersigned, thereunto duly authorized.
| BMC SOFTWARE, INC. | ||
| By: |
/s/ ROBERT E. BEAUCHAMP | |
| Robert E. Beauchamp Chairman of the Board, President and Chief Executive Officer | ||
| Date: |
May 7, 2010 | |
Pursuant to the requirements of the Securities Exchange Act of 1934, this report has been signed below by the following persons on behalf of the registrant and in the capacities and on the dates indicated.
| Signatures |
Title |
Date | ||
| /s/ ROBERT E. BEAUCHAMP Robert E. Beauchamp |
Chairman of the Board, President and Chief Executive Officer | May 7, 2010 | ||
| /s/ STEPHEN B. SOLCHER Stephen B. Solcher |
Senior Vice President and Chief Financial Officer | May 7, 2010 | ||
| /s/ T. CORY BLEUER T. Cory Bleuer |
Vice President, Controller and Chief Accounting Officer | May 7, 2010 | ||
| /s/ JON E. BARFIELD Jon E. Barfield |
Director | May 7, 2010 | ||
| /s/ GARY L. BLOOM Gary L. Bloom |
Director | May 7, 2010 | ||
| /s/ B. GARLAND CUPP B. Garland Cupp |
Director | May 7, 2010 | ||
| /s/ MELDON K. GAFNER Meldon K. Gafner |
Director | May 7, 2010 | ||
| /s/ P. THOMAS JENKINS P. Thomas Jenkins |
Director | May 7, 2010 | ||
| /s/ LOUIS J. LAVIGNE, JR. Louis J. Lavigne, Jr. |
Director | May 7, 2010 | ||
| /s/ KATHLEEN A. O’NEIL Kathleen A. O’Neil |
Director | May 7, 2010 | ||
| /s/ TOM C. TINSLEY Tom C. Tinsley |
Director | May 7, 2010 | ||
93
Table of Contents
| Exhibit Number |
||||
| 3.1 | — | Restated Certificate of Incorporation of the Company; incorporated by reference to Exhibit 1.2 to our Registration Statement on Form 8-A filed August 26, 1988. | ||
| 3.2 | — | Certificate of Amendment of Restated Certificate of Incorporation; incorporated by reference to Exhibit 3.2 to our Annual Report on Form 10-K for the year ended March 31, 1997. | ||
| 3.3 | — | Certificate of Amendment of Restated Certificate of Incorporation filed November 30, 1999; incorporated by reference to Exhibit 3.3 to our Annual Report on Form 10-K for the year ended March 31, 2002. | ||
| *3.4 | — | Amended and Restated Bylaws of the Company. | ||
| 4.1 | — | Indenture, dated at June 4, 2008, between BMC Software, Inc. and Wells Fargo Bank, N.A., as trustee; incorporated by reference to Exhibit 4.1 to our Current Report on Form 8-K filed June 4, 2008. | ||
| 4.2 | — | Supplemental Indenture, dated at June 4, 2008, between BMC Software, Inc. and Wells Fargo Bank, N.A., as trustee, including the form of the 7.25% Note due 2018; incorporated by reference to Exhibit 4.2 to our Current Report on Form 8-K filed June 4, 2008. | ||
| 10.1(a) | — | BMC Software, Inc. 1994 Employee Incentive Plan (conformed version inclusive of amendments); incorporated by reference to Exhibit 10.1 to our Quarterly Report on Form 10-Q for the quarter ended December 31, 2008. | ||
| 10.1(b) | — | Second Amendment to the BMC Software, Inc. 1994 Employee Incentive Plan; incorporated by reference to Exhibit 10.1(b) to our Annual Report on Form 10-K for the year ended March 31, 2009 (the 2009 10-K) | ||
| 10.2(a) | — | BMC Software, Inc. 1994 Non-employee Directors’ Stock Option Plan; incorporated by reference to Exhibit 10.8(a) to our Annual Report on Form 10-K for the year ended March 31, 2005 (the 1995 10-K). | ||
| 10.2(b) | — | Form of Stock Option Agreement employed under BMC Software, Inc. 1994 Non-employee Directors’ Stock Option Plan; incorporated by reference to Exhibit 10.8(b) to the 1995 10-K. | ||
| 10.3 | — | Form of Indemnification Agreement among the Company and its directors and executive officers; incorporated by reference to Exhibit 10.11 to the 1995 10-K. | ||
| 10.4 | — | BMC Software, Inc. 2000 Employee Stock Incentive Plan (conformed version inclusive of amendments); incorporated by reference to Exhibit 10.4 to our Quarterly Report on Form 10-Q for the quarter ended December 31, 2008. | ||
| 10.5 | — | Amended and Restated BMC Software, Inc. Executive Deferred Compensation Plan; incorporated by reference to Exhibit 10.5(d) to our Quarterly Report on Form 10-Q for the quarter ended September 30, 2008. | ||
| 10.6 | — | Executive Employment Agreement between BMC Software, Inc. and Robert E. Beauchamp; incorporated by reference to Exhibit 10.6 to our Current Report on Form 8-K filed November 24, 2008. | ||
| 10.7 | — | Form of Nonemployee Director Stock Option Agreement employed under BMC Software, Inc. 1994 Employee Incentive Plan for nonemployee directors; incorporated by reference to Exhibit 10.7 to the 2009 10-K. | ||
| 10.8(a) | — | BMC Software, Inc. 2002 Nonemployee Director Stock Option Plan; incorporated by reference to Appendix B to our 2002 Proxy Statement filed with the SEC on Schedule 14A. | ||
| 10.8(b) | — | Form of Stock Option Agreement employed under BMC Software, Inc. 2002 Nonemployee Director Stock Option Plan; incorporated by reference to Exhibit 10.8(b) to our Annual Report on Form 10-K for the year ended March 31, 2003. | ||
94
Table of Contents
| Exhibit Number |
||||
| 10.9 | — | BMC Software, Inc. 2002 Employee Incentive Plan (conformed version inclusive of amendments); incorporated by reference to Exhibit 10.9 to our Quarterly Report on Form 10-Q for the quarter ended December 31, 2008. | ||
| 10.10 | — | BMC Software, Inc. Short-term Incentive Performance Award Program (as amended and restated); incorporated by reference to Exhibit 10.10 to our Quarterly Report on Form 10-Q for the quarter ended September 30, 2009. | ||
| 10.11 | — | BMC Software, Inc. Long-term Incentive Performance Award Program (as amended and restated); incorporated by reference to Exhibit 10.11 to our Quarterly Report on Form 10-Q for the quarter ended September 30, 2009. | ||
| 10.12 | — | Executive Employment Agreement between BMC Software, Inc. and Stephen B. Solcher; incorporated by reference to Exhibit 10.12 to our Current Report on Form 8-K filed November 24, 2008. | ||
| 10.13(a) | — | BladeLogic, Inc. 2007 Stock Option and Incentive Plan; incorporated by reference to Exhibit 10.5 to the BladeLogic, Inc. Registration Statement on Form S-1 (Registration No. 333-141915). | ||
| 10.13(b) | — | First Amendment to BladeLogic, Inc. 2007 Stock Option and Incentive Plan; incorporated by reference to Exhibit 10.34(b) to our Quarterly Report on Form 10-Q for the quarter ended December 31, 2008. | ||
| 10.14 | — | Form of Stock Option Agreement employed under BMC Software, Inc. 1994 Employee Incentive Plan utilized for senior executive officers; incorporated by reference to Exhibit 10.14 to our Current Report on Form 8-K filed November 1, 2004. | ||
| 10.15 | — | Form of Restricted Stock Agreement employed under BMC Software, Inc. 1994 Employee Incentive Plan utilized for senior executive officers; incorporated by reference to Exhibit 10.15 to our Current Report on Form 8-K filed November 1, 2004. | ||
| 10.16 | — | Executive Employment Agreement between BMC Software, Inc. and Denise M. Clolery; incorporated by reference to Exhibit 10.16 to our Quarterly Report on Form 10-Q for the quarter ended December 31, 2008. | ||
| 10.17 | — | Executive Employment Agreement between BMC Software, Inc. and Hollie S. Castro; incorporated by reference to Exhibit 10.17 to our Quarterly Report on Form 10-Q for the quarter ended September 30, 2009. | ||
| 10.18 | — | Executive Employment Agreement between BMC Software, Inc. and James W. Grant, Jr.; incorporated by reference to Exhibit 10.18 to our Current Report on Form 8-K filed November 24, 2008. | ||
| 10.19 | — | Form of Stock Option Award Agreement employed under BladeLogic, Inc. 2007 Stock Option and Incentive Plan utilized for senior executive officers; incorporated by reference to Exhibit 10.19 to the 2009 10-K. | ||
| 10.20 | — | Form of Performance-Based Restricted Stock Award Agreement employed under BMC Software, Inc. 1994 Employee Incentive Plan utilized for senior executive officers; incorporated by reference to Exhibit 10.20 to our Current Report on Form 8-K filed on June 12, 2006. | ||
| 10.21 | — | Form of Restricted Stock Unit Award Agreement employed under BladeLogic, Inc. 2007 Stock Option and Incentive Plan utilized for senior executive officers; incorporated by reference to Exhibit 10.21 to the 2009 10-K. | ||
| 10.22 | — | Executive Employment Agreement between BMC Software, Inc. and William Miller; incorporated by reference to Exhibit 10.22 to our Quarterly Report on Form 10-Q for the quarter ended December 31, 2008. | ||
95
Table of Contents
| Exhibit Number |
||||
| 10.23 | — | Form of Stock Option Agreement employed under BMC Software, Inc. 2007 Incentive Plan utilized for senior executive officers; incorporated by reference to Exhibit 10.23 to the Company’s Quarterly Report on Form 10-Q for the quarter ended December 31, 2007. | ||
| 10.24 | — | Form of Performance-Based Restricted Stock Award Agreement employed under BMC Software, Inc. 2007 Incentive Plan utilized for senior executive officers; incorporated by reference to Exhibit 10.24 to our Quarterly Report on Form 10-Q for the quarter ended December 31, 2007. | ||
| 10.25 | — | Form of Time-Based Restricted Stock Award Agreement employed under BMC Software, Inc. 2007 Incentive Plan utilized for senior executive officers; incorporated by reference to Exhibit 10.25 to our Quarterly Report on Form 10-Q for the quarter ended December 31, 2007. | ||
| 10.27 | — | Executive Employment Agreement between BMC Software, Inc. and John McMahon; incorporated by reference to Exhibit 10.27 to our Quarterly Report on Form 10-Q for the quarter ended December 31, 2008. | ||
| 10.28 | — | Form of Performance-Based Restricted Stock Unit Award Agreement employed under BMC Software, Inc. 2007 Incentive Plan utilized for senior executive officers; incorporated by reference to Exhibit 10.28 to our Current Report on Form 8-K filed June 12, 2008. | ||
| 10.29 | — | Form of Time-Based Restricted Stock Unit Award Agreement employed under BMC Software, Inc. 2007 Incentive Plan utilized for senior executive officers; incorporated by reference to Exhibit 10.29 to our Current Report on Form 8-K filed June 12, 2008. | ||
| 10.30 | — | Performance-Based Restricted Stock Unit Award Agreement for Robert E. Beauchamp; incorporated by reference to Exhibit 10.30 to our Current Report on Form 8-K filed August 20, 2008. | ||
| 10.31 | — | Executive Employment Agreement between BMC Software, Inc. and D. Stephen Goddard; incorporated by reference to Exhibit 10.31 to our Quarterly Report on Form 10-Q for the quarter ended December 31, 2008. | ||
| 10.32 | — | Executive Employment Agreement between BMC Software, Inc. and T. Cory Bleuer; incorporated by reference to Exhibit 10.32 to our Quarterly Report on Form 10-Q for the quarter ended December 31, 2008. | ||
| 10.33 | — | BMC Software, Inc. 2007 Incentive Plan (as amended); incorporated by reference to Annex A to our Definitive Proxy Statement on Schedule 14A dated June 24, 2009. | ||
| 10.34 | — | Amendment to Executive Employment Agreement between BMC Software, Inc. and Robert E. Beauchamp; incorporated by reference to Exhibit 10.34 to our Current Report on Form 8-K filed May 3, 2010. | ||
| 10.35 | — | Amendment to Executive Employment Agreement between BMC Software, Inc. and Stephen B. Solcher; incorporated by reference to Exhibit 10.35 to our Current Report on Form 8-K filed May 3, 2010. | ||
| 10.36 | — | Amendment to Executive Employment Agreement between BMC Software, Inc. and James W. Grant; incorporated by reference to Exhibit 10.36 to our Current Report on Form 8-K filed May 3, 2010. | ||
| 10.37 | — | Amendment to Executive Employment Agreement between BMC Software, Inc. and John D. McMahon; incorporated by reference to Exhibit 10.37 to our Current Report on Form 8-K filed May 3, 2010. | ||
| 10.38 | — | Amendment to Executive Employment Agreement between BMC Software, Inc. and William D. Miller; incorporated by reference to Exhibit 10.38 to our Current Report on Form 8-K filed May 3, 2010. | ||
96
Table of Contents
| Exhibit Number |
||||
| 10.39 | — | Amendment to Executive Employment Agreement between BMC Software, Inc. and D. Stephen Goddard; incorporated by reference to Exhibit 10.39 to our Current Report on Form 8-K filed May 3, 2010. | ||
| 10.40 | — | Amendment to Executive Employment Agreement between BMC Software, Inc. and T. Cory Bleuer; incorporated by reference to Exhibit 10.40 to our Current Report on Form 8-K filed May 3, 2010. | ||
| *21.1 | — | Subsidiaries of the Company. | ||
| *23.1 | — | Consent of Independent Registered Public Accounting Firm. | ||
| *31.1 | — | Certification of Chief Executive Officer of BMC Software, Inc. pursuant to Section 302 of the Sarbanes-Oxley Act of 2002. | ||
| *31.2 | — | Certification of Chief Financial Officer of BMC Software, Inc. pursuant to Section 302 of the Sarbanes-Oxley Act of 2002. | ||
| *32.1 | — | Certification of Chief Executive Officer of BMC Software, Inc. pursuant to 18 U.S.C. Section 1350. | ||
| *32.2 | — | Certification of Chief Financial Officer of BMC Software, Inc. pursuant to 18 U.S.C. Section 1350. | ||
| *101.INS | — | XBRL Instance Document. | ||
| *101.SCH | — | XBRL Taxonomy Extension Schema Document. | ||
| *101.CAL | — | XBRL Taxonomy Extension Calculation Linkbase Document. | ||
| *101.LAB | — | XBRL Taxonomy Extension Label Linkbase Document. | ||
| *101.PRE | — | XBRL Taxonomy Extension Presentation Linkbase Document. | ||
| *101.DEF | — | XBRL Taxonomy Extension Definition Linkbase Document. | ||
| * | Filed herewith |
Note: The Amended and Restated Bylaws will not be effective unless and until an amendment to the Company’s Restated Certificate of Incorporation is approved at the upcoming 2010 Annual Meeting of Shareholders and filed with the Secretary of State of the State of Delaware.
97