Attached files
| file | filename |
|---|---|
| 8-K - 8-K - DOMINION ENERGY SOUTH CAROLINA, INC. | a10-8229_38k.htm |
| EX-99.1 - EX-99.1 - DOMINION ENERGY SOUTH CAROLINA, INC. | a10-8229_3ex99d1.htm |
Exhibit 99.2
|
|
SCANA CORPORATION First Quarter 2010 |
|
|
2 SCANA CORPORATION Safe Harbor Statement Statements included in this presentation which are not statements of historical fact are intended to be, and are hereby identified as, “forward-looking statements” for purposes of Section 27A of the Securities Act of 1933, as amended, and Section 21E of the Securities Exchange Act of 1934, as amended. Forward-looking statements include, but are not limited to, statements concerning key earnings drivers, customer growth, environmental regulations and expenditures, leverage ratio, projections for pension fund contributions, financing activities, access to sources of capital, impacts of the adoption of new accounting rules, estimated construction and other expenditures. In some cases, forward-looking statements can be identified by terminology such as “may,” “will,” “could,” “should,” “expects,” “forecasts,” “plans,” “anticipates,” “believes,” “estimates,” “projects,” “predicts,” “potential” or “continue” or the negative of these terms or other similar terminology. Readers are cautioned that any such forward-looking statements are not guarantees of future performance and involve a number of risks and uncertainties, and that actual results could differ materially from those indicated by such forward-looking statements. Important factors that could cause actual results to differ materially from those indicated by such forward-looking statements include, but are not limited to, the following: (1) the information is of a preliminary nature and may be subject to further and/or continuing review and adjustment; (2) regulatory actions, particularly changes in rate regulation, regulations governing electric grid reliability and environmental regulations; (3) current and future litigation; (4) changes in the economy, especially in areas served by subsidiaries of SCANA Corporation (SCANA); (5) the impact of competition from other energy suppliers, including competition from alternate fuels in industrial interruptible markets; (6) growth opportunities for SCANA’s regulated and diversified subsidiaries; (7) the results of short- and long-term financing efforts, including future prospects for obtaining access to capital markets and other sources of liquidity; (8) changes in SCANA’s or its subsidiaries’ accounting rules and accounting policies; (9) the effects of weather, including drought, especially in areas where the Company’s generation and transmission facilities are located and in areas served by SCANA’s subsidiaries; (10) payment by counterparties as and when due; (11) the results of efforts to license, site, construct and finance facilities for base load electric generation; (12) the availability of fuels such as coal, natural gas and enriched uranium used to produce electricity; the availability of purchased power and natural gas for distribution; the level and volatility of future market prices for such fuels and purchased power; and the ability to recover the costs for such fuels and purchased power; (13) the availability of skilled and experienced human resources to properly manage, operate, and grow the Company’s businesses; (14) labor disputes; (15) performance of SCANA’s pension plan assets; (16) higher taxes; (17) inflation; (18) compliance with regulations; and (19) the other risks and uncertainties described from time to time in the periodic reports filed by SCANA or South Carolina Electric & Gas Company (SCE&G) with the United States Securities and Exchange Commission (SEC). The Company disclaims any obligation to update any forward-looking statements. |
|
|
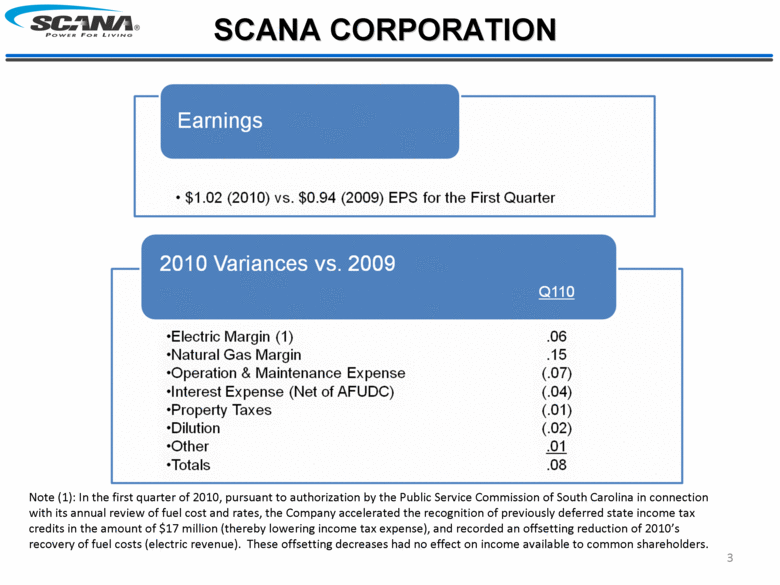
3 SCANA CORPORATION Note (1): In the first quarter of 2010, pursuant to authorization by the Public Service Commission of South Carolina in connection with its annual review of fuel cost and rates, the Company accelerated the recognition of previously deferred state income tax credits in the amount of $17 million (thereby lowering income tax expense), and recorded an offsetting reduction of 2010’s recovery of fuel costs (electric revenue). These offsetting decreases had no effect on income available to common shareholders. Earnings $1.02 (2010) vs. $0.94 (2009) EPS for the First Quarter 2010 Variances vs. 2009 Q110 Electric Margin (1) Natural Gas Margin Operation & Maintenance Expense Interest Expense (Net of AFUDC) Property Taxes Dilution Other Totals .06 15 (.07) (.04) (.01) (02) .01 .08 |
|
|
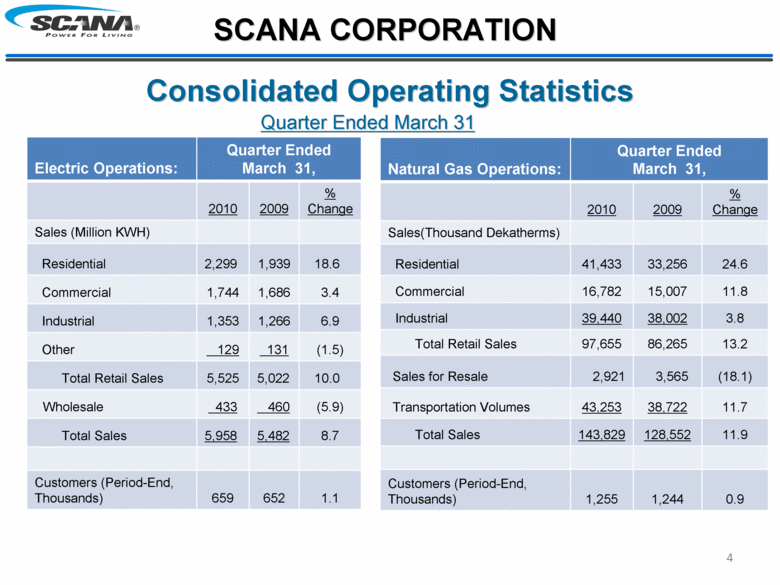
4 Consolidated Operating Statistics SCANA CORPORATION Electric Operations: Quarter Ended March 31, 2010 2009 % Change Sales (Million KWH) Residential 2,299 1,939 18.6 Commercial 1,744 1,686 3.4 Industrial 1,353 1,266 6.9 Other 129 131 (1.5) Total Retail Sales 5,525 5,022 10.0 Wholesale 433 460 (5.9) Total Sales 5,958 5,482 8.7 Customers (Period-End, Thousands) 659 652 1.1 Natural Gas Operations: Quarter Ended March 31, 2010 2009 % Change Sales(Thousand Dekatherms) Residential 41,433 33,256 24.6 Commercial 16,782 15,007 11.8 Industrial 39,440 38,002 3.8 Total Retail Sales 97,655 86,265 13.2 Sales for Resale 2,921 3,565 (18.1) Transportation Volumes 43,253 38,722 11.7 Total Sales 143,829 128,552 11.9 Customers (Period-End, Thousands) 1,255 1,244 0.9 Quarter Ended March 31 |
|
|
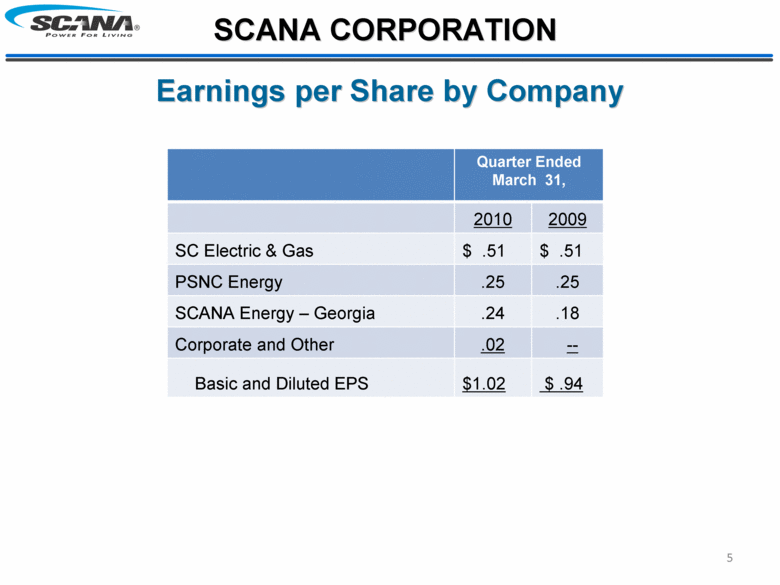
5 Earnings per Share by Company SCANA CORPORATION Quarter Ended March 31, 2010 2009 SC Electric & Gas $ .51 $ .51 PSNC Energy .25 .25 SCANA Energy – Georgia .24 .18 Corporate and Other .02 -- Basic and Diluted EPS $1.02 $ .94 |
|
|
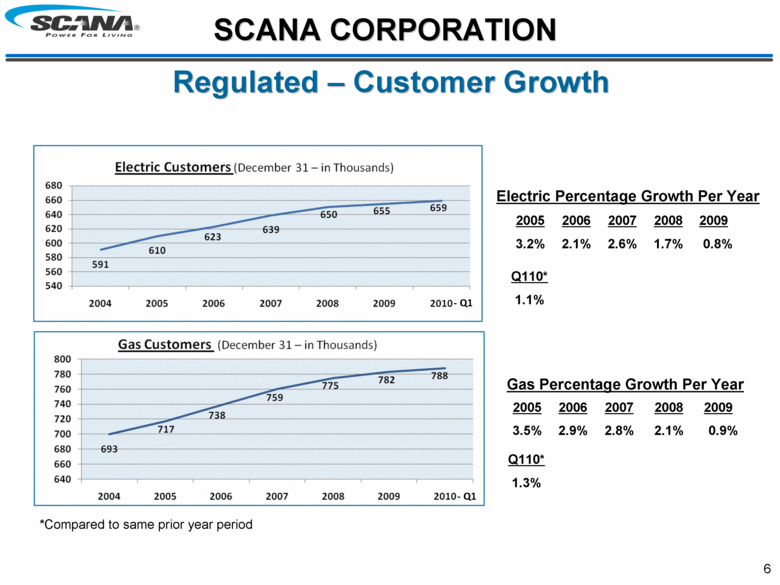
SCANA CORPORATION 6 Regulated – Customer Growth 2005 2006 2007 2008 2009 3.2% 2.1% 2.6% 1.7% 0.8% Electric Percentage Growth Per Year 2005 2006 2007 2008 2009 3.5% 2.9% 2.8% 2.1% 0.9% Gas Percentage Growth Per Year Q110* 1.1% Q110* 1.3% *Compared to same prior year period - Q1 - Q1 |
|
|
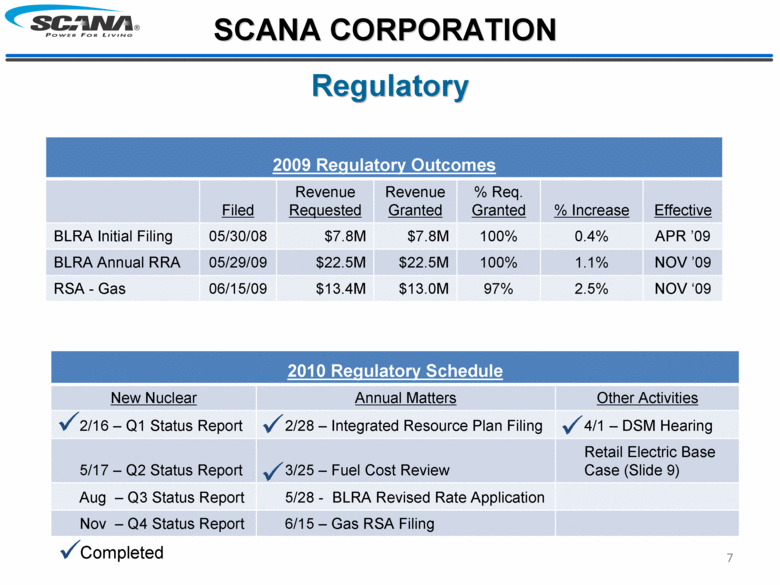
7 Regulatory SCANA CORPORATION 2009 Regulatory Outcomes Filed Revenue Requested Revenue Granted % Req. Granted % Increase Effective BLRA Initial Filing 05/30/08 $7.8M $7.8M 100% 0.4% APR ’09 BLRA Annual RRA 05/29/09 $22.5M $22.5M 100% 1.1% NOV ’09 RSA - Gas 06/15/09 $13.4M $13.0M 97% 2.5% NOV ‘09 2010 Regulatory Schedule New Nuclear Annual Matters Other Activities 2/16 – Q1 Status Report 2/28 – Integrated Resource Plan Filing 4/1 – DSM Hearing 5/17 – Q2 Status Report 3/25 – Fuel Cost Review Retail Electric Base Case (Slide 9) Aug – Q3 Status Report 5/28 - BLRA Revised Rate Application Nov – Q4 Status Report 6/15 – Gas RSA Filing Completed |
|
|
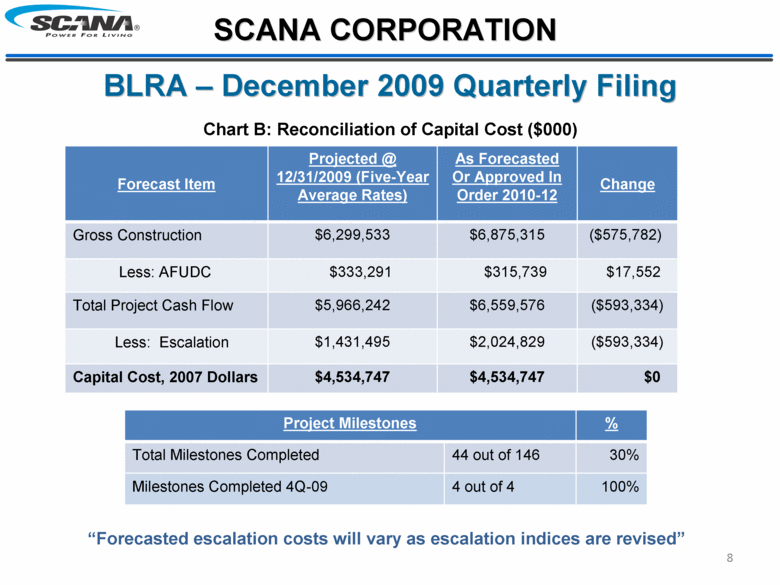
8 BLRA – December 2009 Quarterly Filing SCANA CORPORATION Forecast Item Projected @ 12/31/2009 (Five-Year Average Rates) As Forecasted Or Approved In Order 2010-12 Change Gross Construction $6,299,533 $6,875,315 ($575,782) Less: AFUDC $333,291 $315,739 $17,552 Total Project Cash Flow $5,966,242 $6,559,576 ($593,334) Less: Escalation $1,431,495 $2,024,829 ($593,334) Capital Cost, 2007 Dollars $4,534,747 $4,534,747 $0 Chart B: Reconciliation of Capital Cost ($000) Project Milestones % Total Milestones Completed 44 out of 146 30% Milestones Completed 4Q-09 4 out of 4 100% “Forecasted escalation costs will vary as escalation indices are revised” |
|
|
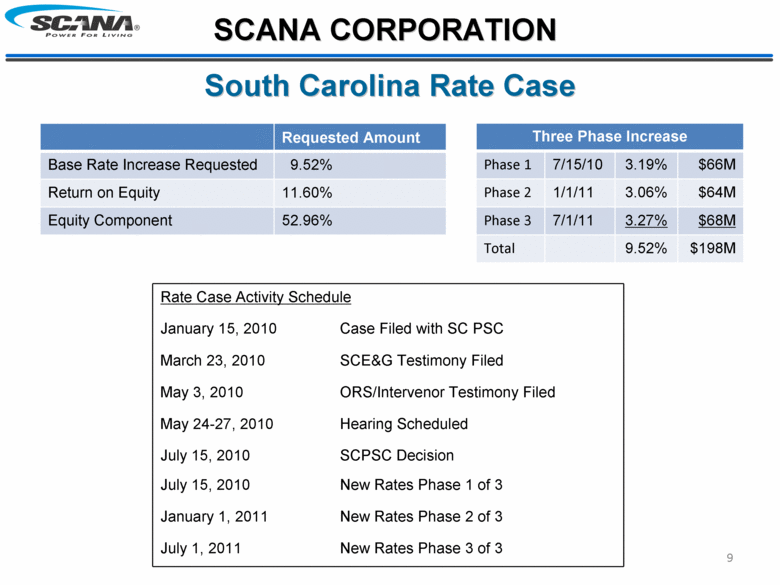
9 South Carolina Rate Case SCANA CORPORATION Requested Amount Base Rate Increase Requested 9.52% Return on Equity 11.60% Equity Component 52.96% Rate Case Activity Schedule January 15, 2010 Case Filed with SC PSC March 23, 2010 SCE&G Testimony Filed May 3, 2010 ORS/Intervenor Testimony Filed May 24-27, 2010 Hearing Scheduled July 15, 2010 SCPSC Decision July 15, 2010 New Rates Phase 1 of 3 January 1, 2011 New Rates Phase 2 of 3 July 1, 2011 New Rates Phase 3 of 3 Three Phase Increase Phase 1 7/15/10 3.19% $66M Phase 2 1/1/11 3.06% $64M Phase 3 7/1/11 3.27% $68M Total 9.52% $198M |
|
|
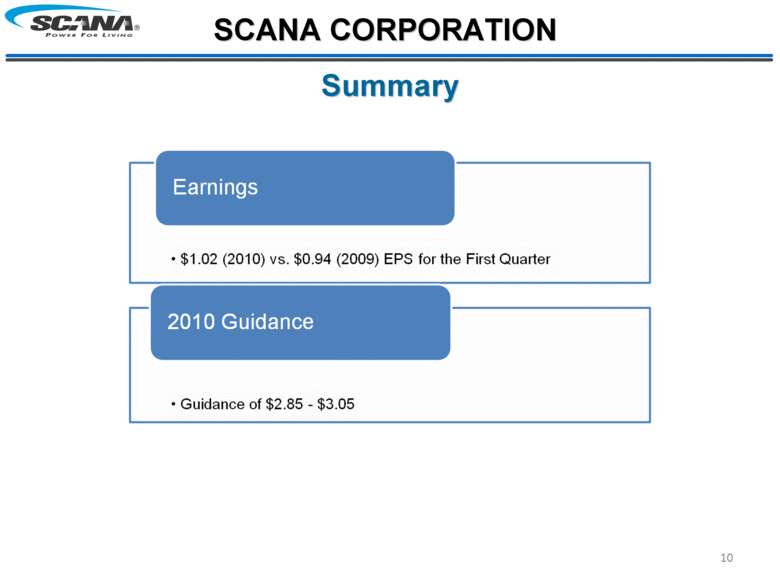
10 Summary SCANA CORPORATION Earnings $1.02 (2010) vs. $0.94 (2009) EPS for the First Quarter 2010 Guidance Guidance of $2.85 - $3.05 |
|
|
11 Questions? SCANA CORPORATION |

