Attached files
| file | filename |
|---|---|
| 8-K - FORM 8-K - Northwest Bancshares, Inc. | l39636e8vk.htm |
| EX-99.1 - EX-99.1 - Northwest Bancshares, Inc. | l39636exv99w1.htm |
Exhibit 99.2

| announces the acquisition of N O R T H W E S T |

| Forward-Looking Statements 2 This presentation contains forward-looking statements, which can be identified by the use of words such as "estimate," "project," "believe," "intend," "anticipate," "plan," "seek," "expect" and words of similar meaning. These forward-looking statements include, but are not limited to: statements of our goals, intentions and expectations; statements regarding our business plans, prospects, growth and operating strategies; statements regarding the asset quality of our loan and investment portfolios; and estimates of our risks and future costs and benefits. These forward-looking statements are based on current beliefs and expectations of our management and are inherently subject to significant business, economic and competitive uncertainties and contingencies, many of which are beyond our control. In addition, these forward-looking statements are subject to assumptions with respect to future business strategies and decisions that are subject to change. The following factors, among others, could cause actual results to differ materially from the anticipated results or other expectations expressed in the forward-looking statements: changes in laws or government regulations or policies affecting financial institutions, including changes in regulatory fees and capital requirements; general economic conditions, either nationally or in our market areas, that are worse than expected; competition among depository and other financial institutions; inflation and changes in the interest rate environment that reduce our margins or reduce the fair value of financial instruments; adverse changes in the securities markets; our ability to enter new markets successfully and capitalize on growth opportunities; our ability to successfully integrate acquired entities, if any; changes in consumer spending, borrowing and savings habits; changes in our organization, compensation and benefit plans; our ability to continue to increase and manage our commercial and residential real estate, multi-family, and commercial and industrial loans; possible impairments of securities held by us, including those issued by government entities and government sponsored enterprises; the level of future deposit premium assessments; the impact of the current recession on our loan portfolio (including cash flow and collateral values), investment portfolio, customers and capital market activities; the impact of the current governmental effort to restructure the U.S. financial and regulatory system; changes in the financial performance and/or condition of our borrowers; and the effect of changes in accounting policies and practices, as may be adopted by the regulatory agencies, as well as the Securities and Exchange Commission, the Public Company Accounting Oversight Board, the Financial Accounting Standards Board and other accounting standard setters. Because of these and other uncertainties, our actual future results may be materially different from the results indicated by these forward- looking statements. Please see "Risk Factors" beginning on page 15 of our 2009 Annual Report on Form 10-K. |

| NexTier Overview 3 NexTier Bank is a privately held commercial bank founded in 1878 and headquartered in Butler, PA, 30 miles north of downtown Pittsburgh At March 31, 2010 the Company had: $584 million in assets $376 million in gross loans $514 million in deposits $18 million in tangible common equity (3.11% of tangible assets) Positive one year gap of 24% (asset sensitive) NexTier has 16 branches in Western Pennsylvania 12 branches in Butler County 3 branches in Allegheny County 1 branch in Armstrong County |

| Transaction Summary 4 Acquisition of an extremely attractive core deposit base 38% demand deposits Cost of deposits of 0.58% Attractively priced transaction 100% cash, $200 per share or $20.3 mm in total consideration 113% of tangible book value, 88% of book value $2.3 mm premium on tangible book, 0.46% premium on deposits 35% cost savings $0.05 per share accretion to EPS Accretive to ROA and ROE Return on investment in excess of 25% Accretive to tangible book value within 1 year |

| Asset Quality 5 $376 million loan portfolio $314 million of loans are in the Pennsylvania market $62 million of loans are in Arizona and other markets $37.6 million in non-performing assets $8.5 million of non-performing assets are in the Pennsylvania market $29.2 million of non-performing assets are in Arizona and other markets Problem assets are primarily out of market, have been thoroughly reviewed and are adequately reserved for in NWBI's pricing of the transaction (estimated loan mark of $7 million will enhance the current reserve of $5.7 million) Price adjustment mechanism if interim loss provision exceeds threshold of $7 million Walk away provision if delinquent loans(1) exceeds threshold of $48 million (1) Delinquent Loans shall mean (i) all loans with principal and/or interest that are 45 or more days past due and still accruing interest, (ii) all loans with principal and/or interest that are non-accruing or classified as non- accrual, (iii) all Other Real Estate Owned, (iv) all net charge-offs occurring after the date of this Agreement, and (v) all losses recognized by NexTier on the sale of any loans occurring after the date of this Agreement; provided that "NexTier Delinquent Loans" shall be as determined by (in the following descending order of priority in the case of any conflict or discrepancy), any (1) Regulatory Authority (regardless of whether such determination by a Regulatory Authority is formal or informal or communicated in writing or otherwise), (2) NexTier's external auditors, or (3) any independent third party who produces a report or analysis on which NexTier's board of directors, any committee thereof, or management relies in determining NexTier's loan loss provision, or any adjustment thereto. |

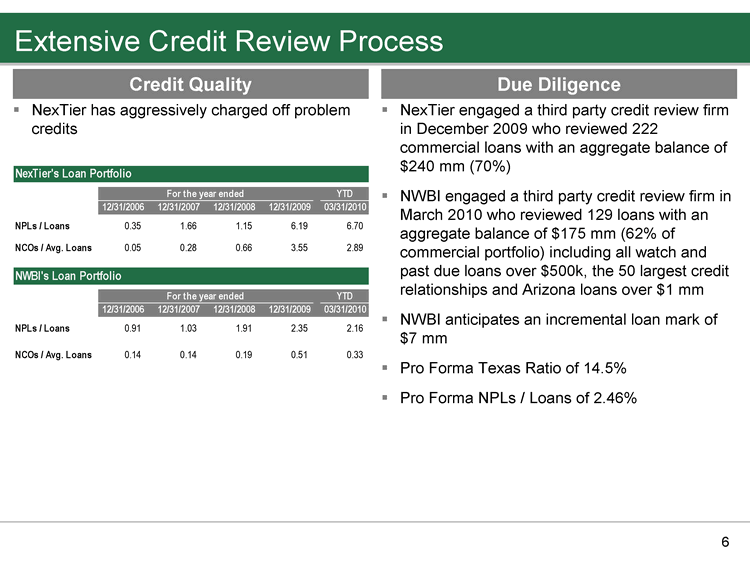
| Extensive Credit Review Process 6 NexTier engaged a third party credit review firm in December 2009 who reviewed 222 commercial loans with an aggregate balance of $240 mm (70%) NWBI engaged a third party credit review firm in March 2010 who reviewed 129 loans with an aggregate balance of $175 mm (62% of commercial portfolio) including all watch and past due loans over $500k, the 50 largest credit relationships and Arizona loans over $1 mm NWBI anticipates an incremental loan mark of $7 mm Pro Forma Texas Ratio of 14.5% Pro Forma NPLs / Loans of 2.46% Due Diligence NexTier has aggressively charged off problem credits Credit Quality NexTier's Loan Portfolio YTD 12/31/2006 12/31/2007 12/31/2008 12/31/2009 03/31/2010 NPLs / Loans 0.35 1.66 1.15 6.19 6.70 NCOs / Avg. Loans 0.05 0.28 0.66 3.55 2.89 NWBI's Loan Portfolio YTD 12/31/2006 12/31/2007 12/31/2008 12/31/2009 03/31/2010 NPLs / Loans 0.91 1.03 1.91 2.35 2.16 NCOs / Avg. Loans 0.14 0.14 0.19 0.51 0.33 For the year ended For the year ended |

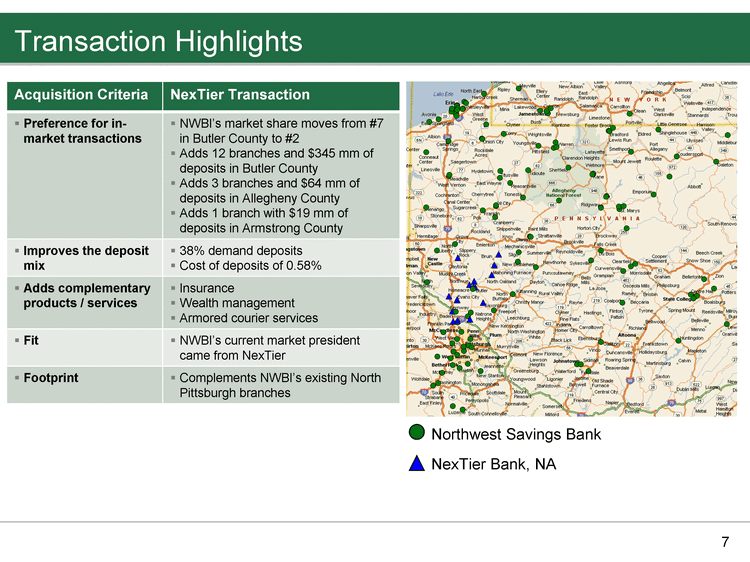
| Transaction Highlights 7 Northwest Savings Bank NexTier Bank, NA Acquisition Criteria NexTier Transaction Preference for in-market transactions NWBI's market share moves from #7 in Butler County to #2 Adds 12 branches and $345 mm of deposits in Butler County Adds 3 branches and $64 mm of deposits in Allegheny County Adds 1 branch with $19 mm of deposits in Armstrong County Improves the deposit mix 38% demand deposits Cost of deposits of 0.58% Adds complementary products / services Insurance Wealth management Armored courier services Fit NWBI's current market president came from NexTier Footprint Complements NWBI's existing North Pittsburgh branches |

| Market Share 8 Allegheny Deposit Market Share Armstrong Deposit Market Share Butler Deposit Market Share Deposit market share as of June 30, 2009 and June 30, 2008. Rank Institution (ST) 2009 Number of Branches 2009 Total Deposits in Market ($000) 2009 Total Market Share (%) 2008 Total Deposits in Market ($000) 2008 Total Market Share (%) 1 PNC Financial Services Group (PA) 10 802,727 26.43 752,165 26.40 2 Pro Forma Combined 16 484,323 15.95 455,194 15.98 2 Nextier Incorporated 12 345,894 11.39 321,387 11.28 3 Royal Bank of Scotland Group 9 330,023 10.87 271,343 9.53 4 F.N.B. Corp. (PA) 8 261,503 8.61 279,331 9.81 5 Huntington Bancshares Inc. (OH) 6 258,613 8.51 234,505 8.23 6 Mars National Bank (PA) 5 198,946 6.55 168,896 5.93 7 Northwest Bancshares, Inc. (PA) 4 138,429 4.56 133,807 4.70 8 Dollar Bank FSB (PA) 2 135,382 4.46 139,684 4.90 9 First Niagara Finl Group (NY) 2 131,194 4.32 133,241 4.68 10 First Commonwealth Financial (PA) 6 123,878 4.08 111,738 3.92 Top 10 64 2,726,589 89.78 2,546,097 89.38 Total For Institutions In Market 79 3,037,205 100.00 2,848,699 100.00 Rank Institution (ST) 2009 Number of Branches 2009 Total Deposits in Market ($000) 2009 Total Market Share (%) 2008 Total Deposits in Market ($000) 2008 Total Market Share (%) 1 PNC Financial Services Group (PA) 114 28,450,411 53.66 29,377,459 55.27 2 Bank of New York Mellon Corp. (NY) 6 6,810,712 12.85 7,942,458 14.94 3 Royal Bank of Scotland Group 77 4,150,150 7.83 3,852,445 7.25 4 Dollar Bank FSB (PA) 25 2,556,047 4.82 2,406,330 4.53 5 First Niagara Finl Group (NY) 33 2,277,848 4.30 2,139,090 4.02 6 TriState Capital Holdings Inc. (PA) 1 1,219,138 2.30 515,828 0.97 7 First Commonwealth Financial (PA) 36 1,140,388 2.15 1,035,257 1.95 8 Huntington Bancshares Inc. (OH) 16 975,516 1.84 795,505 1.50 9 Parkvale Financial Corp. (PA) 28 868,021 1.64 854,372 1.61 10 Pro Forma Combined 21 722,409 1.36 724,060 1.36 10 F.N.B. Corp. (PA) 24 715,838 1.35 671,158 1.26 11 Northwest Bancshares, Inc. (PA) 18 658,526 1.24 665,411 1.25 23 Nextier Incorporated 3 63,883 0.12 58,649 0.11 Top 10 378 49,822,595 93.98 50,255,313 94.55 Total For Institutions In Market 465 53,020,588 100.00 53,152,096 100.00 Rank Institution (ST) 2009 Number of Branches 2009 Total Deposits in Market ($000) 2009 Total Market Share (%) 2008 Total Deposits in Market ($000) 2008 Total Market Share (%) 1 Farmers & Merchants Bancorp (PA) 7 310,300 28.57 307,630 29.68 2 Keystrong Financial Inc. (PA) 3 152,521 14.04 141,142 13.62 3 Royal Bank of Scotland Group 3 127,459 11.74 100,403 9.69 4 S&T Bancorp Inc. (PA) 3 87,164 8.03 82,838 7.99 5 Pro Forma Combined 2 80,364 7.40 80,389 7.76 5 First Commonwealth Financial (PA) 2 72,571 6.68 76,046 7.34 6 Armstrong County Building (PA) 1 65,677 6.05 61,324 5.92 7 Apollo Bancorp Inc. (PA) 4 64,744 5.96 61,025 5.89 8 Northwest Bancshares, Inc. (PA) 1 61,611 5.67 63,412 6.12 9 F.N.B. Corp. (PA) 2 50,534 4.65 50,029 4.83 10 PNC Financial Services Group (PA) 1 48,645 4.48 48,109 4.64 12 Nextier Incorporated 1 18,753 1.73 16,977 1.64 Top 10 27 1,041,226 95.87 991,958 95.72 Total For Institutions In Market 29 1,086,020 100.00 1,036,641 100.00 |

| Composition of Deposits 9 NWBI December 2005 NWBI December 2009 NexTier December 2009 Pro Forma December 2009 Cost of Deposits: 2.35% Cost of Deposits: 1.79% Cost of Deposits: 0.78% Cost of Deposits: 1.71% Cost of deposits for each respective year. Transaction 18.3% MMDA & Savings 29.3% Certificates of Deposit 52.4% Transaction 22.3% MMDA & Savings 31.0% Certificates of Deposit 46.7% Transaction 29.5% MMDA & Savings 52.4% Certificates of Deposit 18.1% MMDA & Savings 32.8% Transaction 22.9% Certificates of Deposit 44.3% |

| Composition of Loan Portfolio 10 NWBI December 2005 NWBI December 2009 NexTier December 2009 Pro Forma December 2009 Yield: 6.23% Yield: 6.17% Yield: 5.67% Yield: 6.14% Yield on loans for each respective year. Commercial Business 3.3% One-to-Four Family 59.5% Multi-Family & Commerical 12.6% Consumer & Home Equity 24.6% Commercial Business 7.0% One-to-Four Family 44.1% Consumer & Home Equity 25.6% Multi-Family & Commerical 23.3% Consumer & Home Equity 11.6% Commercial Business 12.3% Construction 6.8% One-to-Four Family 16.6% Multi-Family & Commerical 52.7% One-to-Four Family 42.2% Commercial Business 7.4% Consumer & Home Equity 24.7% Construction 0.5% Multi-Family & Commerical 25.2% |
