Attached files
| file | filename |
|---|---|
| 8-K - FORM 8-K - BNC BANCORP | d8k.htm |
 BNC Bancorp
Gulf South Bank
Conference
May 5, 2010
Exhibit 99.1 |
 Forward-Looking Statements
2
This presentation contains forward-looking statements relating to the
financial condition, results of operations and business of BNC
Bancorp and its subsidiary Bank of North Carolina. These forward-looking
statements involve risks and uncertainties and are based on the beliefs
and assumptions of the management of BNC Bancorp, and the
information available to management at the time that this presentation was prepared.
Factors that could cause actual results to differ materially from those
contemplated by such forward-looking statements include, among
others, the following: (i) general economic or business conditions, either nationally
or regionally, may be less favorable than expected, resulting in, among
other things, a deterioration in credit quality and/or a reduced
demand for credit or other services; (ii) changes in the interest rate environment may
reduce net interest margins and/or the volumes and values of loans made or
held as well as the value of other financial assets held; (iii)
competitive pressures among depository and other financial institutions may
increase significantly; (iv) legislative or regulatory changes, including
changes in accounting standards, may adversely
affect
the
businesses
in
which
BNC
Bancorp
is
engaged;
(v)
local,
state
or
federal
taxing
authorities
may take tax positions that are adverse to BNC Bancorp; (vi) adverse
changes may occur in the securities markets; (vii) competitors of
BNC Bancorp may have greater financial resources and develop products that
enable them to compete more successfully than BNC Bancorp; (viii) costs or
difficulties related to the integration of Beach First National
Bank (“Beach First”) may be greater than expected; (ix) expected cost
savings associated with our acquisition of Beach First may not be fully
realized or realized within the expected time frame; and (x)
deposit attrition, customer loss or revenue loss following our acquisition of Beach First
may be greater than expected. Additional factors affecting BNC
Bancorp and Bank of North Carolina are discussed in BNC
Bancorp’s filings with the Securities and Exchange Commission (the “SEC”), Annual
Report on Form 10-K, its Quarterly Reports on Form 10-Q and its
Current Reports on Form 8-K. Please refer
to
the
Securities
and
Exchange
Commission’s
website
at
www.sec.gov
where
you
can
review
those
documents. BNC Bancorp does not undertake a duty to update any
forward-looking statements made during this presentation.
|
 Quality
Competence
Discipline
3 |
 BNC Bancorp Highlights
•
11
th
largest
bank
headquartered
in
North
Carolina
(7
th
Pro
forma
with
Beach
First)
•
$1.63 billion in assets as of March 31, 2010
•
Annual Regulatory Exam completed in Q1 2010
•
90% of historic growth has been organic
•
History of strong core earnings and declared dividends
•
Profitable every quarter since 1994
•
Excellent branch locations and market presence across key markets
•
Strong
market
share
in
key
markets
across
BNC
core
markets
along
I-85
/
I-40
/
I-77
/
I-73
corridors
•
Slower price value appreciation and therefore less severe downturn in
property values •
Recent expansion into coastal South Carolina through FDIC assisted
purchase of Beach First National Bank
•
Strong asset quality
•
NPAs/Assets of 2.04% at Q1 2010 versus peer median of 3.58%
•
Well reserved with Allowance for Loan Losses / Total Loans of 1.60% as of
March 31, 2010, up from the 1.44% reported at March 31, 2009 and
consistent with the 1.60% of total loans outstanding at December
31, 2009 •
Most
of
the
credit
team
endured
the
real
estate
downturns
of
the
80s
and
90s;
the
team
has
perspective, experience, and seasoned judgment
•
Continued profitability in Q1 2010
•
Net income to common shareholders of $886,000, or $0.12 per share, an
increase of 1% from Q1 2009
•
Net interest margin of 3.47%, a 36-basis-point increase from a
year prior •
Declared a quarterly dividend in Q1 2010 of $0.05 per share
4 |
 Franchise Overview:
Consistent Growth and Profitability
5
Note:
Acquired
SterlingSouth
Bank
in
Greensboro
($160
million
in
assets)
in
July,
2006,
as
well
as
Beach
First
National
Bank
(approximately
$614
million
in
assets)
from
the
FDIC
as
receiver
in
April
2010.
Results
from
the
Beach
First
deal
are
not
reflected
in
this
table. |
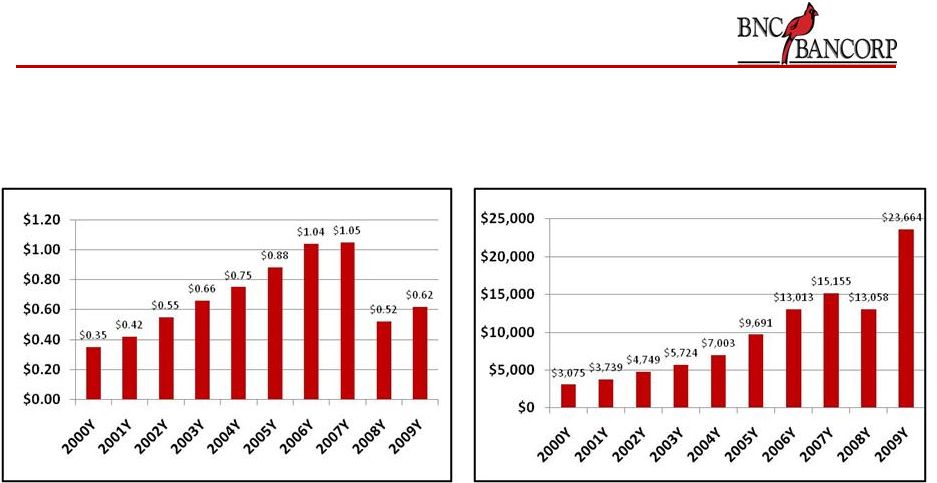 Franchise Overview:
Consistent Growth and Profitability
6
Note: Dollars in millions except per share data
Earnings per Share
Pre-Tax Pre-Provision Net
Revenues |
 Franchise Overview:
Branch Locations and Market Overview
7
•
24 locations in North Carolina and South Carolina
•
17 locations along the 1-85/ I-40/ I-77/ I-73 corridors
in North Carolina •
7 additional locations in South Carolina acquired through the Beach First
National Bank P&A:
1
in
North
Myrtle
Beach,
3
in
Myrtle
Beach,
1
in
Pawleys
Island,
and
2
in
Hilton
Head
Bank of North Carolina
Offices
BNC Bank Offices |
   North Carolina Franchise Overview:
Market Demographics and Position
8
•
Growth Markets:
•
Concord, NC in Cabarrus County; Population: 66,300; The
population of Concord more than doubled during the 10-year
period from 1990 to 2000; Population growth of 18% since
2000 •
Lake Norman Area; Includes Mooresville, Huntersville, Davidson and
Cornelius; Population: Approximately 91,000;
Population growth 47.2% since 2000; Demographics exceed National
and State Averages for wealth, income, and education
•
Both
markets
considered
Metro
Charlotte,
population
of
more
than
1.5
million
Deposit data as of June 30, 2009
Source:
FDIC,
ESRI
(U.S.
Census),
www.city-data.com,
SNL
Financial
County
Market
Rank
Number of
Branches
Deposits in
Market
Deposit
Market
Share (%)
Total
Population
2009
Projected Population
Change 2009-2014 (%)
Median HH
Income 2009
($)
Projected HH Income
Change 2009-2014 (%)
Guilford
5
6
632,132
6.53
476,896
6.49
56,264
6.83
Davidson
1
4
551,631
26.32
159,673
3.32
47,411
3.68
Randolph
9
1
47,412
2.59
142,555
4.11
47,059
6.67
Rowan
10
1
40,161
2.72
139,607
3.71
46,826
4.56
Forsyth
13
2
36,534
0.20
349,532
6.96
55,686
4.55
Cabarrus
11
2
24,256
1.19
173,392
14.81
60,301
6.82
Iredell
18
1
12,871
0.57
160,602
14.54
53,943
2.14
BNC Bancorp Franchise
17
1,344,997
1,602,257
5.26
48,721
5.36
Weighted Average State of North Carolina
9,370,242
8.13
51,418
4.31
National
309,731,508
4.63
54,719
4.06 |
 Overview of South Carolina Franchise
•
Beach First National Bank was founded in 1996
•
The parent holding company, Beach First National Bancshares, Inc., was
previously traded on the NASDAQ under the symbol
“BFNB” •
Beach First National Bank served the Grand Strand and Hilton Head Island
markets with seven banking offices
•
Branch locations include 3 in Myrtle Beach, 1 in North Myrtle Beach, 2 in
Hilton Head, and 1 in Pawleys
Island
•
Voted
“Best
Community
Bank”
in
Myrtle
Beach
2
of
the
last
3
years
by
the
Myrtle
Beach Herald
•
Strong deposit market and retail following
•
#1 ranked market share in Myrtle Beach, according to 2009 data provided by
SNL Financial
•
Overall 19th deposit market share in the state of South Carolina
•
Attractive deposit mix
•
Minimal brokered deposits (approximately 5% of total deposits)
•
Favorable long-term demographics
9 |
   South Carolina Franchise Overview:
Market Demographics and Position
10
Deposit data as of June 30, 2009
Source:
FDIC,
ESRI
(U.S.
Census),
www.city-data.com,
SNL
Financial
•
Growth Markets:
•
Myrtle
Beach
MSA
represents
approximately
pro
forma
22.7%
of
the
BNC
franchise
•
Projected
population
growth
in
South
Carolina
franchise
of
14.5%
between
2009
and
2014, including projected population growth of 16.2% in the Myrtle Beach
MSA •
Myrtle Beach MSA previously experienced 34.5% population growth from
2000-2009 •
Additionally, Beaufort County projects population growth of approximately
11.6% between 2009 and 2014
County
Market
Rank
Number of
Branches
Deposits in
Market
Deposit
Market
Share (%)
Total
Population
2009
Projected Population
Change 2009-2014 (%)
Median HH
Income 2009
($)
Projected HH Income
Change 2009-2014 (%)
Horry
4
4
436,554
7.84
264,423
16.22
46,996
4.1
Beaufort
15
2
96,472
2.72
157,963
11.64
62,527
1.16
Georgetown
10
1
43,662
3.71
62,931
4.08
45,158
6.12
BNC Bancorp Franchise
7
576,688
485,317
14.54
49,455
3.76
Weighted Average State of South Carolina
4,524,760
6.1
48,210
4.74
National
309,731,508
4.63
54,719
4.06 |
 Franchise Overview:
Q1 2010 Financial Highlights
11
•
Net income of $1.39 million for Q1 2010
•
Diluted EPS of $0.12. Continued record of profitability every
quarter since 1994 •
Increase in Net Interest Income of 10.8% from a year prior
•
NPAs/Assets of 2.04%, well below regional peer group median of 3.58%, and
the SNL Bank Index components average of 3.46%
•
Continued progress towards our core deposit growth initiatives, with an
overall year over year increase in deposits of 5% since Q1
2009 •
Interest
bearing
demand
deposits
and
savings
increased
by
$146.6
million
•
Retailed time deposits increased by $134.3 million
•
Wholesale time deposits decreased by $221.7 million year over year
|
 CD Portfolio:
Extending in a Low Rate Environment
12
(In thousands)
Remaining Maturity
2009
2008
2007
2006
2005
2004
2003
Maturities Less than 1 Year
310,447
637,363
487,770
394,084
166,420
129,837
72,584
Maturities 1+ to 2 Years
95,144
97,304
52,699
116,673
123,929
58,509
32,774
Maturities 2+ to 5 Years
212,908
77,444
13,114
8,017
21,813
17,330
7,724
Maturities 5+ to 15 Years
32,610
5,974
6,155
6,471
5,954
-
-
Total CD's
651,109
818,085
559,738
525,245
318,116
205,676
113,082
Weighted
Avg
Remaining
Maturity
20.42
9.43
7.58
9.66
14.55
12.00
11.86
Weighted Avg
Rate
2.81%
3.24%
4.84%
4.75%
3.72%
2.46%
2.04%
% of CD's Less than 1 Year
47.7%
77.9%
87.1%
75.0%
52.3%
63.1%
64.2%
December 31,
Low
Rate
Environment-Extending
Low Rate Environment-Extending
High Rate Environment
Reducing Duration |
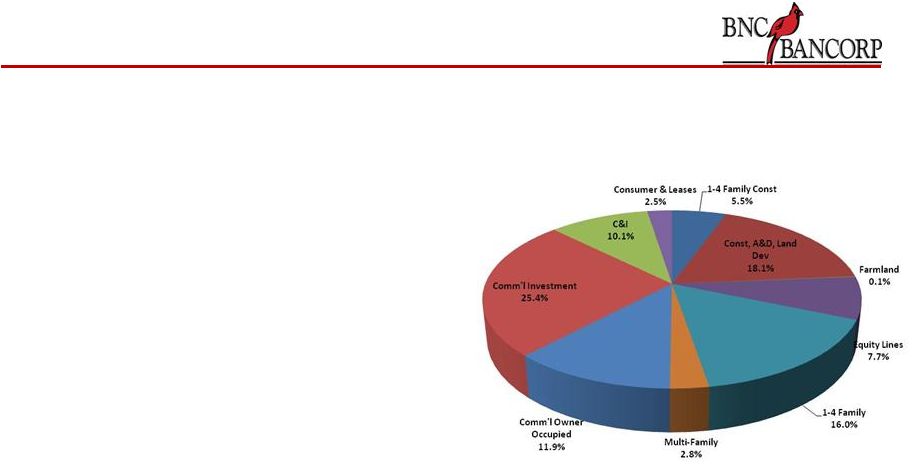 Diversified Loan Portfolio
13
1
Peer financial data as of December 31, 2009; regulatory data.
Represents most recent data available at the time of this
presentation. Loan Composition -
$1.09 billion
7,334 Loans
•
Small average loan balance: $148,490
•
Strong loan quality
•
NPLs
/ Loans of 1.18% as of Q1 2010 versus peers of
3.06%
1
•
Experienced credit team with average tenure of >
25 years and experience through various economic
and credit cycles
•
Construction, Acquisition and Development, and
Land Portfolio has been reduced 26% over the last
18 months from $306M to $227M
•
Residential and Commercial A&D balances have been
reduced 42%, or $28 million over the 18 month period
•
Credit Risk Management has been engaged by the
Audit Committee to perform independent credit
review semi-annually
•
10 Year Relationship
•
Upon completion, CRM reports directly to a joint
meeting of the Audit and Loan Committees of the
Board of Directors
•
Also been instrumental in providing credit training,
policy maintenance, and comprehensive underwriting
tools |
 Loan Portfolio and Asset Quality:
Superior Asset Quality Relative to Peers
14
Note:
Peers
include
publicly
traded
banks
with
assets
between
$1
and
$3
billion
in
NC,
SC,
WV
and
VA
(SCBT,
VCBI,
CHCO,
UBSH,
FCBC,
FNBN,
YAVY,
NBBC,
CFNL,
SCMF,
CBKN,
SMMF,
EVBS,
CRFN,
MBRG,
PEBK,
FOFN,
FSBK,
ECBE,
and
CSBC)
Source:
SNL
Financial
and
BNC
Bancorp
filings
NPAs
+ 90 Days Delinquent / Assets
Reserves / Loans
NPAs
+ 90 Days Delinquent / Equity + Reserves
Net Charge-Offs / Average Loans |
  Loan Portfolio and Asset Quality:
Credit Quality Statistics
15
Balances as of March 31, 2010
(In thousands)
Loan Type
Current Balance
% of Total
Balance
Non-Accrual
Loans
Non-Accrual /
Current Balance
OREO
30-89 Days
Delinq.
90+ Days
Delinq.
Year-to-Date
Charge-offs
1-4 Family Const
$44,690
5.5%
$1,117
0.07%
$0
$912
$0
$395
Const, A&D, Land Dev
181,778
18.1%
907
0.76%
16,556
458
0
419
Farmland
864
0.1%
0
0.00%
0
0
0
0
Equity Lines
79,563
7.7%
413
0.02%
0
44
0
92
1-4 Family
186,379
16.0%
1,683
0.13%
1,736
1,192
0
191
Multi-Family
30,172
2.8%
0
0.00%
0
0
0
0
Comm'l Owner Occupied
142,539
11.9%
1,989
0.02%
0
259
0
55
Comm'l Investment
288,081
25.4%
2,389
0.02%
2,034
16
0
1,190
C&I
111,251
10.1%
4,036
0.08%
0
59
0
410
Consumer & Leases
23,303
2.5%
8
0.01%
0
10
0
124
Total
$1,088,620
100.0%
$12,542
1.12%
$20,326
$2,950
$0
$2,876 |
 Loan Portfolio and Asset Quality:
Construction, A&D and Land Loan Portfolio
16
Balances as of March 31, 2010
(Dollars in millions)
% of Total
Loans
3/31/2010
9/30/2008
18-Month Change
CONSTRUCTION, A&D, LAND
20.9%
$227.4
$306.2
-25.7%
Residential Construction
19.7%
44.7
89.3
-49.9%
Presold
7.7%
17.6
19.2
-8.3%
Speculative
11.9%
27.1
70.1
-61.3%
Loan size - Over $400,000
3.9%
8.8
25.3
-65.2%
Loan size - $200,000 to $400,000
4.9%
11.1
26.6
-58.3%
Loan size - Under $200,000
3.2%
7.2
18.2
-60.4%
Commercial Construction
18.9%
43.0
65.8
-34.7%
Loan size $5.0 to $8.0 million
0.0%
0.0
0.0
0.0%
Loan size $3.0 to $5.0 million
5.3%
12.0
31.8
-62.3%
Loan size $1.0 to $3.0 million
8.9%
20.2
19.6
3.1%
Loan size - under $1 million
4.7%
10.8
14.4
-25.0%
Residential and Commercial A&D
16.9%
38.5
66.0
-41.7%
Loan size $5.0 to $6.0 million
5.1%
11.6
5.6
107.1%
Loan size $3.0 to $5.0 million
3.3%
7.6
17.4
-56.3%
Loan size $1.0 to $3.0 million
6.8%
15.4
31.3
-50.8%
Loan size - under $1 million
1.7%
3.9
11.7
-66.7%
Land
44.5%
101.2
85.1
18.9%
Residential Buildable Lots
17.9%
40.6
26.6
52.6%
Commercial Buildable Lots
7.6%
17.3
13.8
25.4%
Land held for development
12.4%
28.2
30.0
-6.0%
Raw and Agricultural Land
6.6%
15.1
14.7
2.7% |
 Loan Portfolio and Asset Quality:
Commercial Real Estate Portfolio
17
Balances as of March 31, 2010
(Dollars in millions)
% of Total
Loans
3/31/2010
9/30/2008
18-Month Change
COMMERCIAL REAL ESTATE
42.4%
$461.2
$340.2
35.6%
Multi-Family
6.5%
30.2
10.8
179.6%
Churches
3.6%
16.4
13.4
22.4%
Retail
66.6%
307.2
217.7
41.1%
Owner Occupied
19.3%
89.0
66.8
33.2%
Investment
47.3%
218.2
150.9
44.6%
Loan size - $5.0 to $6.0 million
8.9%
40.9
12.1
238.0%
Loan size - $3.0 to $5.0 million
7.7%
35.5
19.1
85.9%
Loan size - $1.0 to $3.0 million
15.7%
72.6
59.4
22.2%
Loan size - under $1 million
15.0%
69.2
60.3
14.8%
Industrial
22.4%
103.5
93.0
11.3%
Owner Occupied
7.9%
36.3
34.5
5.2%
Investment
14.6%
67.2
58.5
14.9%
Loan size - $5.0 to $6.0 million
1.1%
5.1
5.1
0.0%
Loan size - $3.0 to $5.0 million
0.7%
3.3
3.5
-5.7%
Loan size - $1.0 to $3.0 million
6.5%
29.9
22.9
30.6%
Loan size - under $1 million
6.3%
28.9
27.0
7.0%
Other
0.8%
3.9
5.3
-26.4% |
  Loan Portfolio and Asset Quality:
Non-Owner Occupied CRE Portfolio
18
Diversified, Small Concentrations
Balances as of March 31, 2010
(Dollars in Thousands)
Property Type
Current Exposure
% of CRE
Non-Owner
Occupied
% of Total
Loans
Office - Professional & Management
$47,112
16.4%
4.3%
Retail Centers
32,116
11.2%
3.0%
Hotels and Motels - National Chains
34,630
12.1%
3.2%
Manufacturing and Industrial
26,773
9.3%
2.5%
Office Multi-use
23,422
8.2%
2.2%
Showroom Space
8,068
2.8%
0.7%
Restaurants
19,349
6.7%
1.8%
Residential Buildings and Dwellings
11,380
4.0%
1.0%
Miniwarehouses and Self-Storage Units
13,903
4.8%
1.3%
New & Used Car Dealers
10,911
3.8%
1.0%
Office - Finance & Insurance
8,112
2.8%
0.7%
Office - Medical
10,906
3.8%
1.0%
Child Day Care Services
7,092
2.5%
0.7%
Automotive Repair & Care
5,810
2.0%
0.5%
Golf Courses and Country Clubs
4,011
1.4%
0.4%
Retail Single-Use
14,003
4.9%
1.3%
Non-Profits/Government
1,756
0.6%
0.2%
Construction Industry
5,092
1.8%
0.5%
Wholesale Trade - Single Use
2,688
0.9%
0.2%
Total CRE - Non-Owner Occupied
287,133
100.0%
26.4%
Office: No deal larger than $4mm
Retail: No deal larger than $5mm
Strong Credit-Tenant Deals
Hotels: Diversified by Area
Examples:
Hilton Garden Inn
Holiday Inn Express
Hampton Inn
Restaurants: National Chain-
Credit Tenants
Examples:
Bojangles-
multiple locations
IHOP |
 19
Quality
Competence
Discipline |
  Experienced Management
•
Strong culture of management and employee ownership
•
Experienced and established management team with average tenure of more
than 25 years •
Insider ownership of more than 19.7%
20
Name
Prior
Experience
Years of
Experience
Current Position
W. Swope Montgomery, Jr.
Wachovia,
SunTrust
39
President &
Chief Executive Officer
Richard D. Callicutt II
Wachovia,
FirstUnion
29
Executive Vice President &
Chief Operating Officer
David Spencer
KPMG,
FirstSouth Bank
25
Executive Vice President &
Chief Financial Officer
Tom Nelson
Bank of
America
25
Chief Credit Officer
Reid Marks
Bank of
America
34
Commercial Banking
Manager |
 Veteran Credit Team
21
Red denotes those in banking during real estate problems of early
`80s •
Experienced credit team with average tenure of greater than 25 years and
experience through various economic and credit cycles
Name
Title at BNC
Experience, Positions Held
Years of Banking
Experience
Tom Nelson
Chief Credit Officer
Bank of America, Credit Policy and Underwriting, Former USMC
Aviator 25
Larry Brown
Sr
Credit
Officer
-
Corporate
Wachovia Bank. Commercial Lending, Area Credit Officer
43
Janet Helms
Sr
Credit
Officer
-
South
Region
Wachovia Bank/First Union. Commercial RE Underwriting
26
Mike Thomas
Sr
Credit
Officer
-
Real
Estate
BB&T,
Credit
Admin
-
Real
Estate
Development
23
Daren Fuller
Sr
Credit Info Officer
LSB, Credit Administration
17
Link Ward
Sr
Credit
Officer
-
Consumer
BB&T, Wachovia
21
Ben Parks
Credit Review
Wachovia, Bank of America
40
Amy Likens
Sr
Credit
Analyst
-
South
Region
Wachovia, Senior Loan Review and Risk Officer
21
Christine O'Brien
Sr
Credit
Analyst
-
Triad
Region
First Charter, Commercial Loan Analyst Manager
12
Reid Marks
Triad Comm
Banking Mgr
Bank of America, Commercial and Middle Market President
34
Bill Connolly
Concord City Executive
BB&T, SouthTrust, FirstCharter, Business Banking Exec of NC
36
Dana Ritchie
Harrisburg City Executive
CCB (SunTrust), Commercial Lending
35
Earl Snipes
Thomasville City Executive
LSB, Senior Commercial Lender
33
Heather Grossnickle
Greensboro City Executive
SunTrust, BB&T, BofA, Regional Commercial Team Manager
29
Mark Lewis
Salisbury City Executive
Wachovia, CCB (SunTrust), Commercial Loan Manager
25
John Bencini
High Point City Executive
High Point Bank, Commercial Banking Manager
19
Rob Ellenburg
Mooresville City Executive
First Charter, SouthTrust, City Executive Lake Norman Region
11
Randy Carda
High Point Commercial Banker
First Citizens, BB&T, Credit Policy Officer, Market Executive
21
Bill McMurray
Lexington Region Executive
First Union, Market President, Commercial Banking Mgr
38
Brent Bridges
Triad Region Commercial Bkg
Wachovia, BofA, City Executive, Commercial Banking Mgr
30
Jim Bowman
Triad Commercial Real Estate
Centura, 1st Home Federal, Manager, A&D and Construction
36 |
 Core Deposit Growth Initiatives
22
•
Retail Banking
•
In early 2009, hired seasoned Retail Banking Manager from Wachovia
•
Creating consistency in delivery, service, products, and sales throughout
the retail footprint
•
Creating greater levels of accountability and rewards for
performance •
Treasury Services
•
In mid 2008, hired seasoned Treasury Services Professional from
Wachovia •
Previous clients included major US municipalities
•
Hired four calling officers with Treasury experience to market this
platform •
Additionally, Beach First has a strong treasury group which has been very
successful in the property management and HOA sectors in market
•
Private Banking
•
In second quarter of 2009, hired seasoned premiere banking manager from
Bank of America
•
Recruiting premier and private bankers for the affluent markets of
Greensboro, Concord, and Lake Norman areas
•
Goals per Banker: $60 million in core deposits, $40 million in executive
loans, $50 million in investment product referrals
|
 Leverage Transaction Highlights
23
•
Bought Government Agency MBS at attractive yields and at prices between 98
and 102
•
Purchased municipal securities with strong underlying ratings and AAA
insurance •
Assured Guaranty and Texas School District Fund as primary insurers
•
Funded overnight initially, which acted as a hedge to our Prime based loan
portfolio
•
Lead bank in structuring a funding transaction that allowed BNC to lock in
five year UNSECURED funding at an effective cost of 2.95%
•
Earnings have helped cover cost of CPP dividends, provision and continuing
efforts to build infrastructure with exceptional talent
•
Unsecured funding allowed BNC to pay off $300 million in FHLB borrowings,
thus reducing the FHLB stock requirement by $10 million
•
Increased on-balance sheet liquidity from 9% to 30% during a time when
liquidity is a priority for safety and soundness
|
 24
Quality
Competence
Discipline |
 FDIC Assisted Transaction Timeline
25
August 2009
–
Met with Banks Street Partners, LLC (BSP) to discuss assisted transaction
opportunities September 2009
–
BSP and management presents to BNC Board of Directors modeling on
specific potential transactions; BSP engaged as financial
advisor October 2009
–
Company
engages Womble
Carlyle in Atlanta as special legal counsel; face-to-face
discussions held with state and federal regulators
October 2009-January 2010
–
Company explores offensive capital opportunities
November
2009-
DD&F Consulting engaged to begin assisting Functional Leaders with
strategic plans for takeover weekend and post FDIC deal
integration January 2010 to March 2010
–
BNC management meets with various winners of previous FDIC
transactions to better understand the bid preparation methodology and the
necessary infrastructure build to meet loss share and workout
requirements. February 2010
–
Bank of North Carolina’s regulatory exam is completed
March 2010
–
Management and BSP evaluate Beach First National Bank assisted
transaction and decide to pursue first bid
Final Month
•Team of 12 employees conduct
week-long onsite due diligence at Beach First National Bank
headquarters
•Management evaluates pro forma balance
sheet and arrives at final bid
•Transaction completed
|
 Strategic Rationale For Beach First Deal
•
Earn our way through the credit cycle
•
Immediately accretive to earnings per share and tangible book value per
share •
Opportunity to enhance core earnings
•
Improves funding mix. Strong core deposit growth opportunities
•
Protect our balance sheet
•
Loss-share agreement protects Bank of North Carolina on acquired
loans •
Higher pro forma capital levels at both the bank and holding company
•
Strong balance sheet liquidity
•
Prepare for the future
•
Expands Bank of North Carolina’s presence into South Carolina
•
Presents opportunity to grow core deposit franchise
•
Future opportunities for growth due to continued market disruption
26 |
 On the Offensive
27
•
Beach First transaction is evidence of BNC’s plan to be an
opportunistic and disciplined consolidator in the banking
industry •
Managements sees multiple attractive opportunities in our current and
contiguous markets
•
Envision building a larger franchise through a combination of strong
organic growth and opportunistic transactions which can provide
meaningful franchise value
•
BNC acknowledges that offensive capital may be required from time to time
to fund certain of these opportunities. Management has
resisted raising excessive offensive capital at depressed valuation
metrics over the past eighteen months. •
Contingent capital for specific transactions provides a win-win for
existing and new shareholders
•
Will consider non-contingent capital raises that can be supported by
known organic growth opportunities |
 The Place to
Be, for All the Right Reasons No Customer, Employee, Director, or Financial
Representation is worth compromising the Integrity
of our Organization. The Integrity of BNC is its most
cherished Asset. |