Attached files
| file | filename |
|---|---|
| 8-K - FORM 8-K - HOME BANCSHARES INC | d72642e8vk.htm |
Exhibit 99.1

| NASDAQ: HOMB www.homebancshares.com |
| Forward Looking Statements This presentation contains forward-looking statements that relate to expectations, beliefs, projections, future plans and strategies, anticipated events or trends and similar expressions concerning matters that are not historical facts. The forward-looking statements contained herein reflect our current views about future events and financial performance and are subject to risks, uncertainties, assumptions and changes in circumstances that may cause our actual results to differ significantly from historical results and those expressed in any forward-looking statement. Some factors that could cause actual results to differ materially from historical or expected results include: factors listed in the Company's 10-K as filed with the Securities and Exchange Commission; changes in general economic conditions, either nationally or locally in the areas in which we conduct or will conduct our business; inflation, interest rate, market and monetary fluctuations; increases in competitive pressures among financial institutions and businesses offering similar products and services; higher defaults on our loan portfolio than we expect; changes in management's estimate of the adequacy of the allowance for loan losses; legislative or regulatory changes or changes in accounting principles, policies or guidelines; management's estimates and projections of interest rates and interest rate policy; the execution of our business plan; and other factors affecting the financial services industry generally or the banking industry in particular. We do not intend and disclaim any duty or obligation to update or revise any industry information or forward-looking statements set forth in this presentation to reflect new information, future events or otherwise. |
| Where is Arkansas? |
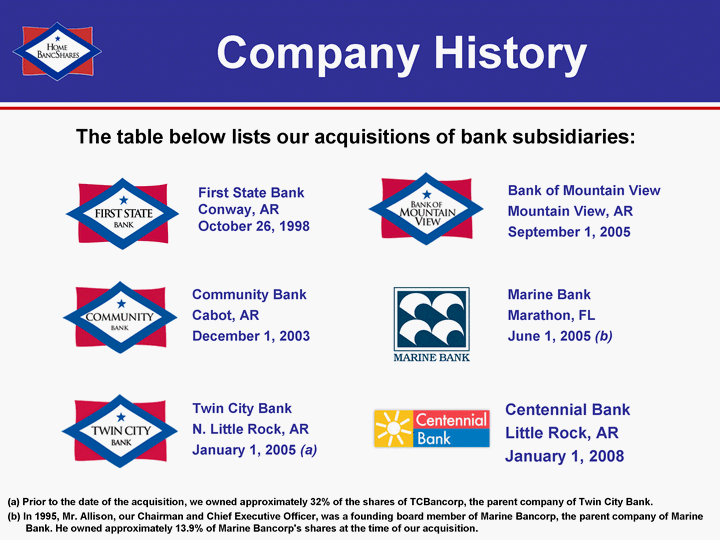
| Company History The table below lists our acquisitions of bank subsidiaries: (a) Prior to the date of the acquisition, we owned approximately 32% of the shares of TCBancorp, the parent company of Twin City Bank. (b) In 1995, Mr. Allison, our Chairman and Chief Executive Officer, was a founding board member of Marine Bancorp, the parent company of Marine Bank. He owned approximately 13.9% of Marine Bancorp's shares at the time of our acquisition. Twin City Bank N. Little Rock, AR January 1, 2005 (a) Community Bank Cabot, AR December 1, 2003 Bank of Mountain View Mountain View, AR September 1, 2005 Marine Bank Marathon, FL June 1, 2005 (b) Centennial Bank Little Rock, AR January 1, 2008 First State Bank Conway, AR October 26, 1998 |
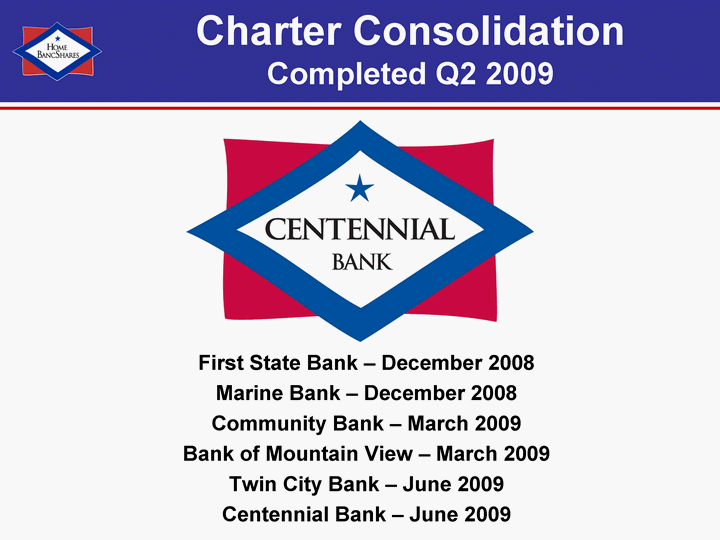
| Charter Consolidation Completed Q2 2009 First State Bank - December 2008 Marine Bank - December 2008 Community Bank - March 2009 Bank of Mountain View - March 2009 Twin City Bank - June 2009 Centennial Bank - June 2009 |
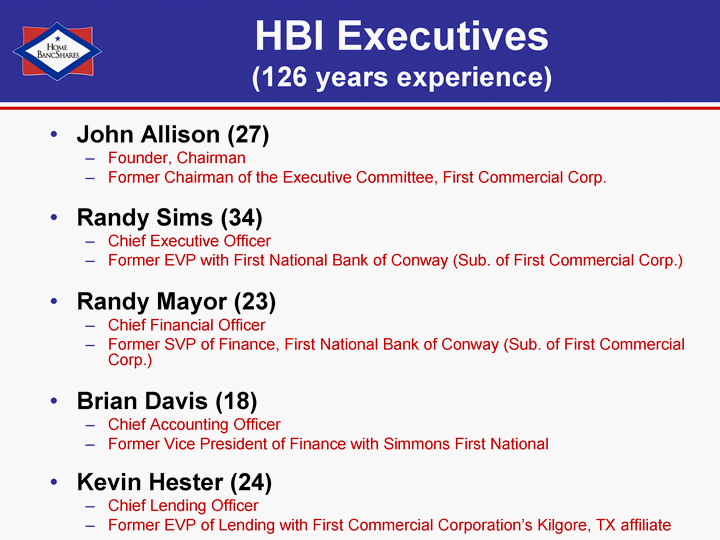
| HBI Executives (126 years experience) John Allison (27) Founder, Chairman Former Chairman of the Executive Committee, First Commercial Corp. Randy Sims (34) Chief Executive Officer Former EVP with First National Bank of Conway (Sub. of First Commercial Corp.) Randy Mayor (23) Chief Financial Officer Former SVP of Finance, First National Bank of Conway (Sub. of First Commercial Corp.) Brian Davis (18) Chief Accounting Officer Former Vice President of Finance with Simmons First National Kevin Hester (24) Chief Lending Officer Former EVP of Lending with First Commercial Corporation's Kilgore, TX affiliate |
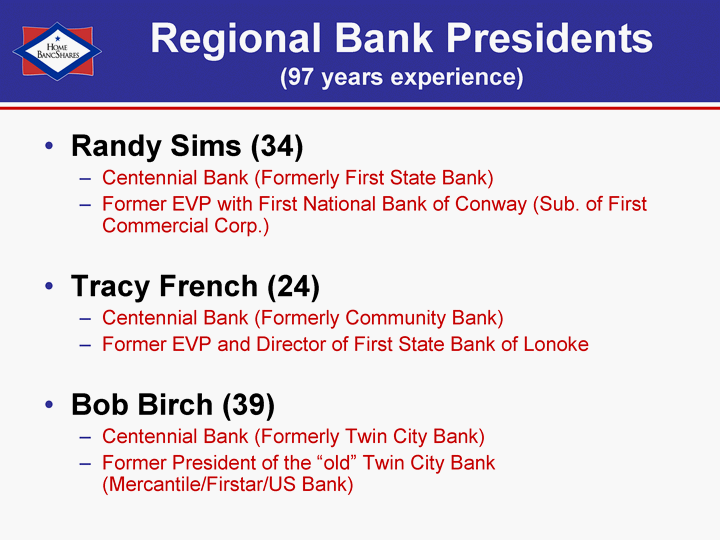
| Regional Bank Presidents (97 years experience) Randy Sims (34) Centennial Bank (Formerly First State Bank) Former EVP with First National Bank of Conway (Sub. of First Commercial Corp.) Tracy French (24) Centennial Bank (Formerly Community Bank) Former EVP and Director of First State Bank of Lonoke Bob Birch (39) Centennial Bank (Formerly Twin City Bank) Former President of the "old" Twin City Bank (Mercantile/Firstar/US Bank) |

| Community Presidents David A. Druey Conway Market Teresa J. Condas Florida Market Justin S. Lawson Searcy Market Bradley J. Shipman Mountain View Market Davy Carter Cabot Market William "Don" Rodgers Heber Springs Market Mike H. Trammel Fordyce/Rison Market Clifford "Donnie" Farmer Jacksonville Market David M. Straessle Private Client Group |
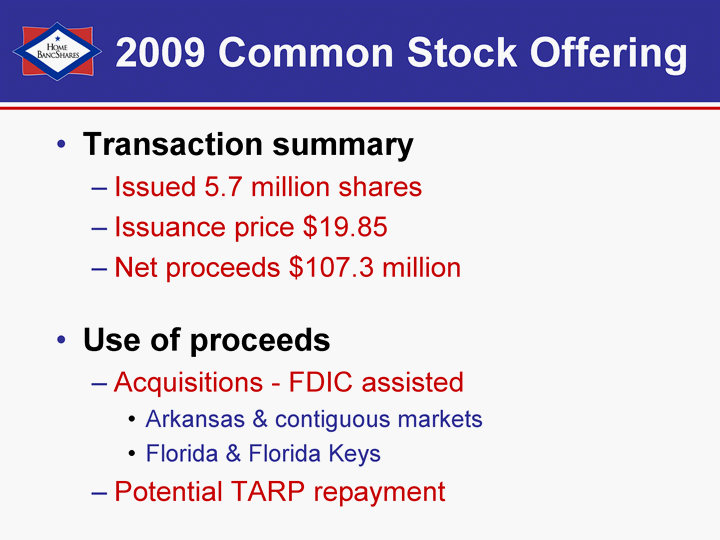
| 2009 Common Stock Offering Transaction summary Issued 5.7 million shares Issuance price $19.85 Net proceeds $107.3 million Use of proceeds Acquisitions - FDIC assisted Arkansas & contiguous markets Florida & Florida Keys Potential TARP repayment |
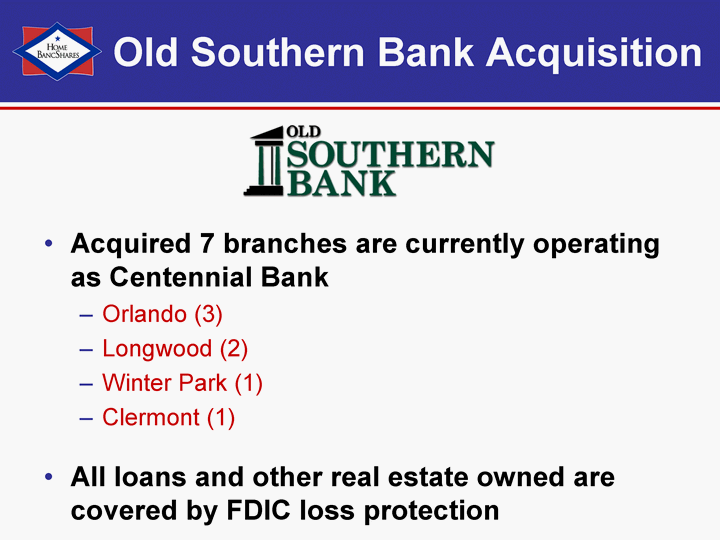
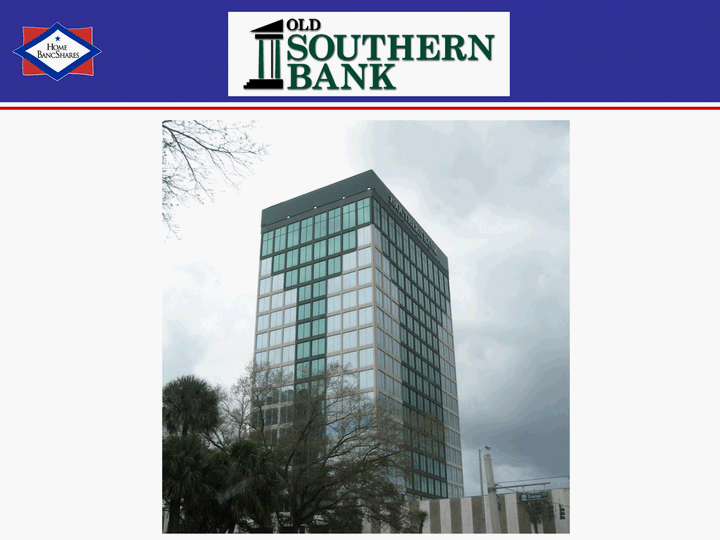
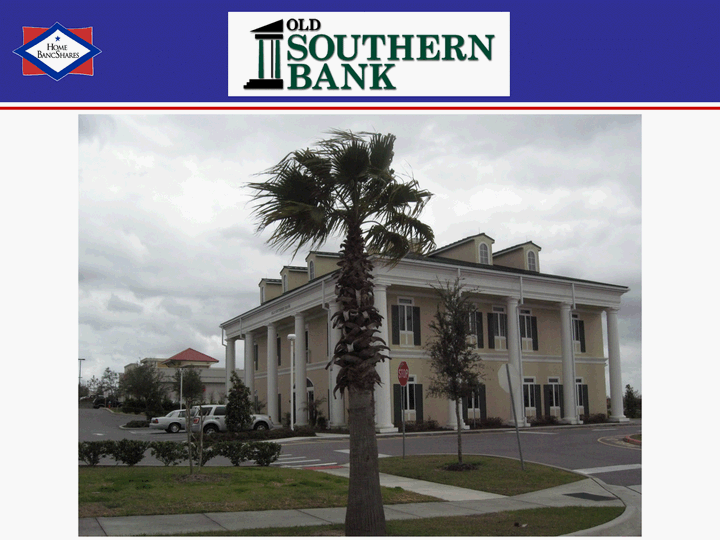
| Old Southern Bank Acquisition Acquired 7 branches are currently operating as Centennial Bank Orlando (3) Longwood (2) Winter Park (1) Clermont (1) All loans and other real estate owned are covered by FDIC loss protection |
| OSB Acquisition: Transaction Overview Assets of $335.4 million excluding purchase adjustments Loans of $179.1 million after loan discounts of $94.1 million Deposits of $328.5 million $9.7 million pre-tax gain on acquisition March 12, 2010 |

| OSB Acquisition: Strategic Opportunity Branch expansion into Lake, Orange & Seminole counties Deposit market growth potential 16% greater than the 5- year national average Household income growth potential 10% greater than the 5- year national average Loan market growth potential 36% greater than the 5-year national average Moderately accretive to net income and earnings per share Slightly accretive to book value and tangible book value Leveraged a portion of our excess capital |
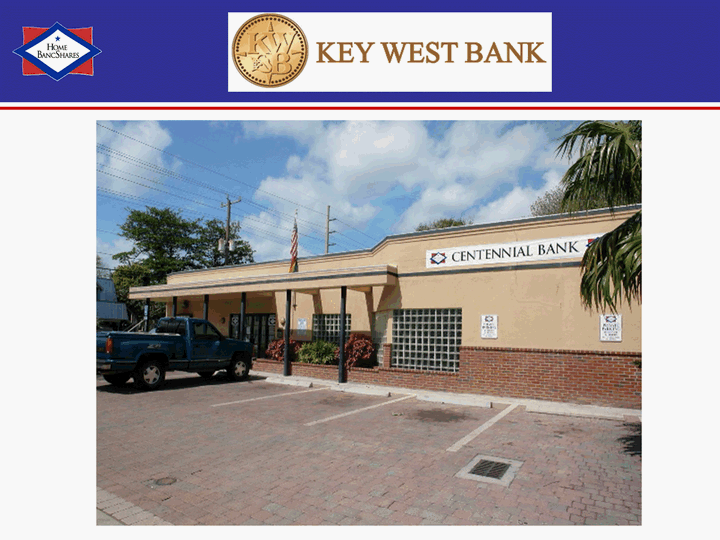
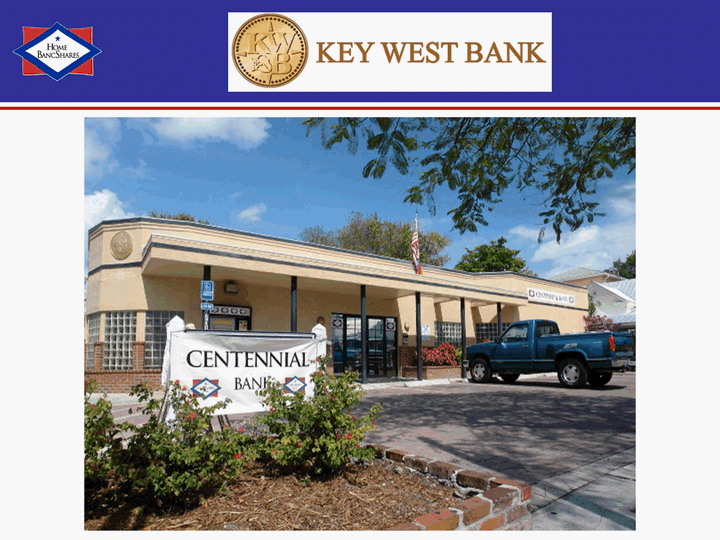
| Key West Bank Acquisition Key West Bank represents our second successful FDIC-assisted acquisition within two weeks All loans and other real estate owned are covered by FDIC loss protection Acquired one full service branch currently operating as Centennial Bank KEY WEST BANK |
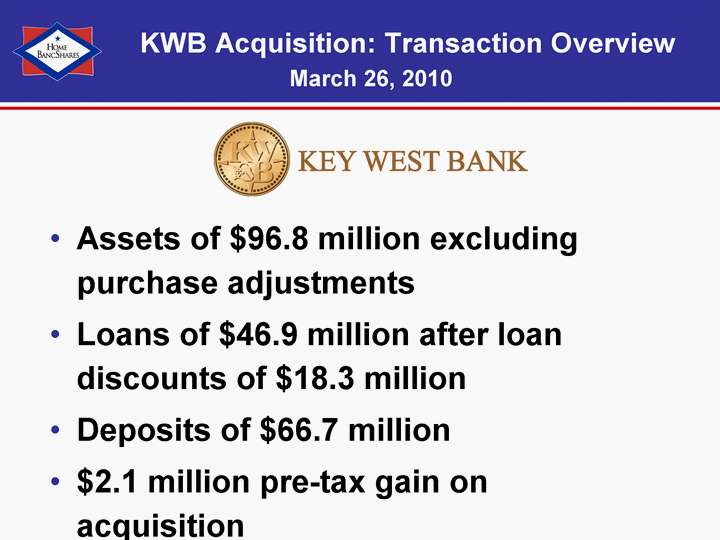
| KWB Acquisition: Transaction Overview Assets of $96.8 million excluding purchase adjustments Loans of $46.9 million after loan discounts of $18.3 million Deposits of $66.7 million $2.1 million pre-tax gain on acquisition KEY WEST BANK March 26, 2010 |

| KWB Acquisition: Strategic Opportunity Expand our current market share in Key West Slightly accretive for its size to the following: Net income Earnings per share Book value Tangible book value Leverage our present infrastructure in Key West Leverage a small percentage of our excess capital KEY WEST BANK |

| 1st Quarter 2010 $ 3.1 Billion Holding Company |
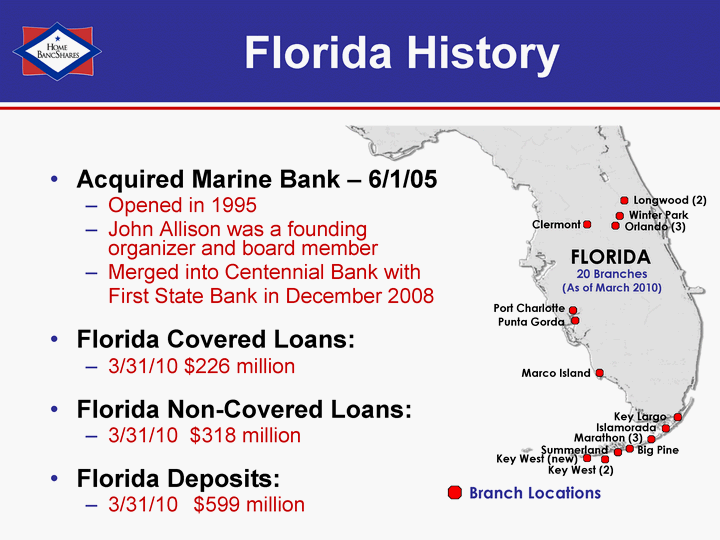
| Florida History Acquired Marine Bank - 6/1/05 Opened in 1995 John Allison was a founding organizer and board member Merged into Centennial Bank with First State Bank in December 2008 Florida Covered Loans: 3/31/10 $226 million Florida Non-Covered Loans: 3/31/10 $318 million Florida Deposits: 3/31/10 $599 million Branch Locations FLORIDA Port Charlotte Punta Gorda Marco Island Key Largo Islamorada Marathon (3) Big Pine Key West (2) Summerland 20 Branches (As of March 2010) Orlando (3) Winter Park Longwood (2) Clermont Key West (new) |
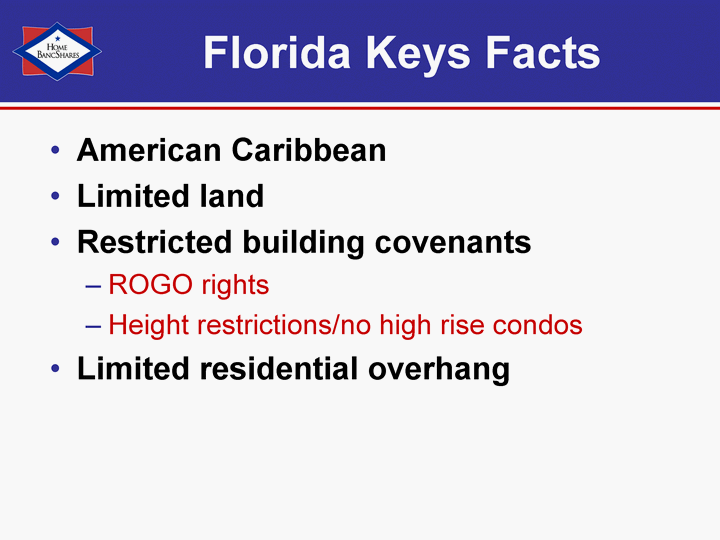
| Florida Keys Facts American Caribbean Limited land Restricted building covenants ROGO rights Height restrictions/no high rise condos Limited residential overhang |
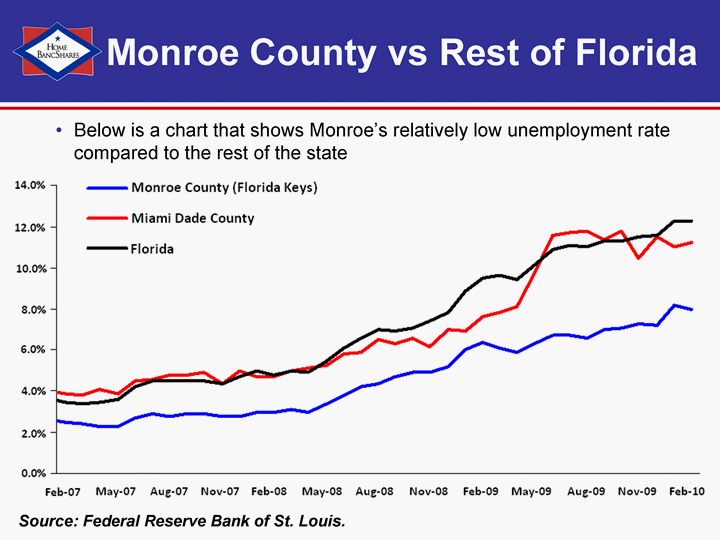
| Monroe County vs Rest of Florida Below is a chart that shows Monroe's relatively low unemployment rate compared to the rest of the state Source: Federal Reserve Bank of St. Louis. |

| Holding Company Profile ARKANSAS Mountain View (2) Searcy (3) Beebe (2) Ward Cabot (5) Jacksonville (3) Sherwood (2) Greenbrier Vilonia Conway (7) Mayflower Maumelle North Little Rock (5) Little Rock (9) 49 Branches (As of 3/31/10) Bryant Quitman Morrilto n Fordyce Riso n Heber Springs $3.1 billion bank holding company (3/31/10) Headquartered in Conway, AR Founded in 1998 Community bank philosophy Local boards Local lending authority Markets in Arkansas and Florida 49 branches in Arkansas 20 branches in Florida History of successful acquisitions Significant insider ownership Present ownership of 23.8% (1/31/10) Headquarters Branch Locations FLORIDA Port Charlotte Punta Gorda Marco Island Key Largo Islamorada Marathon (3) Big Pine Key West (3) Summerland 20 Branches (As of 3/31/10) Orlando (3) Winter Park Longwood (2) Clermont |

| Insider Ownership Name Title Beneficial Shares Owned as of 1/31/10 Beneficial Ownership % John Allison Chairman 2,768,748 10.7% Robert "Bunny" Adcock Vice Chairman 708,722 2.8% Richard Ashley Board Member 1,185,016 4.6% Alex Lieblong Board Member 551,282 2.1% Other Board Members 809,862 3.1% Other Management 214,941 0.8% Total 6,238,571 23.8% |
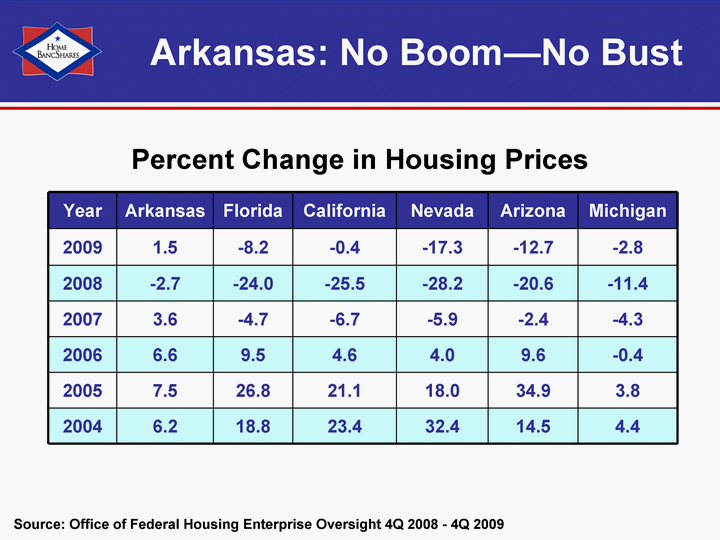
| Arkansas: No Boom-No Bust Year Arkansas Florida California Nevada Arizona Michigan 2009 1.5 -8.2 -0.4 -17.3 -12.7 -2.8 2008 -2.7 -24.0 -25.5 -28.2 -20.6 -11.4 2007 3.6 -4.7 -6.7 -5.9 -2.4 -4.3 2006 6.6 9.5 4.6 4.0 9.6 -0.4 2005 7.5 26.8 21.1 18.0 34.9 3.8 2004 6.2 18.8 23.4 32.4 14.5 4.4 Percent Change in Housing Prices Source: Office of Federal Housing Enterprise Oversight 4Q 2008 - 4Q 2009 |

| Fayetteville Shale Map Home BancShares, Inc., Arkansas Locations Mountain View Searcy Beebe Ward Cabot Jacksonville Sherwood Greenbrier Vilonia Conway Mayflower Maumelle Little Rock Bryant Quitman Rison Fordyce North Little Rock Morrilton Heber Springs |
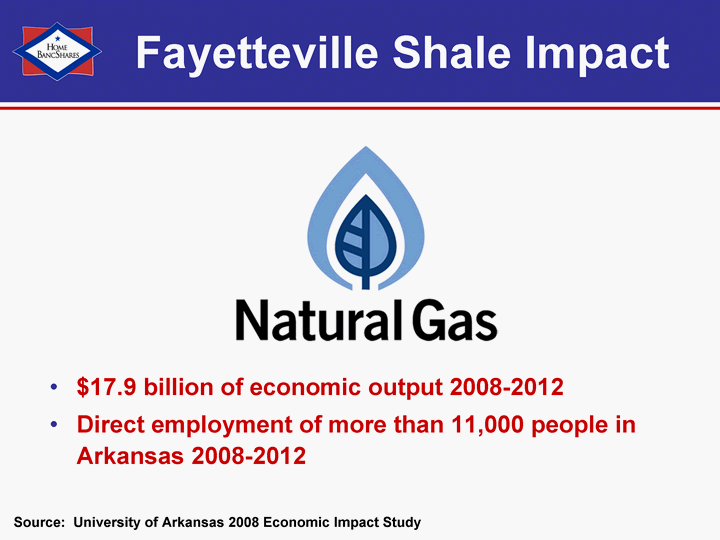
| Fayetteville Shale Impact $17.9 billion of economic output 2008-2012 Direct employment of more than 11,000 people in Arkansas 2008-2012 Source: University of Arkansas 2008 Economic Impact Study |
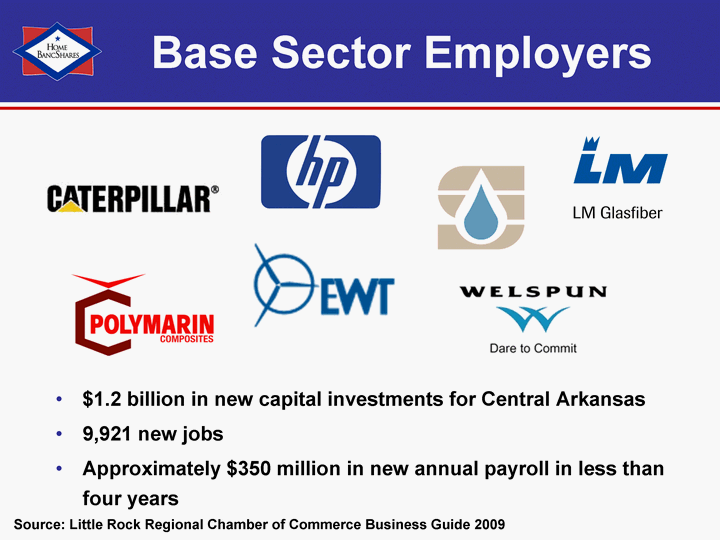
| Base Sector Employers $1.2 billion in new capital investments for Central Arkansas 9,921 new jobs Approximately $350 million in new annual payroll in less than four years Source: Little Rock Regional Chamber of Commerce Business Guide 2009 |
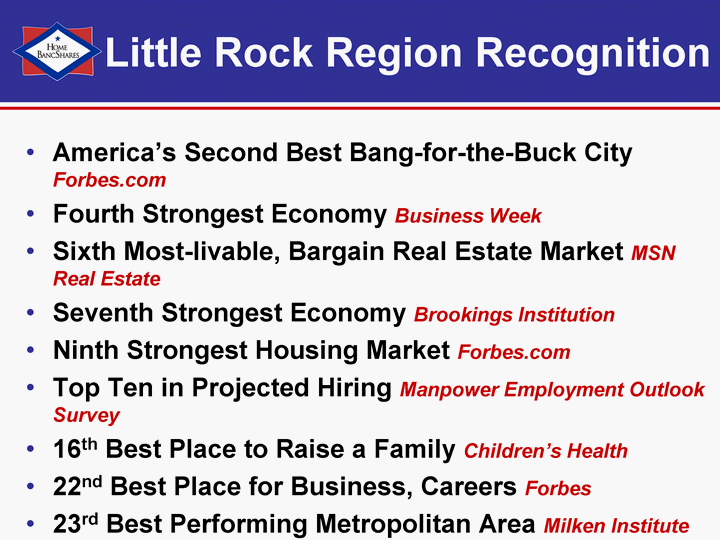
| Little Rock Region Recognition America's Second Best Bang-for-the-Buck City Forbes.com Fourth Strongest Economy Business Week Sixth Most-livable, Bargain Real Estate Market MSN Real Estate Seventh Strongest Economy Brookings Institution Ninth Strongest Housing Market Forbes.com Top Ten in Projected Hiring Manpower Employment Outlook Survey 16th Best Place to Raise a Family Children's Health 22nd Best Place for Business, Careers Forbes 23rd Best Performing Metropolitan Area Milken Institute |
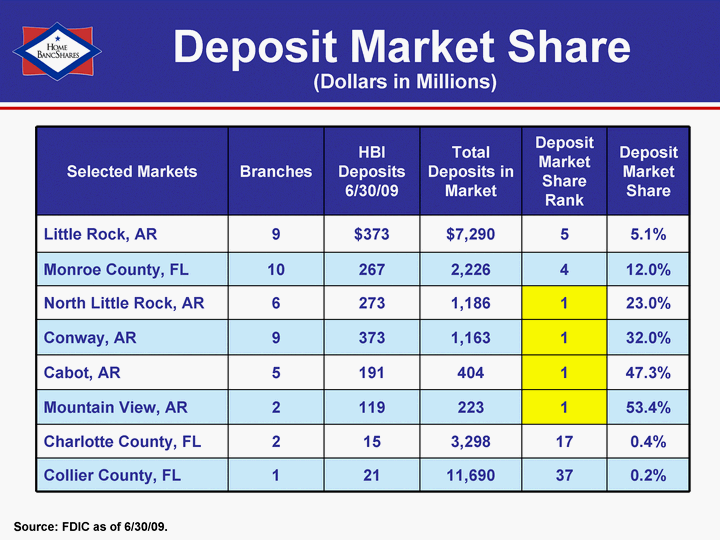
| Deposit Market Share Selected Markets Branches HBI Deposits 6/30/09 Total Deposits in Market Deposit Market Share Rank Deposit Market Share Little Rock, AR 9 $373 $7,290 5 5.1% Monroe County, FL 10 267 2,226 4 12.0% North Little Rock, AR 6 273 1,186 1 23.0% Conway, AR 9 373 1,163 1 32.0% Cabot, AR 5 191 404 1 47.3% Mountain View, AR 2 119 223 1 53.4% Charlotte County, FL 2 15 3,298 17 0.4% Collier County, FL 1 21 11,690 37 0.2% (Dollars in Millions) Source: FDIC as of 6/30/09. |
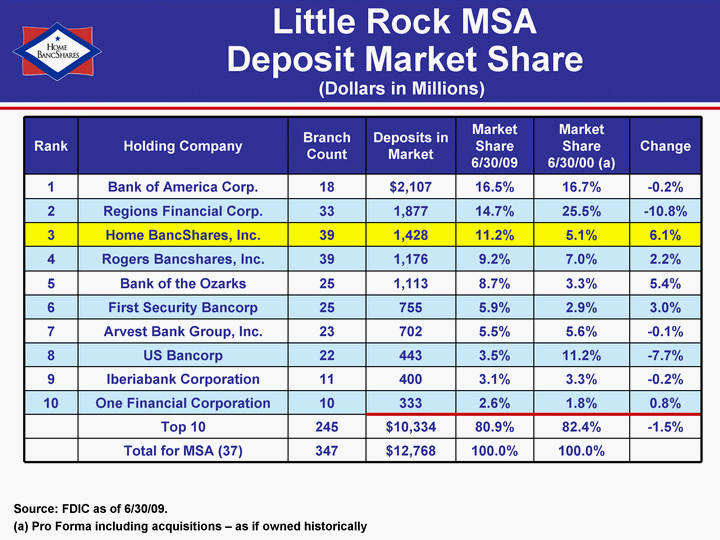
| Little Rock MSA Deposit Market Share Rank Holding Company Branch Count Deposits in Market Market Share 6/30/09 Market Share 6/30/00 (a) Change 1 Bank of America Corp. 18 $2,107 16.5% 16.7% -0.2% 2 Regions Financial Corp. 33 1,877 14.7% 25.5% -10.8% 3 Home BancShares, Inc. 39 1,428 11.2% 5.1% 6.1% 4 Rogers Bancshares, Inc. 39 1,176 9.2% 7.0% 2.2% 5 Bank of the Ozarks 25 1,113 8.7% 3.3% 5.4% 6 First Security Bancorp 25 755 5.9% 2.9% 3.0% 7 Arvest Bank Group, Inc. 23 702 5.5% 5.6% -0.1% 8 US Bancorp 22 443 3.5% 11.2% -7.7% 9 Iberiabank Corporation 11 400 3.1% 3.3% -0.2% 10 One Financial Corporation 10 333 2.6% 1.8% 0.8% Top 10 245 $10,334 80.9% 82.4% -1.5% Total for MSA (37) 347 $12,768 100.0% 100.0% (Dollars in Millions) Source: FDIC as of 6/30/09. (a) Pro Forma including acquisitions - as if owned historically |
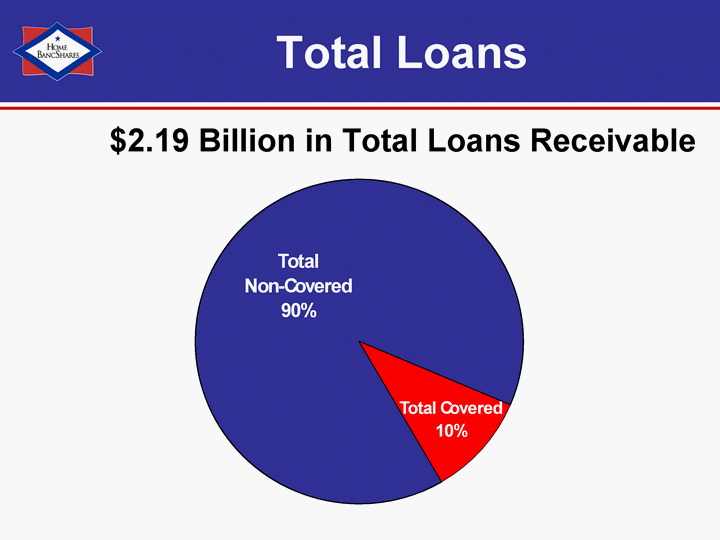
| Total Loans Total Non-Covered Total Covered Hotel/Motel Office Building Warehouse Commercial Construction Church Property Real Estate Agricultural Other Loans by Class by Collateral 1959666 225885 109 97 89 69 49 16 85 $2.19 Billion in Total Loans Receivable |

| Loans Not Covered by Loss Share Loan Type Florida $ Amount (in millions) Total $ Amount (in millions) % of Total Loans Commercial RE (Non-farm/non-residential & agri.) $ 155 $ 853 44% Construction/Land Development 43 364 18% Residential Real Estate 97 445 23% Commercial & Industrial (a) 11 232 11% Consumer 6 33 2% Other 6 33 2% Total $ 318 $ 1,960 100% (a) Includes Agricultural. Loans receivable not covered by loss share of $1.96 billion 85% of our non-covered loans are secured by real estate (Dollars in Millions, As of March 31, 2010) |

| Single Purpose Bldg Retail Space Hotel/Motel Office Building Warehouse Commercial Construction Church Property Real Estate Agricultural Other Loans by Class by Collateral 178 117 109 97 89 69 49 16 85 Commercial Real Estate Not Covered by Loss Share (Non-farm/non-residential & agricultural) $853 million portfolio |
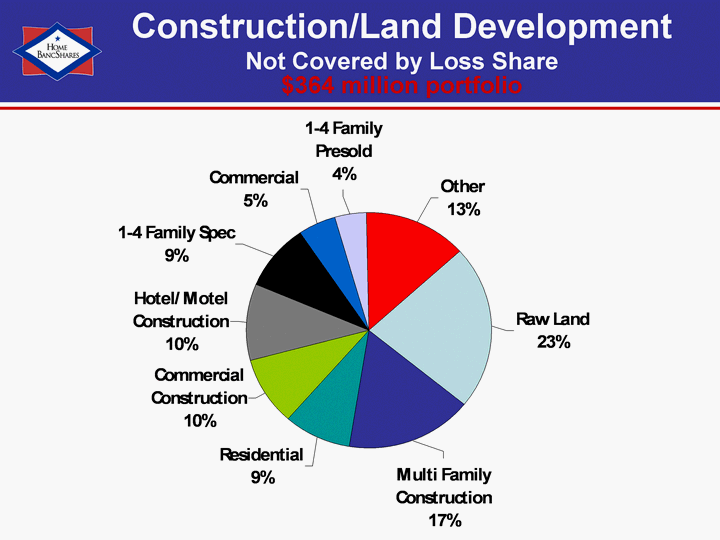
| Construction/Land Development Not Covered by Loss Share Raw Land Multi Family Construction Residential Commercial Construction Hotel/Motel Construction 1-4 Family Spec Commercial 1-4 Family Presold Other Loans by Class by Collateral 82 60 32 35 38 33 18 16 49 $364 million portfolio |
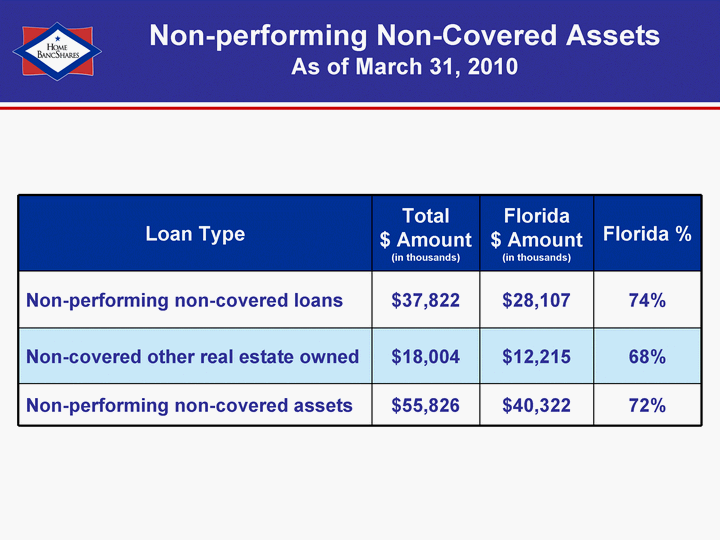
| Non-performing Non-Covered Assets As of March 31, 2010 Loan Type Total $ Amount (in thousands) Florida $ Amount (in thousands) Florida % Non-performing non-covered loans $37,822 $28,107 74% Non-covered other real estate owned $18,004 $12,215 68% Non-performing non-covered assets $55,826 $40,322 72% |
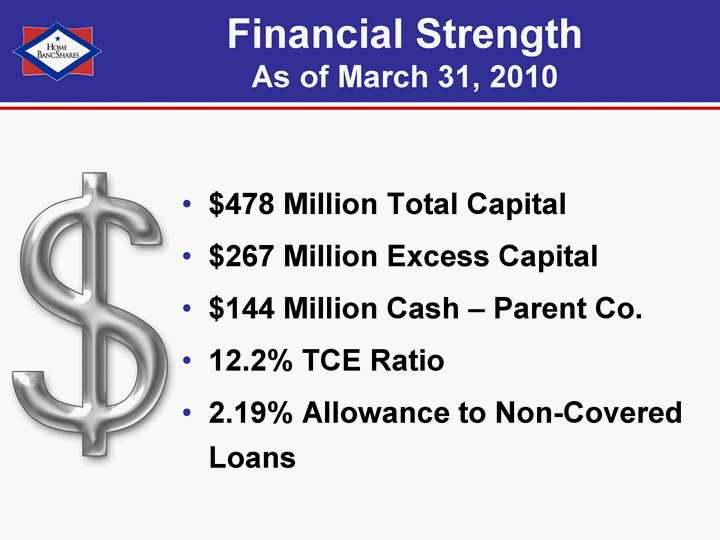
| Financial Strength As of March 31, 2010 $478 Million Total Capital $267 Million Excess Capital $144 Million Cash - Parent Co. 12.2% TCE Ratio 2.19% Allowance to Non-Covered Loans |
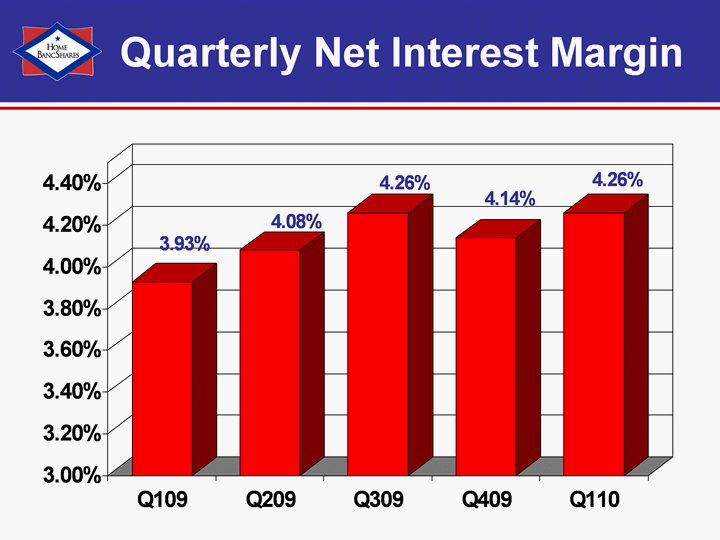
| Quarterly Net Interest Margin Q305 Q405 Q106 Q206 Q306 Q406 Q107 Q207 Q307 Q407 Q108 Q208 Q308 Q408 Q109 Q209 Q309 Q409 Q110 Book Value 0.0338 0.0348 0.0353 0.0352 0.0357 0.0342 0.0342 0.0351 0.0355 0.0361 0.0378 0.0389 0.0382 0.0378 0.0393 0.0408 0.0426 0.0414 0.0426 |
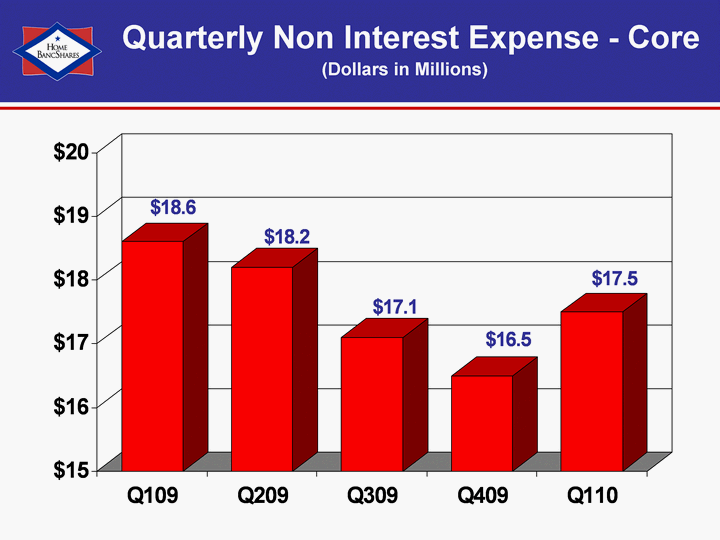
| Quarterly Non Interest Expense - Core Q305 Q405 Q106 Q206 Q306 Q406 Q107 Q207 Q307 Q407 Q108 Q208 Q308 Q408 Q109 Q209 Q309 Q409 Q110 Book Value 0.0338 0.0348 0.0353 0.0352 0.0357 0.0342 0.0342 0.0351 0.0355 0.0361 0.0378 0.0389 18.5 18.3 18.6 18.2 17.1 16.5 17.5 (Dollars in Millions) |
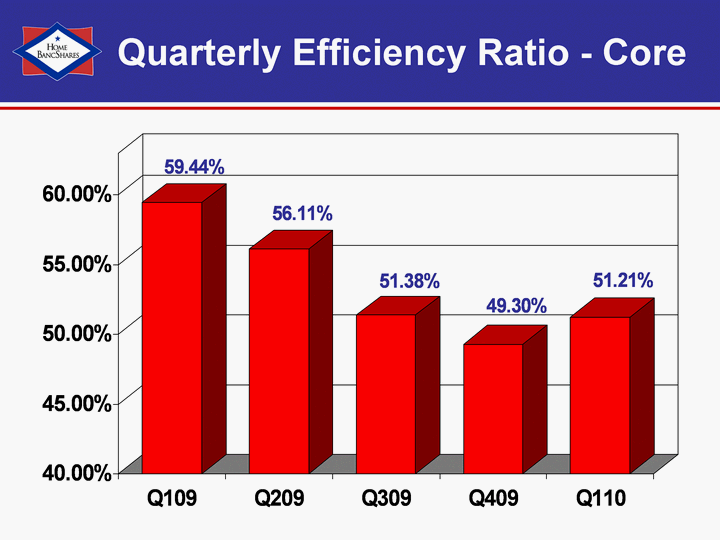
| Quarterly Efficiency Ratio - Core Q305 Q405 Q106 Q206 Q306 Q406 Q107 Q207 Q307 Q407 Q108 Q208 Q308 Q408 Q109 Q209 Q309 Q409 Q110 Efficiency 0.639 0.6346 0.6668 0.6674 0.6372 0.631 0.6252 0.6295 0.6247 0.6054 0.631 0.59 0.5925 0.5933 0.5944 0.5611 0.5138 0.493 0.5121 |

| Loans (Dollars in Millions) '99 '00 '01 '02 '03 '04 '05 '06 '07 '08 '09 Q1 Loans 122000 171000 236000 285000 500000 517000 1205000 1416000 1607000 1956000 1950285 2185551 '10 |

| Deposits (Dollars in Millions) '99 '00 '01 '02 '03 '04 '05 '06 '07 '08 '09 Q1 Deposits 130000 190000 237000 279000 572000 553000 1427000 1607000 1592000 1848000 1835423 2221088 '10 |
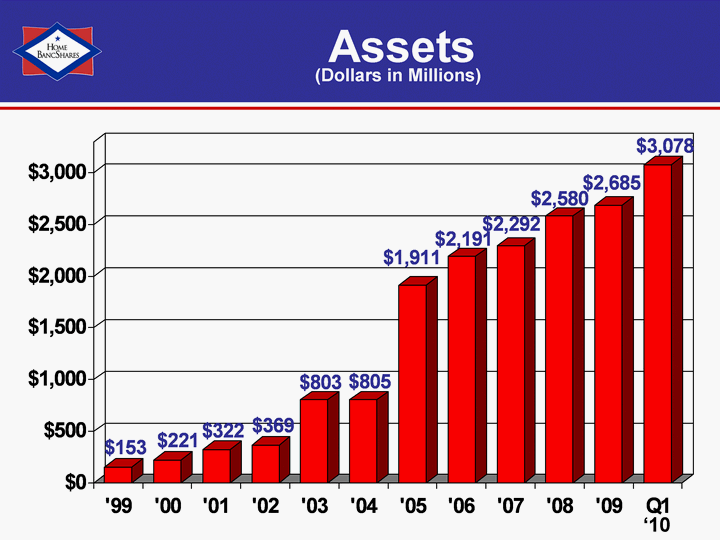
| Assets (Dollars in Millions) '99 '00 '01 '02 '03 '04 '05 '06 '07 '08 '09 Q1 Assets 153000 221000 322000 369000 803000 805000 1911000 2191000 2292000 2580000 2684865 3078199 '10 |

| Capital (Dollars in Millions) '99 '00 '01 '02 '03 '04 '05 '06 '07 '08 '09 Q1 Loans 22345 23118 35997 46753 99472 106610 165857 231419 253056 283044 464973 478338 '10 |
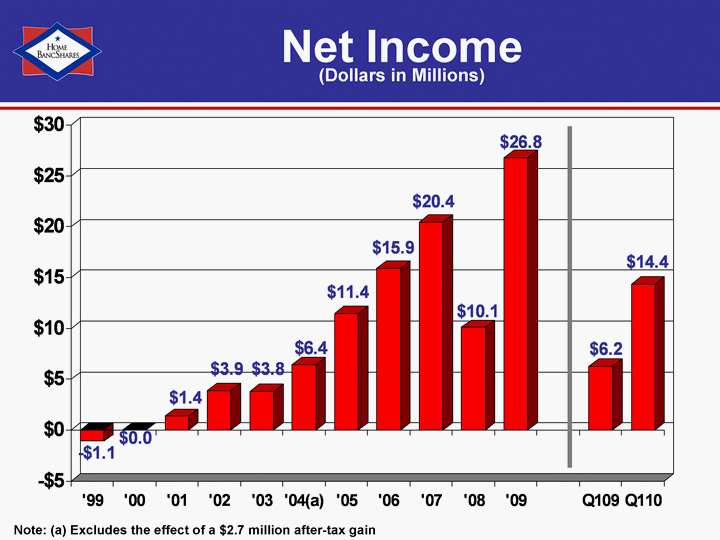
| Net Income '99 '00 '01 '02 '03 '04(a) '05 '06 '07 '08 '09 Q109 Q110 Loans -1113000 -35000 1356000 3877000 3769000 6424000 11446000 15918000 20445000 10116000 26806000 6245000 14374000 Note: (a) Excludes the effect of a $2.7 million after-tax gain (Dollars in Millions) |
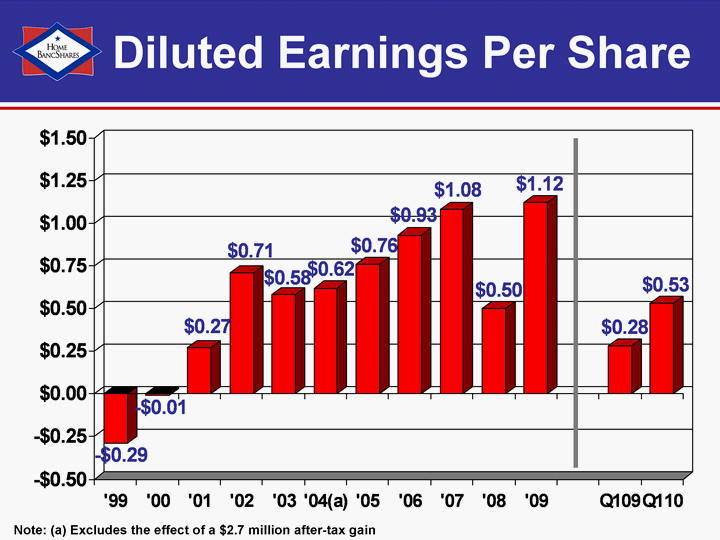
| Diluted Earnings Per Share '99 '00 '01 '02 '03 '04(a) '05 '06 '07 '08 '09 Q109 Q110 DEPS -0.29 -0.01 0.27 0.71 0.58 0.62 0.76 0.93 1.08 0.5 1.12 0.28 0.53 Note: (a) Excludes the effect of a $2.7 million after-tax gain |
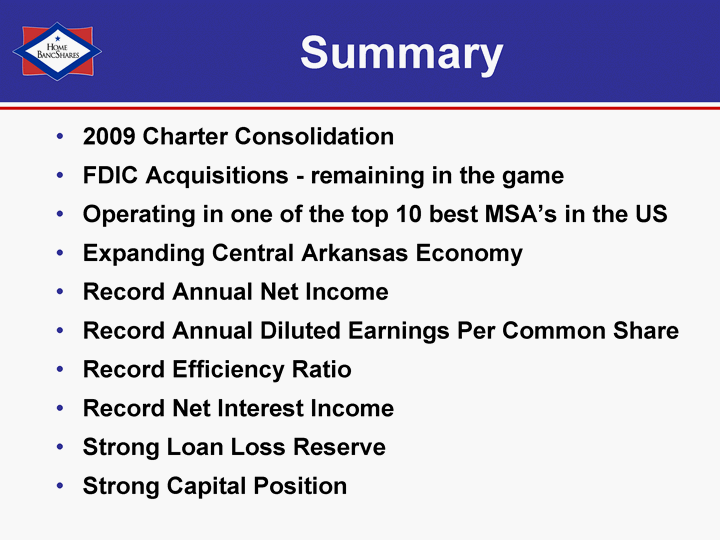
| Summary 2009 Charter Consolidation FDIC Acquisitions - remaining in the game Operating in one of the top 10 best MSA's in the US Expanding Central Arkansas Economy Record Annual Net Income Record Annual Diluted Earnings Per Common Share Record Efficiency Ratio Record Net Interest Income Strong Loan Loss Reserve Strong Capital Position |

| NASDAQ: HOMB www.homebancshares.com |
