Attached files
| file | filename |
|---|---|
| 8-K - 8-K - CBRE GROUP, INC. | a10-8785_18k.htm |
| EX-99.1 - EX-99.1 - CBRE GROUP, INC. | a10-8785_1ex99d1.htm |
Exhibit 99.2
|
|
CB Richard Ellis Group, Inc. First Quarter 2010 Earnings Conference Call April 29, 2010 |

|
|
Forward Looking Statements This presentation contains statements that are forward looking within the meaning of the Private Securities Litigation Reform Act of 1995, including statements regarding our future growth momentum, operations and financial performance. These statements should be considered as estimates only and actual results may ultimately differ from these estimates. Except to the extent required by applicable securities laws, we undertake no obligation to update or publicly revise any of the forward-looking statements that you may hear today. Please refer to our current annual report on Form 10-K, in particular any discussion of risk factors or forward-looking statements, which is filed with the SEC and available at the SEC’s website (http://www.sec.gov), for a full discussion of the risks and other factors that may impact any estimates that you may hear today. We may make certain statements during the course of this presentation which include references to “non-GAAP financial measures,” as defined by SEC regulations. As required by these regulations, we have provided reconciliations of these measures to what we believe are the most directly comparable GAAP measures, which are attached hereto within the appendix. |
|
|
Conference Call Participants Brett White Chief Executive Officer Gil Borok Chief Financial Officer Nick Kormeluk Investor Relations |
|
|
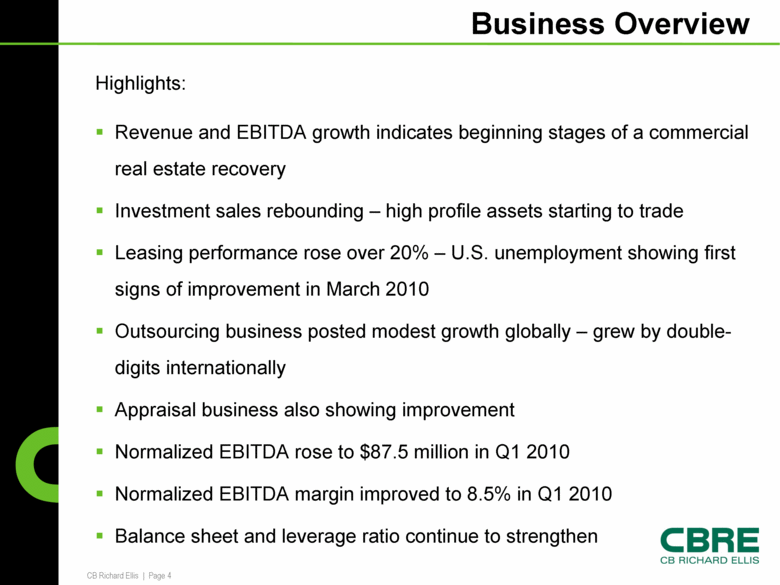
Business Overview Highlights: Revenue and EBITDA growth indicates beginning stages of a commercial real estate recovery Investment sales rebounding – high profile assets starting to trade Leasing performance rose over 20% – U.S. unemployment showing first signs of improvement in March 2010 Outsourcing business posted modest growth globally – grew by double-digits internationally Appraisal business also showing improvement Normalized EBITDA rose to $87.5 million in Q1 2010 Normalized EBITDA margin improved to 8.5% in Q1 2010 Balance sheet and leverage ratio continue to strengthen |
|
|
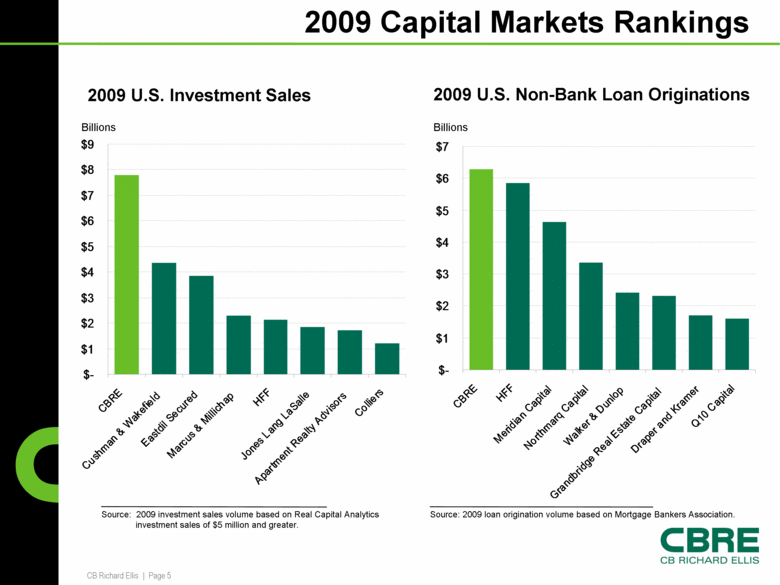
2009 Capital Markets Rankings Billions Billions 2009 U.S. Non-Bank Loan Originations 2009 U.S. Investment Sales Source: 2009 investment sales volume based on Real Capital Analytics investment sales of $5 million and greater. Source: 2009 loan origination volume based on Mortgage Bankers Association. $- $1 $2 $3 $4 $5 $6 $7 $8 $9 CBRE Cushman & Wakefield Eastdil Secured Marcus & Millichap HFF Jones Lang LaSalle Apartment Realty Advisors Colliers $- $1 $2 $3 $4 $5 $6 $7 CBRE HFF Meridian Capital Northmarq Capital Walker & Dunlop Grandbridge Real Estate Capital Draper and Kramer Q10 Capital |
|
|
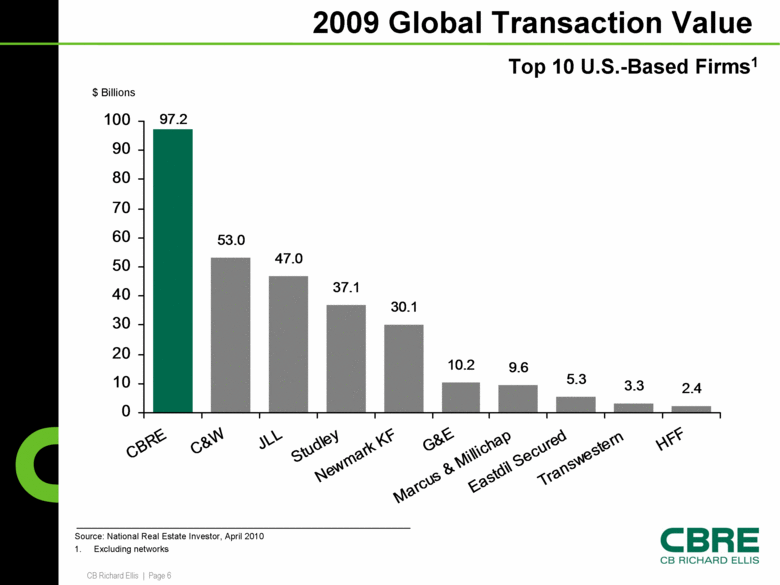
Top 10 U.S.-Based Firms1 2009 Global Transaction Value Source: National Real Estate Investor, April 2010 1. Excluding networks $ Billions 97.2 53.0 47.0 37.1 30.1 10.2 9.6 5.3 3.3 2.4 0 10 20 30 40 50 60 70 80 90 100 CBRE C&W JLL Studley Newmark KF G&E Marcus & Millichap Eastdil Secured Transwestern HFF |
|
|
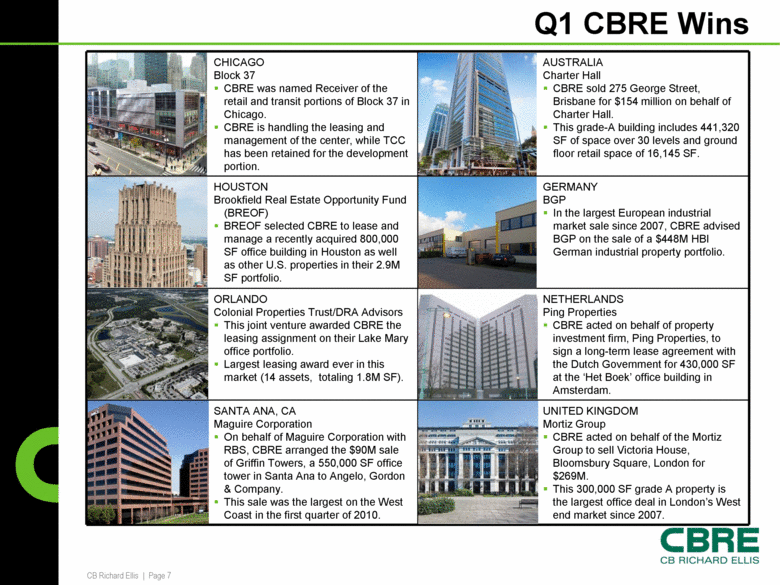
Q1 CBRE Wins CHICAGO Block 37 CBRE was named Receiver of the retail and transit portions of Block 37 in Chicago. CBRE is handling the leasing and management of the center, while TCC has been retained for the development portion. AUSTRALIA Charter Hall CBRE sold 275 George Street, Brisbane for $154 million on behalf of Charter Hall. This grade-A building includes 441,320 SF of space over 30 levels and ground floor retail space of 16,145 SF. HOUSTON Brookfield Real Estate Opportunity Fund (BREOF) BREOF selected CBRE to lease and manage a recently acquired 800,000 SF office building in Houston as well as other U.S. properties in their 2.9M SF portfolio. GERMANY BGP In the largest European industrial market sale since 2007, CBRE advised BGP on the sale of a $448M HBI German industrial property portfolio. ORLANDO Colonial Properties Trust/DRA Advisors This joint venture awarded CBRE the leasing assignment on their Lake Mary office portfolio. Largest leasing award ever in this market (14 assets, totaling 1.8M SF). NETHERLANDS Ping Properties CBRE acted on behalf of property investment firm, Ping Properties, to sign a long-term lease agreement with the Dutch Government for 430,000 SF at the ‘Het Boek’ office building in Amsterdam. SANTA ANA, CA Maguire Corporation On behalf of Maguire Corporation with RBS, CBRE arranged the $90M sale of Griffin Towers, a 550,000 SF office tower in Santa Ana to Angelo, Gordon & Company. This sale was the largest on the West Coast in the first quarter of 2010. UNITED KINGDOM Mortiz Group CBRE acted on behalf of the Mortiz Group to sell Victoria House, Bloomsbury Square, London for $269M. This 300,000 SF grade A property is the largest office deal in London’s West end market since 2007. |
|
|
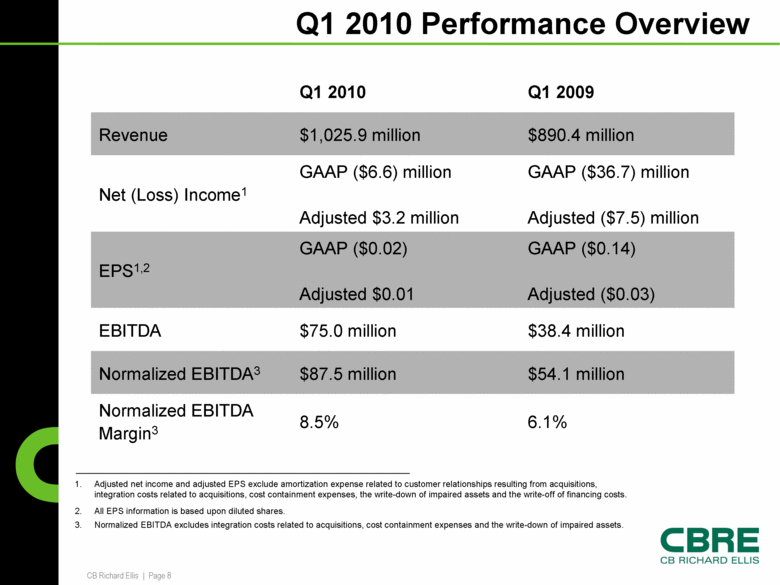
Q1 2010 Performance Overview Q1 2009 Q1 2010 $54.1 million $87.5 million Normalized EBITDA3 6.1% 8.5% Normalized EBITDA Margin3 $38.4 million $75.0 million EBITDA GAAP ($0.14) Adjusted ($0.03) GAAP ($0.02) Adjusted $0.01 EPS1,2 GAAP ($36.7) million Adjusted ($7.5) million GAAP ($6.6) million Adjusted $3.2 million Net (Loss) Income1 $890.4 million $1,025.9 million Revenue 1. Adjusted net income and adjusted EPS exclude amortization expense related to customer relationships resulting from acquisitions, integration costs related to acquisitions, cost containment expenses, the write-down of impaired assets and the write-off of financing costs. 2. All EPS information is based upon diluted shares. 3. Normalized EBITDA excludes integration costs related to acquisitions, cost containment expenses and the write-down of impaired assets. |
|
|
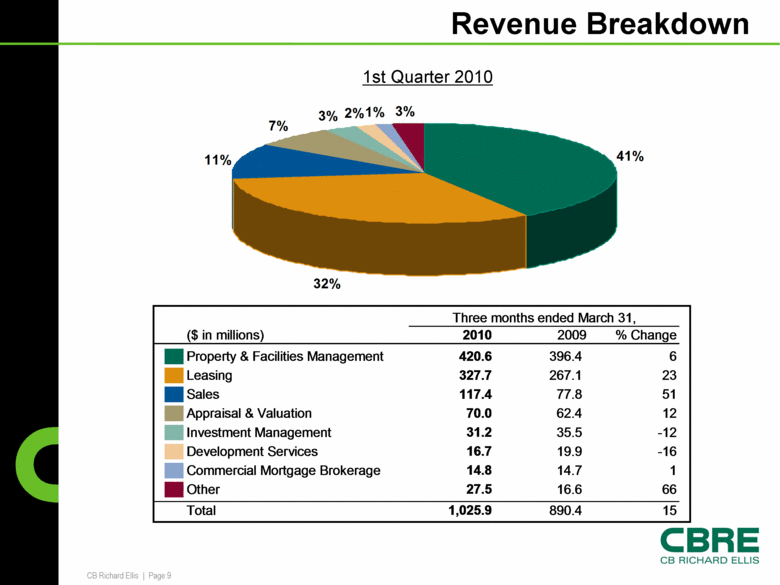
Revenue Breakdown 1st Quarter 2010 ($ in millions) 2010 2009 % Change Property & Facilities Management 420.6 396.4 6 Leasing 327.7 267.1 23 Sales 117.4 77.8 51 Appraisal & Valuation 70.0 62.4 12 Investment Management 31.2 35.5 -12 Development Services 16.7 19.9 -16 Commercial Mortgage Brokerage 14.8 14.7 1 Other 27.5 16.6 66 Total 1,025.9 890.4 15 Three months ended March 31, |
|
|
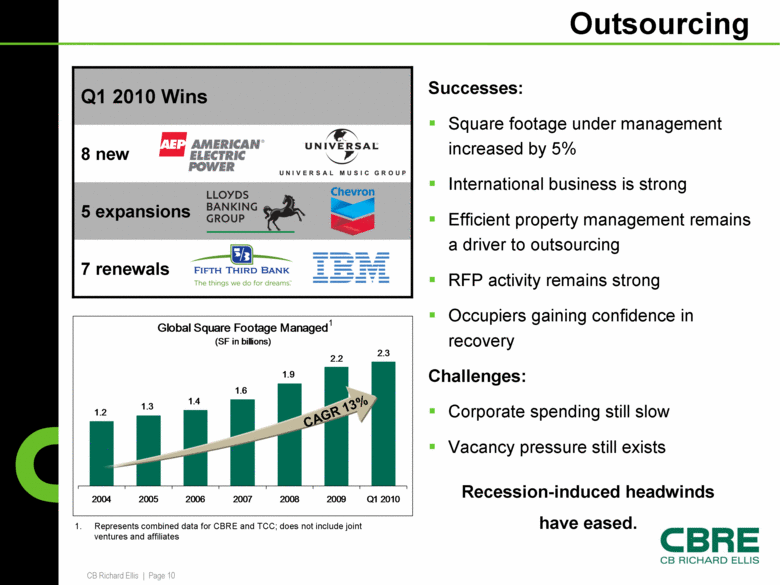
Outsourcing Q1 2010 Wins 7 renewals 5 expansions 8 new CAGR 13% 1. Represents combined data for CBRE and TCC; does not include joint ventures and affiliates 1 Successes: Square footage under management increased by 5% International business is strong Efficient property management remains a driver to outsourcing RFP activity remains strong Occupiers gaining confidence in recovery Challenges: Corporate spending still slow Vacancy pressure still exists Recession-induced headwinds have eased. Global Square Footage Managed (SF in billions) 1.2 1.3 1.4 1.6 2.2 2.3 1.9 2004 2005 2006 2007 2008 2009 Q1 2010 |
|
|
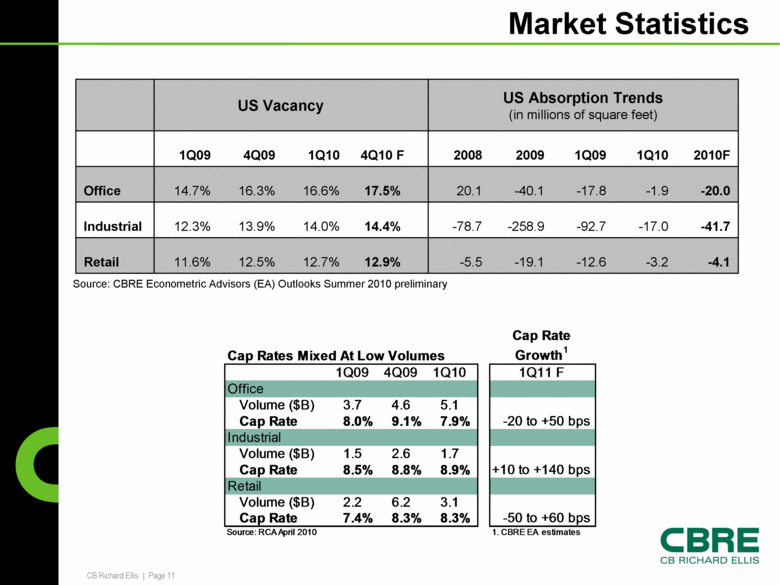
Market Statistics -4.1 -3.2 -12.6 -19.1 -5.5 12.9% 12.7% 12.5% 11.6% Retail -41.7 -17.0 -92.7 -258.9 -78.7 14.4% 14.0% 13.9% 12.3% Industrial -20.0 -1.9 -17.8 -40.1 20.1 17.5% 16.6% 16.3% 14.7% Office 2010F 1Q10 1Q09 2009 2008 4Q10 F 1Q10 4Q09 1Q09 US Absorption Trends (in millions of square feet) US Vacancy Source: CBRE Econometric Advisors (EA) Outlooks Summer 2010 preliminary +10 to +140 bps Cap Rates Mixed At Low Volumes Cap Rate Growth1 1Q09 4Q09 1Q10 1Q11 F Office Volume ($B) 3.7 4.6 5.1 Cap Rate 8.0% 9.1% 7.9% -20 to +50 bps Industrial Volume ($B) 1.5 2.6 1.7 Cap Rate 8.5% 8.8% 8.9% Retail Volume ($B) 2.2 6.2 3.1 Cap Rate 7.4% 8.3% 8.3% -50 to +60 bps Source: RCA April 2010 1. CBRE EA estimates |
|
|
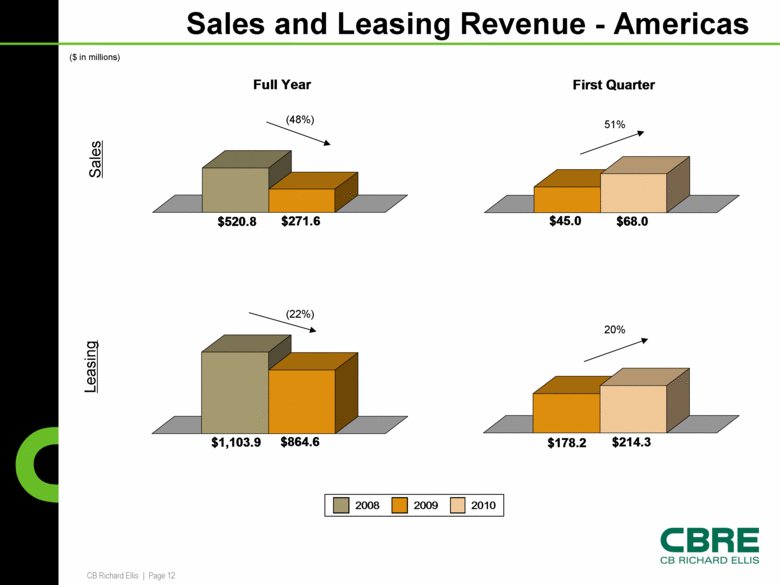
Sales and Leasing Revenue - Americas ($ in millions) Sales Leasing (48%) (22%) 51% 20% 2010 $178.2 $214.3 $520.8 $271.6 Full Year $45.0 $68.0 First Quarter $1,103.9 $864.6 |
|
|
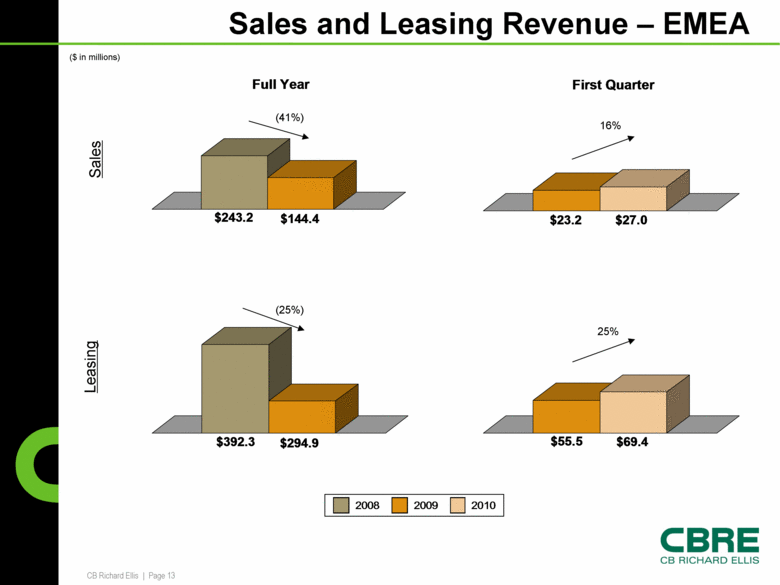
Sales and Leasing Revenue – EMEA ($ in millions) Sales Leasing (41%) (25%) 16% 25% 2010 $55.5 $69.4 $392.3 $294.9 $243.2 $144.4 Full Year $23.2 $27.0 First Quarter |
|
|
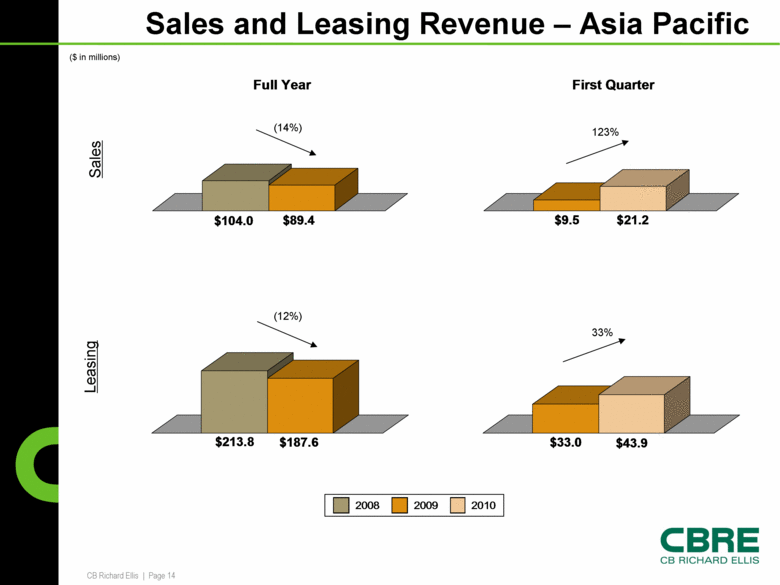
Sales and Leasing Revenue – Asia Pacific ($ in millions) Sales Leasing (14%) 123% (12%) 33% 2010 $9.5 $21.2 First Quarter $104.0 $89.4 Full Year $33.0 $43.9 $213.8 $187.6 2008 2009 |
|
|
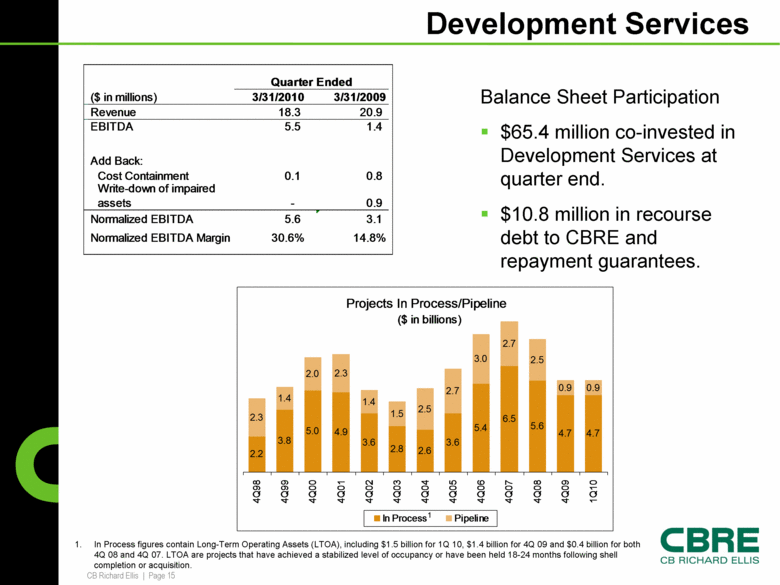
Development Services Balance Sheet Participation $65.4 million co-invested in Development Services at quarter end. $10.8 million in recourse debt to CBRE and repayment guarantees. 1. In Process figures contain Long-Term Operating Assets (LTOA), including $1.5 billion for 1Q 10, $1.4 billion for 4Q 09 and $0.4 billion for both 4Q 08 and 4Q 07. LTOA are projects that have achieved a stabilized level of occupancy or have been held 18-24 months following shell completion or acquisition. 1 5.6 Projects In Process/Pipeline ($ in billions) 2.2 3.8 5.0 4.9 3.6 2.8 2.6 3.6 5.4 6.5 5.6 4.7 4.7 2.3 1.4 2.0 2.3 1.4 1.5 2.5 2.7 3.0 2.7 2.5 0.9 0.9 4Q98 4Q99 4Q00 4Q01 4Q02 4Q03 4Q04 4Q05 4Q06 4Q07 4Q08 4Q09 1Q10 In Process Pipeline Quarter Ended ($ in millions) 3/31/2010 3/31/2009 Revenue 18.3 20.9 EBITDA 5.5 1.4 Add Back: Cost Containment 0.1 0.8 Write-down of impaired assets - 0.9 Normalized EBITDA 5.6 3.1 Normalized EBITDA Margin 30.6% 14.8% |
|
|
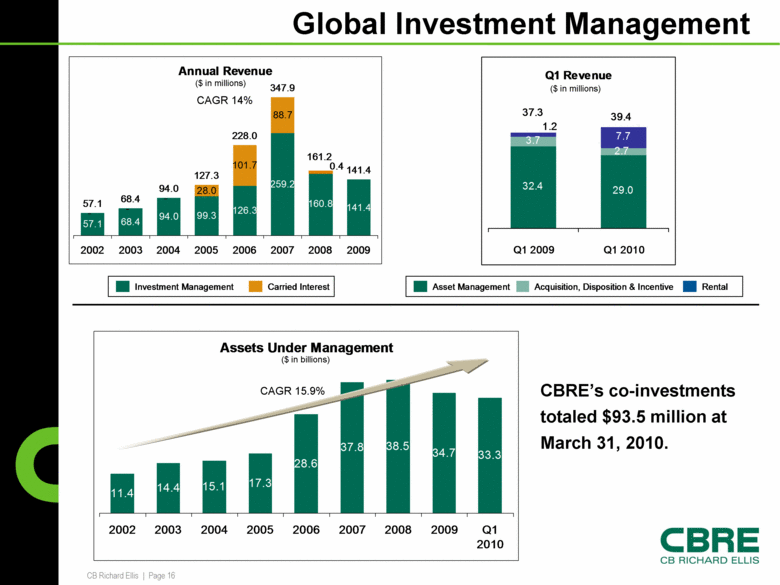
Global Investment Management ($ in billions) ($ in millions) CBRE’s co-investments totaled $93.5 million at March 31, 2010. CAGR 14% CAGR 15.9% ($ in millions) Q1 Revenue 32.4 29.0 7.7 3.7 2.7 1.2 37.3 39.4 Q1 2009 Q1 2010 Assets Under Management 11.4 14.4 15.1 17.3 28.6 37.8 38.5 34.7 33.3 2002 2003 2004 2005 2006 2007 2008 2009 Q1 2010 Investment Management Carried Interest Asset Management Acquisition, Disposition & Incentive Rental |
|
|
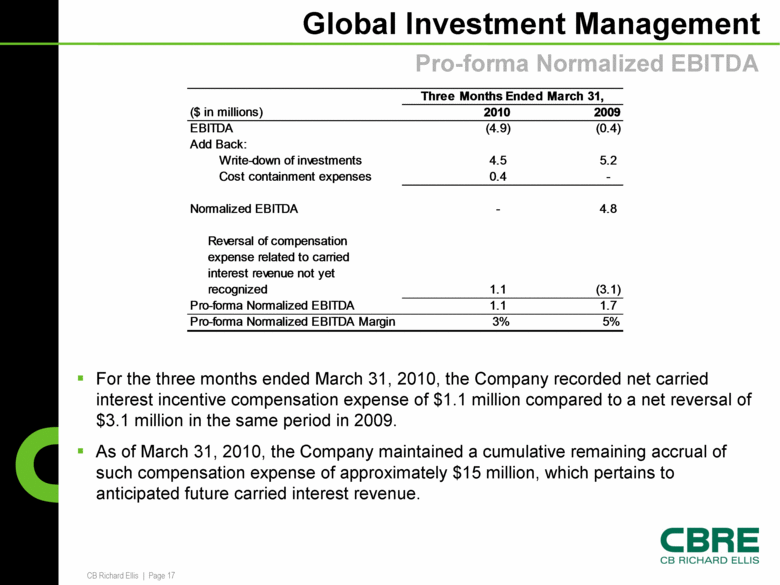
Global Investment Management For the three months ended March 31, 2010, the Company recorded net carried interest incentive compensation expense of $1.1 million compared to a net reversal of $3.1 million in the same period in 2009. As of March 31, 2010, the Company maintained a cumulative remaining accrual of such compensation expense of approximately $15 million, which pertains to anticipated future carried interest revenue. Pro-forma Normalized EBITDA Three Months Ended March 31, ($ in millions) 2010 2009 EBITDA (4.9) (0.4) Add Back: Write-down of investments 4.5 5.2 Cost containment expenses 0.4 - Normalized EBITDA - 4.8 Reversal of compensation expense related to carried interest revenue not yet recognized 1.1 (3.1) Pro-forma Normalized EBITDA 1.1 1.7 Pro-forma Normalized EBITDA Margin 3% 5% |
|
|
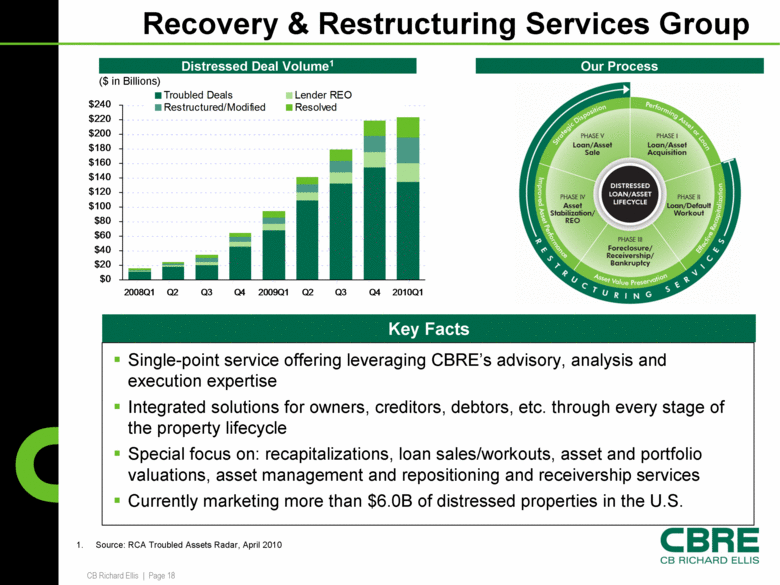
Recovery & Restructuring Services Group Distressed Deal Volume 1 Source: RCA Troubled Assets Radar, April 2010 Our Process Single-point service offering leveraging CBRE’s advisory, analysis and execution expertise Integrated solutions for owners, creditors, debtors, etc. through every stage of the property lifecycle Special focus on: recapitalizations, loan sales/workouts, asset and portfolio valuations, asset management and repositioning and receivership services Currently marketing more than $6.0B of distressed properties in the U.S. Key Facts ($ in Billions) $0 $20 $40 $60 $80 $100 $120 $140 $160 $180 $200 $220 $240 2008Q1 Q2 Q3 Q4 2009Q1 Q2 Q3 Q4 2010Q1 Troubled Deals Lender REO Restructured/Modified Resolved |
|
|
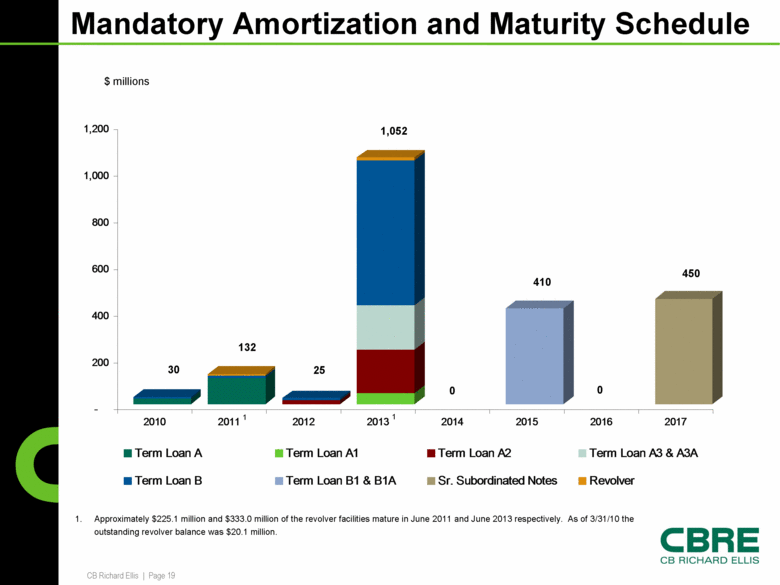
$ millions 1,052 30 132 25 410 450 1. Approximately $225.1 million and $333.0 million of the revolver facilities mature in June 2011 and June 2013 respectively. As of 3/31/10 the outstanding revolver balance was $20.1 million. Mandatory Amortization and Maturity Schedule 0 0 1 1 - 200 400 600 800 1,000 1,200 2010 2011 2012 2013 2014 2015 2016 2017 Term Loan A Term Loan A1 Term Loan A2 Term Loan A3 & A3A Term Loan B Term Loan B1 & B1A Sr. Subordinated Notes Revolver |
|
|
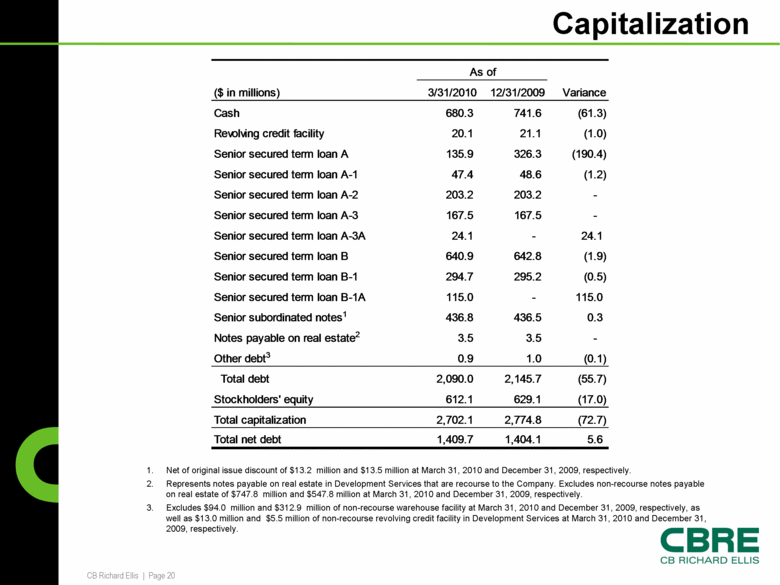
Capitalization Net of original issue discount of $13.2 million and $13.5 million at March 31, 2010 and December 31, 2009, respectively. Represents notes payable on real estate in Development Services that are recourse to the Company. Excludes non-recourse notes payable on real estate of $747.8 million and $547.8 million at March 31, 2010 and December 31, 2009, respectively. Excludes $94.0 million and $312.9 million of non-recourse warehouse facility at March 31, 2010 and December 31, 2009, respectively, as well as $13.0 million and $5.5 million of non-recourse revolving credit facility in Development Services at March 31, 2010 and December 31, 2009, respectively. ($ in millions) 3/31/2010 12/31/2009 Variance Cash 680.3 741.6 (61.3) Revolving credit facility 20.1 21.1 (1.0) Senior secured term loan A 135.9 326.3 (190.4) Senior secured term loan A-1 47.4 48.6 (1.2) Senior secured term loan A-2 203.2 203.2 - Senior secured term loan A-3 167.5 167.5 - Senior secured term loan A-3A 24.1 - 24.1 Senior secured term loan B 640.9 642.8 (1.9) Senior secured term loan B-1 294.7 295.2 (0.5) Senior secured term loan B-1A 115.0 - 115.0 Senior subordinated notes1 436.8 436.5 0.3 Notes payable on real estate2 3.5 3.5 - Other debt3 0.9 1.0 (0.1) Total debt 2,090.0 2,145.7 (55.7) Stockholders' equity 612.1 629.1 (17.0) Total capitalization 2,702.1 2,774.8 (72.7) Total net debt 1,409.7 1,404.1 5.6 As of |
|
|
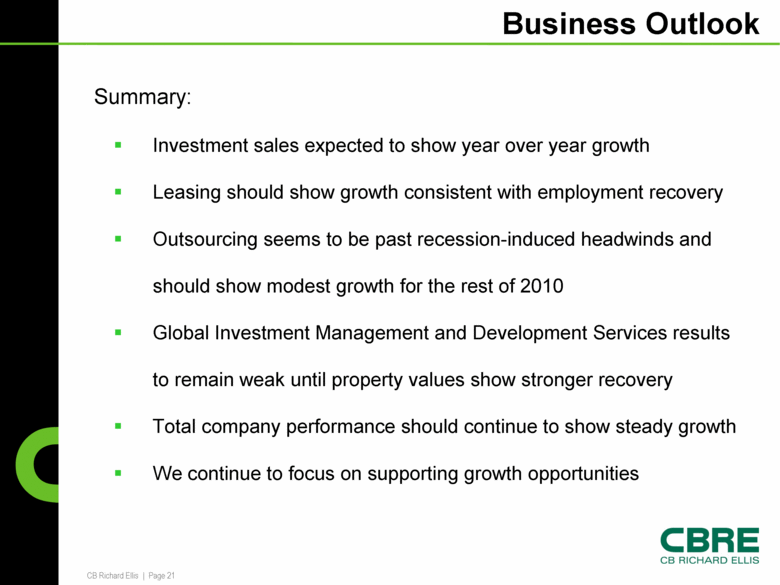
Business Outlook Summary: Investment sales expected to show year over year growth Leasing should show growth consistent with employment recovery Outsourcing seems to be past recession-induced headwinds and should show modest growth for the rest of 2010 Global Investment Management and Development Services results to remain weak until property values show stronger recovery Total company performance should continue to show steady growth We continue to focus on supporting growth opportunities |
|
|
GAAP Reconciliation Tables |
|
|
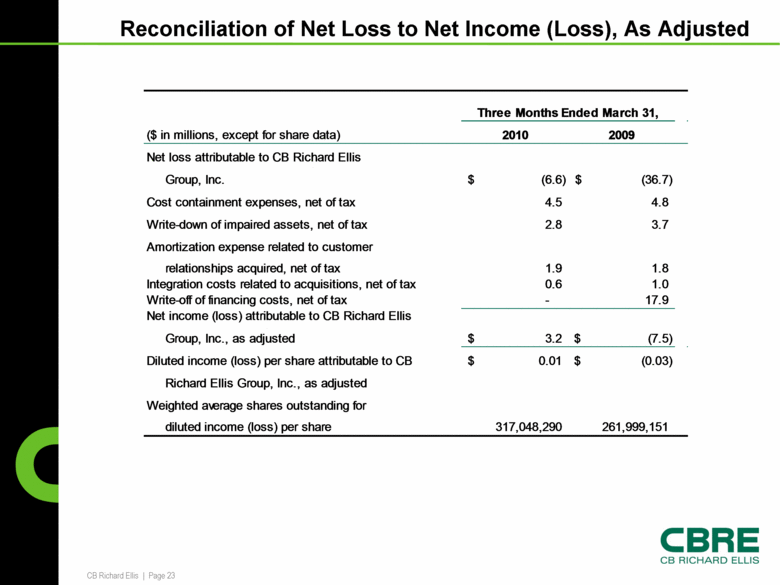
Reconciliation of Net Loss to Net Income (Loss), As Adjusted ($ in millions, except for share data) 2010 2009 Net loss attributable to CB Richard Ellis Group, Inc. (6.6) $ (36.7) $ Cost containment expenses, net of tax 4.5 4.8 Write-down of impaired assets, net of tax 2.8 3.7 Amortization expense related to customer relationships acquired, net of tax 1.9 1.8 Integration costs related to acquisitions, net of tax 0.6 1.0 Write-off of financing costs, net of tax - 17.9 Net income (loss) attributable to CB Richard Ellis Group, Inc., as adjusted 3.2 $ (7.5) $ Diluted income (loss) per share attributable to CB 0.01 $ (0.03) $ Richard Ellis Group, Inc., as adjusted Weighted average shares outstanding for diluted income (loss) per share 317,048,290 261,999,151 Three Months Ended March 31, |
|
|
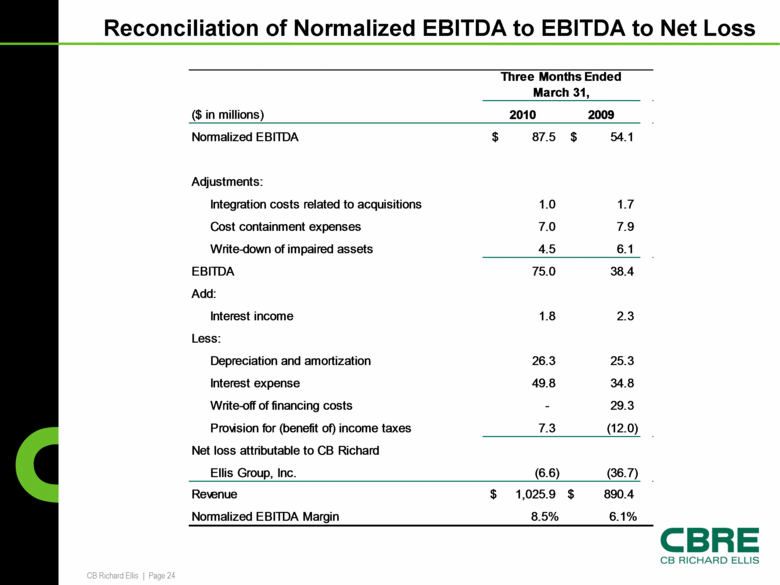
Reconciliation of Normalized EBITDA to EBITDA to Net Loss ($ in millions) 2010 2009 Normalized EBITDA 87.5 $ 54.1 $ Adjustments: Integration costs related to acquisitions 1.0 1.7 Cost containment expenses 7.0 7.9 Write-down of impaired assets 4.5 6.1 EBITDA 75.0 38.4 Add: Interest income 1.8 2.3 Less: Depreciation and amortization 26.3 25.3 Interest expense 49.8 34.8 Write-off of financing costs - 29.3 Provision for (benefit of) income taxes 7.3 (12.0) Net loss attributable to CB Richard Ellis Group, Inc. (6.6) (36.7) Revenue 1,025.9 $ 890.4 $ Normalized EBITDA Margin 8.5% 6.1% Three Months Ended March 31, |