Attached files
| file | filename |
|---|---|
| EX-21 - SUBSIDIARIES OF THE REGISTRANT - ANSYS INC | dex21.htm |
| EX-31.1 - SECTION 302 CEO CERTIFICATION - ANSYS INC | dex311.htm |
| EX-31.2 - SECTION 302 CFO CERTIFICATION - ANSYS INC | dex312.htm |
| EX-32.2 - SECTION 906 CFO CERTIFICATION - ANSYS INC | dex322.htm |
| EX-23.1 - CONSENT OF DELOITTE & TOUCHE LLP - ANSYS INC | dex231.htm |
| EX-32.1 - SECTION 906 CEO CERTIFICATION - ANSYS INC | dex321.htm |
Table of Contents
UNITED STATES
SECURITIES AND EXCHANGE COMMISSION
WASHINGTON, D.C. 20549
FORM 10-K/A
(Amendment No. 1)
(Mark One)
| x | ANNUAL REPORT PURSUANT TO SECTION 13 OR 15(d) OF THE SECURITIES EXCHANGE ACT OF 1934 |
For the Fiscal Year Ended December 31, 2009
OR
| ¨ | TRANSITION REPORT PURSUANT TO SECTION 13 OR 15(d) OF THE SECURITIES EXCHANGE ACT OF 1934 |
Commission File Number: 0-20853
ANSYS, Inc.
(Exact name of registrant as specified in its charter)
| Delaware | 04-3219960 | |
| (State or other jurisdiction of incorporation or organization) |
(IRS Employer Identification No.) |
| 275 Technology Drive, Canonsburg, PA | 15317 | |
| (Address of principal executive offices) | (Zip Code) |
724-746-3304
(Registrant’s telephone number, including area code)
Securities registered pursuant to Section 12(b) of the Act:
| Common Stock, $.01 par value per share | The NASDAQ Stock Market, LLC | |
| (Title of each class) | (Name of exchange on which registered) |
Securities registered pursuant to Section 12(g) of the Act:
None
(Title of class)
Indicate by a check mark if the registrant is a well-known seasoned issuer, as defined in Rule 405 of the Securities Act. Yes x No ¨
Indicate by a check mark if the registrant is not required to file reports pursuant to Section 13 or 15(d) of the Act. Yes ¨ No x
Indicate by a check mark whether the registrant (1) has filed all reports required to be filed by Section 13 or 15(d) of the Securities Exchange Act of 1934 during the preceding 12 months (or for such shorter period that the registrant was required to file such reports), and (2) has been subject to such filing requirements for the past 90 days. Yes x No ¨
Indicate by check mark whether the registrant has submitted electronically and posted on its corporate Web site, if any, every Interactive Data File required to be submitted and posted pursuant to Rule 405 of Regulation S-T (§232.405 of this chapter) during the preceding 12 months (or for such shorter period that the registrant was required to submit and post such files). Yes ¨ No ¨
Indicate by a check mark if disclosure of delinquent filers pursuant to Item 405 of Regulation S-K (§229.405 of this chapter) is not contained herein and will not be contained, to the best of the Registrant’s knowledge, in definitive proxy or information statements incorporated by reference in PART III of this Form 10-K, or any amendment to this Form 10-K. ¨
Indicate by a check mark whether the registrant is a large accelerated filer, an accelerated filer, a non-accelerated filer, or a smaller reporting company (as defined in Exchange Act Rule 12b-2). (Check one):
| Large accelerated filer x | Accelerated filer ¨ | |
| Non-accelerated filer ¨ | Smaller reporting company ¨ |
Indicate by a check mark whether the registrant is a shell company (as defined in Exchange Act Rule 12b-2). Yes ¨ No x
The aggregate market value of the voting stock held by non-affiliates of the Registrant, based upon the closing sale price of the Common Stock on June 30, 2009 as reported on the NASDAQ Global Select Market, was approximately $2,440,000,000. Shares of Common Stock held by each officer and director and by each person who owns 5% or more of the outstanding Common Stock have been excluded in that such persons may be deemed to be affiliates. This determination of affiliate status is not necessarily a conclusive determination for other purposes.
The number of shares of the Registrant’s Common Stock, par value $.01 per share, outstanding as of February 19, 2010 was 89,846,507 shares.
Documents Incorporated By Reference:
Portions of the Proxy Statement for the Registrant’s 2010 Annual Meeting of Stockholders are incorporated by reference into Part III.
Table of Contents
Explanatory Note
This Form 10K/A constitutes Amendment No. 1 to the registrant’s report on Form 10-K for the fiscal year ended December 31, 2009 originally filed on February 25, 2010. The registrant is filing this Form 10-K/A to provide additional disclosures, exhibits and certification corrections, as follows:
| • | The Company provided additional disclosure on goodwill and intangible assets concerning the factors, events or circumstance changes that could affect the fair value determination of the Company’s reporting unit(s) in Critical Accounting Policies and Estimates within Part II, Item 7. |
| • | The Company provided additional disclosure concerning the composition of the cash and cash equivalents balance in Notes 2 and 8 to the consolidated financial statements within Part II, Item 8. |
| • | The Company amended the Section 906 certifications to refer to the year ended December 31, 2009, as well as provided updated Section 302 certifications. |
| • | The Company included the Third Amended and Restated 1996 Stock Option and Grant Plan, and the Amendment to the Third Amended and Restated ANSYS, Inc. 1996 Stock Option and Grant Plan, which were inadvertently left off of the Exhibit List, as Exhibits, within Part IV, Item 15. |
Except as described above, no other changes have been made to the originally filed Form 10-K and no attempt has been made in this Amendment No. 1 to modify or update disclosures for events that occurred subsequent to the original filing.
2
Table of Contents
ANNUAL REPORT ON FORM 10-K FOR FISCAL YEAR 2009
Table of Contents
3
Table of Contents
Important Factors Regarding Future Results
Information provided by ANSYS, Inc. (hereafter the “Company” or “ANSYS”), in this Annual Report on Form 10-K, may contain forward-looking statements concerning such matters as projected financial performance, market and industry segment growth, product development and commercialization, acquisitions or other aspects of future operations. Such statements, made pursuant to the safe harbor established by the securities laws, are based on the assumptions and expectations of the Company’s management at the time such statements are made. The Company cautions investors that its performance (and, therefore, any forward-looking statement) is subject to risks and uncertainties. Various important factors including, but not limited to, those discussed in Item 1A “Risk Factors”, may cause the Company’s future results to differ materially from those projected in any forward-looking statement. All information presented is as of December 31, 2009, unless otherwise indicated.
| ITEM 1: | BUSINESS |
ANSYS develops and globally markets engineering simulation software and technologies widely used by engineers and designers across a broad spectrum of industries, including aerospace, automotive, manufacturing, electronics, biomedical, energy and defense. Headquartered at Southpointe in Canonsburg, Pennsylvania, the Company and its subsidiaries employ approximately 1,600 people as of December 31, 2009 and focus on the development of open and flexible solutions that enable users to analyze designs directly on the desktop, providing a common platform for fast, efficient and cost-conscious product development, from design concept to final-stage testing and validation. The Company distributes its ANSYS® suite of simulation technologies through a global network of resellers and distributors (collectively, channel partners) and direct sales offices in strategic, global locations. It is the Company’s intention to continue to maintain this mixed sales and distribution model.
As a result of the July 31, 2008 acquisition of Ansoft Corporation (“Ansoft”), the Company operates as two operating segments that the Company determined may be aggregated. Given the integrated approach to the multi-discipline problem-solving needs of the Company’s customers, a single sale of software may contain components from multiple product areas and include combined technologies. As a result, it is impracticable for the Company to provide accurate historical or current reporting among its various product-lines.
The Company’s product portfolio consists of the following:
ANSYS WorkbenchTM
ANSYS Workbench is the framework upon which the Company’s suite of advanced engineering simulation technology is built. The innovative project schematic view ties together the entire simulation process, guiding the user through complex multiphysics analyses with drag-and-drop simplicity. With bi-directional computer-aided design (“CAD”) connectivity, an automated project level update mechanism, pervasive parameter management and integrated optimization tools, the ANSYS Workbench delivers productivity, enabling Simulation Driven Product DevelopmentTM.
Multiphysics
The Company’s multiphysics product suite combines solver technology for all physics disciplines with an open and adaptive ANSYS Workbench environment, flexible coupled-physics simulation methods and parallel scalability. Together these technologies form the foundation for comprehensive multiphysics simulation capable of solving complex engineering challenges.
4
Table of Contents
Structural Mechanics
The Company’s structural mechanics product suite offers simulation tools for product design and optimization that increase productivity, minimize physical prototyping and help deliver better and innovative products in less time. These tools tackle real-world analysis problems by making product development less costly and more reliable. In addition, these tools include broad capabilities that cover analysis types, elements, contact, materials, equation solvers and coupled physics capability all targeted toward understanding and solving complex design problems.
Fluid Dynamics
The Company’s fluid dynamics product suite offers modeling fluid flow and other related physical phenomena. Fluid flow analysis capabilities provide all the tools needed to design and optimize new fluids equipment and to troubleshoot already existing installations. The Company’s suite contains general purpose computational fluid dynamics software and additional specialized products to address specific industry applications.
Explicit Dynamics
The Company’s explicit dynamics product suite simulates short, high deformation, large strain, fracture or complete material failure applications. The Company’s product suite is ideal for simulating physical events that occur in a short period of time and may result in material damage or failure. These types of events are often difficult or expensive to study experimentally.
Electromagnetics
The Company’s electromagnetics product suite provides industry leading electromagnetic field simulation software used by electrical engineers to design high-performance electronic and electromechanical products. The software is used to streamline the design process and predict performance of mobile communication, internet-access, broadband networking components and systems, integrated circuits and printed circuit boards, as well as electromechanical systems such as automotive components and power electronics equipment prior to building a prototype.
System and Circuit Simulation
The Company’s system and circuit simulation technology provides schematic capture, layout and design management capabilities that allow engineers to simulate high-speed and high-power electronic circuits coupled to virtual physical models of components derived from the Company’s electromagnetic, structural mechanics, fluid dynamics and multiphysics products to predict overall system-level performance. This type of simulation is essential for engineers designing wind energy and hybrid-propulsion systems, as well as high-speed electronic systems such as wireless communication devices.
Simulation Process & Data Management
ANSYS Engineering Knowledge ManagerTM (“ANSYS EKM”) is a comprehensive solution for simulation-based process and data management challenges. ANSYS EKM provides solutions and benefits to all levels of a company and enables it to address the critical issues associated with simulation data, including backup and archival, traceability and audit trail, process automation, and collaboration and capture of engineering expertise.
Academic
The Company’s academic product suite provides a highly scalable portfolio of academic products based on several usage tiers: associate, research and teaching. Each tier includes a range of noncommercial products that bundle a broad range of physics and advanced coupled field solver capabilities. The Company’s product suite
5
Table of Contents
provides entry-level tools intended for class demonstrations and hands-on instruction. The product suite also provides flexible terms of use and more complex analysis suitable for doctoral and post-doctoral research projects. The Company also provides a low cost, problem size limited product suitable for student use at home.
High-Performance Computing
The Company’s high-performance computing (“HPC”) product suite enables enhanced insight into product performance and improves the productivity of the design process. The Company’s product suite delivers cross-physics parallel processing capability for the full spectrum of the Company’s simulation software by supporting structural, fluids, thermal and electromagnetic simulations in a single HPC solution. The Company’s product suite also increases the turnaround time for individual simulations, enables users to consider multiple design ideas and make the right design decisions early in the design cycle.
Geometry Interfaces
The Company offers comprehensive geometry handling solutions for engineering simulation in an integrated environment with direct interfaces to all major CAD systems, support of additional readers and translators, and an integrated geometry modeler exclusively focused on analysis.
PRODUCT DEVELOPMENT
The Company makes significant investments in research and development and emphasizes accelerated new integrated product releases. The Company’s product development strategy centers on ongoing development and innovation of new technologies to increase productivity and to provide engineering simulation solutions that customers can integrate into enterprise-wide product lifecycle management systems. The Company’s product development efforts focus on extensions of the full product line with new functional modules, further integration with CAD and product lifecycle management (“PLM”) products, and the development of new products. The Company’s products run on the most widely used engineering computing platforms and operating systems, including Windows, Linux and most UNIX workstations.
During 2009, the Company completed the following major product development activities and releases (in chronological order):
| • | The release of version 8.0 of Simplorer® software, which offers a next-generation user interface, advanced modeling capabilities, enhanced integration with third party simulation software and computational performance enhancements. It enables users to create an accurate, customized design flow for rapidly emerging applications that involve multiple engineering domains. Other enhancements include an insulated gate bipolar transistor device characterization tool, which allows users to quickly and accurately create average and dynamic models of power semiconductor devices, an online model database, new function handling techniques and solver methodologies to optimize simulation performance and distributed solve capability, which allows users to distribute parametric variations across a network of computers. |
| • | The release of version 12.0 of ANSYS software, which dramatically compresses design and analysis cycles, enabling parametric studies and design optimization across multiple physics, increasing the accuracy and completeness of virtual prototypes, and capturing and reusing simulation processes and data. This software suite supports fast product design and validation in a complete, highly usable virtual environment that captures complex and coupled physical phenomena. It offers unequalled technical breadth, which allows customers to explore a complete range of dynamic behavior, and encompasses a broad solver portfolio that spans a full range of functionality. It also includes HPC milestones, such as optimized parallel computing performance on multi-core processors, expanded support for large simulators, scaling breakthroughs and support for parallel file systems. |
| • | The release of version 4.0 of SIwaveTM software, which includes new features for signal-integrity, power-integrity and electromagnetic compatibility testing. It also includes an improved desktop graphical user interface with new post-processing of results, solver enhancements that provide accurate |
6
Table of Contents
| solutions beyond 10 Gb/s, automation that links SIwaveTM electromagnetics with circuit simulation and a new link that enables accurate characterization of additional heating due to copper-resistive losses that engineers have previously estimated or ignored completely. |
| • | The release of version 12.0 of HFSSTM software, which helps engineers design, simulate and validate the behavior of complex, high-performance radio frequency, microwave and millimeter-wave devices in next-generation wireless communication and defense systems. It offers a key HPC enhancement, domain decomposition, which allows engineers to simulate and design at a scale and speed never before possible. It also includes key updates in mesh generation and solver technologies, enhancements to the user interface and the modeler, a more robust meshing algorithm and mixed element orders, curvilinear elements and adjoint derivative computation. |
| • | The release of version 2.0 ANSYS EKMTM software, which addresses how to better manage, share and reuse simulation data and how to capture the engineering expertise that a simulation result represents. It offers extensive capabilities for archival and management of simulation data, traceability and audit trail, advanced search and retrieval, report generation and simulation comparison, process/workflow automation, collaboration tools, and capture and deployment of best practices. It also includes a new scripting interface that enables the creating and publishing of custom application templates, which can then be addressed by users over the internet. |
| • | The release of version 5.0 of Ansoft Designer® with Nexxim® software, which supports Simulation Driven Product Development of electronic products and includes features that compress the electronic design and analysis cycle. It offers a distributed-solve HPC capability that allows engineers to analyze process variations within a full signal integrity analysis across a network of computers and links with ANSYS DesignXplorerTM software, which enables design of experiments, sensitivity studies and six-sigma design. It also includes a new simulation engine, which allows engineers to simulate entire wireless systems while linking to highly accurate transistor and electromagnetic models. |
| • | The release of version 12.1 of ANSYS software, which incorporates tools that further automate the product development process and extends the integration of its products into the ANSYS Workbench environment, resulting in faster modeling times and cross-physics automation. It includes automation, which enables parametric studies and design optimization across multiple physics, increases the accuracy and completeness of virtual prototypes and allows for capture and reuse of simulation processes and data. It also offers tools that record, customize and automate analysis steps through journaling and scripting. This software release includes the ANSYS HPC TM solution set, which provides a cross-physics parallel computing capability that supports structural, fluids, thermal and electromagnetic simulation in a single solution. |
The Company’s total research and development expenses were $79.9 million, $71.6 million and $56.5 million in 2009, 2008 and 2007, respectively, or 15.4%, 15.0% and 14.7% of total revenue, respectively. As of December 31, 2009, the Company’s product development staff consisted of approximately 500 full-time employees, most of whom hold advanced degrees and have industry experience in engineering, mathematics, computer science or related disciplines. The Company has traditionally invested significant resources in research and development activities, and intends to continue to make significant investments in this area, particularly as it relates to ongoing integration and evolution of its framework and portfolio of software technologies.
PRODUCT QUALITY
The Company’s employees generally perform product development tasks according to predefined quality plans, procedures and work instructions. Certain technical support tasks are also subject to a quality process. These plans define for each project the methods to be used, the responsibilities of project participants and the quality objectives to be met. The majority of software products are developed under a quality system that is certified to the ISO 9001:2000 standard. The Company establishes quality plans for its products and services, and subjects product designs to multiple levels of testing and verification in accordance with processes established under the Company’s quality system.
7
Table of Contents
SALES AND MARKETING
The Company distributes and supports its products through a global network of independent channel partners, as well as through its own direct sales offices. This network provides the Company with a cost-effective, highly specialized channel of distribution and technical support. It also enables the Company to draw on business and technical expertise from a global network, provides relative stability to the Company’s operations to offset geography-specific economic trends and provides the Company with an opportunity to take advantage of new geographic markets. Approximately 26% in 2009 and 30% in each of 2008 and 2007 of the Company’s total revenue was derived through the indirect sales channel.
The channel partners sell ANSYS products to new customers, expand installations within the existing customer base, offer training and consulting services, and provide the first line of ANSYS technical support. The Company’s channel partner certification process helps to ensure that each channel partner has the ongoing capability to adequately represent the Company’s expanding product-lines and to provide an acceptable level of training, consultation and customer support.
The Company also has a direct sales management organization in place to develop an enterprise-wide, focused sales approach and to implement a worldwide major account strategy. The sales management organization also functions as a focal point for requests to ANSYS from the channel partners and provides additional support in strategic locations through the presence of direct sales offices. A Vice President of Worldwide Sales and Support heads the Company’s sales management organization.
During 2009, the Company continued to invest in its existing domestic and international strategic sales offices. In total, the Company’s direct sales offices employ approximately 450 full-time employees who are responsible for the sales, marketing initiatives and administrative activities designed to support the Company’s overall revenue growth and expansion strategies.
During 2009, the Company also maintained its significant channel partner network, including its reseller network. The reseller network complements the larger ANSYS channel partners by establishing a broader user base for the Company’s products and services. The resellers are required to have appropriately trained marketing, sales and technical personnel.
The Company’s products are utilized by organizations ranging in size from small consulting firms to the world’s largest industrial companies. No single customer accounted for more than 10% of the Company’s revenue in 2009, 2008 or 2007.
Information with respect to foreign and domestic revenue may be found in Note 17 to the consolidated financial statements in Part IV, Item 15 of this Annual Report on Form 10-K and in the section entitled “Management’s Discussion and Analysis of Financial Condition and Results of Operations” in Part II, Item 7 of this Annual Report on Form 10-K.
STRATEGIC ALLIANCES AND MARKETING RELATIONSHIPS
The Company has established and continues to pursue strategic alliances with advanced technology suppliers, and marketing relationships with hardware vendors, specialized application developers, and CAD and PLM providers. The Company believes that these relationships facilitate accelerated incorporation of advanced technology into the Company’s products, provide access to new customers, expand the Company’s sales channels, develop specialized product applications and provide direct integration with leading CAD, EDA, product data management and PLM systems.
The Company has technical and marketing relationships with leading CAD vendors, such as Autodesk, Dassault Systèmes, Parametric Technology Corporation, and Siemens Product Lifecycle Management Software Inc., to provide direct links between products. These links facilitate the transfer of electronic data models between the CAD systems and ANSYS products. In addition, the Company has an agreement with Dassault
8
Table of Contents
Systèmes under which ANSYS fluid flow modeling technology is embedded in the CATIA V5 product lifecycle management environment. This fully integrated product, FLUENT for CATIA V5, enables model building, computation, post-processing and data management within the analysis infrastructure of CATIA V5.
Similarly, the Company maintains marketing and software development relationships with leading software companies in the EDA market, including Cadence, Synopsys and Mentor Graphics. These relationships support transfer of data between electronics design and layout packages and the ANSYS and Ansoft electronics simulation portfolio.
The Company has established relationships with leading suppliers of computer hardware, including Intel, AMD, Microsoft, Hewlett-Packard, Sun Microsystems, IBM, Dell, Cray, Panasas, QLogic, Mellanox and other leading regional resellers and system integrators. These relationships provide the Company with joint marketing opportunities, such as advertising, public relations, editorial coverage and customer events. In addition, these alliances provide the Company with early access and technical collaboration on new processors and related computing technologies, ensuring that the Company’s software products are certified to run effectively on the most current hardware platforms. Key 2009 milestones include support for updated multicore processors from Intel and AMD, use of Intel software development tools for code profiling and optimization, and updated support of the Microsoft HPC Server 2008 operating system.
The Company’s Enhanced Solution Partner Program actively encourages specialized developers of software solutions to use the Company’s technology as a development platform for their applications and provides customers with enhanced functionality related to their use of the Company’s software. With approximately 110 active enhanced solution partnerships, spanning a wide range of technologies, including electronics, mechanical simulation, fluid simulation, acoustics, turbomachinery and CAD, this partner ecosystem extends the depth and breadth of the Company’s technology offering. During 2009, for example, the Company focused on partner solutions for composite modeling, including integration of technology from EVEN AG in the Workbench environment.
The Company has a software license agreement with Livermore Software Technology Corporation (“LSTC”) whereby LSTC has provided LS-DYNA software for explicit dynamics solutions used in applications such as crash test simulations in automotive and other industries. Under this arrangement, LSTC assists in the integration of the LS-DYNA software with the Company’s pre- and post-processing capabilities and provides updates and problem resolution in return for royalty from sales of the ANSYS/LS-DYNA combined product.
COMPETITION
The Company believes that the principal factors affecting sales of its software include ease of use, breadth and depth of functionality, flexibility, quality, ease of integration with other software systems, file compatibility across computer platforms, range of supported computer platforms, performance, price and total cost of ownership, customer service and support, company reputation and financial viability, and effectiveness of sales and marketing efforts.
The Company continues to experience intense competition across all markets for its products and services. Some of the Company’s current and possible future competitors have greater financial, technical, marketing and other resources than the Company, and some have well established relationships with current and potential customers of the Company. The Company’s current and possible future competitors also include firms that have or may in the future elect to compete by means of open source licensing. These competitive pressures may result in decreased sales volumes, price reductions and/or increased operating costs, and could result in lower revenues, margins and net income.
PROPRIETARY RIGHTS AND LICENSES
The Company regards its software as proprietary and relies on a combination of trade secret, copyright, patent and trademark laws, license agreements, nondisclosure and other contractual provisions, and technical measures to protect its proprietary rights in its products. The Company distributes its software products under
9
Table of Contents
software license agreements that grant customers nonexclusive licenses for the use of the Company’s products, which are typically nontransferable. License agreements for the Company’s products are directly between the Company and end users. Use of the licensed software product is restricted to specified sites unless the customer obtains a multi-site license for its use of the software product. Software security measures are also employed to prevent unauthorized use of the Company’s software products and the licensed software is subject to terms and conditions prohibiting unauthorized reproduction. Customers may purchase a perpetual license of the technology with the right to annually purchase ongoing maintenance, technical support and updates, or may lease the product on a fixed term basis for a fee that includes the license, maintenance, technical support and upgrades.
The Company licenses its software products utilizing a combination of web-based and hard copy license terms and forms. For certain software products, the Company primarily relies on “click-wrapped” licenses. The enforceability of these types of agreements under the laws of some jurisdictions is uncertain.
The Company also seeks to protect the source code of its software as a trade secret and as unpublished copyrighted work. The Company has obtained federal trademark registration protection for ANSYS, ANSYS Workbench, AUTODYN, CFX, FLUENT, Maxwell, and other marks in the U.S. and in foreign countries. Additionally, the Company was awarded a patent by the U.S. Patent and Trademark Office for its Web-based reporting technology.
Employees of the Company have signed agreements under which they have agreed not to disclose trade secrets or confidential information and, where legally permitted, that restrict engagement in or connection with any business that is competitive with the Company anywhere in the world while employed by the Company (and, in some cases, for specified periods thereafter), and that any products or technology created by them during their term of employment are the property of the Company. In addition, the Company requires all channel partners to enter into agreements not to disclose the Company’s trade secrets and other proprietary information.
Despite these precautions, there can be no assurance that misappropriation of the Company’s technology and proprietary information will not occur. Further, there can be no assurance that copyright, trademark, patent and trade secret protection will be available for the Company’s products in certain countries, or that restrictions on the ability of employees and channel partners to engage in activities competitive with the Company will be enforceable.
The software development industry is characterized by rapid technological change. Therefore, the Company believes that factors such as the technological and creative skills of its personnel, new product developments, frequent product enhancements, name recognition and reliable product maintenance are also important to establishing and maintaining technology leadership in addition to the various legal protections of its technology that may be available.
The Company does not believe that any of its products infringe upon the proprietary rights of third parties. There can be no assurance, however, that third parties will not claim such infringement by the Company or its licensors or licensees with respect to current or future products. The Company expects that software suppliers will increasingly be subject to the risk of such claims as the number of products and suppliers continues to expand and the functionality of products continues to increase. Any such claims, with or without merit, could be time consuming, result in costly litigation, cause product shipment delays or require the Company to enter into royalty or licensing agreements. Such royalty or licensing agreements, if required, may not be available on terms acceptable to the Company.
SEASONAL VARIATIONS
The Company’s business has experienced seasonality, including quarterly reductions in software sales resulting from the slowdown during the summer months, particularly in Europe, as well as from the seasonal purchasing and budgeting patterns of the Company’s global customers. The Company’s revenue and margins are typically highest in the fourth quarter.
10
Table of Contents
BACKLOG
The Company generally ships its products within 30 days after acceptance of an order and execution of a software license agreement. Accordingly, the Company does not believe that its backlog at any particular point in time is indicative of future sales levels.
EMPLOYEES
As of December 31, 2009, the Company and its subsidiaries had approximately 1,600 full-time employees. At that date, there were also contract personnel and co-op students providing ongoing development services and technical support. The Company believes that its relationship with its employees is good.
AVAILABLE INFORMATION
The Company’s website is www.ansys.com. The Company makes available on its website, free of charge, Annual Reports on Form 10-K, Quarterly Reports on Form 10-Q, Current Reports on Form 8-K, reports filed pursuant to Section 16 and amendments to those reports as soon as reasonably practicable after such materials are electronically filed or furnished to the Securities and Exchange Commission. In addition, the Company has posted the charters for its Audit Committee, Compensation Committee and Nominating and Corporate Governance Committee, as well as the Company’s Code of Business Conduct and Ethics, Standard Business Practices and Corporate Governance Guidelines on its website. Information posted on the Company’s website is not incorporated by reference in this Annual Report on Form 10-K.
| ITEM 1A: | RISK FACTORS |
Information provided by the Company or its spokespersons, including information contained in this Annual Report on Form 10-K, may from time to time contain forward-looking statements concerning projected financial performance, market and industry sector growth, product development and commercialization or other aspects of future operations. Such statements will be based on the assumptions and expectations of the Company’s management at the time such statements are made. The Company cautions investors that its performance (and, therefore, any forward-looking statement) is subject to risks and uncertainties. Various important factors including, but not limited to, the following may cause the Company’s future results to differ materially from those projected in any forward-looking statement.
Adverse Conditions in the Global Economy and Disruption in Financial Markets. The financial markets in the United States, Europe and Asia continue to experience disruption, including, among other things, volatility in security prices, diminished liquidity and credit availability, rating downgrades of certain investments and declining valuations of others. While currently these conditions have not impaired the Company’s ability to access credit markets and finance operations, there can be no assurance that there will not be a further deterioration in financial markets and confidence in major economies. The Company is impacted by these economic developments, both domestically and globally, in that the current tightening of credit in financial markets adversely affects the ability of its customers and suppliers to obtain financing for significant purchases and operations, and could result in a decrease in orders for the Company’s products and services. These economic conditions may negatively impact the Company as some of its customers defer purchasing decisions, thereby lengthening the Company’s sales cycles. In addition, certain of the Company’s customers’ budgets may be constrained and they may be unable to purchase our products at the same level. The Company’s customers’ ability to pay for the Company’s products and services may also be impaired, which may lead to an increase in the Company’s allowance for doubtful accounts and write-offs of accounts receivable. The Company is unable to predict the likely duration and severity of the adverse economic conditions in the U.S. and other countries. Should these economic conditions result in the Company not meeting its revenue growth objectives, the Company’s operating results and financial condition could be adversely affected.
Decline in Customers’ Business. The Company’s sales are based significantly on end user demand for products in key industrial sectors. Many of these sectors periodically experience economic declines, which may be exacerbated by other economic factors, including the current global economic disruptions. These factors may
11
Table of Contents
adversely affect the Company’s business by extending sales cycles and reducing revenue. These economic factors may cause the Company’s customers to reduce the size of their workforce or cut back on operations and may lead to a reduction in license renewals or ongoing maintenance contracts with the Company. The Company’s customers may also request discounts or extended payment terms on new products or seek to extend payment terms on existing contracts, all of which may cause fluctuations in the Company’s future operating results. The Company may not be able to adjust its operating expenses to offset such fluctuations because a substantial portion of the Company’s operating expenses is related to personnel, facilities and marketing programs. The level of personnel and related expenses may not be able to be adjusted quickly and is based, in significant part, on the Company’s expectation for future revenue. The Company’s customers have also been decreasing the size of, foregoing or delaying new investments in the Company’s products as a result of the global economic disruptions, and the Company is experiencing increased pricing pressure in certain products and geographic areas. Accordingly, the Company’s license revenue during the year ended December 31, 2009 was less than license revenue during the year ended December 31, 2008. If the Company’s customers further reduce, delay, or decide to forego investments in the Company’s products and downward pressure on prices continues, the Company’s license revenue may be adversely affected.
Risks Associated with International Activities. A majority of the Company’s business comes from outside the United States and the Company has customers that supply a wide spectrum of goods and services in virtually all of the world’s major economic regions. As the Company continues to expand its sales presence in international regions, the portion of its revenue, expenses, cash, accounts receivable and payment obligations denominated in foreign currencies continues to increase. The Company’s revenues and operating results are adversely affected when the U.S. Dollar strengthens relative to other currencies and are positively affected when the U.S. Dollar weakens. As a result, changes in currency exchange rates will affect the Company’s financial position, results of operations and cash flows. In the event that there are economic declines in countries in which the Company conducts transactions, the resulting changes in currency exchange rates, may from time to time affect the Company’s financial position, results of operations and cash flows. The Company is most impacted by movements in and among the British Pound, Euro, Japanese Yen, Canadian Dollar, Indian Rupee, Swedish Krona, Chinese Renminbi, Korean Won, Taiwan Dollar and the U.S. Dollar. The Company seeks to reduce these risks primarily through its normal operating and treasury activities, but there can be no assurances it will be successful in reducing these risks.
Additionally, the Company’s Ansoft business has had lower revenue than originally anticipated at the time of the Company’s acquisition of Ansoft, primarily as a result of the ongoing global economic downturn having a disproportionate effect on the industries and geographic areas from which Ansoft derives a substantial portion of its revenue. If these international business conditions continue to exist, the Company’s revenue, net income and earnings per share growth may be negatively impacted.
Additional risks inherent in the Company’s international business activities include imposition of government controls, export license requirements, restrictions on the export of critical technology, products and services, political and economic instability, trade restrictions, changes in tariffs and taxes, difficulties in staffing and managing international operations, longer accounts receivable payment cycles and the burdens of complying with a wide variety of foreign laws and regulations. Effective patent, copyright, trademark and trade secret protection may not be available in every foreign country in which the Company sells its products and services. The Company’s business, financial position, results of operations and cash flows could be materially adversely affected by any of these risks.
Stock Market and Stock Price Volatility. Market prices for securities of software companies have generally been volatile. In particular, the market price of the Company’s common stock has been, and may continue to be, subject to significant fluctuations as a result of factors affecting the Company, the software industry or the securities markets in general. Such factors include, but are not limited to, declines in trading price that may be triggered by the Company’s failure to meet the expectations of securities analysts and investors. In connection with recent volatility in global economic conditions, the prices of equity securities, including the price of the
12
Table of Contents
Company’s common stock, experienced price and volume volatility in many cases disproportionate to the underlying operating performance of the affected companies. The Company’s common stock was at its lowest closing price during the year ended December 31, 2009 on March 9, 2009 at a price of $18.06 per share. As of December 31, 2009, the Company’s common stock closed at $43.46 per share. Moreover, the trading price could be subject to additional fluctuations in response to quarter-to-quarter variations in the Company’s operating results, material announcements made by the Company or its competitors, conditions in the financial markets or the software industry generally or other events and factors, many of which are beyond the Company’s control.
Rapidly Changing Technology; New Products; Risk of Product Defects. The Company operates in an industry generally characterized by rapidly changing technology and frequent new product introductions, which can render existing products obsolete or unmarketable. A major factor in the Company’s future success will be its ability to anticipate technological changes and to develop and introduce, in a timely manner, enhancements to its existing products, products acquired in acquisitions and new products to meet those changes. If the Company is unable to introduce new products and to respond quickly to industry changes, its business, financial position, results of operations and cash flows could be materially, adversely affected.
The introduction and marketing of new or enhanced products require the Company to manage the transition from existing products in order to minimize disruption in customer purchasing patterns. There can be no assurance that the Company will be successful in developing and marketing, on a timely basis, new products or product enhancements, that its new products will adequately address the changing needs of the marketplace or that it will successfully manage the transition from existing products. Software products as complex as those offered by the Company may contain undetected errors or failures when first introduced or as new versions are released, and the likelihood of errors is increased as a result of the Company’s commitment to accelerating the frequency of its product releases. There can be no assurance that errors will not be found in any new or enhanced products after commencement of commercial shipments. Certain of these products require a higher level of sales and support expertise. The ability of the Company’s sales channel, particularly the indirect channel, to obtain this expertise and to sell the new product offerings effectively could have an adverse impact on the Company’s sales in future periods. Any of these problems may result in the loss of or delay in customer acceptance, diversion of development resources, damage to the Company’s reputation or increased service and warranty costs, any of which could have a material, adverse effect on the Company’s business, financial position, results of operations and cash flows.
Dependence on Channel Partners. The Company continues to distribute a meaningful portion of its products through its global network of independent, regional channel partners. The channel partners sell the Company’s software products to new and existing customers, expand installations within the existing customer base, offer consulting services and provide the first line of technical support. Consequently, in certain geographies, the Company is highly dependent upon the efforts of the channel partners. Difficulties in ongoing relationships with channel partners, such as failure to meet performance criteria or to promote the Company’s products as aggressively as the Company expects, and differences in the handling of customer relationships could adversely affect the Company’s performance. Additionally, the loss of any major channel partner for any reason, including a channel partner’s decision to sell competing products rather than the Company’s products, could have a material, adverse effect on the Company. Moreover, the Company’s future success will depend substantially on the ability and willingness of its channel partners to continue to dedicate the resources necessary to promote the Company’s portfolio of products and to support a larger installed base of the Company’s products. If the channel partners are unable or unwilling to do so, the Company may be unable to sustain revenue growth.
During times of significant fluctuations in world currencies, certain channel partners may have solvency issues to the extent that effective hedge transactions are not employed or there is not sufficient working capital. In particular, if the U.S. Dollar strengthens relative to other currencies, certain channel partners who pay the Company in U.S. Dollars may have trouble paying the Company on time or may have trouble distributing the Company’s products due to the impact of the currency exchange fluctuation on such channel partner’s cash flows. This may impact the Company’s ability to distribute its products into certain regions and markets, and may have an adverse effect on the Company’s results of operations and cash flows.
13
Table of Contents
Competition. The Company continues to experience intense competition across all markets for its products and services. Some of the Company’s current and possible future competitors have greater financial, technical, marketing and other resources than the Company, and some have well established relationships with current and potential customers of the Company. The Company’s current and possible future competitors also include firms that have or may in the future elect to compete by means of open source licensing. These competitive pressures may result in decreased sales volumes, price reductions and/or increased operating costs, and could result in lower revenues, margins and net income.
Dependence on Senior Management and Key Technical Personnel. The Company’s success depends upon the continued services of the Company’s senior executives, key technical employees and other employees. Each of the Company’s executive officers, key technical personnel and other employees could terminate his or her relationship with the Company at any time. The loss of any of the Company’s senior executives might significantly delay or prevent the achievement of the Company’s business objectives and could materially harm the Company’s business and customer relationships. In addition, because of the highly technical nature of the Company’s products, the loss of any significant number of existing engineering and development personnel could have a material, adverse effect on the Company’s business and operating results.
Dependence on Proprietary Technology. The Company’s success is highly dependent upon its proprietary technology. The Company generally relies on contracts and the laws of copyright and trade secrets to protect its technology. The Company maintains a trade secrets program, enters into confidentiality agreements with its employees and channel partners, and limits access to and distribution of its software, documentation and other proprietary information. There can be no assurance that the steps taken by the Company to protect its proprietary technology will be adequate to prevent misappropriation of its technology by third parties, or that third parties will not be able to develop similar technology independently. Although the Company is not aware that any of its technology infringes upon the rights of third parties, there can be no assurance that other parties will not assert technology infringement claims against the Company or that, if asserted, such claims will not prevail.
Reliance on Perpetual Licenses. Although the Company has historically maintained stable recurring revenue from the sale of software lease licenses, software maintenance subscriptions and third party royalties, it also has relied on sales of perpetual licenses that involve payment of a single, up-front fee and that are more typical in the computer software industry. Additionally, the acquisition of Ansoft resulted in an increase in the Company’s perpetual license revenue as compared to its total revenue. While revenue generated from software lease licenses, software maintenance subscriptions and third party royalties currently represents a portion of the Company’s revenue, to the extent that perpetual license revenue continues to represent a significant percentage of total revenue, the Company’s revenue in any period will depend increasingly on sales completed during that period.
Risks Associated with Acquisitions. Historically, the Company has consummated acquisitions in order to support the Company’s long-term strategic direction, accelerate innovation, provide increased capabilities to its existing products, supply new products and services, expand its customer base and enhance its distribution channels. In the future, the Company may not be able to identify suitable acquisition candidates or, if suitable candidates are identified, the Company may not be able to complete the business combination on commercially acceptable terms. The process of exploring and pursuing acquisition opportunities may result in devotion of significant management and financial resources.
Even if the Company is able to consummate acquisitions that it believes will be successful, such transactions present many risks. Significant risks to such acquisitions include, among others: failing to achieve anticipated synergies and revenue increases; difficulty incorporating and integrating the acquired technologies or products with the Company’s existing product lines; difficulty in coordinating, establishing or expanding sales, distribution and marketing functions, as necessary; disruption of the Company’s ongoing business and diversion of management’s attention to transition or integration issues; unanticipated and unknown liabilities; the loss of key employees, customers, partners and channel partners of the Company or of the acquired company; and
14
Table of Contents
difficulties implementing and maintaining sufficient controls, policies and procedures over the systems, products and processes of the acquired company. If the Company does not achieve the anticipated benefits of its acquisitions as rapidly or to the extent anticipated by the Company’s management and financial or industry analysts, or if others do not perceive the same benefits of the acquisition as the Company, there could be a material, adverse effect on the Company’s business, financial position, results of operations or cash flows.
In addition, for companies acquired, limited experience will exist for several quarters following the acquisition relating to how the acquired company’s sales pipelines will convert into sales or revenues and the conversion rate post-acquisition may be quite different than the historical conversion rate. Because a substantial portion of the Company’s sales are completed in the latter part of a quarter, and its cost structure is largely fixed in the short term, revenue shortfalls may have a negative impact on the Company’s profitability. A delay in a small number of large new software license transactions could cause the Company’s quarterly software license revenues to fall significantly short of its predictions.
Disruption of Operations or Infrastructure Failures. A significant portion of the Company’s software development personnel, source code and computer equipment is located at operating facilities in the United States, Canada, India and throughout Europe. The occurrence of a natural disaster or other unforeseen catastrophe at any of these facilities could cause interruptions in the Company’s operations, services and product development activities. Additionally, if the Company experiences problems that impair its business infrastructure, such as a computer virus, telephone system failure or an intentional disruption of its information technology systems by a third party, these interruptions could have a material, adverse effect on the Company’s business, financial position, results of operations, cash flows and the ability to meet financial reporting timelines. Further, because the Company’s sales are not generally linear during any quarterly period, the potential adverse effects resulting from any of the events described above or any other disruption of the Company’s business could be accentuated if it occurs close to the end of a fiscal quarter.
Sales Forecasts. The Company makes many operational and strategic decisions based upon short- and long-term sales forecasts. The Company’s sales personnel continually monitor the status of all proposals, including the estimated closing date and the value of the sale, in order to forecast quarterly sales. These forecasts are subject to significant estimation and are impacted by many external factors, including global economic conditions and the performance of the Company’s customers. A variation in actual sales activity from that forecasted could cause the Company to plan or to budget incorrectly and, therefore, could adversely affect the Company’s business, financial position, results of operations and cash flows. The Company’s management team forecasts macroeconomic trends and developments, and integrates them through long-range planning into budgets, research and development strategies and a wide variety of general management duties. The current global economic conditions, and the effect those conditions and the related disruptions in global credit markets have on the Company’s customers, may have a significant impact on the accuracy of the Company’s sales forecasts. These conditions may increase the likelihood or the magnitude of variations between actual sales activity and the Company’s sales forecasts and, as a result, the Company’s performance may be hindered because of a failure to properly match corporate strategy with economic conditions. This, in turn, may adversely affect the Company’s business, financial position, results of operations and cash flows.
Income Tax Estimates. The Company makes significant estimates in determining its worldwide income tax provision. These estimates involve complex tax regulations in a number of jurisdictions across the Company’s global operations and are subject to many transactions and calculations in which the ultimate tax outcome is uncertain. The final outcome of tax matters could be different than the estimates reflected in the historical income tax provision and related accruals. Such differences could have a material impact on income tax expense and net income in the periods in which such determinations are made.
The amount of income tax paid by the Company is subject to ongoing audits by federal, state and foreign tax authorities. These audits often result in proposed assessments. The Company’s estimate for liabilities associated with uncertain tax positions is highly judgmental and actual future results may result in favorable or unfavorable
15
Table of Contents
adjustments to the Company’s estimated tax liabilities, including estimates for uncertain tax positions, in the period the assessments are made or resolved, audits are closed or when statutes of limitations on potential assessments expire. As a result, the Company’s effective tax rate may fluctuate significantly on a quarterly basis.
Recently, the Internal Revenue Service announced its intention to require taxpayers with assets over $10.0 million and financial statements prepared under income tax accounting guidance, to disclose information with respect to uncertain tax positions. The proposed disclosure would require a concise description of each uncertain position, as well as the maximum potential federal tax liability attributable to each uncertain tax position. If the new disclosure requirement is implemented, it is anticipated that it will apply to 2010 tax returns.
The Company allocates a portion of its purchase price to goodwill and intangible assets. Impairment charges associated with goodwill are generally not tax deductible and will result in an increased effective income tax rate in the period the impairment is recorded. The Company has recorded significant deferred tax liabilities related to acquired intangible assets that are not deductible for tax purposes. These deferred tax liabilities are based on future statutory tax rates in the locations in which the intangible assets are recorded. Any future changes in statutory tax rates would be recorded as an adjustment to the deferred tax liabilities in the period the change is announced, and could have a material impact on the Company’s effective tax rate during that period.
Periodic Reorganization of Sales Force. The Company relies heavily on its direct sales force. From time to time, the Company reorganizes and makes adjustments to its sales force in response to such factors as management changes, performance issues, market opportunities and other considerations. These changes may result in a temporary lack of sales production and may adversely impact revenue in future quarters. There can be no assurance that the Company will not restructure its sales force in future periods or that the transition issues associated with such a restructuring will not recur.
Regulatory Compliance. Like all other public companies, the Company is subject to the rules and regulations of the Securities and Exchange Commission (“SEC”), including those that require the Company to report on and receive an attestation from its independent registered public accounting firm regarding the Company’s internal control over financial reporting. Compliance with these requirements causes the Company to incur additional expenses and causes management to divert time from the day-to-day operations of the Company. While the Company anticipates being able to fully comply with these requirements, if it is not able to comply with the Sarbanes-Oxley reporting or attestation requirements relating to internal control over financial reporting, the Company may be subject to sanctions by the SEC or NASDAQ. Such sanctions could divert the attention of the Company’s management from implementing its business plan and could have an adverse effect on the Company’s business and results of operations.
As the Company’s stock is listed on the NASDAQ Global Select Market, the Company is subject to the ongoing financial and corporate governance requirements of NASDAQ. While the Company anticipates being able to fully comply with these requirements, if it is not able to comply, the Company’s name may be published on NASDAQ’s daily Non-Compliant Companies list until NASDAQ determines that it has regained compliance or the Company no longer trades on NASDAQ. If the Company were unable to return to compliance with the governance requirements of NASDAQ, the Company may be delisted from the NASDAQ Global Select Market, which could have an adverse effect on the Company’s ability to raise additional capital.
Governmental Revenue Sources. The Company’s sales to the United States government must comply with the regulations set forth in the Federal Acquisition Regulations. Failure to comply with these regulations could result in penalties being assessed against the Company or an order preventing the Company from making future sales to the United States government. Further, the Company’s international activities must comply with the export control laws of the United States, the Foreign Corrupt Practices Act and a variety of other laws and regulations of the United States and other countries in which the Company operates. Failure to comply with any of these laws and regulations could adversely affect the Company’s business, financial position, results of operations and cash flows.
16
Table of Contents
In certain circumstances, the United States government, state and local governments and their respective agencies, and certain foreign governments may have the right to terminate these engagements at any time, without cause. The United States, European Union and certain other government contracts, as well as the Company’s state and local level contracts, are subject to the approval of appropriations or funding authorizations. Certain of these contracts permit the imposition of various civil and criminal penalties and administrative sanctions, including, but not limited to, termination of contracts, refund of a portion of fees received, forfeiture of profits, suspension of payments, fines and suspensions or debarment from future government business, any of which could have an adverse effect on the Company’s results of operations and cash flows.
Risks Associated with Significant Sales to Existing Customers. A significant portion of the Company’s sales include follow-on sales to existing customers that invest in the Company’s broad suite of engineering simulation software and services. If a significant number of current customers were to become dissatisfied with the Company’s products and services, or choose to license or utilize competitive offerings, the Company’s follow-on sales, and recurring lease and maintenance revenues, could be materially, adversely impacted, resulting in reduced revenue, operating margins, net income and cash flows.
Contingencies. The Company is involved in various investigations, claims and legal proceedings from time to time that arise in the ordinary course of its business activities, including alleged infringement of intellectual property rights, commercial disputes, employment matters, tax audits and other matters. Each of these matters is subject to various uncertainties, and it is possible that an unfavorable resolution of one or more of these matters could in the future materially affect the Company’s results of operations, cash flows or financial position.
Changes in Existing Financial Accounting Standards or Taxation Rules. Changes in existing accounting or taxation rules or practices, new accounting pronouncements or taxation rules, or varying interpretations of current accounting pronouncements or taxation practices could have a significant, adverse effect on the Company’s results of operations or the manner in which the Company conducts its business.
Changes in the Company’s Pricing Models. The intense competition the Company faces in the sales of its products and services and general economic and business conditions can put pressure on the Company to adjust its prices. If Company’s competitors offer deep discounts on certain products or services or develop products that the marketplace considers more valuable, the Company may need to lower prices or offer other favorable terms in order to compete successfully. Any such changes may reduce margins and could adversely affect operating results. The Company’s software license updates and product support fees are generally priced as a percentage of its net new software license fees. The Company’s competitors may offer lower percentage pricing on product updates and support, which could put pressure on the Company to further discount its new license prices.
Any broad-based change to the Company’s prices and pricing policies could cause new software license and service revenues to decline or be delayed as its sales force implements and its customers adjust to the new pricing policies. Some of the Company’s competitors may bundle software products for promotional purposes or as a long-term pricing strategy or provide guarantees of prices and product implementations. These practices could, over time, significantly constrain the prices that the Company can charge for certain of its products. If the Company does not adapt its pricing models to reflect changes in customer use of its products or changes in customer demand, the Company’s new software license revenues could decrease. Additionally, increased distribution of applications through application service providers, including software-as-a-service providers, may reduce the average price for the Company’s products or adversely affect other sales of the Company’s products, reducing new software license revenues unless the Company can offset price reductions with volume increases. The increase in open source software distribution may also cause the Company to adjust its pricing models.
Renewal Rates for Annual Lease and Maintenance Contracts. A substantial portion of the Company’s license and maintenance revenue is derived from annual lease and maintenance contracts. These contracts are generally renewed on an annual basis and typically have a high rate of customer renewal. In addition to the recurring revenue base associated with these contracts, a majority of customers purchasing new perpetual
17
Table of Contents
licenses also purchase related annual maintenance contracts. If the rate of renewal for these contracts is adversely affected by economic or other factors, the Company’s license and maintenance growth will be adversely affected over the term that the revenue for those contracts would have otherwise been recognized. As a result, the Company’s business, financial position, results of operations and cash flows may also be adversely impacted during those periods.
| ITEM 1B: | UNRESOLVED STAFF COMMENTS |
The Company has received no written comments regarding our periodic or current reports from the staff of the SEC that were issued 180 days or more preceding the end of our fiscal year 2009 and that remain unresolved.
| ITEM 2: | PROPERTIES |
The Company’s executive offices and those related to certain domestic product development, marketing, production and administration are located in a 107,000 square foot office facility in Canonsburg, Pennsylvania. In May 2004, the Company entered into the first amendment to its existing lease agreement, effective January 1, 2004. The lease was extended from its original period to a period through 2014, with an option to extend through 2019.
As part of the acquisition of Ansoft on July 31, 2008, the Company acquired certain leased office property, including executive offices, which comprise a 28,000 square foot office facility in Pittsburgh, Pennsylvania. In August 2009, the Company’s Ansoft U.S. subsidiary extended the executive office space lease agreement for a period of approximately three years and ten months, commencing February 15, 2011 and expiring December 31, 2014. Total required minimum payments under the operating lease will be $570,000 for each of the years 2011 through 2014.
As part of the acquisition of Fluent Inc. (“Fluent”) on May 1, 2006, the Company acquired certain office property, including executive offices, which comprise a 94,000 square foot office facility in Lebanon, New Hampshire. In addition, the Company acquired a 40,000 square foot facility in Pune, India. This facility supports worldwide product development, marketing and sales activities.
The Company and its subsidiaries also lease office space in various locations throughout the world. The Company owns substantially all equipment used in its facilities. Management believes that its facilities allow for sufficient space to support not only its present needs, but also allow for expansion and growth as the business may require in the foreseeable future.
In the opinion of management, the Company’s properties and its equipment are in good operating condition and are adequate for the Company’s current needs. The Company does not anticipate difficulty in renewing existing leases as they expire or in finding alternative facilities.
| ITEM 3: | LEGAL PROCEEDINGS |
The Company is subject to various legal proceedings from time to time that arise in the ordinary course of business, including alleged infringement of intellectual property rights, commercial disputes, employment matters, tax audits and other matters. In the opinion of the Company, the resolution of pending matters is not expected to have a material, adverse effect on the Company’s consolidated results of operations, cash flows or financial position. However, each of these matters is subject to various uncertainties and it is possible that an unfavorable resolution of one or more of these proceedings could in the future materially affect the Company’s results of operations, cash flows or financial position.
18
Table of Contents
| ITEM 4: | SUBMISSION OF MATTERS TO A VOTE OF SECURITY HOLDERS |
No matters were submitted to a vote of security holders during the fourth quarter of fiscal year 2009.
| ITEM 5: | MARKET FOR REGISTRANT’S COMMON EQUITY, RELATED STOCKHOLDER MATTERS AND ISSUER PURCHASES OF EQUITY SECURITIES |
Market Information
The Company’s common stock trades on the NASDAQ Global Select Market tier of the NASDAQ Stock Market under the symbol: “ANSS.” The following table sets forth the low and high sale price of the Company’s common stock in each of the Company’s last eight fiscal quarters.
| Fiscal Quarter Ended 2009 | Fiscal Quarter Ended 2008 | |||||||||||
| Low Sale Price |
High Sale Price |
Low Sale Price |
High Sale Price | |||||||||
| December 31 |
$ | 36.21 | $ | 43.94 | $ | 20.55 | $ | 37.70 | ||||
| September 30 |
$ | 28.28 | $ | 38.92 | $ | 31.00 | $ | 49.56 | ||||
| June 30 |
$ | 24.61 | $ | 33.53 | $ | 35.23 | $ | 49.86 | ||||
| March 31 |
$ | 18.00 | $ | 29.69 | $ | 31.26 | $ | 41.60 | ||||
On February 12, 2010, there were 263 stockholders of record and approximately 70,290 beneficial holders of the Company’s common stock.
The Company has not paid cash dividends on its common stock as it has retained earnings for use in its business. The Company reviews its policy with respect to the payment of dividends from time to time; however, there can be no assurance that any dividends will be paid in the future.
19
Table of Contents
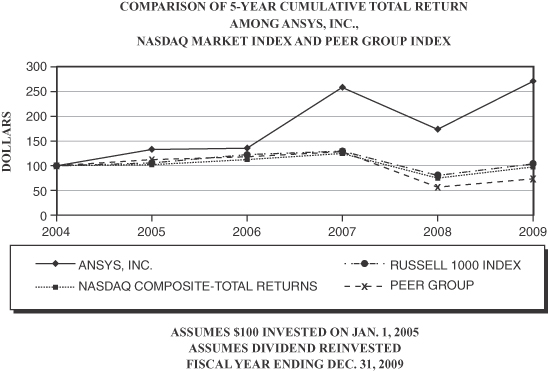
Performance Graph
Set forth below is a line graph comparing the yearly percentage change in the cumulative total stockholder return on the Company’s common stock, based on the market price of the Company’s common stock, with the total return of companies included within the Russell 1000 Index, the NASDAQ Composite Stock Market Index and a peer group of four companies (Autodesk, Inc., Parametric Technology Corporation, Cadence Design Systems, Inc. and Synopsys, Inc.) selected by the Company, for the period commencing December 31, 2004 and ending December 31, 2009. The calculation of total cumulative returns assumes a $100 investment in the Company’s common stock, the Russell 1000 Index, the NASDAQ Composite Stock Market Index and the Peer Group Index on January 1, 2005, and the reinvestment of all dividends, and accounts for all stock splits. The historical information set forth below is not necessarily indicative of future performance.
20
Table of Contents
Equity Compensation Plan Information as of December 31, 2009
| (a) | (b) | (c) | |||||
| Plan Category |
Number of Securities to Be Issued Upon Exercise of Outstanding Options, Warrants and Rights |
Weighted Average Exercise Price of Outstanding Options, Warrants and Rights |
Number of Securities Remaining Available for Future Issuance Under Equity Compensation Plans (excluding securities reflected in column (a)) | ||||
| Equity Compensation Plans Approved By |
|||||||
| 1996 Stock Option and Grant Plan |
7,079,417 | $ | 23.20 | 3,852,678 | |||
| Ansoft Corporation 2006 Stock Incentive Plan |
1,067,853 | $ | 20.40 | 438,334 | |||
| 1996 Employee Stock Purchase Plan |
(1) | (2) | 513,014 | ||||
| Equity Compensation Plans Not Approved By Security Holders |
|||||||
| None |
|||||||
| Total |
8,147,270 | 4,804,026 | |||||
| (1) | The number of shares issuable with respect to the current offering period is not determinable until the end of the period. |
| (2) | The per share purchase price of shares issuable with respect to the current offering period is not determinable until the end of the offering period. |
Unregistered Sale of Equity Securities and Use of Proceeds
None.
Issuer Purchases of Equity Securities
None.
21
Table of Contents
| ITEM 6: | SELECTED FINANCIAL DATA |
The following table sets forth selected financial data as of and for the last five years. This selected financial data should be read in conjunction with the consolidated financial statements and related notes included in Part IV, Item 15 of this Annual Report on Form 10-K. The results of acquired companies have been included in the consolidated financial statements since their respective dates of acquisition.
| Year Ended December 31, | |||||||||||||||
| (in thousands, except per share data) |
2009* | 2008* | 2007* | 2006* | 2005 | ||||||||||
| Total revenue |
$ | 516,885 | $ | 478,339 | $ | 385,340 | $ | 263,640 | $ | 158,036 | |||||
| Operating income |
183,477 | 169,731 | 126,769 | 36,156 | 58,840 | ||||||||||
| Net income |
116,391 | 111,671 | 82,392 | 14,156 | 43,903 | ||||||||||
| Earnings per share—basic |
$ | 1.32 | $ | 1.35 | $ | 1.06 | $ | 0.19 | $ | 0.69 | |||||
| Weighted average shares—basic |
88,486 | 82,975 | 77,792 | 72,686 | 63,498 | ||||||||||
| Earnings per share—diluted |
$ | 1.27 | $ | 1.29 | $ | 1.02 | $ | 0.19 | $ | 0.65 | |||||
| Weighted average shares—diluted |
91,785 | 86,768 | 81,135 | 76,398 | 67,384 | ||||||||||
| Total assets |
$ | 1,920,182 | $ | 1,864,514 | $ | 969,292 | $ | 902,696 | $ | 305,509 | |||||
| Working capital |
248,724 | 129,489 | 109,302 | 36,406 | 167,892 | ||||||||||
| Long-term liabilities |
340,785 | 413,951 | 132,215 | 188,365 | 4,062 | ||||||||||
| Stockholders’ equity |
1,312,631 | 1,182,899 | 641,210 | 534,793 | 224,977 | ||||||||||
| Cash provided by operating activities |
173,689 | 196,708 | 127,128 | 89,697 | 67,825 | ||||||||||
| * | The amounts reflected for 2009, 2008, 2007 and 2006, and the related comparability to other years presented, were significantly impacted by the July 31, 2008 acquisition of Ansoft and the May 1, 2006 acquisition of Fluent. See further information on Ansoft within the “Acquisitions” section of Management’s Discussion and Analysis in Item 7 and in Note 3 to the consolidated financial statements included in Part IV, Item 15 of this Annual Report on Form 10-K. |
22
Table of Contents
| ITEM 7: | MANAGEMENT’S DISCUSSION AND ANALYSIS OF FINANCIAL CONDITION AND RESULTS OF OPERATIONS |
Overview
ANSYS, Inc.’s (hereafter the “Company” or “ANSYS”) results for the year ended December 31, 2009 reflect a revenue increase of 8.1% as compared to the year ended December 31, 2008, and basic and diluted earnings per share of $1.32 and $1.27, respectively. These results were significantly impacted by the July 2008 acquisition of Ansoft. The Company experienced higher revenues in 2009 from both the Ansoft acquisition and from maintenance growth in the Company’s other products. These increases were partially offset by a decline in perpetual software license revenue and service revenue, and an adverse impact on revenue from foreign currency fluctuations. The revenue contribution from the Ansoft business was lower for the year ended December 31, 2009 than the Company had expected at the time of the acquisition. As compared to the Company’s non-Ansoft business, the Ansoft business derives a higher percentage of its revenue from sales of perpetual licenses. Accordingly, there tends to be higher volatility with respect to Ansoft’s revenue performance in any quarter than for the non-Ansoft component of the Company’s business, which has a higher percentage of lease and maintenance revenue. The unfavorable state of the global economy during the year ended December 31, 2009 adversely affected the Company’s Ansoft revenues more significantly than the non-Ansoft revenues, contributing significantly to the revenue underperformance as compared to the Company’s expectations.
In 2009, the Company incurred increased operating expenses associated with the Ansoft business, which was not acquired by the Company until the third quarter of 2008, and decreased non-Ansoft operating expenses, including salaries, incentive compensation, and headcount-related costs. Incentive compensation was lower in 2009 due to a reduction in the Company’s relative performance against internal sales and operating plan as compared to the 2008 performance. The decrease in salaries and headcount-related costs was a result of the decision by the Company to reduce its global workforce by approximately 6% as part of the Company’s ongoing effort to manage expenses and its overall cost structure. The cost reductions were partially offset by $3.7 million in severance costs of which $2.8 million was paid in 2009.
Also, in connection with the acquisition of Ansoft on July 31, 2008, the Company borrowed $355.0 million and incurred interest expense, including expenses associated with an interest rate swap agreement and loan amortization costs, during the years ended December 31, 2009 and 2008 of $10.1 million and $9.3 million, respectively. As of December 31, 2009 and 2008, remaining outstanding borrowings totaled $225.1 million and $279.0 million, respectively.
During March 2009, the Company repurchased 2.1 million shares of treasury stock for $39.9 million. The Company’s financial position includes $343.8 million in cash and short-term investments, and working capital of $248.7 million as of December 31, 2009.
ANSYS develops and globally markets engineering simulation software and services widely used by engineers and designers across a broad spectrum of industries, including aerospace, automotive, manufacturing, electronics, biomedical, energy and defense. Headquartered at Southpointe in Canonsburg, Pennsylvania, the Company and its subsidiaries employ approximately 1,600 people as of December 31, 2009 and focus on the development of open and flexible solutions that enable users to analyze designs directly on the desktop, providing a common platform for fast, efficient and cost-conscious product development, from design concept to final-stage testing and validation. The Company distributes its simulation technologies through a global network of independent channel partners and direct sales offices in strategic, global locations. It is the Company’s intention to continue to maintain this mixed sales and distribution model.
The Company licenses its technology to businesses, educational institutions and governmental agencies. Growth in the Company’s revenue is affected by the strength of global economies, general business conditions, currency exchange rate fluctuations, customer budgetary constraints and the competitive position of the Company’s products. Please see the sub-sections entitled “Adverse Conditions in the Global Economy and
23
Table of Contents
Disruption in Financial Markets,” “Decline in Customers’ Business” and “Risks Associated with International Activities” under Item 1A—Risk Factors above for a complete discussion of how these factors might impact the Company’s financial condition and operating results. The Company believes that the features, functionality and integrated multiphysics capabilities of its software products are as strong as they have ever been. However, the software business is generally characterized by long sales cycles. These long sales cycles increase the difficulty of predicting sales for any particular quarter. The Company makes many operational and strategic decisions based upon short- and long-term sales forecasts, which are impacted not only by these long sales cycles but by current global economic conditions. As a result, the Company believes that its overall performance is best measured by fiscal year results rather than by quarterly results. Please see the sub-section entitled “Sales Forecasts” under Item 1A—Risk Factors above for a complete discussion of the potential impact of the Company’s sales forecasts on the Company’s financial condition and operating results.
The Company’s management considers the intense competition and price pressure that it faces in the short- and long-term by focusing on expanding the breadth, depth, ease of use and quality of the technologies, features, functionality and integrated multiphysics capabilities of its software products as compared to its competitors, investing in research and development to develop new and innovative products and increase the capabilities of its existing products, supplying new products and services, focusing on customer needs, training, consultation and support, and enhancing its distribution channels. From time to time, the Company also considers acquisitions to supplement its global engineering talent, product offerings and distribution channels.
The following discussion should be read in conjunction with the audited consolidated financial statements and notes thereto included elsewhere in this Annual Report on Form 10-K. The Company’s discussion and analysis of its financial condition and results of operations are based upon the Company’s consolidated financial statements, which have been prepared in accordance with accounting principles generally accepted in the United States of America. The preparation of these financial statements requires the Company to make estimates and judgments that affect the reported amounts of assets, liabilities, revenues and expenses, and related disclosure of contingent assets and liabilities. On an ongoing basis, the Company evaluates its estimates, including those related to fair value of stock awards, bad debts, contract revenue, valuation of goodwill, valuation of intangible assets, income taxes, and contingencies and litigation. The Company bases its estimates on historical experience, market experience, estimated future cash flows and on various other assumptions that are believed to be reasonable under the circumstances, the results of which form the basis for making judgments about the carrying value of assets and liabilities that are not readily apparent from other sources. Actual results may differ from these estimates.
This Annual Report on Form 10-K contains forward-looking statements within the meaning of Section 27A of the Securities Act of 1933 and Section 21E of the Securities Exchange Act of 1934, including the following statements, as well as statements that contain such words as “anticipates,” “intends,” “believes,” “plans” and other similar expressions:
| • | The Company’s intentions related to investments in global sales and marketing, research and development, its global business infrastructure and in complementary companies, products, services and technologies. |
| • | Increased exposure to volatility of foreign exchange rates. |
| • | Exposure to changes in domestic and foreign tax regulations in future periods. |
| • | The Company’s plans related to future capital spending. |
| • | Statements regarding the Company’s expected effective tax rate. |
| • | The Company’s intentions regarding its mixed sales and distribution model. |
| • | The sufficiency of existing cash and cash equivalent balances to meet future working capital, capital expenditure and debt service requirements. |
24
Table of Contents
| • | The Company’s estimates regarding the effect that stock-based compensation will have on the financial results of the Company for fiscal year 2010. |
| • | Management’s assessment of the ultimate liabilities arising from various investigations, claims and legal proceedings. |
| • | The Company’s statements regarding the competitive position of its software products. |
| • | The Company’s statements regarding its short-term investments in the event an immediate cash need arises. |
| • | Management’s assessment of its ability to realize deferred tax assets. |
| • | The Company’s statements regarding the strength of its financial position. |
| • | The Company’s estimates regarding the impact of the purchase accounting adjustment to acquired Ansoft deferred revenue on the Company’s revenue. |
| • | The Company’s expectations regarding future claims related to indemnification obligations. |
| • | The Company’s estimates regarding expected interest expense on its term loan. |
| • | The Company’s statements regarding the impact of current global economic conditions. |
| • | The Company’s statements regarding increased exposure to volatility of foreign exchange rates and expectations regarding the impact of currency exchange rate fluctuations on revenue and operating income. |
| • | The Company’s expectations regarding the revenue growth rate of the non-Ansoft operations as compared to recent historical periods. |
| • | The Company’s statement regarding stock repurchases in future periods. |
Forward-looking statements should not be unduly relied upon because they involve known and unknown risks, uncertainties and other factors, some of which are beyond the Company’s control. The Company’s actual results could differ materially from those set forth in the forward-looking statements. Certain factors that might cause such a difference include risks and uncertainties detailed in Item 1A.
Acquisitions
On July 31, 2008, the Company completed its acquisition of Ansoft, a global provider of simulation software for high-performance electronic design. Under the terms of the merger agreement, Ansoft stockholders received $16.25 in cash and 0.431882 shares of ANSYS common stock for each outstanding Ansoft share held on July 31, 2008. ANSYS issued an aggregate of 12.24 million shares of its common stock, including 1.95 million shares pursuant to assumed stock options, valued at approximately $432.6 million based on the average closing market price on the two days preceding and the two days following the announcement of the acquisition, and paid approximately $387.3 million in cash. The total purchase price of approximately $823.8 million includes approximately $3.9 million in transaction fees. The Company used a combination of existing cash and proceeds from a $355.0 million unsecured senior term loan credit facility to fund the transaction. In addition to the $3.9 million in transaction-related costs, the Company incurred financing costs of approximately $4.6 million related to the credit facility.
The operating results of Ansoft have been included in the Company’s consolidated financial statements since the date of acquisition, July 31, 2008. The total purchase price was allocated to the foreign and domestic assets and liabilities of Ansoft based upon management’s estimates of the fair market values of the assets acquired and the liabilities assumed. The allocation included $235.2 million to identifiable intangible assets
25
Table of Contents
(including $98.4 million to developed software to be amortized over ten years, $97.4 million to customer contracts and related relationships to be amortized over 13 years, and $39.4 million to trademarks to be amortized over ten years) and $599.2 million to goodwill, which is not tax deductible.
In valuing deferred revenue on the Ansoft balance sheet as of the acquisition date, the Company applied the fair value provisions applicable to the accounting for business combinations. Although this purchase accounting requirement had no impact on the Company’s business or cash flow, the Company’s reported revenue under accounting principles generally accepted in the United States, primarily for the first 12 months post-acquisition, was less than the sum of what would otherwise have been reported by Ansoft and ANSYS absent the acquisition.
Acquired deferred revenue of $7.5 million was recorded on the Ansoft opening balance sheet. This amount was approximately $23.5 million lower than the historical carrying value. The impact on reported revenue for the year ended December 31, 2009 was $1.1 million for lease license revenue and $7.0 million for maintenance revenue. The impact on reported revenue for the year ended December 31, 2008 was $1.7 million for lease license revenue and $13.0 million for maintenance revenue. The expected impact on reported revenue for the year ending December 31, 2010 is approximately $360,000.
Results of Operations
The operating results of Ansoft have been included in the results of operations since the acquisition date of July 31, 2008.
For purposes of the following discussion and analysis, the table below sets forth certain consolidated financial data for the years 2009, 2008 and 2007.
| Year Ended December 31, | ||||||||||||
| (in thousands, except per share data) |
2009 | 2008 | 2007 | |||||||||
| Revenue: |
||||||||||||
| Software licenses |
$ | 315,633 | $ | 318,154 | $ | 253,287 | ||||||
| Maintenance and service |
201,252 | 160,185 | 132,053 | |||||||||
| Total revenue |
516,885 | 478,339 | 385,340 | |||||||||
| Cost of sales: |
||||||||||||
| Software licenses |
10,210 | 9,766 | 9,113 | |||||||||
| Amortization |
36,011 | 27,803 | 21,532 | |||||||||
| Maintenance and service |
50,021 | 53,845 | 47,402 | |||||||||
| Restructuring charges |
994 | — | — | |||||||||
| Total cost of sales |
97,236 | 91,414 | 78,047 | |||||||||
| Gross profit |
419,649 | 386,925 | 307,293 | |||||||||
| Operating expenses: |
||||||||||||
| Selling, general and administrative |
137,264 | 134,887 | 115,108 | |||||||||
| Research and development |
79,856 | 71,594 | 56,481 | |||||||||
| Amortization |
16,326 | 10,713 | 8,935 | |||||||||
| Restructuring charges |
2,726 | — | — | |||||||||
| Total operating expenses |
236,172 | 217,194 | 180,524 | |||||||||
| Operating income |
183,477 | 169,731 | 126,769 | |||||||||
| Interest expense |
(10,401 | ) | (9,342 | ) | (6,822 | ) | ||||||
| Interest income |
1,740 | 5,575 | 4,916 | |||||||||
| Other (expense) income, net |
(1,287 | ) | 727 | (600 | ) | |||||||
| Income before income tax provision |
173,529 | 166,691 | 124,263 | |||||||||
| Income tax provision |
57,138 | 55,020 | 41,871 | |||||||||
| Net income |
$ | 116,391 | $ | 111,671 | $ | 82,392 | ||||||
26
Table of Contents
Year Ended December 31, 2009 Compared to Year Ended December 31, 2008
Revenue:
| Year Ended December 31, | Change | ||||||||||||
| (in thousands, except percentages) |
2009 | 2008 | Amount | % | |||||||||
| Revenue: |
|||||||||||||
| Lease licenses |
$ | 181,105 | $ | 177,427 | $ | 3,678 | 2.1 | ||||||
| Perpetual licenses |
134,528 | 140,727 | (6,199 | ) | (4.4 | ) | |||||||
| Software licenses |
315,633 | 318,154 | (2,521 | ) | (0.8 | ) | |||||||
| Maintenance |
182,786 | 135,773 | 47,013 | 34.6 | |||||||||
| Service |
18,466 | 24,412 | (5,946 | ) | (24.4 | ) | |||||||
| Maintenance and service |
201,252 | 160,185 | 41,067 | 25.6 | |||||||||
| Total revenue |
$ | 516,885 | $ | 478,339 | $ | 38,546 | 8.1 | ||||||
The Company’s increase in lease license revenue was more than offset by a decline in perpetual license sales. The decline in perpetual licenses sales was primarily driven by certain macroeconomic factors as discussed further below. The Company’s license revenue included Ansoft operations for a full year in 2009 of $39.1 million as compared to five months in 2008 of $21.1 million.
The increase in maintenance revenue was primarily the result of annual maintenance subscriptions sold in connection with new perpetual license sales in recent quarters, as well as the impact of Ansoft operations for a full year in 2009 of $44.1 million as compared to five months in 2008 of $8.4 million.
The decrease in service revenue was primarily the result of reduced revenue from engineering consulting services, as well as a reduction of $700,000 related to the Company’s 2008 biennial users’ conference.
With respect to revenue, on average for the year ended December 31, 2009, the U.S. Dollar was approximately 3.7% stronger, when measured against the Company’s primary foreign currencies, than for the year ended December 31, 2008. The U.S. Dollar strengthened against the British Pound, Euro, Indian Rupee, Swedish Krona and the Canadian Dollar, while it weakened against the Japanese Yen, Korean Won, Taiwan Dollar and the Chinese Renminbi. The net overall strengthening resulted in decreased revenue and operating income during 2009, as compared with 2008, of approximately $10.3 million and $3.6 million, respectively.
A substantial portion of the Company’s license and maintenance revenue is derived from annual lease and maintenance contracts. These contracts are generally renewed on an annual basis and typically have a high rate of customer renewal. In addition to the recurring revenue base associated with these contracts, a majority of customers purchasing new perpetual licenses also purchase related annual maintenance contracts. As a result of the significant recurring revenue base, the Company’s license and maintenance revenue growth rate in any period does not necessarily correlate to the growth rate of new license and maintenance contracts sold during that period. To the extent the rate of customer renewal for lease and maintenance contracts is high, incremental lease contracts and maintenance contracts sold with new perpetual licenses will result in license and maintenance revenue growth. Conversely, if the rate of renewal for these contracts is adversely affected by economic or other factors, as was the case in 2009, the Company’s license and maintenance growth will be adversely affected over the term that the revenue for those contracts would have otherwise been recognized.
The Company’s revenue increased 8.1% in 2009. This revenue growth rate was influenced by the Company’s organic growth rate, incremental growth from the acquisition of Ansoft and the impact of currency exchange rate fluctuations. Although the Company’s overall revenue growth in 2009 benefited from the inclusion of a full year of Ansoft operations as compared to five months of Ansoft operations in 2008, the Company experienced a reduction in the perpetual license revenue of the non-Ansoft operations caused by the disruption in domestic and global economies and the net adverse impact of currency fluctuations. Reductions in the Company’s revenue growth rate adversely impacted the Company’s operating income, net income and earnings per share in 2009.
27
Table of Contents
International and domestic revenues, as a percentage of total revenue, were 66.7% and 33.3%, respectively, during the year ended December 31, 2009, and 68.3% and 31.7%, respectively, during the year ended December 31, 2008.
In valuing deferred revenue on the Ansoft balance sheet as of the acquisition date, the Company applied the fair value provisions applicable to the accounting for business combinations. Although this purchase accounting requirement had no impact on the Company’s business or cash flow, the Company’s reported revenue under accounting principles generally accepted in the United States, primarily for the first 12 months post-acquisition, was less than the sum of what would otherwise have been reported by Ansoft and ANSYS absent the acquisition.
Acquired deferred revenue of $7.5 million was recorded on the Ansoft opening balance sheet. This amount was approximately $23.5 million lower than the historical carrying value. The impact on reported revenue for the year ended December 31, 2009 was $1.1 million for lease license revenue and $7.0 million for maintenance revenue. The impact on reported revenue for the year ended December 31, 2008 was $1.7 million for lease license revenue and $13.0 million for maintenance revenue. The expected impact on reported revenue for the year ending December 31, 2010 is approximately $360,000.
Cost of Sales and Gross Profit:
| (in thousands, except percentages) |
Year Ended December 31, | Change | |||||||||||||||
| 2009 | 2008 | ||||||||||||||||
| Amount | % of Revenue |
Amount | % of Revenue |
Amount | % | ||||||||||||
| Cost of sales: |
|||||||||||||||||
| Software licenses |
$ | 10,210 | 2.0 | $ | 9,766 | 2.0 | $ | 444 | 4.5 | ||||||||
| Amortization |
36,011 | 7.0 | 27,803 | 5.8 | 8,208 | 29.5 | |||||||||||
| Maintenance and service |
50,021 | 9.7 | 53,845 | 11.3 | (3,824 | ) | (7.1 | ) | |||||||||
| Restructuring charges |
994 | 0.2 | — | — | 994 | — | |||||||||||
| Total cost of sales |
97,236 | 18.8 | 91,414 | 19.1 | 5,822 | 6.4 | |||||||||||
| Gross profit |
$ | 419,649 | 81.2 | $ | 386,925 | 80.9 | $ | 32,724 | 8.5 | ||||||||
The change in cost of sales is primarily due to the following:
| • | Increase in Ansoft-related costs of $10.2 million, including an additional $8.7 million in acquired software amortization expense, associated with a full year of Ansoft activity in the current year as compared to five months of activity in the prior year. |
| • | Decrease in salary and headcount-related costs, including incentive compensation, of $3.9 million. |
| • | Decrease of $3.4 million in amortization of acquired Fluent Inc. (“Fluent”) software and a decrease of $600,000 related to certain other acquired software intangibles becoming fully amortized in early 2008. This decrease was partially offset by a $3.6 million increase in amortization of certain trademarks, which were reconsidered in the third quarter of 2008 to have a finite useful life of ten years. During the third quarter of 2008, the Company reconsidered the indefinite lives associated with certain trademarks as part of the product and naming strategy changes that occurred as a result of the July 31, 2008 acquisition of Ansoft. The Company determined that such trademarks had a remaining useful life of ten years and, therefore, amortization of these intangible assets began July 31, 2008. |
| • | Restructuring charges of $994,000 associated with workforce reduction activities that related to the Company’s ongoing effort to manage expenses and cost structure. |
| • | Decrease in third party royalties of $400,000. |
The improvement in the gross profit was a result of the increase in revenue offset by a smaller increase in related cost of sales.
28
Table of Contents
Operating Expenses:
| (in thousands, except percentages) |
Year Ended December 31, | Change | |||||||||||||
| 2009 | 2008 | ||||||||||||||
| Amount | % of Revenue |
Amount | % of Revenue |
Amount | % | ||||||||||
| Operating expenses: |
|||||||||||||||
| Selling, general and administrative |
$ | 137,264 | 26.6 | $ | 134,887 | 28.2 | $ | 2,377 | 1.8 | ||||||
| Research and development |
79,856 | 15.4 | 71,594 | 15.0 | 8,262 | 11.5 | |||||||||
| Amortization |
16,326 | 3.2 | 10,713 | 2.2 | 5,613 | 52.4 | |||||||||
| Restructuring charges |
2,726 | 0.5 | — | — | 2,726 | — | |||||||||
| Total operating expenses |
$ | 236,172 | 45.7 | $ | 217,194 | 45.4 | $ | 18,978 | 8.7 | ||||||
Selling, General and Administrative: Ansoft-related selling, general and administrative costs increased $12.1 million, primarily the result of a full year of activity for the year ended December 31, 2009 as compared to five months of activity for the year ended December 31, 2008. Non-Ansoft expenses decreased by $9.7 million during the year ended December 31, 2009, primarily the result of decreased salary and headcount-related costs, including incentive compensation, of $5.0 million, decreased marketing, advertising and event costs of $2.4 million, decreased business travel expenses of $1.2 million and decreased consulting costs of $1.1 million.
The Company anticipates that it will continue to make targeted investments in its global sales and marketing organization and its global business infrastructure to enhance major account sales activities and to support its worldwide sales distribution and marketing strategies, and the business in general.
Research and Development: Ansoft-related research and development increased $10.5 million, primarily associated with a full year of activity for the year ended December 31, 2009 as compared to five months of activity for the year ended December 31, 2008. Non-Ansoft expenses decreased by $2.2 million during the year ended December 31, 2009, primarily the result of decreased incentive compensation costs of $1.9 million.
The Company has traditionally invested significant resources in research and development activities and intends to continue to make investments in this area, particularly as it relates to ongoing integration, evolution of its ANSYS Workbench platform and expanding capabilities within its broad portfolio of software technologies.
Amortization: Ansoft-related amortization expense increased $6.2 million for the year ended December 31, 2009 as compared to the prior year. The increase relates to a full year of amortization expense in 2009 associated with certain acquired intangible assets compared to five months of amortization in the 2008 period. This increase was partially offset by a $600,000 decrease in amortization of the Fluent customer list.
Restructuring Charges: The Company incurred operating restructuring charges of $2.7 million during the year ended December 31, 2009 associated with workforce reduction activities, which related to the Company’s ongoing effort to manage expenses and cost structure.
Interest Expense: The Company’s interest expense consists of the following:
| (in thousands) |
Year Ended December 31, |
||||||
| 2009 | 2008 | ||||||
| Bank interest on term loans |
$ | 4,865 | $ | 7,746 | |||
| Realized loss (gain) on interest rate swap agreement |
3,959 | (3 | ) | ||||
| Amortization of debt financing costs |
1,229 | 1,525 | |||||
| Other |
348 | 74 | |||||
| Total interest expense |
$ | 10,401 | $ | 9,342 | |||
29
Table of Contents
The increased interest costs shown above for the 2009 period are primarily a result of a higher average outstanding debt balance, partially offset by a lower weighted average effective interest rate of 3.41% as compared to 4.72% in the corresponding 2008 period. The decreased amortization costs are primarily a result of additional amortization expense recorded in 2008 associated with the early payoff of the 2006 term loan.
The Company’s interest rate swap agreement is utilized to hedge a portion of each of the first eight forecasted quarterly variable rate interest payments on the Company’s term loan. Under the swap agreement, the Company receives the variable, three-month LIBOR rate required under its term loan and pays a fixed LIBOR interest rate of 3.32% on the notional amount. This swap agreement resulted in additional interest expense during the year ended December 31, 2009 because the variable, three-month LIBOR rate was lower than the fixed LIBOR rate of 3.32% during each of the 2009 quarterly periods.
Interest Income: Interest income for the year ended December 31, 2009 was $1.7 million as compared to $5.6 million for the year ended December 31, 2008. Interest income decreased as a result of a significant decline in interest rates in the 2009 period as compared to the 2008 period, partially offset by additional interest income associated with an increase in invested cash balances.
Other (Expense) Income, net: The Company recorded other expense of $1.3 million during the year ended December 31, 2009 as compared to other income of $727,000 for the year ended December 31, 2008. The net change was primarily the result of foreign currency transaction gains and losses. As the Company’s presence in foreign locations continues to expand, the Company will have increased exposure to volatility of foreign exchange rates for the foreseeable future.
Income Tax Provision: The Company recorded income tax expense of $57.1 million and had income before income taxes of $173.5 million for the year ended December 31, 2009. This represents an effective tax rate of 32.9% for the year ended December 31, 2009. During the year ended December 31, 2008, the Company recorded income tax expense of $55.0 million and had income before income taxes of $166.7 million. The Company’s effective tax rate was 33.0% for the year ended December 31, 2008. The Company’s effective tax rate for the year ended December 31, 2009 was favorably impacted, when compared to the rate in the year ended December 31, 2008, by additional benefit related to domestic manufacturing activity. The Company also recorded tax benefits of $2.0 million during 2009 related to the favorable settlement of various outstanding ANSYS and Ansoft tax audits. During the third quarter of 2008, the Company filed its 2007 U.S. federal and state tax returns. In conjunction with the completion of these returns, the Company adjusted its estimate for 2007 taxes to reflect the actual results and recorded a net tax benefit of $1.2 million. The effect of this adjustment reduced the 2008 effective tax rate from 33.7% to 33.0%.
The effective tax rates, when compared to the federal and state combined statutory rate, are favorably impacted by lower statutory tax rates in many of the Company’s foreign jurisdictions, domestic manufacturing deductions and research and experimentation credits. These rates are also impacted by charges or benefits associated with the Company’s uncertain tax positions.
Net Income: The Company’s net income for the year ended December 31, 2009 was $116.4 million as compared to net income of $111.7 million for the year ended December 31, 2008. Diluted earnings per share was $1.27 for the year ended December 31, 2009 and $1.29 for the year ended December 31, 2008. The weighted average shares used in computing diluted earnings per share were 91.8 million and 86.8 million during the years ended December 31, 2009 and 2008, respectively.
30
Table of Contents
Year Ended December 31, 2008 Compared to Year Ended December 31, 2007
Revenue:
| Year Ended December 31, | Change | ||||||||||||
| (in thousands, except percentages) |
2008 | 2007 | Amount | % | |||||||||
| Revenue: |
|||||||||||||
| Lease licenses |
$ | 177,427 | $ | 150,554 | $ | 26,873 | 17.8 | ||||||
| Perpetual licenses |
140,727 | 102,733 | 37,994 | 37.0 | |||||||||
| Software licenses |
318,154 | 253,287 | 64,867 | 25.6 | |||||||||
| Maintenance |
135,773 | 104,939 | 30,834 | 29.4 | |||||||||
| Service |
24,412 | 27,114 | (2,702 | ) | (10.0 | ) | |||||||
| Maintenance and service |
160,185 | 132,053 | 28,132 | 21.3 | |||||||||
| Total revenue |
$ | 478,339 | $ | 385,340 | $ | 92,999 | 24.1 | ||||||
The increase in software license revenue was the result of overall growth in both lease and perpetual license sales, as well as the addition of Ansoft-related revenue of $21.1 million for the period from the acquisition (July 31, 2008) through December 31, 2008.
The increase in maintenance revenue was primarily the result of annual maintenance subscriptions sold in connection with new perpetual license sales in recent quarters and Ansoft-related maintenance revenue of $8.4 million for the period from the acquisition (July 31, 2008) through December 31, 2008.
The decrease in service revenue was primarily the result of reduced revenue from engineering consulting services. This decrease was partially offset by service revenue of $700,000 related to the Company’s 2008 biennial users’ conference.
With respect to revenue, on average, for the year ended December 31, 2008, the U.S. Dollar was approximately 2.8% weaker, when measured against the Company’s primary foreign currencies, than for the year ended December 31, 2007. The U.S. Dollar weakened against the Euro, Chinese Renminbi, Swedish Krona and the Japanese Yen, while it strengthened against the British Pound, Indian Rupee and Canadian Dollar. The net overall weakening throughout the year resulted in increased revenue and operating income during 2008, as compared with 2007, of approximately $5.5 million and $2.2 million, respectively.
International and domestic revenues, as a percentage of total revenue, were 68.3% and 31.7%, respectively, during the year ended December 31, 2008, and 65.8% and 34.2%, respectively, during the year ended December 31, 2007.
In accordance with the accounting requirements applicable to deferred revenue acquired in a business combination, acquired deferred revenue of $7.5 million was recorded on the Ansoft opening balance sheet. This amount was approximately $23.5 million lower than the historical carrying value. The impact on reported revenue for the year ended December 31, 2008 was $1.7 million for lease license revenue and $13.0 million for maintenance revenue.
Acquired deferred revenue of $31.5 million was recorded on the Fluent opening balance sheet. This amount was $20.1 million lower than the historical carrying value. The impact on reported revenue was $1.8 million for the year ended December 31, 2007; there was no significant impact for the year ended December 31, 2008.
31
Table of Contents
Cost of Sales and Gross Profit:
| (in thousands, except percentages) |
Year Ended December 31, | Change | |||||||||||||
| 2008 | 2007 | ||||||||||||||
| Amount | % of Revenue |
Amount | % of Revenue |
Amount | % | ||||||||||
| Cost of sales: |
|||||||||||||||
| Software licenses |
$ | 9,766 | 2.0 | $ | 9,113 | 2.4 | $ | 653 | 7.2 | ||||||
| Amortization |
27,803 | 5.8 | 21,532 | 5.6 | 6,271 | 29.1 | |||||||||
| Maintenance and service |
53,845 | 11.3 | 47,402 | 12.3 | 6,443 | 13.6 | |||||||||
| Total cost of sales |
91,414 | 19.1 | 78,047 | 20.3 | 13,367 | 17.1 | |||||||||
| Gross profit |
386,925 | 80.9 | 307,293 | 79.7 | 79,632 | 25.9 | |||||||||
The change in cost of sales is primarily due to the following:
| • | Ansoft-related total cost of sales was $7.8 million for the period from the acquisition (July 31, 2008) through December 31, 2008, including cost of goods sold of $1.0 million, amortization of $5.9 million and cost of services sold of $900,000. |
| • | Increase in salary and headcount-related costs, including incentive compensation, of $2.8 million. |
| • | Increase in amortization of $2.5 million on certain trademarks, which were reconsidered in the third quarter of 2008 to have a finite useful life of ten years. This increase was partially offset by certain acquired software intangibles associated with a 2003 acquisition becoming fully amortized in early 2008. |
| • | Increase in facilities and information technology maintenance costs of $700,000. |
The improvement in the gross profit was a result of the increase in revenue offset by a smaller increase in related cost of sales.
Operating Expenses:
| (in thousands, except percentages) |
Year Ended December 31, | Change | |||||||||||||
| 2008 | 2007 | ||||||||||||||
| Amount | % of Revenue |
Amount | % of Revenue |
Amount | % | ||||||||||
| Operating expenses: |
|||||||||||||||
| Selling, general and administrative |
$ | 134,887 | 28.2 | $ | 115,108 | 29.9 | $ | 19,779 | 17.2 | ||||||
| Research and development |
71,594 | 15.0 | 56,481 | 14.7 | 15,113 | 26.8 | |||||||||
| Amortization |
10,713 | 2.2 | 8,935 | 2.3 | 1,778 | 19.9 | |||||||||
| Total operating expenses |
217,194 | 45.4 | 180,524 | 46.8 | 36,670 | 20.3 | |||||||||
Selling, General and Administrative: Ansoft-related selling, general and administrative costs were $18.2 million for the period from the acquisition (July 31, 2008) through December 31, 2008. Non-Ansoft expenses increased by $1.6 million during the year ended December 31, 2008, which included increased stock-based compensation expenses of $1.7 million and increased salary costs of $1.4 million. In addition, third party commissions increased $1.0 million, and facilities and information technology maintenance costs increased $900,000 as compared to the year ended December 31, 2007. Partially offsetting these increases in selling, general, and administrative costs were decreases in tax compliance costs of $1.8 million and incentive compensation of $1.7 million.
Research and Development: Ansoft-related research and development costs were $7.4 million for the period from the acquisition (July 31, 2008) through December 31, 2008. Non-Ansoft expenses increased by
32
Table of Contents
$7.7 million during the year ended December 31, 2008, which included increased salary costs of $4.1 million. In addition, stock-based compensation expense and consulting fees increased by $900,000 and $800,000, respectively, as compared to the year ended December 31, 2007.
Amortization: Ansoft-related amortization expense was $2.1 million for the period from the acquisition (July 31, 2008) through December 31, 2008.
Interest Expense: The Company’s interest expense consists of the following:
| Year Ended December 31, | |||||||
| (in thousands) |
2008 | 2007 | |||||
| Bank interest on term loans |
$ | 7,746 | $ | 6,023 | |||
| Realized gain on interest rate swap agreement |
(3 | ) | — | ||||
| Amortization of debt financing costs |
1,525 | 504 | |||||
| Other |
74 | 295 | |||||
| Total interest expense |
$ | 9,342 | $ | 6,822 | |||
The interest expense and amortization on the term loans were as follows:
| Year Ended December 31, | ||||||||||||
| 2008 | 2007 | |||||||||||
| (in thousands) |
Interest Expense |
Amortization | Interest Expense |
Amortization | ||||||||
| May 1, 2006 term loan |
$ | 1,219 | $ | 952 | $ | 6,023 | $ | 504 | ||||
| July 31, 2008 term loan (interest expense includes $3 gain on interest rate swap) |
6,524 | 573 | — | — | ||||||||
| Total |
$ | 7,743 | $ | 1,525 | $ | 6,023 | $ | 504 | ||||
The increased interest costs shown above for the 2008 period are primarily a result of a higher average outstanding debt balance, partially offset by a lower weighted-average effective interest rate of 4.72% as compared to 5.85% in the 2007 period. The increased amortization costs shown above for 2008 are primarily a result of the early prepayment of the 2006 term loan, as well as the additional amortization related to the 2008 term loan.
Interest Income: Interest income for the year ended December 31, 2008 was $5.6 million as compared to $4.9 million for the year ended December 31, 2007. Interest income increased as a result of additional funds invested in the 2008 period as compared to the 2007 period.
Other Income (Expense), net: The Company recorded other income of $727,000 during the year ended December 31, 2008 as compared to other expense of $600,000 for the year ended December 31, 2007. The net change was primarily the result of changes in foreign currency transaction gains and losses.
Income Tax Provision: The Company recorded income tax expense of $55.0 million and had income before income taxes of $166.7 million for the year ended December 31, 2008. This represents an effective tax rate of 33.0%. During the year ended December 31, 2007, the Company recorded income tax expense of $41.9 million and had income before income taxes of $124.3 million. The Company’s effective tax rate was 33.7% for the year ended December 31, 2007.
As compared to the federal and state combined statutory rate, these rates are favorably impacted by lower tax rates in many of the Company’s foreign jurisdictions, Section 199 manufacturing deductions and research and experimentation credits. These rates are also impacted by charges or benefits associated with the Company’s uncertain tax positions. During the third quarter of 2008, the Company filed its 2007 U.S. federal and state
33
Table of Contents
income tax returns. In conjunction with the completion of these returns, the Company adjusted its estimate for 2007 taxes to reflect the actual results and recorded a net tax benefit of $1.2 million. The effect of this adjustment reduced the 2008 effective tax rate from 33.7% to 33.0%.
Net Income: The Company’s net income for the year ended December 31, 2008 was $111.7 million as compared to net income of $82.4 million for the year ended December 31, 2007. Diluted earnings per share was $1.29 for the year ended December 31, 2008 and $1.02 for the year ended December 31, 2007. The weighted average shares used in computing diluted earnings per share were 86.8 million and 81.1 million during the years ended December 31, 2008 and 2007, respectively.
Liquidity and Capital Resources
As of December 31, 2009, the Company had cash, cash equivalents and short-term investments totaling $343.8 million and working capital of $248.7 million as compared to cash, cash equivalents and short-term investments of $233.9 million and working capital of $129.5 million at December 31, 2008. The short-term investments are generally investment-grade and liquid, which allows the Company to minimize interest rate risk and to facilitate liquidity in the event an immediate cash need arises.
The Company’s operating activities provided cash of $173.7 million in 2009, $196.7 million in 2008 and $127.1 million in 2007. The net $23.0 million decrease in operating cash flows for the year ended December 31, 2009, as compared to the year ended December 31, 2008, was primarily related to:
| • | An $18.4 million decrease in cash flows from working capital fluctuations whereby these fluctuations produced a net cash inflow of $19.4 million during the year ended December 31, 2009 and a net cash inflow of $37.8 million during the year ended December 31, 2008. |
| • | A decrease in other non-cash operating adjustments of $9.4 million from $47.3 million for the year ended December 31, 2008 to $37.9 million for the year ended December 31, 2009. This decrease was most significantly impacted by an increase in deferred income tax benefits of $14.8 million and an increase of $9.1 million in excess stock option tax benefits, partially offset by an increase of $14.1 million in depreciation and amortization. |
| • | An increase in net income of $4.7 million from $111.7 million for the year ended December 31, 2008 to $116.4 million for the year ended December 31, 2009. |
The Company’s cash flow from operations in 2009 and 2008 was positively impacted by $108,000 and $1.5 million, respectively, as a result of the utilization of acquired net operating losses. As of December 31, 2009, the Company has approximately $13.4 million of remaining net operating losses that were acquired as part of the Ansoft transaction.
The $69.6 million increase in the Company’s cash flow from operations in 2008 as compared to 2007 was primarily the result of a $37.8 million increase in working capital fluctuations, a $29.3 million increase in net income, and a $2.5 million increase in other non-cash operating adjustments. The Company’s cash flow from operations in 2008 and 2007 was positively impacted by $1.5 million and $8.9 million, respectively, as a result of the utilization of acquired net operating losses.
The Company’s investing activities used net cash of $10.7 million for the year ended December 31, 2009 and $338.0 million for the year ended December 31, 2008. Total capital spending was $8.3 million in 2009 and $16.6 million in 2008. During 2008, the Company had net acquisition-related cash outlays of approximately $320.1 million, related to the acquisition of Ansoft. In 2009 and 2008, purchases of short-term investments exceeded maturities by $2.4 million and $1.2 million, respectively. The Company currently plans capital spending of approximately $15.0 million to $20.0 million during 2010; however, the actual level of spending will be dependent upon various factors, including growth of the business and general economic conditions.
34
Table of Contents
The Company’s investing activities used net cash of $338.0 million during 2008 and $15.4 million during 2007. Total capital spending was $16.6 million during 2008 and $10.8 million during 2007. During 2008, the Company had net acquisition-related cash outlays of approximately $320.1 million, related to the acquisition of Ansoft. In 2008, purchases of short-term investments exceeded maturities by $1.2 million and in 2007 the Company purchased $4.4 million in net investments.
Financing activities used cash of $64.1 million for the year ended December 31, 2009 and provided cash of $217.8 million for the year ended December 31, 2008. This change of $281.8 million was primarily a result of $355.0 million in 2008 borrowings associated with the acquisition of Ansoft. In addition, $39.9 million was spent during 2009 to repurchase 2.1 million shares of treasury stock at an average price of $19.28 per share as compared to $10.0 million spent during 2008 to repurchase 368,000 shares of treasury stock at an average price of $27.17 per share. These amounts were partially offset by an $81.6 million decrease in principal payments on long-term debt in 2009 as compared to 2008.
The credit agreement associated with the Ansoft acquisition includes covenants related to the consolidated leverage ratio and the consolidated fixed charge coverage ratio, as well as certain restrictions on additional investments and indebtedness. As of December 31, 2009, the Company is in compliance with all financial covenants as stated in the credit agreement.
Financing activities provided cash of $217.8 million for the year ended December 31, 2008 as compared with cash used of $55.8 million for the year ended December 31, 2007. This change of $273.6 million was primarily a net result of $355.0 million in borrowings associated with the acquisition of Ansoft, partially offset by principal payments of $135.5 million related to the Ansoft and Fluent term loans.
During the years ended December 31, 2009, 2008 and 2007, the Company spent $39.9 million, $10.0 million and $8.0 million, respectively, on stock repurchases. As of December 31, 2009, 1.3 million shares remain authorized for repurchase under the Company’s stock repurchase program. Although the Company has repurchased stock during each year in the three-year period ended December 31, 2008, it may or may not do so in future periods.
The Company believes that existing cash and cash equivalent balances of $335.9 million, together with cash generated from operations, will be sufficient to meet the Company’s working capital, capital expenditure and debt service requirements through fiscal year 2010. The Company’s cash requirements in the future may also be financed through additional equity or debt financings. There can be no assurance that such financings can be obtained on favorable terms, if at all.
The Company continues to generate positive cash flows from operating activities and believes that the best use of its excess cash is to repay its long-term debt, to invest in the business and, under certain favorable conditions, to repurchase stock. Additionally, the Company has in the past and expects in the future to acquire or make investments in complementary companies, products, services and technologies. Any future acquisitions may be funded by available cash and investments, cash generated from operations, existing or additional credit facilities, or from the issuance of additional securities.
The Company has a $5.8 million line of credit available on a company purchase card.
Off-Balance Sheet Arrangements
The Company does not have any special purpose entities or off-balance sheet financing.
35
Table of Contents
Contractual Obligations
The Company’s significant contractual obligations as of December 31, 2009 are summarized below:
| Payments Due by Period | |||||||||||||||
| (in thousands) |
Total | Within 1 year | 2 – 3 years | 4 – 5 years | After 5 years | ||||||||||
| Long-term debt1 |
$ | 231,633 | $ | 29,528 | $ | 135,657 | $ | 66,448 | $ | — | |||||
| Capital lease obligations2 |
372 | 294 | 78 | — | — | ||||||||||
| Corporate office operating lease3 |
7,147 | 1,429 | 2,859 | 2,859 | — | ||||||||||
| Other operating leases4 |
23,662 | 9,787 | 9,060 | 4,264 | 551 | ||||||||||
| Unconditional purchase obligations |
4,784 | 2,868 | 1,648 | 268 | — | ||||||||||
| Obligations related to uncertain tax positions, including interest and penalties5 |
— | — | — | — | — | ||||||||||
| Other long-term obligations6 |
16,654 | 2,122 | 8,037 | 5,879 | 616 | ||||||||||
| Total contractual obligations |
$ | 284,252 | $ | 46,028 | $ | 157,339 | $ | 79,718 | $ | 1,167 | |||||
| (1) | Includes estimated interest payments of $3.0 million within 1 year, $3.3 million within 2-3 years and $250,000 within 4-5 years. The interest rate is set for the quarter ending March 31, 2010 at 1.00% on $150.1 million, representing the unhedged portion of the term loan. The Company entered into an interest rate swap agreement on July 11, 2008 with a forward swap date of August 7, 2008 in order to hedge a portion of each of the first eight forecasted quarterly variable rate interest payments on the new term loan. Under the swap agreement, the Company receives the variable, three-month LIBOR rate required under its term loan and pays a fixed LIBOR interest rate of 3.32% on the notional amount. The initial notional amount of $300.0 million is amortized equally at an amount of $37.5 million over eight quarters through June 30, 2010. The interest rate is set for the quarter ending March 31, 2010 at 4.07% on $75.0 million, representing the hedged portion of the term loan. The estimated payments assume an interest rate of 1.00% on the unhedged portion and 4.07% on the hedged portion of the remaining loan balance and are calculated assuming contractual quarterly principal payments are made with no additional prepayments. |
| (2) | Includes estimated interest payments of $16,000 within 1 year and $6,000 within 2-3 years. |
| (3) | In May 2004, the Company entered into the first amendment to its corporate headquarters lease agreement, with an effective date of January 1, 2004. Under the new amendment, the corporate office facility lease agreement includes a commitment through 2014, with an option for five additional years. |
| (4) | Other operating leases primarily include noncancellable lease commitments for the Company’s other domestic and international offices as well as certain operating equipment. |
| (5) | The Company has approximately $12.1 million of unrecognized tax benefits that have been recorded as liabilities in accordance with income tax accounting guidance for which the Company is uncertain as to if or when such amounts may be settled. As a result, such amounts are excluded from the table above. |
| (6) | Includes long-term retention bonus of $14.8 million (including estimated imputed interest of $677,000 within 2-3 years and $551,000 within 4-5 years) and pension obligations of $1.2 million for certain foreign locations of the Company. |
The Company expended $3.4 million, $4.5 million and $2.6 million related to unconditional purchase obligations that existed as of the beginning of each year for the years ended December 31, 2009, 2008 and 2007, respectively.
Critical Accounting Policies and Estimates
The Company believes that the following critical accounting policies affect the more significant judgments and estimates used in the preparation of its consolidated financial statements.
Revenue is derived principally from the licensing of computer software products and from related maintenance contracts. Revenue from perpetual licenses is classified as license revenue and is recognized upon delivery of the licensed product and the utility that enables the customer to access authorization keys, provided
36
Table of Contents
that acceptance has occurred and a signed contractual obligation has been received, the price is fixed and determinable, and collectibility of the receivable is probable. The Company determines the fair value of post-contract customer support (“PCS”) sold together with perpetual licenses based on the contractual renewal rate for PCS when sold on a standalone basis. Revenue from PCS contracts is classified as maintenance and service revenue and is recognized ratably over the term of the contract.
Revenue for software lease licenses is classified as license revenue and is recognized over the period of the lease contract. Typically, the Company’s software leases include PCS which, due to the short term (principally one year or less) of the Company’s software lease licenses, cannot be separated from lease revenue for accounting purposes. As a result, both the lease license and PCS are recognized ratably over the lease period. Due to the short-term nature of the software lease licenses and the frequency with which the Company provides major product upgrades (typically 12 – 18 months), the Company does not believe that a significant portion of the fee paid under the arrangement is attributable to the PCS component of the arrangement and, as a result, includes the revenue for the entire arrangement within software license revenue in the consolidated statements of income.
Revenue from training, support and other services is recognized as the services are performed. The Company applies the specific performance method to contracts in which the service consists of a single act, such as providing a training class to a customer, and the proportional performance method to other service contracts that are longer in duration and often include multiple acts (for example, both training and consulting). In applying the proportional performance method, the Company typically utilizes output-based estimates for services with contractual billing arrangements that are not based on time and materials, and estimates output based on the total tasks completed as compared to the total tasks required for each work contract. Input-based estimates are utilized for services that involve general consultations with contractual billing arrangements based on time and materials, utilizing direct labor as the input measure.
The Company also executes arrangements through channel partners in which the channel partners are authorized to market and distribute the Company’s software products to end users of the Company’s products and services in specified territories. In sales facilitated by channel partners, the channel partner bears the risk of collection from the end user customer. The Company recognizes revenue from transactions with channel partners when the channel partner submits a written purchase commitment, collectibility from the channel partner is probable, a signed license agreement is received from the end user customer and delivery has occurred to the end user customer, provided that all other revenue recognition criteria are satisfied. Revenue from channel partner transactions is the amount remitted to the Company by the channel partners. This amount includes a fee for PCS that is compensation for providing technical enhancements and the second level of technical support to the end user, which is based on the contractual renewal rate in the end user customer’s license agreement and is recognized over the period that PCS is to be provided. The Company does not offer right of return, product rotation or price protection to any of its channel partners.
Non-income related taxes collected from customers and remitted to governmental authorities are recorded on the balance sheet as accounts receivable and accrued expenses. The collection and payment of these amounts is reported on a net basis in the consolidated statements of income and does not impact reported revenues or expenses.
The Company warrants to its customers that its software will substantially perform as specified in the Company’s most current user manuals. The Company has not experienced significant claims related to software warranties beyond the scope of maintenance support, which the Company is already obligated to provide, and consequently, the Company has not established reserves for warranty obligations.
The Company’s agreements with its customers generally require it to indemnify the customer against claims that the Company’s software infringes third party patent, copyright, trademark or other proprietary rights. Such indemnification obligations are generally limited in a variety of industry-standard respects, including the Company’s right to replace an infringing product. As of December 31, 2009, the Company had not experienced any losses related to these indemnification obligations and no claims with respect thereto were outstanding. The
37
Table of Contents
Company does not expect significant claims related to these indemnification obligations, and consequently, the Company has not established any related reserves.
The Company makes judgments as to its ability to collect outstanding receivables and provides allowances for a portion of receivables when collection becomes doubtful. Provisions are made based upon a specific review of all significant outstanding invoices from both value and delinquency perspectives. For those invoices not specifically reviewed, provisions are provided at differing rates based upon the age of the receivable and the geographical area of origin. In determining these percentages, the Company considers its historical collection experience and current economic trends in the customer’s industry and geographic region. If the historical data used to calculate the allowance for doubtful accounts does not reflect the future ability to collect outstanding receivables, additional provisions for doubtful accounts may be needed and future results of operations could be materially affected.
The Company accounts for income taxes under the asset and liability method, which requires the recognition of deferred tax assets and liabilities for the expected future tax consequences of events that have been included in the financial statements. Under this method, deferred tax assets and liabilities are determined based on the differences between the financial statement and tax bases of assets and liabilities using enacted tax rates in effect for the year in which the differences are expected to reverse. The effect of a change in tax rates on deferred tax assets and liabilities is recognized in income in the period of the enactment date.
The Company records net deferred tax assets to the extent it believes these assets will more likely than not be realized. In making such determination, the Company considers all available positive and negative evidence, including scheduled reversals of deferred tax liabilities, projected future taxable income, tax planning strategies and recent financial operations. In the event the Company determines that it would be able to realize deferred income tax assets in the future in excess of their net recorded amount, an adjustment to the valuation allowance would be recorded that would reduce the provision for income taxes.
In July 2006, accounting guidance was issued on accounting for the uncertainty in income taxes. The accounting guidance clarifies the accounting for uncertainty in income taxes recognized in the financial statements. The accounting guidance clarified that a tax benefit from an uncertain tax position may be recognized when it is more likely than not that the position will be sustained upon examination, including resolutions of any related appeals or litigation processes, based on the technical merits. Income tax positions must meet a more-likely-than-not recognition threshold at the effective date to be recognized upon the adoption of the accounting guidance and in subsequent periods. The accounting guidance also provides guidance on measurement, derecognition, classification, interest and penalties, accounting in interim periods, disclosure and transition. The Company adopted the accounting guidance on January 1, 2007.
The Company recognizes interest and penalties related to unrecognized tax benefits within the income tax expense line in the accompanying consolidated statements of income. Accrued interest and penalties are included within the related tax liability line in the consolidated balance sheet.
The Company tests goodwill and intangible assets with indefinite lives for impairment at least annually by comparing the fair value of each asset (or, in the case of goodwill, the Company’s reporting units) to its carrying value. Fair value is estimated using the discounted cash flow and other valuation methodologies. In preparing the estimate of fair value, the Company relies on a number of factors, including historical operating results, business plans, anticipated future cash flows, economic projections and other market data. Because there are inherent uncertainties involved in these factors, the Company’s estimates of fair value are imprecise and the resulting carrying value of goodwill and intangible assets may be misstated. When the Company assigns a fair value to a trademark it also estimates whether it has a finite or indefinite life, thus impacting whether the value is amortized or not. Events such as product and naming strategy changes can occur whereby the Company may reconsider the life (whether finite or indefinite), resulting in changes to amortization expense. Amortization periods may also be reconsidered for identifiable intangible assets with finite lives.
The Company tested the value of its two reporting units for impairment on January 1, 2009. As of this date, the fair values of each of the Company’s reporting units substantially exceeded their carrying values. The key
38
Table of Contents
assumptions utilized in determining the fair values of the Company’s reporting units are revenue growth rates, growth rates of cash expenditures and related operating margin percentages, income tax rates, and factors that influence the Company’s weighted average cost of capital, including interest rates, the ratio of the Company’s debt capital to its total capital and the Company’s systematic risk or beta.
Of the preceding factors, the Company’s reporting unit fair value is most sensitive to changes in revenue growth rate estimates. Factors that could adversely affect the Company’s revenue growth rates include adverse economic conditions in certain geographies or industries, especially key industrial and electronics industries; enhanced competition and related pricing pressures; integration issues associated with acquisitions; strengthening of the U.S. Dollar or other adverse foreign currency fluctuations; reduced renewal rates for the Company’s annual lease and maintenance contracts; and the Company’s ability to attract and retain key personnel. Any of these factors individually or in combination could cause the Company’s growth rates to decline over a defined period of time. The Company has demonstrated an ability in the past to adjust its cost structure through reductions in discretionary spending, delayed hiring or workforce reductions when faced with periods of reduced revenue growth. If adverse conditions would persist over a longer period of time and would cause a revision to the Company’s long-term revenue growth rate projections without a similar cost reduction response, or if other factors would occur that would result in a similar growth rate revision or a material revision to the other inputs to reporting unit fair value, it could cause the fair value of the Company’s reporting unit(s) to fall below its carrying value, potentially resulting in an impairment of goodwill.
The Company is involved in various investigations, claims and legal proceedings that arise in the ordinary course of its business activities. The Company reviews the status of these matters, assesses its financial exposure and records a related accrual if the potential loss from an investigation, claim or legal proceeding is probable and the amount is reasonably estimable. Significant judgment is involved in the determination of probability and in the determination of whether an exposure is reasonably estimable. As a result of the uncertainties involved in making these estimates, the Company may have to revise its estimates as facts and circumstances change. The revision of these estimates could have a material impact on the Company’s financial position and results of operations.
The Company grants options to purchase its common stock to employees and directors under the Company’s stock option plan. Eligible employees can also purchase shares of the Company’s common stock at a discount under the Company’s employee stock purchase plan. The benefits provided under these plans are share-based payments subject to the provisions of share-based payment accounting guidance. The Company uses the fair value method to apply the provisions of share-based payment accounting guidance. Share-based compensation expense for 2009, 2008 and 2007 was $13.2 million, $11.8 million and $8.9 million, respectively. As of December 31, 2009, total unrecognized estimated compensation expense related to unvested stock options granted prior to that date was $38.8 million, which is expected to be recognized over a weighted average period of 2.0 years. Net stock options, after forfeitures and cancellations, granted during 2009, 2008 and 2007 represented 1.34%, 1.26% and 1.09%, respectively, of outstanding shares as of the beginning of each fiscal year. Net stock options, after forfeitures and cancellations, granted during 2009, 2008 and 2007 represented 1.33%, 1.10% and 1.07%, respectively, of outstanding shares as of the end of each fiscal year. In addition, during 2008, the Company issued 1.95 million options pursuant to assumed stock options associated with the acquisition of Ansoft, representing 2.49% and 2.18% of outstanding shares as of the beginning and end of the 2008 fiscal year, respectively. Of the options issued associated with the acquisition, 1.94 million were fully vested as of the acquisition date.
The value of each share-based award was estimated on the date of grant using the Black-Scholes option pricing model (“Black-Scholes model”). The determination of the fair value of share-based payment awards on the date of grant using an option pricing model is affected by the Company’s stock price as well as assumptions regarding a number of complex and subjective variables. These variables include the Company’s expected stock price volatility over the term of the awards, actual and projected employee stock option exercise behaviors, risk-free interest rates and expected dividends. The table below presents the assumptions used in calculating the compensation expense recorded within the Company’s consolidated statements of income for the years ended
39
Table of Contents
December 31, 2009, 2008 and 2007. The interest rates used were determined by using the five-year Treasury Note yield on the date of grant.
| Compensation Expense December 31, | ||||||
| Assumption used in Black-Scholes option pricing model |
2009 | 2008 | 2007 | |||
| Risk-free interest rate |
1.86% to 2.69% | 2.33% to 3.11% | 3.41% to 4.63% | |||
| Expected dividend yield |
0% | 0% | 0% | |||
| Expected volatility |
41% | 39% | 36% | |||
| Expected term |
6.1 years | 5.8 years | 4.9 years | |||
The Company issues both nonqualified and incentive stock options; however, incentive stock options comprise a significant portion of outstanding stock options. The tax benefits associated with incentive stock options are unpredictable, as they are predicated upon an award recipient triggering an event that disqualifies the award and that then results in a tax deduction to the Company. Share-based payment accounting guidance requires that these tax benefits be recorded at the time of the triggering event. The triggering events for each option holder are not easily projected. In order to estimate the tax benefits related to incentive stock options, the Company makes many assumptions and estimates, including the number of incentive stock options that will be exercised during the period by U.S. employees, the number of incentive stock options that will be disqualified during the period and the fair market value of the Company’s stock price on the exercise dates. Each of these items is subject to significant uncertainty. Additionally, a significant portion of the tax benefits related to disqualified incentive stock options is accounted for as an increase to equity (additional paid-in capital) rather than as a reduction in income tax expense. Although all such benefits continue to be realized through the Company’s tax filings, this accounting treatment has the effect of increasing tax expense and reducing net income. For example, the Company realized a tax benefit of $7.5 million during the year ended December 31, 2009 related to disqualified dispositions of incentive stock options; however, only $369,000 of such amount was recorded as a reduction in income tax expense. Although there are significant limitations in estimating stock-based compensation expense, including those discussed above, the Company currently estimates that these costs will result in a decrease in 2010 operating income of approximately $18.0 million - $20.0 million and a decrease in 2010 net income of approximately $14.0 million - $15.6 million, or approximately $0.15 - $0.17 per diluted share.
If factors change and the Company employs different assumptions in the application of share-based payment accounting guidance in future periods, the compensation expense that the Company will record may differ significantly from what the Company has recorded in the current period. Therefore, it is important for investors to be aware of the high degree of subjectivity involved when using option pricing models to estimate share-based compensation. Option pricing models were developed for use in estimating the value of traded options that have no vesting or hedging restrictions, are fully transferable and do not cause dilution. Because the Company’s share-based payments have characteristics significantly different from those of freely traded options and because changes in the input assumptions can materially affect the Company’s estimates of fair values, in the Company’s opinion, existing valuation models, including the Black-Scholes models, may not provide reliable measures of the fair values of the Company’s share-based compensation. Consequently, there is a risk that the Company’s estimates of the fair values of the Company’s share-based compensation awards on the grant dates may bear little resemblance to the actual values realized upon the exercise, expiration, early termination or forfeiture of those share-based payments in the future. Certain share-based payments, such as employee stock options, may expire worthless or otherwise result in zero intrinsic value as compared to the fair values originally estimated on the grant date and reported in the Company’s financial statements. Alternatively, value may be realized from these instruments that is significantly in excess of the fair values originally estimated on the grant date and reported in the Company’s financial statements. There is currently no market-based mechanism or other practical application to verify the reliability and accuracy of the estimates stemming from these valuation models nor is there a means to compare and adjust the estimates to actual values. Although the fair value of employee share-based awards is determined in accordance with share-based payment accounting guidance using an option pricing model, that value may not be indicative of the fair value observed in a willing buyer/seller market transaction.
40
Table of Contents
Estimates of share-based compensation expenses are significant to the Company’s financial statements, but these expenses are based on the aforementioned option valuation model and will never result in the payment of cash by the Company. For this reason, and because the Company does not view share-based compensation as related to its operational performance, the Board of Directors and management exclude estimated share-based compensation expense when evaluating the Company’s underlying business performance.
Recently Issued and Adopted Accounting Pronouncements
For information with respect to recently issued accounting pronouncements and the impact of these pronouncements on the Company’s consolidated financial statements, see Note 2 to the consolidated financial statements in Part IV, Item 15 of this Annual Report on Form 10-K.
| ITEM 7A: | QUANTITATIVE AND QUALITATIVE DISCLOSURES ABOUT MARKET RISK |
Interest Income Rate Risk. Changes in the overall level of interest rates affect the interest income that is generated from the Company’s cash and short-term investments. For the year ended December 31, 2009, total interest income was $1.7 million. Cash and cash equivalents consist primarily of highly liquid investments, such as time deposits held at major banks, money market mutual funds and other securities with original maturities of three months or less. The Company considers investments backed by government agencies or U.S. financial institutions to be highly liquid and, accordingly, classifies such investments as short-term investments.
Interest Expense Rate Risk. In connection with the Fluent acquisition, the Company entered into two credit agreements as of May 1, 2006 with variable interest rates and total borrowings of $198 million. The amounts borrowed with respect to one of the credit agreements were paid in full as of December 31, 2006. The amounts borrowed with respect to the second credit agreement were paid in full as of June 30, 2008. In connection with the Ansoft acquisition, the Company entered into a $355.0 million term loan with variable interest rates as of July 31, 2008. The term loan is scheduled to mature on July 31, 2013 and provides for tiered pricing with the initial rate at the prime rate + 0.50%, or the LIBOR rate + 1.50%, with step downs permitted after the initial six months under the credit agreement down to a flat prime rate or the LIBOR rate + 0.75%. Such tiered pricing is determined by the Company’s consolidated leverage ratio. The credit agreement includes quarterly financial covenants, requiring the Company to maintain certain financial ratios and, as is customary for facilities of this type, certain events of default that permit the acceleration of the loan. Borrowings outstanding under this facility totaled $225.1 million as of December 31, 2009.
The Company entered into an interest rate swap agreement in order to hedge a portion of each of the first eight forecasted quarterly variable rate interest payments on the Company’s term loan. Under the swap agreement, the Company receives the variable, three-month LIBOR rate required under its term loan and pays a fixed LIBOR interest rate of 3.32% on the notional amount. The initial notional amount of $300.0 million is amortized equally at an amount of $37.5 million over eight quarters through June 30, 2010.
For the year ended December 31, 2009, the Company recorded interest expense related to the term loan at a weighted average interest rate of 3.41%. If the Company did not enter into the interest rate swap agreement, the weighted average interest rates would have been 1.88%. For the year ended December 31, 2008, the Company recorded interest expense related to the term loans at a weighted average interest rate of 4.72%. If the Company did not enter into the interest rate swap agreement, the weighted average interest rate would have been 4.73%. The interest expense on the term loans and amortization related to debt financing costs were as follows:
| Year Ended December 31, | ||||||||||||
| 2009 | 2008 | |||||||||||
| (in thousands) |
Interest Expense |
Amortization | Interest Expense |
Amortization | ||||||||
| May 1, 2006 term loan |
$ | — | $ | — | $ | 1,219 | $ | 952 | ||||
| July 31, 2008 term loan (interest expense includes $3,959 loss and $3 gain, respectively, on interest rate swap) |
8,824 | 1,229 | 6,524 | 573 | ||||||||
| Total |
$ | 8,824 | $ | 1,229 | $ | 7,743 | $ | 1,525 | ||||
41
Table of Contents
The interest rate for the July 31, 2008 term loan is set for the first quarter of 2010 as follows:
| Three Months Ending | ||||||
| March 31, 2010 Applicable Rate |
||||||
| LIBOR rate + 0.75% |
Hedged rate + 0.75% |
|||||
| $150.1 million unhedged portion of term loan |
1.00 | % | — | |||
| $75.0 million hedged portion of term loan |
— | 4.07 | % | |||
Based on the effective interest rates and remaining outstanding borrowings at December 31, 2009, the Company’s interest expense on the term loan for the quarter ending March 31, 2010 will be approximately $1.1 million. A 0.50% increase in interest rates would not impact the Company’s interest expense for the quarter ending March 31, 2010. Based on the effective interest rates and remaining outstanding borrowings at December 31, 2009, assuming contractual quarterly principal payments are made, a 0.50% increase in interest rates would increase the Company’s interest expense by approximately $1.0 million for the year ending December 31, 2010.
Foreign Currency Transaction Risk. The Company’s acquisition of Ansoft has increased its business presence in international locations, particularly in the Asia-Pacific region. As the Company continues to expand its business presence in international regions, the portion of its revenue, expenses, cash, accounts receivable and payment obligations denominated in foreign currencies continues to increase. As a result, changes in currency exchange rates will affect the Company’s financial position, results of operations and cash flows. The Company is most impacted by movements in and among the British Pound, Euro, Japanese Yen, Canadian Dollar, Indian Rupee, Swedish Krona, Chinese Renminbi, Korean Won, Taiwan Dollar and the U.S. Dollar.
With respect to revenue, on average for the year ended December 31, 2009, the U.S. Dollar was approximately 3.7% stronger, when measured against the Company’s primary foreign currencies, than for the year ended December 31, 2008. The U.S. Dollar strengthened against the British Pound, Euro, Indian Rupee, Swedish Krona and the Canadian Dollar, while it weakened against the Japanese Yen, Korean Won, Taiwan Dollar and the Chinese Renminbi. The net overall strengthening resulted in decreased revenue and operating income during 2009, as compared with 2008, of approximately $10.3 million and $3.6 million, respectively. Had the activity for the year ended December 31, 2009 been recorded at the December 31, 2009 spot rates for each subsidiary’s functional currency, the revenue and operating income would have increased by $6.5 million and $2.8 million, respectively.
The most significant impact on revenue and operating income were primarily attributable to U.S. Dollar exchange rate changes against the Euro, British Pound and Japanese Yen as reflected in the charts below.
| Period End Exchange Rates | ||||||
| Period Ended |
USD/EUR | USD/GBP | JPY/USD | |||
| December 2006 |
1.320 | 1.958 | 119.005 | |||
| December 2007 |
1.460 | 1.987 | 111.445 | |||
| December 2008 |
1.397 | 1.459 | 90.728 | |||
| December 2009 |
1.432 | 1.616 | 93.084 | |||
| Average Exchange Rates | ||||||
| Twelve Months Ended |
USD/EUR | USD/GBP | JPY/USD | |||
| December 2007 |
1.371 | 2.002 | 117.646 | |||
| December 2008 |
1.471 | 1.853 | 103.083 | |||
| December 2009 |
1.394 | 1.566 | 93.444 | |||
Other Risks. Based on the nature of the Company’s business, it has no direct exposure to commodity price risk.
42
Table of Contents
| ITEM 8: | FINANCIAL STATEMENTS AND SUPPLEMENTARY DATA |
The following table sets forth selected unaudited quarterly information. The Company believes that the amounts stated below present fairly the results of such periods when read in conjunction with the consolidated financial statements and related notes included in Part IV, Item 15 of this Annual Report on Form 10-K.
Other information required by this Item is included in Part IV, Item 15 of this Annual Report on Form 10-K.
| Fiscal Quarter Ended | ||||||||||||
| (in thousands, except per share data) |
December 31, 2009 |
September 30, 2009 |
June 30, 2009 |
March 31, 2009 | ||||||||
| Revenue |
$ | 150,362 | $ | 128,187 | $ | 122,026 | $ | 116,310 | ||||
| Gross profit |
124,701 | 104,298 | 97,968 | 92,682 | ||||||||
| Operating income |
60,356 | 47,632 | 40,660 | 34,829 | ||||||||
| Net income |
37,630 | 30,529 | 27,137 | 21,095 | ||||||||
| Earnings per share—basic |
0.42 | 0.35 | 0.31 | 0.24 | ||||||||
| Earnings per share—diluted |
0.41 | 0.33 | 0.30 | 0.23 | ||||||||
| Fiscal Quarter Ended | ||||||||||||
| (in thousands, except per share data) |
December 31, 2008 |
September 30, 2008 |
June 30, 2008 |
March 31, 2008 | ||||||||
| Revenue |
$ | 135,301 | $ | 122,247 | $ | 111,246 | $ | 109,545 | ||||
| Gross profit |
109,911 | 97,660 | 90,716 | 88,638 | ||||||||
| Operating income |
45,780 | 38,296 | 43,854 | 41,801 | ||||||||
| Net income |
31,913 | 25,775 | 28,129 | 25,854 | ||||||||
| Earnings per share—basic |
0.36 | 0.30 | 0.36 | 0.33 | ||||||||
| Earnings per share—diluted |
0.34 | 0.29 | 0.34 | 0.32 | ||||||||
| ITEM 9: | CHANGES IN AND DISAGREEMENTS WITH ACCOUNTANTS ON ACCOUNTING AND FINANCIAL DISCLOSURE |
None.
| ITEM 9A: | CONTROLS AND PROCEDURES |
Evaluation of Disclosure Controls and Procedures. As required by Rules 13a-15 and 15d-15 of the Securities Exchange Act of 1934, as amended, or the Exchange Act, the Company has evaluated, with the participation of management, including the Chief Executive Officer and the Chief Financial Officer, the effectiveness of the design and operation of its disclosure controls and procedures as of the end of the period covered by this report. Based on such evaluation, the Chief Executive Officer and Chief Financial Officer have concluded that such disclosure controls and procedures are effective, as defined in Rule 13a-15(e) of the Exchange Act.
The Company has a Disclosure Review Committee to assist in the quarterly evaluation of the Company’s internal disclosure controls and procedures and in the review of the Company’s periodic filings under the Exchange Act. The membership of the Disclosure Review Committee consists of the Company’s Chief Executive Officer, Chief Financial Officer, Global Controller and Treasurer, General Counsel, Investor Relations and Global Insurance Officer, Vice President of Worldwide Sales and Support, Vice President of Human Resources, Vice President of Marketing and Business Unit General Managers. This committee is advised by external counsel, particularly on SEC-related matters. Additionally, other members of the Company’s global management team advise the committee with respect to disclosure via a sub-certification process.
43
Table of Contents
The Company believes, based on its knowledge, that the financial statements and other financial information included in this report fairly present, in all material respects, the financial condition, results of operations and cash flows of the Company as of and for the periods presented in this report. The Company is committed to both a sound internal control environment and to good corporate governance.
Because of its inherent limitations, internal control over financial reporting may not prevent or detect misstatements. Projections of any evaluation of effectiveness to future periods are subject to the risk that controls may become inadequate because of changes in conditions, or that the degree of compliance with policies or procedures may deteriorate.
From time to time, the Company reviews the disclosure controls and procedures, and may from time to time make changes to enhance their effectiveness and to ensure that the Company’s systems evolve with its business.
Report on Internal Control Over Financial Reporting. The Company’s management is responsible for establishing and maintaining adequate internal control over financial reporting, as such term is defined in Exchange Act Rules 13a-15(f). Under the supervision and with the participation of the Company’s management, including the Company’s Chief Executive Officer and Chief Financial Officer, the Company has conducted an evaluation of the effectiveness of its internal control over financial reporting based upon the Internal Control— Integrated Framework issued by the Committee of Sponsoring Organizations of the Treadway Commission. Based on this evaluation, the Company’s Chief Executive Officer and Chief Financial Officer have concluded that the Company’s internal control over financial reporting was effective at December 31, 2009.
Additionally, Deloitte & Touche LLP, an independent registered public accounting firm, has issued an attestation report on the Company’s internal control over financial reporting. This report is included in Item 15 of this Annual Report on Form 10-K.
Changes in Internal Controls. There were no changes in the Company’s internal controls over financial reporting during the fourth quarter of 2009. Since the date of acquisition, the Company has extended its internal controls to Ansoft. The Company has implemented its entity level controls at Ansoft and its subsidiaries, including the Company’s standard business processes, procedures and policies, and re-alignment of the Ansoft business reporting structure.
| ITEM 9B: | OTHER INFORMATION |
None.
44
Table of Contents
| ITEM 10: | DIRECTORS, EXECUTIVE OFFICERS AND CORPORATE GOVERNANCE |
The information required by this Item is incorporated by reference to the Company’s 2010 Proxy Statement and is set forth under “Our Board of Directors,” “Our Executive Officers” and “Ownership of Our Common Stock” therein.
| ITEM 11: | EXECUTIVE COMPENSATION |
The information required by this Item is incorporated by reference to the Company’s 2010 Proxy Statement and is set forth under “Our Board of Directors” and “Our Executive Officers” therein.
| ITEM 12: | SECURITY OWNERSHIP OF CERTAIN BENEFICIAL OWNERS AND MANAGEMENT AND RELATED STOCKHOLDER MATTERS |
The information required by this Item is incorporated by reference to the Company’s 2010 Proxy Statement and is set forth under “Ownership of Our Common Stock” therein.
| ITEM 13: | CERTAIN RELATIONSHIPS AND RELATED TRANSACTIONS AND DIRECTOR INDEPENDENCE |
The information required by this Item is incorporated by reference to the Company’s 2010 Proxy Statement and is set forth under “Our Board of Directors” therein.
| ITEM 14: | PRINCIPAL ACCOUNTANT FEES AND SERVICES |
The information required by this Item is incorporated by reference to the Company’s 2010 Proxy Statement and is set forth under “Independent Registered Public Accounting Firm” therein.
45
Table of Contents
| ITEM 15: | EXHIBITS, FINANCIAL STATEMENT SCHEDULES |
| (a) | Documents Filed as Part of this Annual Report on Form 10-K: |
| 1. | Financial Statements: The following consolidated financial statements and reports of independent registered public accounting firm are filed as part of this report: |
| 2. | Financial Statement Schedule: The following financial statement schedule is filed as part of this report and should be read in conjunction with the consolidated financial statements. |
| Schedule II - Valuation and Qualifying Accounts | 76 |
Schedules not listed above have been omitted because they are not applicable, or are not required, or the information required to be set forth therein is included in the consolidated financial statements or notes thereto.
| 3. | Exhibits: |
The Exhibits listed on the accompanying Exhibit Index immediately following the financial statement schedule are filed as part of, or incorporated by reference into, this Annual Report on Form 10-K.
| (b) | Exhibits: |
The Company hereby files as part of this Annual Report on Form 10-K the Exhibits listed in the attached Exhibit Index on pages 77 through 79 of this Annual Report on Form 10-K.
| a. | Financial Statement Schedule |
The Company hereby files as part of this Annual Report on Form 10-K the financial statement schedule listed in Item 15(a)(2) as set forth above.
46
Table of Contents
Management’s Report on Internal Control over Financial Reporting
Management is responsible for establishing and maintaining an adequate system of internal control over financial reporting for the Company. In order to evaluate the effectiveness of internal control over financial reporting, management has conducted an assessment, including testing, using the financial reporting criteria in the Internal Control—Integrated Framework, issued by the Committee of Sponsoring Organizations of the Treadway Commission.
The Company’s system of internal control over financial reporting is designed to provide reasonable assurance to the Company’s management and board of directors regarding the reliability of financial records used in preparation of the Company’s published financial statements. As all internal control systems have inherent limitations, even systems determined to be effective can provide only reasonable assurance with respect to financial statement preparation and presentation. Based on its assessment, management has concluded that the Company maintained an effective system of internal control over financial reporting as of December 31, 2009. Deloitte & Touche LLP, an independent registered public accounting firm, has audited the Company’s internal control over financial reporting as of December 31, 2009, as stated in their report which appears on page 49.
| /s/ JAMES E. CASHMAN III |
/s/ MARIA T. SHIELDS | |
| James E. Cashman III | Maria T. Shields | |
| President and Chief Executive Officer | Chief Financial Officer | |
| February 25, 2010 |
47
Table of Contents
REPORT OF INDEPENDENT REGISTERED PUBLIC ACCOUNTING FIRM
To the Board of Directors and Stockholders of ANSYS, Inc.
Canonsburg, Pennsylvania
We have audited the accompanying consolidated balance sheets of ANSYS, Inc. and subsidiaries (the “Company”) as of December 31, 2009 and 2008, and the related consolidated statements of income, stockholders’ equity, and cash flows for each of the three years in the period ended December 31, 2009. Our audits also included the financial statement schedule listed in the Index at Item 15. These financial statements and financial statement schedule are the responsibility of the Company’s management. Our responsibility is to express an opinion on the financial statements and financial statement schedule based on our audits.
We conducted our audits in accordance with the standards of the Public Company Accounting Oversight Board (United States). Those standards require that we plan and perform the audit to obtain reasonable assurance about whether the financial statements are free of material misstatement. An audit includes examining, on a test basis, evidence supporting the amounts and disclosures in the financial statements. An audit also includes assessing the accounting principles used and significant estimates made by management, as well as evaluating the overall financial statement presentation. We believe that our audits provide a reasonable basis for our opinion.
In our opinion, such consolidated financial statements present fairly, in all material respects, the financial position of ANSYS, Inc. and subsidiaries as of December 31, 2009 and 2008, and the results of their operations and their cash flows for each of the three years in the period ended December 31, 2009, in conformity with accounting principles generally accepted in the United States of America. Also, in our opinion, such financial statement schedule, when considered in relation to the basic consolidated financial statements taken as a whole, presents fairly, in all material respects, the information set forth therein.
We have also audited, in accordance with the standards of the Public Company Accounting Oversight Board (United States), the Company’s internal control over financial reporting as of December 31, 2009, based on the criteria established in Internal Control—Integrated Framework issued by the Committee of Sponsoring Organizations of the Treadway Commission and our report dated February 25, 2010 expressed an unqualified opinion on the Company’s internal control over financial reporting.
| /s/ Deloitte & Touche LLP |
| Pittsburgh, Pennsylvania |
| February 25, 2010 |
48
Table of Contents
REPORT OF INDEPENDENT REGISTERED PUBLIC ACCOUNTING FIRM
To the Board of Directors and Stockholders of ANSYS, Inc.
Canonsburg, Pennsylvania
We have audited the internal control over financial reporting of ANSYS, Inc. and subsidiaries (the “Company”) as of December 31, 2009, based on criteria established in Internal Control—Integrated Framework issued by the Committee of Sponsoring Organizations of the Treadway Commission. The Company’s management is responsible for maintaining effective internal control over financial reporting and for its assessment of the effectiveness of internal control over financial reporting, included in the accompanying Management’s Report on Internal Control over Financial Reporting. Our responsibility is to express an opinion on the Company’s internal control over financial reporting based on our audit.
We conducted our audit in accordance with the standards of the Public Company Accounting Oversight Board (United States). Those standards require that we plan and perform the audit to obtain reasonable assurance about whether effective internal control over financial reporting was maintained in all material respects. Our audit included obtaining an understanding of internal control over financial reporting, assessing the risk that a material weakness exists, testing and evaluating the design and operating effectiveness of internal control based on the assessed risk, and performing such other procedures as we considered necessary in the circumstances. We believe that our audit provides a reasonable basis for our opinion.
A company’s internal control over financial reporting is a process designed by, or under the supervision of, the company’s principal executive and principal financial officers, or persons performing similar functions, and effected by the company’s board of directors, management, and other personnel to provide reasonable assurance regarding the reliability of financial reporting and the preparation of financial statements for external purposes in accordance with generally accepted accounting principles. A company’s internal control over financial reporting includes those policies and procedures that (1) pertain to the maintenance of records that, in reasonable detail, accurately and fairly reflect the transactions and dispositions of the assets of the company; (2) provide reasonable assurance that transactions are recorded as necessary to permit preparation of financial statements in accordance with generally accepted accounting principles, and that receipts and expenditures of the company are being made only in accordance with authorizations of management and directors of the company; and (3) provide reasonable assurance regarding prevention or timely detection of unauthorized acquisition, use, or disposition of the company’s assets that could have a material effect on the financial statements.
Because of the inherent limitations of internal control over financial reporting, including the possibility of collusion or improper management override of controls, material misstatements due to error or fraud may not be prevented or detected on a timely basis. Also, projections of any evaluation of the effectiveness of the internal control over financial reporting to future periods are subject to the risk that the controls may become inadequate because of changes in conditions, or that the degree of compliance with the policies or procedures may deteriorate.
In our opinion, the Company maintained, in all material respects, effective internal control over financial reporting as of December 31, 2009, based on the criteria established in Internal Control—Integrated Framework issued by the Committee of Sponsoring Organizations of the Treadway Commission.
We have also audited, in accordance with the standards of the Public Company Accounting Oversight Board (United States), the consolidated financial statements and financial statement schedule as of and for the year ended December 31, 2009 of the Company and our report dated February 25, 2010 expressed an unqualified opinion on those financial statements and financial statement schedule.
| /s/ Deloitte & Touche LLP |
| Pittsburgh, Pennsylvania |
| February 25, 2010 |
49
Table of Contents
Consolidated Balance Sheets
| December 31, | ||||||||
| (in thousands, except share data) |
2009 | 2008 | ||||||
| ASSETS |
||||||||
| Current assets: |
||||||||
| Cash and cash equivalents |
$ | 335,878 | $ | 228,176 | ||||
| Short-term investments |
7,966 | 5,699 | ||||||
| Accounts receivable, less allowance for doubtful accounts of $4,418 and $4,422, respectively |
67,084 | 61,823 | ||||||
| Other receivables and current assets |
86,735 | 95,462 | ||||||
| Deferred income taxes |
17,827 | 5,993 | ||||||
| Total current assets |
515,490 | 397,153 | ||||||
| Property and equipment, net |
35,131 | 36,812 | ||||||
| Goodwill |
1,038,824 | 1,048,003 | ||||||
| Other intangible assets, net |
322,313 | 373,398 | ||||||
| Other long-term assets |
5,848 | 8,692 | ||||||
| Deferred income taxes |
2,576 | 456 | ||||||
| Total assets |
$ | 1,920,182 | $ | 1,864,514 | ||||
| LIABILITIES AND STOCKHOLDERS’ EQUITY |
||||||||
| Current liabilities: |
||||||||
| Current portion of long-term debt and capital lease obligations |
$ | 26,758 | $ | 29,630 | ||||
| Accounts payable |
2,426 | 3,069 | ||||||
| Accrued bonuses and commissions |
23,162 | 22,111 | ||||||
| Accrued income taxes |
12,262 | 10,642 | ||||||
| Deferred income taxes |
143 | 1,999 | ||||||
| Other accrued expenses and liabilities |
32,740 | 34,024 | ||||||
| Deferred revenue |
169,275 | 166,189 | ||||||
| Total current liabilities |
266,766 | 267,664 | ||||||
| Long-term liabilities: |
||||||||
| Long-term debt and capital lease obligations, less current portion |
198,668 | 249,795 | ||||||
| Deferred income taxes |
107,313 | 127,527 | ||||||
| Other long-term liabilities |
34,804 | 36,629 | ||||||
| Total long-term liabilities |
340,785 | 413,951 | ||||||
| Commitments and contingencies |
— | — | ||||||
| Stockholders’ equity: |
||||||||
| Preferred stock, $.01 par value; 2,000,000 shares authorized; zero shares issued or outstanding |
— | — | ||||||
| Common stock, $.01 par value; 150,000,000 shares authorized; 89,716,317 shares issued |
897 | 897 | ||||||
| Additional paid-in capital |
801,574 | 806,755 | ||||||
| Retained earnings |
502,201 | 385,810 | ||||||
| Treasury stock, at cost: 40,678 and 337,275 shares, respectively |
(853 | ) | (9,079 | ) | ||||
| Accumulated other comprehensive income (loss) |
8,812 | (1,484 | ) | |||||
| Total stockholders’ equity |
1,312,631 | 1,182,899 | ||||||
| Total liabilities and stockholders’ equity |
$ | 1,920,182 | $ | 1,864,514 | ||||
The accompanying notes are an integral part of the consolidated financial statements.
50
Table of Contents
Consolidated Statements of Income
| Year Ended December 31, | ||||||||||||
| (in thousands, except per share data) |
2009 | 2008 | 2007 | |||||||||
| Revenue: |
||||||||||||
| Software licenses |
$ | 315,633 | $ | 318,154 | $ | 253,287 | ||||||
| Maintenance and service |
201,252 | 160,185 | 132,053 | |||||||||
| Total revenue |
516,885 | 478,339 | 385,340 | |||||||||
| Cost of sales: |
||||||||||||
| Software licenses |
10,210 | 9,766 | 9,113 | |||||||||
| Amortization |
36,011 | 27,803 | 21,532 | |||||||||
| Maintenance and service |
50,021 | 53,845 | 47,402 | |||||||||
| Restructuring charges |
994 | — | — | |||||||||
| Total cost of sales |
97,236 | 91,414 | 78,047 | |||||||||
| Gross profit |
419,649 | 386,925 | 307,293 | |||||||||
| Operating expenses: |
||||||||||||
| Selling, general and administrative |
137,264 | 134,887 | 115,108 | |||||||||
| Research and development |
79,856 | 71,594 | 56,481 | |||||||||
| Amortization |
16,326 | 10,713 | 8,935 | |||||||||
| Restructuring charges |
2,726 | — | — | |||||||||
| Total operating expenses |
236,172 | 217,194 | 180,524 | |||||||||
| Operating income |
183,477 | 169,731 | 126,769 | |||||||||
| Interest expense |
(10,401 | ) | (9,342 | ) | (6,822 | ) | ||||||
| Interest income |
1,740 | 5,575 | 4,916 | |||||||||
| Other (expense) income, net |
(1,287 | ) | 727 | (600 | ) | |||||||
| Income before income tax provision |
173,529 | 166,691 | 124,263 | |||||||||
| Income tax provision |
57,138 | 55,020 | 41,871 | |||||||||
| Net income |
$ | 116,391 | $ | 111,671 | $ | 82,392 | ||||||
| Earnings per share—basic: |
||||||||||||
| Basic earnings per share |
$ | 1.32 | $ | 1.35 | $ | 1.06 | ||||||
| Weighted average shares—basic |
88,486 | 82,975 | 77,792 | |||||||||
| Earnings per share—diluted: |
||||||||||||
| Diluted earnings per share |
$ | 1.27 | $ | 1.29 | $ | 1.02 | ||||||
| Weighted average shares—diluted |
91,785 | 86,768 | 81,135 | |||||||||
The accompanying notes are an integral part of the consolidated financial statements.
51
Table of Contents
Consolidated Statements of Cash Flows
| Year Ended December 31, | ||||||||||||
| (in thousands) |
2009 | 2008 | 2007 | |||||||||
| Cash flows from operating activities: |
||||||||||||
| Net income |
$ | 116,391 | $ | 111,671 | $ | 82,392 | ||||||
| Adjustments to reconcile net income to net cash provided by operating activities: |
||||||||||||
| Depreciation and amortization |
64,186 | 50,093 | 38,949 | |||||||||
| Deferred income tax benefit |
(28,146 | ) | (13,323 | ) | (5,634 | ) | ||||||
| Provision for bad debts |
1,610 | 1,184 | 1,043 | |||||||||
| Stock-based compensation expense |
13,212 | 11,779 | 8,918 | |||||||||
| Excess tax benefits from stock options |
(13,168 | ) | (4,070 | ) | (7,406 | ) | ||||||
| Utilization of acquired net operating loss tax carryforward |
108 | 1,477 | 8,864 | |||||||||
| Other |
108 | 126 | 80 | |||||||||
| Changes in operating assets and liabilities, net of acquisitions: |
||||||||||||
| Accounts receivable |
(6,434 | ) | (4,551 | ) | (10,392 | ) | ||||||
| Other receivables and current assets |
10,166 | (19,578 | ) | (13,583 | ) | |||||||
| Other long-term assets |
1,340 | (380 | ) | (921 | ) | |||||||
| Accounts payable, accrued expenses and current liabilities |
12,913 | 9,467 | 6,055 | |||||||||
| Deferred revenue |
(606 | ) | 40,449 | 14,575 | ||||||||
| Other long-term liabilities |
2,009 | 12,364 | 4,188 | |||||||||
| Net cash provided by operating activities |
173,689 | 196,708 | 127,128 | |||||||||
| Cash flows from investing activities: |
||||||||||||
| Capital expenditures |
(8,311 | ) | (16,639 | ) | (10,758 | ) | ||||||
| Ansoft acquisition payments, net of cash acquired |
— | (320,130 | ) | — | ||||||||
| Purchases of short-term investments |
(9,899 | ) | (12,993 | ) | (4,460 | ) | ||||||
| Maturities of short-term investments |
7,491 | 11,763 | 20 | |||||||||
| Other |
(12 | ) | — | (220 | ) | |||||||
| Net cash used in investing activities |
(10,731 | ) | (337,999 | ) | (15,418 | ) | ||||||
| Cash flows from financing activities: |
||||||||||||
| Principal payments on long-term debt |
(53,924 | ) | (135,499 | ) | (62,434 | ) | ||||||
| Principal payments on capital leases |
(306 | ) | (506 | ) | (745 | ) | ||||||
| Proceeds from long-term debt |
— | 355,000 | — | |||||||||
| Loan commitment fees |
— | (4,609 | ) | — | ||||||||
| Proceeds from issuance of common stock under Employee Stock Purchase Plan |
1,515 | 1,720 | 1,470 | |||||||||
| Proceeds from exercise of stock options |
15,361 | 7,582 | 6,486 | |||||||||
| Purchase of treasury stock |
(39,904 | ) | (10,008 | ) | (8,012 | ) | ||||||
| Excess tax benefits from stock options |
13,168 | 4,070 | 7,406 | |||||||||
| Net cash (used in) provided by financing activities |
(64,090 | ) | 217,750 | (55,829 | ) | |||||||
| Effect of exchange rate fluctuations |
8,834 | (15,507 | ) | 7,028 | ||||||||
| Net increase in cash and cash equivalents |
107,702 | 60,952 | 62,909 | |||||||||
| Cash and cash equivalents, beginning of year |
228,176 | 167,224 | 104,315 | |||||||||
| Cash and cash equivalents, end of year |
$ | 335,878 | $ | 228,176 | $ | 167,224 | ||||||
| Supplemental disclosures of cash flow information: |
||||||||||||
| Cash paid during the year for: |
||||||||||||
| Income taxes |
$ | 58,859 | $ | 58,259 | $ | 36,516 | ||||||
| Interest |
8,642 | 8,085 | 6,307 | |||||||||
| Supplemental disclosures of non-cash operating activities: |
||||||||||||
| Utilization of acquired net operating loss tax carryforward |
$ | 108 | $ | 1,477 | $ | 8,864 | ||||||
| Supplemental disclosures of non-cash investing activities: |
||||||||||||
| Capital lease obligations |
$ | 96 | $ | 364 | $ | — | ||||||
| Stock issued in acquisitions |
— | 432,601 | — | |||||||||
The accompanying notes are an integral part of the consolidated financial statements.
52
Table of Contents
Consolidated Statements of Stockholders’ Equity
| Common Stock | Additional Paid-in Capital |
Retained Earnings |
Treasury Stock | Accumulated Other Comprehensive Income (Loss) |
Total Stockholders’ Equity |
Total Comprehensive Income |
||||||||||||||||||||||||||
| (in thousands) |
Shares | Amount | Shares | Amount | ||||||||||||||||||||||||||||
| Balance, December 31, 2006 |
78,339 | $ | 783 | $ | 344,615 | $ | 193,327 | 1,156 | $ | (11,650 | ) | $ | 7,718 | $ | 534,793 | |||||||||||||||||
| Treasury shares acquired |
— | — | — | — | 250 | (8,012 | ) | — | (8,012 | ) | ||||||||||||||||||||||
| Adoption of FIN 48 |
— | — | — | (1,580 | ) | — | — | — | (1,580 | ) | ||||||||||||||||||||||
| Stock-based compensation activity, including tax benefit of $8,029 |
— | — | 10,017 | — | (1,193 | ) | 13,619 | — | 23,636 | |||||||||||||||||||||||
| Issuance of common stock under Employee Stock Purchase Plan |
— | — | 609 | — | (73 | ) | 861 | — | 1,470 | |||||||||||||||||||||||
| Other comprehensive income |
— | — | — | — | — | — | 8,511 | 8,511 | $ | 8,511 | ||||||||||||||||||||||
| Net income for the year |
— | — | — | 82,392 | — | — | — | 82,392 | 82,392 | |||||||||||||||||||||||
| Balance, December 31, 2007 |
78,339 | 783 | 355,241 | 274,139 | 140 | (5,182 | ) | 16,229 | 641,210 | 90,903 | ||||||||||||||||||||||
| Acquisition of Ansoft Corporation |
10,296 | 103 | 432,498 | — | — | — | — | 432,601 | ||||||||||||||||||||||||
| Treasury shares acquired |
— | — | — | — | 368 | (10,008 | ) | — | (10,008 | ) | ||||||||||||||||||||||
| Stock-based compensation activity, including tax benefit of $4,055 |
1,050 | 11 | 18,465 | — | (139 | ) | 4,942 | — | 23,418 | |||||||||||||||||||||||
| Issuance of common stock under Employee Stock Purchase Plan |
31 | — | 551 | — | (32 | ) | 1,169 | — | 1,720 | |||||||||||||||||||||||
| Losses on interest rate swap, net of tax of $1,538 |
— | — | — | — | — | — | (2,491 | ) | (2,491 | ) | (2,491 | ) | ||||||||||||||||||||
| Other comprehensive loss |
— | — | — | — | — | — | (15,222 | ) | (15,222 | ) | (15,222 | ) | ||||||||||||||||||||
| Net income for the year |
— | — | — | 111,671 | — | — | — | 111,671 | 111,671 | |||||||||||||||||||||||
| Balance, December 31, 2008 |
89,716 | 897 | 806,755 | 385,810 | 337 | (9,079 | ) | (1,484 | ) | 1,182,899 | 93,958 | |||||||||||||||||||||
| Treasury shares acquired |
— | — | — | — | 2,070 | (39,904 | ) | — | (39,904 | ) | ||||||||||||||||||||||
| Stock-based compensation activity, including tax benefit of $12,679 |
— | — | (5,118 | ) | — | (2,298 | ) | 46,552 | — | 41,434 | ||||||||||||||||||||||
| Issuance of common stock under Employee Stock Purchase Plan |
— | — | (63 | ) | — | (68 | ) | 1,578 | — | 1,515 | ||||||||||||||||||||||
| Net gains on interest rate swap, net of tax of $1,217 |
— | — | — | — | — | — | 1,959 | 1,959 | 1,959 | |||||||||||||||||||||||
| Other comprehensive gain |
— | — | — | — | — | — | 8,337 | 8,337 | 8,337 | |||||||||||||||||||||||
| Net income for the year |
— | — | — | 116,391 | — | — | — | 116,391 | 116,391 | |||||||||||||||||||||||
| Balance, December 31, 2009 |
89,716 | $ | 897 | $ | 801,574 | $ | 502,201 | 41 | $ | (853 | ) | $ | 8,812 | $ | 1,312,631 | $ | 126,687 | |||||||||||||||
The accompanying notes are an integral part of the consolidated financial statements.
53
Table of Contents
NOTES TO CONSOLIDATED FINANCIAL STATEMENTS
| 1. | Organization |
ANSYS, Inc. (hereafter the “Company” or “ANSYS”) develops and globally markets engineering simulation software and technologies widely used by engineers and designers across a broad spectrum of industries, including aerospace, automotive, manufacturing, electronics, biomedical, energy and defense.
As defined by accounting guidance issued for disclosures about segments of an enterprise, the Company operates as two segments. However, the Company determined that its two operating segments may be aggregated under the criteria provided in accounting guidance for disclosures about segments. Given the integrated approach to the multi-discipline problem-solving needs of the Company’s customers, a single sale of software may contain components from multiple product areas and include combined technologies. As a result, it is impracticable for the Company to provide accurate historical or current reporting among its various product-lines.
| 2. | Summary of Significant Accounting Policies |
ACCOUNTING PRINCIPLES: The financial statements and accompanying notes are prepared in accordance with accounting principles generally accepted in the United States.
PRINCIPLES OF CONSOLIDATION: The accompanying consolidated financial statements include the accounts of the Company and its wholly owned subsidiaries. All intercompany accounts and transactions have been eliminated.
USE OF ESTIMATES: The preparation of financial statements in conformity with accounting principles generally accepted in the United States requires management to make estimates and assumptions that affect the reported amounts of assets and liabilities and disclosure of contingent assets and liabilities at the date of the financial statements. Estimates also affect the amounts of revenue and expenses during the reported periods. Significant estimates included in these consolidated financial statements include allowances for doubtful accounts receivable, income tax accruals, uncertain tax positions and tax valuation reserves, fair value of stock-based compensation, useful lives for depreciation and amortization, loss contingencies and valuation of goodwill and indefinite lived intangible assets. Actual results could differ from these estimates. Changes in estimates are recorded in the results of operations in the period that the changes occur.
REVENUE RECOGNITION: Revenue is derived principally from the licensing of computer software products and from related maintenance contracts. Revenue from perpetual licenses is classified as license revenue and is recognized upon delivery of the licensed product and the utility that enables the customer to access authorization keys, provided that acceptance has occurred and a signed contractual obligation has been received, the price is fixed and determinable, and collectibility of the receivable is probable. The Company determines the fair value of post-contract customer support (“PCS”) sold together with perpetual licenses based on the contractual renewal rate for PCS when sold on a standalone basis. Revenue from PCS contracts is classified as maintenance and service revenue and is recognized ratably over the term of the contract.
Revenue for software lease licenses is classified as license revenue and is recognized over the period of the lease contract. Typically, the Company’s software leases include PCS which, due to the short term (principally one year or less) of the Company’s software lease licenses, cannot be separated from lease revenue for accounting purposes. As a result, both the lease license and PCS are recognized ratably over the lease period. Due to the short-term nature of the software lease licenses and the frequency with which the Company provides major product upgrades (typically 12 – 18 months), the Company does not believe that a significant portion of the fee paid under the arrangement is attributable to the PCS component of the arrangement and, as a result, includes the revenue for the entire arrangement within software license revenue in the consolidated statements of income.
Revenue from training, support and other services is recognized as the services are performed. The Company applies the specific performance method to contracts in which the service consists of a single act, such
54
Table of Contents
as providing a training class to a customer, and the proportional performance method to other service contracts that are longer in duration and often include multiple acts (for example, both training and consulting). In applying the proportional performance method, the Company typically utilizes output-based estimates for services with contractual billing arrangements that are not based on time and materials, and estimates output based on the total tasks completed as compared to the total tasks required for each work contract. Input-based estimates are utilized for services that involve general consultations with contractual billing arrangements based on time and materials, utilizing direct labor as the input measure.
The Company also executes arrangements through channel partners in which the channel partners are authorized to market and distribute the Company’s software products to end users of the Company’s products and services in specified territories. In sales facilitated by channel partners, the channel partner bears the risk of collection from the end user customer. The Company recognizes revenue from transactions with channel partners when the channel partner submits a written purchase commitment, collectibility from the channel partner is probable, a signed license agreement is received from the end user customer and delivery has occurred to the end user customer, provided that all other revenue recognition criteria are satisfied. Revenue from channel partner transactions is the amount remitted to the Company by the channel partners. This amount includes a fee for PCS that is compensation for providing technical enhancements and the second level of technical support to the end user, which is based on the contractual renewal rate in the end user customer’s license agreement and is recognized over the period that PCS is to be provided. The Company does not offer right of return, product rotation or price protection to any of its channel partners.
Non-income related taxes collected from customers and remitted to governmental authorities are recorded on the balance sheet as accounts receivable and accrued expenses. The collection and payment of these amounts is reported on a net basis in the consolidated statements of income and does not impact reported revenues or expenses.
The Company warrants to its customers that its software will substantially perform as specified in the Company’s most current user manuals. The Company has not experienced significant claims related to software warranties beyond the scope of maintenance support, which the Company is already obligated to provide, and consequently the Company has not established reserves for warranty obligations.
CASH AND CASH EQUIVALENTS: Cash and cash equivalents consist primarily of highly liquid investments such as time deposits held at major banks, money market mutual funds and other securities with original maturities of three months or less. Cash equivalents are carried at cost, which approximates fair value.
The Company’s cash and cash equivalents are comprised of the following:
| December 31, | ||||||
| (in thousands) |
2009 | 2008 | ||||
| Money market mutual funds |
$ | 170,577 | $ | 37,845 | ||
| Cash accounts |
165,301 | 190,331 | ||||
| Total |
$ | 335,878 | $ | 228,176 | ||
SHORT-TERM INVESTMENTS: The Company considers investments backed by government agencies or financial institutions to be highly liquid and classifies such investments as short-term investments. Short-term investments are recorded at fair value. The Company uses the specific identification method to determine the realized gain or loss upon the sale of such securities. As of the balance sheet date, there were no significant unrealized gains or losses on the investments, all of which had maturities or renewal options of less than one year.
The Company is averse to principal loss and seeks to preserve invested funds by limiting default risk, market risk and reinvestment risk by placing its investments with high-quality credit issuers.
PROPERTY AND EQUIPMENT: Property and equipment is stated at cost. Depreciation is computed on the straight-line method over the estimated useful lives of the various classes of assets, which range from one to
55
Table of Contents
40 years. Repairs and maintenance are charged to expense as incurred. Gains or losses from the sale or retirement of property and equipment are included in operating income.
RESEARCH AND DEVELOPMENT COSTS: Research and development costs, other than certain capitalized software development costs, are expensed as incurred.
CAPITALIZED SOFTWARE: Internally developed computer software costs and costs of product enhancements are capitalized subsequent to the determination of technological feasibility; such capitalization continues until the product becomes available for general release. Judgment is required in determining when technological feasibility of a product is established. The Company has determined that technological feasibility is reached after all high-risk development issues have been resolved through coding and testing. Generally, this occurs shortly before the products are released to manufacturing. Amortization of capitalized software costs, both for internally developed as well as for purchased software products, is computed on a product-by-product basis over the estimated economic life of the product, which is generally three years. Amortization is the greater of the amount computed using: (i) the ratio of the current year’s gross revenue to the total current and anticipated future gross revenue for that product or (ii) the straight-line method over the estimated life of the product. Amortization expense related to capitalized and acquired software costs was $36.0 million, $27.8 million and $21.5 million for the years ended December 31, 2009, 2008 and 2007, respectively. These amounts include amortization expense related to capitalized costs of internally developed software of $300,000, $400,000 and $500,000 for the years ended December 31, 2009, 2008 and 2007, respectively.
The Company periodically reviews the carrying value of capitalized software. Impairments are recognized in the results of operations when the expected future undiscounted operating cash flow derived from the capitalized costs of internally developed software is less than the carrying value. No charges for impairment have been required to date.
GOODWILL AND OTHER INTANGIBLE ASSETS: Goodwill represents the excess of the purchase price over the fair value of net assets acquired. Intangible assets consist of trademarks, non-compete agreements, customer lists, and acquired software and technology.
The Company evaluates, at least annually, the realizability of the carrying value of goodwill and indefinite lived intangible assets by comparing the carrying value of the asset (or, in the case of goodwill, the Company’s reporting units) to its estimated fair value. The Company performs its annual goodwill and indefinite lived intangible assets impairment test on January 1 of each year unless there is an indicator that would require a test during the year. No impairment charges have been required to date.
The Company periodically reviews the carrying value of other intangible assets and will recognize impairments when events or circumstances indicate that such assets may be impaired. No impairment charges have been required to date.
The Company reconsidered the indefinite life associated with the Fluent trademark, as well as the trademark acquired in the 2003 acquisition of CFX, as part of the product and naming strategy changes that occurred as a result of the July 31, 2008 acquisition of Ansoft. During the third quarter of 2008, the Company completed an impairment test for these trademarks and determined that these assets had not been impaired as of the test date, July 31, 2008, and determined that such trademarks had a remaining finite useful life of ten years. Accordingly, on July 31, 2008, the Company began amortizing these trademarks over a ten-year period.
CONCENTRATIONS OF CREDIT RISK: The Company has a concentration of credit risk with respect to trade receivables due to the use of certain significant channel partners to market and sell the Company’s products. The Company performs periodic credit evaluations of its customers’ financial condition and generally does not require collateral.
During 2009, sales by channel partners comprised 26% of the Company’s total revenue, with two channel partners each individually accounting for 5% and 3% of total revenue. During 2008, sales by channel partners comprised 30% of the Company’s total revenue, with two channel partners each individually accounting for 6% and 3% of total revenue. During 2007, sales by channel partners comprised 30% of the Company’s total revenue,
56
Table of Contents
with two channel partners each individually accounting for 6% and 4% of total revenue. The decrease in the percentage of sales by channel partners compared to historic trends was primarily attributable to the acquisitions of Ansoft and Fluent, both of which primarily utilized a direct sales model. The Company had no individual customer account for more than 10% of revenue in the years ended December 31, 2009, 2008 or 2007.
In addition to the concentration of credit risk with respect to trade receivables, the Company’s cash and cash equivalents are also exposed to concentration of credit risk. The Company maintains certain cash accounts in U.S. banks that are currently insured by the Federal Deposit Insurance Corporation (“FDIC”) up to $250,000 per depositor through December 31, 2013. On January 1, 2014 the insured amount will return to $100,000 per depositor. The Company had cash balances on deposit with four U.S. banks at December 31, 2009 that exceeded the $250,000 balance insured by the FDIC in the amount of $31.9 million. As a result of the Company’s operations in international locations, it also had $160.1 million of uninsured cash balances held outside the U.S. The Company maintains certain cash equivalent accounts in U.S. financial institutions that are protected by the Securities Investor Protection Corporation (“SIPC”) up to $500,000 per customer. The Company had cash equivalent balances with one U.S. financial institution at December 31, 2009 that exceeded the $500,000 balance protected by the SIPC in the amount of $124.3 million. The Company also maintains approximately $10.0 million in a cash equivalent account that is guaranteed in full by the Ireland government.
ALLOWANCE FOR DOUBTFUL ACCOUNTS: The Company makes judgments as to its ability to collect outstanding receivables and provides allowances for a portion of receivables when collection becomes doubtful. Provisions are made based upon a specific review of all significant outstanding invoices from both value and delinquency perspectives. For those invoices not specifically reviewed, provisions are provided at differing rates based upon the age of the receivable and the geographical area of origin. In determining these percentages, the Company considers its historical collection experience and current economic trends in the customer’s industry and geographic region. The Company recorded provisions for doubtful accounts of $1.6 million, $1.2 million and $1.0 million for the years ended December 31, 2009, 2008 and 2007, respectively.
INCOME TAXES: The Company accounts for income taxes under the asset and liability method, which requires the recognition of deferred tax assets and liabilities for the expected future tax consequences of events that have been included in the financial statements. Under this method, deferred tax assets and liabilities are determined based on the differences between the financial statement and tax bases of assets and liabilities using enacted tax rates in effect for the year in which the differences are expected to reverse. The effect of a change in tax rates on deferred tax assets and liabilities is recognized in income in the period of the enactment date.
The Company records net deferred tax assets to the extent it believes these assets will more likely than not be realized. In making such determination, the Company considers all available positive and negative evidence, including scheduled reversals of deferred tax liabilities, projected future taxable income, tax planning strategies and recent financial operations. In the event the Company determines that it would be able to realize deferred income tax assets in the future in excess of their net recorded amount, an adjustment to the valuation allowance would be recorded that would reduce the provision for income taxes.
In July 2006, accounting guidance was issued on accounting for the uncertainty in income taxes. The accounting guidance clarified the accounting for uncertainty in income taxes recognized in the financial statements. The accounting guidance clarified that a tax benefit from an uncertain tax position may be recognized when it is more likely than not that the position will be sustained upon examination, including resolutions of any related appeals or litigation processes, based on the technical merits. Income tax positions must meet a more-likely-than-not recognition threshold at the effective date to be recognized upon the adoption of the accounting guidance and in subsequent periods. The accounting guidance also provides guidance on measurement, derecognition, classification, interest and penalties, accounting in interim periods, disclosure and transition. The Company adopted the accounting guidance on January 1, 2007.
The Company recognizes interest and penalties related to unrecognized tax benefits within the income tax expense line in the accompanying consolidated statements of income. Accrued interest and penalties are included within the related tax liability line in the consolidated balance sheet.
57
Table of Contents
FOREIGN CURRENCIES: Certain of the Company’s sales transactions are denominated in foreign currencies. These transactions are translated to the functional currency at the exchange rate on the transaction date. Accounts receivable in foreign currencies at year end are translated at the effective exchange rate on the balance sheet date. Gains and losses resulting from foreign exchange transactions are included in other income. The Company recorded a net foreign exchange loss of $1.4 million for the year ended December 31, 2009, gain of $700,000 for the year ended December 31, 2008 and a loss of $700,000 for the year ended December 31, 2007.
The financial statements of the Company’s foreign subsidiaries are translated from the functional (local) currency to U.S. Dollars. Assets and liabilities are translated at the exchange rates on the balance sheet date. Results of operations are translated at average exchange rates, which approximate rates in effect when the underlying transactions occur.
ACCUMULATED OTHER COMPREHENSIVE INCOME (LOSS): The components of accumulated other comprehensive income (loss) are as follows:
| December 31, | ||||||||
| (in thousands) |
2009 | 2008 | ||||||
| Foreign currency translation adjustment |
$ | 9,344 | $ | 1,007 | ||||
| Unrealized losses on interest rate swap, net of tax of $321 and $1,538, respectively |
(532 | ) | (2,491 | ) | ||||
| Accumulated other comprehensive income (loss) |
$ | 8,812 | $ | (1,484 | ) | |||
The components of comprehensive income are as follows:
| Year Ended December 31, | ||||||||
| (in thousands) |
2009 | 2008 | ||||||
| Net income |
$ | 116,391 | $ | 111,671 | ||||
| Foreign currency translation adjustment |
8,337 | (15,222 | ) | |||||
| Unrealized loss on interest rate swap, net of tax |
(483 | ) | (2,489 | ) | ||||
| Realized loss (gain) on interest rate swap reclassed into interest expense, |
2,442 | (2 | ) | |||||
| Comprehensive income |
$ | 126,687 | $ | 93,958 | ||||
EARNINGS PER SHARE: Basic earnings per share (“EPS”) amounts are computed by dividing earnings by the average number of common shares outstanding during the period. Diluted EPS amounts assume the issuance of common stock for all potentially dilutive equivalents outstanding. To the extent stock options are anti-dilutive, they are excluded from the calculation of diluted earnings per share. The details of basic and diluted earnings per share are as follows:
| (in thousands, except per share data) |
Year Ended December 31, | ||||||||
| 2009 | 2008 | 2007 | |||||||
| Net income |
$ | 116,391 | $ | 111,671 | $ | 82,392 | |||
| Weighted average shares outstanding—basic |
88,486 | 82,975 | 77,792 | ||||||
| Dilutive effect of outstanding stock options and deferred stock units |
3,299 | 3,793 | 3,343 | ||||||
| Weighted average shares outstanding—diluted |
91,785 | 86,768 | 81,135 | ||||||
| Basic earnings per share |
$ | 1.32 | $ | 1.35 | $ | 1.06 | |||
| Diluted earnings per share |
$ | 1.27 | $ | 1.29 | $ | 1.02 | |||
| Anti-dilutive options |
2,612 | 1,646 | 1,274 | ||||||
58
Table of Contents
STOCK-BASED COMPENSATION: The Company accounts for stock-based compensation in accordance with share-based payment accounting guidance. The guidance requires an entity to measure the cost of employee services received in exchange for an award of equity instruments based on the grant-date fair value of the award. The cost is recognized over the period during which an employee is required to provide service in exchange for the award, typically the vesting period.
Stock-Based Compensation Information
The weighted average fair values of options granted during the years ended December 31, 2009, 2008 and 2007 were $15.81, $11.98 and $14.03 per share, respectively. The fair value of each option grant is estimated on the date of grant using the Black-Scholes option pricing model, which was developed for use in estimating the fair value of traded options that have no vesting restrictions and are fully transferable. The Company’s options have characteristics significantly different from those of traded options, and changes in input assumptions can materially affect the fair value estimates. The interest rates used were determined by using the five-year Treasury Note yield at the date of grant. The volatility was determined based on the historic volatility of the Company’s stock during the preceding six years for 2009 and during the preceding five years for 2008 and 2007. The following assumptions were also used to determine the fair value of each option grant:
| Compensation Expense December 31, | ||||||
| Assumption used in Black-Scholes option pricing model |
2009 | 2008 | 2007 | |||
| Risk-free interest rate |
1.86% to 2.69% | 2.33% to 3.11% | 3.41% to 4.63% | |||
| Expected dividend yield |
0% | 0% | 0% | |||
| Expected volatility |
41% | 39% | 36% | |||
| Expected term |
6.1 years | 5.8 years | 4.9 years | |||
As stock-based compensation expense recognized in the consolidated statements of income for 2009, 2008 and 2007 is based on awards ultimately expected to vest, it should be reduced for estimated forfeitures. Forfeitures are estimated at the time of grant and revised, if necessary, in subsequent periods if actual forfeitures differ from those estimates. The effect of pre-vesting forfeitures on the Company’s recorded expense has historically been negligible due to the relatively low turnover of stock option holders.
Total stock-based compensation expense, recognized for the years ended December 31, 2009, 2008 and 2007, is as follows:
| Year Ended December 31, | ||||||||||||
| (in thousands) |
2009 | 2008 | 2007 | |||||||||
| Cost of sales: |
||||||||||||
| Software licenses |
$ | 83 | $ | 72 | $ | 52 | ||||||
| Maintenance and service |
1,069 | 783 | 518 | |||||||||
| Operating expenses: |
||||||||||||
| Selling, general and administrative |
8,296 | 8,022 | 6,299 | |||||||||
| Research and development |
3,764 | 2,902 | 2,049 | |||||||||
| Stock-based compensation expense before taxes |
13,212 | 11,779 | 8,918 | |||||||||
| Related income tax benefits |
(2,687 | ) | (2,833 | ) | (1,566 | ) | ||||||
| Stock-based compensation expense, net of taxes |
$ | 10,525 | $ | 8,946 | $ | 7,352 | ||||||
The net impact of stock-based compensation expense reduced 2009 basic and diluted earnings per share by $0.12 and $0.11, respectively, reduced 2008 basic and diluted earnings per share by $0.11 and $0.10, respectively, and reduced 2007 basic and diluted earnings per share each by $0.09.
The Company recorded stock-based compensation expense of $1.0 million, $1.9 million and $1.3 million during 2009, 2008 and 2007, respectively, related to stock-based awards granted during each respective year.
59
Table of Contents
FAIR VALUE OF FINANCIAL INSTRUMENTS: The carrying values of cash, cash equivalents, accounts receivable, accounts payable, accrued expenses, other accrued liabilities and short-term obligations are deemed to be reasonable estimates of their fair values because of their short-term nature. The fair values of investments are based on quoted market prices for those or similar investments. The carrying value of long-term debt is considered a reasonable estimate of fair value due to the variable interest rate underlying the Company’s credit facility. The Company’s interest rate swap agreement is recorded at fair value, utilizing the value of a hypothetical derivative with the same characteristics as the swap agreement.
DERIVATIVE FINANCIAL INSTRUMENTS: The Company holds a derivative financial instrument to manage interest rate risk. The Company accounts for this instrument as a cash flow hedge in accordance with derivative instruments and hedging activities accounting guidance, which requires that every derivative instrument be recorded on the balance sheet as either an asset or liability measured at its fair value as of the reporting date. This guidance also requires that changes in the Company’s derivative fair value be recognized in earnings, unless specific hedge accounting and documentation criteria are met (i.e. the instrument is accounted for as a hedge). The Company records the effective portion of its derivative financial instrument in accumulated other comprehensive income on the consolidated balance sheets. Any ineffective portion or excluded portion of the designated cash flow hedge would be recognized in earnings. The Company’s current cash flow hedge does not have an ineffective or excluded portion. The Company utilizes the hypothetical derivative method to ensure the hedge is effective in offsetting variability in interest expense associated with its credit facility. The Company uses the dollar offset method for calculating ineffectiveness by comparing the cumulative fair value of the swap to the cumulative fair value of the hypothetical derivative.
OTHER RECENTLY ISSUED ACCOUNTING PRONOUNCEMENTS:
Fair Value Measurements: In February 2008, accounting guidance was issued on fair value measurements. The accounting guidance delayed the effective date for the application of recently adopted accounting for fair value measurements to nonfinancial assets and nonfinancial liabilities that are recognized or disclosed at fair value in the financial statements on a nonrecurring basis until fiscal years beginning after November 15, 2008. The Company adopted the provisions for nonfinancial assets and nonfinancial liabilities required to be recognized at fair value on a nonrecurring basis as of January 1, 2009 and it did not have a material impact on the Company’s consolidated financial statements.
Derivative Instruments and Hedging Activities Disclosures: In March 2008, new accounting guidance was issued requiring expanded disclosure about derivative instruments and hedging activities to provide an enhanced understanding of the use of derivative instruments, how they are accounted for and their effect on financial position, financial performance and cash flows. The Company adopted the accounting guidance on January 1, 2009. See Note 8 for the Company’s disclosures regarding its derivative financial instrument.
Fair Value Disclosures in Interim and Annual Reports: In April 2009, new accounting guidance was issued to enhance disclosures of the fair value of financial instruments for both interim and annual periods. The Company adopted the new accounting guidance as of June 30, 2009. See Note 8 for the Company’s disclosures related to the fair value of its financial instruments.
References of Accounting Standards: In June 2009, Accounting Standards CodificationTM was issued and replaces the previously issued authoritative accounting guidance. The new accounting guidance identifies the source of authoritative accounting principles recognized by the Financial Accounting Standards Board to be applied by nongovernmental entities in the preparation of financial statements in conformity with generally accepted accounting principles. The Company adopted the new accounting guidance as of September 30, 2009.
Revenue Recognition for Multiple-Deliverable Arrangements: In October 2009, new accounting guidance was issued for revenue arrangements with multiple deliverables that are outside the scope of the software revenue recognition guidance. Under the new accounting guidance, when vendor specific objective evidence or third
60
Table of Contents
party evidence for deliverables in an arrangement cannot be determined, a best estimate of the selling price is required to separate deliverables and allocate arrangement consideration using the relative selling price method. The new guidance includes new disclosure requirements on how the application of the relative selling price method affects the timing and amount of revenue recognition. This guidance is effective prospectively for revenue arrangements entered into or materially modified in fiscal years beginning on or after June 15, 2010. This guidance is not expected to have an impact on the Company’s financial position, results of operations and cash flows.
Revenue Recognition for Certain Arrangements that Include Software Elements: In October 2009, new accounting guidance was issued for revenue arrangements that include both tangible products and software elements. This new accounting guidance affects companies that sell or lease tangible products in an arrangement that contains software that is more than incidental to the tangible product as a whole. Additionally, clarification is given regarding what guidance should be used in allocation and measuring revenue. This guidance is effective prospectively for revenue arrangements entered into or materially modified in fiscal years beginning on or after June 15, 2010. This guidance is not expected to have an impact on the Company’s financial position, results of operations and cash flows.
| 3. | Acquisitions |
On July 31, 2008, the Company completed its acquisition of Ansoft, a global provider of simulation software for high-performance electronic design. Under the terms of the merger agreement, Ansoft stockholders received $16.25 in cash and 0.431882 shares of ANSYS common stock for each outstanding Ansoft share held on July 31, 2008. ANSYS issued an aggregate of 12.24 million shares of its common stock, including 1.95 million shares pursuant to assumed stock options, valued at approximately $432.6 million based on the average closing market price on the two days preceding and the two days following the announcement of the acquisition, and paid approximately $387.3 million in cash. The total purchase price of approximately $823.8 million includes approximately $3.9 million in transaction fees. The Company used a combination of existing cash and proceeds from a $355.0 million unsecured senior term loan credit facility to fund the transaction. In addition to the $3.9 million in transaction-related costs, the Company incurred financing costs of approximately $4.6 million related to the credit facility.
The operating results of Ansoft have been included in the Company’s consolidated financial statements since the date of acquisition, July 31, 2008. The total purchase price was allocated to the foreign and domestic assets and liabilities of Ansoft based upon management’s estimates of the fair market values of the assets acquired and the liabilities assumed. The allocation included $235.2 million to identifiable intangible assets (including $98.4 million to developed software to be amortized over ten years, $97.4 million to customer contracts and related relationships to be amortized over 13 years, and $39.4 million to trademarks to be amortized over ten years) and $599.2 million to goodwill, which is not tax deductible.
In valuing deferred revenue on the Ansoft balance sheet as of the acquisition date and applying fair value provisions for business combinations, acquired deferred revenue of $7.5 million was recorded. This amount was approximately $23.5 million lower than the historical carrying value.
The following table summarizes the preliminary fair values of the assets acquired and liabilities assumed at the date of acquisition of Ansoft:
| (in thousands) |
At July 31, 2008 | |||
| Cash and other net tangible assets and liabilities |
$ | 83,533 | ||
| Goodwill |
599,157 | |||
| Identifiable intangible assets |
235,200 | |||
| Net deferred tax liabilities |
(94,072 | ) | ||
| Total preliminary purchase price allocation |
$ | 823,818 | ||
61
Table of Contents
| 4. | Other Current Assets |
The Company reports accounts receivable, related to the portion of annual lease licenses and software maintenance that has not yet been recognized as revenue, as a component of other receivables and current assets. These amounts totaled $69.8 million and $74.3 million as of December 31, 2009 and 2008, respectively.
| 5. | Property and Equipment |
Property and equipment consists of the following:
| December 31, | ||||||||||
| (in thousands) |
Estimated Useful Lives | 2009 | 2008 | |||||||
| Equipment |
1-10 years | $ | 33,248 | $ | 31,433 | |||||
| Buildings |
20-40 years | 9,830 | 9,755 | |||||||
| Computer software |
1-5 years | 24,718 | 19,734 | |||||||
| Furniture |
1-13 years | 4,457 | 4,308 | |||||||
| Land |
1,367 | 1,377 | ||||||||
| Leasehold improvements |
1-10 years | 5,592 | 5,375 | |||||||
| 79,212 | 71,982 | |||||||||
| Less: Accumulated depreciation and amortization |
(44,081 | ) | (35,170 | ) | ||||||
| $ | 35,131 | $ | 36,812 | |||||||
The amounts reflected above, as of December 31, 2009 and 2008, include $1.1 million and $1.9 million ($360,000 and $290,000, net of accumulated depreciation), respectively that was acquired through capital lease commitments.
Depreciation and amortization expense related to property and equipment, including the amounts acquired through capital lease commitments, was $10.6 million, $10.1 million and $8.0 million for the years ended December 31, 2009, 2008 and 2007, respectively.
| 6. | Goodwill and Other Intangible Assets |
Goodwill represents the excess of the cost over the value of net tangible and identifiable intangible assets of acquired businesses. Identifiable intangible assets acquired in business combinations are recorded based upon fair market value at the date of acquisition.
During the first quarter of 2009, the Company completed the annual impairment test for goodwill and intangible assets with indefinite lives and determined that these assets had not been impaired as of the test date, January 1, 2009. The Company tested the goodwill and identifiable intangible assets utilizing estimated cash flow methodologies and market comparable information. No events occurred or circumstances changed during the year ended December 31, 2009 that would indicate that the fair values of the Company’s reporting units are below their carrying amount.
Identifiable intangible assets with finite lives are amortized on either a straight-line basis over their estimated useful lives or under the proportional cash flow method and are reviewed for impairment whenever events or circumstances indicate that the carrying amounts may not be recoverable.
Certain trademarks listed in the table below were originally determined to have an indefinite life and, accordingly, were not amortized. The Company reconsidered the indefinite life associated with these trademarks as part of the product and naming strategy changes that occurred as a result of the July 31, 2008 acquisition of Ansoft. During the third quarter of 2008, the Company completed an impairment test for these trademarks and determined that these assets had not been impaired as of the test date, July 31, 2008, and determined that such
62
Table of Contents
trademarks had a remaining finite useful life of ten years. Accordingly, these trademarks are being amortized over a ten-year period beginning July 31, 2008.
As of December 31, 2009 and 2008, the Company’s intangible assets have estimated useful lives and are classified as follows:
| (in thousands) |
December 31, 2009 | December 31, 2008 | ||||||||||||
| Gross Carrying Amount |
Accumulated Amortization |
Gross Carrying Amount |
Accumulated Amortization |
|||||||||||
| Amortized intangible assets: |
||||||||||||||
| Core technology (3–10 years) |
$ | 205,212 | $ | (96,851 | ) | $ | 203,887 | $ | (68,472 | ) | ||||
| Trademarks (3–10 years) |
101,034 | (12,591 | ) | 100,924 | (3,981 | ) | ||||||||
| Non-compete agreements (2–5 years) |
712 | (505 | ) | 1,164 | (683 | ) | ||||||||
| Customer lists (3–13 years) |
169,184 | (44,239 | ) | 167,781 | (27,579 | ) | ||||||||
| Total |
$ | 476,142 | $ | (154,186 | ) | $ | 473,756 | $ | (100,715 | ) | ||||
| Unamortized intangible assets: |
||||||||||||||
| Trademarks |
$ | 357 | $ | 357 | ||||||||||
Amortization expense for intangible assets reflected above was $52.0 million, $38.1 million, and $29.9 million for the years ended December 31, 2009, 2008 and 2007, respectively.
Amortization expense for the amortized intangible assets reflected above is expected to be approximately $48.6 million, $45.3 million, $42.0 million, $37.0 million and $34.8 million for the years ending December 31, 2010, 2011, 2012, 2013 and 2014, respectively.
The changes in goodwill during the years ended December 31, 2009 and 2008 are as follows:
| Year Ended December 31, | ||||||||
| (in thousands) |
2009 | 2008 | ||||||
| Beginning balance |
$ | 1,048,003 | $ | 453,689 | ||||
| Acquisitions |
(4,649 | ) | 600,139 | |||||
| Ansoft stock option tax benefit |
(5,493 | ) | (3,913 | ) | ||||
| Currency translation |
963 | (1,874 | ) | |||||
| Other |
— | (38 | ) | |||||
| Ending balance |
$ | 1,038,824 | $ | 1,048,003 | ||||
In conjunction with the Ansoft acquisition, Ansoft stock option holders received approximately 1.94 million fully vested ANSYS options. As these options are exercised, ANSYS may receive a tax benefit that will be treated as a reduction in goodwill. As of December 31, 2009, there are currently 703,000 shares underlying these options outstanding.
| 7. | Long-Term Debt |
Borrowings consist of the following:
| Year Ended December 31, | ||||||||
| (in thousands) |
2009 | 2008 | ||||||
| Term loan payable in quarterly installments with a final maturity of July 31, 2013 |
$ | 225,076 | $ | 279,000 | ||||
| Capitalized lease obligations |
350 | 425 | ||||||
| Total |
225,426 | 279,425 | ||||||
| Less current portion |
(26,758 | ) | (29,630 | ) | ||||
| Long-term debt and capital lease obligations, net of current portion |
$ | 198,668 | $ | 249,795 | ||||
63
Table of Contents
On May 1, 2006, ANSYS borrowed $198.0 million from a syndicate of banks. The interest rate on the indebtedness was based on the Company’s consolidated leverage ratio and generally ranged from LIBOR + (0.50% – 1.25%) or, at the Company’s election, prime rate + (0.00% – 0.25%). On June 30, 2008, the Company paid all remaining outstanding loan balances under this term loan.
On July 31, 2008, ANSYS borrowed $355.0 million from a syndicate of banks. The interest rate on the indebtedness provides for tiered pricing with the initial rate at the prime rate + 0.50%, or the LIBOR rate + 1.50%, with step downs permitted after the initial six months under the credit agreement down to a flat prime rate or the LIBOR rate + 0.75%. Such tiered pricing is determined by the Company’s consolidated leverage ratio. The Company’s consolidated leverage ratio has been reduced to the lowest level in the debt agreement. During the year ended December 31, 2009, the Company made the required quarterly principal payments of $27.9 million in the aggregate. In addition, the Company made prepayments during the year ended December 31, 2009 totaling $26.0 million, which reduce, on a pro-rata basis, future quarterly principal installments. As of December 31, 2009, required future principal payments total $26.5 million in 2010, $39.7 million in 2011, $92.7 million in 2012 and $66.2 million in 2013.
The Company entered into an interest rate swap agreement in order to hedge a portion of each of the first eight forecasted quarterly variable rate interest payments on the Company’s term loan. Under the swap agreement, the Company receives the variable, three-month LIBOR rate required under its term loan and pays a fixed LIBOR interest rate of 3.32% on the notional amount. The initial notional amount of $300.0 million is amortized equally at an amount of $37.5 million over eight quarters through June 30, 2010. Because the Company intends to pay the LIBOR rate on its underlying credit agreement, the interest rate swap agreement qualifies for hedge accounting.
For the year ended December 31, 2009, the Company recorded interest expense related to the term loan at a weighted average interest rate of 3.41%. If the Company did not enter into the interest rate swap agreement, the weighted average interest rate would have been 1.88%. For the year ended December 31, 2008, the Company recorded interest expense related to the term loans at a weighted average interest rate of 4.72%. If the Company did not enter into the interest rate swap agreement, the weighted average interest rate would have been 4.73%. The interest expense on the term loans and amortization related to debt financing costs were as follows:
| Year Ended December 31, | ||||||||||||
| 2009 | 2008 | |||||||||||
| (in thousands) |
Interest Expense |
Amortization | Interest Expense |
Amortization | ||||||||
| May 1, 2006 term loan |
$ | — | $ | — | $ | 1,219 | $ | 952 | ||||
| July 31, 2008 term loan (interest expense includes $3,959 loss and $3 gain, respectively, on interest rate swap) |
8,824 | 1,229 | 6,524 | 573 | ||||||||
| Total |
$ | 8,824 | $ | 1,229 | $ | 7,743 | $ | 1,525 | ||||
The interest rate for the July 31, 2008 term loan is set for the first quarter of 2010 as follows:
| Three Months Ending | ||||||
| March 31, 2010 Applicable Rate |
||||||
| LIBOR rate + 0.75% |
Hedged rate + 0.75% |
|||||
| $150.1 million unhedged portion of term loan |
1.00 | % | — | |||
| $75.0 million hedged portion of term loan |
— | 4.07 | % | |||
As of December 31, 2009, the fair value of the debt approximated the recorded value.
64
Table of Contents
The credit agreement associated with the Ansoft acquisition includes covenants related to the consolidated leverage ratio and the consolidated fixed charge coverage ratio, as well as certain restrictions on additional investments and indebtedness. As of December 31, 2009, the Company is in compliance with all financial covenants as stated in the credit agreement.
| 8. | Fair Value Measurement |
The valuation hierarchy for disclosure of assets and liabilities reported at fair value prioritizes the inputs for such valuations into three broad levels. Level 1 inputs are quoted prices (unadjusted) in active markets for identical assets or liabilities. Level 2 inputs are quoted prices for similar assets and liabilities in active markets or inputs that are observable for the asset or liability, either directly or indirectly through market corroboration, for substantially the full term of the financial instrument. Level 3 inputs are unobservable inputs based on the Company’s own assumptions used to measure assets and liabilities at fair value. A financial asset or liability’s classification within the hierarchy is determined based on the lowest level input that is significant to the fair value measurement.
The following tables provide the assets and liabilities carried at fair value and measured on a recurring basis as of December 31, 2009 and December 31, 2008:
| December 31, 2009 |
Fair Value Measurements at Reporting Date Using: | |||||||||||||
| (in thousands) |
Quoted Prices in Active Markets (Level 1) |
Significant
Other Observable Inputs (Level 2) |
Significant Unobservable Inputs (Level 3) | |||||||||||
| Assets |
||||||||||||||
| Cash equivalents |
$ | 170,577 | $ | 170,577 | $ | — | $ | — | ||||||
| Short-term investments |
$ | 7,966 | $ | — | $ | 7,966 | $ | — | ||||||
| Liabilities |
||||||||||||||
| Interest rate swap agreement |
$ | (853 | ) | $ | — | $ | (853 | ) | $ | — | ||||
| (in thousands) |
December 31, 2008 |
Fair Value Measurements at Reporting Date Using: | ||||||||||||
| Quoted Prices in Active Markets (Level 1) |
Significant
Other Observable Inputs (Level 2) |
Significant Unobservable Inputs (Level 3) | ||||||||||||
| Assets |
||||||||||||||
| Cash equivalents |
$ | 37,845 | $ | 37,845 | $ | — | $ | — | ||||||
| Short-term investments |
$ | 5,699 | $ | — | $ | 5,699 | $ | — | ||||||
| Liabilities |
||||||||||||||
| Interest rate swap agreement |
$ | (4,029 | ) | $ | — | $ | (4,029 | ) | $ | — | ||||
The cash equivalents in the preceding tables represent money market mutual funds.
The short-term investments carried at fair value in the preceding tables represent deposits held by certain foreign subsidiaries of the Company. The deposits have fixed interest rates with maturity dates ranging from three months to one year. For the year ended December 31, 2009, there were no unrealized gains or losses associated with these deposits.
The interest rate swap agreement in the preceding tables is recorded in other accrued expenses and liabilities on the consolidated balance sheet and is used to hedge a portion of each of the first eight forecasted quarterly variable rate interest payments on the Company’s term loan. Under the swap agreement, the Company receives the variable, three-month LIBOR rate required under its term loan and pays a fixed LIBOR interest rate of 3.32%
65
Table of Contents
on the notional amount. The initial notional amount of $300.0 million is amortized equally at an amount of $37.5 million over eight quarters through June 30, 2010. As of December 31, 2009 and 2008, this derivative, net of tax, was in unrealized loss positions of $530,000 and $2.5 million, respectively. There was no ineffective portion of the swap agreement for the years ended December 31, 2009 and 2008.
The pre-tax (loss) gain on the Company’s derivative financial instrument is categorized in the table below:
| Year Ended | |||||||||
| (in thousands) |
Loss Recognized in Accumulated Other Comprehensive Income (Effective Portion) |
(Loss) Gain Reclassified from Accumulated Other Comprehensive Income into Income Statement (Effective Portion) |
(Loss) Gain Recognized in Income Statement (Ineffective Portion) | ||||||
| Cash Flow Hedge |
|||||||||
| Interest rate swap agreement |
|||||||||
| December 31, 2009 |
$ | (783) | $ | (3,959) | $ | — | |||
| December 31, 2008 |
$ | (4,026) | $ | 3 | $ | — | |||
The Company estimates future realized losses on the interest rate swap agreement of approximately $900,000 for the period January 1, 2010 through June 30, 2010. This estimate assumes a variable, three-month LIBOR rate of 0.25% as compared to a hedged, three-month LIBOR rate of 3.32%.
The carrying values of cash, accounts receivable, accounts payable, accrued expenses, other accrued liabilities and short-term obligations approximate their fair values because of their short-term nature. The carrying value of long-term debt approximates fair value due to the variable interest rate underlying the Company’s credit facility.
| 9. | Income Taxes |
Income before income taxes includes the following components:
| Year Ended December 31, | |||||||||
| (in thousands) |
2009 | 2008 | 2007 | ||||||
| Domestic |
$ | 128,173 | $ | 116,786 | $ | 75,474 | |||
| Foreign |
45,356 | 49,905 | 48,789 | ||||||
| Total |
$ | 173,529 | $ | 166,691 | $ | 124,263 | |||
The provision for income taxes is comprised of the following:
| Year Ended December 31, | ||||||||||||
| (in thousands) |
2009 | 2008 | 2007 | |||||||||
| Current: |
||||||||||||
| Federal |
$ | 57,077 | $ | 42,562 | $ | 25,188 | ||||||
| State |
6,379 | 5,629 | 4,510 | |||||||||
| Foreign |
21,720 | 20,152 | 17,807 | |||||||||
| Deferred: |
||||||||||||
| Federal |
(18,287 | ) | (6,750 | ) | (1,507 | ) | ||||||
| State |
(2,277 | ) | (2,115 | ) | (2,058 | ) | ||||||
| Foreign |
(7,474 | ) | (4,458 | ) | (2,069 | ) | ||||||
| Total |
$ | 57,138 | $ | 55,020 | $ | 41,871 | ||||||
66
Table of Contents
The reconciliation of the U.S. federal statutory tax rate to the consolidated effective tax rate is as follows:
| Year Ended December 31, | |||||||||
| 2009 | 2008 | 2007 | |||||||
| Federal statutory tax rate |
35.0 | % | 35.0 | % | 35.0 | % | |||
| Stock-based compensation |
1.3 | 1.0 | 1.3 | ||||||
| State income taxes, net of federal benefit |
1.3 | 1.1 | 0.2 | ||||||
| Uncertain tax positions |
(1.0 | ) | 1.1 | 1.2 | |||||
| Domestic production activity benefit |
(2.4 | ) | (1.6 | ) | (0.9 | ) | |||
| Research and experimentation credits |
(1.2 | ) | (2.0 | ) | (2.1 | ) | |||
| Adjustments of prior year taxes |
— | (1.0 | ) | — | |||||
| Foreign rate differential |
(0.9 | ) | (0.7 | ) | (1.6 | ) | |||
| Other |
0.8 | 0.1 | 0.6 | ||||||
| 32.9 | % | 33.0 | % | 33.7 | % | ||||
In general, it is the practice and intention of the Company to repatriate previously taxed earnings and to reinvest all other earnings of its non-U.S. subsidiaries. As of December 31, 2009, the Company has recorded a deferred tax liability of $672,000 related to the tax impact of foreign exchange differences on previously taxed earnings expected to be repatriated and a deferred tax liability of $565,000 representing the net U.S. tax effect of earnings to be repatriated in 2010. The Company has not made a provision for U.S. taxes on approximately $110.9 million, representing the remaining excess of the amount for financial reporting over the tax bases of investments in foreign subsidiaries that are essentially permanent in duration. Generally, such amounts become subject to U.S. taxation upon the remittance of dividends and under certain other circumstances. It is not practicable to estimate the amount of deferred tax liability related to investments in these subsidiaries.
The components of deferred tax assets and liabilities are as follows:
| December 31, | ||||||||
| (in thousands) |
2009 | 2008 | ||||||
| Deferred tax assets: |
||||||||
| Interest rate swap |
$ | 321 | $ | 1,538 | ||||
| Research and development credits |
1,122 | 1,427 | ||||||
| Allowance for doubtful accounts |
1,429 | 1,529 | ||||||
| Deferred revenue |
4,104 | 552 | ||||||
| Net operating loss carryforwards |
4,736 | 310 | ||||||
| Investments |
2,082 | 2,045 | ||||||
| Stock-based compensation |
6,197 | 4,145 | ||||||
| Employee benefits |
11,907 | 7,697 | ||||||
| Foreign tax credits |
— | 84 | ||||||
| Uncertain tax positions |
2,974 | 2,312 | ||||||
| Other |
4,685 | 2,186 | ||||||
| Valuation allowance |
(2,082 | ) | (2,098 | ) | ||||
| 37,475 | 21,727 | |||||||
| Deferred tax liabilities: |
||||||||
| Property and equipment |
(2,837 | ) | (1,287 | ) | ||||
| Other intangible assets |
(120,453 | ) | (141,432 | ) | ||||
| Unremitted foreign earnings |
(1,238 | ) | (1,485 | ) | ||||
| Other |
— | (600 | ) | |||||
| (124,528 | ) | (144,804 | ) | |||||
| Net deferred tax liabilities |
$ | (87,053 | ) | $ | (123,077 | ) | ||
The deferred tax assets labeled investments in the table above relate primarily to impaired investments, the deduction for which may only be utilized to offset future capital gains. Based on the nature of the Company’s
67
Table of Contents
investments, it has been determined that it is unlikely that it will experience these capital gains and, therefore, the Company has established a full valuation allowance against the related tax assets. Based upon the Company’s current and historical taxable income, and the anticipated level of future taxable income, management believes it is more likely than not that the remaining deferred tax assets will be realized. Accordingly, no valuation allowance has been established against those assets.
The Company has a domestic net operating loss carryforward of $12.2 million that will expire in 2027. In addition, the Company has a foreign net operating loss carryforward of $1.2 million that has no expiration date. Management believes that these net operating losses are fully realizable; accordingly, no valuation allowance has been established against this asset.
The following is a reconciliation of the total amounts of unrecognized tax benefits:
| Year Ended December 31, | ||||||||||||
| (in thousands) |
2009 | 2008 | 2007 | |||||||||
| Unrecognized tax benefit as of January 1 |
$ | 12,416 | $ | 7,928 | $ | 7,277 | ||||||
| Ansoft unrecognized tax benefit—acquired July 31, 2008 |
— | 3,525 | — | |||||||||
| Gross increases—tax positions in prior period |
427 | 2,454 | 677 | |||||||||
| Gross decreases—tax positions in prior period |
(3,259 | ) | (1,572 | ) | (824 | ) | ||||||
| Gross increases—tax positions in current period |
1,562 | 2,255 | 2,086 | |||||||||
| Reductions due to a lapse of the applicable statute of limitations |
(887 | ) | (1,598 | ) | — | |||||||
| Changes due to currency fluctuation |
65 | (259 | ) | — | ||||||||
| Settlements |
(283 | ) | (317 | ) | (1,288 | ) | ||||||
| Unrecognized tax benefit as of December 31 |
$ | 10,041 | $ | 12,416 | $ | (7,928 | ) | |||||
Included in the balance of unrecognized tax benefits at December 31, 2009 are $9.1 million of tax benefits that, if recognized, would affect the effective tax rate. The Company believes it is reasonably possible that uncertain tax positions of approximately $2.0 million as of December 31, 2009 will be resolved within the next twelve months.
The Company recognizes interest and penalties related to unrecognized tax benefits as income tax expense. Related to the uncertain tax benefits noted above, the Company benefited from a reduction of penalties and interest of $205,000 during 2009. In total, as of December 31, 2009, the Company has recognized a liability for penalties of $495,000 and interest of $1.5 million.
The Company is subject to taxation in the U.S. and various states and foreign jurisdictions. The Company’s 2006 through 2008 tax years are open to examination by the Internal Revenue Service. The 2007 and 2008 federal returns are currently under examination. The Company also has various foreign and state tax filings subject to examination for various years.
| 10. | Pension and Profit-Sharing Plans |
The Company has a 401(k)/profit-sharing plan for all qualifying full-time domestic employees that permit participants to make contributions by salary reduction pursuant to Section 401(k) of the Internal Revenue Code. The Company makes matching contributions on behalf of each eligible participant in an amount equal to 100% of the first 3% and an additional 25% of the next 5%, for a maximum total of 4.25% of the employee’s compensation. The Company may make a discretionary profit sharing contribution in the amount of 0% to 5% based on the participant’s eligible compensation, provided the employee is employed at the end of the year and has worked at least 1,000 hours. The qualifying domestic employees of the Company’s former Ansoft subsidiary, acquired on July 31, 2008, also participate in a 401(k) plan. There is no matching employer contribution associated with this plan. The Company also maintains various defined contribution pension arrangements for its international employees.
68
Table of Contents
Expenses related to the Company’s retirement programs were $3.4 million in 2009, $3.7 million in 2008 and $4.7 million in 2007.
| 11. | Non-Compete and Employment Agreements |
Employees of the Company have signed agreements under which they have agreed not to disclose trade secrets or confidential information and, where legally permitted, that restrict engagement in or connection with any business that is competitive with the Company anywhere in the world while employed by the Company (and, in some cases, for specified periods thereafter), and that any products or technology created by them during their term of employment are the property of the Company. In addition, the Company requires all channel partners to enter into agreements not to disclose the Company’s trade secrets and other proprietary information.
As part of the Company’s acquisition of Fluent Inc. on May 1, 2006, certain former stockholders of Fluent agreed to non-compete clauses for a period of five years.
The Company has an employment agreement with the Chairman of its Board of Directors. In the event the Chairman is terminated without cause, his employment agreement provides for severance at the annual rate of $300,000 for the earlier of a period of one year after termination or when he accepts other employment. The Chairman is subject to a one-year restriction on competition following termination of employment under the circumstances described in the contract.
The Company has an employment agreement with the Chief Executive Officer. This agreement provides for, among other things, minimum severance payments equal to his base salary, target bonus and then-existing benefits, in equal semi-monthly installments, through the earlier of the second anniversary of the termination date if the Chief Executive Officer is terminated without cause or when he accepts other employment. The Chief Executive Officer is subject to a two-year restriction on competition following termination of employment under the circumstances described in the contract.
The Company also has employment agreements with several other employees, primarily in foreign jurisdictions. The terms of these employment agreements generally include annual compensation, severance payment provisions and non-compete clauses.
| 12. | Stock Option and Grant Plan |
The Company has one stock option and grant plan—the Third Amended and Restated 1996 Stock Option and Grant Plan (“Stock Plan”). The Stock Plan, as amended, authorizes the grant of up to 25,400,000 shares of the Company’s common stock in the form of: (i) incentive stock options (“ISOs”), (ii) nonqualified stock options or (iii) the issuance or sale of common stock with or without vesting or other restrictions. Additionally, the Stock Plan permits (a) the grant of common stock upon the attainment of specified performance goals, (b) the grant of the right to receive cash dividends with the holders of the common stock as if the recipient held a specified number of shares of the common stock and (c) the grant of deferred stock awards. In addition to the authorized shares of the Stock Plan, the Company also has 438,000 shares available for stock option issuance that remain under the former Ansoft plan as of December 31, 2009.
The Stock Plan provides that: (i) the exercise price of an ISO must be no less than the fair value of the stock at the date of grant and (ii) the exercise price of an ISO held by an optionee who possesses more than 10% of the total combined voting power of all classes of stock must be no less than 110% of the fair market value of the stock at the time of grant. The Compensation Committee of the Board of Directors has the authority to set expiration dates no later than ten years from the date of grant (or five years for an optionee who meets the 10% criteria), payment terms and other provisions for each grant. The majority of options granted have a four year vesting period. Shares associated with unexercised options or reacquired shares of common stock become available for options or issuances under the Stock Plan. The Compensation Committee of the Board of Directors
69
Table of Contents
may, at its sole discretion, accelerate or extend the date or dates on which all or any particular award or awards granted under the Stock Plans may vest or be exercised. In the event of a merger, liquidation or sale of substantially all of the assets of the Company, the Board of Directors has the discretion to accelerate the vesting of the options granted under the Stock Plan, except that options granted to Independent Directors and certain key executives vest automatically. Under certain scenarios, other optionees may also automatically vest upon the occurrence of such an event. The Stock Plan also provides that, in the event of a sale in which the Company’s stockholders receive cash consideration, the Company may make or provide for a cash payment to participants holding options equal to the difference between the per share cash consideration and the exercise price of the option. In addition, the Stock Plan and the grants issued thereunder terminate upon the effectiveness of any such transaction or event, unless a provision is made in connection with such transaction for the assumption of grants theretofore made. Under the Stock Plan, at the discretion of the Compensation Committee, any option may include a “reload” feature. Such feature allows an optionee exercising an option to receive, in addition to the number of shares of common stock due on the exercise, an additional option with an exercise price equal to the fair market value of the common stock on the date such additional option is granted.
In addition, the Stock Plan provides that the Chairman of the Board of Directors, provided he or she is not an officer of the Company, and the non-affiliate Independent Directors, will receive, at their option, a quarterly grant of (i) 1,400 deferred stock units, which are rights to receive shares of common stock upon termination of service as a Director, or (ii) options to purchase 4,000 shares of common stock. The stock options have a vesting period of four years and expire after seven years, and the deferred stock units are issued in arrears and vest immediately. The exercisability of unvested stock options will be accelerated upon the occurrence of a merger, liquidation or sale of substantially all of the assets of the Company.
The Company currently issues shares related to exercised stock options from its existing pool of treasury shares and has no specific policy to repurchase treasury shares as stock options are exercised. If the treasury pool is depleted, the Company will issue new shares.
Information regarding stock option transactions is summarized below:
| Year Ended December 31, | ||||||||||||||||||
| 2009 | 2008 | 2007 | ||||||||||||||||
| (options in thousands) |
Options | Weighted Average Exercise Price |
Options | Weighted Average Exercise Price |
Options | Weighted Average Exercise Price | ||||||||||||
| Outstanding, beginning of year |
9,216 | $ | 16.91 | 7,479 | $ | 15.30 | 7,814 | $ | 10.78 | |||||||||
| Granted |
1,317 | $ | 37.13 | 1,039 | $ | 29.37 | 1,126 | $ | 37.88 | |||||||||
| Assumed Pursuant to Ansoft Acquisition |
— | — | 1,946 | $ | 10.38 | — | — | |||||||||||
| Exercised |
(2,299 | ) | $ | 6.68 | (1,190 | ) | $ | 6.37 | (1,173 | ) | $ | 5.53 | ||||||
| Forfeited |
(124 | ) | $ | 27.08 | (58 | ) | $ | 29.91 | (288 | ) | $ | 20.66 | ||||||
| Outstanding, end of year |
8,110 | $ | 22.94 | 9,216 | $ | 16.91 | 7,479 | $ | 15.30 | |||||||||
| Vested and Exercisable, end of year |
4,914 | $ | 16.74 | 6,214 | $ | 11.18 | 4,420 | $ | 7.36 | |||||||||
| 2009 | 2008 | 2007 | |||||||
| Weighted Average Remaining Contractual Term (in years) |
|||||||||
| Outstanding |
6.16 | 5.61 | 6.09 | ||||||
| Vested and Exercisable |
4.72 | 4.26 | 4.38 | ||||||
| Aggregate Intrinsic Value (in thousands) |
|||||||||
| Outstanding |
$ | 166,531 | $ | 115,528 | $ | 195,673 | |||
| Vested and Exercisable |
$ | 131,334 | $ | 108,247 | $ | 150,718 | |||
Historical and future expected forfeitures have not been significant and, as a result, the outstanding option amounts reflected in the tables above approximate the options expected to vest.
70
Table of Contents
The Company’s determination of fair value of share-based payment awards on the date of grant using an option pricing model is affected by the Company’s stock price as well as assumptions regarding a number of highly complex and subjective variables. The total estimated grant date fair values of stock options that vested during the years ended December 31, 2009, 2008 and 2007 were $12.4 million, $10.5 million and $8.3 million, respectively. At December 31, 2009, total unrecognized estimated compensation cost related to unvested stock options granted prior to that date was $38.8 million, which is expected to be recognized over a weighted average period of 2.0 years. The total intrinsic values of stock options exercised during the years ended December 31, 2009, 2008 and 2007 were $82.9 million, $41.2 million and $34.4 million, respectively. At December 31, 2009, 3.2 million unvested options with an aggregate intrinsic value of $34.7 million are expected to vest and have a weighted average exercise price of $31.90 and a weighted average remaining contractual term of 8.3 years. The Company recorded cash received from the exercise of stock options of $15.4 million and related tax benefits of $19.7 million (including an excess tax benefit of $13.2 million) for the year ended December 31, 2009.
Information regarding stock options outstanding as of December 31, 2009 is summarized below:
| (options in thousands) |
Options Outstanding | Options Exercisable | ||||||||||
| Range of Exercise Prices |
Options | Weighted Average Remaining Contractual Life (years) |
Weighted Average Exercise Price |
Options | Weighted Average Exercise Price | |||||||
| $ 2.66 - $ 7.83 |
1,543 | 2.00 | $ | 4.90 | 1,543 | $ | 4.90 | |||||
| $ 8.06 - $ 17.66 |
1,601 | 4.29 | $ | 12.80 | 1,401 | $ | 12.21 | |||||
| $ 17.86 - $ 24.01 |
1,548 | 7.04 | $ | 22.74 | 966 | $ | 23.34 | |||||
| $ 24.58 - $ 38.56 |
1,308 | 8.10 | $ | 29.35 | 463 | $ | 30.12 | |||||
| $ 38.75 - $ 46.68 |
2,110 | 8.76 | $ | 40.00 | 541 | $ | 39.02 | |||||
| 13. | Stock Repurchase Program |
In October 2001, the Company announced that its Board of Directors had amended its common stock repurchase program to acquire up to an additional four million shares, or 16 million shares in total under a program that was initially announced in February 2000. Under this program, ANSYS repurchased 2,069,763; 368,406; and 250,000 shares in 2009, 2008 and 2007, respectively. As of December 31, 2009, 1.3 million shares remained authorized for repurchase under the program.
| 14. | Employee Stock Purchase Plan |
The Company’s 1996 Employee Stock Purchase Plan (the “Purchase Plan”) was adopted by the Board of Directors on April 19, 1996 and was subsequently approved by the Company’s stockholders. The stockholders approved an amendment to the Purchase Plan on May 6, 2004 to increase the number of shares available for offerings to 1.6 million shares. The Purchase Plan was amended and restated in 2007. The Purchase Plan is administered by the Compensation Committee. Offerings under the Purchase Plan commence on each February 1 and August 1, and have a duration of six months. An employee who owns or is deemed to own shares of stock representing in excess of 5% of the combined voting power of all classes of stock of the Company may not participate in the Purchase Plan.
During each offering, an eligible employee may purchase shares under the Purchase Plan by authorizing payroll deductions of up to 10% of his cash compensation during the offering period. The maximum number of shares that may be purchased by any participating employee during any offering period is limited to 3,840 shares (as adjusted by the Compensation Committee from time to time). Unless the employee has previously withdrawn from the offering, his accumulated payroll deductions will be used to purchase common stock on the last business day of the period at a price equal to 85% (through the August 2007 offering period) of the fair market value of the common stock on the first or last day of the offering period, whichever is lower. Effective with the February 2008 offering, the purchase price for each share purchased under the Purchase Plan is 90% of the fair
71
Table of Contents
market value of the common stock on the first or last day of the offering period, whichever is lower. Under applicable tax rules, an employee may purchase no more than $25,000 worth of common stock in any calendar year. At December 31, 2009, 1,086,986 shares of common stock had been issued under the Purchase Plan of which 1,019,187 were issued as of December 31, 2008. The total compensation expense recorded under the Purchase Plan during the years ended December 31, 2009, 2008 and 2007 was $410,000, $350,000 and $390,000, respectively.
| 15. | Leases |
In January 1996, the Company entered into a lease agreement with an unrelated third party for a new corporate office facility, which the Company occupied in February 1997. In May 2004, the Company entered into the first amendment to this lease agreement, effective January 1, 2004. The lease was extended from an original period of ten years, with an option for five additional years, to a period of 18 years from the inception date, with an option for five additional years. The Company incurred lease rental expense related to this facility of $1.3 million in 2009, 2008 and 2007. The future minimum lease payments are $1.4 million per annum from January 1, 2010 through December 31, 2014. The future minimum lease payments from January 1, 2015 through December 31, 2019 will be determined based on prevailing market rental rates at the time of the extension, if elected. The amended lease also provided for the lessor to reimburse the Company for up to $550,000 in building refurbishments completed through March 31, 2006. These amounts have been recorded as a reduction of lease expense over the remaining term of the lease.
In August 2009, the Company’s Ansoft U.S. subsidiary extended the executive office space lease agreement for a period of approximately three years and ten months, commencing February 15, 2011 and expiring December 31, 2014. Total required minimum payments under the operating lease will be $570,000 for each of the years 2011 through 2014.
The Company has also entered into various noncancellable operating leases for equipment and office space. Office space lease expense totaled $12.4 million, $9.3 million and $6.3 million for the years ended December 31, 2009, 2008 and 2007, respectively. Future minimum lease payments under noncancellable operating leases for office space in effect at December 31, 2009 are $9.8 million in 2010, $5.7 million in 2011, $4.2 million in 2012 and $3.1 million each in 2013 and 2014.
| 16. | Royalty Agreements |
The Company has entered into various renewable, nonexclusive license agreements under which the Company has been granted access to the licensor’s technology and the right to sell the technology in the Company’s product line. Royalties are payable to developers of the software at various rates and amounts, which generally are based upon unit sales or revenue. Royalty fees are reported in cost of goods sold and were $6.9 million, $6.3 million and $5.2 million for the years ended December 31, 2009, 2008 and 2007, respectively.
| 17. | Geographic Information |
Revenue to external customers is attributed to individual countries based upon the location of the customer. Revenue by geographic area is as follows:
| (in thousands) |
Year Ended December 31, | ||||||||
| 2009 | 2008 | 2007 | |||||||
| United States |
$ | 172,275 | $ | 151,688 | $ | 131,777 | |||
| Japan |
75,207 | 66,960 | 50,896 | ||||||
| Germany |
55,652 | 68,390 | 50,973 | ||||||
| Canada |
8,068 | 8,033 | 4,809 | ||||||
| Other European |
134,869 | 127,246 | 108,971 | ||||||
| Other international |
70,814 | 56,022 | 37,914 | ||||||
| Total revenue |
$ | 516,885 | $ | 478,339 | $ | 385,340 | |||
72
Table of Contents
Property and equipment by geographic area is as follows:
| December 31, | ||||||
| (in thousands) |
2009 | 2008 | ||||
| United States |
$ | 24,565 | $ | 24,936 | ||
| India |
2,882 | 3,259 | ||||
| Japan |
1,814 | 2,216 | ||||
| United Kingdom |
1,708 | 1,648 | ||||
| Germany |
1,648 | 1,781 | ||||
| Canada |
577 | 706 | ||||
| Other European |
1,631 | 1,839 | ||||
| Other international |
306 | 427 | ||||
| Total property and equipment |
$ | 35,131 | $ | 36,812 | ||
| 18. | Contingencies and Commitments |
The Company is subject to various investigations, claims and legal proceedings that arise in the ordinary course of business, including alleged infringement of intellectual property rights, commercial disputes, labor and employment matters, tax audits and other matters. In the opinion of the Company, the resolution of pending matters is not expected to have a material, adverse effect on the Company’s consolidated results of operations, cash flows or financial position. However, each of these matters is subject to various uncertainties and it is possible that an unfavorable resolution of one or more of these proceedings could in the future materially affect the Company’s results of operations, cash flows or financial position.
The Company sells software licenses and services to its customers under proprietary software license agreements. Each license agreement contains the relevant terms of the contractual arrangement with the customer, and generally includes certain provisions for indemnifying the customer against losses, expenses and liabilities from damages that are incurred by or awarded against the customer in the event the Company’s software or services are found to infringe upon a patent, copyright, or other proprietary right of a third party. To date, the Company has not had to reimburse any of its customers for any losses related to these indemnification provisions and no material claims asserted under these indemnification provisions are outstanding as of December 31, 2009. For several reasons, including the lack of prior material indemnification claims, the Company cannot determine the maximum amount of potential future payments, if any, related to such indemnification provisions.
| 19. | Restructuring Charges: Workforce Reduction Activities |
On May 7, 2009, the Company announced actions it had taken or would be taking as part of an ongoing effort to manage expenses and cost structure. These actions included a reduction of approximately 6% of the Company’s global workforce. During the year ended December 31, 2009, the Company recorded restructuring charges of approximately $3.7 million related to these activities, of which $2.8 million was paid. The remaining severance accrual of $900,000 is reported within current liabilities on the consolidated balance sheet.
73
Table of Contents
Pursuant to the requirements of Section 13 or 15(d) of the Securities Exchange Act of 1934, the Registrant has duly caused this report to be signed on its behalf by the undersigned, thereunto duly authorized.
| ANSYS, Inc. | ||||
| Date: April 29, 2010 | By: | /S/ JAMES E. CASHMAN III | ||
| James E. Cashman III President and Chief Executive Officer | ||||
| Date: April 29, 2010 | By: | /S/ MARIA T. SHIELDS | ||
| Maria T. Shields Chief Financial Officer, Vice President, Finance and Administration | ||||
74
Table of Contents
POWER OF ATTORNEY
Pursuant to the requirements of the Securities Exchange Act of 1934, this Annual Report has been signed below by the following persons on behalf of the Registrant and in the capacities and on the dates indicated below.
| Signature |
Title |
Date | ||
| /S/ JAMES E. CASHMAN III James E. Cashman III |
President and Chief Executive Officer (Principal Executive Officer) |
April 29, 2010 | ||
| /S/ MARIA T. SHIELDS Maria T. Shields |
Chief Financial Officer, Vice President, Finance and Administration; (Principal Financial Officer and Accounting Officer) |
April 29, 2010 | ||
| * Peter J. Smith |
Chairman of the Board of Directors | April 29, 2010 | ||
| * Dr. Zoltan Cendes |
Director | April 29, 2010 | ||
| * William R. McDermott |
Director | April 29, 2010 | ||
| * Jacqueline C. Morby |
Director | April 29, 2010 | ||
| * Bradford C. Morley |
Director | April 29, 2010 | ||
| * John F. Smith |
Director | April 29, 2010 | ||
| * Michael C. Thurk |
Director | April 29, 2010 | ||
| * Patrick J. Zilvitis |
Director | April 29, 2010 | ||
| *By: | /S/ JAMES E. CASHMAN III | |
| James E. Cashman III Attorney-in-Fact |
75
Table of Contents
ANSYS, INC.
Valuation and Qualifying Accounts
| (in thousands) Description |
Balance
at Beginning of Year |
Additions– Charges to Costs and Expenses |
Deductions– Returns and Write-Offs |
Balance at End of Year | |||||||||
| Year ended December 31, 2009 |
$ | 4,422 | $ | 1,610 | $ | 1,614 | $ | 4,418 | |||||
| Year ended December 31, 2008 |
$ | 3,399 | $ | 2,637 | (1) | $ | 1,614 | $ | 4,422 | ||||
| Year ended December 31, 2007 |
$ | 2,775 | $ | 1,043 | $ | 419 | $ | 3,399 | |||||
| (1) | Amount includes $1,453 related to the acquisition date balance sheet of Ansoft. |
76
Table of Contents
EXHIBIT INDEX
| Exhibit |
Exhibit | |
| 3.1 | Restated Certificate of Incorporation of the Company (filed as Exhibit 3.1 to the Quarterly Report on Form 10-Q for the fiscal quarter ended June 30, 1996 and incorporated herein by reference). | |
| 3.2 | Certificate of Amendment to the Company’s Restated Certificate of Incorporation as filed with the Secretary of State of the State of Delaware (filed as Exhibit 3.1 to the Company’s Current Report on Form 8-K, filed June 21, 2006, and incorporated herein by reference). | |
| 3.3 | Second Amended and Restated By-laws of the Company (filed as Exhibit 3.1 to the Company’s Current Report on Form 8-K, filed February 19, 2008 and incorporated herein by reference). | |
| 3.4 | Amendment No. 1 to the Second Amended and Restated By-laws of the Company (filed as Exhibit 3.1 to the Company’s Current Report on Form 8-K, filed July 23, 2008, and incorporated herein by reference). | |
| 10.1 | ANSYS, Inc. Second Amended and Restated Employee Stock Purchase Plan (filed as Exhibit 10.1 to the Quarterly Report on Form 10-Q for the fiscal quarter ended September 30, 2007 and incorporated herein by reference).* | |
| 10.2 | Employment Agreement between a subsidiary of the Registrant and Peter J. Smith dated as of March 28, 1994 (filed as Exhibit 10.10 to the Company’s Registration Statement on Form S-1 (File No. 333-4278) and incorporated herein by reference).* | |
| 10.3 | Lease between National Build to Suit Washington County, L.L.C. and the Registrant for the Southpointe property (filed as Exhibit 10.19 to the Company’s Registration Statement on Form S-1 (File No. 333-4278) and incorporated herein by reference). | |
| 10.4 | First Amended Lease Agreement between Southpointe Park Corp. and ANSYS, Inc. (filed as Exhibit 10.2 to the Quarterly Report on Form 10-Q for the fiscal quarter ended June 30, 2004 and incorporated herein by reference). | |
| 10.5 | Registrant’s Pension Plan and Trust, as amended (filed as Exhibit 10.20 to the Company’s Registration Statement on Form S-1 (File No. 333-4278) and incorporated herein by reference).* | |
| 10.6 | Form of Director Indemnification Agreement (filed as Exhibit 10.21 to the Company’s Registration Statement on Form S-1 (File No. 333-4278) and incorporated herein by reference). | |
| 10.7 | Employment Agreement between the Registrant and James E. Cashman III dated as of April 21, 2003 (filed as Exhibit 10.1 to the Company’s Quarterly Report on Form 10-Q for the quarter ended March 31, 2003 and incorporated herein by reference).* | |
| 10.8 | Description of Executive Bonus Plan, Director Stock Option Program and Officer Stock Option Program, Including Forms of Option Agreements for Option Grants to Directors and Officers (filed as Exhibits 99.1 – 99.5 to the Company’s Current Report on Form 8-K, filed February 8, 2005, and incorporated herein by reference).* | |
| 10.9 | Options Granted to Independent Directors Related to the 2005 Annual Meeting of Stockholders on May 10, 2005 (filed as disclosure in the Company’s Current Report on Form 8-K, filed May 13, 2005, and incorporated herein by reference).* | |
| 10.10 | Indemnification Agreement, dated February 9, 2006, between ANSYS, Inc. and Sheila S. DiNardo (filed as Exhibit 10.1 to the Company’s Current Report on Form 8-K, filed February 15, 2006, and incorporated herein by reference). | |
| 10.11 | Amendment to Non-Affiliate Independent Director Compensation on February 9, 2006 (filed as disclosure in the Company’s Current Report on Form 8-K, filed February 15, 2006, and incorporated herein by reference).* | |
77
Table of Contents
| Exhibit |
Exhibit | |
| 10.12 | Deferred Stock Award or Non-Qualified Stock Option Election Form (filed as Exhibit 10.1 to the Company’s Current Report on Form 8-K, filed July 6, 2006, and incorporated herein by reference).* | |
| 10.13 | Form of Deferred Stock Unit Agreement under the Third Amended and Restated ANSYS, Inc. 1996 Stock Option and Grant Plan (filed as Exhibit 10.2 to the Company’s Current Report on Form 8-K, filed July 6, 2006, and incorporated herein by reference).* | |
| 10.14 | Indemnification Agreement, dated July 12, 2007, between ANSYS, Inc. and William R. McDermott, a director of the Company (filed as Exhibit 10.1 to the Company’s Current Report on Form 8-K, filed July 13, 2007, and incorporated herein by reference). | |
| 10.15 | Indemnification Agreement, dated May 21, 2007, between ANSYS, Inc. and Michael C. Thurk, a director of the Company (filed as Exhibit 10.1 to the Company’s Current Report on Form 8-K, filed May 24, 2007, and incorporated herein by reference). | |
| 10.16 | Agreement and Plan of Merger, dated as of March 31, 2008, by and among ANSYS, Inc., Evgeni, Inc., Sidney LLC, and Ansoft Corporation (filed as Exhibit 2.1 to the Company’s Current Report on Form 8-K, filed March 31, 2008, and incorporated herein by reference). | |
| 10.17 | Voting Agreement, dated as of March 31, 2008, made by and between ANSYS, Inc., and the undersigned holder of shares of common stock, par value $0.01 per share, of Ansoft Corporation (filed as Exhibit 10.1 to the Company’s Current Report on Form 8-K, filed March 31, 2008, and incorporated herein by reference). | |
| 10.18 | Voting Agreement, dated as of March 31, 2008, made by and between ANSYS, Inc., and the undersigned holder of shares of common stock, par value $0.01 per share, of Ansoft Corporation (filed as Exhibit 10.1 to the Company’s Current Report on Form 8-K, filed March 31, 2008, and incorporated herein by reference). | |
| 10.19 | Credit Agreement, dated July 31, 2008, by and among ANSYS, Inc., each lender from time to time party thereto, Bank of America, N.A., as Administrative Agent, Banc of America Securities LLC, as Sole Lead Arranger and Sole Book Manager, National City Bank, as Syndication Agent, and Citizens Bank of Pennsylvania, Sumitomo Mitsui Banking Corporation and TD Bank, N.A., as Co-Documentation Agents (filed as Exhibit 10.1 to the Company’s Current Report on Form 8-K, filed July 31, 2008, and incorporated herein by reference). | |
| 10.20 | Subsidiary Guarantee Agreement by and among the domestic subsidiaries of ANSYS, Inc., in favor of Bank of America, N.A., as Administrative Agent, and each lender from time to time party to the Credit Agreement (filed as Exhibit 10.1 to the Company’s Current Report on Form 8-K, filed July 31, 2008, and incorporated herein by reference). | |
| 10.21 | Indemnification Agreement, dated July 31, 2008, between ANSYS, Inc. and Dr. Zoltan Cendes, a director of the Company (filed as Exhibit 10.3 to the Company’s Current Report on Form 8-K, filed July 31, 2008, and incorporated herein by reference). | |
| 10.22 | Deferred Stock Unit Agreement under the Third Amended and Restated ANSYS, Inc. 1996 Stock Option and Grant Plan (filed as Exhibit 10.4 to the Company’s Quarterly Report on Form 10-Q for the quarter ended September 30, 2008 and incorporated herein by reference).* | |
| 10.23 | Amended and Restated ANSYS, Inc. Cash Bonus Plan (filed as Exhibit 10.5 to the Company’s Quarterly Report on Form 10-Q for the quarter ended September 30, 2008 and incorporated herein by reference).* | |
| 10.24 | First Amendment of the Employment Agreement Between the Registrant and James E. Cashman III as of November 6, 2008 (filed as Exhibit 10.6 to the Company’s Quarterly Report on Form 10-Q for the quarter ended September 30, 2008 and incorporated herein by reference).* | |
78
Table of Contents
| Exhibit |
Exhibit | |
| 10.25 | First Amendment of the Employment Agreement Between the Registrant and Peter J. Smith as of November 6, 2008 (filed as Exhibit 10.7 to the Company’s Quarterly Report on Form 10-Q for the quarter ended September 30, 2008 and incorporated herein by reference).* | |
| 10.26 | Amendment to the Compensatory Arrangement for Peter J. Smith (filed as Item 5.02 to the Company’s Current Report on Form 8-K, filed May 15, 2009, and incorporated herein by reference).* | |
| 10.27 | Third Amended and Restated 1996 Stock Option and Grant Plan (filed as Exhibit 10.1 to the Company’s Current Report on Form 8-K, filed June 21, 2006, and incorporated herein by reference).* | |
| 10.28 | Amendment to the Third Amended and Restated ANSYS, Inc. 1996 Stock Option and Grant Plan (filed as Item 5.02 to the Company’s Current Report on Form 8-K, filed May 21, 2009, and incorporated herein by reference). * | |
| 14.1 | Code of Business Conduct and Ethics (filed as Exhibit 14.1 to the Company’s Annual Report on Form 10-K for the fiscal year ended December 31, 2003 and incorporated herein by reference). | |
| 21 | Subsidiaries of the Registrant; filed herewith. | |
| 23.1 | Consent of Deloitte & Touche LLP, independent registered public accounting firm. | |
| 24.1 | Powers of Attorney. Contained on page 75 of the Company’s Annual Report on Form 10-K for the fiscal year ended December 31, 2009 and incorporated herein by reference. | |
| 31.1 | Certification of Chief Executive Officer pursuant to Section 302 of the Sarbanes-Oxley Act of 2002. | |
| 31.2 | Certification of Chief Financial Officer pursuant to Section 302 of the Sarbanes-Oxley Act of 2002. | |
| 32.1 | Certification Pursuant to 18 U.S.C. Section 1350, As Adopted Pursuant to Section 906 of the Sarbanes-Oxley Act of 2002. | |
| 32.2 | Certification Pursuant to 18 U.S.C. Section 1350, As Adopted Pursuant to Section 906 of the Sarbanes-Oxley Act of 2002. | |
| * | Indicates management contract or compensatory plan, contract or arrangement. |
79