Attached files
| file | filename |
|---|---|
| EX-31.1 - EXHIBIT 31.1 - HECLA MINING CO/DE/ | ex31-1.htm |
| EX-32.2 - EXHIBIT 32.2 - HECLA MINING CO/DE/ | ex32-2.htm |
| EX-31.1 - EXHIBIT 31.2 - HECLA MINING CO/DE/ | ex31-2.htm |
| EX-32.1 - EXHIBIT 32.1 - HECLA MINING CO/DE/ | ex32-1.htm |
UNITED STATES
SECURITIES AND EXCHANGE COMMISSION
Washington, D.C. 20549
FORM 10-Q
xQUARTERLY REPORT PURSUANT TO SECTION 13 OR 15(d) OF THE
SECURITIES EXCHANGE ACT OF 1934
For the quarterly period ended March 31, 2010
|
Commission file number
|
1-8491
|
|
HECLA MINING COMPANY
|
|
(Exact Name of Registrant as Specified in Its Charter)
|
|
Delaware
|
77-0664171
|
|
|
(State or Other Jurisdiction of
|
(I.R.S. Employer
|
|
|
Incorporation or Organization)
|
Identification No.)
|
|
|
6500 N. Mineral Drive, Suite 200
|
||
|
Coeur d'Alene, Idaho
|
83815-9408
|
|
|
(Address of Principal Executive Offices)
|
(Zip Code)
|
|
208-769-4100
|
|
(Registrant's Telephone Number, Including Area Code)
|
Indicate by check mark whether the registrant: (1) has filed all reports required to be filed by Section 13 or 15(d) of the Securities Exchange Act of 1934 during the preceding 12 months (or for such shorter period that the registrant was required to file such reports), and (2) has been subject to such filing requirements for the past 90 days.
Yes x No o
Indicate by check mark whether the registrant has submitted electronically and posted on its corporate Web site, if any, every Interactive Data File required to be submitted and posted pursuant to Rule 405 of Regulation S-T (§ 232.405 of this chapter) during the preceding 12 months (or for such shorter period that the registrant was required to submit and post such files).
Yes o No o
Indicate by check mark whether the registrant is a large accelerated filer, an accelerated filer, a non-accelerated filer, or a smaller reporting company. See definitions of “large accelerated filer,” “accelerated filer” and “small reporting company” in Rule 12b-2 of the Exchange Act.
|
Large Accelerated Filer x
|
Accelerated Filer o
|
|||
|
Non-Accelerated Filer o
|
Smaller reporting company o
|
|||
|
(Do not check if a smaller reporting company)
|
Indicate by check mark whether the registrant is a shell company (as defined in Rule 12b-2 of the Exchange Act).
Yes o No x
Indicate the number of shares outstanding of each of the issuer's classes of common stock, as of the latest practicable date.
|
Class
|
Shares Outstanding April 26, 2010
|
|||
|
Common stock, par value
|
245,736,342
|
|||
|
$0.25 per share
|
Hecla Mining Company and Subsidiaries
Form 10-Q
For the Quarter Ended March 31, 2010
I N D E X*
|
|
Page | ||
|
PART I. - Financial Information
|
|||
|
Item l -
|
Condensed Consolidated Financial Statements (Unaudited)
|
4
|
|
|
|
Condensed Consolidated Balance Sheets –
March 31, 2010 and December 31, 2009
|
4 | |
|
|
Condensed Consolidated Statements of Income and Comprehensive Income -
Three Months Ended March 31, 2010 and 2009
|
5 | |
|
|
Condensed Consolidated Statements of Cash Flows –
Three Months Ended March 31, 2010 and 2009
|
6 | |
|
|
Notes to Condensed Consolidated Financial Statements
|
7 | |
|
Item 2 -
|
Management's Discussion and Analysis of Financial Condition and Results of Operations
|
22
|
|
|
Item 3 -
|
Quantitative and Qualitative Disclosures About Market Risk
|
36
|
|
|
Item 4 -
|
Controls and Procedures
|
37
|
|
|
PART II. - Other Information
|
|||
|
Item 1 -
|
Legal Proceedings
|
38
|
|
|
Item 1A -
|
Risk Factors
|
38
|
|
|
Item 2 -
|
Unregistered Sales of Equity Securities and Use of Proceeds
|
38
|
|
|
Item 6 -
|
Exhibits
|
38
|
|
|
Signatures
|
39 | ||
| Exhibit Index |
40
|
||
*Certain items are omitted, as they are not applicable.
Item 1. Financial Statements
Hecla Mining Company and Subsidiaries
Condensed Consolidated Balance Sheets (Unaudited)
(Dollars are in thousands, except per share data)
| March 31,
2010
|
December 31,
2009
|
|||||||
| ASSETS | ||||||||
|
Current assets:
|
||||||||
|
Cash and cash equivalents
|
$ | 116,342 | $ | 104,678 | ||||
|
Investments
|
— | 1,138 | ||||||
|
Accounts receivable:
|
||||||||
|
Trade
|
39,097 | 25,141 | ||||||
|
Other, net
|
571 | 2,286 | ||||||
|
Inventories:
|
||||||||
|
Concentrates, doré, stockpiled ore, and metals in transit and in-process
|
13,003 | 12,563 | ||||||
|
Materials and supplies
|
9,326 | 8,903 | ||||||
|
Current deferred income taxes
|
8,137 | 7,176 | ||||||
|
Other current assets
|
4,210 | 4,578 | ||||||
|
Total current assets
|
190,686 | 166,463 | ||||||
|
Non-current investments
|
1,785 | 2,157 | ||||||
|
Non-current restricted cash and investments
|
10,946 | 10,945 | ||||||
|
Properties, plants, equipment and mineral interests, net
|
811,661 | 819,518 | ||||||
|
Non-current deferred income taxes
|
43,626 | 38,476 | ||||||
|
Other non-current assets
|
8,007 | 9,225 | ||||||
|
Total assets
|
$ | 1,066,711 | $ | 1,046,784 | ||||
|
LIABILITIES
|
||||||||
|
Current liabilities:
|
||||||||
|
Accounts payable and accrued liabilities
|
$ | 15,984 | $ | 13,998 | ||||
|
Accrued payroll and related benefits
|
7,637 | 14,164 | ||||||
|
Accrued taxes
|
7,182 | 6,240 | ||||||
|
Current portion of capital leases
|
1,595 | 1,560 | ||||||
|
Current portion of accrued reclamation and closure costs
|
11,098 | 5,773 | ||||||
|
Total current liabilities
|
43,496 | 41,735 | ||||||
|
Capital leases
|
2,871 | 3,281 | ||||||
|
Accrued reclamation and closure costs
|
122,074 | 125,428 | ||||||
|
Other noncurrent liabilities
|
10,972 | 10,855 | ||||||
|
Total liabilities
|
179,413 | 181,299 | ||||||
|
Commitments and contingencies (Notes 2, 4 and 9)
|
||||||||
|
SHAREHOLDERS’ EQUITY
|
||||||||
|
Preferred stock, 5,000,000 shares authorized:
|
||||||||
|
Series B preferred stock, $0.25 par value, 157,816 shares issued and outstanding,
liquidation preference 2010 — $7,891 and 2009 — $8,581
|
39 | 39 | ||||||
|
Mandatory convertible preferred stock, $0.25 par value, 2,012,500 shares issued and outstanding,
liquidation preference 2010 — $201,250 and 2009 — $217,600
|
504 | 504 | ||||||
|
Common stock, $0.25 par value, 400,000,000 authorized; issued 2010 —
242,334,618 shares and issued 2009 — 238,415,742 shares
|
60,584 | 59,604 | ||||||
|
Capital surplus
|
1,124,450 | 1,121,076 | ||||||
|
Accumulated deficit
|
(282,479 | ) | (300,915 | ) | ||||
|
Accumulated other comprehensive loss
|
(15,160 | ) | (14,183 | ) | ||||
|
Less treasury stock, at cost; 81,375 common shares
|
(640 | ) | (640 | ) | ||||
|
Total shareholders’ equity
|
887,298 | 865,485 | ||||||
|
Total liabilities and shareholders’ equity
|
$ | 1,066,711 | $ | 1,046,784 | ||||
The accompanying notes are an integral part of the interim consolidated financial statements.
- 4 -
Hecla Mining Company and Subsidiaries
Condensed Consolidated Statements of Income and Comprehensive Income (Unaudited)
(Dollars and shares in thousands, except per share amounts)
|
Three Months Ended
|
||||||||
|
March 31, 2010
|
March 31, 2009
|
|||||||
|
Sales of products
|
$ | 79,875 | $ | 54,721 | ||||
|
Cost of sales and other direct production costs
|
36,270 | 29,635 | ||||||
|
Depreciation, depletion and amortization
|
16,069 | 15,218 | ||||||
| 52,339 | 44,853 | |||||||
|
Gross profit
|
27,536 | 9,868 | ||||||
|
Other operating expense (income):
|
||||||||
|
General and administrative
|
4,113 | 4,724 | ||||||
|
Exploration
|
3,429 | 1,028 | ||||||
|
Other operating expense
|
964 | 2,291 | ||||||
|
Gain on disposition of property, plants, equipment and mineral interests
|
— | (6,230 | ) | |||||
|
Termination of employee benefit plan
|
— | (8,950 | ) | |||||
|
Provision for closed operations and environmental matters
|
3,376 | 876 | ||||||
| 11,882 | (6,261 | ) | ||||||
|
Income from operations
|
15,654 | 16,129 | ||||||
|
Other income (expense):
|
||||||||
|
Gain on sale of investments
|
588 | — | ||||||
|
Interest and other income
|
51 | 211 | ||||||
|
Preferred shares issued for debt-related fees
|
— | (4,262 | ) | |||||
|
Interest expense, net of amount capitalized
|
(678 | ) | (4,681 | ) | ||||
| (39 | ) | (8,732 | ) | |||||
|
Income before income taxes
|
15,615 | 7,397 | ||||||
|
Income tax benefit (provision)
|
6,229 | (84 | ) | |||||
|
Net income
|
21,844 | 7,313 | ||||||
|
Preferred stock dividends
|
(3,408 | ) | (3,408 | ) | ||||
|
Income applicable to common shareholders
|
$ | 18,436 | $ | 3,905 | ||||
|
Comprehensive income (loss):
|
||||||||
|
Net income
|
$ | 21,844 | $ | 7,313 | ||||
|
Change in derivative contracts
|
— | 402 | ||||||
|
Unrealized holding gains (losses) on investments
|
(978 | ) | 284 | |||||
|
Comprehensive income
|
$ | 20,866 | $ | 7,999 | ||||
|
Basic income per common share after preferred stock dividends
|
$ | 0.08 | $ | 0.02 | ||||
|
Diluted income per common share after preferred stock dividends
|
$ | 0.07 | $ | 0.02 | ||||
|
Weighted average number of common shares outstanding – basic
|
242,039 | 198,966 | ||||||
|
Weighted average number of common shares outstanding – diluted
|
261,231 | 199,393 | ||||||
The accompanying notes are an integral part of the interim consolidated financial statements.
- 5 -
Hecla Mining Company and Subsidiaries
Condensed Consolidated Statements of Cash Flows (Unaudited)
(In thousands)
|
Three Months Ended
|
||||||||
|
March 31, 2010
|
March 31, 2009
|
|||||||
|
Operating activities:
|
||||||||
|
Net income
|
$ | 21,844 | $ | 7,313 | ||||
|
Non-cash elements included in net income:
|
||||||||
|
Depreciation, depletion and amortization
|
16,107 | 15,218 | ||||||
|
Gain on disposition of properties, plants and equipment
|
— | (6,230 | ) | |||||
|
Gain on sale of investments
|
(588 | ) | — | |||||
|
Provision for reclamation and closure costs
|
2,220 | 238 | ||||||
|
Deferred income taxes
|
(6,344 | ) | — | |||||
|
Stock compensation
|
333 | 296 | ||||||
|
Preferred shares issued for debt-related fees
|
— | 4,262 | ||||||
|
Amortization of loan origination fees
|
172 | 2,097 | ||||||
|
Gain on termination of employee benefit plan
|
— | (8,950 | ) | |||||
|
Other non-cash charges, net
|
446 | 1,007 | ||||||
|
Change in assets and liabilities:
|
||||||||
|
Accounts receivable
|
(12,241 | ) | (7,018 | ) | ||||
|
Inventories
|
(863 | ) | (3,623 | ) | ||||
|
Other current and noncurrent assets
|
1,268 | (521 | ) | |||||
|
Accounts payable and accrued liabilities
|
2,677 | (6,657 | ) | |||||
|
Accrued payroll and related benefits
|
(6,527 | ) | 933 | |||||
|
Accrued taxes
|
942 | 1,327 | ||||||
|
Accrued reclamation and closure costs
|
(249 | ) | (7 | ) | ||||
|
Other non-current liabilities
|
116 | (141 | ) | |||||
|
Net cash provided by (used in) operating activities
|
19,313 | (456 | ) | |||||
|
Investing activities:
|
||||||||
|
Additions to properties, plants, equipment and mineral interests
|
(8,250 | ) | (3,613 | ) | ||||
|
Proceeds from disposition of properties, plants and equipment
|
— | 8,000 | ||||||
|
Increases in restricted cash and investment balances
|
— | (681 | ) | |||||
|
Proceeds from sale of investments
|
1,138 | — | ||||||
|
Net cash provided by (used in) investing activities
|
(7,112 | ) | 3,706 | |||||
|
Financing activities:
|
||||||||
|
Proceeds from issuance of common stock and warrants and exercise of stock options, net of related expense
|
666 | 70,951 | ||||||
|
Dividend paid to preferred shareholders
|
(828 | ) | — | |||||
|
Repayments of debt and capital leases
|
(375 | ) | (48,068 | ) | ||||
|
Net cash provided by (used in) financing activities
|
(537 | ) | 22,883 | |||||
|
Change in cash and cash equivalents:
|
||||||||
|
Net increase in cash and cash equivalents
|
11,664 | 26,133 | ||||||
|
Cash and cash equivalents at beginning of period
|
104,678 | 36,470 | ||||||
|
Cash and cash equivalents at end of period
|
$ | 116,342 | $ | 62,603 | ||||
|
Significant non-cash investing and financing activities:
|
||||||||
|
Addition of capital equipment lease obligations
|
$ | — | $ | 2,548 | ||||
|
Preferred shares issued for debt-related fees
|
$ | — | $ | 4,262 | ||||
|
Preferred stock dividends paid in common stock
|
$ | 16,344 | $ | — | ||||
|
Equity securities received from dispositions of assets
|
$ | — | $ | 299 | ||||
The accompanying notes are an integral part of the interim consolidated financial statements.
- 6 -
Notes to Condensed Consolidated Financial Statements (Unaudited)
Note 1. Basis of Preparation of Financial Statements
In the opinion of management, the accompanying unaudited interim condensed consolidated financial statements and notes to interim condensed consolidated financial statements contain all adjustments, consisting of normal recurring items, necessary to present fairly, in all material respects, the financial position of Hecla Mining Company and its consolidated subsidiaries (“we” or “our” or “us”). These unaudited interim condensed consolidated financial statements should be read in conjunction with our audited consolidated financial statements and related footnotes as set forth in our annual report filed on Form 10-K for the year ended December 31, 2009, as it may be amended from time to time.
The results of operations for the periods presented may not be indicative of those which may be expected for a full year. The unaudited condensed consolidated financial statements have been prepared pursuant to the rules and regulations of the Securities Exchange Commission. Certain information and footnote disclosures normally included in financial statements prepared in accordance with generally accepted accounting principles in the United States (“GAAP”) have been condensed or omitted pursuant to those rules and regulations, although the Company believes that the disclosures are adequate to make the information not misleading.
The preparation of financial statements in conformity with GAAP requires management to make estimates and assumptions that affect the reported amounts of assets and liabilities as of the date of the financial statements, the reported amounts of revenues and expenses during the reporting period and the disclosures of contingent liabilities. Accordingly, ultimate results could differ materially from those estimates.
Note 2. Investments and Restricted Cash
Investments
At December 31, 2009, the fair value of our current investments was $1.1 million, which represented stock having a cost basis of approximately $0.6 million. These shares were sold in January 2010 for proceeds of $1.1 million, resulting in a pre-tax gain of approximately $0.5 million. No current investments were held at March 31, 2010.
At March 31, 2010 and December 31, 2009, the fair value of our non-current investments was $1.8 million and $2.2 million, respectively. Marketable equity securities are carried at fair market value, as they are classified as “available-for-sale.” The cost basis of these non-current investments, representing equity securities, was approximately $1.9 million at March 31, 2010 and December 31, 2009.
At March 31, 2010, total unrealized gains of $0.1 million for investments held having a net gain position and total unrealized losses of $0.4 million for investments held having a net loss position were included in accumulated other comprehensive income (loss).
Restricted Cash and Investments
Various laws and permits require that financial assurances be in place for certain environmental and reclamation obligations and other potential liabilities. Restricted investments primarily represent investments in money market funds and certificates of deposit. These investments that are restricted are to be used primarily for reclamation funding or for funding surety bonds and were $11.8 million at March 31, 2010 and December 31, 2009.
- 7 -
Note 3. Income Taxes
For the three months ended March 31, 2010, we recorded a net $6.2 million income tax benefit, of which $6.1 million related to the reduction in valuation allowance for deferred tax assets. For the three months ended March 31, 2009, we recorded a $0.1 million income tax provision primarily for foreign withholding tax.
We assessed our estimate for the realization of our net deferred tax assets as of March 31, 2010. An increase in average metals prices and an increase in consensus price forecasts used as the basis for projected future taxable income support a reduction to the valuation allowance on the net deferred tax asset of $11 million. A portion of the reduction to the valuation allowance of $3 million is attributable to 2010 operating results and will be realized during the current year as a reduction in the effective rate for the period. The remaining reduction in valuation allowance of $8 million attributable to future periods was recognized as a discrete item during the period ended March 31, 2010. The net deferred tax asset at March 31, 2010, after the net impact of current period utilization and the discrete valuation allowance adjustment, is $52 million.
The current income tax provisions for the first three months of 2010 and 2009 vary from the amounts that would have resulted from applying the statutory income tax rate to pre-tax income primarily due to the effects of U.S. tax net operating loss carryforwards and the valuation allowance in the respective periods.
Note 4: Commitments and Contingencies
Bunker Hill Superfund Site
In 1994, our wholly owned subsidiary, Hecla Limited, as a potentially responsible party under the Comprehensive Environmental Response, Compensation and Liability Act of 1980 (“CERCLA”), entered into a Consent Decree with the U.S. Environmental Protection Agency (“EPA”) and the State of Idaho concerning environmental remediation obligations at the Bunker Hill Superfund site, a 21-square-mile site located near Kellogg, Idaho (the “Bunker Hill site”). The 1994 Consent Decree (the “Bunker Hill Decree” or “Decree”) settled Hecla Limited’s response-cost responsibility under CERCLA at the Bunker Hill site. Parties to the Decree included Hecla Limited, Sunshine Mining and Refining Company (“Sunshine”) and ASARCO Incorporated (“ASARCO”). Sunshine subsequently filed bankruptcy and settled all of its obligations under the Bunker Hill Decree.
In 1994, Hecla Limited entered into a cost-sharing agreement with other potentially responsible parties, including ASARCO, relating to required expenditures under the Bunker Hill Decree. ASARCO was in default of its obligations under the cost-sharing agreement and consequently in August 2005, Hecla Limited filed a lawsuit against ASARCO in Idaho State Court seeking amounts due Hecla Limited for work completed under the Decree. Additionally, Hecla Limited claimed certain amounts due Hecla Limited under a separate agreement related to expert costs incurred to defend both parties with respect to the Coeur d’Alene River Basin litigation in Federal District Court, discussed further below. After Hecla Limited filed suit, ASARCO filed for Chapter 11 bankruptcy protection in United States Bankruptcy Court in Texas in August 2005. As a result of this filing, an automatic stay was in effect for Hecla Limited’s claims against ASARCO. Hecla Limited was unable to proceed with the Idaho State Court litigation against ASARCO because of the stay, and asserted Hecla Limited’s claims in the context of the bankruptcy proceeding.
- 8 -
In late September 2008, Hecla Limited reached an agreement with ASARCO to allow Hecla Limited’s claim against ASARCO in ASARCO’s bankruptcy proceedings in the amount of approximately $3.3 million. Hecla Limited’s claim included approximately $3.0 million in clean up costs incurred by Hecla Limited for ASARCO’s share of such costs under the cost sharing agreement with ASARCO related to the Bunker Hill Decree. The remaining $330,000 is litigation-related costs incurred by Hecla Limited for ASARCO’s share of expert fees in the Basin litigation. The agreement also provides that Hecla Limited and ASARCO release each other from any and all liability under the cost sharing agreement, the Bunker Hill Decree and the Basin CERCLA site. That agreement was approved by the United States Bankruptcy Court for the Southern District of Texas (the “Bankruptcy Court”) on October 27, 2008.
On July 9, 2008, the United States and the State of Idaho reached a settlement agreement with ASARCO under the Bunker Hill Decree. That agreement, among other things, provided for the payment by ASARCO of $16.8 million for various costs and settled ASARCO’s liability under the Decree. The Bankruptcy Court approved that settlement on August 1, 2008.
In late 2009, both the Bankruptcy Court and the U.S. Federal District Court in Texas approved ASARCO’s Plan of Reorganization. As a result of the approved Plan of Reorganization, in December 2009 Hecla Limited received all of its $3.3 million allowed claim plus interest from ASARCO in the bankruptcy proceeding. In addition, pursuant to the approved Plan of Reorganization in the ASARCO bankruptcy proceeding, the United States and the State of Idaho received approximately $16.8 million, plus interest, from ASARCO for their allowed combined claims under the Bunker Hill Decree.
In March 2010, Hecla Limited received an invoice from the EPA to recover response costs incurred by the EPA in performing work required by the Bunker Hill Decree between January 2002 and March 2006. The invoice is a demand for payment of a portion of the costs identified by the EPA in their notice to us in December 2005 (which was not a demand for payment). This invoice is for approximately $5.3 million and represents the total costs alleged to have been incurred by the EPA at the Bunker Hill Site during the period less approximately $9.5 million received by the EPA toward these costs from the ASARCO bankruptcy in late 2009. Prior to this invoice, Hecla Limited had determined a range of potential liability for these costs of between $2.7 and $6.8 million. Because Hecla Limited believed no dollar amount within the range was more likely than any other based on the information available to it at that time, Hecla Limited accrued $2.7 million for this potential liability representing the minimum of the range. Based upon the March 2010 invoice, Hecla Limited has increased its accrual for this potential liability to $5.3 million. Hecla Limited is reviewing the current documentation supporting the invoice to determine whether any portion of the invoice is subject to challenge under the dispute provisions of the Bunker Hill Decree. In addition, Hecla Limited is continuing to pursue a settlement for the entire Coeur d’Alene Basin environmental liability and will pursue resolving this claim in the context of any broader Basin settlement. However, there can be no assurance that Hecla Limited will be successful in either effort and Hecla Limited may be required to pay the invoiced amount in 2010.
Our aggregate accrued liability balance relating to the Bunker Hill site was $8.9 million at March 31, 2010 and $6.7 million at December 31, 2009. The liability balance represents Hecla Limited’s estimated portion of the remaining remediation activities associated with the site, its estimated portion of a long-term institutional controls program required by the Bunker Hill Decree, and potential reimbursement to the EPA of costs allegedly incurred by the agency as described in the March 2010 invoice. ASARCO’s remaining share of its future obligations under the Bunker Hill Decree have been settled in the context of the bankruptcy proceeding and have been paid through proceeds from an ASARCO trust created in 2003 for the purpose of funding certain of ASARCO’s environmental obligations, as well as distributions to the State of Idaho and U.S. for their claims which have been approved and made in December 2009 under the approved Plan of Reorganization in ASARCO’s bankruptcy proceeding. Although Hecla Limited believes the amounts paid to the United States and the State of Idaho by ASARCO will reduce the total remaining obligations under the Decree, because of disputes and uncertainties with regard to the remaining obligations under the Decree, there can be no assurance as to the ultimate disposition of Hecla Limited’s environmental liability associated with the Bunker Hill site.
- 9 -
|
Coeur d’Alene River Basin Environmental Claims
|
Coeur d’Alene Indian Tribe Claims
In July 1991, the Coeur d’Alene Indian Tribe (“Tribe”) brought a lawsuit, under CERCLA, in Federal District Court in Idaho against Hecla Limited, ASARCO and a number of other mining companies asserting claims for damages to natural resources downstream from the Bunker Hill site over which the Tribe alleges some ownership or control. The Tribe’s natural resource damage litigation has been consolidated with the United States’ litigation described below. Because of various bankruptcies and settlements of other defendants, Hecla Limited is the only remaining defendant in the Tribe’s natural resource damages case.
U.S. Government Claims
In March 1996, the United States filed a lawsuit in Federal District Court in Idaho against certain mining companies, including Hecla Limited, that conducted historic mining operations in the Silver Valley of northern Idaho. The lawsuit asserts claims under CERCLA and the Clean Water Act, and seeks recovery for alleged damages to, or loss of, natural resources located in the Coeur d’Alene River Basin (“Basin”) in northern Idaho for which the United States asserts it is the trustee under CERCLA. The lawsuit claims that the defendants’ historic mining activity resulted in releases of hazardous substances and damaged natural resources within the Basin. The suit also seeks declaratory relief that Hecla Limited and other defendants are jointly and severally liable for response costs under CERCLA for historic mining impacts in the Basin outside the Bunker Hill site. Hecla Limited has asserted a number of defenses to the United States’ claims.
In May 1998, the EPA announced that it had commenced a Remedial Investigation/ Feasibility Study under CERCLA for the entire Basin, including Lake Coeur d’Alene, as well as the Bunker Hill site, in support of its response cost claims asserted in its March 1996 lawsuit. In October 2001, the EPA issued its proposed clean-up plan for the Basin. The EPA issued the Record of Decision (“ROD”) on the Basin in September 2002, proposing a $359 million Basin-wide clean-up plan to be implemented over 30 years and establishing a review process at the end of the 30-year period to determine if further remediation would be appropriate. In 2009, the EPA commenced a process expected by late 2010 to result in an amendment to the ROD for the Basin adopting certain changes to the ecological cleanup plan for the upper portion of the Basin. In February 2010, the EPA issued a draft focused feasibility study report which presents and evaluates alternatives for cleanup of the upper portions of the Basin. Although the final remedy has not been selected, each proposed cleanup alternative is estimated to cost between approximately $1 and $2 billion, including work in the Bunker Hill site for which Hecla Limited's liability was previously established under the Bunker Hill Decree.
During 2000 and 2001, Hecla Limited was involved in settlement negotiations with representatives of the United States, the State of Idaho and the Tribe. These settlement efforts were unsuccessful. However, Hecla Limited has resumed settlement negotiations of these and other matters, but it is not possible to predict the outcome of these efforts.
- 10 -
Phase I of the trial on the consolidated Tribe’s and the United States’ claims commenced in January 2001, and was concluded in July 2001. Phase I addressed the extent of liability, if any, of the defendants and the allocation of liability among the defendants and others, including the United States. In September 2003, the Court issued its Phase I ruling, holding that Hecla Limited has some liability for Basin environmental conditions. The Court refused to hold the defendants jointly and severally liable for historic tailings releases and instead allocated a 31% share of liability to Hecla Limited for impacts resulting from these releases. The portion of damages, past costs and clean-up costs to which this 31% applies, other cost allocations applicable to us and the Court’s determination of an appropriate clean-up plan is to be addressed in Phase II of the litigation. The Court also left issues on the deference, if any, to be afforded the United States’ clean-up plan, for Phase II.
The Court found that while certain Basin natural resources had been injured, “there has been an exaggerated overstatement” by the plaintiffs of Basin environmental conditions and the mining impact. The Court significantly limited the scope of the trustee plaintiffs’ resource trusteeship and will require proof in Phase II of the litigation of the trustees’ percentage of trusteeship in co-managed resources. The United States and the Tribe are re-evaluating their claims for natural resource damages for Phase II; such claims may be in the range of $2.0 billion to $3.4 billion. Hecla Limited believes it has limited liability for natural resource damages because of the actions of the Court described above. Because of a number of factors relating to the quality and uncertainty of the United States’ and Tribe’s natural resources damage claims, Hecla Limited is currently unable to estimate what, if any, liability or range of liability Hecla Limited may have for these claims.
Two of the defendant mining companies, Coeur d’Alene Mines Corporation and Sunshine Mining and Refining Company, settled their liabilities under the litigation during 2001. On March 13, 2009 the United States reached agreement with ASARCO concerning ASARCO’s liability in the Coeur d’Alene Basin in the litigation. The agreement, among other things, required the payment by ASARCO of approximately $482 million to the United States or certain trusts. That agreement was approved by the Bankruptcy Court on June 5, 2009. The approval was appealed by ASARCO’s corporate parent. In late 2009, both the Bankruptcy Court and the U.S. Federal Court in Texas approved ASARCO’s Plan of Reorganization which, among other things, resolved the parent’s appeal of the June 5, 2009 Order. As a result of ASARCO’s receiving approval of its Plan of Reorganization in the bankruptcy proceeding, and the distribution of approximately $482 million, plus interest to the United States in December 2009, Hecla Limited anticipates ASARCO will be dismissed as a defendant in the Idaho Federal Court litigation and Hecla Limited will be the only defendant remaining in the litigation. Because of the nature of this settlement and of the bankruptcy proceeding, Hecla Limited does not believe the Coeur d’Alene Basin environmental claims asserted against ASARCO in the bankruptcy proceeding or settlement distribution amounts are indicative of Hecla Limited’s potential liability in the Coeur d’Alene Basin. Phase II of the trial was scheduled to commence in January 2006. As a result of ASARCO’s bankruptcy filing, the Idaho Federal Court vacated the January 2006 trial date. Due to ASARCO’s resolution for its liability in the Basin in the context of its bankruptcy proceeding, Hecla Limited anticipates the Court will schedule a status conference to address rescheduling the Phase II trial date sometime in mid-2010.
In 2003, Hecla Limited estimated the range of potential liability for remediation in the Basin to be between $18 million and $58 million and accrued the minimum of the range, as it believed no amount in the range was more likely than any other amount at that time. In the second quarter of 2007, Hecla Limited determined that the cash payment approach to estimating its potential liability used in 2003 was not reasonably likely to be successful, and changed to an approach of estimating its liability through the implementation of actual remediation in portions of the Basin. Accordingly, Hecla Limited finalized an upper Basin cleanup plan, including a cost estimate, and reassessed its potential liability for remediation of other portions of the Basin, which caused Hecla Limited to increase its estimate of potential liability for Basin cleanup to the range of $60 million to $80 million. Accordingly, in June 2007, Hecla Limited recorded a provision of $42 million, which increased Hecla Limited’s total accrual for remediation in the Basin from $18 million to $60 million, the low end of the estimated range of liability, with no amount in the range being more likely than any other amount. The accrual is not discounted, as the timing of the expenditures is uncertain, but is expected to occur over the next 20 to 30 years.
- 11 -
In expert reports exchanged with the defendants in August and September 2004, the United States claimed to have incurred approximately $87 million for past environmental study, remediation and legal costs associated with the Basin for which it is alleging it is entitled to reimbursement in Phase II. In its claims filed in the ASARCO bankruptcy case, the U.S. increased this claim to $180 million. A portion of these costs is also included in the work to be done under the ROD. With respect to the United States’ past cost claims, as of March 31, 2010, Hecla Limited has determined a potential range of liability for this past response cost to be $5.6 million to $13.6 million, with no amount in the range being more likely than any other amount.
Although the United States has previously issued its ROD proposing a clean-up plan totaling approximately $359 million and its past cost claim is $87 million, based upon the Court’s prior orders, including its September 2003 order and other factors and issues to be addressed by the Court in Phase II of the trial, Hecla Limited currently estimates the range of Hecla Limited’s potential liability for both past costs and remediation (but not natural resource damages as discussed above) in the Basin to be $65.6 million to $93.6 million (including the potential range of liabilities of $60 million to $80 million for Basin cleanup, and $5.6 million to $13.6 million for the United States’ past cost claims as discussed above), with no amount in the range being more likely than any other number at this time. Hecla Limited has accrued the minimum liability within this range, which at March 31, 2010, was $65.6 million. It is possible that Hecla Limited’s ability to estimate what, if any, additional liability it may have relating to the Basin may change in the future depending on a number of factors, including but not limited to any amendments to the ROD, information obtained or developed by Hecla Limited prior to Phase II of the trial and its outcome, settlement negotiations, and any interim court determinations. There can be no assurance as to the outcome of the Coeur d’Alene River Basin environmental claims and Hecla Limited believes it is possible that a combination of various events, as discussed above, or other events could be materially adverse to its financial results or financial condition.
Insurance Coverage Litigation
In 1991, Hecla Limited initiated litigation in the Idaho District Court, County of Kootenai, against a number of insurance companies that provided comprehensive general liability insurance coverage to Hecla Limited and its predecessors. Hecla Limited believes the insurance companies have a duty to defend and indemnify Hecla Limited under their policies of insurance for all liabilities and claims asserted against it by the EPA and the Tribe under CERCLA related to the Bunker Hill site and the Basin. In 1992, the Idaho State District Court ruled that the primary insurance companies had a duty to defend Hecla Limited in the Tribe’s lawsuit. During 1995 and 1996, Hecla Limited entered into settlement agreements with a number of the insurance carriers named in the litigation. Prior to 2009, Hecla Limited has received a total of approximately $7.2 million under the terms of the settlement agreements. Thirty percent of these settlements were paid to the EPA to reimburse the U.S. Government for past costs under the Bunker Hill Decree. Litigation is still pending against one insurer with trial suspended until the underlying environmental claims against Hecla Limited are resolved or settled. The remaining insurer in the litigation, along with a second insurer not named in the litigation, is providing Hecla Limited with a partial defense in all Basin environmental litigation. As of March 31, 2010, Hecla Limited has not recorded a receivable or reduced its accrual for reclamation and closure costs to reflect the receipt of any potential insurance proceeds.
BNSF Railway Company Claim
In early November 2008, legal counsel for the BNSF Railway Company (“BNSF”) submitted a contribution claim under CERCLA against us for approximately $52,000 in past costs BNSF incurred in investigation of environmental conditions at the Wallace Yard near Wallace, Idaho. BNSF asserts that a portion of the Wallace Yard site includes the historic Hercules Mill owned and operated by Hercules Mining Company and that Hecla Limited is a successor to Hercules Mining Company. BNSF proposes that we reimburse them for the $52,000 in past costs and agree to pay all future clean up for the Hercules mill portion of the site, estimated to be $291,000, and 12.5% of any other site costs that cannot be apportioned. In April 2010, a settlement was approved for cleanup of the Wallace yard and nearby spur lines. The settlement was approved in federal court between the Union Pacific Railroad, BNSF, and the State of Idaho and the United States on behalf of the EPA. We believe construction will begin in 2010. We requested and received additional information from BNSF and are investigating the claim they sent us, but do not believe that the outcome of this claim will have a material adverse effect on our results from operations or financial position. We have not recorded a liability relating to the claim as of March 31, 2010.
- 12 -
Rio Grande Silver Guaranty
On February 21, 2008, our wholly-owned subsidiary, Rio Grande Silver Inc. (“Rio”), entered into an agreement with Emerald Mining & Leasing, LLC (“EML”) and Golden 8 Mining, LLC (“G8”) to acquire the right to earn-in to a 70% interest in the San Juan Silver Joint Venture, which holds a land package in the Creede Mining District of Colorado. On October 24, 2008, Rio entered into an amendment to the agreement which delays the incurrence of qualifying expenses to be paid by Rio pursuant to the original agreement. In connection with the amended agreement, we are required to guarantee certain environmental remediation-related obligations of EML and G8 to Homestake Mining Company of California (“Homestake”) up to a maximum liability to us of $2.5 million. As of March 31, 2010, we have not been required to make any payments pursuant to the guaranty. We may be required to make payments in the future, limited to the $2.5 million maximum liability, should EML and G8 fail to meet their obligations to Homestake (which has since been acquired by Barrick Gold Corp.). However, to the extent that any payments are made by us under the guaranty, EML and G8, in addition to other parties named in the amended agreement, have jointly and severally agreed to reimburse and indemnify us for any such payments. We have not recorded a liability relating to the guaranty as of March 31, 2010.
Lucky Friday Water Permit Exceedances
In late 2008 and during 2009, Hecla Limited experienced a number of water permit exceedances for water discharges at its Lucky Friday unit. In April 2009, Hecla Limited entered into a Consent Agreement and Final Order (“CAFO”) and a Compliance Order with the EPA, which included an extended compliance timeline. In connection with the CAFO, Hecla Limited agreed to pay an administrative penalty to the EPA of $177,500 to settle any liability for such exceedances. Hecla Limited is undertaking efforts that it believes will be successful in bringing its water discharges at the Lucky Friday unit into compliance with the permit, but cannot provide assurances that it will be able to fully comply with the permit limits, particularly in the near future.
States of South Dakota and Colorado Superfund Sites Related to CoCa Mines, Inc.
During 1991, Hecla Limited acquired all of the outstanding common stock of CoCa Mines, Inc. (“CoCa”).
During 2008, the U.S. Environmental Protection Agency (“EPA”), made a formal request for information regarding the Gilt Edge Mine Site located in Lawrence County, South Dakota, and asserted CoCa may be liable for environmental cleanup there. The Gilt Edge Mine Site was explored and/or operated as far back as the 1890s. CoCa was involved in a joint venture that conducted limited exploration work at the site during the 1980s. The EPA believes that a cleanup action is required at the location. Hecla Limited did not acquire CoCa until 1991, well after CoCa discontinued its involvement with the Gilt Edge property. Therefore, we believe that Hecla Limited is not liable for any cleanup, and if CoCa might be liable, it has no substantial assets with which to satisfy any such liability.
During 2009, the EPA made a formal request for information regarding the Nelson Tunnel/Commodore Waste Rock Pile Superfund Site (the “Site”) in Creede, Colorado. CoCa was involved in exploration and mining activities in Creede during the 1970s and the 1980s. Hecla Limited did not acquire CoCa until 1991, well after Coca discontinued its historical activities in the vicinity of the Site. Therefore, we believe that Hecla Limited is not liable for any cleanup, and if CoCa might be liable, it has no substantial assets with which to satisfy any such liability.
- 13 -
Although CoCa has received a general notice of Superfund liability from EPA at the Gilt Edge mine, no formal claim for cleanup-related costs has been made for either site. However, there can be no assurance that additional claims against CoCa or its parent corporations will not be asserted in the future.
Other Commitments
Our contractual obligations as of March 31, 2010 included approximately $4.0 million for various capital projects at the Greens Creek and Lucky Friday units, and approximately $12.5 million for commitments relating to non-capital items at Greens Creek. In addition, our commitments relating to open purchase orders at March 31, 2010 included approximately $1.3 million and $1.7 million, respectively, for various capital items at the Greens Creek and Lucky Friday units, and approximately $0.4 million and $0.7 million, respectively, for various non-capital costs. We also have total commitments of approximately $5.1 million relating to scheduled payments on capital leases, including interest, for equipment at our Greens Creek and Lucky Friday units (see Note 9 for more information).
We had letters of credit for approximately $10.2 million outstanding as of March 31, 2010 for reclamation and workers’ compensation insurance bonding.
Other Contingencies
We are subject to other legal proceedings and claims not disclosed above which have arisen in the ordinary course of our business and have not been finally adjudicated. These can include, but are not limited to, legal proceedings and/or claims pertaining to environmental or safety matters. Although there can be no assurance as to the ultimate disposition of these other matters, we believe the outcome of these other proceedings will not have a material adverse effect on our results from operations or financial position.
Note 5. Earnings per Common Share
We are authorized to issue 400,000,000 shares of common stock, $0.25 par value per share, of which 242,253,243 shares were issued and outstanding at March 31, 2010.
The following table reconciles weighted average shares of common stock used in the computations of basic and diluted earnings per share for the three-month periods ended March 31, 2010 and 2009 (dollars and shares in thousands, except per-share amounts):
|
Three Months Ended
|
||||||||
|
March 31,
|
||||||||
|
2010
|
2009
|
|||||||
|
Numerator
|
||||||||
|
Net income
|
$ | 21,844 | $ | 7,313 | ||||
|
Preferred stock dividends
|
(3,408 | ) | (3,408 | ) | ||||
|
Net income applicable to common shares for basic and diluted earnings per share
|
$ | 18,436 | $ | 3,905 | ||||
|
Denominator
|
||||||||
|
Basic weighted average common shares
|
242,039 | 198,966 | ||||||
|
Dilutive stock options and restricted stock
|
19,192 | 427 | ||||||
|
Diluted weighted average common shares
|
261,231 | 199,393 | ||||||
|
Basic earnings per common share
|
||||||||
|
Net income applicable to common shares
|
$ | 0.08 | $ | 0.02 | ||||
|
Diluted earnings per common share
|
||||||||
|
Net income applicable to common shares
|
$ | 0.07 | $ | 0.02 | ||||
- 14 -
Diluted income per share for the three months ended March 31, 2010 and 2009 exclude the potential effects of outstanding shares of our convertible preferred stock, as their conversion and exercise would have no effect on the calculation of dilutive shares.
Options to purchase 861,240 shares of our common stock were not included in the computation of diluted earnings per share in the three-month period ended March 31, 2010. Options to purchase 1,497,179 shares of our common stock and warrants to purchase 26,543,903 shares of our common stock were not included in the computation of diluted earnings per share in the three-month period ended March 31, 2009. The exercise price of the warrants and options not included in the computations of diluted earnings per share exceeded the average price of our stock during those periods and therefore would not affect the calculation of earnings per share.
Note 6. Business Segments
We are currently organized and managed by two reporting segments: the Greens Creek unit and the Lucky Friday unit.
General corporate activities not associated with operating units and their various exploration activities, as well as discontinued operations and idle properties, are presented as “other.” Interest expense, interest income and income taxes are considered general corporate items, and are not allocated to our segments.
The following tables present information about reportable segments for the three months ended March 31, 2010 and 2009 (in thousands):
|
Three months ended
|
||||||||
|
March 31,
|
||||||||
|
2010
|
2009
|
|||||||
|
Net sales to unaffiliated customers:
|
||||||||
|
Greens Creek
|
$ | 56,541 | $ | 40,013 | ||||
|
Lucky Friday
|
23,334 | 14,708 | ||||||
| $ | 79,875 | $ | 54,721 | |||||
|
Income (loss) from operations:
|
||||||||
|
Greens Creek
|
$ | 16,114 | $ | 16,032 | ||||
|
Lucky Friday
|
9,681 | 2,307 | ||||||
|
Other
|
(10,141 | ) | (2,210 | ) | ||||
| $ | 15,654 | $ | 16,129 | |||||
- 15 -
The following table presents identifiable assets by reportable segment as of March 31, 2010 and December 31, 2009 (in thousands):
|
March 31,
|
December 31,
|
|||||||
|
2010
|
2009
|
|||||||
|
Identifiable assets:
|
||||||||
|
Greens Creek
|
$ | 770,332 | $ | 771,433 | ||||
|
Lucky Friday
|
123,034 | 116,797 | ||||||
|
Other
|
173,345 | 158,554 | ||||||
| $ | 1,066,711 | $ | 1,046,784 | |||||
Note 7. Employee Benefit Plans
We sponsor defined benefit pension plans covering substantially all of our U.S. employees. Net periodic pension cost for the plans consisted of the following for the three months ended March 31, 2010 and 2009 (in thousands):
|
Three Months Ended
|
||||||||||||||||
|
March 31,
|
||||||||||||||||
|
Pension Benefits
|
Other Benefits
|
|||||||||||||||
|
2010
|
2009
|
2010
|
2009
|
|||||||||||||
|
Service cost
|
$ | 551 | $ | 567 | $ | 11 | $ | 4 | ||||||||
|
Interest cost
|
931 | 915 | 18 | 14 | ||||||||||||
|
Expected return on plan assets
|
(1,260 | ) | (1,168 | ) | -- | -- | ||||||||||
|
Amortization of prior service cost
|
151 | 151 | 13 | (1 | ) | |||||||||||
|
Amortization of net gain
|
216 | 308 | (11 | ) | (11 | ) | ||||||||||
|
Net periodic benefit cost
|
$ | 589 | $ | 773 | $ | 31 | $ | 6 | ||||||||
We do not expect to contribute to the pension plans during 2010.
At the end of March 2009 we made the decision to terminate a post-retirement medical benefit plan covering employees at our Greens Creek unit. As a result, we recognized a $9 million non-cash gain on termination of the plan during the first quarter of 2009.
Note 8. Shareholders’ Equity
Share-based Compensation Plans
We periodically grant stock options and/or restricted stock unit awards to our employees. We measure the fair value of compensation cost for stock options issued pursuant to our plans using the Black-Scholes options pricing model. Stock option grants generally vest immediately; however, grants to individual executives upon hiring vest over a defined service period. We measure compensation cost for restricted stock unit grants at the closing price of our stock at the time of grant, net of estimated forfeiture. Restricted stock unit grants vest after a named period, usually one year, with compensation cost amortized over that period.
- 16 -
Options and restricted stock units granted in the three-month periods ended March 31, 2010 and 2009 did not have a material impact on our financial statements.
In March 2009, certain portions of employee bonuses, which were accrued at December 31, 2008, were paid with 1,784,671 stock units. Of these units, 739,350 were distributed as shares of common stock issued to the employees in March of 2009. The remaining 1,045,321 units were deferred and distributed as shares of common stock in January 2010.
Preferred Stock Dividends Paid in Common Stock
In January 2010, $16.3 million in dividends declared and unpaid on our Mandatory Convertible preferred stock were paid in 2,649,231 shares of our common stock (with cash for fractional shares). The number of shares of common stock issued as dividends was calculated based on 97% of the average of the closing prices of our common stock over the five consecutive trading day period ending on the second day immediately preceding the dividend payment date.
On April 1, 2010, the declared regular quarterly dividend on the outstanding shares of our Mandatory Convertible preferred stock of approximately $3.3 million was paid in 631,334 shares of our Common Stock (with cash for fractional shares). The number of shares of Common Stock issued as dividends was calculated based on 97% of the average of the closing prices of our Common Stock over the five consecutive trading day period ending on the second day immediately preceding the dividend payment date.
Warrants
The following table summarizes certain information about our stock purchase warrants at March 31, 2010:
|
Warrants
|
Exercise Price
|
Value at
Issuance Date
(in thousands)
|
Expiration Date/
Exercise Date
|
||||||||||
|
Warrants Issued:
|
|||||||||||||
|
Series 1 warrants to purchase common stock
|
7,682,927 | $ | 2.45 | $ | 5,335 |
June 2014
|
|||||||
|
Series 1 warrants to purchase common stock
|
460,976 | 2.56 | 400 |
June 2014
|
|||||||||
|
Series 3 warrants to purchase common stock
|
18,400,000 | 2.50 | 14,816 |
August 2014
|
|||||||||
|
Series 4 warrants to purchase common stock
|
12,173,913 | 3.68 | 14,168 |
June 2010
|
|||||||||
|
Total Warrants Issued
|
38,717,816 | 34,719 | |||||||||||
|
Warrants Exercised:
|
|||||||||||||
|
Series 3 warrants to purchase common stock
|
(15,000 | ) | 2.50 | (12 | ) |
September 2009
|
|||||||
|
Series 3 warrants to purchase common stock
|
(8,500 | ) | 2.50 | (7 | ) |
November 2009
|
|||||||
|
Series 3 warrants to purchase common stock
|
(15,000 | ) | 2.50 | (12 | ) |
February 2010
|
|||||||
|
Total Warrants Outstanding
|
38,679,316 | $ | 34,688 | ||||||||||
In April 2010 Series 4 warrants to purchase 2,840,580 shares of our common stock were exercised, resulting in net proceeds to us of approximately $10.5 million.
- 17 -
Note 9. Credit Facilities and Capital Leases
Credit Facilities
In October 2009 we entered into an amended $60 million senior secured revolving credit agreement, which was amended in March 2010 to extend the term of the amended agreement and reduce the commitment fee rate and interest rate spreads. The facility is secured by our Greens Creek assets, including the shares of common stock owned by us in the wholly-owned subsidiaries that hold the equity interest in the joint venture that owns the Greens Creek mine. Amounts borrowed under the credit agreement are available for general corporate purposes. The interest rate on outstanding loans under the agreement is 4.0% above the LIBOR or an alternative base rate plus an applicable margin of 3.0%. We are required to pay a standby fee of 1.4% per annum on undrawn amounts under the revolving credit agreement. The credit facility is effective until March 12, 2013. We incurred $0.2 million in interest expense in the first quarter of 2010 for the amortization of loan origination fees and $0.3 million in interest expense for commitment fees relating to the revolving credit agreement. We have not drawn funds on the current revolving credit facility as of the filing date of this Form 10-Q. The credit agreement includes various covenants and other limitations related to our various financial ratios and indebtedness and investments, as well as other information and reporting requirements, including the following limitations:
|
·
|
Leverage ratio (calculated as total debt divided by EBITDA) of not more than 3.0:1.
|
|
·
|
Interest coverage ratio (calculated as EBITDA divided by interest expense) of not less than 3.0:1.
|
|
·
|
Current ratio (calculated as current assets divided by current liabilities) of not less than 1.10:1.
|
|
·
|
Tangible net worth of greater than $500 million.
|
During the first quarter of 2009 we incurred interest totaling $5.5 million related to the previous version of our credit facility, including $2.1 million for the amortization of loan origination fees.
Capital Leases
We entered into two 36-month lease agreements in January 2009 for equipment at our Greens Creek and Lucky Friday units, which we have determined to be capital leases. As of March 31, 2010, we recorded $5.7 million for the gross amount of assets acquired under the capital leases and $1.1 million in accumulated depreciation, in Properties, plants, equipment and mineral interests. We have a total liability balance of $4.5 million at March 31, 2010 relating to the lease obligations, with $1.6 million of the liability classified as current and the remaining $2.9 million classified as non-current. At December 31, 2009, the total liability balance associated with capital leases was $4.8 million, with $1.6 million of the liability classified as current and $3.2 million classified as non-current. The total obligation for future minimum future lease payments was $5.1 million at March 31, 2010, with $0.6 million attributed to interest.
The annual maturities of capital lease commitments, including interest, are (in thousands):
- 18 -
|
Twelve-month period ending March 31,
|
||||
|
2011
|
$ | 1,992 | ||
|
2012
|
1,866 | |||
|
2013
|
1,269 | |||
|
Total
|
5,127 | |||
|
Less: imputed interest
|
(661 | ) | ||
|
Net capital lease obligation
|
$ | 4,466 | ||
During the first quarter of 2010, $0.7 million in total interest incurred was recorded to expense, with no amount capitalized. During the first quarter of 2009, $0.9 million in total interest expense incurred was capitalized and $4.7 million was expensed.
Note 10. Developments in Accounting Pronouncements
In February 2010, the FASB issued Accounting Standards Update (“ASU”) 2010-09, which, among other things, amends Subtopic 855-10 with respect to the date through which evaluation of subsequent events must occur and under which circumstances such date must be disclosed. The update amends subtopic 855-10 so that an SEC filer is not required to disclose the date through which subsequent events have been evaluated. This change alleviates potential conflicts between Subtopic 855-10 and the SEC’s requirements. All of the amendments in this update are effective upon issuance, with limited exceptions. Adoption of this guidance did not have a material impact on our consolidated financial statements.
During February 2010, the FASB also issued ASU 2010-08, which corrects existing guidance for various topics. The update is generally effective for the first reporting period (including interim periods) beginning after issuance. We believe these corrections will have minimal, if any, impact on our consolidated financial statements.
In January 2010, the FASB issued ASU 2010-06, which amends Subtopic 820-10 to require new disclosures regarding the amounts of and reasons for significant transfers in and out of Levels 1 and 2 fair value measurement categories, and separate information about purchases, sales, issuances, and settlements in Level 3 fair value measurements. ASU 2010-06 also clarifies existing fair value measurement disclosures to provide for fair value measurement disclosures for each class of assets and liabilities, even within a line item in the statement of financial position, and to provide disclosures about the valuation techniques and inputs used to measure fair value for both recurring and nonrecurring fair value measurements that fall in either the Level 2 or Level 3 categories.
ASU 2010-06 also includes conforming amendments to the guidance on employers’ disclosures about post-retirement benefit plan assets (Subtopic 715-20), changes the terminology in Subtopic 715-20 from major categories of assets to classes of assets, and provides a cross reference to the guidance in Subtopic 820-10 on how to determine appropriate classes to present fair value disclosures.
The new disclosures and clarifications of existing disclosures in ASU 2010-06 are effective for interim and annual reporting periods beginning after December 15, 2009, except for the disclosures about purchases, sales, issuances and settlements in the roll forward of activity in Level 3 fair value measurements. Those disclosures are effective for fiscal years beginning after December 15, 2010, and for interim periods within those fiscal years. Adoption of this guidance has not had a material impact on our consolidated financial statements and is not expected to have a material impact on our consolidated financial statements in the future.
- 19 -
Note 11. Derivative Instruments
Our concentrate sales are based on a provisional sales price containing an embedded derivative that is required to be separated from the host contract for accounting purposes. The host contract is the receivable from the sale of the concentrates at the forward price at the time of the sale. The embedded derivative, which does not qualify for hedge accounting, is adjusted to market value through earnings each period prior to final settlement.
At times, we use commodity forward sales commitments, commodity swap contracts and commodity put and call option contracts to manage our exposure to fluctuation in the prices of certain metals which we produce. Contract positions are designed to ensure that we will receive a defined minimum price for certain quantities of our production, thereby partially offsetting our exposure to fluctuations in the market. These instruments do, however, expose us to other risks, including the amount by which the contract price differs from the spot price of a commodity, and nonperformance by the counterparties to these agreements. At March 31, 2010, we had no outstanding forward sales contracts, commodity put and call options contracts or other commodity hedging positions. In April 2010, we began using derivative contracts to manage our exposure to changes in base metals prices. These contracts do not qualify for hedge accounting and will be marked-to-market through earnings each period.
We periodically use derivative financial instruments to manage interest rate risk. In May 2008, we entered into an interest rate swap agreement that had the economic effect of modifying the LIBOR-based variable interest obligations associated with the previous version of our credit facility. As a result, the interest payable related to the term facility balance was to be fixed at a rate of 9.38% until the scheduled maturity of September 30, 2010 pursuant to the amended and restated credit facility. Hedge accounting was applied for this swap and the terms of the interest rate swap agreement including notational amounts, interest rate reset dates, and maturity dates matched the terms of the hedged note to which the swap agreement pertained. At inception and on an ongoing basis, we performed an effectiveness test using the hypothetical derivative method, and the swap was determined to be highly effective at offsetting changes in the fair value of the hedged note. The interest rate swap was designated as a cash flow hedge, and the fair value of the swap was calculated using the discounted cash flow method based on market observable inputs. In October 2009 we repaid the remaining facility balance and settled the remaining fair value liability associated with the swap.
Note 12. Fair Value Measurement
The table below sets forth our assets that were accounted for at fair value on a recurring basis and the fair value calculation input hierarchy level that we have determined applies to each asset category (in thousands).
- 20 -
|
Description
|
March 31, 2010
|
Quoted prices in active markets for identical assets
(Level 1)
|
Significant other
observable inputs
(Level 2)
|
|||||||||
|
Cash and cash equivalents:
|
||||||||||||
|
Money market funds and other bank deposits (1)
|
$ | 116,342 | $ | 116,342 | $ | - - | ||||||
|
Available for sale securities:
|
||||||||||||
|
Equity securities – mining industry
|
1,785 | 1,785 | - - | |||||||||
|
Trade accounts receivable:
|
||||||||||||
|
Receivables from provisional concentrate sales
|
39,097 | - - | 39,097 | |||||||||
|
Restricted cash balances:
|
||||||||||||
|
Certificates of deposit and other bank deposits (1)
|
11,775 | 11,775 | - - | |||||||||
|
Total
|
$ | 168,999 | $ | 129,902 | $ | 39,097 | ||||||
|
(1)
|
Based on our analysis of the nature and risks of these investments, we determined that presenting them as a single class is appropriate.
|
Trade accounts receivable include amounts due to us for shipments of concentrates sold to smelters. Revenues and the corresponding accounts receivable for sales of metals products are recorded when title and risk of loss transfer to the customer (generally at the time of shipment). Sales of concentrates are recorded using estimated forward prices for the anticipated month of settlement applied to our estimate of payable metal quantities contained in each shipment. Sales are recorded net of estimated treatment and refining charges, which are also impacted by changes in metals prices and quantities of contained metals. We must estimate the prices at which sales of our concentrates will be settled due to the time elapsed between shipment and final settlement with the smelter. Receivables for previously recorded concentrate sales are adjusted to reflect estimated settlement metals prices at the end of each period until final settlement by the smelter. We obtain the forward metals prices used each period from a pricing service. Changes in metal prices between shipment and final settlement will result in changes to revenues previously recorded upon shipment. The embedded derivative contained in our concentrate sales is adjusted to fair market value through earnings each period prior to final settlement.
Note 13. Sale of the Velardeña Mill
On March 9, 2009, we completed the sale of our processing facility located in Velardeña, Mexico to ECU Silver Mining Inc. (“ECU”) for $8 million in cash and 750,000 shares of ECU common stock, valued at $0.3 million at the time of the transaction. Ore produced from the San Sebastian and Don Sergio mines at our San Sebastian unit was processed at the Velardeña mill. Processing of economic ore was completed during the fourth quarter of 2005, and the mill was placed on care and maintenance at that time. The mill had a book value of approximately $3 million at the time of the sale. We recognized a pre-tax gain of approximately $6.2 million during the first quarter of 2009 as a result of the sale. The gain includes $1.0 million related to the elimination of the asset retirement obligation associated with the mill.
- 21 -
Item 2.Management's Discussion and Analysis of Financial Condition and Results of Operations
Certain statements contained in this Form 10-Q, including in Management’s Discussion and Analysis of Financial Condition and Results of Operations and Quantitative and Qualitative Disclosure About Market Risk, are intended to be covered by the safe harbor provided for under Section 27A of the Securities Act of 1933, as amended, and Section 21E of the Securities Exchange Act of 1934, as amended. Our forward-looking statements include our current expectations and projections about future results, performance, results of litigation, prospects and opportunities. We have tried to identify these forward-looking statements by using words such as “may,” “will,” “expect,” “anticipate,” “believe,” “intend,” “feel,” “plan,” “estimate,” “project,” “forecast” and similar expressions. These forward-looking statements are based on information currently available to us and are expressed in good faith and believed to have a reasonable basis. However, our forward-looking statements are subject to a number of risks, uncertainties and other factors that could cause our actual results, performance, prospects or opportunities to differ materially from those expressed in, or implied by, these forward-looking statements.
These risks, uncertainties and other factors include, but are not limited to, those set forth under Part I, Item 1A – Business – Risk Factors in our annual report filed on Form 10-K for the year ended December 31, 2009. Given these risks and uncertainties, readers are cautioned not to place undue reliance on our forward-looking statements. All subsequent written and oral forward-looking statements attributable to Hecla Mining Company or to persons acting on our behalf are expressly qualified in their entirety by these cautionary statements. Except as required by federal securities laws, we do not intend to update or revise any forward-looking statements, whether as a result of new information, future events or otherwise.
Overview
Hecla Mining Company has provided precious and base metals to the U.S. economy and worldwide since its incorporation in 1891. We discover, acquire, develop, produce, and market silver, gold, lead and zinc. In doing so, we intend to manage our business activities in a safe, environmentally responsible and cost-effective manner.
We produce both metal concentrates, which we sell to custom smelters, and unrefined gold and silver bullion bars, which may be sold as doré or further refined before sale to precious metals traders. We are organized and managed into two segments that encompass our operating units and significant exploration interests: the Greens Creek and Lucky Friday units.
Metals prices represent one of our greatest opportunities and risks, as well as the basis for some of our most significant estimates. In the first quarter of 2010, the average prices of silver, gold, zinc and lead all were higher than their levels from the same period last year, as illustrated by the table in Results of Operations below.
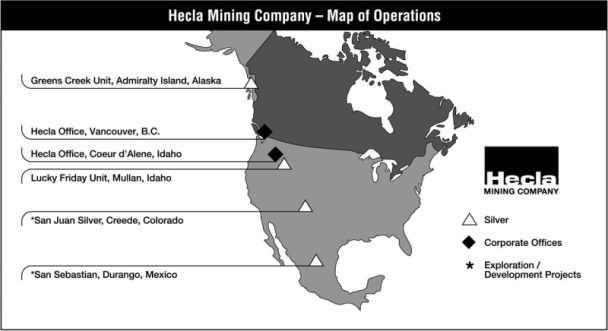
The map below shows the locations of our operating units and our exploration projects, as well as our corporate offices located in Coeur d’Alene, Idaho and Vancouver, British Columbia.
- 22 -
Our current business strategy is to focus our financial and human resources in the following areas:
|
·
|
operating our properties cost-effectively;
|
|
·
|
expanding our proven and probable reserves and production capacity at our operating properties;
|
|
·
|
maintaining and investing in exploration projects in the vicinities of four mining districts we believe to be under-explored and under-invested: North Idaho’s Silver Valley in the historic Coeur d’Alene Mining District; at our Greens Creek unit on Alaska’s Admiralty Island located offshore of Juneau; the silver-producing district near Durango, Mexico; and the Creede district of Southwestern Colorado; and
|
|
·
|
continuing to seek opportunities to acquire and invest in mining and exploration properties and companies
|
(see the Results of Operations and Financial Liquidity and Capital Resources sections below).
Our estimate for 2010 silver production is between 10 and 11 million ounces.
Results of Operations
For the first quarter of 2010, we recorded income applicable to common shareholders of $18.4 million ($0.08 per common share), compared to $3.9 million during the first quarter of 2009 ($0.02 per common share). The following factors led to the improved results for the first three months of 2010 compared to the same period in 2009:
|
·
|
Increased gross profit at our Greens Creek and Lucky Friday units by $10.1 million and $7.6 million, respectively (see The Greens Creek Segment and The Lucky Friday Segment sections below);
|
|
·
|
Increased average prices for silver, gold, zinc and lead for the first quarter of 2010 compared to the same 2009 period, as illustrated by the following table:
|
- 23 -
|
Three months ended March 31,
|
|||||||||
|
2010
|
2009
|
||||||||
|
Silver —
|
London PM Fix ($/ounce)
|
$ | 16.92 | $ | 12.61 | ||||
|
Realized price per ounce
|
$ | 16.92 | $ | 13.92 | |||||
|
Gold —
|
London PM Fix ($/ounce)
|
$ | 1,109 | $ | 909 | ||||
|
Realized price per ounce
|
$ | 1,107 | $ | 938 | |||||
|
Lead —
|
LME Final Cash Buyer ($/pound)
|
$ | 1.01 | $ | 0.52 | ||||
|
Realized price per pound
|
$ | 0.93 | $ | 0.61 | |||||
|
Zinc —
|
LME Final Cash Buyer ($/pound)
|
$ | 1.04 | $ | 0.53 | ||||
|
Realized price per pound
|
$ | 0.96 | $ | 0.63 | |||||
Concentrate sales are generally recorded as revenues at the time of shipment at forward prices for the estimated month of settlement, which differ from average market prices. Due to the time elapsed between shipment of concentrates and final settlement with the smelters, we must estimate the prices at which sales of our metals will be settled. Previously recorded sales are adjusted to estimated settlement metal prices each period through final settlement. The differences between our realized metal prices and average market prices are due primarily to price adjustments included in our revenues resulting from the difference between metal prices upon transfer of title of concentrates to the buyer and metal prices at the time of final settlement. For the first quarter of 2010, we reported negative adjustments to provisional settlements of $3.0 million compared to positive price adjustments to provisional settlements of $5.4 million in the first quarter of 2009.
|
·
|
A valuation allowance adjustment to our deferred tax asset balance resulted in a $6.1 million net income tax benefit recognized in the first quarter of 2010, with no comparable adjustment recorded in the first quarter of 2009. See Note 3 of Noted to Condensed Consolidated Financial Statements (Unaudited) for more information.
|
|
·
|
Decrease in interest expense to $0.7 million for the quarter ended March 31, 2010 compared to $4.7 million for the same 2009 period. The decrease is the result of repayment in October 2009 of the remaining debt incurred for the purchase of the 70.3% interest in the Greens Creek joint venture (see Note 9 of Notes to Condensed Consolidated Financial Statements (Unaudited) for more information on our debt facilities).
|
|
·
|
$4.3 million in expense recognized in the first quarter of 2009 for the issuance of shares of preferred stock for debt-related fees pursuant to our amended and restated credit agreement.
|
The factors discussed above were partially offset by the following other significant items affecting the comparison of our first quarter 2010 operating results to the results for the same 2009 period:
|
·
|
The termination of an employee benefit plan in the first quarter of 2009, resulting in a non-cash gain of $9.0 million (see Note 7 of Notes to Condensed Consolidated Financial Statements (Unaudited) for more information).
|
|
·
|
The sale of our Velardeña mill in Mexico, generating a pre-tax gain of $6.2 million in the first quarter of 2009 (see Note 13 of Notes to Condensed Consolidated Financial Statements (Unaudited) for more information).
|
|
·
|
Increase of $2.4 million in exploration expense in the 2010 period due to an increase in exploration activity at or near our current operations at the Greens Creek and Lucky Friday units, at our San Sebastian unit in Mexico, and at the San Juan Silver project in Colorado.
|
|
·
|
Higher provision for closed operations and environmental matters by $2.5 million in the 2010 period primarily due to a $2.4 million adjustment to increase our liability balance associated with the Bunker Hill Superfund Site recorded in the first quarter of 2010 (see Note 4 of Notes to Condensed Consolidated Financial Statements (Unaudited) for more information).
|
- 24 -
The Greens Creek Segment
Below is a comparison of the operating results and key production statistics of our Greens Creek segment (dollars are in thousands, except for per ounce amounts).
|
Three Months Ended March 31,
|
||||||||
|
2010
|
2009
|
|||||||
|
Sales
|
$ | 56,541 | $ | 40,013 | ||||
|
Cost of sales and other direct production costs
|
(25,063 | ) | (19,787 | ) | ||||
|
Depreciation, depletion and amortization
|
(14,080 | ) | (12,931 | ) | ||||
|
Gross Profit
|
$ | 17,398 | $ | 7,295 | ||||
|
Tons of ore milled
|
198,124 | 191,484 | ||||||
|
Production:
|
||||||||
|
Silver (ounces)
|
1,601,655 | 1,996,853 | ||||||
|
Gold (ounces)
|
16,862 | 18,049 | ||||||
|
Zinc (tons)
|
19,681 | 16,121 | ||||||
|
Lead (tons)
|
6,680 | 5,186 | ||||||
|
Payable metal quantities sold:
|
||||||||
|
Silver (ounces)
|
1,229,263 | 1,495,381 | ||||||
|
Gold (ounces)
|
12,851 | 13,130 | ||||||
|
Zinc (tons)
|
13,808 | 10,336 | ||||||
|
Lead (tons)
|
4,552 | 3,533 | ||||||
|
Ore grades:
|
||||||||
|
Silver ounces per ton
|
10.87 | 14.12 | ||||||
|
Gold ounces per ton
|
0.13 | 0.14 | ||||||
|
Zinc percent
|
11.21 | 9.60 | ||||||
|
Lead percent
|
4.28 | 3.53 | ||||||
|
Mining cost per ton
|
$ | 42.00 | $ | 44.27 | ||||
|
Milling cost per ton
|
$ | 22.05 | $ | 23.25 | ||||
|
Total cash cost per silver ounce (1)
|
$ | (6.47 | ) | $ | 3.21 | |||
|
(1)
|
A reconciliation of this non-GAAP measure to cost of sales and other direct production costs and depreciation, depletion and amortization, the most comparable GAAP measure, can be found below in Reconciliation of Total Cash Costs (non-GAAP) to Costs of Sales and Other Direct Production Costs and Depreciation, Depletion and Amortization (GAAP).
|
The $10.1 million increase in gross profit during the first quarter of 2010 compared to the same 2009 period was primarily the result of significantly higher average market and realized metal prices in the first quarter of 2010 for all metals produced at Greens Creek and 17% and 22% increases in zinc and lead ore grades. The impact of these factors was partially offset by a 23% decrease in silver ore grades, which resulted in lower silver production in the 2010 period in spite of an increase in mill throughput. The ore grade variances are due to differences in the sequencing of production from the various mine areas as a part of the overall mine plan. In addition, gross profit at Greens Creek was affected by negative prices adjustments to revenues during the first quarter of 2010 of $3.3 million compared to positive price adjustments during the first quarter of 2009 of $4.5 million. Price adjustments to revenues result from changes in metal prices between transfer of title of concentrates to buyers and final settlements during the quarter. Cost of sales and other direct production costs increased by 27% in the 2010 period, due primarily to an increase in ore volume. However, mining and milling costs were lower on a per ton basis in the first quarter of 2010 compared to the same 2009 period.
- 25 -
The $9.68 decrease in total cash cost per silver ounce in the first quarter of 2010 compared to the first quarter of 2009 is due to higher by-product credits by $19.62 per ounce as a result of higher average market and realized zinc, lead and gold prices and increased zinc and lead production due to higher ore grades for those metals, partially offset by higher treatment and freight costs, production costs, and mine license taxes by $6.82, $2.30, and $0.62 per ounce, respectively. While value from zinc, lead and gold by-products is significant, we believe that identification of silver as the primary product is appropriate because:
|
·
|
silver has historically accounted for a higher proportion of revenue than any other metal and is expected to do so in the future;
|
|
·
|
we have historically presented Greens Creek as a producer primarily of silver, based on the original analysis that justified putting the project into production, and believe that consistency in disclosure is important to our shareholders regardless of the relationships of metals prices and production from year to year;
|
|
·
|
metallurgical treatment maximizes silver recovery;
|
|
·
|
the Greens Creek deposit is a massive sulfide deposit containing an unusually high proportion of silver; and
|
|
·
|
in most of its working areas, Greens Creek utilizes selective mining methods to target silver production.
|
We periodically review our proven and probable reserves to ensure that reporting of primary products and by-products is appropriate. Within our cost per ounce calculations, because we consider zinc, lead and gold to be by-products of our silver production, the values of these metals offset operating costs.
The Lucky Friday Segment
The following is a comparison of the operating results and key production statistics of our Lucky Friday segment (dollars are in thousands, except for per ounce amounts):
|
Three Months Ended March 31,
|
||||||||
|
2010
|
2009
|
|||||||
|
Sales
|
$ | 23,334 | $ | 14,708 | ||||
|
Cost of sales and other direct production costs
|
(11,207 | ) | (9,848 | ) | ||||
|
Depreciation, depletion and amortization
|
(1,989 | ) | (2,287 | ) | ||||
|
Gross profit
|
$ | 10,138 | $ | 2,573 | ||||
|
Tons of ore milled
|
92,041 | 86,446 | ||||||
|
Production:
|
||||||||
|
Silver (ounces)
|
882,079 | 866,298 | ||||||
|
Lead (tons)
|
5,501 | 5,639 | ||||||
|
Zinc (tons)
|
2,531 | 2,591 | ||||||
|
Payable metal quantities sold:
|
||||||||
|
Silver (ounces)
|
812,977 | 777,281 | ||||||
|
Lead (tons)
|
5,055 | 4,940 | ||||||
|
Zinc (tons)
|
1,846 | 1,833 | ||||||
|
Ore grades:
|
||||||||
|
Silver ounces per ton
|
10.30 | 10.66 | ||||||
|
Lead percent
|
6.45 | 6.99 | ||||||
|
Zinc percent
|
3.15 | 3.49 | ||||||
|
Mining cost per ton
|
$ | 53.07 | $ | 55.82 | ||||
|
Milling cost per ton
|
$ | 14.47 | $ | 13.99 | ||||
|
Total cash cost per silver ounce (1)
|
$ | 3.21 | $ | 8.03 | ||||
|
|
(1)
|
A reconciliation of this non-GAAP measure to cost of sales and other direct production costs and depreciation, depletion and amortization, the most comparable GAAP measure, can be found below in Reconciliation of Total Cash Costs (non-GAAP) to Costs of Sales and Other Direct Production Costs and Depreciation, Depletion and Amortization (GAAP).
|
- 26 -
The $7.6 million increase in gross profit for the first quarter of 2010 compared to the same 2009 period resulted primarily from significantly higher average market and realized silver, lead and zinc prices and improved production resulting from a 6% increase in mill throughput. Cost of sales and other direct production costs increased by 14% in the first quarter of 2010 compared to the first quarter of 2009 due primarily to the increase in ore volume. Production costs improved on a per ton basis in the 2010 period, with a 5% decrease in mining cost per ton, partially offset by a 3% increase in milling cost per ton.
The $4.82 decrease in total cash costs per silver ounce in the first quarter of 2010 compared to the 2009 period is attributed to higher lead and zinc by-product credits by $6.79 per ounce resulting from increased average market and realized prices for those metals, partially offset by higher treatment and freight, profit sharing, and production costs $0.73, $0.67 and $0.46 per ounce, respectively. While value from lead and zinc is significant at the Lucky Friday, we believe that identification of silver as the primary product, with zinc and lead as by-products, is appropriate because:
|
·
|
silver has historically accounted for a higher proportion of revenue than any other metal and is expected to do so in the future;
|
|
·
|
the Lucky Friday unit is situated in a mining district long associated with silver production; and
|
|
·
|
the Lucky Friday unit generally utilizes selective mining methods to target silver production.
|
We periodically review our proven and probable reserves to ensure that reporting of primary products and by-products is appropriate. Within our cost per ounce calculations, because we consider zinc and lead to be by-products of our silver production, the values of these metals offset operating costs.
Over the past years we have evaluated alternatives for deeper access at the Lucky Friday mine in order to expand its operational life. As a result, we have initiated engineering, procurement of long lead time equipment, development, and other early construction activities for an internal shaft at Lucky Friday. If construction of the shaft is undertaken, upon completion, the internal shaft would allow us to mine mineralized material below our current workings and provide deeper platforms for exploration. Construction of the internal shaft would take approximately five years and involve significant capital expenditures. Should we decide to continue with construction of the internal shaft, our ability to fund this project, along with our other capital requirements, would depend to a large extent on our operating performance. A significant decrease in metals prices, an increase in operating costs or an increase in the capital cost could potentially require us to suspend the project or access additional capital though debt financing, the sale of securities, or other external sources. This additional financing could be costly or unavailable.
Many of the employees at our Lucky Friday unit are represented by a union. The collective bargaining agreement with the union expires on April 30, 2010. We are in the process of negotiating a new collective bargaining agreement with the union, however, there can be no assurance that we will reach an agreement with them before (or after) April 30, or that an agreement can be reached without disruptions to production.
Corporate Matters
Other significant variances affecting the results of our first quarter 2010 operations as compared to the first quarter 2009 were as follows:
- 27 -
|
●
|
Lower general and administrative expense in the first quarter of 2010 by $0.6 million which was primarily the result of workforce reduction costs incurred in the 2009 period, partially offset by increased incentive compensation expense in the 2010 period.
|
|
●
|
$1.3 million decrease in other operating expense primarily as a result of professional fees incurred in the first quarter of 2009 related to compliance with our amended and restated credit agreement in place at that time.
|
|
●
|
Interest expense, net of interest capitalized, of $0.7 million for the first quarter of 2010 compared to $4.7 million for the 2009 period. The decrease is due to our repayment in October 2009 of the remaining balance of debt incurred for the purchase of the remaining 70.3% interest in the Greens Creek joint venture (see Note 9 of Notes to Condensed Consolidated Financial Statements (Unaudited) for more information on our debt facilities).
|
|
●
|
$4.3 million in expense recognized in the first quarter of 2009 for the issuance of shares of preferred stock for debt-related fees pursuant to our amended and restated credit agreement in effect at that time.
|
|
●
|
An income tax benefit of $6.2 million for the first quarter of 2010 compared to an income tax provision of $0.1 million for the first quarter of 2009. The difference is due primarily to a $6.3 million adjustment to reduce our deferred tax asset valuation allowance in the first quarter of 2010. See Note 3 of Notes to Condensed Consolidated Financial Statements (Unaudited) for more information.
|
Reconciliation of Total Cash Costs (non-GAAP) to Cost of Sales and Other Direct Production Costs and Depreciation, Depletion and Amortization (GAAP)
The tables below present reconciliations between non-GAAP total cash costs to cost of sales and other direct production costs and depreciation, depletion and amortization (GAAP) for our operations at the Greens Creek and Lucky Friday units for the three months ended March 31, 2010 and 2009 (in thousands, except costs per ounce).
Total cash costs include all direct and indirect operating cash costs related directly to the physical activities of producing metals, including mining, processing and other plant costs, third-party refining and marketing expense, on-site general and administrative costs, royalties, and mining production taxes, net of by-product revenues earned from all metals other than the primary metal produced at each unit. Total cash costs provide management and investors an indication of net cash flow, after consideration of the realized price received for production sold. Management also uses this measurement for the comparative monitoring of performance of our mining operations period-to-period from a cash flow perspective. “Total cash cost per ounce” is a measure developed by precious metals companies in an effort to provide a comparable standard; however, there can be no assurance that our reporting of this non-GAAP measure is similar to that reported by other mining companies.
Cost of sales and other direct production costs and depreciation, depletion and amortization, is the most comparable financial measure calculated in accordance with GAAP to total cash costs. The sum of the cost of sales and other direct production costs and depreciation, depletion and amortization for our operating units in the tables below is presented in our Condensed Consolidated Statement of Income and Comprehensive Income (Loss) (Unaudited) (in thousands).
- 28 -
|
Total, All Properties
|
||||||||
|
Three Months Ended March 31,
|
||||||||
|
2010
|
2009
|
|||||||
|
Total cash costs
|
$ | (7,532 | ) | $ | 13,368 | |||
|
Divided by silver ounces produced
|
2,484 | 2,863 | ||||||
|
Total cash cost per silver ounce produced
|
$ | (3.03 | ) | $ | 4.67 | |||
|
Reconciliation to GAAP:
|
||||||||
|
Total cash costs
|
$ | (7,532 | ) | $ | 13,368 | |||
|
Depreciation, depletion and amortization
|
16,069 | 15,218 | ||||||
|
Treatment costs
|
(24,918 | ) | (17,530 | ) | ||||
|
By-product credits
|
69,395 | 37,875 | ||||||
|
Change in product inventory
|
(458 | ) | (4,324 | ) | ||||
|
Reclamation and other costs
|
(217 | ) | 246 | |||||
|
Cost of sales and other direct production costs and depreciation, depletion and amortization (GAAP)
|
$ | 52,339 | $ | 44,853 | ||||
|
Greens Creek unit
|
||||||||
|
Three Months Ended March 31,
|
||||||||
|
2010
|
2009
|
|||||||
|
Total cash costs
|
$ | (10,366 | ) | $ | 6,411 | |||
|
Divided by silver ounces produced
|
1,602 | 1,997 | ||||||
|
Total cash cost per silver ounce produced
|
$ | (6.47 | ) | $ | 3.21 | |||
|
Reconciliation to GAAP:
|
||||||||
|
Total cash costs
|
$ | (10,366 | ) | $ | 6,411 | |||
|
Depreciation, depletion and amortization
|
14,080 | 12,932 | ||||||
|
Treatment costs
|
(19,939 | ) | (13,304 | ) | ||||
|
By-product credits
|
55,926 | 30,526 | ||||||
|
Change in product inventory
|
(334 | ) | (4,086 | ) | ||||
|
Reclamation and other costs
|
(224 | ) | 239 | |||||
|
Cost of sales and other direct production costs and depreciation, depletion and amortization (GAAP)
|
$ | 39,143 | $ | 32,718 | ||||
- 29 -
|
Lucky Friday unit
|
||||||||
|
Three Months Ended March 31,
|
||||||||
|
2010
|
2009
|
|||||||
|
Total cash costs
|
$ | 2,834 | $ | 6,957 | ||||
|
Divided by silver ounces produced
|
882 | 866 | ||||||
|
Total cash cost per silver ounce produced
|
$ | 3.21 | $ | 8.03 | ||||
|
Reconciliation to GAAP:
|
||||||||
|
Total cash costs
|
$ | 2,834 | $ | 6,957 | ||||
|
Depreciation, depletion and amortization
|
1,989 | 2,286 | ||||||
|
Treatment costs
|
(4,979 | ) | (4,226 | ) | ||||
|
By-product credits
|
13,469 | 7,349 | ||||||
|
Change in product inventory
|
(124 | ) | (238 | ) | ||||
|
Reclamation and other costs
|
7 | 7 | ||||||
|
Cost of sales and other direct production costs and depreciation, depletion and amortization (GAAP)
|
$ | 13,196 | $ | 12,135 | ||||
Financial Liquidity and Capital Resources
Our liquid assets include (in millions):
|
March 31,
2010
|
December 31,
2009
|
|||||||
|
Cash and cash equivalents
|
$ | 116.3 | $ | 104.7 | ||||
|
Marketable equity securities
|
1.8 | 3.3 | ||||||
|
Total cash, cash equivalents and investments
|
$ | 118.1 | $ | 108..0 | ||||
Cash and cash equivalents increased by $11.7 million in the first three months of 2010, as discussed below, while the value of marketable equity securities decreased by $1.5 million due to the sale of securities in January 2010 (see Note 2 of Notes to Condensed Consolidated Financial Statements (Unaudited) for more information) and changes in market value (see Note 12 of Notes to Condensed Consolidated Financial Statements (Unaudited) for more information).
In October 2009, we entered into a three year, $60 million senior-secured revolving credit facility which has not been drawn upon as of March 31, 2010. The facility is available for general corporate purposes and, based on our current cash position and business plan, we do not currently contemplate drawing on the facility in the near term. We may pursue acquisition opportunities or capital expansion projects which could require additional equity issuances or financing. There can be no assurances that such financing will be available to us.
Series 4 warrants to purchase 2,840,580 shares of our Common Stock were exercised in April 2010, resulting in proceeds to us of approximately $10.5 million. The remaining Series 4 warrants to purchase 9,333,333 shares of our Common Stock which have an exercise price of $3.68 per share, expire in June 2010 (see Note 8 of Notes to Condensed Consolidated Financial Statements (Unaudited) for more information on our warrants outstanding). If all remaining Series 4 warrants are exercised prior to expiration, we would receive proceeds of approximately $44.8 million (including the $10.5 million already received from warrants exercised in April) during the second quarter of 2010.
As a result of our current cash balance, the performance of our operations, current metals prices, the potential of additional warrant exercises, and full availability of our $60 million revolving credit facility, we believe our cash, cash equivalents, investments, cash from operations, and availability of financing if needed will be adequate to meet our obligations during the next twelve months.
- 30 -
We currently estimate that approximately $40 to $50 million will be committed to sustaining capital expenditures through the end of this year. However, we have initiated engineering, procurement of long lead time equipment, development, and other early construction activities for an internal shaft at our Lucky Friday mine to increase its production and longevity. If we decide to continue with construction of the internal shaft, our estimate of capital expenditures for the remainder of this year could increase by approximately $30 million. Deeper access will require significant capital resources over several years’ duration. Our ability to finance such a program will depend on our operational performance, metals prices, our ability to estimate capital costs, and sources of liquidity available to us. We believe that our available cash, revolving credit agreement, cash from operations, potential proceeds from warrant exercises, and access to equity and financial markets will allow us to proceed if project economics appear to be favorable, and we may also mitigate market risk from time to time with selective base metal hedging programs. However, a sustained downturn in metals prices or significant increases in operational or capital costs could compel us to suspend the project in the future.
|
Three Months Ended
March 31,
|
||||||||
|
2010
|
2009
|
|||||||
|
Cash provided by (used in) operating activities (in millions)
|
$ | 19.3 | $ | (0.5 | ) | |||
Cash provided by operating activities in the first three months of 2010 increased compared to the same 2009 period primarily due to higher income, as adjusted for non-cash items. The improved results are attributable to higher prices for all metals produced at our operations. Working capital and other operating asset and liability changes decreased by $14.9 million in the first three months of 2010 compared to a decrease of $15.7 million in the 2009 period. The $0.8 million difference is due primarily to higher accounts payable and accrued liabilities and a reduction in other current and non-current assets, partially offset by increased accounts receivable and a reduction in accrued payroll and related benefits. The increase in accounts payable and accrued liabilities is attributable to increased activity and the timing of payments to vendors at our operating units. The decrease in other current and non-current assets during the first quarter is due primarily to amortization of loan origination fees relating to our credit facility and a reduction in the overfunded status of our pension plan. The higher accounts receivable balances this year are attributable primarily to increased metals prices, 42% and 28% increases in inventory tonnage of our zinc and lead concentrate, respectively, at Greens Creek during the first quarter of 2010, and the timing of concentrate shipments from Greens Creek. The decrease in accrued payroll and related benefits is due mainly to the payment of 2009 incentive compensation in the first quarter of 2010.
|
Three Months Ended
March 31,
|
||||||||
|
2010
|
2009
|
|||||||
|
Cash (used in) provided by investing activities (in millions)
|
$ | (7.1 | ) | $ | 3.7 | |||
We received $8.0 million in proceeds from the sale of the Velardeña mill in Mexico in the first quarter of 2009 (see Note 13 of Notes to Condensed Consolidated Financial Statements (Unaudited) for more information on the sale). During the first three months of 2010 we invested $8.3 million in capital expenditures, higher by $4.6 million than the same period last year, due to an increase in capital spending at both the Greens Creek and Lucky Friday units resulting from projects that had been deferred in the prior year. In January 2010 we sold investments having a cost basis of $0.6 million for proceeds of $1.1 million (see Note 2 of Notes to Condensed Consolidated Financial Statements (Unaudited) for more information). There was no change in our restricted cash balances during the first quarter of 2010, while we increased our restricted cash balances related to environmental bonding by $0.7 in the same 2009 period.
- 31 -
|
Three Months Ended
March 31,
|
||||||||
|
2010
|
2009
|
|||||||
|
Cash (used in) provided by financing activities (in millions)
|
$ | (0.5 | ) | $ | 22.9 | |||
Our financing activities in the first three months of 2009 included sales of common stock and warrants which yielded $71 million cash, net of related issuance costs, $48 million of which was applied to repayments of our debt facility. No comparable transactions occurred in the corresponding 2010 period. During the first quarter of 2010, warrant and options exercised resulted in net cash proceeds of $0.7 million, while we paid $0.8 million in cash dividends on our Series B preferred stock and made repayments on our capital leases of $0.4 million.
Contractual Obligations, Contingent Liabilities and Commitments
The table below presents our fixed, non-cancelable contractual obligations and commitments primarily related to our outstanding purchase orders, certain capital expenditures, our credit facility (as modified by amendments) and lease arrangements as of March 31, 2010 (in thousands):
|
Payments Due By Period
|
||||||||||||||||||||
|
Less than 1 year
|
1-3 years
|
4-5 years
|
More than
5 years
|
Total
|
||||||||||||||||
|
Purchase obligations (1)
|
$ | 4,122 | $ | - - | $ | - - | $ | - - | $ | 4,122 | ||||||||||
|
Commitment fees (2)
|
840 | 1,637 | - - | - - | 2,477 | |||||||||||||||
|
Contractual obligations (3)
|
16,520 | - - | - - | - - | 16,520 | |||||||||||||||
|
Capital lease commitments (4)
|
1,992 | 3,135 | - - | - - | 5,127 | |||||||||||||||
|
Operating lease commitments (5)
|
2,763 | 5,162 | 1,820 | - - | 9,745 | |||||||||||||||
|
Supplemental executive retirement plan (6)
|
374 | 972 | 945 | 942 | 3,233 | |||||||||||||||
|
Total contractual cash obligations
|
$ | 26,611 | $ | 10,906 | $ | 2,765 | $ | 942 | $ | 41,224 | ||||||||||
|
(1)
|
Consists of open purchase orders of approximately $1.7 million at the Greens Creek unit and $2.4 million at the Lucky Friday unit. Included in these amounts are approximately $1.3 million and $1.7 million related to various capital projects at the Greens Creek and Lucky Friday units, respectively.
|
|
(2)
|
In October 2009 we entered into a $60 million revolving credit agreement involving a three-year term, which was amended in March 2010. We are required to pay a standby fee of 1.4% per annum on undrawn amounts under the revolving credit agreement. There was no amount drawn under the revolving credit agreement as of March 31, 2010, and the amounts above assume no amounts will be drawn during the agreement’s term. For more information on our credit facility, see Note 9 of Notes to Condensed Consolidated Financial Statements (Unaudited).
|
|
(3)
|
Includes approximately $4.0 million for various capital projects at the Greens Creek and Lucky Friday units. Total contractual obligations at March 31, 2010 also included approximately $12.5 million for commitments relating to non-capital items at Greens Creek.
|
|
(4)
|
Represents scheduled capital lease payments of $4.2 million and $0.9 million (including interest), respectively, for equipment at our Greens Creek and Lucky Friday units. These leases have fixed payment terms and contain bargain purchase options at the end of the lease periods (see Note 9 of Notes to Condensed Consolidated Financial Statements (Unaudited) for more information).
|
- 32 -
|
(5)
|
We enter into operating leases in the normal course of business. Substantially all lease agreements have fixed payment terms based on the passage of time. Some lease agreements provide us with the option to renew the lease or purchase the leased property. Our future operating lease obligations would change if we exercised these renewal options and if we entered into additional operating lease arrangements.
|
|
(6)
|
There were no funding requirements as of March 31, 2010 under our other defined benefit pension plans. See Note 7 of Notes to Condensed Consolidated Financial Statements (Unaudited) for more information.
|
We maintain reserves for costs associated with mine closure, land reclamation and other environmental matters. At March 31, 2010, our reserves for these matters totaled $133.2 million, for which no contractual or commitment obligations exist. Future expenditures related to closure, reclamation and environmental expenditures are difficult to estimate, although we anticipate we will make expenditures relating to these obligations over the next 30 years. For additional information relating to our environmental obligations, see Note 4 of Notes to Condensed Consolidated Financial Statements (Unaudited).
Off-Balance Sheet Arrangements
At March 31, 2010, we had no existing off-balance sheet arrangements, as defined under SEC regulations, that have or are reasonably likely to have a current or future effect on our financial condition, revenues or expenses, results of operations, liquidity, capital expenditures or capital resources that is material to investors.
Critical Accounting Estimates
Our significant accounting policies are described in Note 1 of Notes to Consolidated Financial Statements in our annual report filed on Form 10-K for the year ended December 31, 2009. As described in Note 1, we are required to make estimates and assumptions that affect the reported amounts and related disclosures of assets, liabilities, revenue, and expenses. Our estimates are based on our experience and our interpretation of economic, political, regulatory, and other factors that affect our business prospects. Actual results may differ significantly from our estimates.
We believe that our most critical accounting estimates are related to future metals prices, obligations for environmental, reclamation, and closure matters, mineral reserves, and accounting for business combinations, as they require us to make assumptions that are highly uncertain at the time the accounting estimates are made, and changes in them are reasonably likely to occur from period to period. Management has discussed the development and selection of these critical accounting estimates with the Audit Committee of our Board of Directors, and the Audit Committee has reviewed the disclosures presented below. In addition, there are other items within our financial statements that require estimation, but are not deemed to be critical. However, changes in estimates used in these and other items could have a material impact on our financial statements.
Future Metals Prices
Metals prices are key components in estimates that determine the valuation of some of our significant assets and liabilities, including properties, plants and equipment, deferred tax assets, and certain accounts receivable. As shown under Item 1A. — Risk Factors in our annual report filed on Form 10-K for the year ended December 31, 2009, metals prices have been historically volatile. While average prices for all four metals we produce performed favorably for the five consecutive years prior to 2008, there was a reduction in the average prices for zinc and lead in 2008 compared to 2007, and average prices for silver, zinc and lead were lower in 2009 compared to 2008. However, average prices for all for metals were higher in the first quarter of 2010 compared to the same period in 2009. We have recorded impairments to our asset carrying value because of low prices in the past, and we can offer no assurance that prices will either remain at their current levels or increase.
- 33 -
Processes supporting valuation of our assets and liabilities that are most significantly affected by metals prices include analyses of asset carrying values, depreciation, and deferred income taxes. On at least an annual basis – and more frequently if circumstances warrant – we examine the carrying values of our assets, our depreciation rates, and the valuation allowances on our deferred tax assets. In our analyses of carrying values and deferred taxes, we apply several pricing views to our forecasting model, including current prices, analyst price estimates, forward-curve prices, and historical prices (see Mineral Reserves, below, regarding prices used for reserve estimates). Using applicable accounting guidance and our view of metals markets, we use the average of the various methods to determine whether the values of our assets are fairly stated, and to determine the level of valuation allowances on our deferred tax assets. In addition, estimates of future metals prices are used in the valuation of certain assets in the determination of the purchase price allocations for our acquisitions (see Business Combinations below).
Sales of all metals products sold directly to smelters are recorded as revenues when title and risk of loss transfer to the smelter (generally at the time of shipment) at estimated forward metals prices for the estimated month of settlement. Due to the time elapsed from shipment to the smelter and the final settlement with the smelter, we must estimate the prices at which sales of our metals will be settled. Previously recorded sales and trade accounts receivable are adjusted to estimated settlement metals prices until final settlement by the smelter. Changes in metals prices between shipment and final settlement will result in changes to revenues and accounts receivable previously recorded upon shipment. As a result, our trade accounts receivable balances are subject to changes in metals prices until final settlement occurs. For more information, see part O. Revenue Recognition of Note 1 of Notes to Consolidated Financial Statements in our annual report filed on Form 10-K for the year ended December 31, 2009.
Obligations for Environmental, Reclamation and Closure Matters
The most significant liability on our balance sheet is for accrued reclamation and closure costs. We have conducted considerable remediation work at sites in the United States for which remediation requirements have not been fully determined, nor have they been agreed upon between us and various regulatory agencies with oversight over the properties. We have estimated our liabilities with counsel and in accordance with appropriate accounting guidance. On at least an annual basis – and more frequently if warranted – management reviews our liabilities. However, the range of liability proposed by the plaintiffs in environmental proceedings considerably exceeds the liabilities we have recognized. If substantial damages were awarded or remediation costs incurred in excess of our accruals, our financial results or condition could be materially adversely affected. In addition, our liquidity could be negatively impacted if significant damages were awarded or remediation costs incurred relating to our environmental accruals.
Mineral Reserves
Critical estimates are inherent in the process of determining our reserves. Our reserves are affected largely by our assessment of future metals prices, as well as by engineering and geological estimates of ore grade, accessibility and production cost. Metals prices are estimated at long-term averages, as described in Item 2. — Property Descriptions in our annual report on Form 10-K filed for the year ended December 31, 2009. Our assessment of reserves occurs at least annually, and periodically utilizes external audits.
- 34 -
Reserves are a key component in valuation of our properties, plants and equipment. Reserve estimates are used in determining appropriate rates of units-of-production depreciation, with net book value of many assets depreciated over remaining estimated reserves. Reserves are also a key component in forecasts, with which we compare estimated future cash flows from reserves and other mineralized material to current asset values to ensure that carrying values are reported appropriately. Forecasted cash flows are also used in the determination of recoverability of deferred tax assets. Reserves also play a role in the valuation of certain assets in the determination of the purchase price allocations for our acquisitions (see Business Combinations below). Reserves represent a culmination of many estimates, and are not guarantees that we will recover the indicated quantities of metals.
Business Combinations
We are required to allocate the purchase price of acquired companies to the tangible and intangible assets acquired and liabilities assumed based on their estimated fair values at acquisition date. The valuation of assets acquired and liabilities assumed requires management to make significant estimates and assumptions, especially with respect to long-lived assets, including estimates of future metals prices and mineral reserves, as discussed above. In some cases, we use third-party appraisers to determine the fair values and lives of property and other identifiable assets.
- 35 -
Item 3. Quantitative and Qualitative Disclosures About Market Risk
The following discussion about our risk management activities includes forward-looking statements that involve risk and uncertainties, as well as summarizes the financial instruments held by us at March 31, 2010, which are sensitive to changes in interest rates and commodity prices and are not held for trading purposes. Actual results could differ materially from those projected in the forward-looking statements. In the normal course of business, we also face risks that are either nonfinancial or nonquantifiable (see Item 1A. – Risk Factors in our annual reported filed on Form 10-K for the year ended December 31, 2009).
Short-term Investments
From time to time we hold various types of short-term investments that are subject to changes in market interest rates and are sensitive to those changes. We did not carry any such short-term investments as of March 31, 2010.
Commodity-Price Risk Management
At times, we use commodity forward sales commitments, commodity swap contracts and commodity put and call option contracts to manage our exposure to fluctuation in the prices of certain metals which we produce. Contract positions are designed to ensure that we will receive a defined minimum price for certain quantities of our production. We use these instruments to reduce risk by offsetting market exposures. We had no commodity-related derivative positions at March 31, 2010. In April 2010, we began using derivative contracts to manage our exposure to changes in base metals prices. These contracts do not qualify for hedge accounting and will be marked-to-market through earnings each period.
Interest-Rate Risk Management
We periodically use derivative financial instruments to manage interest rate risk. In May 2008, we entered into an interest rate swap agreement that had the economic effect of modifying the LIBOR-based variable interest obligations associated with the previous version of our credit facility. As a result, the interest payable related to the term facility balance was to be fixed at a rate of 9.38% until the scheduled maturity on September 30, 2010 pursuant to the amended and restated credit facility. Hedge accounting was applied for this swap and the terms of the interest rate swap agreement including notational amounts, interest rate reset dates, and maturity dates matched the terms of the hedged note to which the swap agreement pertained. At inception and on an ongoing basis, we performed an effectiveness test using the hypothetical derivative method, and the swap was determined to be highly effective at offsetting changes in the fair value of the hedged note. The interest rate swap was designated as a cash flow hedge, and the fair value of the swap was calculated using the discounted cash flow method based on market observable inputs. In October 2009 we repaid the remaining facility balance and settled the remaining fair value liability associated with the swap.
On October 14, 2009, we entered into an amended $60 million revolving credit agreement for a three-year term, which was amended in March 2010. See Note 9 of Notes to Condensed Consolidated Financial Statements (Unaudited) for more information. We have not drawn on the current revolving credit facility. However, if used, amounts borrowed under the facility would be subject to changes in market interest rates.
- 36 -
Provisional Sales
Sales of all metals products sold directly to smelters, including by-product metals, are recorded as revenues when title and risk of loss transfer to the smelter (generally at the time of shipment) at forward prices for the estimated month of settlement. Due to the time elapsed from shipment to the smelter and the final settlement with the smelter, we must estimate the prices at which sales of our metals will be settled. Previously recorded sales are adjusted to estimated settlement metals prices until final settlement by the smelter. Changes in metals prices between shipment and final settlement will result in changes to revenues previously recorded upon shipment. Our concentrate sales are based on a provisional sales price containing an embedded derivative that is required to be separated from the host contract for accounting purposes. The host contract is the receivable from the sale of the concentrates at the forward price at the time of the sale. The embedded derivative, which does not qualify for hedge accounting, is adjusted to market through earnings each period prior to final settlement. Metals prices can and often do fluctuate widely and are affected by numerous factors beyond our control (see Item 1A – Risk Factors – A substantial or extended decline in metals prices would have a material adverse effect on us in our annual report filed on Form 10-K for the year ended December 31, 2009 for more information). At March 31, 2010, metals contained in concentrates and exposed to future price changes totaled 961,580 ounces of silver, 4,693 ounces of gold, 15,581 tons of zinc, and 6,363 tons of lead. If the price for each metal were to change by one percent, the change in the total value of the concentrates sold would be approximately $0.7 million. However, as noted in Commodity-Price Risk Management above, in April 2010, we have initiated a program designed to mitigate the risk of negative price adjustments with limited mark-to-market hedges of our base metals sales.
Item 4.Controls and Procedures
An evaluation was performed under the supervision and with the participation of our management, including the Chief Executive Officer (“CEO”) and Chief Financial Officer (“CFO”), of the effectiveness of the design and operation of our disclosure controls and procedures as required by Securities Exchange Act Rules 13a-15(e) and 15d-15(e) as of the end of the period covered by this report. Based on that evaluation, our CEO and CFO concluded that our disclosure controls and procedures, including controls and procedures designed to ensure that information required to be disclosed by us is accumulated and communicated to our management (including our CEO and CFO), were effective as of March 31, 2010, in ensuring them in a timely manner that material information required to be disclosed in this report has been properly recorded, processed, summarized and reported. There were no changes in our internal control over financial reporting during the quarter ended March 31, 2010, that have materially affected, or are reasonably likely to materially affect, our internal control over financial reporting.
Internal control systems, no matter how well designed and operated, have inherent limitations. Therefore, even a system which is determined to be effective cannot provide absolute assurance that all control issues have been detected or prevented. Our systems of internal controls are designed to provide reasonable assurance with respect to financial statement preparation and presentation.
- 37 -
Part II - Other Information
Hecla Mining Company and Subsidiaries
Item 1.Legal Proceedings
For information concerning legal proceedings, refer to Note 4 of Notes to Condensed Consolidated Financial Statements (Unaudited), which is incorporated by reference into this Item 1.
Item 1A. Risk Factors
Item 1A – Risk Factors of the Company’s annual report filed on Form 10-K for the year ended December 31, 2009 sets forth information relating to important risks and uncertainties that could materially adversely affect the Company’s business, financial condition or operating results. Those risk factors continue to be relevant to an understanding of the Company’s business, financial condition and operating results. There are no material changes to the Risk Factors set forth in Item 1A in our annual report on Form 10-K for the year ended December 31, 2009.
Item 2.Unregistered Shares of Equity Securities and Use of Proceeds
As previously disclosed in our Current Report on Form 8-K filed on December 31, 2009, on January 4, 2010, we issued 2,649,231unregistered shares of our Common Stock for a previously announced payment of dividends in arrears and the regular quarterly dividend on our outstanding 6.5% Mandatory Convertible Preferred Stock. The issuance of shares to our existing holders of the Mandatory Convertible Preferred Stock is exempt from registration as it involves no sale for value in which any investment decision is made and/or no public offering pursuant to Section 4(2) of the Securities Act of 1933.
Item 6.Exhibits
|
|
See the exhibit index to this Form 10-Q for the list of exhibits.
|
Items 3, 4 and 5 of Part II are not applicable and are omitted from this report.
- 38 -
Hecla Mining Company and Subsidiaries
SIGNATURES
Pursuant to the requirements of the Securities Exchange Act of 1934, the registrant has duly caused this report to be signed on its behalf by the undersigned thereunto duly authorized.
| HECLA MINING COMPANY | ||
| (Registrant) | ||
|
Date: April 28, 2010
|
/s/ Phillips S. Baker, Jr. | |
| Phillips S. Baker, Jr. | ||
| Chief Executive Officer and Director | ||
|
Date: April 28, 2010
|
/s/ James A. Sabala | |
| James A. Sabala | ||
| Senior Vice President and Chief Financial Officer |
- 39 -
Hecla Mining Company and Wholly Owned Subsidiaries
Form 10-Q – March 31, 2010
Index to Exhibits
|
|
3.1
|
Certificate of Incorporation of the Registrant as amended to date. Filed as exhibit 3.1 to Registrant’s Form 10-K for the year ended December 31, 2009 (File No. 1-8491), and incorporated herein by reference.
|
|
|
3.2
|
Bylaws of the Registrant as amended to date. Filed as exhibit 3.1 to Registrant’s Current Report on Form 8-K filed on December 6, 2007 (File No. 1-8491), and incorporated herein by reference.
|
|
|
4.1(a)
|
Certificate of Designation, Preferences and Rights of Series A Junior Participating Preferred Stock of the Registrant. Filed as part of exhibit 3.1 to Registrant’s Form 10-K for the year ended December 31, 2009 (File No. 1-8491), and incorporated herein by reference.
|
|
|
4.1(b)
|
Certificate of Designation, Preferences and Rights of Series B Cumulative Convertible Preferred Stock of the Registrant. Filed as part of exhibit 3.1 to Registrant’s Form 10-K for the year ended December 31, 2009 (File No. 1-8491), and incorporated herein by reference.
|
|
|
4.1(c)
|
Certificate of Designations of 6.5% Mandatory Convertible Preferred Stock of the Registrant. Filed as part of exhibit 3.1 to Registrant’s Form 10-K for the year ended December 31, 2009 (File No. 1-8491), and incorporated herein by reference.
|
|
|
4.2(a)
|
Form of Series 1 Common Stock Purchase Warrant. Filed as exhibit 4.1 to Registrant’s Current Report on Form 8-K filed on December 11, 2008 (File No. 1-8491), and incorporated herein by reference.
|
|
|
4.2(b)
|
Form of Series 3 Common Stock Purchase Warrant. Filed as exhibit 4.1 to Registrant’s Current Report on Form 8-K filed on February 9, 2009 (File No. 1-8491), and incorporated herein by reference.
|
|
|
4.2(c)
|
Form of Series 4 Common Stock Purchase Warrant Filed as exhibit 4.1 to Registrant’s Current Report on Form 8-K filed on June 8, 2009 (File No. 1-8491), and incorporated herein by reference.
|
- 40 -
|
|
10.1
|
Second Amended and Restated Credit Agreement effective October 14, 2009, by and among Hecla Mining Company, as Parent, Hecla Alaska LLC, Hecla Greens Creek Mining Company and Hecla Juneau Mining Company, as Borrowers, The Bank of Nova Scotia, as the Administrative Agent for the Lenders, and various Lenders. Filed as exhibit 10.1 to Registrant’s Current Report on Form 8-K on October 15, 2009 (File No. 1-8491), and incorporated herein by reference.
|
|
|
10.2
|
First Amendment to Second Amended and Restated Credit Agreement, dated March 12, 2010, by and among Hecla Alaska LLC, Hecla Greens Creek Mining Company and Hecla Juneau Mining Company, as Borrowers, and Hecla Mining Company, as Parent, and The Bank of Nova Scotia and ING Capital LLC, as Lenders. Filed as exhibit 10.1 to Registrant’s Current Report on Form 8-K filed on March 18, 2010 (File No. 1-8491), and incorporated herein by reference.
|
|
|
10.3
|
Employment Agreement dated January 29, 2010, between Hecla Mining Company and David C. Sienko, in the form of the Employment Agreement incorporated by reference herein to exhibit 10.1 to the Company’s Quarterly Report on Form 10-Q for the quarter ended June 30, 2007. (1)
|
|
|
10.4
|
Indemnification Agreement dated January 29, 2010, between Hecla Mining Company and David C. Sienko in the form of the Indemnification Agreement incorporated by reference herein to exhibit 10.7 to the Company’s Quarterly Report on Form 10-Q for the quarter ended September 30, 2006. (1)
|
|
|
31.1
|
Certification pursuant to Section 302 of the Sarbanes-Oxley Act of 2002. *
|
|
|
31.2
|
Certification pursuant to Section 302 of the Sarbanes-Oxley Act of 2002. *
|
|
|
32.1
|
Certification pursuant to Section 906 of the Sarbanes-Oxley Act of 2002. *
|
|
|
32.2
|
Certification pursuant to Section 906 of the Sarbanes-Oxley Act of 2002. *
|
___________________
* Filed herewith.
(1) Indicates a management contract or compensatory plan or arrangement.
- 41 -