Attached files
| file | filename |
|---|---|
| 8-K - CURRENT REPORT OF MATERIAL EVENTS OR CORPORATE CHANGES - COMERICA INC /NEW/ | a10-8517_18k.htm |
| EX-99.2 - EX-99.2 - COMERICA INC /NEW/ | a10-8517_1ex99d2.htm |
Exhibit 99.1
|
|
Comerica Bank Tower Dallas, Texas April 27, 2010 Comerica Incorporated Annual Meeting of Shareholders |
|
|
Call to Order 2010 Annual Meeting of Shareholders |
|
|
Opening Remarks and Introductions 2010 Annual Meeting of Shareholders |
|
|
Proposal I Election of Three Class II Directors 2010 Annual Meeting of Shareholders |
|
|
Proposal II Ratification of the Appointment of Ernst & Young LLP as Independent Auditors 2010 Annual Meeting of Shareholders |
|
|
Proposal III Approval of a Non-Binding, Advisory Proposal Approving Executive Compensation 2010 Annual Meeting of Shareholders |
|
|
Proposal IV Approval of the Comerica Incorporated 2006 Amended and Restated Long-Term Incentive Plan, as Further Amended 2010 Annual Meeting of Shareholders |
|
|
Proposal V Approval of Amendments to the Certificate of Incorporation to Eliminate the Classified Structure of the Board of Directors 2010 Annual Meeting of Shareholders |
|
|
Proposal VI Shareholder Proposal - Requesting That the Board of Directors Take Steps to Eliminate Shareholder Supermajority Voting Provisions 2010 Annual Meeting of Shareholders |
|
|
Proposal VII Shareholder Proposal - Requesting That the Board of Directors Adopt a Policy to Consider Seeking Recoupment of Executive Compensation Awards 2010 Annual Meeting of Shareholders |
|
|
Proposal VIII Shareholder Proposal - Requesting That the Board of Directors’ Executive Compensation Committee Adopt a Pay for Superior Performance Principle 2010 Annual Meeting of Shareholders |
|
|
Polls Open for Voting 2010 Annual Meeting of Shareholders |
|
|
Polls Closed 2010 Annual Meeting of Shareholders |
|
|
Voting Results 2010 Annual Meeting of Shareholders |
|
|
Adjournment 2010 Annual Meeting of Shareholders |
|
|
Safe Harbor Statement Any statements in these materials that are not historical facts are forward-looking statements as defined in the Private Securities Litigation Reform Act of 1995. Words such as "anticipates," "believes," "feels," "expects," "estimates," "seeks," "strives," "plans," "intends," "outlook," "forecast," "position," "target," "mission," "assume," "achievable," "potential," "strategy," "goal," "aspiration," "outcome," "continue," "remain," "maintain," "trend," "objective" and variations of such words and similar expressions, or future or conditional verbs such as "will," "would," "should," "could," "might," "can," "may" or similar expressions, as they relate to Comerica or its management, are intended to identify forward-looking statements. These forward-looking statements are predicated on the beliefs and assumptions of Comerica’s management based on information known to Comerica’s management as of the date of these materials and do not purport to speak as of any other date. Forward-looking statements may include descriptions of plans and objectives of Comerica’s management for future or past operations, products or services, and forecasts of Comerica’s revenue, earnings or other measures of economic performance, including statements of profitability, business segments and subsidiaries, estimates of credit trends and global stability. Such statements reflect the view of Comerica’s management as of this date with respect to future events and are subject to risks and uncertainties. Should one or more of these risks materialize or should underlying beliefs or assumptions prove incorrect, Comerica’s actual results could differ materially from those discussed. Factors that could cause or contribute to such differences are further economic downturns, changes in the pace of an economic recovery and related changes in employment levels, changes in real estate values, fuel prices, energy costs or other events that could affect customer income levels or general economic conditions, changes related to the headquarters relocation or to its underlying assumptions, the effects of recently enacted legislation, actions taken by or proposed by the U.S. Department of Treasury, the Board of Governors of the Federal Reserve System, the Texas Department of Banking and the Federal Deposit Insurance Corporation, legislation enacted in the future, and the impact and expiration of such legislation and regulatory actions, the effects of war and other armed conflicts or acts of terrorism, the effects of natural disasters including, but not limited to, hurricanes, tornadoes, earthquakes, fires, droughts and floods, the disruption of private or public utilities, the implementation of Comerica’s strategies and business models, management’s ability to maintain and expand customer relationships, changes in customer borrowing, repayment, investment and deposit practices, management’s ability to retain key officers and employees, changes in the accounting treatment of any particular item, the impact of regulatory examinations, declines or other changes in the businesses or industries in which Comerica has a concentration of loans, including, but not limited to, the automotive production industry and the real estate business lines, the anticipated performance of any new banking centers, the entry of new competitors in Comerica’s markets, changes in the level of fee income, changes in applicable laws and regulations, including those concerning taxes, banking, securities and insurance, changes in trade, monetary and fiscal policies, including the interest rate policies of the Board of Governors of the Federal Reserve System, fluctuations in inflation or interest rates, changes in general economic, political or industry conditions and related credit and market conditions, the interdependence of financial service companies and adverse conditions in the stock market. Comerica cautions that the foregoing list of factors is not exclusive. For discussion of factors that may cause actual results to differ from expectations, please refer to our filings with the Securities and Exchange Commission. In particular, please refer to “Item 1A. Risk Factors” beginning on page 11 of Comerica’s Annual Report on Form 10-K for the year ended December 31, 2009. Forward-looking statements speak only as of the date they are made. Comerica does not undertake to update forward-looking statements to reflect facts, circumstances, assumptions or events that occur after the date the forward-looking statements are made. For any forward-looking statements made in these materials or in any documents, Comerica claims the protection of the safe harbor for forward-looking statements contained in the Private Securities Litigation Reform Act of 1995. 2010 Annual Meeting of Shareholders |
|
|
Chairman and Chief Executive Officer’s Presentation 2010 Annual Meeting of Shareholders |
|
|
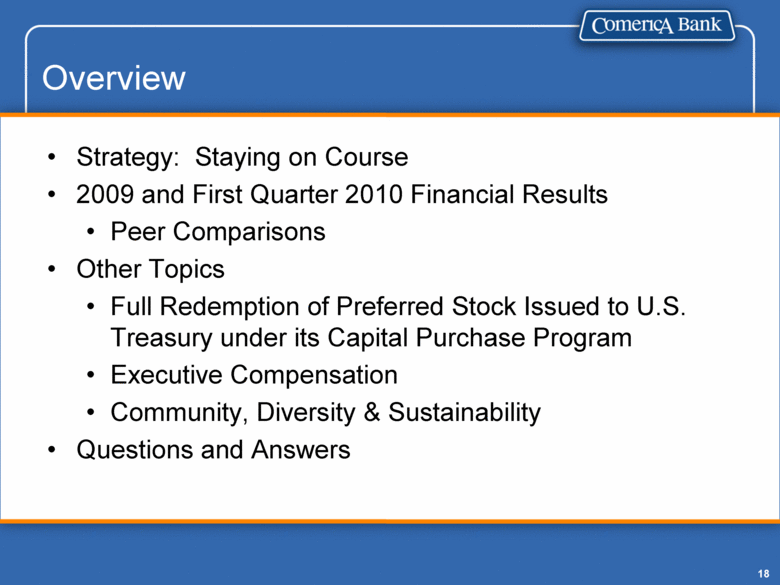
Strategy: Staying on Course 2009 and First Quarter 2010 Financial Results Peer Comparisons Other Topics Full Redemption of Preferred Stock Issued to U.S. Treasury under its Capital Purchase Program Executive Compensation Community, Diversity & Sustainability Questions and Answers Overview |
|
|
Consistent Strategy Built on Skill |
|
|
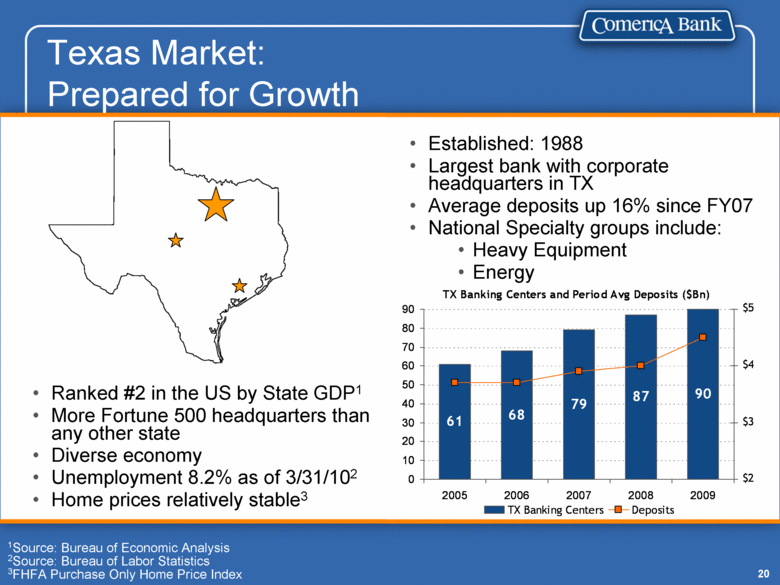
Established: 1988 Largest bank with corporate headquarters in TX Average deposits up 16% since FY07 National Specialty groups include: Heavy Equipment Energy Ranked #2 in the US by State GDP1 More Fortune 500 headquarters than any other state Diverse economy Unemployment 8.2% as of 3/31/102 Home prices relatively stable3 1Source: Bureau of Economic Analysis 2Source: Bureau of Labor Statistics 3FHFA Purchase Only Home Price Index Texas Market: Prepared for Growth TX Banking Centers and Period Avg Deposits ($Bn) 61 68 79 87 90 0 10 20 30 40 50 60 70 80 90 2005 2006 2007 2008 2009 $2 $3 $4 $5 TX Banking Centers Deposits |
|
|
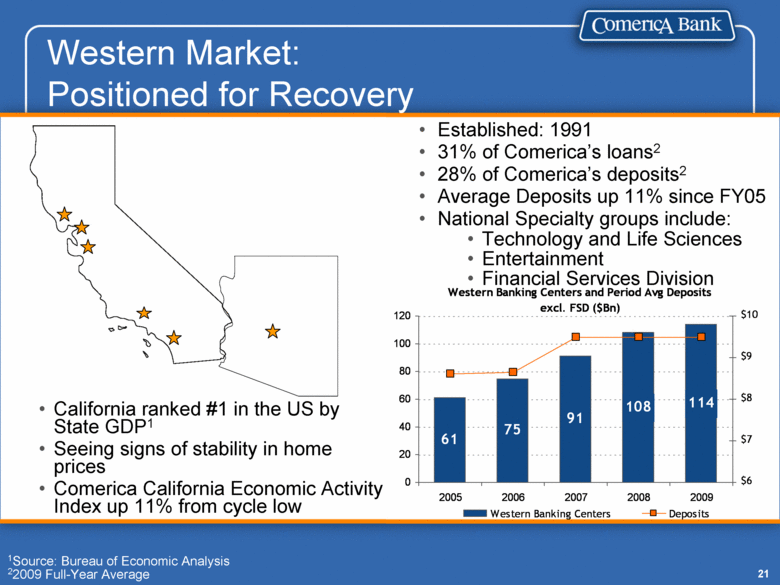
California ranked #1 in the US by State GDP1 Seeing signs of stability in home prices Comerica California Economic Activity Index up 11% from cycle low Established: 1991 31% of Comerica’s loans2 28% of Comerica’s deposits2 Average Deposits up 11% since FY05 National Specialty groups include: Technology and Life Sciences Entertainment Financial Services Division 1Source: Bureau of Economic Analysis 22009 Full-Year Average Western Market: Positioned for Recovery Western Banking Centers and Period Avg Deposits excl. FSD ($Bn) 61 75 91 108 114 0 20 40 60 80 100 120 2005 2006 2007 2008 2009 $6 $7 $8 $9 $10 Western Banking Centers Deposits |
|
|
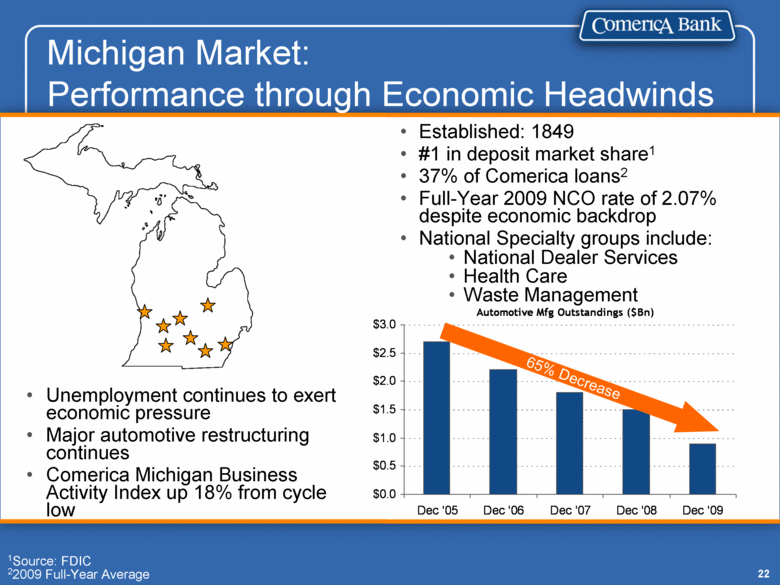
Established: 1849 #1 in deposit market share1 37% of Comerica loans2 Full-Year 2009 NCO rate of 2.07% despite economic backdrop National Specialty groups include: National Dealer Services Health Care Waste Management Unemployment continues to exert economic pressure Major automotive restructuring continues Comerica Michigan Business Activity Index up 18% from cycle low 1Source: FDIC 22009 Full-Year Average 65% Decrease Michigan Market: Performance through Economic Headwinds Automotive Mfg Outstandings ($Bn) $0.0 $0.5 $1.0 $1.5 $2.0 $2.5 $3.0 Dec '05 Dec '06 Dec '07 Dec '08 Dec '09 |
|
|
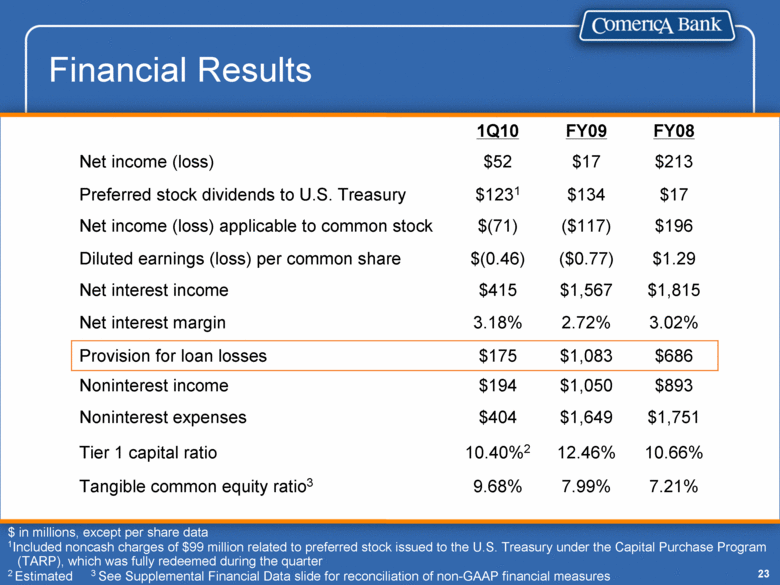
Financial Results 7.99% 12.46% $1,649 $1,050 $1,083 2.72% $1,567 ($0.77) ($117) $134 $17 FY09 7.21% 10.66% $1,751 $893 $686 3.02% $1,815 $1.29 $196 $17 $213 FY08 10.40%2 Tier 1 capital ratio $(71) Net income (loss) applicable to common stock $1231 Preferred stock dividends to U.S. Treasury $404 Noninterest expenses 9.68% Tangible common equity ratio3 $194 Noninterest income $175 Provision for loan losses 3.18% Net interest margin $415 Net interest income $(0.46) Diluted earnings (loss) per common share $52 Net income (loss) 1Q10 $ in millions, except per share data 1Included noncash charges of $99 million related to preferred stock issued to the U.S. Treasury under the Capital Purchase Program (TARP), which was fully redeemed during the quarter 2 Estimated 3 See Supplemental Financial Data slide for reconciliation of non-GAAP financial measures |
|
|
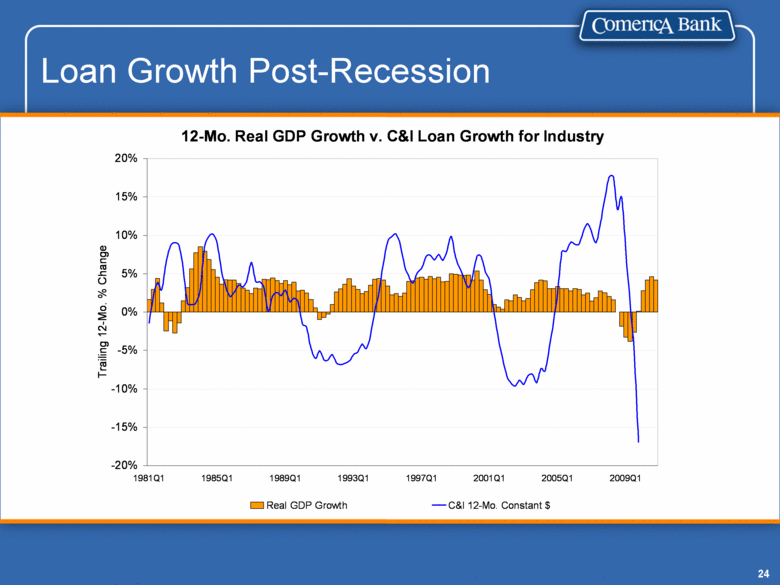
Loan Growth Post-Recession 12-Mo. Real GDP Growth v. C&I Loan Growth for Industry -20% -15% -10% -5% 0% 5% 10% 15% 20% 1981Q1 1985Q1 1989Q1 1993Q1 1997Q1 2001Q1 2005Q1 2009Q1 Trailing 12-Mo. % Change Real GDP Growth C&I 12-Mo. Constant $ |
|
|
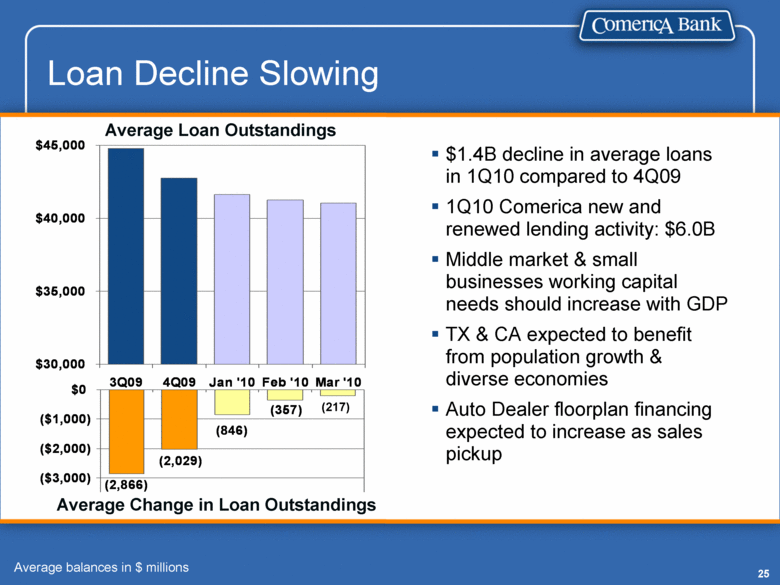
Loan Decline Slowing Average Loan Outstandings Average Change in Loan Outstandings (217) $1.4B decline in average loans in 1Q10 compared to 4Q09 1Q10 Comerica new and renewed lending activity: $6.0B Middle market & small businesses working capital needs should increase with GDP TX & CA expected to benefit from population growth & diverse economies Auto Dealer floorplan financing expected to increase as sales pickup Average balances in $ millions $30,000 $35,000 $40,000 $45,000 3Q09 4Q09 Jan '10 Feb '10 Mar '10 (2,866) (2,029) (846) (357) ($3,000) ($2,000) ($1,000) $0 |
|
|
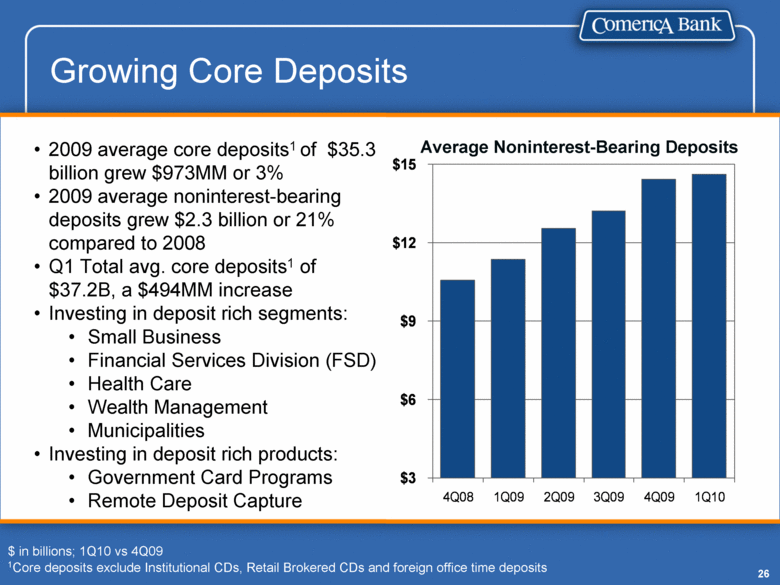
Growing Core Deposits Average Noninterest-Bearing Deposits $ in billions; 1Q10 vs 4Q09 1Core deposits exclude Institutional CDs, Retail Brokered CDs and foreign office time deposits 2009 average core deposits1 of $35.3 billion grew $973MM or 3% 2009 average noninterest-bearing deposits grew $2.3 billion or 21% compared to 2008 Q1 Total avg. core deposits1 of $37.2B, a $494MM increase Investing in deposit rich segments: Small Business Financial Services Division (FSD) Health Care Wealth Management Municipalities Investing in deposit rich products: Government Card Programs Remote Deposit Capture $3 $6 $9 $12 $15 4Q08 1Q09 2Q09 3Q09 4Q09 1Q10 |
|
|
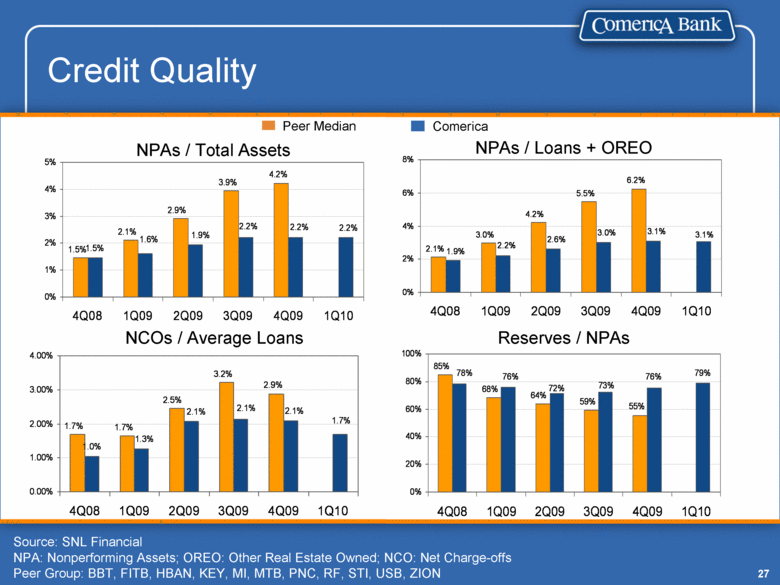
Credit Quality Source: SNL Financial NPA: Nonperforming Assets; OREO: Other Real Estate Owned; NCO: Net Charge-offs Peer Group: BBT, FITB, HBAN, KEY, MI, MTB, PNC, RF, STI, USB, ZION NCOs / Average Loans Reserves / NPAs NPAs / Total Assets NPAs / Loans + OREO Comerica Peer Median 1.0% 1.7% 1.7% 2.5% 3.2% 2.9% 1.3% 1.7% 2.1% 2.1% 2.1% 0.00% 1.00% 2.00% 3.00% 4.00% 4Q08 1Q09 2Q09 3Q09 4Q09 1Q10 79% 55% 59% 64% 68% 85% 72% 76% 73% 76% 78% 0% 20% 40% 60% 80% 100% 4Q08 1Q09 2Q09 3Q09 4Q09 1Q10 1.5% 4.2% 3.9% 2.9% 2.1% 1.5% 1.6% 2.2% 1.9% 2.2% 2.2% 0% 1% 2% 3% 4% 5% 4Q08 1Q09 2Q09 3Q09 4Q09 1Q10 6.2% 5.5% 4.2% 3.0% 2.1% 1.9% 2.2% 2.6% 3.0% 3.1% 3.1% 0% 2% 4% 6% 8% 4Q08 1Q09 2Q09 3Q09 4Q09 1Q10 |
|
|
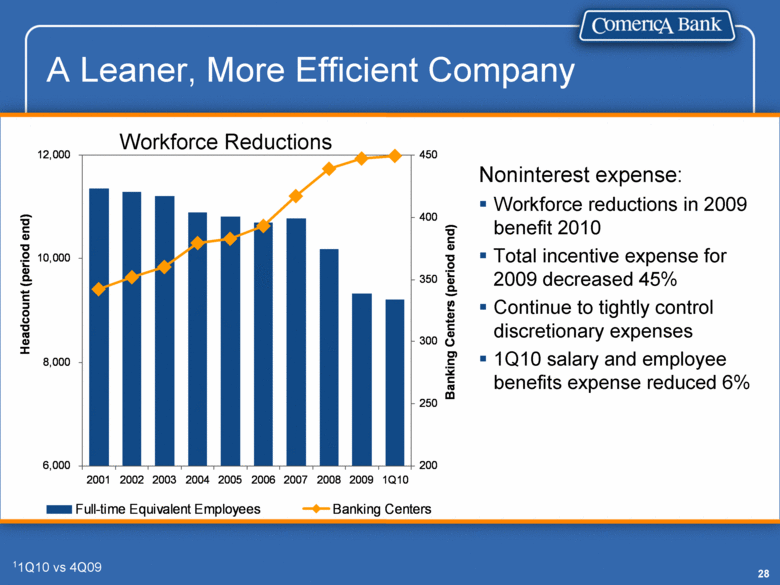
A Leaner, More Efficient Company Workforce Reductions 11Q10 vs 4Q09 Noninterest expense: Workforce reductions in 2009 benefit 2010 Total incentive expense for 2009 decreased 45% Continue to tightly control discretionary expenses 1Q10 salary and employee benefits expense reduced 6% 6,000 8,000 10,000 12,000 2001 2002 2003 2004 2005 2006 2007 2008 2009 1Q10 Headcount (period end) 200 250 300 350 400 450 Banking Centers (period end) Full-time Equivalent Employees Banking Centers |
|
|
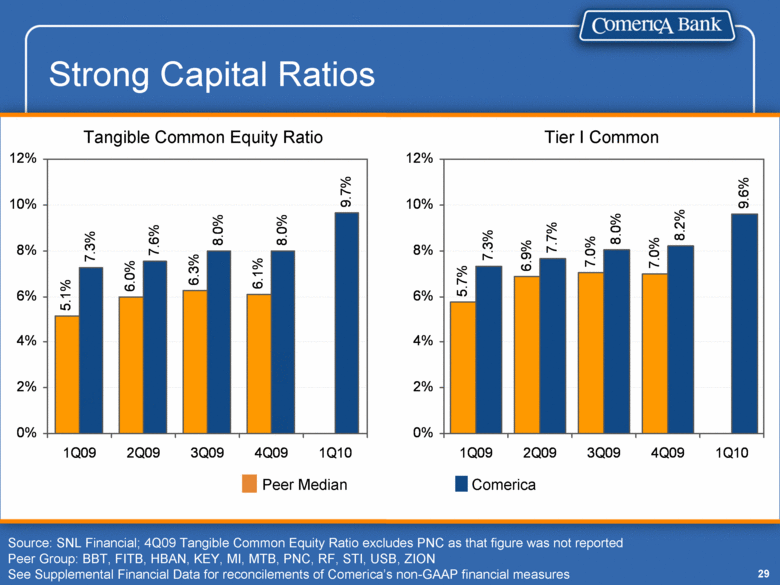
Strong Capital Ratios Source: SNL Financial; 4Q09 Tangible Common Equity Ratio excludes PNC as that figure was not reported Peer Group: BBT, FITB, HBAN, KEY, MI, MTB, PNC, RF, STI, USB, ZION See Supplemental Financial Data for reconcilements of Comerica’s non-GAAP financial measures Tier I Common Tangible Common Equity Ratio Peer Median Comerica 7.3% 7.7% 8.0% 8.2% 9.6% 7.0% 7.0% 6.9% 5.7% 0% 2% 4% 6% 8% 10% 12% 1Q09 2Q09 3Q09 4Q09 1Q10 7.3% 7.6% 8.0% 8.0% 9.7% 6.1% 6.3% 6.0% 5.1% 0% 2% 4% 6% 8% 10% 12% 1Q09 2Q09 3Q09 4Q09 1Q10 |
|
|
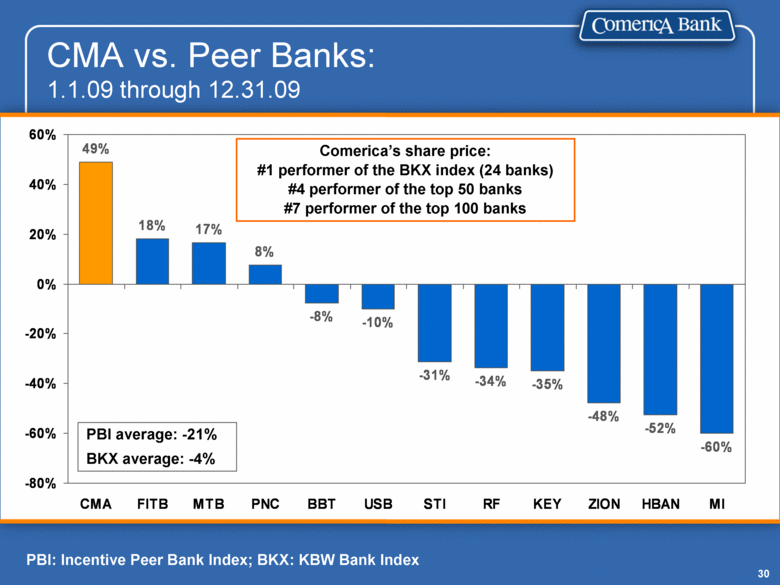
PBI average: -21% BKX average: -4% PBI: Incentive Peer Bank Index; BKX: KBW Bank Index CMA vs. Peer Banks: 1.1.09 through 12.31.09 Comerica’s share price: #1 performer of the BKX index (24 banks) #4 performer of the top 50 banks #7 performer of the top 100 banks 49% 18% 17% 8% -8% -10% -31% -34% -35% -48% -52% -60% -80% -60% -40% -20% 0% 20% 40% 60% CMA FITB MTB PNC BBT USB STI RF KEY ZION HBAN MI |
|
|
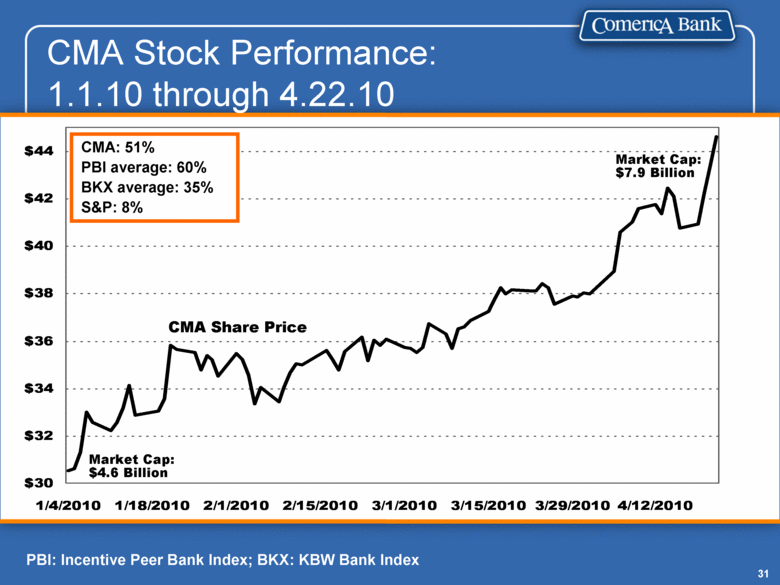
CMA Share Price Market Cap: $4.6 Billion Market Cap: $7.9 Billion CMA: 51% PBI average: 60% BKX average: 35% S&P: 8% CMA Stock Performance: 1.1.10 through 4.22.10 PBI: Incentive Peer Bank Index; BKX: KBW Bank Index $30 $32 $34 $36 $38 $40 $42 $44 1/4/2010 1/18/2010 2/1/2010 2/15/2010 3/1/2010 3/15/2010 3/29/2010 4/12/2010 |
|
|
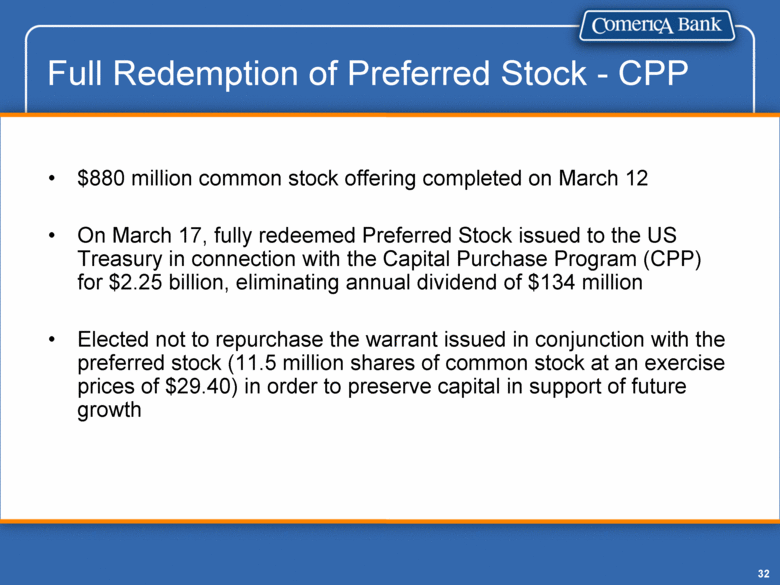
$880 million common stock offering completed on March 12 On March 17, fully redeemed Preferred Stock issued to the US Treasury in connection with the Capital Purchase Program (CPP) for $2.25 billion, eliminating annual dividend of $134 million Elected not to repurchase the warrant issued in conjunction with the preferred stock (11.5 million shares of common stock at an exercise prices of $29.40) in order to preserve capital in support of future growth Full Redemption of Preferred Stock - CPP |
|
|
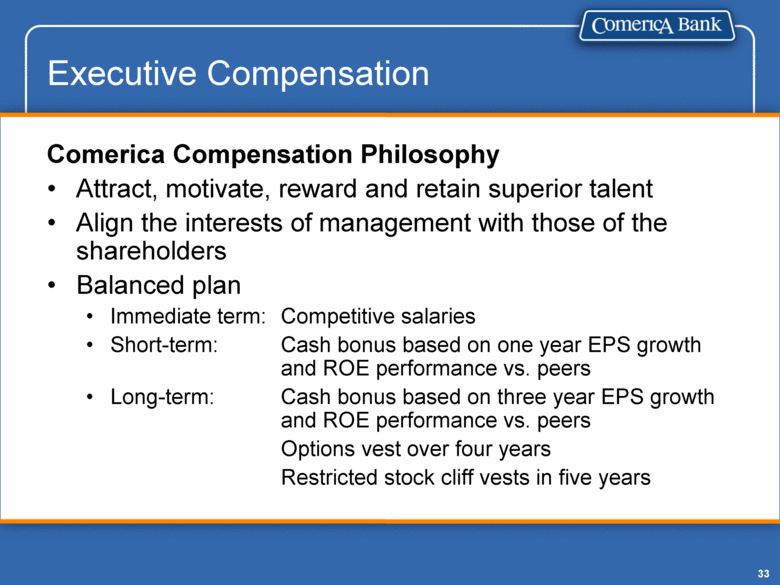
Executive Compensation Comerica Compensation Philosophy Attract, motivate, reward and retain superior talent Align the interests of management with those of the shareholders Balanced plan Immediate term: Competitive salaries Short-term: Cash bonus based on one year EPS growth and ROE performance vs. peers Long-term: Cash bonus based on three year EPS growth and ROE performance vs. peers Options vest over four years Restricted stock cliff vests in five years |
|
|
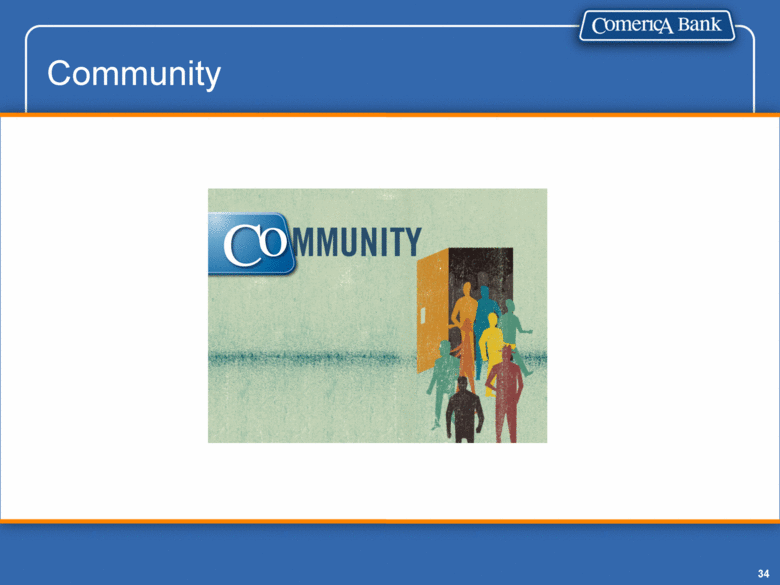
Community |
|
|
Diversity |
|
|
Sustainability |
|
|
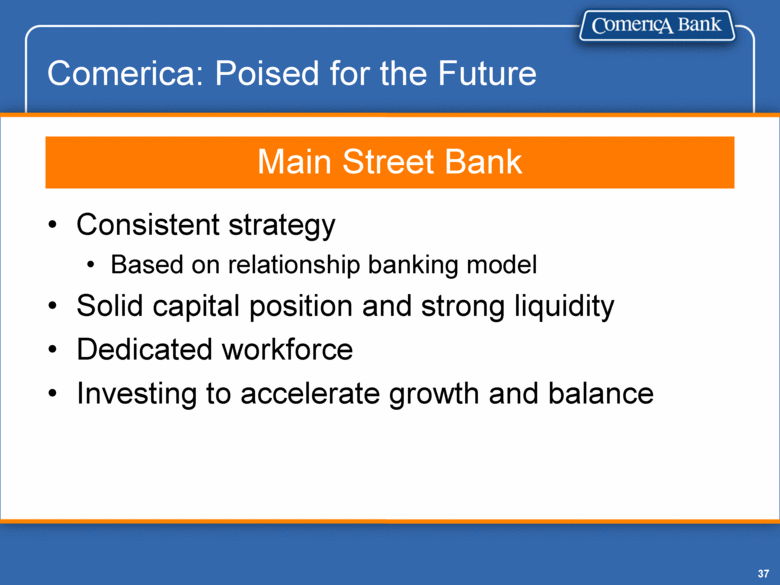
Comerica: Poised for the Future Consistent strategy Based on relationship banking model Solid capital position and strong liquidity Dedicated workforce Investing to accelerate growth and balance Main Street Bank |
|
|
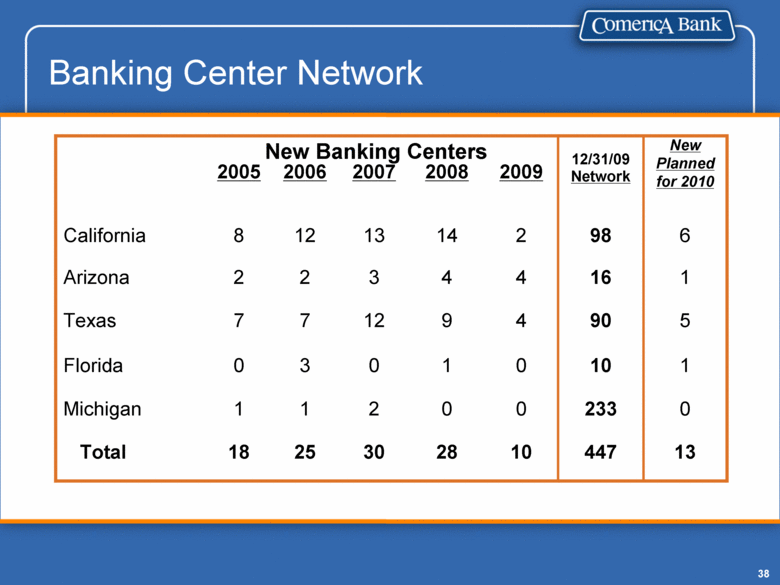
447 233 10 90 16 98 12/31/09 Network 13 0 1 5 1 6 New Planned for 2010 10 0 0 4 4 2 2009 30 2 0 12 3 13 2007 28 0 1 9 4 14 2008 2006 2005 18 1 0 7 2 8 2 Arizona 25 Total 1 Michigan 3 Florida 7 Texas 12 California Banking Center Network New Banking Centers |
|
|
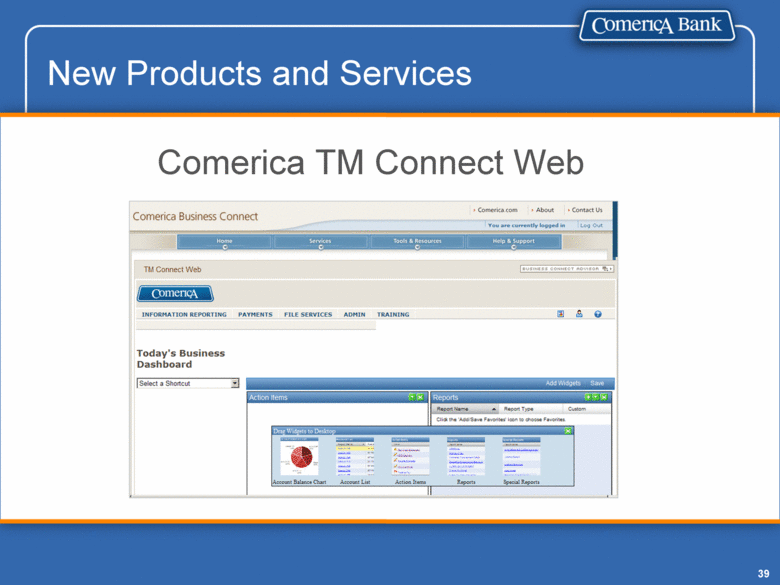
New Products and Services Comerica TM Connect Web |
|
|
New Products and Services Mobile Banking |
|
|
The Way Forward The way forward is paved by the careful, yet confident manner in which we have navigated the most challenging economic environment in modern history. We believe we are well positioned for growth and the economic recovery ahead. |
|
|
Questions and Answers |
|
|
[LOGO] |
|
|
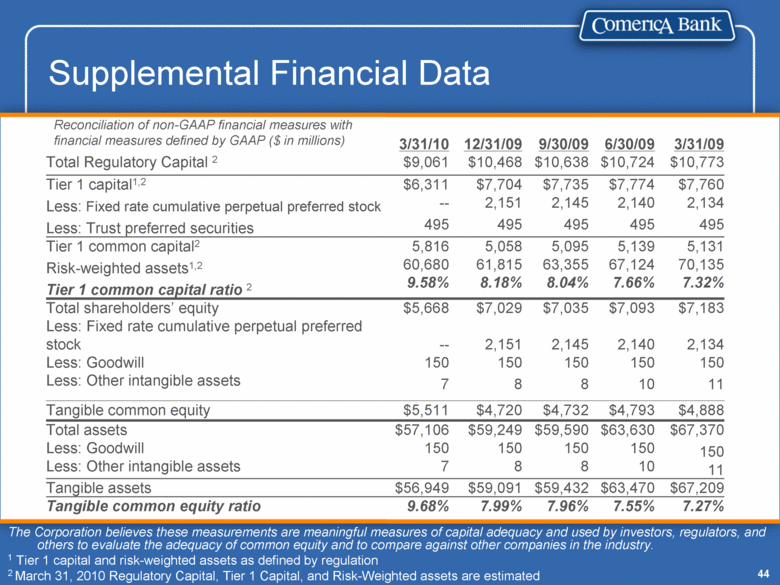
Supplemental Financial Data The Corporation believes these measurements are meaningful measures of capital adequacy and used by investors, regulators, and others to evaluate the adequacy of common equity and to compare against other companies in the industry. 1 Tier 1 capital and risk-weighted assets as defined by regulation 2 March 31, 2010 Regulatory Capital, Tier 1 Capital, and Risk-Weighted assets are estimated 9.68% $56,949 $57,106 150 7 $5,511 $5,668 -- 150 7 5,816 60,680 9.58% $6,311 -- 495 $9,061 3/31/10 7.99% $59,091 $59,249 150 8 $4,720 $7,029 2,151 150 8 5,058 61,815 8.18% $7,704 2,151 495 $10,468 12/31/09 $10,773 $10,724 $10,638 Total Regulatory Capital 2 7.96% $59,432 $59,590 150 8 $4,732 $7,035 2,145 150 8 5,095 63,355 8.04% $7,735 2,145 495 9/30/09 7.55% $63,470 $63,630 150 10 $4,793 $7,093 2,140 150 10 5,139 67,124 7.66% $7,774 2,140 495 6/30/09 7.27% $67,209 $67,370 150 11 $4,888 $7,183 2,134 150 11 5,131 70,135 7.32% $7,760 2,134 495 3/31/09 Total shareholders’ equity Less: Fixed rate cumulative perpetual preferred stock Less: Goodwill Less: Other intangible assets Reconciliation of non-GAAP financial measures with financial measures defined by GAAP ($ in millions) Tangible common equity ratio Total assets Less: Goodwill Less: Other intangible assets Tangible common equity Tier 1 capital1,2 Less: Fixed rate cumulative perpetual preferred stock Less: Trust preferred securities Tangible assets Tier 1 common capital2 Risk-weighted assets1,2 Tier 1 common capital ratio 2 |

