Attached files
| file | filename |
|---|---|
| 8-K - Ally Financial Inc. | v182000_8k.htm |
 Contact GMAC Investor Relations at (866) 710-4623 or investor.relations@gmacfs.com
Annual
Shareholders’
Meeting
 Forward-Looking Statements
In the presentation that follows and related comments by GMAC Inc. (“GMAC”) management, the use of the words “expect,” “anticipate,”
Forward-Looking Statements
In the presentation that follows and related comments by GMAC Inc. (“GMAC”) management, the use of the words “expect,” “anticipate,”
“estimate,” “forecast,”
“initiative,” “objective,” “plan,” “goal,” “project,” “outlook,” “priorities,” “target,” “explore,” “positions,”
“intend,” “evaluate,”
“pursue,” “seek,” “may,” “would,” “could,” “should,” “believe,” “potential,” “continue,” or similar expressions is intended
to identify forward-
looking statements. All statements herein and in related management comments, other than statements of historical fact, including without
limitation, statements about future events and financial performance, are forward-looking statements
that involve certain risks and
uncertainties. While these statements represent our current judgment on what the future may hold, and we believe these judgments are
reasonable, these statements are not guarantees of any events or financial results, and
GMAC’s actual results may differ materially due to
numerous important factors that are described in the most recent reports on SEC Forms 10-K and 10-Q for GMAC, each of which may be
revised or supplemented in subsequent reports on SEC Forms 10-Q
and 8-K. Such factors include, among others, the following: uncertainty of
GMAC's ability to enter into transactions or execute strategic alternatives to realize the value of its Residential Capital, LLC (“ResCap”)
operations; our inability
to repay our outstanding obligations to the U.S. Department of the Treasury, or to do so in a timely fashion and without
disruption to our business; our inability to successfully accommodate the additional risk exposure relating to providing wholesale and
retail
financing to Chrysler dealers and customers and the resulting impact to our financial stability; uncertainty related to Chrysler’s and GM’s recent
exits from bankruptcy; uncertainty related to the new financing arrangement between GMAC
and Chrysler; securing low cost funding for
GMAC and ResCap and maintaining the mutually beneficial relationship between GMAC and GM, and GMAC and Chrysler; our ability to
maintain an appropriate level of debt and capital; the profitability and financial
condition of GM and Chrysler; our ability to realize the
anticipated benefits associated with our recent conversion to a bank holding company, and the increased regulation and restrictions that we
are now subject to; continued challenges in the residential
mortgage and capital markets; the potential for deterioration in the residual value of
off-lease vehicles; the continuing negative impact on ResCap of the decline in the U.S. housing market; changes in U.S. government-
sponsored mortgage programs or
disruptions in the markets in which our mortgage subsidiaries operate; disruptions in the market in which we
fund GMAC’s and ResCap’s operations, with resulting negative impact on our liquidity; changes in our accounting assumptions that may
require
or that result from changes in the accounting rules or their application, which could result in an impact on earnings; changes in the
credit ratings of ResCap, GMAC, Chrysler or GM; changes in economic conditions, currency exchange rates or political stability
in the markets
in which we operate; and changes in the existing or the adoption of new laws, regulations, policies or other activities of governments, agencies
and similar organizations. Investors are cautioned not to place undue reliance
on forward-looking statements. GMAC undertakes no obligation
to update publicly or otherwise revise any forward-looking statements except where expressly required by law. A reconciliation of certain non-
GAAP financial measures included within this presentation
is provided in the supplemental charts.
Use of the term “loans” describes products associated with direct and indirect lending activities of GMAC’s global operations. The specific
products include retail installment sales
contracts, loans, lines of credit, leases or other financing products. The term “originate” refers to
GMAC’s purchase, acquisition or direct origination of various “loan” products.
2
 Transformational Year
In 2009, GMAC made significant progress transforming the Company and
Transformational Year
In 2009, GMAC made significant progress transforming the Company and
positioning itself for improved results going forward:
Auto Finance Franchise: Regained market share, added a new OEM relationship, achieved
profitability in each quarter of 2009 and began an orderly
disposition of non-core operations
Capital: Executing Bank Holding Company strategy and improved capital position through
investments made by the U.S. Treasury
Ally Bank: Introduced Ally brand and funded the majority of new originations at the bank
Liquidity: Grew deposits by $11 billion, issued $7.4 billion of TLGP parent company debt and
issued $1.8 billion of term asset backed securitizations
Legacy Mortgage: Implemented critical steps to de-risk legacy mortgage exposure and limit
further negative earnings impact
The transformation has continued into 2010: New auto franchise relationships announced,
agreement reached to sell European mortgage platform, improved corporate debt ratings and re-
entered unsecured debt markets with over $5 billion of issuances
3
 Core pre-tax earnings(1) remained weak in 2009 but improved from 2008 levels
Weak economic conditions (high unemployment and declining home prices)
High levels of credit losses and continued reserve build in auto, mortgage and commercial
Core pre-tax earnings(1) remained weak in 2009 but improved from 2008 levels
Weak economic conditions (high unemployment and declining home prices)
High levels of credit losses and continued reserve build in auto, mortgage and commercial
finance portfolios
Strategic mortgage actions (revaluation of certain higher risk mortgage loans)
Increased mortgage repurchase liability reserves
Goodwill Impairment
Immaterial impact from GM bankruptcy
Full Year 2009 Financial Results
(1) Core pre-tax earnings is defined as income from continuing operations before taxes, OID amortization and bond exchange gains.
Please refer to page 15 for more details.
(2) 2008 net income includes approximately $11.5 billion of bond exchange gains
($ millions)
2009
2008
Inc / (Dec)
Core pre-tax (loss) income
(1)
(6,795)
$
(8,084)
$
1,289
$
Net (loss) income
(2)
(10,298)
$
1,868
$
(12,166)
$
Total assets
172,306
$
189,476
$
(17,170)
$
Tier 1 capital ratio
14.1%
N/A
N/A
4
 2009 Full Year Results by Segment
Global Automotive Services profitability improved significantly in 2009; driven by
2009 Full Year Results by Segment
Global Automotive Services profitability improved significantly in 2009; driven by
improving results in North American Operations
Mortgage Operations results continued to be weak and were impacted by the
strategic actions taken in 4Q
Inc/(Dec) vs.
FY 2009
FY 2008
FY 2008
North American Automotive Finance
1,752
$
(207)
$
1,959
$
International Automotive Finance
(101)
141
(242)
Insurance
329
499
(170)
Global Automotive Services
1,980
433
1,547
Mortgage Operations
(7,301)
(4,008)
(3,293)
Corporate and Other
(1)
(2,617)
6,951
(9,568)
Pre-Tax (loss) income from continuing operations
(7,938)
3,376
(11,314)
Income tax benefit from continuing operations
78
(60)
138
Discontinued operations
(2,282)
(1,568)
(714)
Net income (loss)
(10,298)
$
1,868
$
(12,166)
$
(1) Corporate and Other includes Commercial Finance, equity investments, bond exchange gains, amortization of original issue discount
from GMAC bond exchanges and net impact from ALM activities
5
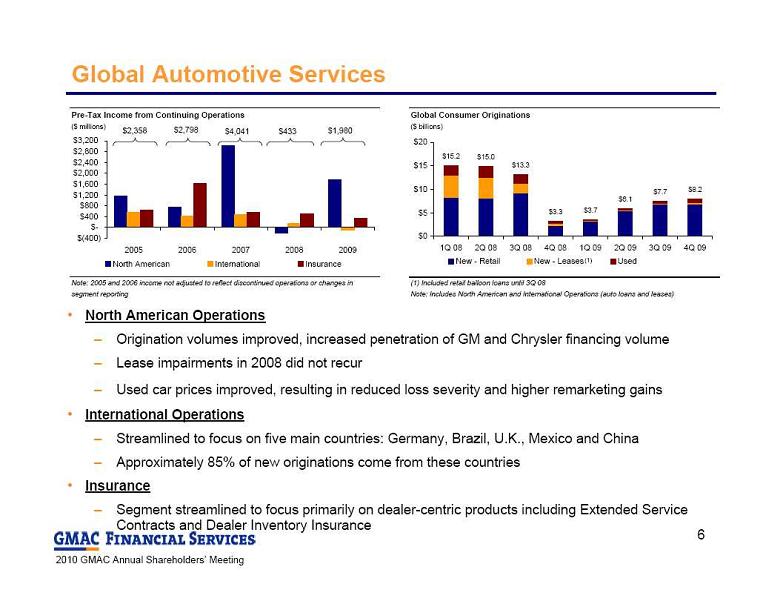 Global Automotive Services
North American Operations
Origination volumes improved, increased penetration of GM and Chrysler financing volume
Lease impairments in 2008 did not recur
Used car prices improved, resulting in reduced loss severity and higher remarketing gains
International Operations
Streamlined to focus on five main countries: Germany, Brazil, U.K., Mexico and China
Approximately 85% of new originations come from these countries
Insurance
Segment streamlined to focus primarily on dealer-centric products including Extended Service
Global Automotive Services
North American Operations
Origination volumes improved, increased penetration of GM and Chrysler financing volume
Lease impairments in 2008 did not recur
Used car prices improved, resulting in reduced loss severity and higher remarketing gains
International Operations
Streamlined to focus on five main countries: Germany, Brazil, U.K., Mexico and China
Approximately 85% of new originations come from these countries
Insurance
Segment streamlined to focus primarily on dealer-centric products including Extended Service
Contracts and Dealer Inventory Insurance
$433
$1,980
$2,358
$4,041
$2,798
(1)
Pre-Tax Income from Continuing Operations
($ millions)
Note: 2005 and 2006 income not adjusted to reflect discontinued operations or changes in
segment reporting
$(400)
$-
$400
$800
$1,200
$1,600
$2,000
$2,400
$2,800
$3,200
2005
2006
2007
2008
2009
North American
International
Insurance
#REF!
#REF!
#REF!
#REF!
#REF!
#REF!
#REF!
#REF!
#REF!
#REF!
#REF!
#REF!
#REF!
#REF!
#REF!
#REF!
#REF!
#REF!
#REF!
#REF!
#REF!
#REF!
Global Consumer Originations
($ billions)
(1) Included retail balloon loans until 3Q 08
Note: Includes North American and International Operations (auto loans and leases)
$15.2
$15.0
$13.3
$3.3
$3.7
$6.1
$7.7
$8.2
$0
$5
$10
$15
$20
1Q 08
2Q 08
3Q 08
4Q 08
1Q 09
2Q 09
3Q 09
4Q 09
New - Retail
New - Leases
Used
Total
6
 Delinquency trends in the core auto portfolio stabilized in the second half of 2009
Legacy subprime Nuvell portfolio significantly impacting delinquent balances
Ratios impacted by declining portfolio balances
Global Auto Finance: Consumer Delinquency Trends
Global Delinquencies - Managed
Retail Contract Amount
$ Amount of Contracts Greater than 30 Days Past Due (millions)
2.62%
2.80%
2.91%
2.66%
2.96%
2.54%
2.74%
3.31%
2.82%
3.27%
3.46%
3.48%
$0
$500
$1,000
$1,500
$2,000
$2,500
3Q 08
4Q 08
1Q 09
2Q 09
3Q 09
4Q 09
0.00%
0.50%
1.00%
1.50%
2.00%
2.50%
3.00%
3.50%
4.00%
4.50%
Nuvell Delinquent Contract $
Delinquent Contract $ (excluding Nuvell)
% of Retail Contract $ Outstanding
% of Retail Contract $ Outstanding (excluding Nuvell)
7
Delinquency trends in the core auto portfolio stabilized in the second half of 2009
Legacy subprime Nuvell portfolio significantly impacting delinquent balances
Ratios impacted by declining portfolio balances
Global Auto Finance: Consumer Delinquency Trends
Global Delinquencies - Managed
Retail Contract Amount
$ Amount of Contracts Greater than 30 Days Past Due (millions)
2.62%
2.80%
2.91%
2.66%
2.96%
2.54%
2.74%
3.31%
2.82%
3.27%
3.46%
3.48%
$0
$500
$1,000
$1,500
$2,000
$2,500
3Q 08
4Q 08
1Q 09
2Q 09
3Q 09
4Q 09
0.00%
0.50%
1.00%
1.50%
2.00%
2.50%
3.00%
3.50%
4.00%
4.50%
Nuvell Delinquent Contract $
Delinquent Contract $ (excluding Nuvell)
% of Retail Contract $ Outstanding
% of Retail Contract $ Outstanding (excluding Nuvell)
7
 Global Auto Finance: Consumer Loss Trends
Annualized credit losses were elevated in 2009 due to overall weak economic
Global Auto Finance: Consumer Loss Trends
Annualized credit losses were elevated in 2009 due to overall weak economic
conditions
Continued stress in subprime Nuvell portfolio
Loss severity improved in 2009 due to strong used car prices
Global Annualized Credit Losses - Managed Retail Contracts
($ millions)
(1) 3Q 09 elevated due to change in previously disclosed charge-off policy
1.80%
1.84%
1.56%
1.13%
1.04%
0.87%
2.39%
2.48%
1.35%
1.41%
1.57%
2.12%
2.43%
2.29%
3.29%
3.57%
$0
$100
$200
$300
$400
$500
1Q 08
2Q 08
3Q 08
4Q 08
1Q 09
2Q 09
3Q 09
4Q 09
0.00%
0.50%
1.00%
1.50%
2.00%
2.50%
3.00%
3.50%
4.00%
Nuvell Credit Losses
Credit Losses (excluding Nuvell)
% of Avg. Managed Assets
% of Avg. Managed Assets (excluding Nuvell)
(1)
8
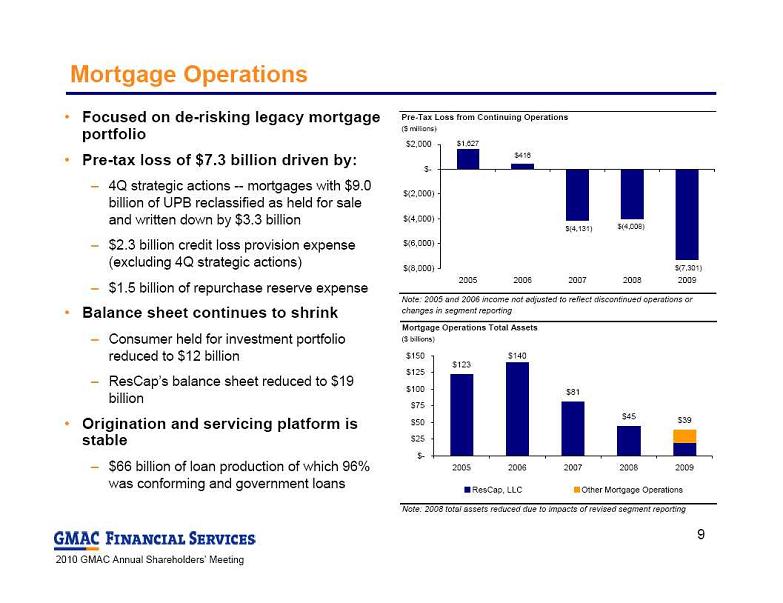 Mortgage Operations
Focused on de-risking legacy mortgage
Mortgage Operations
Focused on de-risking legacy mortgage
portfolio
Pre-tax loss of $7.3 billion driven by:
4Q strategic actions -- mortgages with $9.0
billion of UPB reclassified as held for sale
and written down by $3.3 billion
$2.3 billion credit loss provision expense
(excluding 4Q strategic actions)
$1.5 billion of repurchase reserve expense
Balance sheet continues to shrink
Consumer held for investment portfolio
reduced to $12 billion
ResCap’s balance sheet reduced to $19
billion
Origination and servicing platform is
stable
$66 billion of loan production of which 96%
was conforming and government loans
Pre-Tax Loss from Continuing Operations
($ millions)
Note: 2005 and 2006 income not adjusted to reflect discontinued operations or
changes in segment reporting
$1,627
$416
$(4,131)
$(7,301)
$(4,008)
$(8,000)
$(6,000)
$(4,000)
$(2,000)
$-
$2,000
2005
2006
2007
2008
2009
Mortgage Operations Total Assets
($ billions)
Note: 2008 total assets reduced due to impacts of revised segment reporting
$123
$140
$81
$45
$39
$-
$25
$50
$75
$100
$125
$150
2005
2006
2007
2008
2009
ResCap, LLC
Other Mortgage Operations
9
 In the 4th Quarter, GMAC took several strategic actions to address challenges in
the legacy mortgage business, which were designed to:
Minimize impact of future ResCap issues and position GMAC for improved financial performance
Accelerate access to the capital markets
Position GMAC to explore strategic alternatives for ResCap and the mortgage business
$ 9.0 billion of ResCap and Ally Bank assets transferred from held for investment
to held for sale and marked down to approximately 42% of UPB
Ally Bank loans were purchased by GMAC and subsequently contributed to
ResCap as a capital contribution
Mortgage Restructuring Actions
($ in billions)
Unpaid
Principal
Balance
Carry Value
as of
12/31/2009
4Q 09 Marks
% of Unpaid
Principal
Balance
Ally Bank Loans
(1)
3.5
1.4
(1.3)
41%
ResCap Domestic Loans
3.0
1.5
(0.7)
48%
ResCap International Assets
2.4
0.9
(1.3)
36%
Total Asset Valuation
9.0
$
3.8
$
(3.3)
$
42%
(1)
Includes certain mortgage loans with low FICO, high LTV, low/no documentation or unfavorable geographic concentration
Summary of Mortgage Related Marks
10
 Liquidity
GMAC’s liquidity profile has significantly improved over the past year
Building lower cost deposit base
Grew deposits by $11 billion in 2009
Parent company liquidity grew to
Liquidity
GMAC’s liquidity profile has significantly improved over the past year
Building lower cost deposit base
Grew deposits by $11 billion in 2009
Parent company liquidity grew to
$31.4 billion at 12/31/09
$8.9 billion in cash
$12.5 billion available based on
existing collateral
Improved access to capital
markets
Issued $7.4 billion of TLGP debt
Re-entered term ABS market under
programs sponsored by Ally bank
Issued over $5 billion of unsecured
debt in 2010 year to date
Received multi-notch upgrades
Deposits
($ billions)
$20.0
$31.1
$0.0
$5.0
$10.0
$15.0
$20.0
$25.0
$30.0
$35.0
$40.0
4Q 08
4Q 09
Ally Bank Retail
Ally Bank Brokered
Ally Bank Other
ResMor
Agency
Previous
Current
Outlook
Moody's
Ca
B3
Stable
S&P
CCC
B
Stable
Fitch
CC
B
Positive
DBRS
CCC
BB (low)
Stable
GMAC Inc. Unsecured Ratings
11
 Capital
Total capital base has improved despite absorbing losses while working through
Capital
Total capital base has improved despite absorbing losses while working through
legacy assets
Total Risk Based Capital Ratio of 15.5%
Balance sheet has been reduced by $120 billion since 2006
Sale and wind down of legacy mortgage assets
Divestiture of non-core assets/divisions
Continued focus on optimizing capital base and supporting core originations
(1) First time GMAC reported capital ratios
(2) Tier 1 Common Capital Ratio would have been 11.7% assuming full
conversion of Series F-2 MCP
($ billions)
12/31/2009
3/31/2009
Tier 1 Capital
22.4
$
20.5
$
Tier 1 Common Capital
7.7
$
14.3
$
Total Risk-Based Capital
24.6
$
23.4
$
Tangible Assets
171.8
$
179.6
$
Risk-Weighted Assets
158.4
$
194.4
$
Tier 1 Capital Ratio
14.1%
10.6%
Tier 1 Common Capital Ratio
4.8%
7.3%
Total Risk-Based Capital Ratio
15.5%
12.0%
(2)
(1)
GMAC Total Assets
$ Billions
$292
$249
$189
$172
$0
$50
$100
$150
$200
$250
$300
$350
2006
2007
2008
2009
12
 Conclusion
Objectives
Capitalize on opportunities in the auto finance business
Drive critical focus on profitability
Demonstrate improved access to the capital markets
Transition fully to bank holding company model
Expand use of deposits and other cost efficient funding at Ally Bank
Explore strategic alternatives to maximize value of mortgage operations and
Conclusion
Objectives
Capitalize on opportunities in the auto finance business
Drive critical focus on profitability
Demonstrate improved access to the capital markets
Transition fully to bank holding company model
Expand use of deposits and other cost efficient funding at Ally Bank
Explore strategic alternatives to maximize value of mortgage operations and
further limit risk
The progress made in 2009 positions GMAC to accelerate its return to profitability
and access to the capital markets, which will assist in timely repayment of U.S.
Treasury investments
13
 Supplemental Charts
14
 Core Earnings Walk
Supplemental
($ millions)
2009
2008
Inc / (Dec)
Total net revenue (less OID and bond exchange gains)
7,404
$
3,975
$
3,429
$
Provision for loan losses
6,043
3,410
2,633
Noninterest expense
8,156
8,649
(493)
Core pre-tax (loss) income
(6,795)
$
(8,084)
$
1,289
$
OID amortization
(1,143)
-
(1,143)
Bond exchange gains
-
11,460
(11,460)
Income tax expense / (benefit)
78
(60)
138
Loss from discontinued operations
(2,282)
(1,568)
(714)
Net (loss) income
(10,298)
$
1,868
$
(12,166)
$
Total assets
172,306
$
189,476
$
(17,170)
$
Tier 1 capital ratio
14.1%
N/A
N/A
15
Core Earnings Walk
Supplemental
($ millions)
2009
2008
Inc / (Dec)
Total net revenue (less OID and bond exchange gains)
7,404
$
3,975
$
3,429
$
Provision for loan losses
6,043
3,410
2,633
Noninterest expense
8,156
8,649
(493)
Core pre-tax (loss) income
(6,795)
$
(8,084)
$
1,289
$
OID amortization
(1,143)
-
(1,143)
Bond exchange gains
-
11,460
(11,460)
Income tax expense / (benefit)
78
(60)
138
Loss from discontinued operations
(2,282)
(1,568)
(714)
Net (loss) income
(10,298)
$
1,868
$
(12,166)
$
Total assets
172,306
$
189,476
$
(17,170)
$
Tier 1 capital ratio
14.1%
N/A
N/A
15
 Capital Measures as of 12/31/09
Supplemental
Capital
12/31/2009
3/31/2009
Shareholders’ Equity
20.8
$
22.0
$
Less:
Goodwill and certain other intangibles
(0.5)
(1.4)
Unrealized (gain) loss and other adjustments
(0.4)
(0.1)
Trust Preferred Securities
2.5
-
Total Tier 1 Capital
22.4
20.5
Total Tier 1 Capital
22.4
20.5
Less:
Senior preferred
(10.9)
(5.0)
Trust Preferred Securities
(2.5)
-
Preferred interest
(1.3)
(1.3)
Tier 1 Common
7.7
14.3
Total Tier 1 Capital
22.4
20.5
Add:
Qualifying subordinated debt and redeemable preferred stock
0.2
0.2
Allowance for loan and lease losses includible in Tier 2 Capital
2.0
2.6
Total Risk-Based Capital
24.6
23.4
Total Equity
20.8
22.0
Less:
Preferred equity
(12.2)
(6.3)
Goodwill and intangible assets
(0.5)
(1.4)
Tangible Common Equity
8.1
14.3
Total Assets
172.3
179.6
Less:
Goodwill and intangible assets
(0.5)
(1.4)
Tangible Assets
171.8
$
178.1
$
Note: Numbers may not foot due to rounding
($ billions)
16
Capital Measures as of 12/31/09
Supplemental
Capital
12/31/2009
3/31/2009
Shareholders’ Equity
20.8
$
22.0
$
Less:
Goodwill and certain other intangibles
(0.5)
(1.4)
Unrealized (gain) loss and other adjustments
(0.4)
(0.1)
Trust Preferred Securities
2.5
-
Total Tier 1 Capital
22.4
20.5
Total Tier 1 Capital
22.4
20.5
Less:
Senior preferred
(10.9)
(5.0)
Trust Preferred Securities
(2.5)
-
Preferred interest
(1.3)
(1.3)
Tier 1 Common
7.7
14.3
Total Tier 1 Capital
22.4
20.5
Add:
Qualifying subordinated debt and redeemable preferred stock
0.2
0.2
Allowance for loan and lease losses includible in Tier 2 Capital
2.0
2.6
Total Risk-Based Capital
24.6
23.4
Total Equity
20.8
22.0
Less:
Preferred equity
(12.2)
(6.3)
Goodwill and intangible assets
(0.5)
(1.4)
Tangible Common Equity
8.1
14.3
Total Assets
172.3
179.6
Less:
Goodwill and intangible assets
(0.5)
(1.4)
Tangible Assets
171.8
$
178.1
$
Note: Numbers may not foot due to rounding
($ billions)
16