Attached files
| file | filename |
|---|---|
| 8-K - FORM 8-K - Cooper-Standard Holdings Inc. | d8k.htm |
Exhibit 99.1
NON-GAAP FINANCIAL MEASURES
We use certain non-GAAP financial measures in this Exhibit 99.1, including EBITDA and Adjusted EBITDA, that are supplemental measures that are not required by, or presented in accordance with, generally accepted accounting principles in the United States (“GAAP”). EBITDA and Adjusted EBITDA are not measurements of our financial performance under GAAP and should not be considered as alternatives to net income, operating income or any other performance measures derived in accordance with GAAP or as a measure of our liquidity. Additionally, EBITDA and Adjusted EBITDA are not intended to be measures of free cash flow, as they do not consider certain cash requirements such as interest payments, tax payments and debt service requirements. In addition, our method of calculating EBITDA and Adjusted EBITDA may vary from the method used by other companies. We have used the method for calculating EBITDA and Adjusted EBITDA pursuant to the new debt. Although Adjusted EBITDA contains certain additional adjustments, our management considers Adjusted EBITDA to be a key indicator of financial performance. Adjusted EBITDA contains certain adjustments that do not comply with the SEC’s rules governing the use of non-GAAP financial measures.
In addition to EBITDA and Adjusted EBITDA being used for purposes of our debt arrangements, we believe EBITDA and Adjusted EBITDA are frequently used by securities analysts, investors and other interested parties in the evaluation of companies in our industry. In addition, we believe that investors, analysts and rating agencies consider EBITDA and Adjusted EBITDA useful means of measuring our ability to meet our debt service obligations and evaluating our financial performance, and management uses these measurements for one or more of these purposes. Our presentation of EBITDA and Adjusted EBITDA should not be construed as an inference that our future results will be unaffected by unusual or nonrecurring items. EBITDA and Adjusted EBITDA have important limitations as analytical tools and you should not consider them in isolation or as a substitute for analysis of our results as reported under GAAP. Because of these limitations, EBITDA and Adjusted EBITDA should not be considered as measures of discretionary cash available to us to service our indebtedness or invest in our business. We compensate for these limitations by relying primarily on our GAAP results and using EBITDA and Adjusted EBITDA only for supplemental purposes.
For the definition of and additional information about EBITDA and Adjusted EBITDA, a description of how EBITDA and Adjusted EBITDA are calculated from our net income and a reconciliation of EBITDA and Adjusted EBITDA to our net income, see note 4 to “Summary—Summary Historical and Pro Forma Financial Data” in this Exhibit 99.1.
1
FORWARD-LOOKING STATEMENTS
In addition to historical information, certain statements contained in this Exhibit 99.1 are forward-looking statements within the meaning of federal securities laws and we intend that such forward-looking statements be subject to the safe-harbor created thereby. These forward-looking statements include statements concerning our plans, objectives, goals, strategies, future events, future revenue or performance, capital expenditures, financing needs, plans or intentions relating to acquisitions, business trends, and other information that is not historical information. When used in this report, the words “estimates,” “expects,” “anticipates,” “projects,” “plans,” “intends,” “believes,” “forecasts,” or future or conditional verbs, such as “will,” “should,” “could,” or “may,” and variations of such words or similar expressions are intended to identify forward-looking statements. All forward-looking statements, including, without limitation, management’s examination of historical operating trends and data are based upon our current expectations and various assumptions. Our expectations, beliefs and projections are expressed in good faith and we believe there is a reasonable basis for them. However, no assurances can be made that these expectations, beliefs and projections will be achieved. Forward-looking statements are not guarantees of future performance and are subject to significant risks and uncertainties that may cause actual results or achievements to be materially different from the future results or achievements expressed or implied by the forward-looking statements.
There are a number of risks and uncertainties that could cause our actual results to differ materially from the forward-looking statements contained in this Exhibit 99.1. Important factors that could cause our actual results to differ materially from the forward-looking statements we make herein are described in our Annual Report on Form 10-K for the year ended December 31, 2009 and those described in filings made by us with the Bankruptcy Court.
Such risks and uncertainties and other important factors include, but are not limited to:
| • | our substantial leverage; |
| • | our ability to incur significant additional indebtedness; |
| • | limitations on operating our business as a result of covenant restrictions contained in our debt agreements; |
| • | our ability to satisfy our obligations under our indebtedness and new preferred stock; |
| • | our ability to satisfy our debt obligations if we elect to redeem the new preferred stock; |
| • | the possibility that we may be initially controlled by majority stockholders whose interests may conflict with other holders of our securities; |
| • | variations of our actual financial results to the projections filed with the Bankruptcy Court; |
| • | the lack of comparability of our financial condition and results of operations to those reflected in our historical financial statements; |
| • | our assumptions regarding the application of “fresh-start” accounting; |
| • | potential limitations on our ability to offset future U.S. taxable income with losses and credits incurred prior to our emergence from chapter 11 bankruptcy proceedings; |
2
| • | whether we will be subject to claims not discharged in the Bankruptcy Cases; |
| • | whether our future financial statements will contain disclosure about our ability to continue as a going concern; |
| • | uncertainty as to the effect of the Bankruptcy Cases on our operations going forward; |
| • | our dependence on the automotive industry; |
| • | our dependence on certain major customers; |
| • | viability of our supply base; |
| • | availability and cost of credit; |
| • | disruptions in the financial markets and the cost of credit; |
| • | availability and cost of raw materials; |
| • | the possibility of further material contractions in automotive sales and production; |
| • | escalating pricing pressures; |
| • | the possibility of our not being able to meet significant increases in demand; |
| • | competition in our industry; |
| • | our conducting operations outside the United States; |
| • | the uncertainty of our ability to achieve expected lean savings; |
| • | our exposure to product liability and warranty claims; |
| • | labor conditions; |
| • | our ability to meet our customers’ needs for new and improved products in a timely manner; |
| • | our ability to attract and retain key personnel; |
| • | our legal rights to our intellectual property portfolio; |
| • | our underfunded pension plans; |
| • | environmental and other regulation; and |
| • | the possibility that our acquisition strategy will not be successful. |
The outcome of the Chapter 11 Cases is uncertain and subject to substantial risk. There can be no assurance that we will be successful in achieving our financial restructuring. There may be other factors that may cause our actual results to differ materially from the forward-looking statements. All forward-looking statements attributable to us or persons acting on our behalf apply only as of the date of this Exhibit 99.1 and other reports we file with the SEC and the date of any filings we make with the Bankruptcy Court and are expressly qualified in their entirety by the cautionary statements included herein and therein. We undertake no obligation to update or revise forward-looking statements to reflect events or circumstances that arise after the date made or to reflect the occurrence of unanticipated events.
3
TRADEMARKS AND TRADENAMES
We own or have rights to trademarks or trade names that we use in conjunction with the operation of our business. In addition, Stratlink™, Safe Seal™, PosiBond™, and PosiLock™, our name, logo and website name and address are our service marks or trademarks. Each trademark, trade name or service mark by any other company appearing in this Exhibit 99.1 belongs to its holder.
MARKET SHARE, RANKING AND SIMILAR INFORMATION
Some market data and other statistical information used throughout this Exhibit 99.1 is based on data available from CSM Worldwide and J.D. Power-LMC, each independent market research firms. Other data is based on our good faith estimates, which are derived from our review of internal surveys, as well as third party sources. Although we believe all of these third party sources are reliable, we have not independently verified the information and cannot guarantee its accuracy and completeness. To the extent that we have been unable to obtain information from third party sources, we have expressed our belief on the basis of our own internal analyses and estimates of our and our competitors’ products and capabilities. Certain market share, ranking and similar information set forth in this Exhibit 99.1 is based on management’s estimates, which are primarily based on reports prepared by industry consultants commissioned by us. Market share information is subject to change, however, and cannot always be verified with complete certainty due to limits on the availability and reliability of raw data, the voluntary nature of the data-gathering process and other limitations and uncertainties inherent in any statistical survey of market share. While we are not aware of any misstatements regarding any market share, ranking and similar information presented herein, the global automotive industry involves risks and uncertainties and industry data is subject to change based on various factors. See “Forward-Looking Statements.” In addition, customer preferences can and do change and the definition of the relevant market is a matter of judgment and analysis. As a result, you should be aware that market share, ranking and other similar information set forth in this Exhibit 99.1, and estimates and beliefs based on such data, may not be reliable.
GLOSSARY OF CERTAIN DEFINED TERMS
As used in this Exhibit 99.1:
“Backstop Parties” means certain funds or accounts managed by Barclays Bank PLC, Capital Research and Management Company, Lord, Abbett & Co., Oak Hill Advisors, L.P., Silver Point Capital, L.P., TCW Asset Management Company and TD Asset Management Inc. from which the Debtors have obtained backstop commitments pursuant to the Equity Commitment Agreement;
“Bankruptcy Cases” collectively refers to the Chapter 11 Cases and the Canadian Proceedings;
“Bankruptcy Code” refers to title 11 of the United States Code;
“Bankruptcy Court” refers to the United States Bankruptcy Court for the District of Delaware;
“Canadian Proceedings” refers to CSA Canada’s Proceedings under Canada’s Companies’ Creditors Arrangement Act;
4
“Chapter 11 Cases” refers to the Debtors’ proceedings under chapter 11 of the Bankruptcy Code in the Bankruptcy Court;
“Chrysler” refers to Chrysler LLC combined with Chrysler Group LLC;
“Company,” “we,” “us” and “our” or similar terms refer to Cooper-Standard Automotive Inc. and its direct parent, Cooper-Standard Holdings Inc., also referred to herein as Parent, and all of their consolidated subsidiaries after consummation of the Plan of Reorganization described herein, unless otherwise specified or the context otherwise requires;
“Creditors’ Committee” means the official committee of unsecured creditors, appointed in the Chapter 11 Cases pursuant to section 1102(a) of the Bankruptcy Code on August 14, 2009, as the same may be constituted from time to time.
“CSA U.S.” and the “Issuer” refer solely to Cooper-Standard Automotive Inc. and not any of its subsidiaries;
“CSA Canada” refers solely to Cooper-Standard Automotive Canada Limited and not any of its subsidiaries;
“Debtors” means Parent and each of its direct and indirect wholly-owned U.S. subsidiaries that filed voluntary petitions for relief under the Bankruptcy Code in the Bankruptcy Court in 2009;
“DIP Credit Agreement” means the debtor-in-possession credit agreement approved by final order of the Bankruptcy Court on December 29, 2009;
“Disclosure Statement” means our first amended disclosure statement for the Debtors’ Second Amended Joint Chapter 11 Plan of Reorganization, as approved by the Bankruptcy Court on March 26, 2010;
“Emergence Date” means the effective date of the Plan of Reorganization;
“Equity Commitment Agreement” means the commitment agreement between Parent and the Backstop Parties, dated as of March 19, 2010 and approved by final order of the Bankruptcy Court on March 26, 2010, as may be amended from time to time in accordance with the terms thereof;
“Escrow Issuer” refers to CSA Escrow Corporation;
“Ford” refers to Ford Motor Company;
“GM” refers to General Motors Corporation combined with General Motors Company;
“new common stock” refers to shares of common stock of Parent, par value $0.001 per share, to be issued and distributed pursuant to the Plan of Reorganization and the Equity Commitment Agreement;
“new preferred stock” refers to shares of the 7% Cumulative Participating Convertible Preferred Stock of Parent, par value $0.001 per share, to be issued and distributed pursuant to the Plan of Reorganization and the Equity Commitment Agreement;
5
“new warrants” refers to warrants exercisable for shares of new common stock to be issued and distributed pursuant to the Plan of Reorganization and a new warrant agreement;
“Parent” refers solely to Cooper-Standard Holdings Inc. and not to any of its subsidiaries;
“Plan of Reorganization” refers to the Debtors’ Second Amended Joint Chapter 11 Plan of Reorganization filed with the Bankruptcy Court on March 26, 2010, together with all exhibits, appendices and schedules thereto, as the same may be amended or modified from time to time in accordance with the terms thereof;
“Prepetition Credit Agreement” refers to the Credit Agreement, dated December 23, 2004 and as amended from time to time, among Parent, CSA U.S., CSA Canada, the Dutch Borrower, the lenders from time to time party thereto, the administrative agent, the syndication agent, the co-documentation agents and the joint lead arrangers and book runners;
“Reorganized Debtors” means the Debtors from and after the Emergence Date;
“Rights Offering” means the equity rights offering under the Plan of Reorganization, for which the Debtors have obtained backstop commitments from the Backstop Parties under the Equity Commitment Agreement;
“Senior Notes” means the Company’s 7% senior notes due 2012;
“Senior Subordinated Notes” means the Company’s 8 3/8% senior subordinated notes due 2014.
6
Our Company
We are a leading manufacturer of body sealing, anti-vibration (“AVS”) and fluid handling components, systems, subsystems and modules. Our products are primarily for use in passenger vehicles and light trucks that are manufactured by global automotive original equipment manufacturers (“OEMs”) and replacement markets. We believe that we are the largest global producer of body sealing systems, the second largest global producer of the types of fluid handling products that we manufacture and one of the largest North American producers in the AVS business.
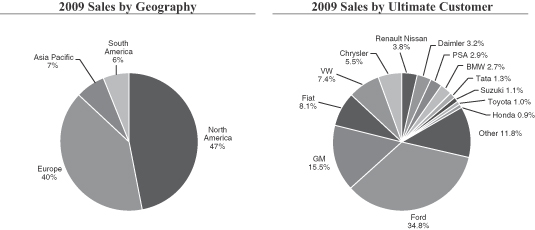
We design and manufacture our products in each major automotive region of the world in close proximity to our customers through a disciplined and consistent approach to engineering and production. We operate in 66 manufacturing locations and nine design, engineering and administrative locations around the world, including Australia, Belgium, Brazil, Canada, China, Czech Republic, France, Germany, India, Italy, Japan, Korea, Mexico, the Netherlands, Poland, Spain, the United Kingdom and the United States. For the year ended December 31, 2009, we generated approximately 47% of our sales in North America, 40% in Europe, 6% in South America and 7% in Asia/Pacific.
We provide parts to virtually every major global OEM for use on a multitude of different platforms. However, we generate a significant portion of our sales from Ford Motor Company (“Ford”), “GM” (defined as General Motors Corporation combined with General Motors Company) and “Chrysler” (defined as Chrysler LLC combined with Chrysler Group LLC) (collectively, the “Detroit 3”). For the year ended December 31, 2009, our sales of product on platforms produced by Ford, GM and Chrysler comprised approximately 34.8%, 15.5% and 5.5% of our sales, respectively, or 55.8% in the aggregate of our sales. Consequently, any significant reduction of our sales to, or the loss of any one of, the Detroit 3 or any significant reduction in the market shares of the Detroit 3 could have a material adverse effect on our financial results.
For the year ended December 31, 2009, approximately 80% of our sales were direct to OEMs, including Ford, GM and Chrysler (collectively, the “Detroit 3”), Fiat, Volkswagen/Audi Group, Renault/Nissan, PSA Peugeot Citroën, Daimler, BMW, Toyota, Volvo, Jaguar/Land Rover and Honda. The remaining 20% of our sales for the year ended December 31, 2009 were primarily to Tier I and Tier II automotive suppliers and non-automotive customers. In 2009, our products were found in 17 of the 20 top-selling vehicle models in North America and in 19 of the 20 top-selling vehicle models in Europe.
We conduct substantially all of our activities through our subsidiaries and sell our product lines through two reportable segments—North America and International. The International segment covers Europe, South America and Asia. For the year ended December 31, 2009, on a pro forma basis, we had sales of $1.9 billion, net loss of $(324.8) million and Adjusted EBITDA of $178.0 million.
7
The following chart illustrates our balance and diversity by providing a breakdown of our $1.9 billion in sales for the year ended December 31, 2009 by geography and customer.
Products
We supply a diverse range of products on a global basis to a broad group of customers across a wide range of vehicles. Our principal product lines are body and chassis products and fluid handling products. For the years ended December 31, 2008 and 2009, body and chassis products accounted for 66% and 65%, respectively, of our sales, and fluid handling products accounted for 34% and 35%, respectively, of our sales. The top ten vehicle platforms we supply accounted for approximately 28% of our sales in 2008 and 32% of our sales in 2009. Our principal product lines are described below.
| Product Lines |
Solutions |
Products & Modules |
Market Position* | |||
| Body & Chassis: Body Sealing |
Protect vehicle interiors from weather, dust and noise intrusion |
Extruded rubber and thermoplastic sealing, weather strip assemblies and encapsulated glass products |
#1 globally | |||
| Anti-Vibration |
Control and isolate noise and vibration in the vehicle to improve ride and handling | Engine and body mounts, dampers, isolators, springs, stamped or cast metal products and rubber products | #3 North America | |||
| Fluid Handling: | Control, sense, measure and deliver fluids and vapors throughout the vehicle | Pumps, tubes and hoses, connectors and valves (individually and in systems and subsystems) | #2 globally | |||
| * | Market positions are management’s estimates, which are based on reports prepared by industry consultants commissioned by us in 2008. |
8
Our Industry
The automotive industry is one of the world’s largest and most competitive. Consumer demand for new vehicles impacts sales and production volumes of global OEMs. Component suppliers rely on high levels of sales and production to be successful.
The automotive supplier industry is generally characterized by high barriers to entry, significant start-up costs and long-standing customer relationships. The key criteria by which OEMs judge automotive suppliers include price, quality, service, performance, design and engineering capabilities, innovation, timely delivery and, more recently, financial stability. Over the last decade, those suppliers that have been able to achieve manufacturing scale, reduce structural costs, diversify their customer bases and establish a global manufacturing footprint have been successful.
The table below outlines vehicle production forecasts for years 2010 through 2014:
| 2010 | 2011 | 2012 | 2013 | 2014 | ||||||
| (vehicle units in millions) | ||||||||||
| Europe |
16.9 | 17.4 | 18.7 | 20.0 | 21.1 | |||||
| North America |
11.6 | 12.7 | 13.4 | 14.4 | 15.2 | |||||
| Asia |
31.8 | 34.0 | 36.9 | 39.3 | 40.6 | |||||
| * | Source: CSM Worldwide April 2010 Forecast |
Among the leading drivers of new vehicle demand is the availability of consumer credit to finance purchases. Due to the turmoil in the global credit markets and the recession in the United States and global economies, there was a severe contraction in the availability of consumer credit. As a result, global sales volumes plummeted, led by the decline in the mature North American and European markets. During 2009, North American light vehicle industry production declined by approximately 32% from 2008 levels to 8.6 million units, while European light vehicle industry production declined by approximately 20% from 2008 levels to 16.3 million units. The decline was less pronounced in Asia, where volumes were down only 1% from 2008 levels to 26.6 million units. This resilience was largely attributable to the continued expansion of the Chinese and Indian markets, both of which will continue to increase as a share of the global automotive market in the coming years.
Our two largest customers faced significant challenges during 2009. After sustained market share and operating losses in recent years, Ford and GM initiated strategic actions throughout their global businesses, including divesting and closing non-core brands, accelerating and broadening both operational and financial restructuring plans and seeking direct and indirect governmental support. In addition, GM filed for chapter 11 bankruptcy protection in June, though it has since emerged.
Several significant and emerging trends are contributing to improvement in the automotive supplier industry, including positive North American sales trends in the fourth quarter of 2009 and first quarter of 2010, increased vehicle scrappage, an improved credit environment, projected growth in global light vehicle production, new and alternative powertrains and an emphasis on electrification/efficiency.
9
Our Competitive Strengths
Innovative and high quality products. We believe we have distinguished ourselves in the automotive industry through our engineering and technological capabilities, as evidenced by our development of innovative solutions, including our ESP Thermoplastic Glassruns (body sealing), ride stabilizing hydromounts (AVS) and proprietary plastics-to-aluminum overmolding process (fluid handling). In addition, we believe we have a reputation for outstanding quality within the automotive industry, a factor that has been important to maintaining and expanding our successful relationships with our customers. We have earned numerous awards, including, among others, the DaimlerChrysler Global Supplier Award, GM Supplier of the Year, Ford’s Silver World Excellence Award and Toyota’s Cost Excellence Performance Award.
Operational excellence. We have a proven track record and disciplined approach to operational excellence, which has generated significant cost savings of approximately 4% of sales annually since 2004. We believe we have the ability to generate similar savings in the future, due to the flexible nature of our manufacturing capabilities, our highly efficient operations and our ability to leverage economies of scale from the high volumes of products we produce for the world’s top-selling vehicle platforms. We have created a culture of continuous improvement and lean manufacturing in all aspects of our operations. Over the life cycle of each platform, we focus on streamlining manufacturing, increasing automation and reducing material and other costs in an effort to generate additional operational savings. We budget and track operational savings at the facility level, which management regularly reports and reviews.
Strong customer relations and program management. We believe that our customer relationships, program management capabilities, global presence, comprehensive product line, excellence in manufacturing, product innovation and quality assurance combine to provide us with significant competitive advantages. We have proven our ability to expand globally with customers, increase scale in a consolidating industry and be first-to-market with design and engineering innovations.
We have a high level of dedication to customer service, and for each major product launch we dedicate a team of sales representatives, engineers, quality specialists and senior management, who work together to ensure that the product launch is completed on time and consistent with rigorous quality standards. These characteristics have allowed us to remain a leading supplier to Ford and GM while steadily growing our business with European and Asian OEMs. Our capabilities are evidenced by our success in being awarded significant content on our customers’ top-selling platforms, including the Ford F-Series and GM’s GMT900 platform, which includes the Yukon, Tahoe, Sierra and Silverado vehicle models.
Global manufacturing footprint. We have established a global manufacturing footprint that allows us to serve our customers worldwide. Our global manufacturing operations are supported by 66 manufacturing locations and nine design, engineering and administrative locations around the world, including Australia, Belgium, Brazil, Canada, China, Czech Republic, France, Germany, India, Italy, Japan, Korea, Mexico, the Netherlands, Poland, Spain, the United Kingdom and the United States. Since 2004, we have increased our sales outside North America from 30% to 53%, largely reflecting our strategic focus on gaining exposure to high growth Asian markets and from key acquisitions in Europe. As part of our strategy, we operate several successful joint ventures, which has allowed us to enter into new geographic markets, to acquire new customers and to develop new technologies. Our joint venture partners provide knowledge and insight into local markets and access to local suppliers of raw materials and components. We believe our global manufacturing footprint and proximity to customers provides us with a competitive advantage by allowing us to efficiently transport parts to local
10
customers at a significantly lower cost as many of the parts are difficult to transport across long distances.
Incumbent position across diverse customer base. In 2009, our products were found in 17 of the 20 top-selling vehicle models in North America and in 19 of the 20 top-selling vehicle models in Europe. As the incumbent supplier to platforms, we have typically participated in the design of their successor platforms, and therefore, we believe we have been afforded a competitive advantage to win the upgrade and the ultimate replacement business. In addition, we believe that our presence on our largest customers’ highest-volume and most important platforms is a competitive advantage that allows us to further increase our market share, cross-sell our other product lines, fully leverage our lean initiatives, spread our fixed costs over higher volumes and increase our return on capital.
Experienced management team. Our senior management team has extensive experience in the automotive industry and collectively has over 130 years of experience in the industry. Our management team is focused on guiding us through the challenges facing the automotive industry and the changing economic environment through ongoing and continued cost reduction and restructuring initiatives and is intent on continuing to implement our business strategies.
Conservative capital structure. At the Emergence Date, we expect to have $494.3 million of outstanding indebtedness. The senior secured asset-based revolving credit facility will be subject to borrowing base limitations, and we expect to have approximately $34.7 million of letters of credit outstanding but not drawn under such facility on the Emergence Date. Actual borrowings under such facility may be higher or lower based on available cash on the Emergence Date. For the year ended December 31, 2009, on a pro forma basis, we had Adjusted EBITDA of $178.0 million, resulting in a total debt to Adjusted EBITDA ratio of 2.7x. Additionally, we expect to issue 17,486,992 shares of our new common stock and 1,000,000 shares of our 7% cumulative participating convertible preferred stock at the Emergence Date. Upon the Emergence Date, we will have significantly improved our leverage as compared to historical levels. We believe our Emergence Date capital structure is a conservative and stable structure.
Our Business Strategy
Continue optimization of our business and cost structure. We seek to optimize our business and cost structure so that we are appropriately configured in the rapidly changing environment in the automotive industry, with an emphasis on reducing our overall cost structure and making our manufacturing operations more efficient. Our primary areas of focus are:
| • | Identifying and implementing lean manufacturing initiatives. Our lean manufacturing initiatives focus on optimizing manufacturing by eliminating waste, controlling cost and enhancing productivity. Lean manufacturing initiatives have been implemented at each of our manufacturing and design facilities and continue to be an important element in our disciplined approach to operational excellence. |
| • | Relocating operations to lower-cost countries. We are supplementing our Western European operations with Central and Eastern European facilities where there are lower operating costs and to more closely match our customers’ footprints for more efficient transport of parts. In addition, we have expanded our operations in China, India and Mexico. |
11
| • | Consolidating facilities to reduce our cost structure. Our optimization efforts are designed to streamline our global operations and include taking advantage of opportunities to reduce our overall cost structure by consolidating and closing facilities. For example, in the second half of 2009, we closed two manufacturing facilities, one located in Ohio and another located in Germany, and in March 2010, we announced the closure of our manufacturing facility in Spain. We will continue to take a disciplined approach to evaluating opportunities that would improve our efficiency, profitability and cost structure. |
| • | Maintaining flexibility in all areas of our operations. Our operational capital needs are generally lower than many in our industry and a major portion of our manufacturing machinery is movable from job-to-job, providing us flexibility in adapting to market changes and serving customers worldwide. |
Further developing technologies. We will draw on our technical expertise to provide customers with innovative solutions. Our engineers combine product design with a broad understanding of material options for enhanced vehicle performance. We believe our reputation for successful innovation in product design and material usage is the reason our customers consult us early in the development and design process of their next generation vehicles.
Recent innovations that highlight our ability to combine materials and product design expertise can be found in the following products:
| • | Safe Seal™. Safe Seal™ is a body sealing product featuring sensors built into the seal capable of reversing power windows, doors and partitions to prevent injury. |
| • | Our New Generation Hydro Body Mount. Our new generation Hydro Body Mount features patented Inertia-track design, combining plastic, metal and rubber to provide superior damping in the driver compartment for improved ride. |
| • | Direct Injection Fuel Rail. Direct Injection Fuel Rails draw upon our innovative welding processes and understanding of metal dynamics to create high pressure capability for highly advanced direct injection engines, improving fuel economy and performance. |
| • | Stratlink. Utilizing our internal material engineering capabilities we have developed a rubber compound which performs equally with externally sourced compounds, which will significantly reduce cost. |
| • | PlastiCool. A low cost, low weight, high temperature alternative to metal and rubber hose currently used in transmission cooling. This product offers a more robust joint design, improving quality and potentially reducing warranty costs. Additionally, because the material is smaller than current alternatives it allows for greater design flexibility. |
Continued emphasis on fuel efficient, global and high volume vehicles. We believe that by focusing on fuel efficient, global and high volume vehicles, we will be able to solidify and expand our global leadership position.
| • | Fuel Efficient. With the recent shift in customer preferences toward light weight, fuel efficient vehicles, we intend to target small car, hybrid and alternative powertrains and increase the content we provide to these platforms. We believe that furthering our position in the small car and hybrid market and alternative powertrains will allow us to increase market share, create greater economies of scale and provide more opportunities to partner with customers. |
| • | Global. Our global presence makes us one of the select few manufacturers of products in our product line areas who can take advantage of the many business opportunities |
12
| that are becoming available worldwide as a result of the OEMs’ expanding emphasis on global platforms. Examples of successful global platforms we supply are the redesigned Ford Fiesta and GM’s Buick LaCrosse. |
China, India and South America will continue to be regions of emphasis as the light vehicle market is projected to grow substantially as their economies continue to develop. In China, we are developing a substantial manufacturing and marketing presence to serve local OEMs, and we intend to follow our customers as they target other high growth developing markets.
| • | High Volume. While smaller cars and crossover vehicles have grown in popularity, certain large car and truck platforms continue to be in demand and remain important to our business. For example, the Ford F-150 and GM’s GMT 900 platform (the Silverado, Sierra, Tahoe and Yukon nameplates) continue to be popular models for which we supply a broad range of our product offerings, including body sealing systems, anti-vibration systems and fuel, brake, emissions and thermal management components. |
Through our extensive product portfolio, innovative solutions and broad global capabilities, we expect to continue winning new business across all major regions and automakers.
Developing systems solutions and other value-added products. We also believe that significant opportunities exist to grow by providing complete sub-systems, modules and assemblies. As a leader in design, engineering and technical capabilities, we are able to focus on improving products, developing new technologies and implementing more efficient processes in each of our product lines. Our body sealing products are visible to vehicle passengers and can enhance the vehicle’s aesthetic appeal, in addition to creating a barrier to wind, precipitation, dust and noise. Our AVS products are an important contributor to vehicle quality, significantly improving ride and handling. Our fluid handling modules and sub-systems are designed to increase functionality and decrease costs to the OEM, which can be the deciding factor in winning new business.
Selectively pursuing complementary acquisitions and alliances. We intend to continue to selectively pursue complementary acquisitions and joint ventures to enhance our customer base, geographic penetration, scale and technology. Consolidation is an industry trend and is encouraged by the OEMs’ desire for fewer supplier relationships. We believe we have a strong platform for growth through acquisitions based on our past integration successes, experienced management team, global presence and operational excellence. In addition, we believe joint ventures allow us to penetrate new markets with less relative risk and capital investment. We currently operate through several successful joint ventures, including those with Nishikawa Rubber Company, Zhejiang Saiyang Seal Products Co., Ltd. (“Saiyang Sealing”), Guyoung Technology Co. Ltd. (“Guyoung”), Hubei Jingda Precision Steel Tube Industry Co., Ltd. (“Jingda”), Shanghai Automotive Industry Corporation (“SAIC”) and Toyoda Gosei Co., Ltd. (“Toyoda Gosei”).
Developing business in non-automotive markets. While the automotive industry will continue to be our core business, we supply other industries with products using our expertise and material compounding capabilities. For example, we supply parts to customers in the technical rubber business and develop and produce synthetic rubber products for a variety of industry applications, including aircraft flooring, commercial flooring, insulating sheets for power stations, non-slip step coverings, rubber for appliances and construction applications. In our technical rubber business we fabricate products from a wide variety of elastomer compounds and can custom fit many applications.
13
Recent Developments
We estimate that during the quarter ended March 31, 2010 our sales will range between $590 million and $600 million compared to $402 million for the quarter ended March 31, 2009. We estimate that during the quarter ended March 31, 2010 our net income will range between $2 million and $5 million compared to a net loss of $55 million for the quarter ended March 31, 2009. In addition, we estimate that during the quarter ended March 31, 2010, on a pro forma basis, our Adjusted EBITDA will range between $70 million and $76 million compared to $15 million for the quarter ended March 31, 2009. We estimate that as of March 31, 2010 our balance sheet cash will be between $260 million and $270 million. Our results for the quarter ended March 31, 2010 have benefited from a significant increase in volumes in all regions and our lean savings, offset by the return of certain employee benefits and slightly higher raw material costs. In addition, during the quarter ended March 31, 2010 we repaid $50 million of the borrowings outstanding under our $175 million DIP Credit Agreement. For the definition of, and additional information about, Adjusted EBITDA and a description of how Adjusted EBITDA is calculated from our net income, see “Non-GAAP Financial Measures” and note 4 in “—Summary Historical and Pro Forma Financial Data.”
The first quarter estimates included above are unaudited, are subject to completion and reflect our current best estimates and may be revised as a result of management’s further review of our results. During the course of the preparation of our final consolidated quarterly financial statements and related notes, we may identify items that would require us to make material adjustments to the preliminary financial information presented above.
Historically, sales to automotive customers are lowest during the months prior to model changeovers and during assembly plant shutdowns. However, economic conditions and consumer demand may change the traditional seasonality of the industry as lower production may prevail without the impact of seasonality. Historically, model changeover periods have typically resulted in lower sales volumes during July, August and December. During these periods of lower sales volumes, profit performance is lower but working capital improves due to continuing collection of accounts receivable.
Plan of Reorganization
On August 3, 2009, the Debtors filed voluntary petitions for relief under chapter 11 of the Bankruptcy Code in the Bankruptcy Court. The Chapter 11 Cases have been consolidated for procedural purposes only under Case No. 09-12743 (PJW). The Debtors continue to operate their businesses and manage their properties as “debtors-in-possession” under the jurisdiction of the Bankruptcy Court and in accordance with the applicable provisions of the Bankruptcy Code and orders of the Bankruptcy Court. On August 14, 2009, the Creditors’ Committee was appointed in the Chapter 11 Cases.
14
On August 4, 2009, CSA Canada commenced the “Canadian Proceedings” in the Ontario Superior Court of Justice (Commercial List) in Toronto, Ontario, Canada (the “Canadian Court”), court file no. 09-8307-00CL. CSA Canada’s plan of compromise or arrangement was sanctioned on April 16, 2010. The effectiveness of the plan of compromise or arrangement is subject to certain conditions, including the consummation of the Plan of Reorganization. The Company’s subsidiaries and operations outside of the United States and Canada are not included in the Chapter 11 Cases or the Canadian Proceedings and continue to operate in the ordinary course of business.
Following the Debtors’ entry into a Commitment Agreement (the “Equity Commitment Agreement”) with certain holders (the “Backstop Parties”) of the Company’s 7% Senior Notes due 2012 (the “Senior Notes”) and 8 3/8% Senior Subordinated Notes due 2014 (the “Senior Subordinated Notes”) on March 19, 2010, the Debtors filed with the Bankruptcy Court on March 20, 2010 a First Amended Joint Chapter 11 Plan of Reorganization (as amended by the Second Amended Joint Chapter 11 Plan of Reorganization, dated March 26, 2010, the “Plan of Reorganization”) and an accompanying Disclosure Statement (as amended by the First Amended Disclosure Statement, dated March 26, 2010, the “Disclosure Statement”). The Disclosure Statement and the Equity Commitment Agreement were approved by the Bankruptcy Court on March 26, 2010. The Equity Commitment Agreement and the Plan of Reorganization provide for a backstopped equity rights offering and the purchase of new common stock and new preferred stock of the Company by the Backstop Parties (as described below), with aggregate proceeds to the Company of $355 million, that would unimpair the claims under the Prepetition Credit Agreement and the Senior Notes and improve the recovery to the holders of the Senior Subordinated Notes (as compared to the recovery they would have received under the plan of reorganization filed February 1, 2010). Consummation of the transactions contemplated by the Equity Commitment Agreement is subject to certain customary conditions, including, among other things, confirmation of the Plan of Reorganization. Under the Plan of Reorganization, holders of Senior Notes will receive payment in full, in cash, provided that certain of the Backstop Parties have each agreed to forgo their right as holders of Senior Notes to receive payment in full, in cash, and in lieu thereof, have agreed to accept their pro rata share of 20.95% (assuming the conversion of the new preferred stock) of the new common stock in full satisfaction of and in consideration for their allowed prepetition Senior Note claims and their commitment under the Equity Commitment Agreement. In addition, holders of Senior Subordinated Notes will receive a distribution of 8% of the new common stock (assuming the conversion of the new preferred stock) and warrants to acquire an additional 3% of the new common stock (assuming conversion of the new preferred stock and the new warrants) that may be exercised at a strike price of $27.33 per share, and eligible noteholders of Senior Subordinated Notes will receive rights to purchase 39.6% of the new common stock (assuming the conversion of the new preferred stock) pursuant to the Rights Offering at a subscription price of $21.54 per share. In addition, the Backstop Parties have agreed to purchase 11.75% of the new common stock (assuming the conversion of the new preferred stock) at a price per share of $27.07 and 1,000,000 shares of new preferred stock of the Company (which constitutes all of the new preferred stock to be issued under the Plan of Reorganization) at a price per share of $100.00 and will receive warrants to acquire an additional 7% of the new common stock (assuming the conversion of the new preferred stock and the new warrants) that may be exercised at a strike price of $27.33 per share. The occurrence of the Emergence Date is subject to the satisfaction of numerous conditions, including, among other things, consummation of the Rights Offering and entry into a new debt agreement and a new secured working capital facility.
On March 26, 2010, we filed the Plan of Reorganization and the Bankruptcy Court approved our Disclosure Statement relating to the Plan of Reorganization, authorized the solicitation of votes to approve the Plan of Reorganization and approved the Equity Commitment Agreement
15
that we entered into with the Backstop Parties. The Plan of Reorganization sets forth the contemplated structure of the Reorganized Debtors and outlines the manner in which the prepetition creditors’ and equity holders’ various claims against and interests in the Debtors will be treated, subject to confirmation of the Plan of Reorganization and the occurrence of the Emergence Date. The hearing to consider confirmation of the Plan of Reorganization is currently scheduled to be held by the Bankruptcy Court on May 12, 2010. The Bankruptcy Court will confirm the Plan of Reorganization if the requisite class votes to approve the plan are obtained and it determines that the Plan of Reorganization otherwise complies with the requirements set forth in section 1129 of the Bankruptcy Code. Although the timing is uncertain and no assurances can be given, we believe and have assumed that the Bankruptcy Court will confirm a plan of reorganization for the Debtors that would be substantially similar to the Plan of Reorganization described herein. Unless the context otherwise requires, we have assumed that the Emergence Date will be on or about May 27, 2010. To the extent there are material changes to the Plan of Reorganization or the Emergence Date, information based upon these assumptions could be materially different.
On the Emergence Date, the terms of the plan of reorganization confirmed by the Bankruptcy Court will be binding upon the Debtors and all other parties affected by such plan of reorganization. Parties will have 14 days following the entry by the Bankruptcy Court of a confirmation order to file a notice of appeal with respect to such confirmation order. Even if a notice of appeal is timely filed, the Debtors expect to proceed to consummate the plan of reorganization confirmed by the Bankruptcy Court in accordance with its terms, unless the party seeking the appeal also obtains a stay of implementation of such plan of reorganization pending appeal of the confirmation order, in which event the Debtors will not be able to implement the terms of the plan of reorganization confirmed by the Bankruptcy Court unless and until the stay is lifted. An appeal of the confirmation order may be initiated even if there is no stay pending appeal of the confirmation order and, in such circumstances, the appeal may be dismissed as moot if the Debtors have implemented such plan of reorganization to the point of “substantial consummation.”
The proposed Plan of Reorganization includes the following key elements, among others:
| • | The rationalization of the Debtors’ balance sheet through the discharge of certain prepetition debt and claims. |
| • | The following claims and interests would be treated as follows, in full and complete satisfaction of the Debtors’ obligations in respect thereto, although no assurance can be given as to what the final terms of the confirmed Plan of Reorganization will be: |
| • | Each holder of a claim for the administrative cost or expense of the Chapter 11 Cases will receive an amount in cash equal to the allowed amount of such claim. |
| • | Each holder of a priority tax claim will receive in exchange for such claim an amount in cash equal to the allowed amount of such claim or such other treatment as agreed to by the holder of such claim and the Debtors or the Reorganized Debtors, as the case may be. |
| • | Each holder of an allowed priority claim will receive in exchange for such claim an amount in cash sufficient to render such claim unimpaired; provided, however, that allowed priority claims representing obligations incurred in the ordinary course of business will be paid in full or performed by the Debtors or Reorganized Debtors consistent with past practice. |
16
| • | Each holder of a secured claim that is not a prepetition credit facility claim will either have its secured claim reinstated or receive in exchange for such claim treatment that will render such claim unimpaired. |
| • | Each holder of an intercompany claim will, at the sole discretion of the Debtors or Reorganized Debtors, (i) have the claim reinstated, (ii) have the intercompany claim cancelled and discharged, in full or in part, with no property or interest distributed for cancelled or discharged portions of such claim or (iii) receive property of the Debtors or Reorganized Debtors in exchange for settlement or discharge of such claim; provided that intercompany claims held by non Debtor subsidiaries will remain unaltered. |
| • | Each holder of a prepetition credit facility claim will receive in exchange for such claim an amount in cash equal to the allowed amount of such claim, and the prepetition credit facility will be cancelled and terminated. |
| • | Each holder of a prepetition senior note claim will receive in exchange for such claim an amount in cash equal to the allowed amount of such claim; provided, however, that certain of the Backstop Parties that are also holders of Senior Notes have agreed to forego their right to receive payment in cash and, in lieu thereof, have agreed to accept their pro rata share of 4,563,095 shares of new common stock in respect of their allowed prepetition senior note claims and their commitment under the Equity Commitment Agreement. The Senior Notes will be cancelled and terminated. |
| • | Each holder of a prepetition senior subordinated note claim will receive in exchange for such claim, (i) its pro rata share of 1,742,222 shares of new common stock, (ii) its share of new warrants to purchase 725,926 shares of new common stock and (iii) its pro rata share of rights to purchase 8,623,491 shares of new common stock; provided that, in lieu of its share of rights, holders of such claims that are not eligible to participate in the Rights Offering will be entitled to receive shares of new common stock with a value equal to the rights such holders would have received if they were eligible to participate in the Rights Offering. The Senior Subordinated Notes will be cancelled and terminated. |
| • | Each holder of a general unsecured claim against Cooper-Standard Automotive Inc., Cooper-Standard Automotive FHS Inc., Cooper-Standard Automotive Fluid Systems Mexico Holding LLC, Cooper-Standard Automotive OH, LLC, StanTech Inc., Westborn Service Center, Inc., North American Rubber, Incorporated, Sterling Investments Company, Cooper-Standard Automotive NC L.L.C., CS Automotive LLC, CSA Services Inc. or NISCO Holding Company (collectively, the “Subsidiary Debtors”) will receive in exchange for such claim, cash in an amount sufficient to render such claim unimpaired. |
| • | Each equity interest in a Subsidiary Debtor will be reinstated. |
| • | Holders of general unsecured claims against Parent will not receive or retain any interest or property under the Plan of Reorganization on account of such claims. |
| • | Holders of equity interests in Parent will not receive or retain any interest or property under the Plan of Reorganization on account of such interests. |
| • | The costs of emergence, including the cash required for distributions in settlement of certain prepetition claims and to repay borrowings outstanding under the DIP Credit Agreement, will be financed primarily from the proceeds of new debt, the Rights Offering, cash on balance sheet and the Senior ABL Facility, to the extent required. |
17
The consummation of the Plan of Reorganization will significantly de-lever our capital structure. Assuming a May 27, 2010 Emergence Date, we expect to have approximately $494.3 million of total consolidated funded debt compared to $1.2 billion of total prepetition consolidated funded debt outstanding as of August 3, 2009.
As a result of the restructuring transactions contemplated by the Plan of Reorganization, the holders of Senior Notes and Senior Subordinated Notes, including the Backstop Parties, are expected to beneficially own substantially all of our equity interests, subject to dilution by shares of new common stock issued in connection with management equity plans.
Liquidity and Capital Resources—After Emergence from Bankruptcy Proceedings
At the Emergence Date, we expect to have $494.3 million of outstanding indebtedness. We intend to fund our ongoing capital and working capital requirements through a combination of cash flows from operations and borrowings under a senior secured asset-based revolving credit facility that we expect to enter into upon our emergence from bankruptcy. We anticipate that funds generated by operations and funds available under a senior secured asset-based revolving credit facility will be sufficient to meet working capital requirements for the next 12 months.
Based on our current and anticipated levels of operations and the condition in our markets and industry, we believe that our cash on hand, cash flow from operations and availability under a senior secured asset-based revolving credit facility will enable us to meet our working capital, capital expenditures, debt service and other funding requirements for the foreseeable future. However, our ability to fund our working capital needs, debt payments and other obligations, and to comply with the financial covenants, including borrowing base limitations, under a senior secured asset-based revolving credit facility, depends on our future operating performance and cash flow and many factors outside of our control, including the costs of raw materials, the state of the overall automotive industry and financial and economic conditions and other factors. Any future acquisitions, joint ventures or other similar transactions will likely require additional capital and there can be no assurance that any such capital will be available to us on acceptable terms, if at all.
Accounting Impact of Emergence from Chapter 11
As discussed in detail in the section titled “Unaudited Pro Forma Consolidated Financial Information,” our emergence from bankruptcy, the implementation of the Plan of Reorganization and our application of “fresh-start” accounting principles will affect our future results of operations and make it difficult to compare our historical, pre-emergence results of operations with those that we report in the future. As noted in the unaudited pro forma consolidated financial statements, initial “fresh-start” accounting valuations are preliminary and have been made solely for purposes of developing the unaudited pro forma consolidated financial information. However, updates to such preliminary valuations will be completed as of the Emergence Date and, to the extent such updates reflect a valuation different than those used in the unaudited pro forma consolidated financial information, there may be adjustments in the carrying values of certain assets. To the extent actual calculations and allocations differ from those used in calculating the unaudited pro forma consolidated financial information, these differences will be reflected on our balance sheet upon emergence under “fresh-start” accounting and may also affect the amount of revenues and expenses, which would be recognized in the statement of operations post-emergence from bankruptcy.
18
SUMMARY HISTORICAL AND PRO FORMA FINANCIAL DATA
The following tables set forth our summary consolidated historical and unaudited pro forma consolidated financial information for the periods ended and as of the dates set forth below. The summary historical financial data as of December 31, 2008 and 2009 and for the years ended December 31, 2007, 2008 and 2009 have been derived from our audited consolidated financial statements and the notes thereto. The financial information as of December 31, 2007 was obtained from our 2007 audited consolidated financial statements.
The summary unaudited pro forma consolidated financial data set forth below has been derived by applying the pro forma adjustments described under “Unaudited Pro Forma Consolidated Financial Information” to our historical consolidated balance sheet as of December 31, 2009 and to our historical consolidated statement of operations for the year ended December 31, 2009. The summary unaudited pro forma consolidated statement of operations data has been prepared to give effect to the Pro Forma Adjustments, as further described under “Unaudited Pro Forma Consolidated Financial Information,” as if they had occurred on January 1, 2009. The summary unaudited pro forma consolidated balance sheet data has been prepared to give effect to the transactions as if they had occurred on December 31, 2009.
The summary pro forma consolidated financial data presented for the year ended December 31, 2009 was derived from the audited consolidated financial statements and has been prepared to give effect to the following:
| • | the effectiveness of the Plan of Reorganization, including the new debt and the Rights Offering (collectively referred to as “Reorganization Adjustments” in Unaudited Pro Forma Consolidated Financial Information); and |
| • | the estimated adjustments required under “fresh-start” accounting for entities emerging from the Bankruptcy Cases (classified as “Fresh-Start Adjustments” in Unaudited Pro Forma Consolidated Financial Information). |
The summary historical and pro forma consolidated financial data set forth below should be read in conjunction with our consolidated financial statements and the notes thereto.
The summary unaudited pro forma consolidated financial information set forth below is presented for illustrative purposes only and is not necessarily indicative of the results of operations or financial position that would have actually been reported had the transaction and other matters reflected in the Pro Forma Adjustments occurred on January 1, 2009 or as of December 31, 2009, respectively, nor is it indicative of our future results of operations or financial position. In addition, our historical financial statements will not be comparable to our financial statements following emergence from bankruptcy due to the effects of the consummation of the Plan of Reorganization as well as adjustments for “fresh-start” accounting. In addition, the amount of new stockholders’ equity in the unaudited pro forma consolidated balance sheet is not an estimate of the market value of our new common stock or new preferred stock as of the Emergence Date or at any other time. We make no representations as to the market value, if any, of our new common stock and new preferred stock.
19
| Historical | Pro Forma | |||||||||||||||
| Year Ended December 31, | Year Ended December 31, |
|||||||||||||||
| 2007 | 2008 | 2009 | 2009 | |||||||||||||
| (in millions) | ||||||||||||||||
| Statement of operations: |
||||||||||||||||
| Sales |
$ | 2,511.2 | $ | 2,594.6 | $ | 1,945.3 | $ | 1,945.3 | ||||||||
| Cost of products sold |
2,114.1 | 2,260.1 | 1,679.0 | 1,690.5 | ||||||||||||
| Gross profit |
397.1 | 334.5 | 266.3 | 254.8 | ||||||||||||
| Selling, administration & engineering expenses |
222.1 | 231.7 | 199.5 | 199.3 | ||||||||||||
| Amortization of intangibles |
31.9 | 31.0 | 15.0 | 10.5 | ||||||||||||
| Impairment charges |
146.4 | 33.4 | 363.5 | 363.5 | ||||||||||||
| Restructuring |
26.4 | 38.3 | 32.4 | 32.4 | ||||||||||||
| Operating profit (loss) |
(29.7 | ) | 0.1 | (344.1 | ) | (350.9 | ) | |||||||||
| Interest expense, net of interest income |
(89.5 | ) | (92.9 | ) | (64.3 | ) | (45.7 | ) | ||||||||
| Equity earnings |
2.2 | 0.9 | 4.0 | 2.5 | ||||||||||||
| Reorganization items, net |
— | — | (17.4 | ) | — | |||||||||||
| Other income (expense) |
(0.5 | ) | (1.4 | ) | 9.9 | 12.3 | ||||||||||
| Loss before income taxes |
(117.5 | ) | (93.3 | ) | (411.9 | ) | (381.8 | ) | ||||||||
| Provision for income tax expense (benefit) |
32.9 | 29.3 | (55.7 | ) | (56.9 | ) | ||||||||||
| Consolidated net loss |
(150.4 | ) | (122.6 | ) | (356.2 | ) | (324.9 | ) | ||||||||
| Add: Net loss (income) attributable to noncontrolling interests(1) |
(0.6 | ) | 1.1 | 0.1 | 0.1 | |||||||||||
| Net loss attributable to Cooper-Standard Holdings Inc. |
$ | (151.0 | ) | $ | (121.5 | ) | $ | (356.1 | ) | $ | (324.8 | ) | ||||
| Balance sheet data (at end of period): |
||||||||||||||||
| Cash and cash equivalents |
$ | 40.9 | $ | 111.5 | $ | 380.3 | $ | 184.8 | ||||||||
| Net working capital(2) |
249.8 | 154.5 | 240.8 | 199.7 | ||||||||||||
| Total assets |
2,162.3 | 1,818.3 | 1,737.4 | 1,755.1 | ||||||||||||
| Total non-current liabilities |
1,351.6 | 1,346.9 | 263.9 | 768.2 | ||||||||||||
| Total debt(3) |
1,140.2 | 1,144.1 | 204.3 | 479.3 | ||||||||||||
| Liabilities subject to compromise |
— | — | 1,261.9 | — | ||||||||||||
| Equity (deficit) |
276.8 | 19.7 | (306.5 | ) | 595.7 | |||||||||||
| Statement of cash flows data: |
||||||||||||||||
| Net cash provided (used) by: |
||||||||||||||||
| Operating activities |
$ | 185.4 | $ | 136.5 | $ | 130.0 | ||||||||||
| Investment activities |
(260.0 | ) | (73.9 | ) | (45.5 | ) | ||||||||||
| Financing activities |
55.0 | 14.1 | 166.1 | |||||||||||||
| Capital expenditures |
107.3 | 92.1 | 46.1 | |||||||||||||
| Other financial data (unaudited): |
||||||||||||||||
| EBITDA(4) |
$ | 107.5 | $ | 140.8 | $ | (233.6 | ) | $ | (220.5 | ) | ||||||
| Adjusted EBITDA(4) |
285.7 | 210.2 | 176.5 | 178.0 | ||||||||||||
| (1) | Certain prior period amounts have been reclassified from other income to net loss (income) attributable to noncontrolling interests due to recent accounting pronouncements. |
| (2) | Net working capital is defined as current assets (excluding cash and cash equivalents) less current liabilities (excluding debt payable within one year). |
| (3) | Includes $175.0 million of borrowings under our DIP Credit Agreement, $0.8 million in capital leases and $28.5 million of other third party debt at December 31, 2009. |
| (4) | In evaluating our business, management considers EBITDA and Adjusted EBITDA as key indicators of our operating performance. In addition, our management uses EBITDA and Adjusted EBITDA: |
| • | as measures utilized in the calculation of the financial covenants contained in our financing arrangements; |
20
| • | in developing our internal budgets and forecasts; |
| • | as a significant factor in evaluating our management for compensation purposes; |
| • | in evaluating potential acquisitions; |
| • | in comparing our current operating results with corresponding historical periods and with the operational performance of other companies in our industry; and |
| • | in presentations to the members of our board of directors to enable our board to have the same measurement basis of operating performance as is used by management in their assessments of performance and in forecasting and budgeting, both for individual operating units and for our company as a whole. |
In addition, we believe Adjusted EBITDA and similar measures are widely used by investors, securities analysts and other interested parties in evaluating our performance. We define Adjusted EBITDA as net income (loss) plus provision for income tax expense (benefit), interest expense, net of interest income, depreciation and amortization, as adjusted for items that management does not consider to be reflective of our core operating performance. These adjustments include restructuring costs, impairment charges, non-cash fair value adjustments, acquisition related costs, professional fees and expenses associated with reorganization, non-cash stock based compensation and non-cash gains and losses from certain foreign currency transactions and translation. The new debt uses a similar calculation of Adjusted EBITDA to determine compliance with covenants.
We calculate Adjusted EBITDA by adjusting net income (loss) to eliminate the impact of a number of items we do not consider indicative of our ongoing operating performance. You are encouraged to evaluate each adjustment and the reasons we consider it appropriate for supplemental analysis. However, Adjusted EBITDA is not a financial measurement recognized under GAAP, and when analyzing our operating performance, investors should use Adjusted EBITDA in addition to, and not as an alternative for, net income (loss), operating income, or any other performance measure derived in accordance with GAAP, or as an alternative to cash flow from operating activities as a measure of our liquidity. Our use of Adjusted EBITDA has limitations as an analytical tool, and it should not be considered in isolation or as a substitute for analysis of our results of operations as reported under GAAP. These limitations include:
| • | it does not reflect our cash expenditures or future requirements for capital expenditures or contractual commitments; |
| • | it does not reflect changes in, or cash requirements for, our working capital needs; |
| • | it does not reflect interest expense or cash requirements necessary to service interest or principal payments under the new debt; |
| • | it does not reflect certain tax payments that may represent a reduction in cash available to us; |
| • | although depreciation and amortization are non-cash charges, the assets being depreciated or amortized may have to be replaced in the future, and Adjusted EBITDA does not reflect cash requirements for such replacements; and |
| • | other companies, including companies in our industry, may calculate these measures differently and, as the number of differences in the way companies calculate these measures increases, the degree of their usefulness as a comparative measure correspondingly decreases. |
In addition, in evaluating Adjusted EBITDA, it should be noted that in the future we may incur expenses similar to the adjustments in the below presentation. Our presentation of Adjusted EBITDA should not be construed as an inference that our future results will be unaffected by unusual or non-recurring items.
21
The following table provides a reconciliation of Adjusted EBITDA to net income (loss), which is the most directly comparable financial measure presented in accordance with U.S. GAAP and Canadian GAAP (dollars in millions):
| Historical | Pro Forma | |||||||||||||||
| Year Ended December 31, | Year Ended December 31, |
|||||||||||||||
| 2007 | 2008 | 2009 | 2009 | |||||||||||||
| (in millions) | ||||||||||||||||
| Net income (loss) attributable to Cooper-Standard Holdings Inc. |
$ | (151.0 | ) | $ | (121.5 | ) | $ | (356.1 | ) | $ | (324.8 | ) | ||||
| Plus: |
||||||||||||||||
| Provision for income tax expense (benefit) |
32.9 | 29.3 | (55.7 | ) | (56.9 | ) | ||||||||||
| Interest expense, net of interest income |
89.6 | 92.9 | 64.3 | 45.7 | ||||||||||||
| Depreciation and amortization |
136.0 | 140.1 | 113.9 | 115.5 | ||||||||||||
| EBITDA |
$ | 107.5 | $ | 140.8 | $ | (233.6 | ) | $ | (220.5 | ) | ||||||
| Restructuring |
26.4 | 30.6 | 32.4 | 32.4 | ||||||||||||
| Foreign exchange losses (gains) |
(0.1 | ) | 0.1 | (4.2 | ) | (6.6 | ) | |||||||||
| Net gain on bond repurchase(a) |
— | (1.7 | ) | (9.1 | ) | (9.1 | ) | |||||||||
| Inventory write-up(b) |
2.5 | — | — | 7.0 | ||||||||||||
| Impairment(c) |
146.4 | 36.0 | 363.5 | 363.5 | ||||||||||||
| Reorganization costs(d) |
— | — | 25.1 | — | ||||||||||||
| Equity investment amortization(e) |
— | — | — | 1.5 | ||||||||||||
| Transition and integration costs(f) |
1.5 | 0.5 | — | — | ||||||||||||
| Stock compensation expense |
1.5 | (g) | 1.2 | (g) | 1.4 | (g) | 8.9 | (h) | ||||||||
| Other |
— | 2.7 | 1.0 | 0.9 | ||||||||||||
| Adjusted EBITDA |
$ | 285.7 | $ | 210.2 | $ | 176.5 | $ | 178.0 | ||||||||
| (a) | Net gain on purchase of Senior Subordinated Notes. |
| (b) | Write-ups of inventory to fair value. |
| (c) | For the year ended December 31, 2007 impairment included charges related to goodwill of $142.9 million and certain intangibles of $3.5 million. For the year ended December 31, 2008 impairment included charges related to goodwill of $23.1 million, certain intangibles of $3.9 million, fixed assets of $6.4 million, and our investment in Guyoung of $2.6 million. For the year ended December 31, 2009 impairment included charges related to goodwill of $157.2 million, certain intangibles of $202.4 million and fixed assets of $3.9 million. |
| (d) | Reorganization and bankruptcy-related expenses, including professional fees incurred before bankruptcy filing in 2009. |
| (e) | Amortization of fair value adjustment on equity investment. |
| (f) | Transition and integration costs related to the acquisition of MAPS and El Jarudo in 2007 and MAP India in 2008. |
| (g) | Compensation expense related to stock options and Company stock units issued to management. |
| (h) | Estimated annual expense for restricted stock units and stock options reserved for distribution to management upon emergence. |
| Payment due by period | |||||||||||||||
| Total | Less than 1 year |
1-3 Years | 3-5 years | More than 5 Years | |||||||||||
| (in millions) | |||||||||||||||
| Debt obligations(1): |
|||||||||||||||
| Long-term debt(2) |
$ | 465.0 | $ | — | $ | — | $ | 15.0 | $ | 450.0 | |||||
| Interest on debt obligations(3) |
306.0 | 38.2 | 76.5 | 76.5 | 114.8 | ||||||||||
| Capital lease obligations |
0.8 | 0.7 | 0.1 | — | — | ||||||||||
| Operating lease obligations |
71.5 | 14.5 | 21.8 | 15.2 | 20.0 | ||||||||||
| Other obligations(4) |
47.8 | 39.7 | 6.2 | 1.0 | 0.9 | ||||||||||
| Total |
$ | 891.1 | $ | 93.1 | $ | 104.6 | $ | 107.7 | $ | 585.7 | |||||
| (1) | This table reflects that all of the debt subject to compromise will be eliminated upon our emergence from the bankruptcy proceedings. |
| (2) | Assumes an expected $15.0 million of borrowings under a senior secured asset-based revolving credit facility. The amount of any actual borrowings may be higher or lower than such amount based on the available cash on such date. We expect approximately $34.7 million face amount of letters of credit to be issued (but undrawn) under a senior secured asset-based revolving credit facility effective as of the Emergence Date. |
22
| (3) | Interest on debt obligations only includes the interest on the new debt. The actual amounts of interest expense will ultimately depend on the amount of borrowings and letters of credit outstanding under a senior secured asset-based revolving credit facility and the interest rates in effect thereunder during each period. A 0.25% increase or decrease in the effective interest rate used above would increase or decrease our annual interest expense by $1.2 million. |
| (4) | Noncancellable purchase order commitments for capital expenditures and other borrowings. |
Quantitative and Qualitative Disclosures About Market Risk
We are exposed to fluctuations in interest rates, currency exchange rates and commodity prices. Prior to filing for bankruptcy we had entered into derivative financial instruments to monitor its exposure to these risks, but as a result of the bankruptcy filing all but one of these instruments were dedesignated. We actively monitor our exposure to risk from changes in foreign currency exchange rates and interest rates through the use of derivative financial instruments in accordance with management’s guidelines. We do not enter into derivative instruments for trading purposes. See “Critical Accounting Policies and Estimates—Derivative Financial Instruments” and note 21 to our consolidated financial statements.
Excluding prepetition debt, as of December 31, 2009, we had $182.0 million of variable rate debt. A 1% increase in the average interest rate would increase future interest expense by approximately $1.8 million per year.
At December 31, 2009 we had one interest rate swap contract outstanding with $9.5 million of notional amount pertaining to EURO denominated debt fixed at 4.14%.
23
UNAUDITED PRO FORMA CONSOLIDATED FINANCIAL INFORMATION
The unaudited pro forma consolidated balance sheet and statement of operations of Cooper-Standard Holdings Inc. are presented for the year ended December 31, 2009 and apply Cooper-Standard Holdings Inc.’s accounting policies to the periods presented. As used herein, Predecessor refers to Cooper-Standard Holdings Inc. and all of its consolidated subsidiaries prior to the Emergence Date and Successor refers to Cooper-Standard Holdings Inc. and all of its consolidated subsidiaries on and after the Emergence Date. We prepared the following unaudited pro forma consolidated financial information by applying adjustments to the historical audited consolidated financial statements of Cooper-Standard Holdings Inc. included elsewhere herein. The unaudited pro forma financial information gives effect to the Plan of Reorganization and “fresh-start” accounting as if the Emergence Date had occurred on January 1, 2009 for the unaudited pro forma consolidated statement of operations and on December 31, 2009 for the unaudited pro forma consolidated balance sheet. The unaudited pro forma consolidated financial information should be read in conjunction with Cooper-Standard Holdings Inc.’s audited consolidated financial statements and related notes as of and for the year ended December 31, 2009, which are not included herein.
The unaudited pro forma consolidated financial information is presented for informational purposes only. The unaudited pro forma consolidated financial information is not necessarily indicative of what our financial position or results of operations would have been if the effectiveness of the Plan of Reorganization had actually occurred on January 1, 2009 and is not necessarily indicative of our future financial position or results of operations. In addition, the historical financial statements of Cooper-Standard Holdings Inc. will not be comparable to the financial statements of Cooper-Standard Holdings Inc. following emergence from bankruptcy due to the effects of the consummation of the Plan of Reorganization as well as adjustments for “fresh-start” accounting. In addition, the amount of new stockholders’ equity in the unaudited pro forma consolidated balance sheet is not an estimate of the market value of the new common stock or new preferred stock as of the Emergence Date or at any other time. We make no representations as to the market value, if any, of the new common stock or new preferred stock.
The following unaudited pro forma financial information adjusts historical information for the effects of:
| • | the Plan of Reorganization, which includes the Reorganization Adjustments; and |
| • | the estimated adjustments required under “fresh-start” accounting for entities emerging from the Bankruptcy Cases (classified as “Fresh-Start Adjustments” in the unaudited pro forma consolidated financial information). |
Reorganization Adjustments
The unaudited pro forma consolidated financial information gives effect to the following Reorganization Adjustments, the Plan of Reorganization and the implementation of the transactions contemplated by the Plan of Reorganization. These adjustments give effect to the terms of the Plan of Reorganization and certain underlying assumptions, which include, but are not limited to, the below.
| • | New debt proceeds of $450.0 million. |
24
| • | The issuance of 17.5 million shares of new common stock, including 8.6 million shares offered to holders of Senior Subordinated Notes in connection with the Rights Offering, 2.6 million shares to the Backstop Parties pursuant to the Equity Commitment Agreement and 6.3 million shares to certain holders of Senior Notes and Senior Subordinated Notes. The Company will also issue shares of new preferred stock convertible into 4.3 million shares of new common stock pursuant to the Equity Commitment Agreement. The Company will receive cash proceeds of $355 million in connection with the Rights Offering and Equity Commitment Agreement and will also receive the full and complete satisfaction, settlement and release of allowed senior note claims and allowed senior subordinated note claims for such shares. In addition, the Company also will issue new warrants to purchase 2.4 million shares of new common stock. |
| • | The repayment of $175.0 million of liabilities under the DIP Credit Agreement. On the Emergence Date, each holder of an allowed DIP claim will receive, in full and complete satisfaction, settlement and release of and in exchange for such allowed claim against the Debtors, an amount in cash equal to the allowed amount of such claim. |
| • | The repayment of the $647.9 million outstanding under the Prepetition Credit Agreement. |
| • | The repayment of the $102.2 million outstanding of the Senior Notes in cash. |
| • | A decrease in interest expense, including the amortization of debt issuance costs, resulting from a lower level of debt. |
Fresh-Start Adjustments
The unaudited pro forma consolidated financial information also gives effect to the following Fresh-Start Adjustments relating to the preliminary application of “fresh-start” accounting pursuant to U.S. GAAP. Under “fresh-start” accounting, reorganization value represents the fair value of the entity before considering debt and approximates the amount a willing buyer would pay for the assets of the entity immediately after the reorganization. The pro forma adjustments are based on an assumed reorganization value of $1,075 million (excluding cash) for (i) differences in assumed working capital as of the Emergence Date and actual working capital as reported at the balance sheet date and (ii) the inclusion of a deferred tax liability at nominal value.
Reorganization values and the fair values of assets and liabilities, including leases, on the pro forma balance sheet are preliminary values as of December 31, 2009, have been made solely for purposes of developing the unaudited pro forma consolidated financial information, and are subject to further revisions and adjustments. Updates to such preliminary valuations will be completed as of the Emergence Date and, to the extent such updates reflect a valuation different than those used in the unaudited pro forma consolidated financial information, there may be adjustments in the carrying values of certain assets and liabilities and related deferred taxes. To the extent actual valuations may differ from those used in preparing the unaudited pro forma consolidated financial information, these differences will be reflected on our balance sheet upon emergence under “fresh-start” accounting and may also affect the revenues and expenses, which would be recognized in the statement of operations post-emergence from bankruptcy. As such, the following unaudited pro forma consolidated financial information is not intended to represent the actual post-emergence financial condition and statement of operations of Cooper-Standard Holdings Inc., and any differences could be material.
25
UNAUDITED PRO FORMA CONSOLIDATED STATEMENT OF OPERATIONS
For the year ended December 31, 2009
(dollars in millions)
| Historical | Reorganization and Pro Forma Adjustments |
Pro Forma | ||||||||||
| Sales |
$ | 1,945.3 | $ | — | $ | 1,945.3 | ||||||
| Cost of products sold |
1,679.0 | 11.5 | (a) | 1,690.5 | ||||||||
| Gross profit |
266.3 | (11.5 | ) | 254.8 | ||||||||
| Selling, administration & engineering expenses |
199.5 | (0.2 | )(b) | 199.3 | ||||||||
| Amortization of intangibles |
15.0 | (4.5 | )(c) | 10.5 | ||||||||
| Impairment charges |
363.5 | — | (d) | 363.5 | ||||||||
| Restructuring |
32.4 | — | 32.4 | |||||||||
| Operating loss |
(344.1 | ) | (6.8 | ) | (350.9 | ) | ||||||
| Interest expense, net of interest income |
(64.3 | ) | 18.6 | (e) | (45.7 | ) | ||||||
| Equity earnings |
4.0 | (1.5 | )(f) | 2.5 | ||||||||
| Reorganization items, net |
(17.4 | ) | 17.4 | (g) | — | |||||||
| Other income |
9.9 | 2.4 | (h) | 12.3 | ||||||||
| Loss before income taxes |
(411.9 | ) | 30.1 | (381.8 | ) | |||||||
| Provision for income tax benefit |
(55.7 | ) | (1.2 | )(i) | (56.9 | ) | ||||||
| Net loss |
(356.2 | ) | 31.3 | (324.9 | ) | |||||||
| Less: Net income attributed to noncontrolling interest |
0.1 | — | 0.1 | |||||||||
| Net loss attributable to Cooper-Standard Holdings Inc. |
$ | (356.1 | ) | $ | 31.3 | $ | (324.8 | ) | ||||
See accompanying notes to the unaudited pro forma consolidated financial statements.
26
UNAUDITED PRO FORMA CONSOLIDATED BALANCE SHEET
As of December 31, 2009
(dollars in millions)
| Historical | Reorganization Adjustments |
Fresh-Start Adjustments |
Pro Forma | ||||||||||||
| Assets |
|||||||||||||||
| Current assets: |
|||||||||||||||
| Cash and cash equivalents |
$ | 380.3 | $ | (195.5 | )(j) | $ | — | $ | 184.8 | ||||||
| Accounts receivable, net |
355.5 | — | — | 355.5 | |||||||||||
| Inventories, net |
111.6 | — | 7.0 | (q) | 118.6 | ||||||||||
| Prepaid expenses |
22.2 | — | — | 22.2 | |||||||||||
| Other |
76.4 | — | — | 76.4 | |||||||||||
| Total current assets |
946.0 | (195.5 | ) | 7.0 | 757.5 | ||||||||||
| Property, plant, & equipment, net |
586.2 | — | 60.5 | (r) | 646.7 | ||||||||||
| Intangibles, net |
98.2 | — | 138.8 | (s) | 237.0 | ||||||||||
| Other assets |
107.0 | (7.6 | )(k) | 14.5 | (t) | 113.9 | |||||||||
| $ | 1,737.4 | $ | (203.1 | ) | $ | 220.8 | $ | 1,755.1 | |||||||
| Liabilities and Equity (Deficit) |
|||||||||||||||
| Current liabilities: |
|||||||||||||||
| Debt payable within one year |
$ | 18.2 | $ | — | $ | — | $ | 18.2 | |||||||
| Debtor-in-possession financing |
175.0 | (175.0 | )(l) | — | — | ||||||||||
| Accounts payable |
166.3 | 47.6 | (m) | — | 213.9 | ||||||||||
| Payroll liabilities |
71.5 | — | — | 71.5 | |||||||||||
| Accrued liabilities |
87.1 | 0.5 | (n) | — | 87.6 | ||||||||||
| Total current liabilities |
518.1 | (126.9 | ) | — | 391.2 | ||||||||||
| Long-term debt |
11.1 | 450.0 | — | 461.1 | |||||||||||
| Pension benefits |
148.9 | — | — | 148.9 | |||||||||||
| Postretirement benefits other than pensions |
76.3 | — | — | 76.3 | |||||||||||
| Deferred tax liabilities |
7.9 | 33.6 | (u) | 41.5 | |||||||||||
| Other long-term liabilities |
19.7 | 20.7 | (n) | — | 40.4 | ||||||||||
| Liabilities subject to compromise |
1,261.9 | (1,261.9 | )(n) | — | — | ||||||||||
| Total liabilities |
2,043.9 | (918.1 | ) | 33.6 | 1,159.4 | ||||||||||
| Stockholders’ equity (deficit) |
|||||||||||||||
| Common stock, old |
— | – | — | — | |||||||||||
| Additional paid-in capital |
356.3 | (356.3 | )(o) | — | |||||||||||
| Accumulated deficit |
(636.3 | ) | 480.1 | (o) | 156.2 | (o) | — | ||||||||
| Accumulated other comprehensive loss |
(31.0 | ) | — | 31.0 | (o) | — | |||||||||
| Total Predecessor equity (deficit) |
(311.0 | ) | 123.8 | 187.2 | — | ||||||||||
| Total Successor equity |
— | 591.2 | (p) | — | 591.2 | ||||||||||
| Noncontrolling interests |
4.5 | — | — | 4.5 | |||||||||||
| Total equity (deficit) |
(306.5 | ) | 715.0 | 187.2 | 595.7 | ||||||||||
| Total liabilities and equity (deficit) |
$ | 1,737.4 | $ | (203.1 | ) | $ | 220.8 | $ | 1,755.1 | ||||||
See accompanying notes to the unaudited pro forma consolidated financial statements.
27
NOTES TO THE UNAUDITED PRO FORMA CONSOLIDATED FINANCIAL STATEMENTS
1. Basis of Presentation
The unaudited pro forma consolidated balance sheet and statement of operations of the Successor are presented for the year ended December 31, 2009 and apply the Predecessor’s accounting policies to the periods presented. We prepared the following unaudited pro forma consolidated financial information by applying adjustments to our historical consolidated financial statements. These adjustments give effect to the Plan of Reorganization and fresh-start accounting guidance pursuant to U.S. GAAP, reflecting the Successor’s post-emergence balance sheet as if the Emergence Date had occurred on January 1, 2009 for the period presented for the unaudited pro forma consolidated statement of operations and on December 31, 2009 for the unaudited pro forma consolidated balance sheet.
2. Notes to Unaudited Pro Forma Consolidated Statement of Operations
Reorganization and Pro Forma Adjustments
(a) Adjust cost of sales for the following items (dollars in millions):
| Adjust inventory to fair value |
$ | 7.0 | ||
| Adjust depreciation expense based on preliminary application of fresh-start accounting |
6.1 | |||
| Eliminate net hedging losses pursuant to settlement of hedges upon Emergence Date |
(1.6 | ) | ||
| $ | 11.5 | |||
(b) Adjust selling, administration, and engineering expenses for the following items (dollars in millions):
| Eliminate bankruptcy related professional fees incurred in 2009 before bankruptcy filing |
$ | (7.7 | ) | |
| Eliminate stock compensation expense related to Predecessor equity |
(1.4 | ) | ||
| Record stock compensation expense related to Successor equity |
8.9 | |||
| $ | (0.2 | ) | ||
(c) Adjust amortization expense based on preliminary application of fresh-start accounting. Total pro forma intangible amortization of $10.5 million is summarized as follows (dollars in millions):
| Customer contracts and relationships |
$ | 8.7 | |
| Technology |
1.6 | ||
| Other |
0.2 | ||
| $ | 10.5 | ||
(d) Although fresh-start accounting will result in an adjustment to the historical cost basis of our assets, the goodwill impairment charge of $157.2 million, impairment charge of $202.4 million related to certain intangible assets and $3.9 million related to certain fixed assets were not adjusted.
28
NOTES TO THE UNAUDITED PRO FORMA CONSOLIDATED FINANCIAL STATEMENTS—(Continued)
(e) Reflect interest expense and amortization of debt issuance costs on new debt, and the elimination of interest expense and amortization of debt issuance costs on old debt (dollars in millions):
| Eliminate historical interest expense |
$ | (64.3 | ) | |
| Add new interest on the following debt: |
||||
| Interest on new debt |
40.5 | |||
| Amortization of debt issuance costs |
2.8 | |||
| Interest on other debt |
2.4 | |||
| Net reduction in interest expense |
$ | (18.6 | ) | |
A 0.25% increase or decrease in the effective interest rate used above would increase or decrease the pro forma interest expense by $1.2 million for the year ended December 31, 2009.
(f) Amortization for the fair value adjustment on equity investment.
(g) Eliminate reorganization items incurred after filing for bankruptcy in 2009.
(h) Eliminate losses on interest rate swaps recorded in 2009 to reflect the settlement of these instruments upon emergence.
(i) Reflect the change in the estimated total income tax provision through reorganization and pro forma adjustments using expected country specific effective income tax rate. No income tax provision adjustment was made on the portion of the pre-tax adjustments attributable to operations with anticipated valuation allowances.
3. Notes to Unaudited Pro Forma Consolidated Balance Sheet
Reorganization Adjustments
(j) Reflects a decrease in cash and cash equivalents to give effect to transactions pursuant to the Plan of Reorganization, including the proceeds from the new debt, issuance of the new common stock and payments for the discharge of debt and other liabilities subject to compromise.
| (dollars in millions) | ||||
| Sources of funds: |
||||
| Proceeds from new debt |
$ | 450.0 | ||
| Proceeds from issuance of new preferred stock |
100.0 | |||
| Proceeds from issuance of new common stock, net of issuance costs of $12.4 million |
242.6 | |||
| Release of cash collateral for letters of credit and other cash deposits |
11.6 | |||
| Total sources of funds |
$ | 804.2 | ||
| Uses of funds: |
||||
| Payments to DIP lenders |
(175.0 | ) | ||
| Payments to Prepetition Credit Agreement lenders |
(647.9 | ) | ||
| Payments to holders of Senior Notes |
(102.2 | ) | ||
| Payments for settlement of prepetition claims |
(22.0 | ) | ||
| Debt issuance costs |
(14.1 | ) | ||
| Professional fees |
(34.5 | ) | ||
| Management Employee Incentive Plan |
(4.0 | ) | ||
| Total uses of funds |
(999.7 | ) | ||
| Net change in funds |
$ | (195.5 | ) | |
29
NOTES TO THE UNAUDITED PRO FORMA CONSOLIDATED FINANCIAL STATEMENTS—(Continued)
(k) Adjustments reflect a decrease in other assets to give effect to transactions pursuant to the Plan of Reorganization (dollars in millions):
| Debt issuance costs related to new exit financing (including $3.0 million of estimated professional fees) |
$ | 17.1 | ||
| Debt issuance costs related to DIP financing |
(13.1 | ) | ||
| Release of cash collateral for letters of credit and other cash deposits |
(11.6 | ) | ||
| $ | (7.6 | ) | ||
(l) Reflect repayment of borrowings under the DIP Credit Agreement on Emergence Date.
(m) Adjustments reflect the following: (i) the reclassification of $69.7 million from liabilities subject to compromise to accounts payable related to the Cooper Tire settlement, offset by (ii) the settlement of $10.4 million related to priority claims, administrative claims and miscellaneous secured claims and payment of $11.7 million for accrued professional fees.
(n) Record the discharge of liabilities subject to compromise. Detail of liability subject to compromise is as follows (dollars in millions):
| Detail of liabilities subject to compromise |
|||
| Borrowings under the Prepetition Credit Agreement(1) |
$ | 607.8 | |
| Senior Notes(1) |
206.2 | ||
| Senior Subordinated Notes(1) |
324.6 | ||
| General unsecured claims |
11.6 | ||
| Other payables |
69.7 | ||
| Derivatives and swaps |
20.8 | ||
| Pension, deferred compensation and severance liabilities |
20.7 | ||
| Other accrued liabilities |
0.5 | ||
| $ | 1,261.9 | ||
| (1) | Includes interest accrued and unpaid prior to the bankruptcy filing and unamortized debt issuance costs. |
(o) Reflects elimination of pre-emergence equity accounts and accumulated deficit under the Plan of Reorganization and accumulated other comprehensive loss under fresh-start accounting.
(p) Reflects the par value and additional paid in capital consisting of (dollars in millions):
| Issuance of 1.0 million shares of new preferred stock |
$ | 128.0 | |
| Issuance of 17.5 million shares of new common stock |
442.1 | ||
| Issuance of 2.4 million new warrants |
21.1 | ||
| $ | 591.2 | ||
(q) Adjust inventories to reflect preliminary fair value adjustments. Inventories were recorded at fair value which is estimated for finished goods and work-in-process based upon the expected selling price less costs to complete, selling and disposal costs and a normal profit to the buyer. Raw material inventory was recorded at carrying value as such value approximates the replacement cost.
30
NOTES TO THE UNAUDITED PRO FORMA CONSOLIDATED FINANCIAL STATEMENTS—(Continued)
(r) Adjust property, plant and equipment to fair value based on preliminary results of valuation procedures. The actual adjustment under fresh-start accounting as updated by our final valuation procedures as of the Emergence Date could differ materially from this estimate.
(s) Resulting intangible assets of $237.0 million is the excess of reorganization value over the fair value of estimated net assets (dollars in millions):
| Total anticipated enterprise value (net of cash) |
$ | 1,025.0 | ||
| Assumed cash balance at Emergence Date |
50.0 | |||
| $ | 1,075.0 | |||
| Amounts allocable to fair values under fresh-start accounting: |
||||
| Cash and cash equivalents |
184.8 | |||
| Accounts receivable, net |
355.5 | |||
| Inventories, net |
118.6 | |||
| Prepaid expenses |
22.2 | |||
| Other |
76.4 | |||
| Property, plant and equipment, net |
646.7 | |||
| Other assets |
113.9 | |||
| Accounts payable |
(213.9 | ) | ||
| Payroll liabilities |
(71.5 | ) | ||
| Accrued liabilities |
(87.6 | ) | ||
| Pension benefits |
(148.9 | ) | ||
| Postretirement benefits other than pensions |
(76.3 | ) | ||
| Deferred tax liabilities |
(41.5 | ) | ||
| Other long-term liabilities |
(40.4 | ) | ||
| New intangible assets |
$ | 237.0 | ||
(t) Adjust equity investment to reflect fair value adjustments.
(u) Record an estimated net deferred tax liability to reflect the impact of fresh-start accounting.
31
Legal Proceedings
We are periodically involved in claims, litigation and various legal matters that arise in the ordinary course of business. In addition, we conduct and monitor environmental investigations and remedial actions at certain locations. Each of these matters is subject to various uncertainties, and some of these matters may be resolved unfavorably for us. A reserve estimate is established for each matter and updated as additional information becomes available. We do not believe that the ultimate resolution of any of these matters will have a material adverse effect on our business, financial condition or results of operations.
On August 3, 2009, the Debtors filed the Chapter 11 Cases and on August 4, 2009, CSA Canada commenced the Canadian Proceedings. At this time, it is not possible to predict the outcome of the Chapter 11 Cases or the effect on our business of the Chapter 11 Cases or the Canadian Proceedings. The plan of arrangement or compromise of CSA Canada was sanctioned by the Canadian Court on April 16, 2010, but its effectiveness remains subject to certain conditions, including the consummation of the Plan of Reorganization.
In general, all pending litigation involving the Debtors and CSA Canada was stayed upon the filing of the Chapter 11 Cases and the Canadian Proceedings, respectively.
Parent, CSA U.S. and CSA Canada (collectively, the “Defendants”) were named as defendants in an adversary proceeding (Case No. 09-52014 (PJW)) initiated by Cooper Tire & Rubber Company and Cooper Tire Rubber & Company UK Limited (together, “CTR”) in the Bankruptcy Court on August 19, 2009 (the “CTR Adversary Proceeding”). CTR’s complaint had sought a declaratory judgment that CTR was entitled to a portion of the CAD$80 million tax refund received by CSA Canada from the Canadian government on July 27, 2009 and a portion of all future refunds received by CSA Canada, in each case relating to the period prior to the Company’s 2004 Acquisition. CTR also sought imposition of a resulting trust or, in the alternative, a constructive trust in favor of CTR and turnover of the portion of the Canadian income tax refunds attributable to the years 2000 through 2004. On September 29, 2009, the Canadian Court issued an order lifting the stay in the Canadian Proceedings to allow CTR to commence proceedings against CSA Canada in the Chapter 11 Cases and ordering all income tax refunds received by CSA Canada after September 29, 2009 be segregated immediately upon receipt and not disbursed, encumbered or otherwise dealt with in any way until further order of the Canadian Court. On October 5, 2009, CTR filed an amended complaint in the adversary proceeding against Parent, CSA U.S. and CSA Canada. In connection with the CTR Adversary Proceedings, the Defendants, CTR and the Creditors’ Committee entered into an Agreement Concerning Terms and Conditions of a Compromise and Settlement, dated March 17, 2010 (the “CTR Settlement Agreement”). Under the terms of the CTR Settlement Agreement, CTR agreed to, among other things, dismiss its complaint in the Bankruptcy Court with prejudice and claim no further entitlement to the tax refunds. The Defendants agreed to, among other things, (i) pay CTR approximately $17.6 million in cash and (ii) to obtain a release of CTR’s obligations in connection with a guarantee of one of our leases or, alternatively, provide a letter of credit in favor of CTR, in the initial amount of $7 million (but declining by $1 million per year for seven years) to reimburse CTR for any amounts that it is required to pay our landlord on account of such guarantee. The Defendants and CTR have also granted general mutual releases to each other with respect to claims and liabilities under the purchase agreement governing the 2004 Acquisition and other claims and liabilities, subject to certain exceptions relating to certain continuing indemnification obligations. On April 15, 2010, the Bankruptcy Court issued an order approving the CTR Settlement Agreement. We estimate that the remaining tax refund to be received by CSA Canada is approximately $40.0 million. No assurance can be given, however, that this estimated tax refund will be received from the Canadian government or that if received that it will be for the full estimated amount of $40.0 million.
32