Attached files
| file | filename |
|---|---|
| EX-99.1 - EX-99.1 - WELLS FARGO & COMPANY/MN | f55553exv99w1.htm |
| 8-K - FORM 8-K - WELLS FARGO & COMPANY/MN | f55553e8vk.htm |
Exhibit 99.2

| 1Q10 Quarterly Supplement April 21, 2010 |

| Forward-looking statements and additional information Forward-looking statements: This Quarterly Supplement contains forward-looking statements about our future financial performance. These forward- looking statements include statements using words such as "believe," "expect," "anticipate," "estimate," "should," "may," "can," "will," "outlook," "appears" or similar expressions. Forward-looking statements in this Quarterly Supplement include, among others, statements about: expected or estimated future losses in our loan portfolios, including our belief that quarterly provision expense and quarterly total credit losses have peaked and are expected to decline; the future economic environment; reduction or mitigation of risk in our loan portfolios; potential sales of loan portfolios; future effects of loan modification programs; life-of-loan loss estimates; future recast risk in the Pick-a-Pay portfolio; and the amount and timing of expected cost savings and integration expenses relating to the Wachovia merger. Investors are urged to not unduly rely on forward-looking statements as actual results could differ materially from expectations. Forward-looking statements speak only as of the date made, and we do not undertake to update them to reflect changes or events that occur after that date. For more information about factors that could cause actual results to differ materially from expectations, refer to pages 16-17 of Wells Fargo's press release announcing our first quarter results, as well as Wells Fargo's reports filed with the Securities and Exchange Commission, including our Annual Report on Form 10-K for the year ended December 31, 2009, including the discussion under "Risk Factors" in that report. Purchased credit-impaired loan portfolio: Loans that were acquired from Wachovia that were considered credit impaired were written down at acquisition date in purchase accounting to an amount estimated to be collectible in accordance with FASB ASC 310-30 (formerly SOP 03- 3), and the related allowance for loan losses was not carried over to Wells Fargo's allowance. In addition, such purchased credit-impaired loans are not classified as nonaccrual or nonperforming, and are not included in loans that were contractually 90+ days past due and still accruing. Any losses on such loans are charged against the nonaccretable difference established in purchase accounting and are not reported as charge-offs (until such difference is fully utilized). As a result of accounting for purchased loans with evidence of credit deterioration, certain ratios of the combined company are not comparable to a portfolio that does not include purchased credit-impaired loans accounted for under FASB ASC 310-30. In certain cases, the purchased credit-impaired loans may affect portfolio credit ratios and trends. Management believes that the presentation of information adjusted to exclude the purchased credit-impaired loans provides useful disclosure regarding the credit quality of the non-impaired loan portfolio. Accordingly, certain of the loan balances and credit ratios in this Quarterly Supplement have been adjusted to exclude the purchased credit-impaired loans. References in this Quarterly Supplement to impaired loans mean the purchased credit-impaired loans. Please see pages 30-32 of the press release for additional information regarding the purchased credit-impaired loans. |

| Table of Contents 1Q10 Results 1Q10 Overview Page 3 1Q10 Overview: Strong earnings 4 Strong operating margins 5 Capital strength 6 Building the franchise 7 Retail bank sales and cross-sell metrics 8 Loans outstanding 9 Consumer loan portfolio risk reduction 10 Total core deposits 11 Noninterest expense 12 Community Banking 13 Wholesale Banking 14 Wealth, Brokerage and Retirement 15 FAS 167 period-end impact 16 Provision expense 17 Quarterly total credit losses 18 Consumer delinquency trends 19-20 Nonaccrual loan growth decelerating 21 PCI loan portfolio 22 Allowance for credit losses 23 Wachovia merger update 24 Appendix Pages 25-46 FAS 167 adoption 26 PCI loan portfolio update: Nonaccretable diff. 27 1Q10 PCI nonaccretable difference 28 1Q10 PCI accretable yield 29 1Q10 Credit quality highlights 30 Nonperforming assets 31 Nonaccrual loans 32 Net loan charge-offs 33 Commercial real estate loan portfolio 34 CRE loan portfolio by business group 35 CRE portfolio: Property type by business group 36 Wholesale Banking CRE loan portfolio 37 Pick-a-Pay mortgage portfolio 38 Pick-a-Pay credit highlights 39 Pick-a-Pay: Current-30 DPD roll rates 40 Pick-a-Pay nonaccrual loan composition 41 Pick-a-Pay loan modifications 42 Real estate 1-4 family first mortgage portfolio 43 Home equity portfolio 44 Credit card portfolio 45 Auto portfolio 46 Tier 1 common equity reconciliation 47 Tangible common equity reconciliation 48 |

| 1Q10 Overview Strong, broad-based earnings Net income of $2.5 billion, EPS of $0.45/share, after merger-related expense of $247 million after-tax ($0.05/share); all business segments contributed to earnings Continuing to build the franchise for long-term profitability Revenue of $21.4 billion, up 2% from 1Q09, on strong growth in trust and investment fees, insurance, debit cards, asset based lending, and processing and other fees Credit believed to have "turned the corner" Provision expense and net charge-offs down in 1Q10 Early stage delinquencies continued to decline across most major consumer portfolios Nonaccrual inflows declined in 1Q10 on declines in non-FAS 167 consumer real estate inflows and lower commercial and commercial real estate inflows; CRE inflows down 27% Continued to supply credit to the economy and working to keep homeowners in their homes $128 billion new credit supplied, over 520,000 (1) active trial and completed modifications Continued to build capital 7.1% Tier 1 common ratio (2) up 60 bps in the quarter, all internally generated 10.0% Tier 1 risk-based capital ratio up 70 bps in the quarter, all internally generated March 31, 2010 capital ratios are preliminary. (1) Active trial and completed modifications between January 2009 through March 31, 2010. (2) See table on page 47 for more information on Tier 1 common equity. |

| 1Q10 Overview: Strong earnings All business segments (2) contributed to 1Q10 earnings Community Banking = $1,455 million Wholesale Banking = $1,197 million Wealth, Brokerage and Retirement = $282 million (1) Included $1.9 billion upon redemption of TARP preferred stock in 4Q09. (2) Segment net income excludes Other net loss of $387 million in the quarter, which includes Wachovia integration expenses and the elimination of items that are included in both Community Banking and Wealth, Brokerage and Retirement relating primarily to wealth management customers serviced, and products sold, in the stores. |

| Strong operating margins (1) See table on page 48 for more information on tangible common equity. |

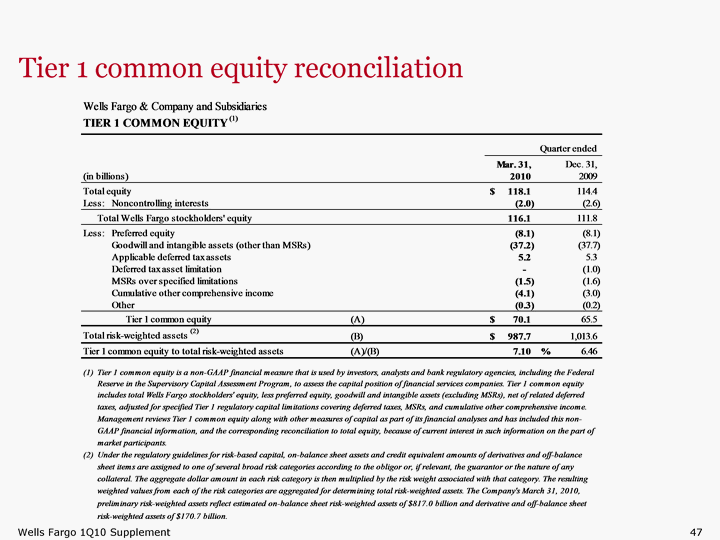
| Capital strength ($ in billions) 60 bps increase in Tier 1 common ratio in 1Q10, all internally generated Capital ratios now exceed strong pre-Wachovia, pre-TARP levels Adoption of FAS 167 increased common equity by $356 million: $183 million due to an increase to retained earnings and $173 million due to an increase to other comprehensive income Increased RWA by $6.4 billion on 1/1/2010 Less than 1 bp impact on Tier 1 common ratio Allowance for credit losses of $25.7 billion; in addition, $19.9 billion nonaccretable difference remaining to cover PCI portfolios 3/31/2010 capital ratios are preliminary. (1) See table on page 47 for more information on Tier 1 common equity. |

| Building the franchise ($ in millions) Revenue up 2% from 1Q09, despite a 7% decline in average loans, on growth in trust and investment fees, insurance, debit cards, asset based lending, and processing and other fees NIM up 11 bps on 14% growth in checking and savings Noninterest income up 7% from 1Q09 largely on growth in legacy Wells Fargo and Wachovia retail bank cross-sell and broad-based revenue increases including synergies from the merger Revenue +2% Revenue per $ Assets 12 bps |
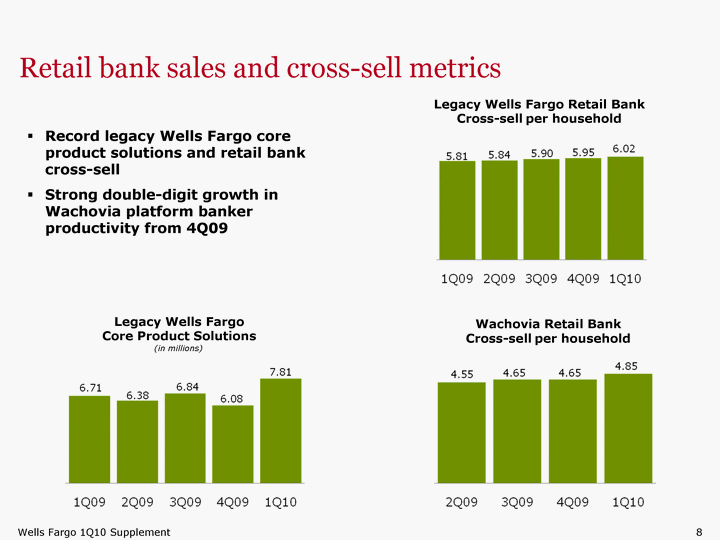
| Retail bank sales and cross-sell metrics Legacy Wells Fargo Core Product Solutions Legacy Wells Fargo Retail Bank Cross-sell per household Wachovia Retail Bank Cross-sell per household Record legacy Wells Fargo core product solutions and retail bank cross-sell Strong double-digit growth in Wachovia platform banker productivity from 4Q09 (in millions) |
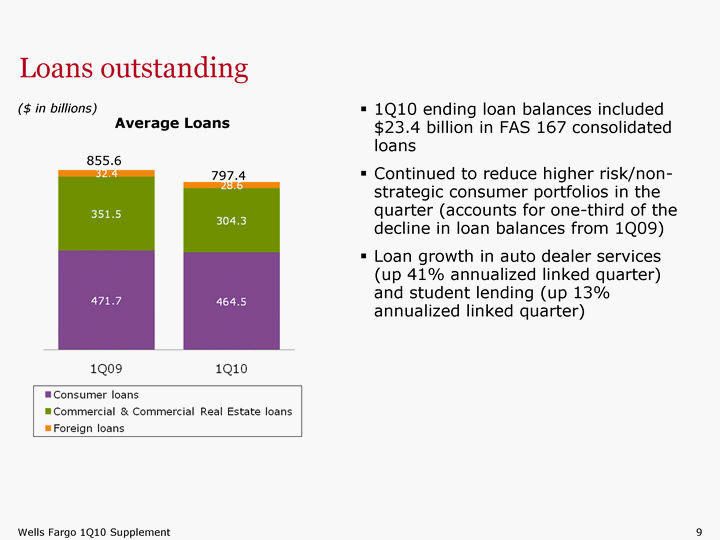
| Loans outstanding 1Q10 ending loan balances included $23.4 billion in FAS 167 consolidated loans Continued to reduce higher risk/non- strategic consumer portfolios in the quarter (accounts for one-third of the decline in loan balances from 1Q09) Loan growth in auto dealer services (up 41% annualized linked quarter) and student lending (up 13% annualized linked quarter) ($ in billions) ($ in billions) Average Loans 855.6 797.4 |

| Consumer loan portfolio risk reduction Non-strategic loan portfolio continued to decline as expected from paydowns, net charge-offs and sales Consumer non-strategic loans outstanding down $4.3 billion from 4Q09 and $23.2 billion since 4Q08 Additional opportunities to reduce risk pursued Sales of noncore, non-relationship loans Loan modifications Short sales in advance of foreclosure process (1) Net of purchase accounting adjustments related to the PCI loans and, for other loans, an adjustment to mark the loans to a market yield at date of merger and less any subsequent charge-offs. |

| Total core deposits Period-end checking and savings deposits up $68.5 billion, or 12%, from 1Q09 Lower rate checking and savings deposits account for 88% of core deposits at 1Q10, up from 79% at 1Q09 $3 billion of Wachovia's higher rate CDs matured in 1Q10 with better- than-expected retention Combined Regional Banking net checking accounts up Consumer checking accounts up a net 7.0% YoY California consumer checking accounts up a net 9.6% YoY New Jersey consumer checking accounts up a net 8.1% YoY Period-end balances. Core deposits are noninterest-bearing deposits, interest-bearing checking, savings certificates, market rate and other savings, and certain foreign deposits (Eurodollar sweep balances). ($ in billions) 756.1 756.2 |

| Noninterest expense Credit resolution costs (foreclosed asset expense, collections and workout personnel expense, and loan resolution costs) in 1Q10 were approximately $250 million higher than 1Q09 We continued to invest in our businesses for long term growth Regional Banking platform banker FTEs in the East up more than 300, or 4%, since 4Q09 Converted 1,225 ATMs to Envelope FreeSM webATM machines Opened 11 banking stores Over 200 retail brokerage financial advisor new hires in 1Q10 Commercial Banking East and Government and Institutional Banking hiring (88 hired over past year) Mortgage sales and fulfillment and relationship management tools and technology Integration costs expected to be approximately $2 billion in 2010; 70% of targeted consolidated savings realized in expense run-rate ($ in millions) 12,117 11,818 (1) Includes $77 million Wachovia and $128 million other integration expense. (1) |
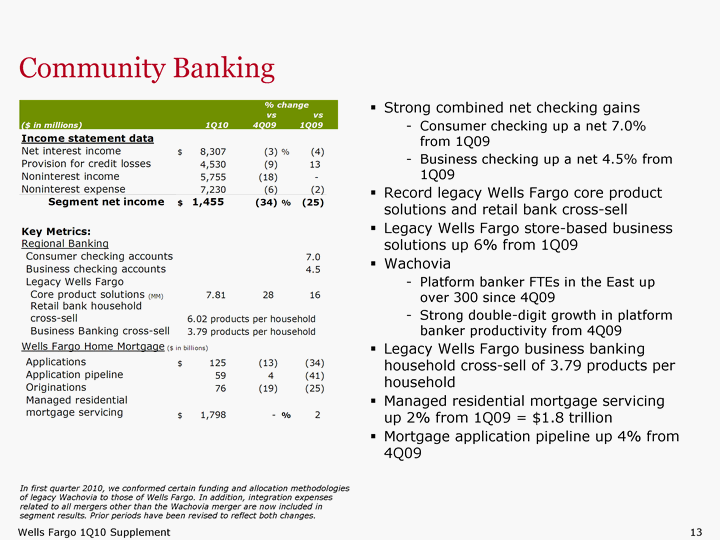
| Community Banking Strong combined net checking gains Consumer checking up a net 7.0% from 1Q09 Business checking up a net 4.5% from 1Q09 Record legacy Wells Fargo core product solutions and retail bank cross-sell Legacy Wells Fargo store-based business solutions up 6% from 1Q09 Wachovia Platform banker FTEs in the East up over 300 since 4Q09 Strong double-digit growth in platform banker productivity from 4Q09 Legacy Wells Fargo business banking household cross-sell of 3.79 products per household Managed residential mortgage servicing up 2% from 1Q09 = $1.8 trillion Mortgage application pipeline up 4% from 4Q09 In first quarter 2010, we conformed certain funding and allocation methodologies of legacy Wachovia to those of Wells Fargo. In addition, integration expenses related to all mergers other than the Wachovia merger are now included in segment results. Prior periods have been revised to reflect both changes. |
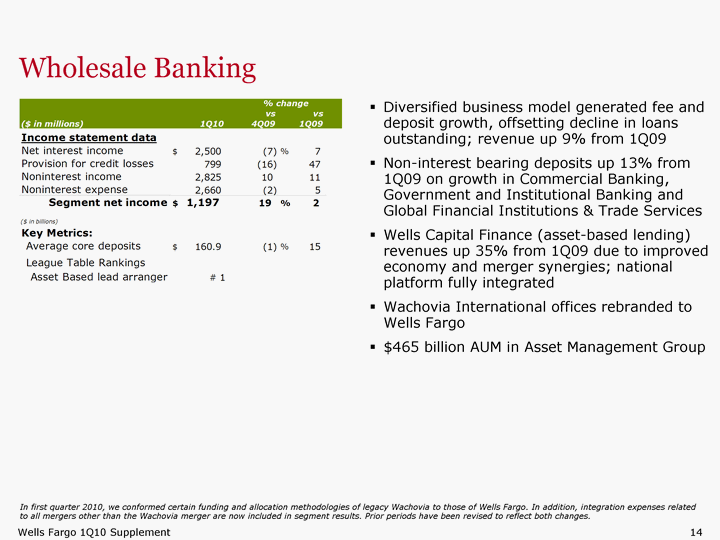
| Wholesale Banking Diversified business model generated fee and deposit growth, offsetting decline in loans outstanding; revenue up 9% from 1Q09 Non-interest bearing deposits up 13% from 1Q09 on growth in Commercial Banking, Government and Institutional Banking and Global Financial Institutions & Trade Services Wells Capital Finance (asset-based lending) revenues up 35% from 1Q09 due to improved economy and merger synergies; national platform fully integrated Wachovia International offices rebranded to Wells Fargo $465 billion AUM in Asset Management Group In first quarter 2010, we conformed certain funding and allocation methodologies of legacy Wachovia to those of Wells Fargo. In addition, integration expenses related to all mergers other than the Wachovia merger are now included in segment results. Prior periods have been revised to reflect both changes. |

| Wealth, Brokerage and Retirement $1.1 trillion retail brokerage client assets, up 22% from 1Q09 Revenue up 10% from 4Q09 and up 16% from 1Q09 on asset based fees and increased brokerage transaction activity Wealth, Brokerage and Retirement client assets up 21% from 1Q09 Managed account assets up 47% from 1Q09 on the market recovery and strong net flows Solid financial advisor recruiting during the quarter, as brokers who have joined the firm were two times more productive than those who have left the firm Institutional retirement plan assets up 35% from 1Q09 on the market recovery and new business gains In first quarter 2010, we conformed certain funding and allocation methodologies of legacy Wachovia to those of Wells Fargo. In addition, integration expenses related to all mergers other than the Wachovia merger are now included in segment results. Prior periods have been revised to reflect both changes. |

| FAS 167 period-end effect on loans and credit performance (1) Period-end loans do not include related allowance for credit losses and VIE loans that were consolidated prior to FAS 167 adoption. |

| Provision expense believed to have peaked ($ in millions) Total Provision Expense 5,913 6,111 5,086 4,558 Provision expense declined $781 million from 3Q09, and declined $583 million from 4Q09 and is currently expected to decline over the balance of 2010 Net charge-offs believed to have peaked in 4Q09 1Q10 charge-offs included $145 million related to newly issued regulatory charge- off guidance applicable to collateral- dependent residential real estate loan modifications and $123 million from FAS 167 consolidated loans 5,330 145 123 FAS 167 Collateral-dependent modified loans |

| Quarterly total credit losses believed to have peaked in 4Q09 Commercial and commercial real estate losses declined $356 million with decreases in all loan categories All other consumer losses were relatively flat |

| 19 Consumer delinquency trends improving in major consumer loan categories PCI adjustment on the Wachovia portfolio |

| Pick-a-Pay non-impaired and PCI portfolios continued to perform better than original expectations Pick-a-Pay Non-impaired (Non-PCI) Current To 30 Days Pick-a-Pay Impaired (PCI) Current To 30 Days Early stage delinquencies continue to show stabilization Although 150 plus delinquents continue to increase as a result of foreclosure moratoriums and modification programs, the loans have been written down to net realizable value or evaluated through the allowance for loan losses Roll rates from current to 30+ DPD continued to improve in 1Q10 (See page 40) |

| Nonaccrual loan growth decelerating Increase in nonaccruals driven by consumer real estate and commercial real estate mortgage; all other consumer and commercial portfolios showed relatively flat to declining NPLs New inflows declined in 1Q10 Non-FAS 167 consumer real estate inflows declined Total commercial and commercial real estate inflows declined CRE inflows down 27% Outflows taking longer to be realized largely due to the need and desirability to work through the consumer loan modification process before foreclosing and the potential economic benefits of working with our commercial customers rather than foreclose Increasing percentage of nonaccruals have had the loss content recognized Over 45% of commercial and commercial real estate nonaccruals are currently paying interest that is applied to principal; 29% of commercial and commercial real estate nonaccruals already written down 37% of consumer nonaccrual loans have already been written down Approximately two-thirds of consumer nonaccrual loans either have had losses taken and/or CLTV ^ 80% |
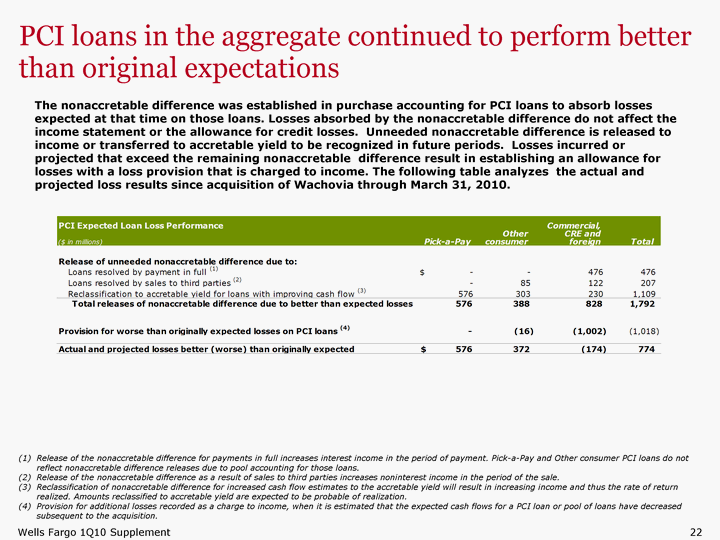
| PCI loans in the aggregate continued to perform better than original expectations (1) Release of the nonaccretable difference for payments in full increases interest income in the period of payment. Pick-a-Pay and Other consumer PCI loans do not reflect nonaccretable difference releases due to pool accounting for those loans. (2) Release of the nonaccretable difference as a result of sales to third parties increases noninterest income in the period of the sale. (3) Reclassification of nonaccretable difference for increased cash flow estimates to the accretable yield will result in increasing income and thus the rate of return realized. Amounts reclassified to accretable yield are expected to be probable of realization. (4) Provision for additional losses recorded as a charge to income, when it is estimated that the expected cash flows for a PCI loan or pool of loans have decreased subsequent to the acquisition. The nonaccretable difference was established in purchase accounting for PCI loans to absorb losses expected at that time on those loans. Losses absorbed by the nonaccretable difference do not affect the income statement or the allowance for credit losses. Unneeded nonaccretable difference is released to income or transferred to accretable yield to be recognized in future periods. Losses incurred or projected that exceed the remaining nonaccretable difference result in establishing an allowance for losses with a loss provision that is charged to income. The following table analyzes the actual and projected loss results since acquisition of Wachovia through March 31, 2010. |

| Allowance for credit losses Allowance for credit losses of $25.7 billion up $3.9 billion from close of Wachovia merger; includes $594 million in reserves from FAS 167 consolidated loans 94% of nonaccrual loans 4.8x quarterly net charge-offs Remaining $19.9 billion nonaccretable difference for PCI loan portfolios separate from allowance Allowance based on management's estimate of inherent losses in the loan portfolio at 3/31/10 Reflects estimated impact of recent regulatory guidance based on available information (1) Includes purchased credit-impaired Wachovia loans of $58.2 billion in 1Q09, $55.2 billion in 2Q09, $54.3 billion in 3Q09, $51.7 billion in 4Q09, and $49.5 billion in 1Q10 and $247 million in allowance associated with purchased credit-impaired loans in 1Q10. Allowance for credit losses as a percentage of total loans (1) 3.20% 3.28% 3.07% 2.86% 2.71% ($ in millions) |

| Wachovia merger update Delivering on the promise Initiative Original Expectation 1Q10 Update Credit Costs $40 billion of estimated purchase accounting life-of-loan losses In line with expectations Annual Expense Savings $5 billion Re-confirmed, full run rate expected in 2011 Merger Costs $7.9 billion Expected to be approximately $5 billion Approximately $2 billion expected to be expensed in 2010 Wachovia Deposit Run-Off 21% deposit run-off in 2009 Better deposit retention and spreads than modeled with better than expected deposit mix (more DDA) Revenue Synergies None assumed in acquisition pricing Revenue synergies observed, with significant incremental business opportunities Risk Reduction Exiting non-strategic businesses Reduced structured products exposure, proprietary trading positions and other higher risk securities Loan portfolio risk reduction Pick-a-Pay portfolio reduced by $12.4 billion since 12/31/08 (included within $23.2 billion decline in non-strategic consumer loan outstandings (1) from 12/31/08) (1) Includes Pick-a-Pay mortgage, liquidating home equity and legacy WFF indirect auto. |

| Appendix |
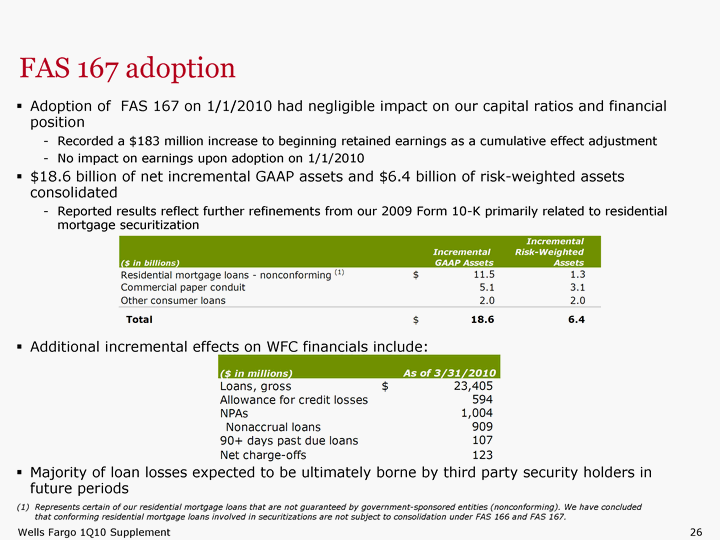
| Adoption of FAS 167 on 1/1/2010 had negligible impact on our capital ratios and financial position Recorded a $183 million increase to beginning retained earnings as a cumulative effect adjustment No impact on earnings upon adoption on 1/1/2010 $18.6 billion of net incremental GAAP assets and $6.4 billion of risk-weighted assets consolidated Reported results reflect further refinements from our 2009 Form 10-K primarily related to residential mortgage securitization Additional incremental effects on WFC financials include: Majority of loan losses expected to be ultimately borne by third party security holders in future periods FAS 167 adoption Represents certain of our residential mortgage loans that are not guaranteed by government-sponsored entities (nonconforming). We have concluded that conforming residential mortgage loans involved in securitizations are not subject to consolidation under FAS 166 and FAS 167. |

| Purchase credit-impaired (PCI) loan portfolio update Nonaccretable difference $96.2 billion of Wachovia purchased credit-impaired loans at 12/31/08 with $40.9 billion life-of-loan purchase accounting marks $20.1 billion of Wachovia nonaccrual loans eliminated at 12/31/08 through purchase accounting Pick-a-Pay PCI portfolio continued to perform better than originally expected at time of merger; $576 million reclassified to accretable yield since 12/31/08 Non Pick-a-Pay PCI loans tracking with original expectations at time of merger Nonaccretable difference established in purchase accounting for PCI loans absorbs losses otherwise recorded as charge-offs (1) Release of the nonaccretable difference for payments in full increases interest income in the period of payment. Pick-a-Pay and Other consumer PCI loans do not reflect nonaccretable difference releases due to pool accounting for those loans. (2) Release of the nonaccretable difference as a result of sales to third parties increases noninterest income in the period of the sale. (3) Reclassification of nonaccretable difference for increased cash flow estimates to the accretable yield will result in increasing income and thus the rate of return realized. Amounts reclassified to accretable yield are expected to be probable of realization. (4) Write-downs to net realizable value of PCI loans are charged to the nonaccretable difference when severe delinquency (normally 180 days) or other indications of severe borrower financial stress exist that indicate there will be a loss upon final resolution of the loan. |

| 1Q10 PCI nonaccretable difference (1) Release of the nonaccretable difference for payments in full increases interest income in the period of payment. Pick-a-Pay and Other consumer PCI loans do not reflect nonaccretable difference releases due to pool accounting for those loans. (2) Release of the nonaccretable difference as a result of sales to third parties increases noninterest income in the period of the sale. (3) Reclassification of nonaccretable difference for increased cash flow estimates to the accretable yield will result in increasing income and thus the rate of return realized. Amounts reclassified to accretable yield are expected to be probable of realization. (4) Write-downs to net realizable value of PCI loans are charged to the nonaccretable difference when severe delinquency (normally 180 days) or other indications of severe borrower financial stress exist that indicate there will be a loss upon final resolution of the loan. $668 million reclassified to accretable yield for loans with improving cash flows reflecting better than expected performance, including $549 million from the Pick-a-Pay PCI portfolio |
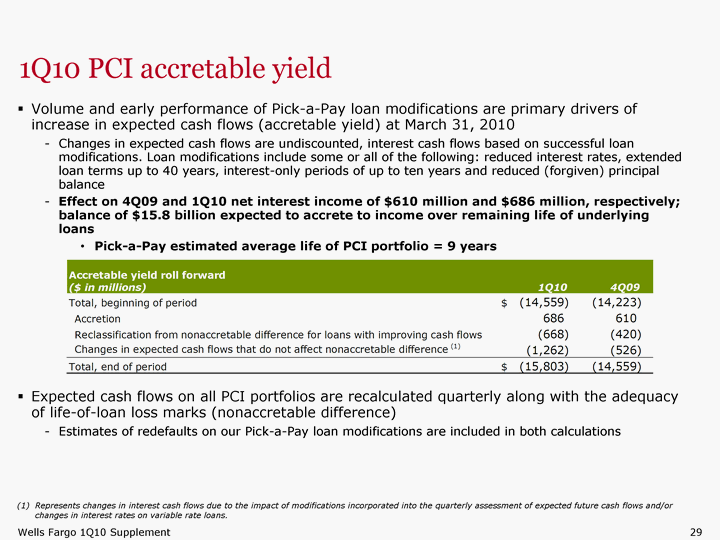
| 1Q10 PCI accretable yield Volume and early performance of Pick-a-Pay loan modifications are primary drivers of increase in expected cash flows (accretable yield) at March 31, 2010 Changes in expected cash flows are undiscounted, interest cash flows based on successful loan modifications. Loan modifications include some or all of the following: reduced interest rates, extended loan terms up to 40 years, interest-only periods of up to ten years and reduced (forgiven) principal balance Effect on 4Q09 and 1Q10 net interest income of $610 million and $686 million, respectively; balance of $15.8 billion expected to accrete to income over remaining life of underlying loans Pick-a-Pay estimated average life of PCI portfolio = 9 years Expected cash flows on all PCI portfolios are recalculated quarterly along with the adequacy of life-of-loan loss marks (nonaccretable difference) Estimates of redefaults on our Pick-a-Pay loan modifications are included in both calculations (1) Represents changes in interest cash flows due to the impact of modifications incorporated into the quarterly assessment of expected future cash flows and/or changes in interest rates on variable rate loans. |

| 1Q10 Credit quality highlights Allowance for credit losses $25.7 billion 6x allowance at start of credit crisis 4.8x quarterly charge-offs 3.28% of total loans $19.9 billion in nonaccretable difference for PCI portfolio in addition to allowance Provision expense continued to decline reflecting stable net charge-offs; Reserve build reflects FAS 167 consolidated loans Net charge-offs of $5.3 billion Included $145 million related to newly issued regulatory charge-off guidance applicable to collateral-dependent residential real estate loan modifications and $123 million in losses on loans moved on balance sheet due to FAS 167 adoption Loss rate of 2.71% reflected legacy Wells Fargo credit discipline, reduced risk in the Wachovia portfolio, and smaller percent of higher loss content portfolios (e.g. credit card only 3% of total loan portfolio) Credit losses are trending better than originally expected. Based on current economic conditions and forecasts, we believe provision expense peaked in 3Q09 and charge-offs peaked in 4Q09; expect provision expense to decline over the rest of 2010 |

| Nonperforming assets Allowance considers losses inherent in the loan portfolio including nonperforming loans as of 3/31/10 Commercial & CRE nonaccruals of $12.1 billion 69% have FAS 114 reserves of $1.1 billion 91% secured while approximately 53% have some level of recourse Over 45% are currently paying interest that is applied to principal $2.1 billion in losses taken to date Consumer nonaccruals of $15.0 billion >99% secured Approximately two-thirds of nonaccrual loans have either had losses taken or have CLTV < 80% 21% current CLTV (1) below 80% $2.9 billion in losses taken to date $2.3 billion of nonaccrual troubled debt restructurings (TDRs) have $2.1 billion of loan impairment for expected life-of-loan loss reserves Foreclosed assets up $921 million $446 million of the increase reflects shift from PCI loans when PCI loans become REO GNMA foreclosed assets are insured and already written down The current loan-to-value (LTV) ratio is calculated as the outstanding loan balance divided by the collateral value. The table above does not include PCI loans that were contractually 90 days past due and still accruing. Also excludes GNMA and similar loans whose repayments are insured by the Federal Housing Administration or guaranteed by the Department of Veterans Affairs. |

| Nonaccrual loans $2.9 billion increase includes $909 million in FAS 167 consolidated loan nonaccruals Growth rates continued to slow as anticipated in 1Q10 Up 11% from 4Q09 vs. increases of 17% in 4Q09 from 3Q09, 32% in 3Q09 from 2Q09 and 50% in 2Q09 from 1Q09 New inflows declined in 1Q10 Non-FAS 167 consumer real estate inflows declined Total commercial and commercial real estate inflows declined CRE inflows down 27% Outflows slower to be realized in consumer portfolio, largely due to loan modification process $6.8 billion of consumer nonaccruals are over 180+ days past due vs. $6.1 billion in 4Q09 Increasing percentage of nonaccruals have had the loss content recognized Over 45% of commercial and commercial real estate nonaccruals are currently paying interest that is applied to principal 37% of consumer nonaccruals have been written down Approximately two-thirds of consumer nonaccrual loans either have had losses taken and/or CLTV ^ 80% |

| Net loan charge-offs Losses declined $83 million and included $145 million in collateral-dependent losses related to newly issued regulatory charge-off guidance applicable to residential real estate loan modifications and $123 million in FAS 167 consolidated loan losses Commercial and commercial real estate losses declined $356 million with decreases in all loan categories Consumer loss increase reflects the previously described $268 million in loan losses |

| Commercial real estate (CRE) loan portfolio Office Industrial, Warehouse Other RE Apartment Retail (Ex Shopping Ctr) Land (Ex 1-4 Family) Shopping Ctr 1-4 Family Structure Hotel/Motel 1-4 Family Land Institutional 2% Agriculture Retail CA FL TX NC GA NY VA AZ NJ PA Other 34% of the portfolio is owner-occupied Home builder balances = $7.3 billion NPAs have been relatively flat for last 3 quarters and inflows have slowed More than half the increase in nonaccruals driven by two property types, office and hotel/motel |

| CRE loan portfolio by business group Wholesale Banking 16% owner-occupied Community Banking 62% owner-occupied Wealth, Brokerage and Retirement (WBR) 46% owner-occupied |

| CRE portfolio: Property type by business group CRE portfolio secured by well-diversified mix of property types across three business groups Balances secured by 1-4 family residential real estate structure & land make up 6% of the portfolio, with higher concentrations in Wealth, Brokerage & Retirement Retail, excluding shopping centers, includes stores, restaurants, and other retail businesses independently located Other real estate is composed of multiple properties (ex. churches, public storage and parking lots) Wholesale Banking Community Banking WBR Office Industrial, Warehouse Other RE Apartment Retail (Ex Shopping Ctr) Land (Ex 1-4 Family) Shopping Ctr 1-4 Family Structure Hotel/Motel 1-4 Family Land Institutional Agriculture Retail As of 3/31/10. Office Industrial, Warehouse Retail (Ex Shopping Ctr) Land (Ex 1-4 Family) Shopping Ctr 1-4 Family Structure Hotel/Motel 1-4 Family Land Institutional Agriculture Retail Other RE Apartment Office Industrial, Warehouse Other RE Apartment Retail (Ex Shopping Ctr) Land (Ex 1-4 Family) Shopping Ctr 1-4 Family Structure Hotel/Motel 1-4 Family Land Agriculture Retail Institutional |

| Wholesale Banking CRE loan portfolio (1) Wholesale CRE outstandings of $85.0 billion (1) down $3.8 billion, or 4%, from 4Q09 Legacy Wells Fargo CRE portfolio = $34.0 billion Seasoned senior management team with strong tenured underwriting experience Distinctive portfolio monitoring process followed; risk of each loan reassessed every 90 days using current detailed borrower credit and collateral data Underwriting focused primarily on cash flows and creditworthiness, not solely on valuations Wachovia PCI CRE portfolio = $10.0 billion carrying value down $1.0 billion, or 9%, from 4Q09 Risk mitigated through purchase accounting; managed by a dedicated specialty group 26% of portfolio to residential homebuilders; higher concentration than non-PCI portfolios Wachovia non-PCI CRE portfolio = $27.5 billion down $2.2 billion, or 7%, from 4Q09 Majority of portfolio managed by a dedicated specialty group focused on restructuring, disposition and workout strategies Legacy Wells Fargo senior manager leads team averaging more than 25 years in industry experience CRE loans originated through other Wholesale Banking channels (both legacy Wells Fargo and Wachovia) = $13.5 billion More than 45% owner-occupied and average loan less than $3 million More than 90% are non-construction loans Includes $8 billion in C&I loans managed by commercial real estate business including unsecured loans to real estate developers not secured by real estate and loans to REITs, as well as foreign and consumer loans. |

| Pick-a-Pay mortgage portfolio Book balance of $82.9 billion in first lien loans outstanding, down $2.3 billion from 4Q09 on paid-in-full loans and loss mitigation efforts Unpaid principal balance of $100.8 billion, down $2.9 billion from 4Q09 Pick-a-Pay loans with negative amortization potential decreased $3.9 billion from 4Q09 Total portfolio deferred interest of $3.5 billion down $180 million from 4Q09 Deferred interest down for the fourth consecutive quarter due to: Loan modification efforts Customers' minimum payments continue to increase modestly each year (7.5%), while interest rates are falling, so for many customers the minimum payment not only covers interest due, but also pays down some principal In March 2010, approximately 63% of customers choosing the minimum payment did not defer interest Expect minimal recast risk over next 3 years due to product structure and features In 2010 less than $24 million, or 115 loans, expected to hit contractual recast due to term or balance cap and have a payment change greater than 7.5% annual reset. Less than $37 million, or 156 loans, expected in 2011 and less than $49 million, or 213 loans, expected in 2012 |

| Pick-a-Pay credit highlights Pick-a-Pay non-PCI portfolio Loans down 3% driven by loans paid-in-full 85% of portfolio current Nonaccrual loans up $809 million 73% of loans have been written down to net realizable value (See page 41) Although net TDRs increased $65 million as we continue to work with customers, $219 million nonperforming TDRs have been reclassified to accruing TDR status $4.2 billion in nonaccruals included $614 million of non-accruing TDRs of which 67% were paying as agreed Net charge-offs rose only $74 million, consistent with expectations, and included $46 million in losses associated with new regulatory guidance applicable to collateral-dependent loan modifications as well as $37 million from 1Q10 loan modifications 39% of portfolio with CLTV (1) 80% and under Pick-a-Pay PCI portfolio Carrying value down 2% 57% of portfolio current Life-of-loan losses continued to perform better than originally projected at time of merger Total portfolio Portfolio performing better than expectations LTV's continue to stabilize in both portfolios The current loan-to-value (LTV) ratio is calculated as the outstanding loan balance plus the outstanding balance of any equity lines of credit that share common collateral divided by the collateral value. (2) The current loan-to-value (LTV) ratio is calculated as the net carrying value loan balance plus the net carrying value of any equity lines of credit that share common collateral divided by the collateral value. |

| Pick-a-Pay Non-impaired (Non-PCI) Current To 30 Days Pick-a-Pay Impaired (PCI) Current To 30 Days Pick-a-Pay: Current - 30 days past due roll rates Roll rates from current to 30+ days past due (DPD) continued to improve in 1Q10 In the non-impaired portfolio, the quarter- end 30+ roll rates have improved to their lowest levels since 1Q09 In the impaired portfolio, the quarter-end 30+ roll rates were at their lowest levels since 2Q08 First time delinquents, defined as the percentage of 30+ days delinquent loans that are delinquent for the first time in the life of the loan, an important indicator in tracking the emergence of new problem loans, continued to improve in 1Q10 In the non-impaired portfolio, the percentage of first time delinquents has dropped four consecutive quarters In the impaired portfolio, the ratio of first time delinquents is at levels not seen since early 2008 |

| Pick-a-Pay nonaccrual loan composition 73% of Pick-a-Pay NPLs held at estimated recoverable value vs. 66% in 4Q09, reflecting write-downs and/or CLTV=<100% Allowance covers the remaining 27% that have not yet been written down 10% of the NPLs are performing modifications Performing modifications move to current status after six consecutive payments are made 1Q10 Total $4,161 million 180 DPD written down to estimated recoverable value Charge-offs to date of $641 million (28% of orig. balance) 180 DPD updated CLTV ^ 100% No charge-offs to date: 56% of loans have LTV<80% 44% of loans have LTV>80% but <100% 0 -179 DPD Initial charge-offs usually not taken until 180 DPD ($73 million taken to date) Expected losses included in allowance Loan modifications (TDRs) Charge-offs/principal forgiveness to date of $127 million (17% of orig. balance) Additionally, we hold expected life-of-loan loss reserves in allowance Days Past Due (DPD) LTV is considered to be over 100% if the loan balance exceeds current estimated appraised value based on automated valuation methodology or updated appraisal where available. |

| Pick-a-Pay loan modifications Over 4,800 full-term MAP and HAMP modifications in 1Q10; over 52,600 in full year 2009 88% of modifications have been in the PCI portfolio 34% of PCI portfolio modified through March 31, 2010 We have attempted to contact the majority of customers 90+ days delinquent or in foreclosure Modifications reduced payment for 98% of customers compared to industry average 82% (1) Modifications have reduced payments by 25% on average from the customer's minimum payment option, as we strive to give customers an affordable, sustainable payment. Modifications include: Interest rate reductions Interest rates reduced on average by more than 200 bps on modified loans Payments are generally interest-only initially and migrate to fully amortizing over time, usually 5-7 years Term extensions Principal forgiveness Over $2.8 billion of principal forgiven program-to-date Modifications are re-underwritten, income is documented and negative amortization feature is eliminated Redefault experience has been lower than expected though it remains early Redefault rates of our most seasoned modifications are significantly below the redefault rate of industry option ARM modifications with equal aging (1); outperformance reflects payment reductions and principal forgiveness 4Q09 HAMP rollout Rolled out in late October to Pick-a-Pay customers Over 6,200 loans have been approved for the HAMP trial modification An additional 22,000 Pick-a-Pay customers are being reviewed for HAMP eligibility (1) Source: OCC and OTS Mortgage Metrics Report, Fourth Quarter 2009. |

| Real estate 1-4 family first mortgage portfolio First lien mortgage loans up 5% on the addition of $14.5 billion in FAS 167 consolidated loans Run-off portfolio (1) down 3% PCI portfolio down 3% Debt consolidation down 4% Other mortgage up 12% Other first lien mortgage nonaccruals up 61 bps Net charge-offs up $178 million and included FAS 167 consolidated loan losses of $97 million (1) Non-PCI Pick-a-Pay mortgage loans of $46.8 billion. (2) Ratios on other first lien mortgage loan portfolio only. |

| Home equity portfolio (1) Core Portfolio (2) Outstandings (3) up 2% reflecting FAS 167 consolidation of $5 billion in loans High quality new originations with weighted average CLTV of 60%, 774 FICO, and 32% total debt service ratio 1Q10 losses up $147 million vs. a $42 million increase in 4Q09 $86 million in losses related to new regulatory guidance applicable to collateral-dependent residential real estate loan modifications Delinquency rate decreased 14 bps, reflecting improvement in large and stressed residential markets such as CA and FL Delinquency for loans with a CLTV >100% of 5.27% indicated that the vast majority of customers with negative equity continued making their payments Liquidating Portfolio 1Q10 losses down $13 million $13 million in losses related to new regulatory guidance applicable to collateral-dependent residential real estate loan modifications Delinquency for loans with a CTLV>100% of 7.49% indicated that most customers, even ones sourced through third party channels, continued making their payments (1) Excludes purchased credit-impaired Wachovia loans. (2) Includes equity lines of credit and closed-end junior liens associated with the Pick-a-Pay portfolio totaling $1.8 billion at March 31, 2010, and $1.8 billion at December 31, 2009. (3) Outstandings includes $2.1 billion of business equity lines of credit reclassified from commercial loan portfolio as of December 31, 2009. 2009 credit losses are reported separately with the commercial loan portfolio. (4) CLTV quarter-end based predominantly on estimated home values from automated valuation models updated through March 2010. Total loans include all open-to-buy and unused lines of credit. |

| Credit card portfolio $22.5 billion credit card outstandings represent 3% of total loans $17.6 billion Community Banking $4.9 billion Wells Fargo Financial Significantly smaller portfolio than large bank peers Outstandings down 6% as consumers reduced their debt Net charge-offs and 30+ days past due relatively stable Proactive risk mitigation efforts include: Tightened underwriting criteria Line management changes (i.e. fewer balance transfers and approved balance increases) |

| Auto portfolio Core Portfolio Total outstandings up 13% QoQ reflecting continued market share gains and $1.9 billion from FAS 167 consolidated loans Strongest quarterly originations since the merger New originations LTV and loan structures consistent with 2H09 Net charge-offs down 82 bps QoQ, on better-than-seasonally improved delinquencies Record Manheim index of 119.9 in March; up 13% from March 2009 30+ days past due improved 94 bps Liquidating Portfolio (1) Wells Fargo Financial indirect auto outstandings down 14%, or $1.5 billion, QoQ driven by paydowns Legacy Wells Fargo Indirect portfolio. |
| Tier 1 common equity reconciliation |

| Return on average tangible common equity |
