UNITED STATES
SECURITIES AND EXCHANGE COMMISSION
WASHINGTON, D.C. 20549
FORM 8-K
CURRENT REPORT
Pursuant to Section 13 or 15(d) of the Securities Exchange Act of 1934
April 21, 2010
(Date of earliest event reported)
LABORATORY CORPORATION
OF
AMERICA HOLDINGS
| DELAWARE | 1-11353 | 13-3757370 | ||
| (State or other jurisdiction of Incorporation) |
(Commission File Number) |
(I.R.S. Employer Identification No.) |
| 358 SOUTH MAIN STREET, BURLINGTON, NORTH CAROLINA |
27215 | 336-229-1127 | ||
| (Address of principal executive offices) | (Zip Code) |
(Registrant's telephone number including area code) |
Check the appropriate box below if the Form 8-K filing is intended to simultaneously satisfy the filing obligation of the registrant under any of the following provisions:
¨ Written communications pursuant to Rule 425 under the Securities Act (17 CFR 230.425)
¨ Soliciting material pursuant to Rule 14a-12 under the Exchange Act (17 CFR 240.14a-12)
¨ Pre-commencement communications pursuant to Rule 14d-2(b) under the Exchange Act (17 CFR 240.14d-2(b))
¨ Pre-commencement communications pursuant to Rule 13e-4(c) under the Exchange Act (17 CFR 240.13e-4(c))
ITEM 7.01. Regulation FD Disclosure
Summary information of the Company dated April 21, 2010.
SIGNATURES
Pursuant to the requirements of the Securities Exchange Act of 1934, the registrant has duly caused this report to be signed on its behalf by the undersigned hereunto duly authorized.
| Laboratory Corporation of America Holdings (Registrant) |
||||
| Date: April 21, 2010 | By: | /s/F. Samuel Eberts III | ||
| F. Samuel Eberts III, Chief Legal Officer and Secretary |
||||

1
8-K Filed April 21, 2010

2
Introduction
This slide presentation contains forward-looking statements which are
subject to change based on various important factors, including without
limitation, competitive actions in the marketplace and adverse
actions of
governmental and other third-party payors.
Actual results could differ materially from those suggested by these
forward-looking statements. Further information on potential factors that
could affect the Company’s financial results
will be included in the
Company’s Form 10-K for the year ended December 31, 2009, and
subsequent SEC filings. The Company has no obligation to provide any
updates to these forward-looking statements even if its expectations
change.

3
First Quarter Results
(In millions, except per share data)
2010
2009
+/(-)
Revenue
1,193.6
$
1,155.7
$
3.3%
Adjusted Operating Income
(1)
243.5
$
240.5
$
1.2%
Adjusted Operating Income Margin
(1)
20.4%
20.8%
(40)
bp
Adjusted EPS
(1)
1.30
$
1.22
$
6.6%
Operating Cash Flow
232.0
$
208.9
$
11.1%
Less: Capital Expenditures
(24.5)
$
(30.7)
$
(20.2%)
Free Cash Flow
207.5
$
178.2
$
16.4%
(1) See Reconciliation of non-GAAP Financial Measures (included herein)
Three Months Ended Mar 31,
4
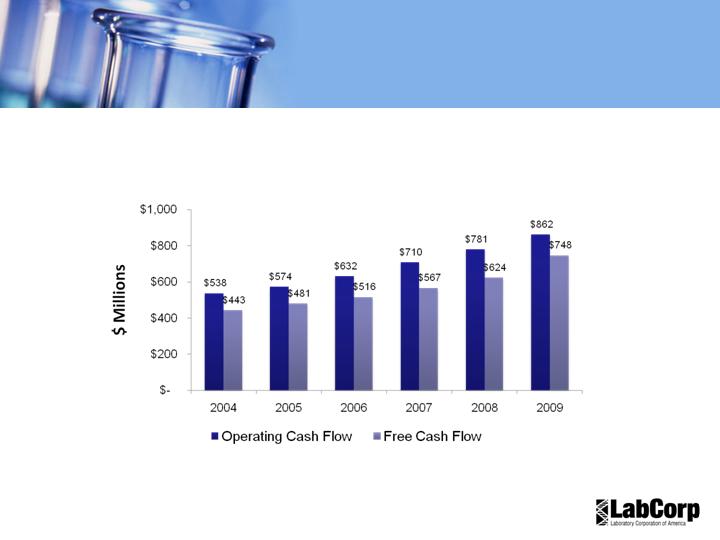
Cash Flow Trends
11% FCF CAGR
2004-2009
5
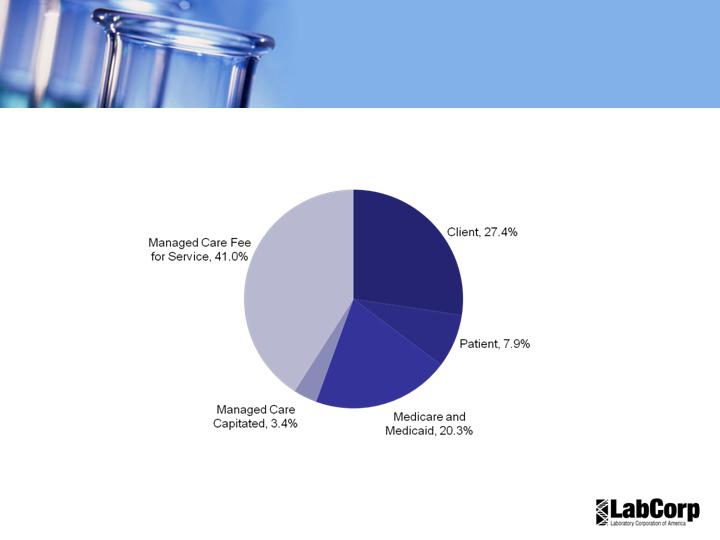
Revenue by Payer- US
2010 YTD
6
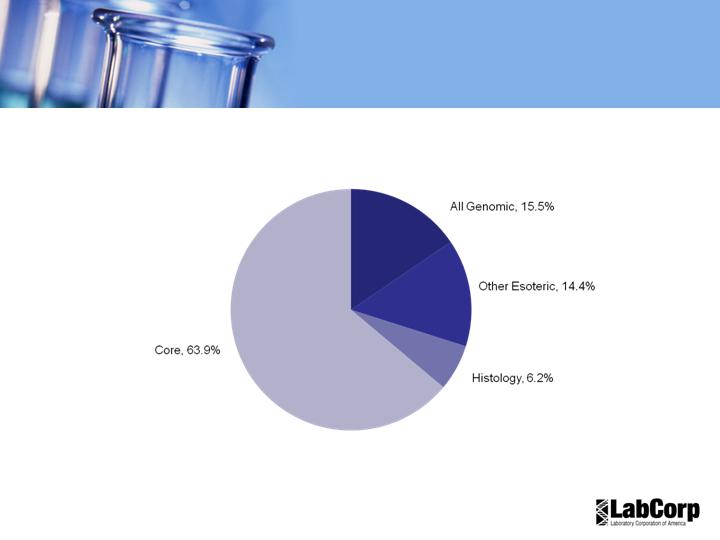
Revenue by Business Area - US
2010 YTD

7
Revenue by Payer
(in millions, except PPA)
YTD Q1-2008
YTD Q1-2009
YTD Q1-2010
Revenue
Revenue
Revenue
$'s
%
Accns
PPA
$'s
%
Accns
PPA
$'s
%
Accns
PPA
Client
285.4
$
27%
8.638
33.04
$
303.3
$
28%
8.918
34.01
$
307.9
$
27%
8.598
35.80
$
Patient
97.9
9%
0.590
165.98
$
83.7
8%
0.531
157.57
$
88.3
8%
0.536
164.81
$
Third Party
(Medicare/Medicaid)
198.8
19%
4.728
42.05
$
220.3
20%
4.983
44.21
$
228.5
20%
4.927
46.37
$
Managed Care:
- Capitated
42.4
4%
3.691
11.49
$
44.6
4%
3.665
12.16
$
39.0
3%
3.225
12.11
$
- Fee for service
414.6
40%
9.339
44.39
$
448.3
41%
9.584
46.78
$
461.0
41%
9.491
48.57
$
Total Managed Care
457.0
44%
13.030
35.07
$
492.9
45%
13.249
37.20
$
500.0
44%
12.716
39.32
$
LabCorp Total - US
1,039.1
$
100%
26.986
38.51
$
1,100.1
$
100%
27.681
39.74
$
1,124.7
$
100%
26.777
42.00
$
LabCorp Total - Canada
64.1
$
-
1.835
34.90
$
55.6
$
-
2.269
24.50
$
68.9
$
-
2.287
30.14
$
LabCorp Total
1,103.2
$
28.821
38.28
$
1,155.7
$
29.950
38.59
$
1,193.6
$
29.064
41.07
$

8
Revenue by Business Area
(in millions, except PPA)
YTD Q1-2008
YTD Q1-2009
YTD Q1-2010
Revenue
Revenue
Revenue
$'s
%
Accns
PPA
$'s
%
Accns
PPA
$'s
%
Accns
PPA
All Genomic
156.4
$
15%
2.144
72.94
$
172.4
$
16%
2.250
76.64
$
174.5
$
16%
2.189
79.68
$
Other Esoteric
118.1
11%
2.881
40.98
140.2
13%
3.303
42.44
161.8
14%
3.734
43.33
Histology
79.2
8%
0.629
125.99
73.5
7%
0.609
120.69
70.1
6%
0.564
124.28
All Genomic / Esoteric
353.7
34%
5.654
62.55
386.1
35%
6.162
62.67
406.4
36%
6.487
62.65
Core
685.5
66%
21.332
32.13
714.0
65%
21.520
33.18
718.3
64%
20.290
35.40
LabCorp Total - US
1,039.1
$
100%
26.986
38.51
$
1,100.1
$
100%
27.681
39.74
1,124.7
$
100%
26.777
42.00
LabCorp Total - Canada
64.1
$
-
1.835
34.90
$
55.6
$
-
2.269
24.50
$
68.9
$
-
2.287
30.14
$
LabCorp Total
1,103.2
$
28.821
38.28
$
1,155.7
$
29.950
38.59
$
1,193.6
$
29.064
41.07
$
9
Financial Guidance - 2010
Excluding the impact of restructuring and other special charges
and share repurchase activity after March 31, 2010,
guidance for 2010 is:
Revenue growth:
Approximately 2.5% – 4.5%
Adjusted EPS:
$5.35 to $5.55
Operating cash flow of approximately(1):
$870 Million
Capital expenditures of approximately:
$135 Million
(1) Operating cash flow guidance excludes any transition payments to UnitedHealthcare.

10
Supplemental Financial
Information
Q1 10
Depreciation
$32.2
Amortization
$17.4
Capital expenditures
$24.5
Cash flows from operations
$232.0
Bad debt as a percentage of sales
5.05%
Effective interest rates on debt:
Zero-coupon subordinated notes
2.00%
5 1/2% Senior Notes
5.38%
5 5/8% Senior Notes
5.75%
Term loan
3.67%
Revolving credit facility (weighted average)
0.58%
Days sales outstanding
46
UnitedHeathcare transition payments - Billed
$10.1
UnitedHeathcare transition payments - Paid
$14.5
Laboratory Corporation of America
Other Financial Information
March 31, 2010
($ in millions)

11
Reconciliation of non-GAAP
Financial Measures
Adjusted Operating Income
2010
2009
Operating income
$234.2
$240.5
Restructuring and other special charges
9.3
-
Adjusted operating income
$243.5
$240.5
Adjusted EPS
Diluted earnings per common share
$1.25
$1.22
Impact of restructuring and other special charges (1)
0.05
-
Adjusted EPS
$1.30
$1.22
Three Months Ended Mar 31,
(1) After tax impact of restructuring and other special charges, $5.7 million divided by 106.5 million shares
Reconciliation of non-GAAP Financial Measures
(In millions, except per share data)

12