Attached files
| file | filename |
|---|---|
| 8-K - FORM 8-K - PACCAR INC | d8k.htm |
Exhibit 99.1
|
|
||
| PACCAR Inc | ||
| Public Affairs Department | ||
| P.O. Box 1518 | ||
| Bellevue, WA 98009 | ||
| Contact: Robin Easton (425) 468-7676 | ||
FOR IMMEDIATE RELEASE
PACCAR Announces Improved First Quarter Revenues and Earnings
PACCAR MX Engine and New Truck Models Launched
April 20, 2010, Bellevue, Washington – “PACCAR reported improved revenues and net income for the first quarter of 2010,” said Mark C. Pigott, chairman and chief executive officer. “PACCAR’s results reflect the benefits of stronger truck sales in North America and an improvement in financial services profits and parts revenues worldwide. I am very proud of our 15,000 employees who have delivered superior results to our shareholders and customers in a very challenging recession. PACCAR’s excellent performance in profitability, shareholder return and new product development, against a backdrop of a very difficult global automotive industry, is remarkable.”
“PACCAR’s strong balance sheet and positive cash flow have enabled the company to maintain ongoing investments to enhance operating efficiency and develop innovative products such as the PACCAR MX diesel engine and introduce many new truck models. These investments contribute to the company’s long-term growth,” noted Pigott. “Financial results for the first quarter reflect the benefit of a small ‘pre-buy’ in the U.S. and Canadian markets as customers transition to the new EPA 2010 engine emission technology. However, the U.S. and Canada truck markets are being negatively impacted in the second quarter as the industry adjusts to higher-priced vehicles.”
PACCAR earned $68.3 million ($.19 per diluted share) for the first quarter of 2010 compared to $26.3 million ($.07 per diluted share) in the first quarter last year. First quarter net sales and financial services revenues were $2.23 billion compared to $1.99 billion reported for the first quarter of 2009.
Global Truck Markets
DAF’s premium vehicles are the quality leaders in Europe. “DAF achieved a record market share in the above 15-tonne market of 14.8 percent in 2009 and has a medium-term market share goal of 20 percent. The estimate for 2010 industry sales in the above 15-tonne truck market in Europe is 150,000-180,000 units, in line with 2009,” noted Harrie Schippers, DAF president.
“Class 8 industry retail sales in the U.S. and Canada are expected to be in the range of 110,000-140,000 vehicles in 2010, reflecting the uneven economy, particularly the continued low level of
housing starts and auto production,” said Dan Sobic, PACCAR executive vice president. “The good news is that freight tonnage has increased modestly on a year-on-year basis in the last few months. Additionally, our customers’ profitability is benefiting from reasonable fuel prices and good availability of drivers.” Added Sobic, “Truck retail sales are still below replacement demand levels, resulting in the North American truck fleet age of nearly seven years. The truck industry is generating slightly better parts and service business due to the aging fleet and higher tonnage.”
Financial Highlights – First Quarter 2010
Highlights of PACCAR’s financial results during the first quarter of 2010 include:
| • | Consolidated sales and revenues of $2.23 billion. |
| • | Net income of $68.3 million. |
| • | Manufacturing cash and marketable securities of $2.05 billion. |
| • | Financial Services pretax income of $28.1 million. |
| • | Aftermarket parts revenues of $505.2 million. |
| • | Research and development expenses of $54.8 million. |
| • | Positive operating cash flow of $285.4 million. |
| • | Medium-term note (MTN) issuance of $300.0 million. |
PACCAR MX Engine Launch
During the first quarter of 2010, PACCAR announced the introduction of the PACCAR MX engine to be installed in Kenworth and Peterbilt trucks this summer. The PACCAR MX engine is designed to deliver industry leading performance, reliability, and fuel efficiency to Kenworth and Peterbilt customers worldwide. “PACCAR’s 50 years of engine development and manufacturing expertise have established the company as one of the leading diesel engine manufacturers in the world,” said Jim Cardillo, PACCAR president. “Over 125,000 PACCAR MX engines are successfully operating in DAF trucks globally.” Cardillo added, “The PACCAR MX is designed to meet the Environmental Protection Agency’s (EPA) 2010 emissions regulations and has accumulated over 50 million test miles in rigorous and severe conditions in North America. PACCAR is pleased to be launching this proven, industry-leading engine in Kenworth and Peterbilt trucks.”
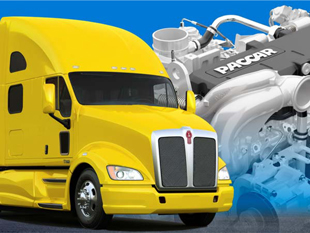
Kenworth Model T700 and PACCAR MX Engine
Capital Investments and New Product Launches
PACCAR’s excellent long-term profits, strong balance sheet, and intense focus on quality, technology and productivity have enabled the company to invest $3.8 billion in capital projects, new products and processes during the last decade. PACCAR expects to increase capital and research and development (R&D) investments in 2010 as the economy improves. Capital expenditures of $175-$200 million and R&D expenses of $225-$250 million are targeted for new products and enhancing operating efficiency. “Kenworth, Peterbilt and DAF are investing in new industry-leading products and services to enable their customers to continue to deliver profitable results in their businesses,” said Tom Plimpton, PACCAR vice chairman.
Kenworth introduced the new EPA SmartWay® certified Model T700 at the Mid-America Truck Show in Louisville, Kentucky. “The Kenworth T700 sets the industry standard for product quality, aerodynamics and reinforces Kenworth’s leadership in fuel economy performance,” said Bill Kozek, Kenworth general manager. Kenworth also launched the T440, offering excellent productivity and fuel efficiency to regional delivery and vocational customers.
Peterbilt unveiled the new EPA SmartWay® certified Model 587, a dynamic successor of the highly successful Model 387. “The Model 587 is the culmination of design, engineering and customer feedback which resulted in an optimized truck that delivers excellent operational efficiency and driver comfort for on-highway Class 8 trucks,” said Bill Jackson, Peterbilt general manager. Peterbilt announced the availability of the Model 320 Hybrid Class 8 refuse truck that utilizes Hydraulic Launch Assist (HLA) technology and the Model 382 for regional and shorter-haul applications.
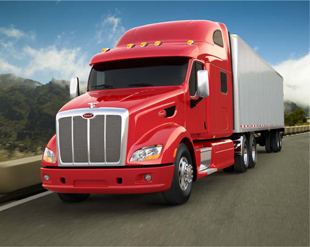
Peterbilt Model 587
Kenworth and Peterbilt launched PACCAR’s new in-dash telematics system. These new state-of-the art systems offer navigation, vehicle diagnostics, communication and entertainment technologies in a touch-screen-operated unit customized for the trucking industry.
Six Sigma and Lean Manufacturing Generate Savings and Improve Efficiency
“PACCAR’s application of Six Sigma tools together with Lean Manufacturing techniques has generated cumulative benefits for PACCAR of $1.4 billion since 1998,” commented Helene Mawyer, PACCAR vice president. “Ten thousand PACCAR employees have been trained in Six Sigma and over 12,000 projects have been implemented throughout the company. Six Sigma and Lean projects are integrated in all business activities at PACCAR and have been adopted at 190 of the company’s suppliers and many of the company’s dealers and customers, ensuring improved product quality and reduced costs in the factories and offices.”
Financial Services Companies Achieve Good Results
PACCAR Financial Services (PFS) has a portfolio of 140,000 trucks and trailers, with total assets of $8.04 billion. PACCAR Leasing, a major full-service truck leasing company in North America with a fleet of over 30,000 vehicles, is included in this segment. First quarter pretax income was $28.1 million compared to the $15.3 million earned in the first quarter of 2009. First quarter revenues were $246.4 million compared to $255.8 million in 2009. During the first quarter of 2010, profit increased due to better finance margins and an improved provision for credit losses. The provision for credit losses was $21.7 million in the first quarter of 2010 versus $25.0 million in the same period in 2009. “New finance business and used truck prices are improving and, coupled with lower credit losses, PFS is achieving improved results in the U.S. and Canada, as well as other primary markets,” said Tim Henebry, president, PACCAR Financial. PACCAR Financial issued $300 million of three-year medium-term notes in March 2010.
“PACCAR’s strong balance sheet, complemented by its AA- credit rating, enables PFS to offer competitive financing to Kenworth, Peterbilt and DAF dealers and customers around the world,” said Ron Armstrong, PACCAR senior vice president. “Strong credit quality, good margins and excellent portfolio management are generating solid earnings.” PACCAR Financial Services has excellent access to the medium-term note markets. Armstrong added, “Our good credit rating and conservative business approach enables the Company to issue debt, often at lower costs than many of our competitors, ensuring that PACCAR Financial Services is able to profitably support the sale of PACCAR trucks in 20 countries at a time when many lenders have exited the transportation finance business.”
PACCAR is a global technology leader in the design, manufacture and customer support of high-quality light-, medium- and heavy-duty trucks under the Kenworth, Peterbilt and DAF nameplates. It also provides financial services and information technology and distributes truck parts related to its principal business.
PACCAR will hold a conference call with securities analysts to discuss first quarter earnings on April 20, 2010, at 8:00 a.m. Pacific time. Interested parties may listen to the call by selecting “Live Webcast” at PACCAR’s homepage. The Webcast will be available on a recorded basis through April 30, 2010. PACCAR shares are traded on the Nasdaq Stock Market, symbol PCAR, and its homepage is www.paccar.com.
This release contains “forward-looking statements” within the meaning of the Private Securities Litigation Reform Act. These statements are based on management’s current expectations and are subject to uncertainty and changes in circumstances. Actual results may differ materially from those included in these statements due to a variety of factors. More information about these factors is contained in PACCAR’s filings with the Securities and Exchange Commission.
# # #
PACCAR Inc
SUMMARY INCOME STATEMENTS
(in millions except per share amounts)
| Three Months Ended March 31 | 2010 | 2009 | ||||
| Truck and Other: |
||||||
| Net sales and revenues |
$ | 1,984.3 | $ | 1,730.4 | ||
| Cost of sales and revenues |
1,767.8 | 1,561.1 | ||||
| Research and development |
54.8 | 52.3 | ||||
| Selling, general and administrative |
94.1 | 88.4 | ||||
| Interest and other expense, net (a) |
4.2 | 15.3 | ||||
| Truck and Other Income Before Income Taxes | 63.4 | 13.3 | ||||
| Financial Services: |
||||||
| Revenues |
246.4 | 255.8 | ||||
| Interest and other (a) |
175.1 | 194.2 | ||||
| Selling, general and administrative |
21.5 | 21.3 | ||||
| Provision for losses on receivables |
21.7 | 25.0 | ||||
| Financial Services Income Before Income Taxes | 28.1 | 15.3 | ||||
| Investment income |
4.5 | 8.0 | ||||
| Total Income Before Income Taxes | 96.0 | 36.6 | ||||
| Income taxes |
27.7 | 10.3 | ||||
| Net Income | $ | 68.3 | $ | 26.3 | ||
| Net Income Per Share: |
||||||
| Basic |
$ | .19 | $ | .07 | ||
| Diluted |
$ | .19 | $ | .07 | ||
| Weighted Average Shares Outstanding: |
||||||
| Basic |
364.6 | 363.1 | ||||
| Diluted |
365.7 | 364.0 | ||||
| Dividends declared per share |
$ | .09 | $ | .18 | ||
(a) For the quarter ended March 31, 2009, Truck and Other “Interest and other expense, net” and Financial Services “Interest and other” include $11.5 and $11.1, respectively, for expenses related to the net change in value of economic hedges.
PACCAR Inc
CONDENSED BALANCE SHEETS
(in millions)
| March 31 2010 |
December 31 2009 | |||||
| ASSETS |
||||||
| Truck and Other: |
||||||
| Cash and marketable debt securities |
$ | 2,052.3 | $ | 2,056.0 | ||
| Trade and other receivables, net |
576.4 | 554.7 | ||||
| Inventories |
545.5 | 632.1 | ||||
| Property, plant and equipment, net |
1,696.2 | 1,757.7 | ||||
| Equipment on operating leases and other |
1,077.1 | 1,137.2 | ||||
| Financial Services Assets |
8,042.5 | 8,431.3 | ||||
| $ | 13,990.0 | $ | 14,569.0 | |||
| LIABILITIES AND STOCKHOLDERS’ EQUITY |
||||||
| Truck and Other: |
||||||
| Accounts payable, deferred revenues and other |
$ | 2,302.1 | $ | 2,442.5 | ||
| Long-term debt |
173.1 | 172.3 | ||||
| Financial Services Liabilities |
6,422.2 | 6,850.5 | ||||
| STOCKHOLDERS’ EQUITY |
5,092.6 | 5,103.7 | ||||
| $ | 13,990.0 | $ | 14,569.0 | |||
| Common Shares Outstanding |
364.7 | 364.4 | ||||
|
GEOGRAPHIC REVENUE DATA
|
||||||
| Three Months Ended March 31 | 2010 | 2009 | ||||
| United States and Canada |
$ | 1,151.4 | $ | 889.9 | ||
| Europe |
768.1 | 779.2 | ||||
| Other |
311.2 | 317.1 | ||||
| $ | 2,230.7 | $ | 1,986.2 | |||
PACCAR Inc
CONDENSED CASH FLOW STATEMENT
(in millions of dollars)
| Three Months Ended March 31 | 2010 | 2009 | ||||||
| OPERATING ACTIVITIES: |
||||||||
| Net income |
$ | 68.3 | $ | 26.3 | ||||
| Depreciation and amortization: |
||||||||
| Property, plant and equipment |
48.1 | 49.5 | ||||||
| Equipment on operating leases and other |
114.0 | 105.3 | ||||||
| Net change in wholesale receivables on new trucks |
(.5 | ) | 205.2 | |||||
| Net decrease in sales-type finance leases and dealer direct loans on new trucks |
57.3 | 44.1 | ||||||
| All other operating activities |
(1.8 | ) | (339.6 | ) | ||||
| Net Cash Provided by Operating Activities |
285.4 | 90.8 | ||||||
| INVESTING ACTIVITIES: |
||||||||
| Acquisition of property, plant and equipment |
(26.1 | ) | (16.5 | ) | ||||
| Acquisition of equipment for operating leases |
(163.0 | ) | (96.4 | ) | ||||
| Net decrease in financial services receivables |
212.2 | 375.8 | ||||||
| Net change in marketable securities |
(26.9 | ) | (2.2 | ) | ||||
| All other investing activities |
44.3 | 91.4 | ||||||
| Net Cash Provided by Investing Activities |
40.5 | 352.1 | ||||||
| FINANCING ACTIVITIES: |
||||||||
| Cash dividends paid |
(32.8 | ) | (101.3 | ) | ||||
| Stock compensation transactions |
3.6 | 7.0 | ||||||
| Net decrease in debt |
(321.6 | ) | (316.1 | ) | ||||
| Net Cash Used in Financing Activities |
(350.8 | ) | (410.4 | ) | ||||
| Effect of exchange rate changes on cash |
(32.4 | ) | (62.8 | ) | ||||
| Net Decrease in Cash and Cash Equivalents |
(57.3 | ) | (30.3 | ) | ||||
| Cash and cash equivalents at beginning of period |
1,912.0 | 1,955.2 | ||||||
| Cash and cash equivalents at end of period |
$ | 1,854.7 | $ | 1,924.9 | ||||