Attached files
| file | filename |
|---|---|
| 10-K - PACIFIC STATE BANCORP | form10k.htm |
| EX-21 - EXHIBIT 21 - PACIFIC STATE BANCORP | exhibit21.htm |
| EX-23 - EXHIBIT 23 - PACIFIC STATE BANCORP | exhibit23.htm |
| EX-32.1 - CERTIFICATION OF CHIEF EXECUTIVE OFFICER - PACIFIC STATE BANCORP | exhibit321.htm |
| EX-31.1 - CERTIFICATION OF CHIEF EXECUTIVE OFFICER - PACIFIC STATE BANCORP | exhibit311.htm |
| EX-32.2 - CERTIFICATION OF CHIEF FINANCIAL OFFICER - PACIFIC STATE BANCORP | exhibit322.htm |
| EX-31.2 - CERTIFICATION OF CHIEF FINANCIAL OFFICER - PACIFIC STATE BANCORP | exhibit312.htm |
SELECTED FINANCIAL DATA
The information set forth below should be read in conjunction with "Management's Discussion and Analysis of Financial Condition and Results of Operation" and the Company’s audited consolidated financial statements and notes thereto, included elsewhere in this report.
|
(Dollars in thousands, except per share data) |
Year Ended December 31, |
|||||||||||||||||||
|
2009 |
2008 |
2007 |
2006 |
2005 |
||||||||||||||||
|
Statements of Operations: |
||||||||||||||||||||
|
Total Interest Income |
$ | 20,097 | $ | 27,275 | $ | 31,242 | $ | 26,495 | $ | 18,782 | ||||||||||
|
Net Interest Income |
12,288 | 15,035 | 17,400 | 17,307 | 13,536 | |||||||||||||||
|
Provision for Loan Losses |
15,365 | 7,001 | 1,425 | 360 | 35 | |||||||||||||||
|
Total Non-interest Income |
(1,365 | ) | (5,268 | ) | 2,465 | 2,583 | 2,481 | |||||||||||||
|
Total Non-interest Expenses |
18,939 | 13,328 | 10,997 | 10,360 | 9,100 | |||||||||||||||
|
(Benefit from)Provision for Income Taxes |
(343 | ) | (5,372 | ) | 2,894 | 3,627 | 2,596 | |||||||||||||
|
Net (Loss) Income |
(23,038 | ) | (5,190 | ) | 4,549 | 5,543 | 4,286 | |||||||||||||
|
Balance Sheets: |
||||||||||||||||||||
|
Total Assets |
369,845 | 421,453 | 431,074 | 386,752 | 309,611 | |||||||||||||||
|
Total Investments |
23,941 | 39,738 | 41,352 | 23,107 | 28,539 | |||||||||||||||
|
Total Loans, net |
245,846 | 301,945 | 308,458 | 287,318 | 241,556 | |||||||||||||||
|
Allowance for Loan Losses (ALL) |
10,508 | 6,019 | 3,948 | 2,478 | 2,356 | |||||||||||||||
|
Total Deposits |
322,425 | 340,980 | 341,821 | 340,996 | 273,074 | |||||||||||||||
|
Subordinated Debentures |
8,764 | 8,764 | 8,764 | 8,764 | 8,764 | |||||||||||||||
|
Shareholders' Equity |
5,679 | 27,284 | 34,036 | 29,059 | 21,373 | |||||||||||||||
|
Performance Ratios: |
||||||||||||||||||||
|
(Loss) Return on Average Assets |
(5.74 | )% | (1.20 | )% | 1.13 | % | 1.67 | % | 1.53 | % | ||||||||||
|
(Loss) Return on Average Equity |
(100.98 | )% | (14.95 | )% | 14.22 | % | 22.91 | % | 22.98 | % | ||||||||||
|
Average Equity to Average Assets |
5.68 | % | 8.00 | % | 7.95 | % | 7.30 | % | 6.65 | % | ||||||||||
|
Tier 1 Risk-Based Capital |
3.01 | % | 10.25 | % | 11.40 | % | 10.65 | % | 10.44 | % | ||||||||||
|
Total Risk-Based Capital |
6.53 | % | 11.50 | % | 12.60 | % | 11.83 | % | 11.88 | % | ||||||||||
|
Net Interest Margin |
3.48 | % | 3.84 | % | 4.79 | % | 5.76 | % | 5.41 | % | ||||||||||
|
Average Earning Assets to Average Total Assets |
83.67 | % | 90.40 | % | 90.31 | % | 93.33 | % | 89.22 | % | ||||||||||
|
Nonperforming Assets to Total Assets |
9.14 | % | 5.59 | % | 0.10 | % | -- | -- | ||||||||||||
|
ALL to Total Loans |
4.10 | % | 1.95 | % | 1.26 | % | 0.86 | % | 0.98 | % | ||||||||||
|
Nonperforming Loans to ALL |
217.60 | % | 391.43 | % | 10.94 | % | -- | -- | ||||||||||||
|
Share Data: |
||||||||||||||||||||
|
Common Shares Outstanding |
3,722,198 | 3,718,598 | 3,707,698 | 3,665,968 | 3,517,113 | |||||||||||||||
|
Book Value Per Share |
$ | 1.53 | $ | 7.34 | $ | 9.19 | $ | 7.94 | $ | 6.08 | ||||||||||
|
Basic (Loss) Earnings Per Share |
$ | (6.19 | ) | $ | (1.40 | ) | $ | 1.23 | $ | 1.57 | $ | 1.23 | ||||||||
|
Diluted Earnings Per Share |
$ | (6.19 | ) | $ | (1.40 | ) | $ | 1.14 | $ | 1.41 | $ | 1.10 | ||||||||
-1-
-2-
-3-
PACIFIC STATE BANCORP AND SUBSIDIARY
CONSOLIDATED BALANCE SHEET
December 31, 2009 and 2008
(In thousands, except share amounts)
|
2009 |
2008 |
|||||||
|
ASSETS |
||||||||
|
Cash and due from banks |
$ | 10,517 | $ | 16,700 | ||||
|
Federal funds sold |
45,568 | 21,811 | ||||||
|
Total cash and cash equivalents |
56,085 | 38,511 | ||||||
|
Investment securities (Notes 3 and 7) |
23,941 | 39,738 | ||||||
|
Loans, less allowance for loan losses of $10,508 in 2009 and $6,019 in 2008 (Notes 4, 10 and 13) |
245,846 | 301,945 | ||||||
|
Premises and equipment, net (Note 5) |
16,234 | 16,811 | ||||||
|
Other real estate |
10,934 | 2,029 | ||||||
|
Company owned life insurance (Note 14) |
7,030 | 6,751 | ||||||
|
Accrued interest receivable and other assets (Note 9) |
9,775 | 15,668 | ||||||
|
Total assets |
$ | 369,845 | $ | 421,453 | ||||
|
LIABILITIES AND |
||||||||
|
SHAREHOLDERS' EQUITY |
||||||||
|
Deposits: |
||||||||
|
Non-interest bearing |
$ | 59,871 | $ | 69,874 | ||||
|
Interest bearing (Note 6) |
262,554 | 271,106 | ||||||
|
Total deposits |
322,425 | 340,980 | ||||||
|
Other borrowings (Note 7) |
29,000 | 40,000 | ||||||
|
Subordinated debentures (Note 8) |
8,764 | 8,764 | ||||||
|
Accrued interest payable and other liabilities |
3,977 | 4,425 | ||||||
|
Total liabilities |
364,166 | 394,169 | ||||||
|
Shareholders' equity (Note 11): |
||||||||
|
Preferred stock - 2,000,000 shares authorized; none issued or outstanding |
- | - | ||||||
|
Common stock - no par value; 24,000,000 shares authorized; issued and outstanding –3,722,198 shares in 2009 and 3,718,598 shares in 2008 |
10,823 | 10,767 | ||||||
|
Accumulated deficit |
(4,224 | ) | 18,814 | |||||
|
Accumulated other comprehensive loss, net of taxes (Notes 3 and 15) |
(920 | ) | (2,297 | ) | ||||
|
Total shareholders' equity |
5,679 | 27,284 | ||||||
|
Total liabilities and shareholders' equity |
$ | 369,845 | $ | 421,453 | ||||
The accompanying notes are an integral
part of these consolidated financial statements
-4-
PACIFIC STATE BANCORP AND SUBSIDIARY
CONSOLIDATED STATEMENT OF OPERATIONS
For the Years Ended December 31, 2009, 2008 and 2007
(In thousands, except per share amounts)
|
2009 |
2008 |
2007 |
||||||||||
|
Interest income: |
||||||||||||
|
Interest and fees on loans |
$ | 18,544 | $ | 24,565 | $ | 27,902 | ||||||
|
Interest on Federal funds sold |
85 | 376 | 1,285 | |||||||||
|
Interest and dividends on investment securities: |
||||||||||||
|
Taxable |
1,354 | 2,095 | 1,843 | |||||||||
|
Exempt from Federal income taxes |
114 | 150 | 134 | |||||||||
|
Dividends |
- | 89 | 78 | |||||||||
|
Total interest income |
20,097 | 27,275 | 31,242 | |||||||||
|
Interest expense: |
||||||||||||
|
Interest on deposits (Note 6) |
6,454 | 10,425 | 12,844 | |||||||||
|
Interest on borrowings (Note 7) |
1,090 | 1,351 | 296 | |||||||||
|
Interest on subordinated debentures (Note 8) |
265 | 464 | 702 | |||||||||
|
Total interest expense |
7,809 | 12,240 | 13,842 | |||||||||
|
Net interest income before provision for loan losses |
12,288 | 15,035 | 17,400 | |||||||||
|
Provision for loan losses (Note 4) |
15,365 | 7,001 | 1,425 | |||||||||
|
Net interest income after provision for loan losses |
(3,077 | ) | 8,034 | 15,975 | ||||||||
|
Non-interest income: |
||||||||||||
|
Service charges |
601 | 823 | 889 | |||||||||
|
Gain on sale of loans |
267 | 188 | 150 | |||||||||
|
Gain on sale of assets |
119 | 471 | - | |||||||||
|
Gain on death benefit from company owned life insurance |
- | 2,574 | - | |||||||||
|
Other income |
623 | 890 | 1,426 | |||||||||
|
Other than temporary impairment charge (Note 3) |
(3,125 | ) | (8,923 | ) | - | |||||||
|
Gain (loss) on sale of securities (Note 3) |
150 | (1,291 | ) | - | ||||||||
|
Total non-interest income |
(1,365 | ) | (5,268 | ) | 2,465 | |||||||
|
Non-interest expenses: |
||||||||||||
|
Salaries and employee benefits (Note 14) |
5,181 | 5,546 | 5,336 | |||||||||
|
Occupancy (Notes 5 and 10) |
1,199 | 1,251 | 1,180 | |||||||||
|
Furniture and equipment (Notes 5 and 10) |
1,000 | 1,032 | 708 | |||||||||
|
Other real estate |
5,667 | 94 | - | |||||||||
|
FDIC insurance assessments |
1,056 | 301 | 59 | |||||||||
|
Goodwill impairment charge |
718 | - | - | |||||||||
|
Other expenses (Note 12) |
4,118 | 5,104 | 3,714 | |||||||||
|
Total non-interest expenses |
18,939 | 13,328 | 10,997 | |||||||||
|
(Loss) income before (benefit from) provision for income taxes |
(23,381 | ) | (10,562 | ) | 7,443 | |||||||
|
(Benefit from) provision for income taxes (Note 9) |
(343 | ) | (5,372 | ) | 2,894 | |||||||
|
Net (loss) income |
$ | (23,038 | ) | $ | (5,190 | ) | $ | 4,549 | ||||
|
Basic (loss) earnings per share (Note 11) |
$ | (6.19 | ) | $ | (1.40 | ) | $ | 1.23 | ||||
|
Diluted (loss) earnings per share (Note 11) |
$ | (6.19 | ) | $ | (1.40 | ) | $ | 1.14 | ||||
The accompanying notes are an integral
part of these consolidated financial statements
-5-
PACIFIC STATE BANCORP AND SUBSIDIARY
CONSOLIDATED STATEMENT OF CHANGES IN SHAREHOLDERS' EQUITY
For the Years Ended December 31, 2009, 2008 and 2007
(In thousands, except share amounts)
|
Common Stock |
Accumulated Other
Compre-hensive |
Total |
||||||||||||||||||||||
|
Shares |
Amount |
Retained
Earnings |
Loss (Net of Taxes) |
Shareholders'
Equity |
Comprehensive Income (loss) |
|||||||||||||||||||
|
Balance, January 1, 2007 |
3,665,968 | $ | 9,651 | $ | 19,455 | $ | (47 | ) | $ | 29,059 | ||||||||||||||
|
Comprehensive income: |
||||||||||||||||||||||||
|
Net income |
4,549 | 4,549 | 4,549 | |||||||||||||||||||||
|
Other comprehensive loss (Note 15): |
||||||||||||||||||||||||
|
Net change in unrealized gains (losses) on available-for-sale investment securities, net of tax |
(339 | ) | (339 | ) | (339 | ) | ||||||||||||||||||
|
Total comprehensive income |
4,210 | |||||||||||||||||||||||
|
Stock-based compensation expense |
309 | 309 | ||||||||||||||||||||||
|
Stock options exercised and related tax benefit (Note 11) |
41,730 | 458 | 458 | |||||||||||||||||||||
|
Balance, December 31, 2007 |
3,707,698 | 10,418 | 24,004 | (386 | ) | 34,036 | ||||||||||||||||||
|
Comprehensive loss (as restated, see Note 15): |
||||||||||||||||||||||||
|
Net loss |
(5,190 | ) | (5,190 | ) | (5,190 | ) | ||||||||||||||||||
|
Other comprehensive loss (Note 15): |
||||||||||||||||||||||||
|
Net change in unrealized gains (losses) on available-for-sale investment securities, net of tax (Note 3) |
(1,911 | ) | (1,911 | ) | (1,911 | ) | ||||||||||||||||||
|
Total comprehensive loss |
(7,101 | ) | ||||||||||||||||||||||
|
Stock-based compensation expense |
270 | 270 | ||||||||||||||||||||||
|
Stock options exercised and related tax benefit (Note 11) |
10,900 | 79 | 79 | |||||||||||||||||||||
|
Balance, December 31, 2008 |
3,718,598 | $ | 10,767 | $ | 18,814 | $ | (2,297 | ) | $ | 27,284 | ||||||||||||||
|
Comprehensive loss: |
||||||||||||||||||||||||
|
Net loss |
(23,038 | ) | (23,038 | ) | (23,038 | ) | ||||||||||||||||||
|
Other comprehensive loss (Note 15): |
||||||||||||||||||||||||
|
Net change in unrealized gains (losses) on available-for-sale investment securities, net of tax (Note 3) |
1,377 | 1,377 | 1,377 | |||||||||||||||||||||
|
Total comprehensive loss |
(21,661 | ) | ||||||||||||||||||||||
|
Stock-based compensation expense |
56 | 56 | ||||||||||||||||||||||
|
Stock options exercised and related tax benefit (Note 11) |
3,600 | |||||||||||||||||||||||
|
Balance, December 31, 2009 |
3,722,198 | $ | 10,823 | (4,224 | ) | (920 | ) | 5,679 | ||||||||||||||||
The accompanying notes are an integral
part of these consolidated financial statements
-6-
PACIFIC STATE BANCORP AND SUBSIDIARY
CONSOLIDATED STATEMENT OF CASH FLOWS
For the Years Ended December 31, 2009, 2008 and 2007
(In thousands)
|
2009 |
2008 |
2007 |
||||||||||
|
Cash flows from operating activities: |
||||||||||||
|
Net (loss) income |
$ | (23,038 | ) | $ | (5,190 | ) | $ | 4,549 | ||||
|
Provision for loan losses |
15,365 | 7,001 | 1,425 | |||||||||
|
Net (increase) decrease in deferred loan origination costs |
(58 | ) | 65 | (168 | ) | |||||||
|
Depreciation, amortization and accretion |
1,165 | 503 | 93 | |||||||||
|
Gain on sale of loans |
(267 | ) | (188 | ) | (150 | ) | ||||||
|
(Gain) loss on sale of premises, equipment and other real estate |
(119 | ) | (471 | ) | - | |||||||
|
Stock-based compensation expense |
56 | 270 | 309 | |||||||||
|
Tax benefit from exercise of stock options |
- | (4 | ) | (223 | ) | |||||||
|
Company owned life insurance earnings |
(279 | ) | (318 | ) | (246 | ) | ||||||
|
Gain on death benefit from company owned life insurance |
- | (2,574 | ) | - | ||||||||
|
(Gain) loss on sale of securities |
(150 | ) | 1,291 | - | ||||||||
|
Other than temporary impairment charge |
3,125 | 8,923 | - | |||||||||
|
Provision (benefit) for deferred income taxes |
9,043 | (5,301 | ) | (755 | ) | |||||||
|
Provision for other real estate owned |
5,041 | - | - | |||||||||
|
(Increase) decrease in accrued interest receivable and other assets |
(4,063 | ) | 873 | (594 | ) | |||||||
|
(Decrease) increase in accrued interest payable and other liabilities |
(448 | ) | (2,028 | ) | 3,420 | |||||||
|
Net cash provided by operating activities |
5,373 | 2,852 | 7,660 | |||||||||
|
Cash flows from investing activities: |
||||||||||||
|
Decrease (increase) in interest bearing deposits at other banks |
- | 3,000 | (3,000 | ) | ||||||||
|
Purchases of available-for-sale investment securities |
(6,581 | ) | (48,361 | ) | (53,022 | ) | ||||||
|
Proceeds from the sale of available-for-sale securities |
7,627 | 13,635 | - | |||||||||
|
Proceeds from matured and called available-for-sale investment securities |
2,250 | 22,735 | 33,805 | |||||||||
|
Proceeds from principal repayments from available-for-sale government-guaranteed mortgage-backed securities |
11,703 | 1,261 | 1,068 | |||||||||
|
Proceeds from principal repayments from held-to-maturity government-guarantee mortgage-backed securities |
11 | 26 | 5 | |||||||||
|
Purchase of FRB and FHLB stock |
(48 | ) | (14 | ) | (831 | ) | ||||||
|
Proceeds from the sale of other real estate |
3,127 | - | - | |||||||||
|
Net increase in loans |
24,108 | (304 | ) | (22,227 | ) | |||||||
|
Redemption (purchase) of company owned life insurance |
- | 4,166 | (1,700 | ) | ||||||||
|
Purchases of premises and equipment |
(441 | ) | (5,397 | ) | (3,082 | ) | ||||||
|
Net cash used in investing activities |
41,756 | (9,253 | ) | (48,984 | ) | |||||||
|
Cash flows from financing activities: |
||||||||||||
|
Net increase (decrease) in demand, interest-bearing and savings deposits |
(11,336 | ) | 7,746 | (21,893 | ) | |||||||
|
Net (decrease) increase in time deposits |
(7,219 | ) | (8,587 | ) | 22,718 | |||||||
|
Proceeds from exercise of stock options |
- | 75 | 235 | |||||||||
|
Excess tax benefit from exercise of stock options |
- | 4 | 223 | |||||||||
|
Net (decrease) increase in other borrowings |
(11,000 | ) | - | 35,100 | ||||||||
|
Net cash (used in) provided by financing activities |
(29,555 | ) | (762 | ) | 36,383 | |||||||
|
(Decrease) increase in cash and cash equivalents |
17,574 | (7,163 | ) | (4,941 | ) | |||||||
|
Cash and cash equivalents at beginning of period |
38,511 | 45,674 | 50,615 | |||||||||
|
Cash and cash equivalents at end of period |
$ | 56,085 | $ | 38,511 | $ | 45,674 | ||||||
|
Supplemental disclosure of cash flow information: |
||||||||||||
|
Cash paid during the year for: |
||||||||||||
|
Interest expense |
$ | 7,100 | $ | 12,565 | $ | 13,048 | ||||||
|
Income taxes |
$ | - | $ | 925 | $ | 2,500 | ||||||
|
Non-cash investing activities: |
||||||||||||
|
Net unrealized (gain) loss on available-for-sale investment securities |
$ | (2,338 | ) | $ | 3,253 | $ | (565 | ) | ||||
The accompanying notes are an integral part of these consolidated financial statements.
-7-
PACIFIC STATE BANCORP AND SUBSIDIARY
NOTES TO CONSOLIDATED FINANCIAL STATEMENTS
(CONTINUED)
NOTE 1. NATURE OF OPERATIONS
On June 24, 2002, Pacific State Bancorp ("Bancorp") commenced operations as a bank holding company by acquiring all of the outstanding shares of Pacific State Bank ("Bank") in a one bank holding company reorganization. This corporate structure gives Bancorp and the Bank greater flexibility in terms of operation, expansion, and
diversification.
Pacific State Bancorp's subsidiaries include the Bank, Pacific State Statutory Trust II and Pacific State Statutory Trust III. Pacific State Statutory Trust II and Pacific State Statutory Trust III are unconsolidated Delaware statutory business trusts formed in March 2004 and June 2007, respectively, for the exclusive
purpose of issuing and selling trust preferred securities and holding subordinated debentures issued by Bancorp. The proceeds from the issuance of subordinated debentures in 2004 were utilized by Bancorp to provide capital to the Bank and for general corporate purposes. The proceeds from the issuance of subordinated debenture in 2007 were utilized to retire subordinated debentures issued in 2002.
The Bank commenced operations in 1987 and is a California state-chartered member bank of the Federal Reserve System. The Bank operates nine branches in California, including two branches in Stockton and branches in Modesto, Groveland, Arnold, Angels Camp, Tracy, Lodi and Hayward. The Bank's primary source of revenue
is providing loans to customers who are predominately small and middle-market businesses and individuals.
GOING CONCERN CONSIDERATION
The consolidated financial statements for 2009 have been prepared on a going concern basis, which contemplates the realization of assets and the discharge of liabilities in the normal course of business. As a result, the consolidated financial statements do not include any adjustments that may result from the outcome of any regulatory action
or the Company’s or the Bank’s inability to meet its existing debt obligations. The Bank has recently incurred significant operating losses, experienced a significant deterioration in the quality of its assets and become subject to enhanced regulatory scrutiny. These factors, among others, were deemed to cast substantial doubt on the Company’s and the Bank’s ability to continue as a going concern. If the Company cannot continue to operate as a going concern, it is likely that shareholders
will lose all or substantially all of their investment in the Company.
The Company is actively pursuing a broad range of strategic alternatives, including a capital infusion or a merger, in order to address any doubt related to the Company’s ability to continue as a going concern. There can be no assurance that the pursuit of strategic alternatives will result in any transaction, or that any such transaction
will allow the Company’s shareholders to avoid a loss of all or substantially all of their investment in the Company. The pursuit of strategic alternatives may also involve significant expenses and management time and attention.
The Company needs to raise additional capital to meet the higher minimum capital levels that the Bank and Company are obligated to maintain under the Consent order with the California Department of Financial Institutions (“CDFI”). As of December 31, 2009, the Bank was considered “under capitalized” under the prompt
corrective action rules of the Federal Deposit Insurance Corporation (“FDIC”). In addition, should the Company’s current rate of operating losses continue or should the Company’s asset quality erode and require significant additional provision for credit losses, resulting in additional net operating losses, the Company’s capital levels will decline further and it will need to raise more capital to satisfy its regulatory capital requirements. The Company’s ability
to raise additional capital depends on conditions in the capital markets, which are outside the Company’s control, and on the Company’s financial performance. Accordingly, the Company cannot be certain of its ability to raise additional capital on acceptable terms, or at all. If the Company cannot raise additional capital, its results of operations and financial condition could be materially and adversely affected, and it may be subject to further supervisory action. In addition, if
the Company were to raise additional capital through the issuance of additional shares, its stock price could be adversely affected, depending on the terms of any shares it were to issue.
During the fourth quarter of 2009, the Company and the Bank entered into the Written Agreement with the FRB and the CDFI. Additionally, on April 15, 2010, the Bank executed a Waiver and Consent to an Order of the CDFI (the “Consent”) requiring the Bank, within 90 days of the effective
date of the Order, to increase and to maintain tangible capital at a level equal to 10% of assets. The effective date will be the date that the CDFI executes the Order per se. As of December 31, 2009, the Bank had a ratio of tangible capital to assets of 3.9%, which was not sufficient to meet the higher level that the Bank would be obligated to maintain under the Consent. As a result, if within 90 days of the effective
date of the Order the Bank cannot comply with the Consent provisions, the Bank may be subject to further supervisory action, which could have a material adverse effect on its results of operations, financial condition and business.
-8-
PACIFIC STATE BANCORP AND SUBSIDIARY
NOTES TO CONSOLIDATED FINANCIAL STATEMENTS
(CONTINUED)
NOTE 2. SUMMARY OF SIGNIFICANT ACCOUNTING POLICIES
The accounting and reporting policies of Pacific State Bancorp and its subsidiary (collectively, the "Company") conform with accounting principles generally accepted in the United States and prevailing practice within the banking industry. The more significant of these policies applied in the preparation of the accompanying consolidated
financial statements are discussed below.
PRINCIPLES OF CONSOLIDATION
The accompanying consolidated financial statements include the accounts of the Company and its wholly-owned subsidiary, Pacific State Bank. Significant intercompany transactions and balances have been eliminated in consolidation. For financial reporting purposes, the Company's investment in Pacific State Statutory
Trusts II and III ("Trusts") are accounted for under the equity method and are included in accrued interest receivable and other assets in the consolidated balance sheet. The subordinated debentures issued and guaranteed by the Company and held by the Trusts are included as subordinated debentures in the consolidated balance sheet.
SEGMENT INFORMATION
Management has determined that because all of the banking products and services offered by the Company are available in each branch of the Bank, all branches are located within the same economic environment and management does not allocate resources based on the performance of different lending or transaction activities, it is appropriate
to aggregate the Bank branches and report them as a single operating segment. No customer accounts for more than 10 percent of revenues for the Company or the Bank.
USE OF ESTIMATES
The preparation of financial statements in conformity with accounting principles generally accepted in the United States of America requires management to make estimates and assumptions. These estimates and assumptions affect the reported amounts of assets and liabilities at the date of the financial statements and the reported
amounts of revenues and expenses during the reporting period. Actual results could differ from these estimates.
RECLASSIFICATIONS
Certain reclassifications have been made to prior years' balances to conform to classifications used in 2009.
CASH AND CASH EQUIVALENTS
For the purpose of the statement of cash flows, cash, due from banks and Federal funds sold are considered to be cash equivalents. Generally, Federal funds are sold for one-day periods.
INVESTMENT SECURITIES
Investment securities are classified into the following categories:
· Available-for-sale securities, reported at fair value, with unrealized gains and losses excluded from earnings and reported, net of taxes, as accumulated other comprehensive income (loss) within shareholders' equity.
· Held-to-maturity securities, which management has the positive intent and ability to hold to maturity, reported at amortized cost, adjusted for the accretion of discounts and amortization of premiums.
Management determines the appropriate classification of its investments at the time of purchase and may only change the classification in certain limited circumstances. The Company did not have any investments classified as trading at December 31, 2009 or 2008. All transfers between categories are accounted for at
fair value. There were no transfers between categories in 2009 or 2008.
Gains or losses on the sale of investment securities are computed on the specific identification method. Interest earned on investment securities is reported in interest income, net of applicable adjustments for accretion of discounts and amortization of premiums.
Investment securities are evaluated for impairment on at least a quarterly basis and more frequently when economic or market conditions warrant such an evaluation to determine whether a decline in their value is other than temporary. Management utilizes criteria such as the magnitude and duration of the decline and the intent
and ability of the Company to retain its investment in the securities for a period of time sufficient to allow for an anticipated recovery in fair value, in addition to the reasons underlying the decline, to determine whether the loss in value is other than temporary. The term "other than temporary" is not intended to indicate that the decline is permanent, but indicates that the prospects for a near-term recovery of value is not necessarily favorable, or that there is a lack of evidence to support
a realizable value equal to or greater than the carrying value of the investment. Once a decline in value is determined to be other than temporary, the value of the security is reduced and a corresponding charge to earnings is recognized.
As a member of the Federal Reserve System, the Federal Home Loan Bank System and the Farmer Mac Home Administration System, the Bank is required to maintain an investment in restricted capital stock of each system. These investments are carried at cost and are redeemable at par and are included in accrued interest receivable
and other assets in the consolidated balance sheet.
-9-
PACIFIC STATE BANCORP AND SUBSIDIARY
NOTES TO CONSOLIDATED FINANCIAL STATEMENTS
(CONTINUED)
LOANS
Loans are stated at principal balances outstanding. Interest is accrued daily based upon outstanding loan balances. However, when, in the opinion of management, loans are considered to be impaired and the future collectability of interest and principal is in serious doubt, loans are placed on nonaccrual status and
the accrual of interest income is suspended. Any interest accrued but unpaid is charged against income. Payments received are applied to reduce principal to the extent necessary to ensure collection. Subsequent payments on these loans, or payments received on nonaccrual loans for which the ultimate collectability of principal is not in doubt, are applied first to earned but unpaid interest and then to principal.
An impaired loan is measured based on the present value of expected future cash flows discounted at the loan's effective interest rate or, as a practical matter, at the loan's observable market price or the fair value of collateral if the loan is collateral dependent. A loan is considered impaired when, based on current information
and events, it is probable that the Company will be unable to collect all amounts due (including both principal and interest) in accordance with the contractual terms of the loan agreement. Interest income on impaired loans, if appropriate, is recognized on a cash basis.
Loan origination fees, commitment fees, direct loan origination costs and purchase premiums and discounts on loans are deferred and recognized as an adjustment of yield, and amortized to interest income over the contractual term of the loan. The unamortized balance of deferred fees and costs is reported as a component of net
loans.
The Company may purchase loans or acquire loans through a business combination for which differences exist between the contractual cash flows and the cash flows expected to be collected due, at least in part, to credit quality. When the Company acquires such loans, the yield that may be accreted (accretable yield) is limited
to the excess of the Company’s estimate of undiscounted cash flows expected to be collected over the Company’s initial investment in the loan. The excess of contractual cash flows over cash flows expected to be collected may not be recognized as an adjustment to yield, loss, or a valuation allowance. Subsequent increases in cash flows expected to be collected generally should be recognized prospectively through adjustment of the loan’s yield over its remaining life. Decreases
in cash flows expected to be collected should be recognized as an impairment. The Company may not "carry over" or create a valuation allowance in the initial accounting for loans acquired under these circumstances. At December 31, 2009 and 2008, there were no such loans being accounted for under this policy.
LOAN SALES AND SERVICING
The Company accounts for the transfer and servicing of financial assets based on the financial and servicing assets it controls and liabilities it has incurred, derecognizes financial assets when control has been surrendered and derecognizes liabilities when extinguished.
Government Guaranteed Loans
Included in the loan portfolio are loans which are 75% to 90% guaranteed by the Small Business Administration (SBA), Farmer Mac and USDA Business and Industry. The guaranteed portion of these loans may be sold to a third party, with the Company retaining the unguaranteed portion. The Company generally receives a premium
in excess of the adjusted carrying value of the loan at the time of sale. The Company may be required to refund a portion of the sales premium if the borrower defaults or prepays within ninety days of the settlement date. At December 31, 2009, there were no premiums subject to these recourse provisions.
The Company's investment in the loan is allocated between the retained portion of the loan, the servicing asset (liability) and the sold portion of the loan based on their relative fair values on the date the loan is sold. The gain on the sold portion of the loan is recognized as income at the time of sale. The carrying
value of the retained portion of the loan is discounted based on the estimated value of a comparable non-guaranteed loan. The servicing asset (liability) is recognized and amortized over the estimated life of the related loan. Significant future prepayments of these loans will result in the recognition of additional amortization of related servicing assets (liabilities).
The Company serviced government-guaranteed loans for others totaling $48,327,000 and $53,112,000 as of December 31, 2009 and 2008 respectively.
Servicing Rights
Servicing rights acquired through 1) a purchase or 2) the origination of loans which are sold with servicing rights retained are recognized as separate assets or liabilities. Servicing assets or liabilities are recorded at the difference between the contractual servicing fees and adequate compensation for performing the servicing,
and are subsequently amortized in proportion to and over the period of the related net servicing income or expense. Servicing assets are periodically evaluated for impairment. Servicing rights were not significant at December 31, 2009 and 2008.
ALLOWANCE FOR LOAN LOSSES
The allowance for loan losses is maintained to provide for losses related to impaired loans and other losses that can be expected to occur in the normal course of business. The determination of the allowance is based on estimates made by management, to include consideration of the character of the loan portfolio, specifically
identified problem loans, potential losses inherent in the portfolio taken as whole and economic conditions in the Company's service area.
Classified loans and loans determined to be impaired are individually evaluated by management for specific risk of loss. In addition, reserve factors are assigned to currently performing loans based on management's assessment of the following for each identified loan type: (1) inherent credit risk, (2) historical losses
and, (3) where the Company has not experienced losses, the loss experience of peer banks. These estimates are particularly susceptible to changes in the economic environment and market conditions.
The Bank's Loan Committee reviews the adequacy of the allowance for loan losses at least quarterly, to include consideration of the relative risks in the portfolio and current economic conditions and other factors. The allowance is adjusted based on that review if, in the judgment of the Loan Committee and management, changes
are warranted.
While management uses the best information available on which to base estimates, future adjustments to the allowance for credit losses may be necessary if the economic conditions, particularly in the Stockton Markets and San Joaquin County, differ substantially from the assumptions used by management. In addition, regulatory agencies,
as an integral part of their examination process, periodically review the Company’s allowance for loan losses, and my require the Company to make additions to the allowance based on their judgment about information available to them at the time of their examination.
This allowance is established through a provision for loan losses which is charged to expense. Additions to the allowance are expected to maintain the adequacy of the total allowance after net charge-offs and loan growth. The allowance for loan losses at December 31, 2009 and 2008, respectively, reflects management's
estimate of probable losses in the portfolio.
-10-
PACIFIC STATE BANCORP AND SUBSIDIARY
NOTES TO CONSOLIDATED FINANCIAL STATEMENTS
(CONTINUED)
Allowance for Losses Related to Undisbursed Loan and Lease Commitments
The Bank maintains a separate allowance for losses related to undisbursed loan and lease commitments. Management estimates the amount of probable losses by applying the loss factors used in the allowance for loan and lease loss methodology to an estimate of the expected usage of undisbursed commitments for each loan or lease type. The allowance
totaled $67,000 and $222,000 at December 31, 2009 and 2008, respectively, and is included in accrued interest payable and other liabilities on the consolidated balance sheet.
OTHER REAL ESTATE
Other real estate includes real estate acquired in full or partial settlement of loan obligations. When property is acquired, any excess of the Company's recorded investment in the loan balance and accrued interest income over the estimated fair market value of the property is charged against the allowance for loan losses. A
valuation allowance for selling and administration costs associated with the liquidation of the property is recorded and maintained subsequent to foreclosure of the property. The allowance is established through a provision for losses on other real estate which is included in other expenses. Subsequent gains or losses on sales or permanent impairment charges are recorded in other income or expenses as incurred. At December 31, 2009 the Company has $10,934,000 in other real estate
and $2,029,000 in other real estate at December 31 2008.
PREMISES AND EQUIPMENT
Premises and equipment are carried at cost. Depreciation is determined using the straight-line method over the estimated useful lives of the related assets. The useful lives of premises are estimated to be ten to thirty-nine years. The useful lives of furniture, fixtures and equipment are estimated to be
three to fifteen years. Leasehold improvements are amortized over the life of the asset or the life of the related lease, whichever is shorter. When assets are sold or otherwise disposed of, the cost and related accumulated depreciation and amortization are removed from the accounts, and any resulting gain or loss is recognized in income for the period. The cost of maintenance and repairs is charged to expense as incurred.
The Company evaluates premises and equipment for financial impairment as events or changes in circumstances indicate that the carrying amount of such assets may not be fully recoverable.
GOODWILL AND INTANGIBLE ASSETS
As a result of the Company's 2002 acquisition of the Stockton branch of California Bank & Trust, the Company recognized a core deposit intangible asset of $448,000 and goodwill of $718,000. The core deposit intangible has been fully amortized and will no longer impact the Company’s financial statements. Goodwill
is not amortized, but is measured for impairment on an annual basis. At December 31, 2009 management has determined that the goodwill previously recorded can no longer be supported and has recognized an impairment charge of $718,000, or the entire balance of the goodwill. As of December 31, 2008 the Company had a balance of $718,000 of goodwill recorded.
INCOME TAXES
The Company and its subsidiaries file consolidated tax returns. The Company accounts for income taxes in accordance with FASB ASC 740, Income Taxes, resulting in two components of income tax expense: current and deferred. Current income tax expense approximates taxes to be paid or refunded for the current period. The Company determines
deferred income taxes using the balance sheet method. Under this method, the net deferred tax asset or liability is based on the tax effects of the differences between the book and tax bases of assets and liabilities, and recognizes enacted changes in tax rates and laws in the period in which they occur. Deferred income tax expense results from changes in deferred tax assets and liabilities between periods. Deferred tax assets are recognized subject to Management’s judgment that realization is more likely
than not. A tax position that meets the more likely than not recognition threshold is measured to determine the amount of benefit to recognize. The tax position is measured at the largest amount of benefit that is greater than fifty percent likely of being realized upon settlement. Interest and penalties are recognized as a component of income tax expense.
On the consolidated balance sheet, net deferred tax assets are included in accrued interest receivable and other assets.
Management continually evaluates the ability of the Company to ultimately realize deferred tax assets currently recorded. If management determines that it is more likely than not that the deferred tax assets can ultimately be realized, no valuation allowance is recorded. If management determines that it is not more
likely than not that the deferred tax assets will be realized, a valuation allowance is recorded against the future tax benefits that management believes will not be realized. As of December 31, 2009, the Company has recorded a valuation allowance of $9,043,000 against deferred tax assets. As of December 31, 2008 the Company did not record a valuation allowance against deferred tax assets.
-11-
PACIFIC STATE BANCORP AND SUBSIDIARY
NOTES TO CONSOLIDATED FINANCIAL STATEMENTS
(CONTINUED)
EARNINGS (LOSS) PER SHARE
Basic earnings (loss) per share (EPS), which excludes dilution, is computed by dividing income available to common shareholders by the weighted-average number of common shares outstanding for the period. Diluted EPS reflects the potential dilution that could occur if securities or other contracts to issue common stock, such as
stock options, result in the issuance of common stock which shares in the earnings of the Company. The Company had a net loss for 2009 and 2008; therefore all stock options are antidilutive. All data with respect to computing earnings per share is retroactively adjusted to reflect stock splits and dividends and the treasury stock method is applied to determine the dilutive effect of stock options in computing diluted EPS.
STOCK-BASED COMPENSATION
At December 31, 2009, the Company had one shareholder approved stock-based compensation plan which is described more fully in Note 11. The Company accounts for its stock based compensation plan in accordance with FASB ASC 718, Stock Compensation, using the modified
prospective transition method. Under that transition method, compensation cost recognized in fiscal years 2006, 2007, 2008 and 2009 includes: (a) compensation cost for all share-based payments vesting during 2006, 2007, 2008 and 2009 that were granted prior to, but not yet vested as of January 1, 2006, based on the grant-date fair value estimated in accordance with the original provisions of ASC 718, and (b) compensation cost for all share-based payments vesting during 2006, 2007, 2008 and 2009 that
were granted subsequent to January 1, 2006, based on the grant-date fair value estimated in accordance with the provisions of ASC 718. For further information on grants and vesting please refer to Note 11. Compensation cost is recognized net of estimated forfeitures. Results for prior periods have not been restated.
As a result of applying ASC 718, the Company recorded an expense of $56,000 in 2009, $270,000 in 2008 and $309,000 in 2007.
Determining Fair Value
The Company bases the fair value of the options previously granted on the date of grant using a Black-Scholes-Merton option pricing model that uses assumptions based on expected option life, the level of expected stock volatility and the risk-free interest rate. Stock volatility is based on the historical volatility of the Company's
stock. The risk-free rate is based on the U.S. Treasury yield curve and the expected term of the options. The expected term of the options represents the period that the Company's share-based awards are expected to be outstanding based on the terms of the optionee’s employment agreement and position within the Company, previous option activity, the number of shares currently owned and the expected time of when those options would be exercised. The Company has not paid cash dividends. The Company estimates
the forfeiture rate in calculating the compensation expense to be insignificant. The Company did not grant any stock options in 2009 or 2008. In 2007 the Company granted 30,000 stock options using a risk free rate of 4.98%, volatility rate of 34.79% and forfeiture rate of 2%. This resulted in a fair market value under the Black-Scholes-Merton model of $9.22 per option.
TRANSACTION ACCOUNT GUARANTEE PROGRAM
The Bank is participating in the FDIC's Transaction Account Guarantee Program. Under this program, through December 31, 2010, all noninterest-bearing transaction accounts are fully guaranteed by the FDIC for the entire amount in the account and the Bank is assessed an annual fee of 25 basis points for all deposit amounts exceeding
the existing deposit insurance limit of $250,000. Coverage under the Transaction Account Guarantee Program is in addition to and separate from the coverage available under the FDIC's general deposit insurance rules.
-12-
PACIFIC STATE BANCORP AND SUBSIDIARY
NOTES TO CONSOLIDATED FINANCIAL STATEMENTS
(CONTINUED)
RECENTLY ADOPTED ACCOUNTING PRONOUNCEMENTS
FASB ASC 805, Business Combinations, requires an acquirer in a business combination to recognize the assets acquired (including loan receivables), the liabilities assumed, and any noncontrolling interest
in the acquiree at the acquisition date, at their fair values as of that date, with limited exceptions. The acquirer is not permitted to recognize a separate valuation allowance as of the acquisition date for loans and other assets acquired in a business combination. The revised statement requires acquisition-related costs to be expensed separately from the acquisition. It also requires restructuring costs that the acquirer expected but was not obligated to incur, to be expensed separately from the business combination.
The adoption of these provisions did not have any effect on the Company’s financial statements at the date of adoption.
FASB ASC 815-10, Derivatives and Hedging, changes the disclosure requirements for derivative instruments and hedging activities. It requires enhanced disclosures about how and why an entity uses derivatives,
how derivatives and related hedged items are accounted for, and how derivatives and hedged items affect an entity’s financial position, performance and cash flows. The Company had no derivative instruments as of December 31, 2009.
FASB ASC 820-10-55-23B, Fair Value Measurements and Disclosures- Overall — Implementation Guidance, relates to the requirements that pertain to nonfinancial assets and nonfinancial liabilities
covered by accounting guidance for Fair Value Measurements. The adoption of this guidance did not have any effect on the Company’s financial statements at the date of adoption.
FASB ASC 320-10-65-1, Investments — Debt and Equity Securities Guidance related to Recognition and Presentation of Other-Than-Temporary Impairments states that an other-than-temporary impairment
(OTTI) write-down of debt securities, where fair value is below amortized cost, is triggered in circumstances where (1) an entity has the intent to sell a security, (2) it is more likely than not that the entity will be required to sell the security before recovery of its amortized cost basis, or (3) the entity does not expect to recover the entire amortized cost basis of the security. If an entity intends to sell a security or if it is more likely than not the entity will be required to sell
the security before recovery, an OTTI write-down is recognized in earnings equal to the entire difference between the security’s amortized cost basis and its fair value. If an entity does not intend to sell the security or it is more likely than not that it will not be required to sell the security before recovery, the OTTI write-down is separated into an amount representing the credit loss, which is recognized in earnings, and the amount related to all other factors, which is recognized in other comprehensive
income. The adoption of these provisions did not have a material effect on the Company’s financial statements at the date of adoption.
FASB ASC 820-10-65-4, Fair Value Measurements and Disclosures- Overall — Transition Guidance related to Determining Fair Value When the Volume and Level of Activity for the Asset or Liability Have Significantly
Decreased and Identifying Transactions That Are Not Orderly, addresses measuring fair value in situations where markets are inactive and transactions are not orderly. In these circumstances quoted prices may not be determinative of fair value. Even if there has been a significant decrease in the volume and level of activity for an asset or liability and regardless of the valuation technique(s) used, the objective of a fair value measurement has not changed. Under these provisions price quotes for assets
or liabilities in inactive markets may require adjustment due to uncertainty as to whether the underlying transactions are orderly. The adoption of these provisions did not have any effect on the Company’s financial statements at the date of adoption.
FASB ASC 825-10-65-1, Financial Instruments — Overall — Transition Guidance related to Interim Disclosures about Fair Value of Financial Instruments, states that entities must disclose
the fair value of financial instruments in interim reporting periods as well as in annual financial statements. The methods and assumptions used to estimate fair value as well as any changes in methods and assumptions that occurred during the reporting period must also be disclosed. The adoption of these provisions did not have any effect on the Company’s financial statements at the date of adoption.
FASB ASC 855, Subsequent Events, establishes general standards of accounting for and disclosure of events that occur after the balance sheet date but before financial statements are issued or are available
to be issued. The accounting guidance defines: (1) the period after the balance sheet date during which Management of a reporting entity should evaluate events or transactions that may occur for potential recognition or disclosure in the financial statements, (2) the circumstances under which an entity should recognize events or transactions occurring after the balance sheet date in its financial statements, and (3) the disclosures that an entity should make about events or transactions that occurred
after the balance sheet date. Management has reviewed events occurring through March 31, 2010, the date the financial statements were issued and no subsequent events occurred requiring accrual or disclosure.
-13-
PACIFIC STATE BANCORP AND SUBSIDIARY
NOTES TO CONSOLIDATED FINANCIAL STATEMENTS
(CONTINUED)
NOTE 3. INVESTMENT SECURITIES
The amortized cost and estimated fair value of investment securities at December 31, 2009 and 2008 consisted of the following:
AVAILABLE-FOR-SALE (AFS)
|
( In Thousands) |
Amortized Cost |
Gross Unrealized Gains |
Gross Unrealized Losses |
Estimated
Fair
Value |
||||||||||||
|
U.S. Treasury securities |
$ | 5,002 | $ | 66 | $ | - | $ | 5,068 | ||||||||
|
Obligations of states and political Subdivisions |
2,730 | 6 | (74 | ) | 2,662 | |||||||||||
|
Mortgage-backed securities |
7,036 | 307 | - | 7,343 | ||||||||||||
|
Other MBS & CMO |
5,742 | 106 | - | 5,848 | ||||||||||||
|
Corporate bonds |
4,955 | 28 | (1,998 | ) | 2,985 | |||||||||||
| $ | 25,465 | $ | 513 | $ | (2,072 | ) | $ | 23,906 | ||||||||
Net unrealized losses on available-for-sale investment securities totaled $1,559,000 as of December 31, 2009. $920,000 was recorded as accumulated other comprehensive loss net of $639,000 tax effect within shareholders' equity at December 31, 2009. The $639,000 tax effect was recorded as a valuation allowance against
deferred tax assets and is included as a reduction of income tax benefit for the year ended 2009.
The Company recorded other than temporary impairment charges against two securities in 2009. One security was a single issue trust preferred security of a bank which failed in the second half of 2009. As a result, the Company recorded an other than temporary impairment charge of the remaining book value of $2,299,000. The
second security was a pooled trust preferred security which ceased interest payments in 2009. The Company enlisted a third party valuation expert to determine the value of the security as of December 31, 2009. Based on the analysis performed by the third party, the Company recorded an other than temporary impairment charge of $826,000 against the security.
The Company realized a gain of $24,000 on the sale of Temecula Valley, a single issue trust preferred security which the Company recorded an other than temporary impairment against in 2008. The Company also recorded a gain of $38,000 on the sale of the US Treasury Bill in first quarter 2009, and another gain of $88,000 on the
sale of a GNMA Agency MBS.
|
( In Thousands) |
Amortized Cost |
Gross Unrealized Gains |
Gross Unrealized Losses |
Estimated
Fair
Value |
||||||||||||
|
Debt securities: |
||||||||||||||||
|
U.S. Treasury securities |
$ | 9,937 | $ | 240 | $ | - | $ | 10,177 | ||||||||
|
Obligations of states and political sub-divisions |
3,154 | 11 | (130 | ) | 3,035 | |||||||||||
|
Mortgage-backed securities |
22,355 | 318 | (2 | ) | 22,671 | |||||||||||
|
Corporate bonds |
8,143 | 4 | (4,338 | ) | 3,809 | |||||||||||
| $ | 43,589 | $ | 573 | $ | (4,470 | ) | $ | 39,692 | ||||||||
Net unrealized losses on available-for-sale investment securities totaling $2,297,000 were recorded, net of $1,600,000 in tax benefit, as accumulated other comprehensive loss within shareholders' equity at December 31, 2008. The Company realized losses of $7,789,000 on sales and calls of securities in 2008. The $7,789,000
included realized losses on an other-than-temporary charge of $6,498,000 in third quarter of 2008 related to Fannie Mae and Freddie Mac preferred stock. The Company subsequently sold the preferred stock in the fourth quarter of 2008, realizing an additional loss of $345,000. The Company recorded another other-than-temporary impairment charge of $2,425,000 on a single issue trust preferred debenture in the fourth quarter of 2008 which has not been sold and realized losses on other securities
totaling $946,000 in the fourth quarter of 2008. $6,011,000, net of tax benefit of $4,203,000 of unrealized losses was reclassified from accumulated other comprehensive income to loss on sale of securities and other-than-temporary impairment charge on the consolidated statement of operations at the time the losses were realized or determined to be other-than-temporarily impaired.
HELD-TO-MATURITY (HTM)
|
Amortized Cost |
Gross Unrealized Gains |
Gross Unrealized Losses |
Estimated Fair
Value |
|||||||||||||
|
(In Thousands) |
||||||||||||||||
|
Debt securities: |
||||||||||||||||
|
Mortgage-backed securities |
$ | 35 | $ | - | $ | - | $ | 35 | ||||||||
|
Amortized Cost |
Gross Unrealized Gains |
Gross Unrealized Losses |
Estimated Fair
Value |
|||||||||||||
|
(In Thousands) |
||||||||||||||||
|
Debt securities: |
||||||||||||||||
|
Mortgage-backed securities |
$ | 46 | $ | - | $ | - | $ | 46 | ||||||||
-14-
PACIFIC STATE BANCORP AND SUBSIDIARY
NOTES TO CONSOLIDATED FINANCIAL STATEMENTS
(CONTINUED)
There were no sales or transfers of held-to-maturity investment securities during the years ended December 31, 2009, 2008 and 2007.
Investment securities with unrealized losses at December 31, 2009 and 2008 are summarized and classified according to the duration of the loss period as follows:
|
Less than 12 Months |
12 Months or More |
Total |
||||||||||||||||||||||
|
Fair
Value |
Unrealized
Losses |
Fair
Value |
Unrealized
Losses |
Fair
Value |
Unrealized
Losses |
|||||||||||||||||||
|
(In Thousands) |
||||||||||||||||||||||||
|
Obligations of states and political sub-divisions |
$ | 1,311 | $ | (60 | ) | $ | 594 | $ | (14 | ) | $ | 1,905 | $ | (74 | ) | |||||||||
|
Corporate bonds |
1,171 | (611 | ) | 782 | (1,387 | ) | 1,953 | (1,998 | ) | |||||||||||||||
| $ | 2,482 | $ | (671 | ) | $ | 1,376 | $ | (1,401 | ) | $ | 3,858 | $ | (2,072 | ) | ||||||||||
|
Less than 12 Months |
12 Months or More |
Total |
||||||||||||||||||||||
|
Fair
Value |
Un realized
Losses |
Fair
Value |
Unrealized
Losses |
Fair
Value |
Unrealized
Losses |
|||||||||||||||||||
|
(In Thousands) |
||||||||||||||||||||||||
|
Debt Securities |
||||||||||||||||||||||||
|
Obligations of state and political sub-divisions |
$ | 1,325 | $ | (130 | ) | $ | - | $ | - | $ | 1,325 | $ | (130 | ) | ||||||||||
|
Mortgage-backed securities |
10 | (1 | ) | 433 | (1 | ) | 443 | (2 | ) | |||||||||||||||
|
Corporate bonds |
- | - | 2,726 | (4,338 | ) | 3,226 | (4,338 | ) | ||||||||||||||||
| $ | 1,335 | $ | (131 | ) | $ | 3,159 | $ | (4,339 | ) | $ | 4,994 | $ | (4,470 | ) | ||||||||||
U.S. Treasury Securities
At December 31, 2009, the Company held 1 U.S. Treasury security, which is safe kept at PCBB as collateral for the Company’s PCBB line of credit.
Obligations of states and political sub-divisions
At December 31, 2009, the Company held 8 municipal debt securities, of which 6 were in an unrealized loss position. Management believes the unrealized losses on the Company’s investments in municipal bonds were caused by market conditions and is not attributable to changes in credit quality. Because the decline
in market value is attributable to changes in market conditions and not credit quality, and because the Company has the ability and intent to hold these investments until a recovery of fair value, which may be maturity, the Company does not consider these investments to be other-than-temporarily impaired at December 31, 2009.
At December 31, 2008, the Company held 10 municipal debt securities, of which 3 were in an unrealized loss position. Management believes the unrealized losses on the Company’s investments in municipal bonds were caused by market conditions and is not attributable to changes in credit quality. Because the decline
in market value is attributable to changes in market conditions and not credit quality, and because the Company has the ability and intent to hold these investments until a recovery of fair value, which may be maturity, the Company does not consider these investments to be other-than-temporarily impaired at December 31, 2008.
Mortgage-Backed Securities
At December 31, 2009, the Company held 8 mortgage-backed investment securities of which none were in a loss position for less than twelve months or twelve months or more.
At December 31, 2008, the Company held 16 mortgage-backed investment securities of which 4 were in a loss position for less than twelve months and none of the securities were in a loss position for twelve months or more. Management believes that the unrealized losses on the Company's investments in mortgage-backed investment
securities were caused by market conditions and is not attributable to changes in credit quality. The contractual cash flows of those investments are guaranteed by an agency of the U.S. government. Because the decline in market value is attributable to changes in market conditions and not credit quality, and because the Company has the ability and intent to hold those investments until a recovery of fair value, which may be maturity, the Company does not consider those investments to be
other-than-temporarily impaired at December 31, 2008.
-15-
PACIFIC STATE BANCORP AND SUBSIDIARY
NOTES TO CONSOLIDATED FINANCIAL STATEMENTS
(CONTINUED)
Corporate Bonds
At December 31, 2009, the Company held 7 corporate debt securities, of which 6 were in an unrealized loss position. Management believes the unrealized losses on the Company’s investments in corporate bonds were caused by the demand for these particular securities declining throughout the year but because the Company has
the ability and intent to hold these investments until a recovery of fair value, which may be maturity. The Company only considers one of these investments to be other-than-temporarily impaired at December 31, 2009, with the investment discussed below.
At December 31, 2009, the Company's investment securities included $1,000,000 of collateralized debt obligation or asset-backed security, issued by US Cap IV, an exempted company incorporated under the laws of the Cayman Islands. Due to an analysis valuation and opinion from Red Pine Advisors LLC on the fair value of the instrument
at December 31, 2009, and an approximate fair value of 0.96% of par, the Company subsequently recorded a valuation allowance of $826,000 and recorded an other-than-temporary impairment write down of $826,000 as of December 31, 2009.
At December 31, 2008, the Company held 9 corporate debt securities, of which 7 were in an unrealized loss position. Management believes the unrealized losses on the Company’s investments in corporate bonds were caused by the demand for these particular securities declining throughout the year but because the Company has
the ability and intent to hold these investments until a recovery of fair value, which may be maturity, the Company does not consider these investments to be other-than-temporarily impaired at December 31, 2008.
The amortized cost and estimated fair value of investment securities at December 31, 2009 by contractual maturity are shown below. Expected maturities will differ from contractual maturities because the issuers of the securities may have the right to call or prepay obligations with or without call or prepayment penalties.
|
Available-for-Sale |
Held-to-Maturity |
|||||||||||||||
|
Amortized Cost |
Estimated Fair Value |
Amortized Cost |
Estimated Fair
Value |
|||||||||||||
|
(In Thousands) |
||||||||||||||||
|
Within one year |
$ | 5,259 | $ | 5,325 | $ | - | $ | - | ||||||||
|
After one year through five years |
- | - | - | - | ||||||||||||
|
After five years through ten years |
359 | 339 | - | - | ||||||||||||
|
After ten years |
12,811 | 10,899 | - | - | ||||||||||||
| 18,429 | 16,563 | - | - | |||||||||||||
|
Investment securities not due at a single maturity date: |
||||||||||||||||
|
Mortgage-backed securities |
7,036 | 7,343 | 35 | 35 | ||||||||||||
| $ | 25,465 | $ | 23,906 | $ | 35 | $ | 35 | |||||||||
Investment securities with amortized costs totaling $19,278,000 and $21,566,000 and estimated market values totaling $19,716,000 and $21,044,000 were pledged to secure treasury tax and loan accounts, public deposits and Federal Reserve Bank advances at December 31, 2009 and 2008, respectively. Certain other investment securities
are pledged to secure borrowings with the Federal Home Loan Bank (see Note 7).
-16-
PACIFIC STATE BANCORP AND SUBSIDIARY
NOTES TO CONSOLIDATED FINANCIAL STATEMENTS
(CONTINUED)
NOTE 4. LOANS AND ALLOWANCE FOR LOAN LOSSES
Outstanding loans are summarized below:
|
December 31, |
||||||||
|
2009 |
2008 |
|||||||
|
(In thousands) |
||||||||
|
Commercial |
$ | 66,091 | $ | 81,284 | ||||
|
Agricultural |
7,770 | 13,153 | ||||||
|
Real estate - commercial mortgage |
150,120 | 135,013 | ||||||
|
Real estate – construction |
17,531 | 64,762 | ||||||
|
Installment |
14,641 | 13,609 | ||||||
|
Gross loans |
256,153 | 307,821 | ||||||
|
Deferred loan origination costs, net |
201 | 143 | ||||||
|
Allowance for loan losses |
(10,508 | ) | (6,019 | ) | ||||
|
Net loans |
$ | 245,846 | $ | 301,945 | ||||
Changes in the allowance for loan losses were as follows:
|
Year Ended December 31, |
||||||||||||
|
2009 |
2008 |
2007 |
||||||||||
|
(In thousands) |
||||||||||||
|
Balance, beginning of year |
$ | 6,019 | $ | 3,948 | $ | 2,478 | ||||||
|
Provision charged to operations |
15,365 | 7,001 | 1,425 | |||||||||
|
Losses charged to allowance |
(10,989 | ) | (5,868 | ) | (161 | ) | ||||||
|
Recoveries |
113 | 938 | 206 | |||||||||
|
Balance, end of year |
$ | 10,508 | $ | 6,019 | $ | 3,948 | ||||||
There were twenty five loans on nonaccrual status in the amount of $22,864,000 as of December 31, 2009. The Company recorded an allowance of $3,490,000 related to the loans on nonaccrual status. There were eleven loans on nonaccrual status in the amount of $23,560,000 as of December 31, 2008. There was one
loan on nonaccrual status in the amount of $432,000 at December 31, 2007. The Company did not recognize any interest income on impaired or nonaccrual loans during 2009, 2008 and 2007.
The average outstanding balance of impaired loans for the years ended December 31, 2009, 2008 and 2007 was $16,909,000, $9,591,000 and $36,000, respectively
The interest foregone on nonaccrual loans was $728,000 at December 31, 2009 and $736,000 at December 31, 2008. The interest foregone on nonaccrual loans was not significant at December 31, 2007.
Salaries and employee benefits totaling $991,000 $954,000, $1,006,000 have been deferred as loan origination costs for the years ended December 31, 2009, 2008 and 2007, respectively.
-17-
PACIFIC STATE BANCORP AND SUBSIDIARY
NOTES TO CONSOLIDATED FINANCIAL STATEMENTS
(CONTINUED)
NOTE 5. PREMISES AND EQUIPMENT
Premises and equipment consisted of the following:
|
December 31, |
||||||||
|
2009 |
2008 |
|||||||
|
(In thousands) |
||||||||
|
Land |
$ | 5,683 | $ | 4,955 | ||||
|
Buildings and improvements |
9,943 | 6,326 | ||||||
|
Furniture, fixtures and equipment |
5,413 | 5,159 | ||||||
|
Leasehold improvements |
1,807 | 1,807 | ||||||
|
Construction in progress |
- | 4,172 | ||||||
|
Total gross premises and equipment |
22,846 | 22,419 | ||||||
|
Less accumulated depreciation and amortization |
(6,612 | ) | (5,608 | ) | ||||
|
Total premises and equipment |
$ | 16,234 | $ | 16,811 | ||||
Depreciation and amortization included in occupancy, furniture and equipment expense totaled $1,007,000, $826,000, and $745,000 for the years ended December 31, 2009, 2008 and 2007, respectively.
NOTE 6. INTEREST-BEARING DEPOSITS
Interest-bearing deposits consisted of the following:
|
December 31, |
||||||||
|
2009 |
2008 |
|||||||
|
(In thousands) |
||||||||
|
Savings |
$ | 26,920 | $ | 8,920 | ||||
|
Money market |
36,900 | 55,294 | ||||||
|
NOW accounts |
17,451 | 18,390 | ||||||
|
Time deposits, $100,000 or more |
85,091 | 106,018 | ||||||
|
Time deposits under $100,000 |
96,192 | 82,484 | ||||||
|
Total interest bearing deposits |
$ | 262,554 | $ | 271,106 | ||||
Aggregate annual maturities of time deposits are as follows:
|
December 31, 2009 |
||||
|
(In thousands) |
||||
|
2010 |
$ | 124,115 | ||
|
2011 |
32,080 | |||
|
2012 |
11,405 | |||
|
2013 |
8,455 | |||
|
2014 |
5,228 | |||
|
Total time deposits |
$ | 181,283 | ||
-18-
PACIFIC STATE BANCORP AND SUBSIDIARY
NOTES TO CONSOLIDATED FINANCIAL STATEMENTS
(CONTINUED)
Interest expense recognized on interest-bearing deposits consisted of the following:
|
December 31, |
||||||||||||
|
2009 |
2008 |
2007 |
||||||||||
|
(In thousands) |
||||||||||||
|
Savings |
$ | 187 | $ | 42 | $ | 46 | ||||||
|
Money market |
601 | 1,386 | 1,985 | |||||||||
|
NOW accounts |
77 | 232 | 246 | |||||||||
|
Time deposits, $100,000 or more |
2,809 | 5,069 | 6,657 | |||||||||
|
Time deposits under $100,000 |
2,780 | 3,696 | 3,910 | |||||||||
|
Total deposit interest expense |
$ | 6,454 | $ | 10,425 | $ | 12,844 | ||||||
NOTE 7. OTHER BORROWINGS
The Company has secured short-term borrowing arrangements totaling $7,568,000 with two of its correspondent banks. There were no borrowings outstanding under these arrangements at December 31, 2009 and 2008.
The Company has a borrowing arrangement with the Federal Home Loan Bank of San Francisco (FHLB) which allow the Company to borrow on a short-term basis up to approximately $40,549,000 as of December 31, 2009 and on a short-term or long-term basis up to $93,112,000 as of December 31, 2008 based on specific percentages of the collateral
pledged. For the years ended December 31, 2009 and 2008, various loan types secured a borrowing capacity of $34,585,000 and $85,571,000 and investment securities secured borrowing capacity of $5,964,000 and $7,541,000, respectively. The Bank had outstanding letters of credit with the Federal Home Loan Bank in the amount of $7,282,000 at December 31, 2009.
Advances from the FHLB at December 31, 2009 and 2008 consisted of the following:
|
December 31, | ||||||||||||||||
|
2009 |
2008 | |||||||||||||||
|
Balance |
Rate |
Maturity Date |
Balance |
Rate |
Maturity Date | |||||||||||
| $ | 10,000 | 3.22 | % |
January 4, 2010 |
$ | 10,000 | 3.00 | % |
July 2, 2009 | |||||||
| 15,000 | 3.33 | % |
August 23, 2010 |
1,000 | 1.27 | % |
December 15, 2009 | |||||||||
| 1,000 | 2.20 | % |
December 15, 2010 |
10,000 | 3.22 | % |
January 4, 2010 | |||||||||
| 1,000 | 2.61 | % |
December 15, 2011 |
15,000 | 3.33 | % |
August 23, 2010 | |||||||||
| 1,000 | 2.82 | % |
December 17, 2012 |
1,000 | 2.20 | % |
December 15, 2010 | |||||||||
| 1,000 | 2.97 | % |
December 16, 2013 |
1,000 | 2.61 | % |
December 15, 2011 | |||||||||
| $ | 29,000 | 1,000 | 2.82 | % |
December 17, 2012 | |||||||||||
| 1,000 | 2.97 | % |
December 16, 2013 | |||||||||||||
| $ | 40,000 | |||||||||||||||
-19-
PACIFIC STATE BANCORP AND SUBSIDIARY
NOTES TO CONSOLIDATED FINANCIAL STATEMENTS
(CONTINUED)
NOTE 8. SUBORDINATED DEBENTURES
The following is a summary of the subordinated debentures payable to the Company's subsidiary grantor trusts at December 31, 2009 and 2008 (dollars in thousands):
|
|
December 31, |
|||||||
|
2009 |
2008 |
|||||||
|
Subordinated debentures due to Pacific State Statutory Trust II with interest payable quarterly based on 3-month LIBOR plus 2.79% (3.04% at December 31, 2009), and redeemable with no premium beginning March 17, 2009 and due March 17, 2034. |
$ | 3,609 | $ | 3,609 | ||||
|
Subordinated debentures due to Pacific State Statutory Trust III with interest payable quarterly based on 3-month LIBOR plus 1.45% (1.70% at December 31, 2009), and redeemable with no premium beginning September 16, 2012 and due September 16, 2037. |
5,155 | 5,155 | ||||||
|
Total subordinated debentures |
$ | 8,764 | $ | 8,764 | ||||
The Company has guaranteed, on a subordinated basis, distributions and other payments due on the trust preferred securities issued by the subsidiary grantor trusts. Interest expense recognized by the Company for the years ended December 31, 2009, 2008 and 2007 related to the subordinated debentures was $265,000, $464,000 and
$702,000, respectively.
On August 13, 2009, the Company deferred the payment of interest on the Company’s $3.5 Million of Floating Rate Junior Subordinated Deferrable Interest Debentures due 2034, issued to Pacific State Statutory Trust II and $5.0 Million of Floating Rate Junior Subordinated Deferrable Interest Debentures due 2037, issued to Pacific
State Statutory Trust III. Pacific Statutory Trusts II and III are grantor trust subsidiaries of the Company which were created solely for the purpose of issuing capital securities, the proceeds of which were loaned to the Company pursuant to the Debentures.
The terms of the Debentures are governed by Indentures, each of which provides generally that the payment of interest is deferrable, at the option of the Company, for up to 20 consecutive quarters; nonpayment of interest for more than such period is an event of default pursuant to which the payment of principal and interest may be accelerated
by the Indenture Trustee or the holders of not less than 25% of the aggregate principal amount of the Debentures then outstanding.
The current deferral of interest, which is applicable for the period commencing September 2009, is the first time that the Company has deferred payment of interest on the Debentures. The obligation to pay interest on the Debentures is cumulative and will continue to accrue currently at the
rate stated in the Debentures. Interest is set at a variable rates based on the three-month LIBOR, reset and payable quarterly, plus 2.79% for the 2034 Debentures and 1.45% for the 2037 Debentures.
-20-
PACIFIC STATE BANCORP AND SUBSIDIARY
NOTES TO CONSOLIDATED FINANCIAL STATEMENTS
(CONTINUED)
NOTE 9. INCOME TAXES
The (benefit from) provision for income taxes for the years ended December 31, 2009, 2008 and 2007 consisted of the following:
|
Federal |
State |
Total |
||||||||||
|
(In Thousands) |
||||||||||||
|
2009 |
||||||||||||
|
Current |
$ | (3,849 | ) | $ | (3,726 | ) | $ | (7,575 | ) | |||
|
Deferred |
820 | (2,631 | ) | (1,811 | ) | |||||||
|
Total before Valuation Allowance |
(3,029 | ) | (6,357 | ) | ( 9,386 | ) | ||||||
|
Imposition of Valuation Allowance |
4,343 | 4,700 | 9,043 | |||||||||
|
Provision/(Benefit)from income taxes |
$ | 1,314 | $ | (1,657 | ) | $ | (343 | ) | ||||
|
2008 |
||||||||||||
|
Current |
$ | 306 | $ | (399 | ) | $ | (93 | ) | ||||
|
Deferred |
(3,839 | ) | (1,440 | ) | (5,279 | ) | ||||||
|
Benefit from income taxes |
$ | (3,533 | ) | $ | (1,839 | ) | $ | (5,372 | ) | |||
|
2007 |
||||||||||||
|
Current |
$ | 2,776 | $ | 873 | $ | 3,649 | ||||||
|
Deferred |
(592 | ) | (163 | ) | (755 | ) | ||||||
|
Provision for income taxes |
$ | 2,184 | $ | 710 | $ | 2,894 | ||||||
Deferred tax assets and liabilities are recognized for future tax consequences attributable to differences between the amounts reported in the financial statements of existing assets and liabilities and their respective tax bases and operating loss and tax credit carryforwards. Deferred tax assets and liabilities are measured using enacted
tax rates expected to apply to taxable income in the years in which those temporary differences are expected to be recovered or settled. Amounts for the current year are based upon estimates and assumptions as of the date of these financial statements and could vary significantly from amounts shown on the tax returns as filed.
A valuation allowance is provided to reduce deferred tax assets to a level which, more likely than not, will be realized. "More likely than not" is defined as greater than 50% chance. Due to the losses recognized during the current period, a valuation allowance has been recorded for substantially all of the Company's
net deferred assets. The determination of the amount of deferred income tax assets which are more likely than not to be realized is primarily dependent on projections of future earnings, which are subject to uncertainty and estimates that may change given economic conditions and other factors. All available evidence, both positive and negative, is considered to determine whether, based on the weight of the evidence, a valuation allowance is needed. The need for this valuation
allowance will be periodically reviewed and benefits will be recognized when they are determined to be realizable.
Based on Management’s judgment, a valuation allowance in the amount of $9,043,000 was needed to reduce the gross deferred tax asset because it is not more likely than not that the gross deferred tax asset will be realized through recoverable taxes or future taxable income. Net deferred tax assets are included with interest
receivable and other assets in the Consolidated Balance Sheets.
-21-
PACIFIC STATE BANCORP AND SUBSIDIARY
NOTES TO CONSOLIDATED FINANCIAL STATEMENTS
(CONTINUED)
Deferred tax assets (liabilities) consisted of the following:
|
December 31, |
||||||||
|
2009 |
2008 |
|||||||
|
(In Thousands) |
||||||||
|
Deferred tax assets: |
||||||||
|
Allowance for loan losses |
$ | 3,039 | $ | 2,064 | ||||
|
OREO Writedown |
1,924 | - | ||||||
|
Goodwill |
146 | - | ||||||
|
Deposit purchase premium |
101 | 109 | ||||||
|
Deferred compensation |
727 | 762 | ||||||
|
Reserve for unfunded commitments |
28 | 92 | ||||||
|
Nonaccrual interest |
640 | 341 | ||||||
|
Other than temporary impairment charges |
796 | 1,455 | ||||||
|
Net operating loss |
2,628 | 4,646 | ||||||
|
Unrealized losses on available-for-sale investment securities |
639 | 1,602 | ||||||
|
Other |
42 | - | ||||||
|
Total deferred tax assets before valuation allowance |
10,710 | 11,071 | ||||||
|
Valuation allowance |
(9,043 | ) | - | |||||
|
Total deferred tax assets |
1,667 | 11,071 | ||||||
|
Deferred tax liabilities: |
||||||||
|
Bank premises and equipment |
$ | (28 | ) | $ | (116 | ) | ||
|
Mark to market adjustments |
(642 | ) | (1,604 | ) | ||||
|
Goodwill |
- | (130 | ) | |||||
|
FHLB dividends |
(103 | ) | (103 | ) | ||||
|
Prepaid expenses |
(160 | ) | (188 | ) | ||||
|
Total deferred tax liabilities |
(933 | ) | (2,141 | ) | ||||
|
Net deferred tax assets |
$ | 734 | $ | 8,930 | ||||
At December 31, 2009, the Company had cumulative Federal and State net operating loss carryforwards (NOLs) of $3,384,000 and $20,644,000, respectively. The federal NOLs begin to expire in 2029 and the state NOLs begin to expire in 2020.
The Company and its subsidiaries file income tax returns in the United States and California jurisdictions. With few exceptions, the Company is no longer subject to Federal income tax examinations for years before 2005 and State income tax examinations by tax authorities for years before 2004.
The total amount of unrecognized tax benefits, including interest and penalties, at December 31, 2009 is not material. The amount of tax benefits that would impact the effective rate, if recognized, is not expected to be material. The Company does not anticipate any significant changes with respect to unrecognized
tax benefits within the next 12 months.
The provision for income taxes differs from amounts computed by applying the statutory Federal income tax rates to operating income before income taxes. The significant items comprising these differences for the years ended December 31, 2009, 2008 and 2007 consisted of the following:
|
2009 |
2008 |
2007 |
||||||||||
|
Federal income tax, at statutory rate |
34.0 | % | 34.0 | % | 34.0 | % | ||||||
|
State Franchise tax, net of Federal tax effect |
4.9 | % | 9.5 | % | 6.3 | % | ||||||
|
Tax exempt investment security income, net |
0.2 | % | 0.3 | % | (0.4 | ) % | ||||||
|
Company owned life insurance, net |
0.4 | % | 1.0 | % | (1.1 | ) % | ||||||
|
Gain on Company owned life insurance |
- | % | 8.3 | % | - | % | ||||||
|
Other |
(35.3 | ) % | (2.2 | ) % | 0.1 | % | ||||||
|
Effective tax rate |
4.2 | % | 50.9 | % | 38.9 | % | ||||||
-22-
PACIFIC STATE BANCORP AND SUBSIDIARY
NOTES TO CONSOLIDATED FINANCIAL STATEMENTS
(CONTINUED)
NOTE 10. COMMITMENTS AND CONTINGENCIES
LEASES
The Company leases branch offices and certain equipment under non-cancelable operating leases. The leases expire on various dates through 2016 and have various renewal options ranging from five to ten years.
Future minimum lease payments are as follows (in thousands):
Year Ending December 31,
(In Thousands)
|
2010 |
$ | 306 | ||
|
2011 |
319 | |||
|
2012 |
328 | |||
|
2013 |
338 | |||
|
2014 |
348 | |||
|
Thereafter |
229 | |||
|
Total |
$ | 1,868 |
Rental expense included in occupancy, furniture and equipment expense totaled $342,000, $496,000, and $383,000 for the years ended December 31, 2009, 2008 and 2007, respectively.
FEDERAL RESERVE REQUIREMENTS
Banks are required to maintain a combination of reserves with the Federal Reserve Bank and vault cash equal to a percentage of their reservable deposits. The reserve balances held with the Federal Reserve Bank or in the form of vault cash totaled $2,852,000 and $4,451,000 as of December 31, 2009 and 2008, respectively.
CORRESPONDENT BANKING AGREEMENTS
The Company maintains funds on deposit with other federally insured financial institutions under correspondent banking agreements. Some of those insured financial institutions have elected to participate in the FDIC sponsored Transaction Account Guarantee Program. Under that program, through June 30, 2010, all noninterest-bearing
transaction accounts are fully guaranteed by the FDIC for the entire amount in the account. Coverage under the Transaction Account Guarantee Program is in addition to and separate from the coverage available under the FDIC's general deposit insurance rules. Uninsured deposits held at institutions not participating in this program totaled $0 at December 31, 2009 and $65,000 at December 31, 2008.
FINANCIAL INSTRUMENTS WITH OFF-BALANCE-SHEET RISK
The Company is a party to financial instruments with off-balance-sheet risk in the normal course of business in order to meet the financing needs of its customers and to reduce its own exposure to fluctuations in interest rates. These financial instruments consist of commitments to extend credit and standby letters of credit. These
instruments involve, to varying degrees, elements of credit and interest rate risk in excess of the amount recognized on the balance sheet.
The Company's exposure to credit loss in the event of nonperformance by the other party for commitments to extend credit and standby letters of credit is represented by the contractual amount of those instruments. The Company uses the same credit policies in making commitments and standby letters of credit as it does for loans
included on the balance sheet.
The following financial instruments represent off-balance-sheet credit risk:
|
December 31, |
||||||||
|
2009 |
2008 |
|||||||
|
(In thousands) |
||||||||
|
Commitments to extend credit |
$ | 20,785 | $ | 55,522 | ||||
|
Standby letters of credit |
$ | 1,394 | $ | 1,557 | ||||
Commitments to extend credit are agreements to lend to a customer as long as there is no violation of any condition established in the contract. Commitments generally have fixed expiration dates or other termination clauses and may require payment of a fee. Since some of the commitments are expected to expire without
being drawn upon, the total commitment amounts do not necessarily represent future cash requirements. The Company evaluates each customer's creditworthiness on a case-by-case basis. The amount of collateral obtained, if deemed necessary by the Company upon extension of credit, is based on management's credit evaluation of the borrower. Collateral held varies, but may include accounts receivable, inventory, equipment, income-producing commercial properties and residential real
estate.
Standby letters of credit are conditional commitments issued by the Company to guarantee the performance or financial obligation of a customer to a third party. The credit risk involved in issuing letters of credit is essentially the same as that involved in extending loans to customers. The fair value of the liability
related to these standby letters of credit, which represents the fees received for issuing the guarantees, was not significant at December 31, 2009 and 2008. The Company recognizes these fees as revenue over the term of the commitment or when the commitment is used.
At December 31, 2009, commercial and agricultural loan commitments represent approximately 58% of total commitments and are generally unsecured or secured by various assets of the borrower. Real estate and construction loan commitments represent approximately 7% of total commitments and are generally secured by property with
a loan-to-value ratio not to exceed 75% to 80% at the time of underwriting. With the decline in the real estate market, the Company has experienced increasing loan-to-value ratios. In cases where loan-to-value ratios have increased to a level above underwriting standards, the Company has reduced available lines to meet those standards. In addition, the Company has reduced open construction commitments from $11,778,000 at December 31, 2008 to $1,533,000 at December 31, 2009. Consumer
loan commitments, including home equity lines of credit, represent the remaining 35% of total commitments and are generally unsecured with the exception of home equity lines of credit.
-23-
PACIFIC STATE BANCORP AND SUBSIDIARY
NOTES TO CONSOLIDATED FINANCIAL STATEMENTS
(CONTINUED)
CONCENTRATIONS OF CREDIT RISK
The Company's customers are primarily located in San Joaquin, Stanislaus, Calaveras, Alameda, and Tuolumne Counties. At December 31, 2009, approximately 26% of the Company's loans are for general commercial uses, including professional, retail and small business, and 3% are for agricultural uses. Additionally, 7% of
the Company's loans are for the construction of residential and commercial real estate and 59% are loans which are collateralized by mortgages on residential and commercial real estate. Generally, real estate loans are secured by real property while commercial and other loans are secured by funds on deposit and business or personal assets. The remaining 5% of the Company's loans are consumer installment loans. Repayment is generally expected from the proceeds of property sales
and permanent financing for real estate construction loans and borrower cash flows for other loans.
CONTINGENCIES
The Company is subject to legal proceedings and claims which arise in the ordinary course of business. Management has reserved for liabilities which have been identified and in the opinion of management, the amount of ultimate liability with respect to such actions will not materially affect the consolidated financial position
or consolidated results of operations of the Company.
NOTE 11. SHAREHOLDERS' EQUITY
DIVIDENDS
The Company's ability to pay cash dividends is dependent on dividends paid to it by the Bank and limited by California corporation law. Under California law, the holders of common stock of the Company are entitled to receive dividends when and as declared by the Board of Directors, out of funds legally available, subject to certain
restrictions. The California general corporation law prohibits the Company from paying dividends on its common stock unless: (i) its retained earnings, immediately prior to the dividend payment, equals or exceeds the amount of the dividend or (ii) immediately after giving effect to the dividend, the sum of the Company's assets (exclusive of goodwill and deferred charges) would be at least equal to 125% of its liabilities (not including deferred taxes, deferred income and other deferred liabilities)
and the current assets of the Company would be at least equal to its current liabilities, or, if the average of its earnings before taxes on income and before interest expense for the two preceding fiscal years was less than the average of its interest expense for the two preceding fiscal years, at least equal to 125% of its current liabilities. In addition, the Company's ability to pay dividends is subject to certain covenants contained in the indentures related to the trust preferred securities issued
by the Trusts.
Upon declaration by the Board of Directors of the Company, all shareholders of record will be entitled to receive dividends. A significant source of cash for the Company is dividends from the Bank. The California Financial Code restricts the total dividend payment of any bank in any calendar year to the lesser of
(1) the bank's retained earnings or (2) the bank's net income for its last three fiscal years, less distributions made to shareholders during the same three-year period. As a member of the Federal Reserve System, the Bank is also subject to similar restrictions imposed by Federal law. At December 31, 2009, the Bank did have sufficient retained earnings to pay a dividend.
On February 18, 2010 the Company and the Bank entered into a Written Agreement with the California Department of Financial Institutions (“DFI”) and the San Francisco Federal Reserve Bank (“FRB”). Under the Written Agreement, the Company and the Bank are prohibited from declaring or paying any dividends
without the prior written approval of the Federal Reserve Bank of San Francisco, the Director of the Division of Banking Supervision and Regulation of the Board of Governors, and the California Department of Financial Institutions. For more information related to the Written Agreement, see Form 8-K filed on February 23, 2010.
EARNINGS (LOSS) PER SHARE
A reconciliation of the numerators and denominators of the basic and diluted earnings (loss) per share computations is as follows:
|
For The Year Ended December 31, |
||||||||||||
|
(Amounts in thousands, except per share data) |
2009 |
2008 |
2007 |
|||||||||
|
Basic (Loss) Earnings Per Share Computations: |
||||||||||||
|
Net (loss) income |
$ | (23,038 | ) | $ | (5,190 | ) | $ | 4,549 | ||||
|
Average common shares outstanding |
3,721 | 3,710 | 3,687 | |||||||||
|
Basic (loss) earnings per share |
$ | (6.19 | ) | $ | (1.40 | ) | $ | 1.23 | ||||
|
Diluted Earnings (Loss) Per Share Computations: |
||||||||||||
|
Net (loss) income |
$ | (23,038 | ) | $ | (5,190 | ) | $ | 4,549 | ||||
|
Average common shares outstanding |
3,721 | 3,710 | 3,687 | |||||||||
|
Effect of stock options |
- | - | 317 | |||||||||
|
Total Weighted Average Shares and Common Stock Equivalents |
3,721 | 3,710 | 4,004 | |||||||||
|
Diluted (loss) earnings per share |
$ | (6.19 | ) | $ | (1.40 | ) | $ | 1.14 | ||||
In 2009 and 2008, there were no adjustments for the effect of stock options since any adjustment would be anti-dilutive to the Company’s net loss. 30,000 stock options were not included in the 2007 calculation as they were anti-dilutive.
-24-
PACIFIC STATE BANCORP AND SUBSIDIARY
NOTES TO CONSOLIDATED FINANCIAL STATEMENTS
(CONTINUED)
STOCK OPTION PLAN
The Company currently has one shareholder approved stock option plan, the Pacific State Bancorp 1997 Stock Option Plan. At December 31, 2009, the plan has 663,769 shares remaining as reserved for issuance for options already granted. Under the 1997 Plan 26,954 shares of common stock remain reserved for future issuance to directors through
nonstatutory agreements. The plan requires that the price may not be less than the fair market value of the Company’s common stock at the date of grant and that the stock must be paid in full at the time the option is exercised. The Plan does not provide for the settlement of awards in cash and new shares are issued upon the exercise of the options. There was one grant of 30,000 stock options made in 2007 and no options were granted in 2009 or 2008. The options under the plan expire
on dates determined by the Board of Directors, but not longer than ten years from the date of grant. The vesting period is generally over five years.
STOCK OPTION COMPENSATION EXPENSE
The compensation cost that has been charged against income for stock options was $56,000, $270,000 and $309,000 for the years ended December 31, 2009, 2008 and 2007, respectively. The total income tax benefit recognized in shareholders equity for stock options exercised was $0, $4,000 and $223,000 for the years ended December
31, 2009, 2008 and 2007, respectively.
At December 31, 2009, the total compensation cost related to nonvested stock option awards granted to employees under the Company’s stock option plans but not yet recognized was $0. In December of 2009, the Company announced the resignation of a member on the Board of Directors. The resignation of this Director
resulted in the nonvested stock options granted to this Director to be canceled. The canceled stock options were the last remaining nonvested stock options that the Company had recorded. As such, there will no longer be expense related to stock option activity unless additional stock options are granted. Stock option compensation expense is recognized on a straight-line basis over the vesting period of the option. The total fair value of options vested during the years
ended December 31, 2009, 2008 and 2007 was $56,000, $270,000 and $309,000, respectively.
A summary of the activity within the plan follows:
|
2009 |
2008 | |||||||
|
Shares |
Weighted Average Exercise Price |
Shares |
Weighted Average Exercise Price | |||||
|
Options outstanding, |
||||||||
|
beginning of year |
645,869 |
$ |
7.73 |
656,769 |
$ |
7.69 | ||
|
Options granted |
- |
$ |
- |
- |
$ |
- | ||
|
Options exercised |
(3,600) |
$ |
5.42 |
(10,900) |
$ |
4.98 | ||
|
Options cancelled |
(141,200) |
$ |
8.99 |
- |
$ |
- | ||
|
Options outstanding, |
||||||||
|
end of year |
501,069 |
$ |
7.40 |
645,869 |
$ |
7.73 | ||
|
Options exercisable, |
||||||||
|
end of year |
501,069 |
$ |
7.40 |
621,869 |
$ |
7.27 | ||
The aggregate intrinsic value is calculated as the difference between the exercise price of the underlying awards and the quoted price of the Company’s common stock for options that were in-the-money at December 31, 2009. The intrinsic value of options outstanding and exercisable as of December 31, 2009 relating to the
above stock option plans was $0. The intrinsic value of options vested or expected to vest as of December 31, 2009 relating to the above stock option plans was $0. The weighted average remaining contractual term for options outstanding and exercisable was 3.48 years. During the years ended December 31, 2009, 2008 and 2007, the aggregate intrinsic value of options exercised was $0, $52,000 and $569,000, respectively.
The cash received from options exercised for the years ended December 31, 2009, 2008 and 2007 was $20,000, $75,000 and $235,000, respectively. The actual tax benefit realized for the tax deductions from options exercised was $0, $4,000 and $223,000 for the years ended December 31, 2009, 2008 and 2007, respectively.
-25-
PACIFIC STATE BANCORP AND SUBSIDIARY
NOTES TO CONSOLIDATED FINANCIAL STATEMENTS
(CONTINUED)
REGULATORY CAPITAL
The Company and the Bank are subject to certain regulatory capital requirements administered by the FRB and the Federal Deposit Insurance Corporation (FDIC). Failure to meet these minimum capital requirements can initiate certain mandatory, and possibly additional discretionary, actions by regulators that, if undertaken, could
have a direct material effect on the Company’s consolidated financial statements. Under capital adequacy guidelines and the regulatory framework for prompt corrective action, the Bank must meet specific capital guidelines that involve quantitative measures of its assets, liabilities and certain off-balance-sheet items as calculated under regulatory accounting practices. The Company’s and the Bank’s capital amounts and classification are also subject to qualitative judgments
by the regulators about components, risk weightings and other factors.
Quantitative measures established by regulation to ensure capital adequacy require the Company and the Bank to maintain minimum amounts and ratios of total and Tier 1 capital to risk-weighted assets and of Tier 1 capital to average assets as set forth on the following table. Each of these components is defined in the regulations.
The most recent notification from the FDIC categorized the Bank as under-capitalized under the regulatory framework for prompt correction action. To be considered well capitalized, the Bank must maintain minimum total risk-based, Tier 1 risk-based and Tier 1 leverage ratios as set forth below. There are no conditions
or events since December 31, 2009 that management believes have changed the Bank's category.
The Bank is also subject to a regulatory order with the FRB and the DFI that calls for the Bank to develop a written capital plan to maintain sufficient capital at the Bank. A capital restoration plan has been developed to address this deficiency, which contemplates several approaches to increasing capital to acceptable levels. There
can be no assurances that these approaches will be successful. Should the Company or the Bank be unable to increase capital to acceptable levels, or should capital levels deteriorate further, the Company and/or the Bank could be subject to additional regulatory action.
|
To Be Well Capitalized |
||||||||||||||||||||||||
|
For Capital |
Under Prompt Corrective |
|||||||||||||||||||||||
|
(Dollars in thousands) |
Actual |
Adequacy Purposes |
Action Provisions |
|||||||||||||||||||||
|
Minimum |
Minimum |
Minimum |
Minimum |
|||||||||||||||||||||
|
December 31, 2009 |
Amount |
Ratio |
Amount |
Ratio |
Amount |
Ratio |
||||||||||||||||||
|
Pacific State Bancorp: |
||||||||||||||||||||||||
|
Total capital (to risk-weighted assets) |
$ | 19,103 | 6.5 | % | $ | 23,388 | 8.0 | % | N/A | N/A | ||||||||||||||
|
Tier I capital (to risk-weighted assets) |
$ | 8,796 | 3.0 | % | $ | 11,694 | 4.0 | % | N/A | N/A | ||||||||||||||
|
Tier I capital (to average assets) …… |
$ | 8,796 | 2.3 | % | $ | 15,462 | 4.0 | % | N/A | N/A | ||||||||||||||
|
Pacific State Bank: |
||||||||||||||||||||||||
|
Total capital (to risk-weighted assets) |
$ | 19,004 | 6.5 | % | $ | 23,367 | 8.0 | % | $ | 29,209 | 10.0 | % | ||||||||||||
|
Tier I capital (to risk-weighted assets) |
$ | 15,273 | 5.2 | % | $ | 11,683 | 4.0 | % | $ | 17,525 | 6.0 | % | ||||||||||||
|
Tier I capital (to average assets) …… |
$ | 15,273 | 4.0 | % | $ | 15,452 | 4.0 | % | $ | 19,315 | 5.0 | % | ||||||||||||
|
December 31, 2008 |
||||||||||||||||||||||||
|
Pacific State Bancorp: |
||||||||||||||||||||||||
|
Total capital (to risk-weighted assets) |
$ | 41,903 | 11.5 | % | $ | 29,143 | 8.0 | % | N/A | N/A | ||||||||||||||
|
Tier I capital (to risk-weighted assets) |
$ | 37,336 | 10.3 | % | $ | 14,562 | 4.0 | % | N/A | N/A | ||||||||||||||
|
Tier I capital (to average assets) …… |
$ | 37,336 | 8.6 | % | $ | 17,310 | 4.0 | % | N/A | N/A | ||||||||||||||
|
Pacific State Bank: |
||||||||||||||||||||||||
|
Total capital (to risk-weighted assets) |
$ | 41,275 | 11.3 | % | $ | 29,107 | 8.0 | % | $ | 36,384 | 10.0 | % | ||||||||||||
|
Tier I capital (to risk-weighted assets) |
$ | 36,708 | 10.1 | % | $ | 14,554 | 4.0 | % | $ | 21,830 | 6.0 | % | ||||||||||||
|
Tier I capital (to average assets) |
$ | 36,708 | 8.7 | % | $ | 16,819 | 4.0 | % | $ | 21,023 | 5.0 | % | ||||||||||||
During the fourth quarter of 2009, the Company and the Bank entered into the Written Agreement with the FRB and the CDFI. Additionally, on April 15, 2010, the Bank executed a Waiver and Consent to an Order of the CDFI (the “Consent”) requiring the Bank, within 90 days of the effective
date of the Order, to increase and to maintain tangible capital at a level equal to 10% of assets. The effective date will be the date that the CDFI executes the Order per se. As of December 31, 2009, the Bank had a ratio of tangible capital to assets of 3.9%, which was not sufficient to meet the higher level that the Bank would be obligated to maintain under the Consent. As a result, if within 90 days of the effective
date of the Order the Bank cannot comply with the Consent provisions, the Bank may be subject to further supervisory action, which could have a material adverse effect on its results of operations, financial condition and business.
-26-
PACIFIC STATE BANCORP AND SUBSIDIARY
NOTES TO CONSOLIDATED FINANCIAL STATEMENTS
(CONTINUED)
NOTE 12. OTHER EXPENSES
Other expenses consisted of the following:
|
Year Ended December 31, |
||||||||||||
|
(In thousands) |
||||||||||||
|
2009 |
2008 |
2007 |
||||||||||
|
Other operating expenses |
$ | 1,208 | $ | 1,735 | $ | 1,509 | ||||||
|
Professional Fees |
1,110 | 1,253 | 294 | |||||||||
|
Data Processing |
812 | 588 | 328 | |||||||||
|
Telephone |
261 | 265 | 251 | |||||||||
|
Directors Fees |
210 | 321 | 290 | |||||||||
|
Appraisal Fees |
204 | 262 | 266 | |||||||||
|
Advertising and promotion |
182 | 408 | 564 | |||||||||
|
Postage, stationery and supplies |
131 | 272 | 212 | |||||||||
|
Total other expense |
$ | 4,118 | $ | 5,104 | $ | 3,714 | ||||||
NOTE 13. LOANS TO RELATED PARTIES
During the normal course of business, the Company enters into loans with related parties, including executive officers and directors. These loans are made with substantially the same terms, including rates and collateral, as loans to unrelated parties. The following is a summary of the aggregate activity involving
related party borrowers (in thousands):
|
Balance January 1, 2009 |
$ | 4,180,000 | ||
|
Disbursements |
532,000 | |||
|
Amounts repaid |
(80,000 | ) | ||
|
Loans with parties no longer considered related |
(3,787,000 | ) | ||
|
Balance, December 31, 2009 |
$ | 845,000 | ||
|
Undisbursed commitments to related parties, December 31, 2009 |
$ | 41,000 |
-27-
PACIFIC STATE BANCORP AND SUBSIDIARY
NOTES TO CONSOLIDATED FINANCIAL STATEMENTS
(CONTINUED)
NOTE 14. EMPLOYEE BENEFIT PLANS
The 401(k) Savings Plan established by the Bank in 1990 was converted into a Company plan in 2002. Under the provisions of the plan, the Company matches one-half of the employees' contributions up to a maximum of three percent of an employee's annual salary. All employees who are at least 21 years of age and have completed
one year of service are eligible under the plan. The Company's contributions vest at a rate of 20% after one year of service and an additional 20% for each year thereafter. Contributions to the plan totaled $44,000, $66,000 and $18,000 for the years ended December 31, 2009, 2008 and 2007, respectively.
SALARY CONTINUATION AND RETIREMENT PROGRAMS
The Board of Directors approved salary continuation and retirement programs for six key employees in 2003, one in 2007 and an additional 2 in 2008. Three of these agreements have been terminated due to the death of one employee and the resignation of two others. The accrued balances related to the terminated contracts
were reversed from expense in 2008 and 2009. Under these plans, the employees will receive monthly payments for twenty years after retirement. These benefits are substantially equivalent to those available under split-dollar life insurance policies purchased by the Company on the lives of the employees. In addition, the estimated present value of these future benefits is accrued over the period from the effective dates of the plans until the participants' expected retirement dates
based on a 7% discount rate. The expense recognized under these plans for the years ended December 31, 2009 and 2008 totaled $189,000 and $90,000, respectively. Accrued compensation payable under the plans totaled $1,223,000 and $1,106,000 at December 31, 2009 and 2008, respectively.
In connection with these plans, the Company purchased single premium life insurance policies with cash surrender values totaling $7,030,000 at December 31, 2009. Income earned on these policies, net of expenses, totaled $279,000, $318,000 and $246,000 for the years ended December 31, 2009, 2008 and 2007, respectively. Income
earned on these policies is not subject to federal or state income tax under certain circumstances.
NOTE 15. COMPREHENSIVE (LOSS) INCOME
Comprehensive (loss) income is a more inclusive financial reporting methodology that includes disclosure of other comprehensive (loss) income that historically has not been recognized in the calculation of net income. The Company's only source of other comprehensive income (loss) is unrealized gains and losses on the Company's
available-for-sale investment securities. Total comprehensive income and the components of accumulated other comprehensive income (loss) are presented in the consolidated statement of changes in shareholders' equity.
The Company has restated comprehensive loss for the year ended December 31, 2008 to properly reflect the effect of changes in unrealized losses on available-for-sale investment securities included in other comprehensive loss. Previously reported total comprehensive loss for the year ended December 31, 2008 was $1,090,000 and
the amount has been corrected to report total comprehensive loss for the year ended December 31, 2008 of $7,100,000. This change was made to correct a mathematical error in the computation of comprehensive loss and did not effect the Company’s financial position at December 31, 2008, or the results of operations or its cash flows for the year then ended.
At December 31, 2009, 2008 and 2007, the Company held securities classified as available-for-sale which had changes in net unrealized gains or losses as follows:
|
2009 |
2008 |
2007 |
||||||||||
|
Other comprehensive (loss) income: |
||||||||||||
|
Unrealized holding (losses) gains arising during the year |
(787 | ) | (13,467 | ) | (565 | ) | ||||||
|
Tax (expense) benefit on unrealized holding gains |
(961 | ) | 5,545 | 226 | ||||||||
|
Reclassification adjustment for unrealized loss and other than temporary impairment charge |
3,125 | 10,214 | - | |||||||||
|
Tax benefit of reclassification at adjustment |
- | (4,203 | ) | - | ||||||||
|
Total change in unrealized gain (loss) on available for sale securities |
$ | 1,377 | $ | (1,911 | ) | $ | (339 | ) | ||||
-28-
PACIFIC STATE BANCORP AND SUBSIDIARY
NOTES TO CONSOLIDATED FINANCIAL STATEMENTS
(CONTINUED)
NOTE 16. DISCLOSURES ABOUT FAIR VALUE OF FINANCIAL INSTRUMENTS
The estimated carrying and fair values of the Company's financial instruments are as follows:
|
(In thousands) |
December 31, 2009 |
December 31, 2008 |
||||||||||||||
|
Carrying |
Fair |
Carrying |
Fair |
|||||||||||||
|
Amount |
Value |
Amount |
Value |
|||||||||||||
|
Financial assets: |
||||||||||||||||
|
Cash and due from banks |
$ | 10,517 | 10,517 | $ | 16,700 | $ | 16,700 | |||||||||
|
Federal funds sold |
45,568 | 45,568 | 21,811 | 21,811 | ||||||||||||
|
Investment securities |
23,941 | 23,941 | 39,738 | 39,738 | ||||||||||||
|
Loans, net |
245,846 | 244,698 | 301,945 | 305,257 | ||||||||||||
|
Company owned life insurance |
7,030 | 7,030 | 6,751 | 6,751 | ||||||||||||
|
Accrued interest receivable |
1,022 | 1,022 | 1,394 | 1,394 | ||||||||||||
|
Other investments |
2,495 | 2,495 | 2,447 | 2,447 | ||||||||||||
|
Financial liabilities: |
||||||||||||||||
|
Deposits |
$ | 322,425 | 324,731 | $ | 340,980 | $ | 343,084 | |||||||||
|
Other borrowings |
29,000 | 29,495 | 40,000 | 40,019 | ||||||||||||
|
Subordinated debentures |
8,764 | 1,753 | 8,764 | 2,918 | ||||||||||||
|
Accrued interest payable |
1,393 | 1,393 | 2,102 | 2,102 | ||||||||||||
These estimates do not reflect any premium or discount that could result from offering the Company's entire holdings of a particular financial instrument for sale at one time, nor do they attempt to estimate the value of anticipated future business related to the instruments. In addition, the tax ramifications related to the
realization of unrealized gains and losses can have a significant effect on fair value estimates and have not been considered in any of these estimates.
The following methods and assumptions were used to estimate the fair value of financial instruments. For cash and cash equivalents, variable-rate loans and leases, accrued interest receivable and payable, FHLB stock, demand deposits and short-term borrowings, the carrying amount is estimated to be fair value. For
investment securities, fair values are based on quoted market prices, quoted market prices for similar securities and indications of value provided by brokers. The fair values for fixed-rate loans are estimated using discounted cash flow analyses, using interest rates currently being offered at each reporting date for loans with similar terms to borrowers of comparable creditworthiness. Fair values for fixed-rate certificates of deposit are estimated using discounted cash flow analyses using interest
rates offered at each reporting date by the Company for certificates with similar remaining maturities. The fair value of subordinated debentures was determined based on the current market for like-kind instruments of a similar maturity and structure. The fair values of commitments are estimated using the fees currently charged to enter into similar agreements and are not significant and, therefore, not included in the above table.
FAIR VALUE MEASUREMENTS
Fair Value Hierarchy
The Company groups its assets and liabilities measured at fair value in three levels, based on the markets in which the assets and liabilities are traded and the reliability of the assumptions used to determine fair value. Valuations within these levels are based upon:
Level 1 – Quoted market prices for identical instruments traded in active exchange markets.
Level 2 – Quoted prices for similar instruments in active markets, quoted prices for identical or similar instruments in markets that are not active, and model-based valuation techniques for which all significant assumptions are observable or can be corroborated by observable market data.
Level 3 – Model-based techniques that use at least one significant assumption not observable in the market. These unobservable assumptions reflect the Company's estimates of assumptions that market participants would use on pricing the asset or liability. Valuation techniques include management judgment and estimation
which may be significant.
Assets Recorded at Fair Value
The following tables present information about the Company's assets and liabilities measured at fair value on a recurring and nonrecurring basis as of December 31, 2009:
Recurring Basis:
The Company is required or permitted to record the following assets at fair value on a recurring basis under other accounting pronouncements.
|
December 31, 2009 |
||||||||||||||||
|
Description |
Fair Value |
Level 1 |
Level 2 |
Level 3 |
||||||||||||
|
Available-for-sale investment securities |
$ | 23,906 | $ | 8,517 | $ | 15,100 | $ | 289 | ||||||||
|
December 31, 2008 |
||||||||||||||||
|
Description |
Fair Value |
Level 1 |
Level 2 |
Level 3 |
||||||||||||
|
Available-for-sale investment securities |
$ | 39,738 | $ | 39,738 | $ | - | $ | - | ||||||||
Fair values for available-for-sale investment securities, which include debt securities of U.S. Government treasuries, U.S. Governmental agencies, obligations of states and political subdivisions and corporate bonds are based on quoted market prices for similar securities.
-29-
PACIFIC STATE BANCORP AND SUBSIDIARY
NOTES TO CONSOLIDATED FINANCIAL STATEMENTS
(CONTINUED)
Non-recurring Basis:
The Company may be required, from time to time, to measure certain assets at fair value on a non-recurring basis. These include assets that are measured at the lower of cost or market value that were recognized at fair value which was below cost at the reporting date.
|
December 31, 2009 |
||||||||||||||||||||
|
Description |
Fair Value |
Level 1 |
Level 2 |
Level 3 |
Total Losses |
|||||||||||||||
|
Impaired loans |
$ | 60,551 | $ | - | $ | 60,551 | $ | - | $ | 2,876 | ||||||||||
|
Other real estate |
10,934 | - | 10,934 | - | 4,504 | |||||||||||||||
|
Total |
$ | 71,485 | $ | - | $ | 71,485 | $ | - | $ | 7,380 | ||||||||||
|
December 31, 2008 |
||||||||||||||||||||
|
Description |
Fair Value |
Level 1 |
Level 2 |
Level 3 |
Total Losses |
|||||||||||||||
|
Impaired loans |
$ | 25,301 | $ | - | $ | 25,301 | $ | - | $ | 2,926 | ||||||||||
|
Other real estate |
2,029 | - | 2,029 | - | - | |||||||||||||||
|
Total |
$ | 27,330 | $ | - | $ | 27,330 | $ | - | $ | 2,926 | ||||||||||
Impaired loans are reported at carrying value of loans for which adjustments are predominantly based on the appraised value of the collateral and loans considered impaired under FASB ASC 310-10-35, Subsequent Measurement of Receivables, where a specific reserve has been established.
The fair value of other real estate owned that was measured at fair value subsequent to their initial classification as other real estate.
At December 31, 2009, loans and other real estate measured at fair value on a non-recurring basis were measured for impairment by valuing the underlying collateral based on third-party appraisals, which are level 2 fair value measurements. Values are reported net of specific reserves.
-30-
PACIFIC STATE BANCORP AND SUBSIDIARY
NOTES TO CONSOLIDATED FINANCIAL STATEMENTS
(CONTINUED)
NOTE 17. PARENT ONLY CONDENSED FINANCIAL STATEMENTS
CONDENSED BALANCE SHEET
December 31, 2009 and 2008
(In thousands)
|
2009 |
2008 |
|||||||
|
ASSETS |
||||||||
|
Cash and cash equivalents |
$ | 25 | $ | 470 | ||||
|
Investment in bank subsidiary |
14,353 | 35,157 | ||||||
|
Investment in Pacific State Statutory Trust II and III |
264 | 264 | ||||||
|
Other assets |
- | 204 | ||||||
|
Total assets |
$ | 14,642 | $ | 36,095 | ||||
|
LIABILITIES AND |
||||||||
|
SHAREHOLDERS' EQUITY |
||||||||
|
Liabilities: |
||||||||
|
Subordinated debentures |
$ | 8,764 | $ | 8,764 | ||||
|
Other liabilities |
199 | 47 | ||||||
|
Total liabilities |
8,963 | 8,811 | ||||||
|
Shareholders' equity: |
||||||||
|
Common stock |
10,823 | 10,767 | ||||||
|
Retained earnings |
(4,224 | ) | 18,814 | |||||
|
Accumulated other comprehensive loss, net of taxes |
(920 | ) | (2,297 | ) | ||||
|
Total shareholders' equity |
5,679 | 27,284 | ||||||
|
Total liabilities and shareholders' equity |
$ | 14,642 | $ | 36,095 | ||||
-31-
PACIFIC STATE BANCORP AND SUBSIDIARY
NOTES TO CONSOLIDATED FINANCIAL STATEMENTS
(CONTINUED)
CONDENSED STATEMENT OF INCOME
For the Years Ended December 31, 2009, 2008 and 2007
(In thousands)
|
2009 |
2008 |
2007 |
||||||||||
|
Income: |
||||||||||||
|
Dividends declared by bank subsidiary |
$ | - | $ | 650 | $ | - | ||||||
|
Interest |
8 | 15 | 21 | |||||||||
|
Total income |
8 | 665 | 21 | |||||||||
|
Expenses: |
||||||||||||
|
Interest on subordinated debentures |
265 | 464 | 702 | |||||||||
|
Salaries and employee benefits |
108 | 99 | 95 | |||||||||
|
Professional |
113 | 95 | 102 | |||||||||
|
Other expenses |
125 | 227 | 148 | |||||||||
|
Total expenses |
611 | 885 | 1,047 | |||||||||
|
Loss before equity in undistributed income of subsidiary |
(603 | ) | (220 | ) | (1,026 | ) | ||||||
|
Equity in undistributed income of subsidiary |
(22,237 | ) | (5,328 | ) | 5,153 | |||||||
|
(Loss) Income before income tax benefit |
(22,840 | ) | (5,548 | ) | 4,127 | |||||||
|
Income tax expense (benefit) |
198 | (358 | ) | (422 | ) | |||||||
|
Net (loss) income |
$ | (23,038 | ) | $ | (5,190 | ) | 4,549 | |||||
-32-
PACIFIC STATE BANCORP AND SUBSIDIARY
NOTES TO CONSOLIDATED FINANCIAL STATEMENTS
(CONTINUED)
CONDENSED STATEMENT OF CASH FLOWS
For the Years Ended December 31, 2009, 2008 and 2007
(In Thousands)
|
2009 |
2008 |
2007 |
||||||||||
|
Cash flows from operating activities: |
||||||||||||
|
Net (loss) income |
$ | (23,038 | ) | $ | (5,190 | ) | $ | 4,549 | ||||
|
Adjustments to reconcile net income (loss) to net |
||||||||||||
|
cash provided by (used in) operating activities: |
||||||||||||
|
Undistributed net loss (income) of subsidiary |
22,237 | 5,328 | (5,153 | ) | ||||||||
|
Decrease (increase) in other assets |
204 | 1,497 | (529 | ) | ||||||||
|
(Decrease) increase in other liabilities |
152 | (14 | ) | 61 | ||||||||
|
Net cash provided by (used in) |
||||||||||||
|
operating activities |
(445 | ) | 1,621 | (1,072 | ) | |||||||
|
Cash flows from investing activities: |
||||||||||||
|
Proceeds from the retirement of Pacific State |
||||||||||||
|
Statutory Trust I |
- | - | 155 | |||||||||
|
Investment in bank subsidiary |
- | (1,500 | ) | - | ||||||||
|
Investment in Pacific State Statutory |
||||||||||||
|
Trust III |
- | - | (155 | ) | ||||||||
|
Net cash provided by (used in) |
||||||||||||
|
investing activities |
- | (1,500 | ) | - | ||||||||
|
Cash flows from financing activities: |
||||||||||||
|
Proceeds from issuance of junior |
||||||||||||
|
subordinated debentures |
- | - | 5,000 | |||||||||
|
Retirement of junior subordinated debentures |
- | - | (5,000 | ) | ||||||||
|
Stock options exercised and related |
||||||||||||
|
tax benefit |
- | 349 | 458 | |||||||||
| - | ||||||||||||
|
Net cash provided by financing |
||||||||||||
|
activities |
- | 349 | 458 | |||||||||
|
Increase (decrease) in cash and cash equivalents |
(445 | ) | 470 | (614 | ) | |||||||
|
Cash and cash equivalents at beginning |
||||||||||||
|
of year |
470 | - | 614 | |||||||||
|
Cash and cash equivalents at end of year |
$ | 25 | $ | 470 | $ | - | ||||||
|
Non-cash investing activities: |
||||||||||||
|
Net unrealized (gain) loss on |
||||||||||||
|
available-for-sale investment securities |
$ | (2,338 | ) | $ | 3,253 | $ | (565 | ) | ||||
-33-
FORWARD LOOKING STATMENTS
Certain statements discussed or incorporated by reference in this Annual Report including, but not limited to, information concerning possible or assumed future results of operations of the Company set forth in the Management's Discussion and Analysis of Financial Condition and Results of
Operation, are forward-looking statements within the meaning of the Securities Exchange Act of 1934 (the "Exchange Act"). Forward-looking statements include statements in which words such as "expect," "anticipate," "intend," "plan," "believe," "estimate," "consider" or variants or similar expressions are used. The Company’s actual future results and shareholder values may differ materially from those anticipated and expressed in these forward-looking statements, which are based on management's beliefs and
assumptions and on information currently available to management, and are subject to risks and uncertainties that could cause actual results to differ materially from those projected. Such risks and uncertainties include, among others, (1) competitive pressures in the banking industry; (2) changes in the interest rate environment; (3) general economic conditions, either nationally or regionally; (4) changes in the regulatory environment; (5) changes in business conditions and inflation; and (6) changes in securities
markets. Many of these factors are beyond the Company’s ability to control or predict. Investors are cautioned not to put undue reliance on any forward-looking statements. In addition, the Company does not have any intention or obligation to update forward-looking statements contained in this Annual Report, even if new information, future events or other circumstances have made them incorrect or misleading. Except as specifically noted herein all references to the "Company" refer to
Pacific State Bancorp, a California corporation.
-34-
MANAGEMENT'S DISCUSSION AND ANALYSIS OF FINANCIAL CONDITION AND RESULTS OF OPERATIONS
GENERAL DESCRIPTION OF BUSINESS
Pacific State Bancorp (the “Company”) is a holding company with one bank subsidiary, Pacific State Bank, (the “Bank”), and two unconsolidated subsidiary grantor trusts, Pacific State Statutory Trusts II and III. Pacific State Bancorp commenced operations on June 24, 2002 after acquiring all of the outstanding
shares of Pacific State Bank. The Bank is a California state chartered bank formed November 2, 1987. The Bank is a member of the Federal Reserve System. The Bank’s primary source of revenue is interest on loans to customers who are predominantly small to middle-market businesses and middle-income individuals. Pacific State Statutory Trusts II and III are unconsolidated, wholly owned statutory business trusts formed in March 2004 and June 2007, respectively for the exclusive purpose
of issuing and selling trust preferred securities.
The Bank conducts a general commercial banking business, primarily in the five county regions that comprises Alameda, Calaveras, San Joaquin, Stanislaus and Tuolumne counties. The Bank offers commercial banking services to residents and employers of businesses in the Bank’s service area, including professional firms and
small to medium sized retail and wholesale businesses and manufacturers. The Company as of March 31, 2010 had 89 employees, including 41 officers. The Bank does not engage in any non-bank lines of business. The business of the Bank is not to any significant degree seasonal in nature. The Bank has no operations outside California and has no material amount of loans or deposits concentrated among any one or few persons, groups or industries. The Bank operates nine branches with
its Administrative Office and one branch located at 1899 W. March Lane, in Stockton, California; additional branches are located in Stockton and in the communities of Angels Camp, Arnold, Groveland, Lodi, Modesto, Tracy and Hayward, California.
Pacific State Bancorp common stock trades on the NASDAQ Global Market under the symbol of “PSBC”.
BUSINESS PLAN
The focus of the Company’s business plan is to attract “Business Relationship” small, medium and large accounts, but not to the exclusion of any other business which the Company can reasonably and profitably attract. In order to provide a level of service to attract such customers, the Company has structured
its specific services and charges on a basis which management believes to be profitable, taking into consideration other aspects of the account relationship. The Company offers a full range of banking services to its customers intended to attract the following specific types of accounts: relatively large consumer accounts; professional group and association accounts, including the accounts of groups or firms of physicians, dentists, attorneys and accountants; and accounts of small to medium-sized businesses
engaged in retail, wholesale, light industrial, manufacturing, agricultural and service activities.
TRUST SUBSIDIARIES
The Company during 2004 and 2007 established two subsidiary grantor trusts. Pacific State Statutory Trusts II and III (the “Trusts”). The Trusts were established for the sole purpose of issuing capital securities (“Capital Securities”) pursuant to declarations of trust (the “Declarations”). The
proceeds from the sale of the Capital Securities were loaned to the Company as subordinated debentures (the “Debentures”) issued to the Trusts pursuant to indentures (the “Indentures”). Interest payments on the Debentures will flow through the Trusts to the Pooling Vehicles, which are the holders of the Capital Securities and similar securities issued by other financial institutions. Payments of distributions by the Trusts to the Pooling Vehicle are guaranteed by
the Company. See Note 8 to the Company’s consolidated financial statements included with this report.
Proceeds from the issuance of the 2004 subordinated debentures were used to provide the Bank with an additional $3.5 million in capital in order to support the continued growth of the Bank. Proceeds from the issuance of the 2007 subordinated debentures were used to retire the 2002 subordinated debenture issuance.
PRODUCT LINES AND SERVICES
The Bank currently offers the following general banking services at all of its branches: commercial, construction, agricultural and real estate loans and personal credit lines, interest on checking, U.S. Savings bond services, domestic and foreign drafts, banking by appointment, automatic transfer of funds between savings and checking accounts,
business courier services, checking and savings accounts for personal and business purposes, domestic letters of credit, a depository for MasterCard and Visa drafts, federal depository services, cash management assistance, wire and telephone transfers, Individual Retirement Accounts, time certificates of deposit, courier service for non-cash deposits, Visa and MasterCard, revolving lines of credit to consumers secured by deeds of trust on private residences, unsecured overdraft protection credit lines attached
to checking accounts, ATM cards and MasterMoney debit cards via the Star, Cirrus, Plus, MasterCard and Visa networks.
The Bank is not authorized to offer trust services. The Federal Reserve Bank of San Francisco is the Company’s primary correspondent relationship. The Bank currently also has correspondent relationships with City National Bank in Beverly Hills, California, First Tennessee Bank in Memphis, Tennessee, Wells Fargo
Bank, San Francisco, California and Pacific Coast Bankers Bank, San Francisco, California.
The Bank recognizes that, in order to be competitive, it must attract a certain number of consumer accounts. Individual Retirement Accounts, Visa and MasterCard, revolving lines of credit to consumers secured by deeds of trust on private residences, and unsecured overdraft protection credit lines attached to checking accounts
currently offered by the Bank are designed to appeal particularly to consumers. Moreover, participation in large-scale ATM networks assists the Company in competing for consumer accounts.
The Bank is an approved Small Business Administration and 504 lender, FSA, USDA Business and Industry, USDA Part-time Farmer Program, FHA and VA lender.
-35-
CRITICAL ACCOUNTING POLICIES
General
Pacific State Bancorp’s consolidated financial statements are prepared in accordance with accounting principles generally accepted in the United States of America (GAAP). The financial information contained within our consolidated financial statements is, to a significant extent, financial information that is based on measures of
the financial effects of transactions and events that have already occurred. A variety of factors could affect the ultimate value that is obtained either when earning income, recognizing an expense, recovering an asset or relieving a liability. We use historical loss factors as one factor in determining the inherent loss that may be present in our loan portfolio. Actual losses could differ significantly from the historical factors that we use.
Estimates that we use are related to the assumptions and estimates related to share based compensation, expected useful lives of our depreciable assets and the determination whether any impairment exists related to our investments and intangible and other long-lived assets. In addition, GAAP itself may change from one previously
acceptable method to another method. Although the economics of our transactions would be the same, the timing of events that would impact our transactions could change.
A critical accounting estimate is one that requires a company to make assumptions about matters that are highly uncertain at the time the accounting estimate is made. If different estimates that the company reasonably could have used for the accounting estimate in the current period were made, or if changes in the accounting
estimate that are reasonably likely to occur from period to period occurred, they could have a material impact on the presentation of the company's financial condition, changes in financial condition or results of operations.
The most significant accounting policies followed by the Company are presented in Note 2 to the consolidated financial statements. These policies, along with the disclosures presented in the other financial statement notes and in this discussion, provide information on how significant assets and liabilities are valued in the financial
statements and how those values are determined. Based on the valuation techniques used and the sensitivity of financial statement amounts to the methods, assumptions, and estimates underlying those amounts. Management has identified the allowance for loan losses accounting to be the accounting area requiring the most subjective or complex judgments, and as such could be most subject to revision as new information becomes available. A discussion of the factors affecting accounting for the allowance
for loan losses is included in the “ALLOWANCE FOR LOAN LOSSES (ALL)” discussion below.
Overview
The Company incurred a net loss of $23.0 million ($6.19 basic and $6.19 diluted loss per share) for the year ended December 31, 2009 as compared to net loss of $5.2 million ($1.40 basic and $1.40 diluted loss per share) for the same period of 2008. For the year ended December 31, 2007, we realized net earnings of $4.5 million
($1.23 basic and $1.14 diluted earnings per share). Our net losses in 2009 were due primarily to increased provisions for loan losses, a valuation allowance on our deferred taxes of $9.0 million, and an increase in nonperforming assets which has reduced the Company’s net interest income. Provisions for loan losses increased from $7.0 million at December 31, 2008 to $15.4 million at December 30, 2009.
These losses have resulted in a decrease in our shareholders’ equity and regulatory capital. Our shareholders’ equity was $5.7 million at December 31, 2009, and $27.3 million at December 31, 2008. As of December 31, 2009, the Bank was “under capitalized” under the prompt corrective action
rules of the Federal Deposit Insurance Corporation (“FDIC”). These conditions create an uncertainty about the Company’s ability to continue as a going concern. The consolidated financial statements set forth in this Annual Report have been prepared on a going concern basis, which contemplates the realization of assets and the discharge of liabilities in the normal course of business for the foreseeable future, and do not include any adjustments to reflect the possible future effects on the recoverability
and classification of assets, or the amounts and classification of liabilities that may result from the outcome of the Company’s inability to repay the outstanding principal balance of its debt or from any extraordinary regulatory action, either of which would affect its ability to continue as a going concern.
We have been adversely impacted by the continuing deterioration in the Central California real estate markets. This has particularly impacted our construction lending, a substantial portion of which has included loans for the construction of tract projects and single family homes built for unidentified buyers and loans to improve land.
Our homebuilder borrowers are experiencing declining prices and longer sale periods for their completed homes and lots, resulting in slower repayments than originally projected. This situation has resulted in a significant amount of loan defaults within the construction loan portfolio. Further real estate market declines may have additional adverse affects on the values of the properties collateralizing our loans and we could incur higher losses on sales of these properties.
We began curtailing the origination of construction loans in mid-2007, and these types of loans now represent a smaller portion of our loan portfolio (6.8% at December 31, 2009, down from 21.0% at December 31, 2008). At December 31, 2009, we still had $702 thousand of unfunded commitments for these loans, but believe that
the substantial part of these commitments will expire unfunded because conditions to funding will not be satisfied. We do not intend to originate any material amount of new construction loans under present market conditions, and we expect that construction loans will continue to decrease, both in total amount and as a percentage of our loan portfolio.
Our non-performing assets have continued to increase, from $25.6 million at December 31, 2008 to $33.8 million at December 31, 2009. Non-accrual loans, which decreased from $23.6 million to $22.9 million, was offset by an increase in other real estate owned which increased from $2.0 million to $10.9 million.
Our allowance for loan losses was $10.5 million or 4.10% of loans at December 31, 2009 compared to $6.0 million or 1.95% of loans at December 31, 2008.
-36-
Our financial condition has adversely affected our funding sources during the past year. As a result of the Bank not being “well capitalized” under applicable regulations after June, 2009, we may not accept new brokered deposits without the approval of the FDIC. In addition, FHLBSF reduced our maximum borrowing capacity at
the FHLBSF to $40.5 million at December 31, 2009 from $93.1 million at December 31, 2008. As a result of decreased borrowing lines management has taken the action of pledging collateral at the Federal Reserve Bank of San Francisco (“FRBSF”) to enable us to obtain overnight advances.
Our total assets have decreased from $421.5 million at December 31, 2008 to $369.8 million at December 31, 2009. We have not pursued a growth strategy during the past year as a result of declining regulatory capital ratios. Because at December 31, 2009 we were “under capitalized” we do not intend to grow and
may reduce our total assets in coming periods through securities and loan sales and loan participations.
On February 18, 2010, the Company and the Bank consented to enter into a written agreement with the FRBSF and the CDFI as follow-up to an examination of the Bank (the “Written Agreement”).
A copy of the Written Agreement is filed as Exhibit 10.1 to the Company’s Current Report on Form 8-K dated February 24, 2010, and is incorporated herein by this reference. The description provided below of the Written Agreement is a summary and does not purport to be a complete description of all of the terms of such
Written Agreement and is qualified in its entirety by reference to the Written Agreement filed with this Current Report.
Among other things, the Written Agreement provides that the Company and the Bank shall submit to the FRBSF and the CDFI their continuing plans to enhance lending and credit administration functions, to maintain policies and procedures for the maintenance of an adequate allocation for loan and lease losses, to improve the Bank’s earnings
and overall condition, improve management of the Bank’s liquidity position and funds management practices and update its capital plan in order to maintain sufficient capital at the Company and the Bank. The Written Agreement also restricts the Company and the Bank from making the payment of dividends, any payments on trust preferred securities, any reduction in capital or the purchase or redemption of stock without the prior approval of the FRBSF. Progress reports detailing the form and manner
of all actions taken to secure compliance with the Written Agreement must be submitted to the FRBSF at least quarterly.
The Directors of the Company and the Bank have recognized and agree with the goal of financial soundness represented by the Written Agreement and have confirmed the intent of the Directors and senior management of the Company and the Bank to diligently seek to comply with all requirements (including timelines) specified in the Written
Agreement.
We believe that making the improvements in our operations required by the Written Agreement will enhance our financial performance. However, there can be no assurance that these results will follow as a result of our actions, or that we will be able to make the changes required by the Written Agreement. Among other things,
compliance with the Written Agreement may be more time consuming or expensive than anticipated, the objectives set forth in the Written Agreement may take longer to achieve than we would hope or expect and we may not be able to increase our capital consistent with the revised capital plan to be submitted. Our efforts to comply with the Written Agreement may have adverse effects on our operations and financial condition for reasons we cannot currently anticipate. Also, the conditions of the economy
nationally and in California, the capital markets and the real estate markets may impair the likelihood of success of the remedial actions we are attempting to take.
As a result of being undercapitalized under the prompt corrective action rules, the Bank is subject to certain regulatory restrictions. These include, among others, that the Bank may not make any capital distributions, must submit an acceptable capital restoration plan to the FDIC, may not increase its average total assets during a calendar
quarter to exceed its average total assets during the preceding calendar quarter and may not acquire a business, establish or acquire a branch office or engage in a new line of business.
As a result of the Written Agreement, we are actively seeking additional capital either directly through the sale of securities or indirectly through the merger with another bank or financial institution (which could be accompanied by a financing). We expect that any sale of securities would most likely be through a private
placement to institutional investors. While we have had discussions with various financing sources and potential merger partners, at the date of this Report we have no agreements for any such transaction. Any merger or financing could involve a change of control of the Company.
If the Bank is not successful in raising additional capital, it will not be able to become fully compliant with the provisions of the Written Agreement. As a result, the FRBSF, CDFI and the FDIC may take further enforcement action, including placing the Bank into receivership. If the Bank is placed into FDIC receivership, it is likely
that the Bank would be required to cease operations and liquidate. If the Bank were to liquidate it is unlikely that there would be any assets available to the holders of the common shareholders of the Company.
-37-
Going Concern Considerations
The consolidated financial statements for 2009 have been prepared on a going concern basis, which contemplates the realization of assets and the discharge of liabilities in the normal course of business. As a result, the consolidated financial statements do not include any adjustments that may result from the outcome of any regulatory action
or the Company’s or the Bank’s inability to meet its existing debt obligations. The Bank has recently incurred significant operating losses, experienced a significant deterioration in the quality of its assets and become subject to enhanced regulatory scrutiny. These factors, among others, were deemed to cast substantial doubt on the Company’s and the Bank’s ability to continue as a going concern. If the Company cannot continue to operate as a going concern, it is likely that shareholders
will lose all or substantially all of their investment in the Company.
The Company is actively pursuing a broad range of strategic alternatives, including a capital infusion or a merger, in order to address any doubt related to the Company’s ability to continue as a going concern. There can be no assurance that the pursuit of strategic alternatives will result in any transaction, or that any such transaction
will allow the Company’s shareholders to avoid a loss of all or substantially all of their investment in the Company. The pursuit of strategic alternatives may also involve significant expenses and management time and attention.
The Company needs to raise additional capital to meet the higher minimum capital levels that the Bank and Company are obligated to maintain under the Consent order with the California Department of Financial Institutions (“CDFI”). As of December 31, 2009, the Bank was considered “under capitalized” under the prompt
corrective action rules of the Federal Deposit Insurance Corporation (“FDIC”). In addition, should the Company’s current rate of operating losses continue or should the Company’s asset quality erode and require significant additional provision for credit losses, resulting in additional net operating losses, the Company’s capital levels will decline further and it will need to raise more capital to satisfy its regulatory capital requirements. The Company’s ability
to raise additional capital depends on conditions in the capital markets, which are outside the Company’s control, and on the Company’s financial performance. Accordingly, the Company cannot be certain of its ability to raise additional capital on acceptable terms, or at all. If the Company cannot raise additional capital, its results of operations and financial condition could be materially and adversely affected, and it may be subject to further supervisory action. In addition, if
the Company were to raise additional capital through the issuance of additional shares, its stock price could be adversely affected, depending on the terms of any shares it were to issue.
During the fourth quarter of 2009, the Company and the Bank entered into the Written Agreement with the FRB and the CDFI. Additionally, on April 15, 2010, the Bank executed a Waiver and Consent to an Order of the CDFI (the “Consent”) requiring the Bank, within 90 days of the effective
date of the Order, to increase and to maintain tangible capital at a level equal to 10% of assets. The effective date will be the date that the CDFI executes the Order per se. As of December 31, 2009, the Bank had a ratio of tangible capital to assets of 3.9%, which was not sufficient to meet the higher level that the Bank would be obligated to maintain under the Consent. As a result, if within 90 days of the effective
date of the Order the Bank cannot comply with the Consent provisions, the Bank may be subject to further supervisory action, which could have a material adverse effect on its results of operations, financial condition and business.
-38-
RESULTS OF OPERATIONS
Year Ended December 31, 2009 Compared to Year Ended December 31, 2008
Net loss for the year ended December 31, 2009, was $23,038,000 representing an increase of $17,848,000 over the net loss of $5,190,000 for the year ended December 31, 2008. The primary causes of the increase in net loss were the increase in the provision for loan losses of $8,364,000, the increase other real estate expense of $5,573,000,
the decrease in tax benefit of $5,029,000, the decrease in net interest income of $2,747,000 and a gain on the death benefit from company owned life insurance of $2,574,000 experienced in 2008 that did not reoccur in 2009. The unfavorable items above were offset by a decrease of $7,089,000 in security losses and other than temporary impairment charges compared to 2008.
In 2009 the Company continued to be negatively impacted by declining economic activity, declining real estate values and losses on investment securities. As the economic activity in the region where the Company operates has declined, the ability of the Company’s borrowers to repay debt has diminished. If borrowers
are unable to repay debt, the Company moves to liquidate collateral taken under the note. In cases where real estate was taken as collateral, the current value of the real estate may not be adequate to repay the remaining debt owed as a result of declining property values in the region. Weak repayment experience and declining real estate values led to an elevated level of provision for loan losses and other real estate expense incurred in 2009.
The Company has also been negatively impacted by the loss of value in investment securities where the underlying Companies have discontinued payments of interest and the repayment of principal is doubtful. The Company has recorded other than temporary impairment charges against two securities. A more in depth discussion
of the other than temporary impairment charges can be found in Note 3 to the financial statements.
As a result of recent losses, the Company has recorded a valuation allowance against deferred tax assets of $9,043,000 as an offset to income tax benefit for the year ended December 31, 2009. The valuation allowance resulted in a much lower tax benefit for 2009 as a percentage of pretax income compared to 2008. As
the Company’s financial outlook improves, the valuation allowance may be reversed in future periods as an additional tax benefit subject to an analysis by management on the likelihood of ultimate realization of the deferred tax asset.
The Company’s net interest income has declined as nonperforming assets have become a larger portion of the Company’s balance sheet. This has led to a contracting net interest margin and a reduction of interest income. The reduction in interest income has been offset by a reduction in interest expense primarily
as the result of reduced market rates paid for deposits and borrowings. A more in depth discussion of average balances and the rates received or paid on those balances is presented in the section titled “Net Interest Income” below.
Loss on average assets (ROA) was 5.74% for the year ended 2009 while the return on average assets was 1.20% for the year ended 2008. The loss on average equity (ROE) was 100.98% in 2009 compared with a loss on average equity of 14.95% in 2008. Diluted loss per share for 2009 was $6.19 compared to diluted loss per
share of $1.40 in 2008.
The Company’s average total assets decreased to $401.4 million in 2009 or 7.4% over $433.5 million in 2008. The Company’s total assets decreased to $369.8 million as of December 31, 2009 or 12.2% compared to $421.5 million at December 31, 2008. Total gross loans decreased in 2009 to $256.4 million from
$308.0 million in 2008, a decrease of $51.6 million or 16.8%. Total deposits decreased to $322.4 million, or 5.4%, compared to $341.0 million in 2008.
-39-
Year Ended December 31, 2008 Compared to Year Ended December 31, 2007
Net loss for the year ended December 31, 2008, was $5,190,000 representing a decrease of $9,739,000 or 214% over net income of $4,549,000 for the year ended December 31, 2007. The primary causes of the decrease in net income were the increase in the provision for loan losses of $5,576,000 or 391% over 2007 levels, other than temporary impairment
charges of $8,923,000, and a loss on the sale of securities of $1,291,000 which were not experienced in 2007. In addition to the increase in the provision for loan losses, other than temporary impairment charges and losses on the sale of securities, noninterest expense increased by $2,331,000, or 21%, over 2007 levels due primarily to increased legal and professional fees associated with loan collections.
In 2008 the Company faced many difficult challenges with respect to its investment and loan portfolios. The Company took significant losses related to Fannie Mae and Freddie Mac preferred stock positions. The value of the preferred stock positions were impaired after the United States Treasury Department placed the
organizations into receivership and canceled dividend payments associated with the preferred stock. The Company subsequently sold the preferred stock at a realized loss of $6,843,000. The Company also recognized an impairment charge on a single issue trust preferred security in the amount of $2,425,000 and experienced other net realized losses of $946,000 in the investment portfolio.
As the economic environment has deteriorated, additional reserves were required for loan losses. The Company recorded $7,001,000 in provision for additional loan losses in 2008. The reserve for loan losses as of December 31, 2008 was $6,019,000 or 1.95% of loans.
Despite the Company’s losses, Pacific State Bancorp continued to achieve strong growth in average earning assets, increasing by $28,373,000 or 8%. Offsetting the growth in average earning assets was a decrease in the average yield earned on average earning assets by 163 basis points or 19%. In order to fund
the growth in average earning assets, the Company increased its average interest bearing liabilities by $28,407,000 or 9%. The average rate paid on interest bearing liabilities decreased by 88 basis points or 19%. The decrease in the rate received on average earning assets offset the growth in average earning assets which resulted in decreased total interest earned by $3,967,000 or 13%. The Company experienced a similar result in interest bearing liabilities. The rate
paid on average interest bearing liabilities was large enough to offset the increase in interest bearing liabilities. The result was decreased interest expense of $1,602,000, or 12%. The net result is a decrease in net interest income of $2,365,000 or 14%. A more in depth discussion of average balances and the rates received or paid on those balances is presented in the section titled “Net Interest Income”
below.
Loss on average assets (ROA) was 1.20% for the year ended 2008 while the return on average assets was 1.13% for the year ended 2007. The loss on average equity (ROE) was 14.95% in 2008 compared with a return on average equity of 14.22% in 2007. Diluted loss per share for 2008 was $1.40 compared to diluted earnings
per share of $1.14 in 2007, a decrease of 223%. The decrease in earnings per share was primarily due to the decrease in net income of 332%.
The Company’s average total assets increased to $433.5 million in 2008 or 7.7% over $402.5 million in 2007. The Company’s total assets decreased to $421.5 million as of December 31, 2008 or 2.2% below $431.1 million at December 31, 2007. Total gross loans decreased in 2008 to $308.0 million from $312.4
million in 2007, a decrease of $4.4 million or 1.4%. Total deposits decreased to $341.0 million, or 0.25%, compared to $341.8 million in 2007. The growth in the average balance sheet compared to an overall decrease in the period end balance sheet is the result of growth in the middle of 2008 with contraction at the end of the year. The contraction at the end of 2008 is the result of the poor economic environment in which the Company operates.
-40-
Net Interest Income
The primary source of income for the Company is net interest income. Net interest income represents the excess of interest and fees earned on interest-earning assets (loans, securities and federal funds sold) over the interest paid on deposits and borrowed funds. Net interest margin is net interest income expressed as a percentage of average
earning assets. Our net interest margin is affected by changes in the yields earned on assets and rates paid on liabilities, referred to as rate changes, and changes in the relative amounts of interest earning assets and interest bearing liabilities. Interest rates earned and paid are affected principally by our competition, general economic conditions and other factors beyond our control such as federal economic policies, the general supply of money in the economy, legislative tax policies, governmental
budgetary matters, and actions of the FRB. Our inability to maintain strong asset quality, capital or liquidity may adversely affect (i) our ability to accommodate desirable borrowing customers, thereby impacting growth in quality, higher-yielding earning assets; (ii) our ability to attract comparatively stable, lower-cost deposits; and (iii) the costs of wholesale funding sources.
Net interest income decreased $2.7 million or 18% to $12.3 million in 2009 from $15.0 million in 2008 and decreased $2.4 million or 14% in 2008 from $17.4 million in 2007. Total average earning assets decreased $39.1 million or 10% to $352.8 million from $391.9 million in 2008. Average loan balances outstanding during
2009 decreased $35.8 million or 11%, while average balances of investments, federal funds sold and interest bearing deposits in banks decreased by $3.3 million or 5%. The average yield on loans in 2009 decreased by 115 basis points compared to 2008. The average yield on investments, federal funds sold and interest bearing deposits decreased 156 basis points in 2009 compared to 2008. The decrease in loan yields is related to fluctuating market conditions based on economic data,
non-performing loans and competition. As a result of the change in mix of earning assets, the overall yield on average earning assets during 2009 decreased 126 basis points to 5.70% from 6.96% for 2008.
Total average earning assets increased $28.4 million or 7.8% to $391.9 million in 2008 from $363.5 million in 2007. Average loan balances outstanding during 2008 increased $22.3 million or 7.4%, while average balances of investments, federal funds sold and interest bearing deposits in banks increased by $6.1 million or 9.7%. The
average yields on loans in 2008 decreased by 167 basis points. The average yield on investments, federal funds sold and interest bearing deposits decreased 138 basis points in 2008 compared to 2007. The decrease in yields is related to fluctuating market conditions based on credit loan quality rating and economic data. As a result of the change in mix of earning assets, the overall yield on average earning assets during 2008 decreased 163 basis points to 6.96% from 8.59% for 2007.
Total interest expense decreased $4.4 million or 36%, to $7.8 million in 2009, from $12.2 million in 2008. Total interest expense decreased $1.6 million or 12% to $12.2 million in 2008, from $13.8 million in 2007. In 2009 the average balance of interest-bearing liabilities increased $14.0 million or 4.2% to $316.2
million from $330.2 million for the year ended December 31, 2008. In 2008 the average balance of interest-bearing liabilities increased $28.4 million or 9.4% to $330.2 million from $301.8 million for the year ended 2007. Additionally, the average rate paid on interest-bearing liabilities decreased to 2.47% in 2009 from 3.71% in 2008 and decreased in 2008 from 4.59% in 2007. The decrease in the average interest rate paid on interest-bearing liabilities represents 124 basis points
or 33.4% in 2009 and a decrease of 88 basis points or 19.2% in 2008.
Average interest-bearing demand deposits increased $7.3 million or 10.2% to $64.6 million in 2009 from $71.9 million in 2008. The average rate paid on these deposits during 2009 decreased 120 basis points. Average certificates of deposit decreased $18.6 million or 8.9% to $189.3 million in 2009 from $207.9 million
in 2008. The average rate paid on certificates of deposit during 2009 decreased 127 basis points. As a result of the decreases in interest rates described above and overall changes in the mix of interest-bearing deposits, the average rate paid on all interest bearing deposits and borrowings decreased 124 basis points for 2009 to 2.47% from 3.71% in 2008.
-41-
The following table sets forth the Company's daily average balance sheet, related interest income or expense and yield or rate paid for the periods indicated. The yield on tax-exempt securities has not been adjusted to a tax-equivalent yield basis. Average balances are based on daily averages.
AVERAGE BALANCES, INTEREST INCOME/EXPENSE AND YIELDS/RATES PAID
|
For Year Ended December 31, |
||||||||||||||||||||||||
|
(Dollars in thousands) |
2009 |
2008 |
||||||||||||||||||||||
|
Interest |
Average |
Interest |
Average |
|||||||||||||||||||||
|
Average |
Income or |
Yield or |
Average |
Income or |
Yield or |
|||||||||||||||||||
|
Assets: |
Balance |
Expense |
Cost |
Balance |
Expense |
Cost |
||||||||||||||||||
|
Interest-earning assets: |
||||||||||||||||||||||||
|
Loans |
$ | 286,642 | $ | 18,544 | 6.47 | % | $ | 322,489 | $ | 24,565 | 7.62 | % | ||||||||||||
|
Investment securities |
36,127 | 1,468 | 4.06 | % | 48,306 | 2,290 | 4.74 | % | ||||||||||||||||
|
Federal funds sold |
30,017 | 85 | 0.28 | % | 20,057 | 376 | 1.87 | % | ||||||||||||||||
|
Interest bearing deposits in banks |
0 | 0 | 0 | % | 1,041 | 44 | 4.23 | % | ||||||||||||||||
|
Total average earning assets |
$ | 352,786 | $ | 20,097 | 5.70 | % | $ | 391,893 | $ | 27,275 | 6.96 | % | ||||||||||||
|
Non-earning assets: |
||||||||||||||||||||||||
|
Cash and due from banks |
11,850 | 13,522 | ||||||||||||||||||||||
|
Bank premises and equipment |
25,771 | 15,399 | ||||||||||||||||||||||
|
Other assets |
17,051 | 16,629 | ||||||||||||||||||||||
|
Allowance for loan loss |
(6,047 | ) | (3,939 | ) | ||||||||||||||||||||
|
Total average assets |
$ | 401,411 | $ | 433,504 | ||||||||||||||||||||
|
Liabilities and Shareholders' Equity: |
||||||||||||||||||||||||
|
Interest-bearing liabilities: |
||||||||||||||||||||||||
|
Interest-bearing demand |
$ | 64,568 | $ | 678 | 1.05 | % | $ | 71,935 | $ | 1,618 | 2.25 | % | ||||||||||||
|
Savings |
18,654 | 187 | 1.00 | % | 6,122 | 42 | 0.69 | % | ||||||||||||||||
|
Time deposits |
189,332 | 5,589 | 2.95 | % | 207,848 | 8,765 | 4.22 | % | ||||||||||||||||
|
Other borrowing |
43,657 | 1,355 | 3.10 | % | 44,265 | 1,815 | 4.10 | % | ||||||||||||||||
|
Total average interest-bearing liabilities |
$ | 316,211 | $ | 7,809 | 2.47 | % | $ | 330,170 | $ | 12,240 | 3.71 | % | ||||||||||||
|
Noninterest-bearing liabilities: |
||||||||||||||||||||||||
|
Demand deposits |
58,145 | 64,242 | ||||||||||||||||||||||
|
Other liabilities |
4,241 | 4,378 | ||||||||||||||||||||||
|
Total average liabilities |
378,597 | 398,790 | ||||||||||||||||||||||
|
Shareholders' equity: |
22,814 | 34,714 | ||||||||||||||||||||||
|
Total average liabilities and shareholders' equity |
$ | 401,411 | $ | 433,504 | ||||||||||||||||||||
|
Net interest income |
$ | 12,288 | $ | 15,035 | ||||||||||||||||||||
|
Net interest margin |
3.48 | % | 3.84 | % | ||||||||||||||||||||
|
1) |
Interest income and yields on loans include (cost expense) fee income of ($119,000), $799,000 and $1,623,000 for the years ended December 31, 2009, 2008 and 2007, respectively. The Company had twenty five nonaccrual loan(s) in the amount of $22,864,000 and $23,560,000 as of December 31, 2009 and December 31, 2008, respectively. The
Company had $432,000 on nonaccrual loans for the year ended December 31, 2007. |
-42-
|
For Year Ended December 31, |
||||||||||||
|
(Dollars in thousands) |
2007 |
|||||||||||
|
Interest |
Average |
|||||||||||
|
Average |
Income or |
Yield or |
||||||||||
|
Assets: |
Balance |
Expense |
Cost |
|||||||||
|
Interest-earning assets: |
||||||||||||
|
Loans |
$ | 300,239 | $ | 27,902 | 9.29 | % | ||||||
|
Investment securities |
37,089 | 2,033 | 5.48 | % | ||||||||
|
Federal funds sold |
25,115 | 1,285 | 5.12 | % | ||||||||
|
Interest bearing deposits in banks |
1,077 | 22 | 2.04 | % | ||||||||
|
Total average earning assets |
$ | 363,520 | $ | 31,242 | 8.59 | % | ||||||
|
Non-earning assets: |
||||||||||||
|
Cash and due from banks |
15,398 | |||||||||||
|
Bank premises and equipment |
12,940 | |||||||||||
|
Other assets |
13,322 | |||||||||||
|
Allowance for loan loss |
(2,665 | ) | ||||||||||
|
Total average assets |
$ | 402,515 | ||||||||||
|
Liabilities and Shareholders' Equity: |
||||||||||||
|
Interest-bearing liabilities: |
||||||||||||
|
Interest-bearing demand |
$ | 81,898 | $ | 2,231 | 2.72 | % | ||||||
|
Savings |
5,352 | 46 | 0.86 | % | ||||||||
|
Time deposits |
200,154 | 10,567 | 5.28 | % | ||||||||
|
Other borrowing |
14,359 | 998 | 6.95 | % | ||||||||
|
Total average interest-bearing liabilities |
$ | 301,763 | $ | 13,842 | 4.59 | % | ||||||
|
Noninterest-bearing liabilities: |
||||||||||||
|
Demand deposits |
64,242 | |||||||||||
|
Other liabilities |
4,525 | |||||||||||
|
Total average liabilities |
370,530 | |||||||||||
|
Shareholders' equity: |
31,986 | |||||||||||
|
Total average liabilities and shareholders' equity |
$ | 402,516 | ||||||||||
|
Net interest income |
$ | 17,400 | ||||||||||
|
Net interest margin |
4.79 | % | ||||||||||
-43-
The following table sets forth changes in interest income and expense for each major category of earning assets and interest-bearing liabilities, and the amount of change attributable to volume, rates and the combination of volume and rates (mix) for the periods indicated. The yield on tax-exempt securities has not been adjusted
to a tax-equivalent yield basis.
ANALYSIS OF CHANGES IN NET INTEREST INCOME AND EXPENSE
|
Years ended December 31, |
||||||||||||
|
2009 over 2008 |
||||||||||||
|
Net |
||||||||||||
|
Change |
Rate(1) |
Volume(2) |
||||||||||
|
(In thousands) |
||||||||||||
|
Interest Income: |
||||||||||||
|
Loans and leases |
$ | (6,021 | ) | $ | (3,290 | ) | $ | (2,731 | ) | |||
|
Investment securities |
(822 | ) | (245 | ) | (577 | ) | ||||||
|
Federal funds sold |
(291 | ) | (478 | ) | 187 | |||||||
|
Interest bearing deposits in banks |
(44 | ) | - | (44 | ) | |||||||
|
Total interest income |
(7,178 | ) | (4,013 | ) | (3,165 | ) | ||||||
|
Interest Expense: |
||||||||||||
|
Interest-bearing demand |
(940 | ) | (774 | ) | (166 | ) | ||||||
|
Savings |
145 | 59 | 86 | |||||||||
|
Time deposits |
(3,176 | ) | (2,395 | ) | (781 | ) | ||||||
|
Other borrowing |
(460 | ) | (435 | ) | (25 | ) | ||||||
|
Total interest expense |
(4,431 | ) | (3,545 | ) | (886 | ) | ||||||
|
Net interest income |
$ | (2,747 | ) | $ | (468 | ) | $ | (2,279 | ) | |||
|
Years ended December 31, |
||||||||||||
|
2008 over 2007 |
||||||||||||
|
Net |
||||||||||||
|
Change |
Rate(1) |
Volume(2) |
||||||||||
|
(In thousands) |
||||||||||||
|
Interest Income: |
||||||||||||
|
Loans and leases |
$ | (3,337 | ) | $ | (5,405 | ) | $ | 2,068 | ||||
|
Investment securities |
257 | (358 | ) | 615 | ||||||||
|
Federal funds sold |
(909 | ) | (650 | ) | (259 | ) | ||||||
|
Interest bearing deposits in banks |
22 | 23 | (1 | ) | ||||||||
|
Total interest income |
(3,967 | ) | (6,390 | ) | 2,423 | |||||||
|
Interest Expense: |
||||||||||||
|
Interest-bearing demand |
(613 | ) | (342 | ) | (271 | ) | ||||||
|
Savings |
(4 | ) | (11 | ) | 7 | |||||||
|
Time deposits |
(1,802 | ) | (2,208 | ) | 406 | |||||||
|
Other borrowing |
817 | (1,262 | ) | 2,079 | ||||||||
|
Total interest expense |
(1,602 | ) | (3,823 | ) | 2,221 | |||||||
|
Net interest income |
$ | (2,365 | ) | $ | (2,567 | ) | $ | 202 | ||||
|
(1) |
The rate change in net interest income represents the change in rate multiplied by the current year’s average balance. |
|
(2) |
The volume change in net interest income represents the change in average balance multiplied by the current year’s rate. |
-44-
NON-INTEREST INCOME
The Company’s non-interest income normally consists primarily of service charges on deposit accounts, gain on sale of loans and ATM and other service fees. For the year ended December 31, 2008, non-interest income represented a reduction of 24% of the Company’s revenues versus a contribution of 7% in 2007. In
2008 the Company’s non-interest income was severely impacted by negative activity. The Company recorded an other than temporary impairment charge on available for sale securities of $8.9 million and a loss on the sale of available for sale securities of $1.3 million, reduced somewhat by a gain on the sale of assets of $471 thousand and a gain on Company owned life insurance of $2.6 million.
Total non-interest income decreased significantly to a net loss of $1.4 million in 2009 from a net loss of $5.3 million in 2008 which was an increase of $3.9 million from 2008. Service charge income decreased $222 thousand or 27% to $601 thousand in 2009. The decrease in service charges in 2009 was the result of decreased account
activity. Service charge income decreased $66 thousand in 2008 or 7% to $823 thousand, down from $889 thousand for the comparable period in 2007. The increase in service charge income in 2007 was is the result of the increase in deposit accounts as a result of the growth of the Company. Other income decreased $117 thousand to $773 thousand in 2009 over 2008 and decreased $536 thousand or 38% in 2008 from $1,426 thousand in 2007. Other income decreased in 2008 compared
to 2007 primarily because of a decrease in prepayment penalties assessed on loans.
The following table sets forth a summary of non-interest income for the periods indicated.
|
Years Ended December 31, |
||||||||||||
|
2009 |
2008 |
2007 |
||||||||||
|
(In thousands) |
||||||||||||
|
Service charges |
$ | 601 | $ | 823 | $ | 889 | ||||||
|
Gain on sale of loans |
267 | 188 | 150 | |||||||||
|
Gain on sale of assets |
119 | 471 | - | |||||||||
|
Gain on company owned life insurance |
- | 2,574 | - | |||||||||
|
Other income |
623 | 890 | 1,426 | |||||||||
|
Other than temporary impairment charge |
(3,125 | ) | (8,923 | ) | - | |||||||
|
Gain (loss) on sale of securities |
150 | (1,291 | ) | - | ||||||||
|
Total non-interest income |
$ | (1,365 | ) | $ | (5,268 | ) | $ | 2,465 | ||||
NON-INTEREST EXPENSE
Non-interest expense consists of salaries and related employee benefits, occupancy and equipment expenses, professional fees, appraisal fees, directors’ fees, postage, stationery and supplies expenses, telephone expenses, data processing expenses, advertising and promotion expense and other operating expenses. Non-interest expense
for 2009 was $18.9 million compared to $13.3 million for 2008 and $11 million in 2007, representing an increase of $5.6 million or 42% for 2009, and $2.3 million or 21% for 2008. The decrease in salary and benefits in 2009 over 2008 of $365,000 was primarily the result of reduced executive officers salary levels. The decrease in occupancy and equipment expense of $84 thousand in 2009 over 2008 is attributable to decreased use of machines for branch data capture, information technology upgrades
and expensing of certain assets no longer in use. The increase in occupancy and equipment expense of $395 thousand in 2008 over 2007 is attributable to increased use of machines for branch data capture, information technology upgrades and expensing of certain assets no longer in use. Data processing expense increased by $260 thousand in 2008 over 2007 levels; the increase is primarily attributable to increasing volumes of electronic clearing of paper check items. Advertising
expense decreased in 2009 and 2008 due to a focus on controlling costs and evaluating the effectiveness of prior years’ advertising. The Company incurred expenses associated with other real estate owned in 2009 and 2008 due to the foreclosure and marketing of properties where a borrower discontinued payments in agreement with loan terms. Other expense increased in 2009 over 2008 primarily due to deposit insurance assessments, correspondent bank charges, armored car expense, loan collection
expense and other costs associated with the growth of the Company. Professional fees increased significantly, due to the increase of legal costs associated with loan collection during 2008.
The following table sets forth a summary of non-interest expense for the periods indicated.
|
Year Ended December 31, |
||||||||||||
|
(In thousands) |
||||||||||||
|
2009 |
2008 |
2007 |
||||||||||
|
Other real estate owned |
5,667 | 94 | - | |||||||||
|
Salaries and employee benefits |
5,181 | 5,546 | 5,336 | |||||||||
|
Occupancy and equipment |
2,199 | 2,283 | 1,888 | |||||||||
|
Other operating expenses |
1,208 | 1,735 | 1,509 | |||||||||
|
Professional fees |
1,110 | 1,253 | 294 | |||||||||
|
FDIC |
1,056 | 301 | 59 | |||||||||
|
Data processing |
812 | 588 | 328 | |||||||||
|
Goodwill |
718 | - | - | |||||||||
|
Telephone |
261 | 265 | 251 | |||||||||
|
Directors fees |
210 | 321 | 290 | |||||||||
|
Appraisal fees |
204 | 262 | 266 | |||||||||
|
Advertising and promotion |
182 | 408 | 564 | |||||||||
|
Postage, stationary and supplies |
131 | 272 | 212 | |||||||||
|
Total noninterest expense |
$ | 18,939 | $ | 13,328 | $ | 10,997 | ||||||
-45-
PROVISION FOR INCOME TAXES
The Company’s provision for income taxes includes both federal income and state franchise taxes and reflects the application of federal and state statutory rates to the Company’s net income before taxes. The principal difference between statutory tax rates and the Company’s effective tax rate is the benefit
derived from investing in tax-exempt securities, Company owned life insurance and valuation allowance recorded deferred tax assets. Increases and decreases in the provision for taxes primarily reflect changes in the Company’s net income before tax. The following table reflects the Company’s tax provision and the related effective tax rate for the periods indicated.
The following table reflects the Company’s tax provision and the related effective tax rate for the periods indicated.
|
Years Ended December 31, |
||||||||||||
|
(Dollars in thousands) |
2009 |
2008 |
2007 |
|||||||||
|
Tax (benefit from) provision |
$ | (343 | ) | $ | (5,372 | ) | $ | 2,894 | ||||
|
Effective Tax Rate |
1.5 | % | 50.9 | % | 38.9 | % | ||||||
FINANCIAL CONDITION
CAPITAL RESOURCES AND REGULATORY AGREEMENTS
Capital adequacy is a measure of the amount of capital needed to sustain asset growth and act as a cushion for losses. Capital protects depositors and the Federal deposit insurance fund from potential losses and is a source of funds for the investments the Company needs to remain competitive. Historically, capital has been generated
principally from the retention of earnings.
Overall capital adequacy is monitored on a day-to-day basis by the Company’s management and reported to the Company’s Board of Directors on a monthly basis. The Bank’s regulators measure capital adequacy by using a risk-based capital framework and by monitoring
compliance with minimum leverage ratio guidelines. Under the risk-based capital standard, assets reported on the Company’s balance sheet and certain off-balance sheet items are assigned to risk categories, each of which is assigned a risk weight.
This standard characterizes an institution's capital as being "Tier 1" capital (defined as principally comprising shareholders' equity and qualifying subordinated debentures) and "Tier 2" capital (defined as principally comprising the qualifying portion of subordinated debt
and the qualifying portion of the ALLL), the total amount not to exceed 100% of Tier 1 capital. The minimum ratio of total risk-based capital to risk-adjusted assets, including certain off-balance sheet items, is 8%.
At December 31, 2008 and 2007 the Company’s capital met all minimum regulatory requirements. As of December 31, 2009, the most recent notification by the Federal Depository Insurance Corporation (FDIC) categorized the Bank as “under capitalized” under the regulatory
framework for prompt corrective action. To be categorized as well capitalized the Bank must meet the minimum ratios as set forth below. There are no conditions or events since that notification that management believes have changed the Company’s and the Bank’s category. The Company is actively seeking additional capital through the sale of debt or equity securities or merger with another financial institution. We may also improve our capital ratios through reducing total assets, principally
through securities or loan sales or loan participations. For more information on the Company’s and the Bank’s risk-based capital ratios, see Note 11 to the Financial Statements contained in this report.
-46-
The following table sets forth the regulatory standards for well capitalized and adequately capitalized institutions and the capital ratios for the Company and the Bank as of the date indicated.
|
To Be Well Capitalized |
||||||||||||||||||||||||
|
For Capital |
Under Prompt Corrective |
|||||||||||||||||||||||
|
(Dollars in thousands) |
Actual |
Adequacy Purposes |
Action Provisions |
|||||||||||||||||||||
|
Minimum |
Minimum |
Minimum |
Minimum |
|||||||||||||||||||||
|
December 31, 2009 |
Amount |
Ratio |
Amount |
Ratio |
Amount |
Ratio |
||||||||||||||||||
|
Pacific State Bancorp: |
||||||||||||||||||||||||
|
Total capital (to risk-weighted assets) |
$ | 19,103 | 6.5 | % | $ | 23,388 | 8.0 | % | N/A | N/A | ||||||||||||||
|
Tier I capital (to risk-weighted assets) |
$ | 8,796 | 3.0 | % | $ | 11,694 | 4.0 | % | N/A | N/A | ||||||||||||||
|
Tier I capital (to average assets) …… |
$ | 8,796 | 2.3 | % | $ | 15,462 | 4.0 | % | N/A | N/A | ||||||||||||||
|
Pacific State Bank: |
||||||||||||||||||||||||
|
Total capital (to risk-weighted assets) |
$ | 19,004 | 6.5 | % | $ | 23,367 | 8.0 | % | $ | 29,209 | 10.0 | % | ||||||||||||
|
Tier I capital (to risk-weighted assets) |
$ | 15,273 | 5.2 | % | $ | 11,683 | 4.0 | % | $ | 17,525 | 6.0 | % | ||||||||||||
|
Tier I capital (to average assets) …… |
$ | 15,273 | 4.0 | % | $ | 15,452 | 4.0 | % | $ | 19,315 | 5.0 | % | ||||||||||||
|
December 31, 2008 |
||||||||||||||||||||||||
|
Pacific State Bancorp: |
||||||||||||||||||||||||
|
Total capital (to risk-weighted assets) |
$ | 41,903 | 11.5 | % | $ | 29,143 | 8.0 | % | N/A | N/A | ||||||||||||||
|
Tier I capital (to risk-weighted assets) |
$ | 37,336 | 10.3 | % | $ | 14,562 | 4.0 | % | N/A | N/A | ||||||||||||||
|
Tier I capital (to average assets) …… |
$ | 37,336 | 8.6 | % | $ | 17,310 | 4.0 | % | N/A | N/A | ||||||||||||||
|
Pacific State Bank: |
||||||||||||||||||||||||
|
Total capital (to risk-weighted assets) |
$ | 41,275 | 11.3 | % | $ | 29,107 | 8.0 | % | $ | 36,384 | 10.0 | % | ||||||||||||
|
Tier I capital (to risk-weighted assets) |
$ | 36,708 | 10.1 | % | $ | 14,554 | 4.0 | % | $ | 21,830 | 6.0 | % | ||||||||||||
|
Tier I capital (to average assets) |
$ | 36,708 | 8.7 | % | $ | 16,819 | 4.0 | % | $ | 21,023 | 5.0 | % | ||||||||||||
During the fourth quarter of 2009, the Company and the Bank entered into the Written Agreement with the FRB and the CDFI. Additionally, on April 15, 2010, the Bank executed a Waiver and Consent to an Order of the CDFI (the “Consent”) requiring the Bank, within 90 days of the effective
date of the Order, to increase and to maintain tangible capital at a level equal to 10% of assets. The effective date will be the date that the CDFI executes the Order per se. As of December 31, 2009, the Bank had a ratio of tangible capital to assets of 3.9%, which was not sufficient to meet the higher level that the Bank would be obligated to maintain under the Consent. As a result, if within 90 days of the effective
date of the Order the Bank cannot comply with the Consent provisions, the Bank may be subject to further supervisory action, which could have a material adverse effect on its results of operations, financial condition and business.
Investment Securities
The Company classifies its investment securities as "held-to-maturity" or "available-for-sale" at the time of investment purchase. Generally, all securities are purchased with the intent and ability to hold them for long-term
investment, and the Company has both the ability and intent to hold “held-to-maturity” investments to maturity. The Company does not engage in trading activities.
Investment securities held-to-maturity are carried at cost adjusted for the accretion of discounts and amortization of premiums. Securities available-for-sale may be sold to implement
the Company’s asset/liability management strategies and in response to changes in interest rates, prepayment rates and similar factors. Securities available-for-sale are recorded at fair value and unrealized gains or losses, net of income taxes, are reported as accumulated other comprehensive income or loss, in a separate component of shareholder's equity. Gain or loss on sale of investment securities is based on the specific identification method.
Investment securities held-to-maturity at December 31, 2009, consisted of mortgage-backed securities totaling $35 thousand with a remaining contractual maturity of 6 to 14 years and a weighted-average yield to maturity of 5.36%.
-47-
The following table summarizes the contractual maturities of the Company’s investment securities at their amortized cost and their weighted-average yields at December 31, 2009. The yield on tax-exempt securities has not been adjusted to a tax-equivalent yield basis.
|
(Dollars in thousands) |
Within One Year |
One to Five Years |
Five to Ten Years |
Over Ten Years |
Total |
|||||||||||||||||||||||||||||||||||
|
Amount |
Yield |
Amount |
Yield |
Amount |
Yield |
Amount |
Yield |
Amount |
Yield |
|||||||||||||||||||||||||||||||
|
Available-for-sale securities: |
||||||||||||||||||||||||||||||||||||||||
|
US Government Agencies and Treasuries |
$ | 5,002 | 2.35 | % | $ | - | - | % | $ | - | - | % | $ | - | - | % | $ | 5,002 | 2.35 | % | ||||||||||||||||||||
|
Municipal Obligations |
- | - | % | - | - | % | 359 | 2.90 | % | 2,371 | 4.82 | % | 2,730 | 4.57 | % | |||||||||||||||||||||||||
|
Corporate and Other Bonds |
- | - | % | - | - | % | - | - | % | 4,955 | 4.48 | % | 4,955 | 4.48 | % | |||||||||||||||||||||||||
|
Mortgage- backed securities |
257 | 3.46 | % | - | - | % | - | - | % | 12,521 | 4.69 | % | 12,778 | 4.66 | % | |||||||||||||||||||||||||
|
Total available-for-sale securities |
5,259 | 2.41 | % | - | - | % | 359 | 2.90 | % | 19,847 | 4.67 | % | 25,465 | 4.16 | % | |||||||||||||||||||||||||
|
Held-to-maturity Securities |
||||||||||||||||||||||||||||||||||||||||
|
Mortgage-backed securities |
$ | - | - | % | $ | - | - | % | $ | 18 | 5.96 | % | $ | 17 | 4.68 | % | $ | 35 | 5.36 | % | ||||||||||||||||||||
The following table summarizes the carrying value of the Company’s investment securities held on the dates indicated.
|
As of December 31, |
||||||||||||
|
(Dollars in thousands) |
2009 |
2008 |
2007 |
|||||||||
|
Available-for-sale securities – at fair value: |
||||||||||||
|
U.S. Government agencies and treasuries |
$ | 5,068 | $ | 10,177 | $ | 20,417 | ||||||
|
Municipal obligations |
2,662 | 3,035 | 3,161 | |||||||||
|
Corporate and other bonds |
2,985 | 3,809 | 9,592 | |||||||||
|
Mortgage- backed securities |
13,191 | 22,671 | 8,124 | |||||||||
|
Total available-for-sale |
$ | 23,906 | $ | 39,692 | $ | 41,294 | ||||||
|
Held-to-maturity securities – at amortized cost: |
||||||||||||
|
Mortgage-backed securities |
$ | 35 | $ | 46 | $ | 58 | ||||||
Due to the Company’s deterioration of shareholders’ equity in 2009, the Company currently has several securities whose investment is greater than 10% of the Company’s total equity.
LOANS AND ASSET QUALITY
The Company concentrates its lending activities primarily within Alameda, Calaveras, San Joaquin, Stanislaus and Tuolumne Counties.
The Company manages its credit risk through diversification of its loan portfolio and the application of underwriting policies and procedures and credit monitoring practices. Although the Company has a diversified loan portfolio, a significant portion of its borrowers' ability to repay the
loans is dependent upon the professional services and residential real estate development industry sectors. Generally, the loans are secured by real estate or other assets and are expected to be repaid from cash flows of the borrower or proceeds from the sale of collateral.
-48-
The following table sets forth the amounts of loans outstanding by category as of the dates indicated:
|
(Dollars in thousands) |
As of December 31, |
|||||||||||||||||||
|
2009 |
2008 |
2007 |
2006 |
2005 |
||||||||||||||||
|
Commercial and Agricultural |
$ | 73,861 | $ | 94,437 | $ | 95,658 | $ | 89,044 | $ | 60,645 | ||||||||||
|
Real estate-construction |
17,531 | 64,762 | 80,168 | 75,654 | 43,352 | |||||||||||||||
|
Real estate-commercial mortgage |
150,120 | 135,013 | 121,157 | 112,532 | 126,166 | |||||||||||||||
|
Installment |
14,641 | 13,609 | 15,215 | 12,526 | 13,536 | |||||||||||||||
|
Deferred Loan Fees and Costs |
201 | 143 | 208 | 40 | 213 | |||||||||||||||
|
Allowance for Loan Losses |
(10,508 | ) | (6,019 | ) | (3,948 | ) | (2,478 | ) | (2,356 | ) | ||||||||||
|
Total Net Loans |
$ | 245,846 | $ | 301,945 | $ | 308,458 | $ | 287,318 | $ | 241,556 | ||||||||||
Net loans have decreased $56.1 million or 19%, to $246.0 million at December 31, 2009 from $302.0 million at December 31, 2008. The Company’s loan portfolio contracted in the commercial and agricultural categories by $20.5 million or 22% in 2009. Real estate construction loans have decreased $47.2 million or
73%, real estate commercial mortgage loans increased $15.1 million or 11% and installment loans have increased $1.0 million or 8% in 2009. The portfolio mix has changed in 2009 as compared with the mix of the previous year: while commercial and agricultural loans remained at 30% in 2009, real estate construction loans decreased to 7% compared from 21% in 2008, real estate - commercial mortgage loans increased to 61%, compared to 44% in 2008 and installment loans increased to 6% in 2009 over 4% in 2008. The
shift in the mix reflects the changes in lending needs within the Company’s service area. In addition, the Company has reclassified loans from real estate – construction to real estate – commercial mortgage as construction projects are completed and a permanent loan is provided. The Company has also reclassified real estate – construction loans to other real estate as projects are acquired through foreclosure and prepared for liquidation. The change in
the mix of the loan portfolio is the result of management’s efforts to reduce risk and minimize losses where possible.
The following table sets forth the maturity distribution of the Company’s commercial and agricultural loans and construction loans outstanding as of December 31, 2009, which, based on remaining scheduled repayments of principal, were due within the periods indicated.
|
(Dollars in thousands) |
Within One Year |
After One through Five Years |
After Five Years |
Total |
||||||||||||
|
Commercial and agricultural loans |
$ | 37,954 | $ | 28,334 | $ | 7,573 | $ | 73,861 | ||||||||
|
Construction Loans |
17,531 | - | - | 17,531 | ||||||||||||
|
Total |
$ | 55,485 | $ | 28,334 | $ | 7,573 | $ | 91,392 | ||||||||
|
Loans due after one year with: |
||||||||||||||||
|
Fixed Rates |
$ | 23,110 | $ | 4,551 | $ | 27,661 | ||||||||||
|
Variable Rates |
$ | 5,224 | $ | 3,022 | $ | 8,246 | ||||||||||
The Company’s practice is to place a loan on nonaccrual status when one of the following events occurs:(i) Any installment of principal or interest is 90 days or more past due (unless in management's opinion the loan is well-secured and in the process of collection), (ii) management determines the ultimate collection of principal
or interest to be unlikely or (iii) the terms of the loan have been renegotiated due to a serious weakening of the borrower's financial condition. Nonperforming loans are loans that are on nonaccrual, are 90 days past due and still accruing or have been restructured.
-49-
The following table sets forth a summary of the Company’s nonperforming loans and other assets as of the dates indicated:
|
As of December 31, |
||||||||||||||||||||
|
(Dollars in Thousands) |
2009 |
2008 |
2007 |
2006 |
2005 |
|||||||||||||||
|
Nonaccrual loans |
$ | 22,864 | $ | 23,560 | $ | 432 | $ | - | $ | - | ||||||||||
|
90 days past due and still accruing interest |
- | - | - | - | - | |||||||||||||||
|
Other Real Estate Owned |
$ | 10,934 | $ | 2,029 | - | - | -- | |||||||||||||
The Company had a total of twenty five loans on nonaccrual at December 31, 2009. In each case, the Company holds commercial real estate as collateral and in one case holds a single family residence as collateral in addition to the commercial real estate. The Company had a total of eleven loans on nonaccrual at December
31, 2008. Three of those loans accounted for $17 million or 72% of the total balance of nonaccrual loans. The Company had one nonaccrual loan as of December 31, 2007.
ALLOWANCE FOR LOAN LOSSES (ALL)
In determining the amount of the Company’s Allowance for Loan Losses (“ALL”), management assesses probable loss characteristics of the loan portfolio including the concentrations, nature and diversification of the portfolio. Each credit is assigned a credit risk rating factor, and this factor, multiplied by the dollars
associated with the credit risk rating, is used to calculate one component of the ALL. In addition, management estimates the probable loss on individual credits that are receiving increased management attention due to identified increases in credit risk. Management reviews the credit risk report with the Directors Loan Committee as well as with the full Board of Directors, monthly.
The adequacy of the ALL is calculated upon three components. First is the credit risk rating of the loan portfolio, including all outstanding loans. Every extension of credit has been assigned a risk rating based upon a comprehensive definition intended to measure the inherent
risk of lending money. Each rating has an assigned risk factor expressed as a reserve percentage. Central to this assigned risk factor is the historical loss record of the Company. Secondly, established specific reserves are available for individual loans currently on management's watch and classified loan lists. These are the estimated potential losses associated with specific borrowers based upon the collateral and event(s) causing the risk ratings. The third component is unallocated. This reserve is for qualitative
factors that may affect the portfolio as a whole, such as those factors described below. Management believes the assigned risk grades and our methods for managing risk are satisfactory.
The Company makes provisions to the ALL on a regular basis through charges to operations that are reflected in the Company’s statements of income as a provision for loan losses. When a loan is deemed uncollectible, it is charged against the allowance. Any recoveries of previously charged-off
loans are credited back to the allowance. There is no precise method of predicting specific losses or amounts that ultimately may be charged-off on particular categories of the loan portfolio. Similarly, the adequacy of the ALL and the level of the related provision for probable loan losses is determined on a judgment basis by management based on consideration of a number of factors including (i) economic conditions, (ii) borrowers' financial condition, (iii) loan impairment, (iv) evaluation of industry trends,
(v) industry and other concentrations, (vi) loans which are contractually current as to payment terms but demonstrate a higher degree of risk as identified by management, (vii) continuing evaluation of the performing loan portfolio, (viii) monthly review and evaluation of problem loans identified as having a loss potential, (ix) monthly review by the Board of Directors, and (x) assessments by regulators and other third parties. Certain members of Management and the Board of Directors evaluate the allowance and
determine its desired level considering objective and subjective measures, such as knowledge of the borrowers' businesses, valuation of collateral, the determination of impaired loans and exposure to potential losses.
-50-
The Company’s principal lines of lending are (i) commercial and agricultural, (ii) real estate construction and (iii) commercial and residential real estate. The primary sources of repayment of the Company’s commercial loans are the borrowers' conversion of short-term assets to
cash and operating cash flow. The net assets of the borrower or guarantor are usually identified as a secondary source of repayment. The principal factors affecting the Company’s risk of loss from commercial lending include each borrower's ability to manage its business affairs and cash flows, local and general economic conditions and real estate values in the Company’s service area. The Company manages its commercial loan portfolio by monitoring its borrowers' payment performance and their respective
financial condition and makes periodic adjustments, if necessary, to the risk grade assigned to each loan in the portfolio. The Company’s evaluations of its borrowers are facilitated by management's knowledge of local market conditions and periodic reviews by a consultant of the Company’s credit administration policies.
The principal source of repayment of the Company’s real estate construction loans is the sale of the underlying collateral or the availability of permanent financing from the Company or other lending source. The principal risks associated with real estate construction lending include
project cost overruns and deterioration of real estate values as a result of various factors, including competitive pressures and economic downturns. The Company manages its credit risk associated with real estate construction lending by establishing loan-to-value ratios and loan-to-cost ratios on projects on an as-completed basis, inspecting project status in advance of controlled disbursements and matching maturities with expected completion dates. Generally, the Company requires a loan-to-value ratio of not
more than 80% on single family residential construction loans.
The principal source of repayment of the Company’s real estate mortgage loans is the borrowers' operating cash flow. Similar to commercial loans, the principal factors affecting the Company’s risk of loss in real estate mortgage lending include each borrower’s ability to
manage its business affairs and cash flows, local and general economic conditions and real estate values in the Company’s service area. The Company manages its credit risk associated with real estate mortgage lending primarily by establishing maximum loan-to-value ratios and using strategies to match the borrower's cash flow to loan repayment terms.
The Company’s specific underwriting standards and methods for each of its principal lines of lending include industry-accepted analysis and modeling and certain proprietary techniques. The Company’s underwriting criteria are designed to comply with applicable regulatory guidelines,
including required loan-to-value ratios. The Company’s credit administration policies contain mandatory lien position and debt service coverage requirements, and the Company generally requires a guarantee from 20% or more owners of its corporate borrowers.
The ALL should not be interpreted as an indication that charge-offs in future periods will occur in the stated amounts or proportions.
-51-
The following table summarizes the Company’s loan loss experience as well as provisions and charges to the allowance for loan losses and certain ratios for the periods indicated:
|
(Dollars in thousands) |
Years Ended December 31, |
|||||||||||||||||||
|
2009 |
2008 |
2007 |
2006 |
2005 |
||||||||||||||||
|
Beginning Balance: |
$ | 6,019 | $ | 3,948 | $ | 2,478 | $ | 2,356 | $ | 2,214 | ||||||||||
|
Provision for loan losses |
15,365 | 7,001 | 1,425 | 360 | 35 | |||||||||||||||
|
Charge-offs: |
||||||||||||||||||||
|
Commercial |
(3,253 | ) | (1,905 | ) | (143 | ) | (10 | ) | - | |||||||||||
|
Real Estate |
(7,532 | ) | (3,266 | ) | - | - | - | |||||||||||||
|
Other |
(204 | )) | (697 | ) | (18 | ) | (14 | ) | (17 | ) | ||||||||||
|
Total Charge-offs |
(10,989 | ) | (5,868 | ) | (161 | ) | (24 | ) | (17 | ) | ||||||||||
|
Recoveries: |
||||||||||||||||||||
|
Commercial |
98 | 925 | 203 | - | 124 | |||||||||||||||
|
Other |
15 | 13 | 3 | 1 | - | |||||||||||||||
|
Total Recoveries |
113 | 938 | 206 | 1 | 124 | |||||||||||||||
|
Reclassification of the reserve for unfunded commitments |
- | - | - | (215 | ) | - | ||||||||||||||
|
Ending Balance |
$ | 10,508 | $ | 6,019 | $ | 3,948 | $ | 2,478 | $ | 2,356 | ||||||||||
|
ALL to total loans |
4.10 | % | 1.95 | % | 1.26 | % | 0.98 | % | 1.10 | % | ||||||||||
|
Net charge-offs (recoveries) to average loans |
3.79 | % | 1.53 | % | (0.01 | )% | 0.01 | % | (0.01 | )% | ||||||||||
The provision for loan losses was $15,365,000 for 2009 compared to $7,001,000 for 2008 and $1,425,000 for 2007. The increase of $8,364,000 in the provision for loan losses in 2009 over 2008 reflected a severe economic downturn in the region where the Company operates. The region has experienced declining real estate values which
have left certain construction loans with a loan-to-value of greater than 100%. In those cases where the loan is dependent on the collateral to repay the loan, the Company has charged-off loan principal to bring the loan back into compliance with policy. In other cases, the value of the collateral has decreased below the principal on the loan, but cash flows from business operations are expected to repay the loan. In these cases the business is evaluated to determine if there
are sufficient cash flows available through business operations to repay the loan. If operating cash flow has deteriorated, additional reserve is recorded against the loan. The increase of $5,576,000 in the provision for loan losses, in 2008 over 2007 represented potential losses from specific customers in the loan portfolio. The Company recorded net charge-offs of $10,876,000 or 3.79% of average loans during 2009. Net charge-offs were $4,930,000 or 1.53% of average
loans during 2008. Net (recoveries) charge-offs were $(45,000) or .01% of average loans for 2007.
The following table summarizes the allocation of the allowance for loan losses (ALL) by loan type and the loans as a percent of loans outstanding in each loan category at the dates indicated
|
(Dollars in thousands) |
||||||||||||||||||||||||||||||||||||||||
|
2009 |
2008 |
2007 |
2006 |
2005 |
||||||||||||||||||||||||||||||||||||
|
Commercial and Agricultural |
$ | 4,026 | 38.31 | % | $ | 1,428 | 30.68 | % | $ | 1,584 | 30.77 | % | $ | 1,086 | 25.82 | % | $ | 994 | 24.89 | % | ||||||||||||||||||||
|
Real estate – construction |
395 | 3.76 | % | 2,882 | 21.04 | % | 757 | 25.68 | % | 269 | 26.11 | % | 196 | 17.79 | % | |||||||||||||||||||||||||
|
Real estate – commercial |
5,218 | 49.66 | % | 1,312 | 43.86 | % | 563 | 39.58 | % | 642 | 44.01 | % | 501 | 51.77 | % | |||||||||||||||||||||||||
|
Installment |
869 | 8.27 | % | 246 | 4.42 | % | 293 | 3.97 | % | 279 | 4.06 | % | 300 | 5.55 | % | |||||||||||||||||||||||||
|
Unallocated |
- | - | 151 | - | 751 | - | 202 | - | 365 | - | ||||||||||||||||||||||||||||||
|
Total |
$ | 10,508 | 100.00 | % | $ | 6,019 | 100.00 | % | $ | 3,948 | 100.00 | % | $ | 2,478 | 100.00 | % | $ | 2,356 | 100.00 | % | ||||||||||||||||||||
-52-
DEPOSITS
The Company primarily obtains deposits from local businesses and professionals as well as through certificates of deposit, savings and checking accounts.
The following table sets forth the remaining maturities of certificates of deposit at December 31, 2009:
|
(Dollars in thousands) |
Under $100,000 |
Over $100,000 |
||||||
|
Three Months or less |
$ | 27,182 | $ | 26,748 | ||||
|
Over three through six months |
7,433 | 8,934 | ||||||
|
Over six through twelve months |
26,321 | 27,497 | ||||||
|
Over twelve months |
35,256 | 21,912 | ||||||
|
Total |
$ | 96,192 | $ | 85,091 | ||||
LIQUIDITY AND MARKET RISK
The purpose of liquidity management is to ensure efficient and economical funding of the Company’s assets consistent with the needs of the Company’s depositors and, to a lesser extent, shareholders. This process is managed not by formally monitoring the cash flows from operations, investing and financing activities as described
in the Company’s statement of cash flows, but through an understanding principally of depositor and borrower needs. As loan demand increases, the Company can use asset liquidity from maturing investments along with deposit growth to fund the new loans.
With respect to assets, liquidity is provided by receipts from cash and money market investments such as interest-bearing time deposits, federal-funds sold, available-for-sale investment securities, and by principal and interest payments on loans. With respect to liabilities, liquidity is
provided by core deposits, shareholders' equity and the ability of the Company to borrow funds and to generate deposits.
Because estimates of the liquidity needs of the Company may vary from actual needs, the Company maintains a substantial amount of liquid assets to absorb short-term increases in loans or reductions in deposits. As loan demand decreases or loans are paid off, investment assets can absorb these
excess funds or deposit rates can be decreased to run off excess liquidity. Therefore, there is some correlation between financing activities associated with deposits and investing activities associated with lending. The Company’s liquid assets (cash and due from banks, federal funds sold, interest bearing deposits in banks and available-for-sale investment securities) totaled $80.0 million or 22% of total assets at December 31, 2009, $78.2 million or 19% of total assets at December 31, 2008 and $89.9 million
or 21% of total assets at December 31, 2007. The Company expects that its primary source of liquidity will be acquisition of core deposits and wholesale borrowing arrangements.
The Bank is a participating institution in the Transaction Account Guarantee Program (“TAG Program”), which the FDIC extended in April of 2010 from June 30, 2010 to December 31, 2010. The TAG Program provides the Bank’s deposit customers in non-interest bearing and interest-bearing NOW accounts paying fifty basis
points or less full FDIC insurance for an unlimited amount. The current expiration of the TAG Program is anticipated to be the Bank’s most significant liquidity risk in the near term and mitigating the liquidity impact of such an event remains a priority. As of December 31, 2009, the Company had approximately 49 deposit accounts with balances greater than $250,000 participating in the TAG Program providing unlimited insurance coverage for a total of $26 million in deposits. Based on current liquidity
sources, management anticipates that the Bank will have adequate collateral and other sources of liquidity to meet these potential needs. However, it could require the Bank to utilize the majority of its available liquidity and potentially utilize a portion of our borrowing capacity at the discount window.
MARKET RISK
Market risk is the risk of loss in a financial instrument arising from adverse changes in market rates and processes such as interest rates, commodity prices and equity prices. As typical for a financial institution, the Company’s market risk arises primarily from interest rate risk exposure. Fluctuation in interest
rates will ultimately impact both the level of income and expense recorded on a large portion of the Company’s assets and liabilities, and the market value of all interest earning assets and interest bearing liabilities, other than those that possess a short term to maturity. Based upon the nature of its operations, the Company is not subject to foreign currency exchange or commodity pricing. However, the Company’s commercial real estate loan portfolio, concentrated primarily
in Northern California, is subject to risks associated with the local economies.
The fundamental objective of the Company’s management of its assets and liabilities is to maximize the economic value of the Company while maintaining adequate liquidity and managing exposure to interest rate risk deemed by management to be acceptable. Management believes
an acceptable degree of exposure to interest rate risk results from management of assets and liabilities through using floating rate loans and deposits, maturities, pricing and mix to attempt to neutralize the potential impact of changes in market interest rates. The Company’s profitability is dependent to a large extent upon its net interest income, which is the difference between its interest income on interest earning assets, such as loans and securities, and interest expense on interest bearing
liabilities, such as deposits, trust preferred securities and other borrowings. The Company, like other financial institutions, is subject to interest rate risk to the degree that its interest earning assets reprice differently from its interest bearing liabilities. The Company manages its mix of assets and liabilities with the goal of limiting exposure to interest rate risk, ensuring adequate liquidity, and coordinating its sources and uses of funds.
The Company seeks to control its interest rate risk exposure in a manner that will allow for adequate levels of earnings and capital over a range of possible interest rate environments. The Company has adopted formal policies and practices to monitor and manage interest rate exposure. As
part of this effort, the Company measures interest rate risk utilizing both an internal asset liability measurement system as well as independent third party reviews to confirm the reasonableness of the assumptions used to measure and report the Company’s interest rate risk, enabling management to make any adjustments necessary.
Interest rate risk is managed by the Company’s Asset Liability Committee (“ALCO”), which includes members of senior management and several members of the Board of Directors. The ALCO monitors interest rate risk by analyzing the potential impact on interest income
from potential changes in interest rates and considers the impact of alternative strategies or changes in balance sheet structure. The ALCO manages the Company’s balance sheet in part to maintain the potential impact on net interest income within acceptable ranges despite changes in interest rates. The Company’s exposure to interest rate risk is reviewed on a quarterly basis by the ALCO.
-53-
NET INTEREST INCOME SIMULATION
In order to measure interest rate risk at December 31, 2009, the Company used a simulation model to project changes in net interest income that result from forecasted projection and changes in interest rates. This analysis, which is performed quarterly by management, calculates the difference between net interest income forecasted
using a rising and falling interest rate scenario and net interest income forecasted using a base market derived from the current interest rates. The income simulation model includes various assumptions regarding the re-pricing relationships for each of the Company’s products. Many of the Company’s assets are floating rate loans, which are assumed to reprice immediately and to the same extent as the change in market rates according to their contracted index. The Company’s
non-term deposit products reprice more slowly, usually changing less than the change in market rates and at the discretion of the Company.
The analysis indicates the impact of changes in net interest income for the given set of rate changes and assumptions. It assumes that the balance sheet grows modestly, but that its structure will remain similar to the structure at year-end. It does not account for all
factors that impact this analysis, including the potential impact of loan prepayments, deposit drifts or other balance sheet movements including changes by management to mitigate the impact of interest rate changes or secondary impacts such as changes to the Company’s credit risk profile as interest rates change. Changes that vary significantly from the assumptions may have significant effects on the Company’s net interest income.
The following table reflects the Company’s projected net interest income sensitivity analysis based on year-end data:
|
December 31, 2009 |
||||||||
|
Change in Rates |
Adjusted Net Interest Income |
Percent Change From Base |
||||||
|
(In thousands) |
||||||||
|
Up 200 basis points |
$ | 11,097 | (8.24 | )% | ||||
|
Up 100 basis points |
$ | 11,601 | (4.08 | )% | ||||
|
Base Scenario |
$ | 12,094 | 0.00 | % | ||||
|
Down 100 basis points |
$ | 12,242 | 1.22 | % | ||||
|
Down 200 basis points |
$ | 12,100 | 0.05 | % | ||||
-54-
CONTRACTUAL OBLIGATIONS
The following table summarizes the contractual obligations of the Company as of December 31, 2009:
|
Less than |
More than |
|||||||||||||||||||
|
Total |
one year |
1-3 years |
3-5 years |
5 years |
||||||||||||||||
|
Subordinated Debentures, floating rate |
||||||||||||||||||||
|
of 3.04% payable March 17, 2034 |
$ | 3,609 | $ | - | $ | - | $ | - | $ | 3,609 | ||||||||||
|
Subordinated Debentures, floating rate |
||||||||||||||||||||
|
of 1.70% payable September 16, 2037 |
5,155 | - | - | - | 5,155 | |||||||||||||||
|
FHLB Loans weighted average fixed rate of 3.20% |
29,000 | 26,000 | 2,000 | 1,000 | - | |||||||||||||||
|
Operating lease obligations |
1,868 | 306 | 647 | 686 | 229 | |||||||||||||||
|
Salary continuation program (1) |
1,223 | - | - | - | 1,223 | |||||||||||||||
|
Total |
$ | 40,855 | $ | 26,306 | $ | 2,647 | $ | 1,686 | $ | 10,216 | ||||||||||
|
(1) |
Salary continuation program obligations represent the amount accrued as of December 31, 2009 under the terms of the program. |
In addition to those obligations listed above, in the normal course of business, the Company will make cash distributions for, among other items, the payment of interest on interest bearing deposit accounts and debt obligations, payments for quarterly tax estimates and contributions to certain employee benefit plans.
IMPACT OF INFLATION
Inflation affects the Company’s financial position as well as its operating results. It is management's opinion that the effects of inflation on the financial statements have not been material.
-55-
QUARTERLY FINANCIAL INFORMATION (UNAUDITED)
The following table presents the summary unaudited results for the stated eight quarters:
|
2009 |
2008 |
|||||||||||||||||||||||||||||||
|
(In thousands, except per share data) |
4th Quarter |
3rd Quarter |
2nd Quarter |
1st
Quarter |
4th Quarter |
3rd Quarter |
2nd Quarter |
1st
Quarter |
||||||||||||||||||||||||
|
Diluted (loss) earnings per share |
(2.76 | ) | (2.12 | ) | (1.23 | ) | (.08 | ) | $ | (1.52 | ) | $ | (0.30 | ) | $ | 0.15 | $ | 0.27 | ||||||||||||||
|
Basic (loss) earnings per share |
(2.76 | ) | (2.12 | ) | (1.23 | ) | (.08 | ) | $ | (1.52 | ) | $ | (0.32 | ) | $ | 0.16 | $ | 0.30 | ||||||||||||||
|
Interest income |
4,389 | 4,978 | 5,178 | 5,552 | $ | 5,792 | $ | 6,948 | $ | 7,234 | $ | 7,301 | ||||||||||||||||||||
|
Net interest income |
2,773 | 3,142 | 3,048 | 3,325 | $ | 3,220 | $ | 4,048 | $ | 3,848 | $ | 3,919 | ||||||||||||||||||||
|
Provision for loan losses |
9,213 | 1,000 | 4,180 | 972 | $ | 5,591 | $ | 600 | $ | 600 | $ | 210 | ||||||||||||||||||||
|
Total non-interest (loss) income |
293 | (345 | ) | (1,692 | ) | 379 | $ | (3,400 | ) | $ | (2,937 | ) | $ | 597 | $ | 472 | ||||||||||||||||
|
Total non-interest expense |
7,163 | 3,412 | 5,067 | 3,297 | $ | 4,450 | $ | 3,558 | $ | 2,825 | $ | 2,495 | ||||||||||||||||||||
|
(Loss) Income before taxes |
(13,949 | ) | (1,615 | ) | (7,891 | ) | (565 | ) | $ | (10,221 | ) | $ | (3,047 | ) | $ | 1,020 | $ | 1,686 | ||||||||||||||
|
Net (loss) Income |
(10,305 | ) | (7,874 | ) | (4,565 | ) | (294 | ) | $ | (5,654 | ) | $ | (1,209 | ) | $ | 579 | $ | 1,094 | ||||||||||||||
-56-
MARKET PRICE FOR REGISTRANT’S COMMON EQUITY, DIVIDENDS AND RELATED STOCKHOLDER MATTERS
The Company’s common stock is listed for trading on the NASDAQ Global Market under the symbol PSBC. Prior to July 12, 2005, trading information regarding the common stock was available via the OTC Bulletin Board. The following table, which summarizes trading activity during the Company’s last two fiscal years, is based on information
provided by Yahoo.com Historical Quotes. The quotations reflect the price that would be received by the seller without retail mark-up, mark-down or commissions and may not have represented actual transactions.
|
Sales Prices |
||||||||||||
|
Quarter Ended: |
High |
Low |
Volume |
|||||||||
|
December 31, 2009 |
$ | 1.00 | $ | 0.34 | 1,155,700 | |||||||
|
September 30, 2009 |
$ | 2.01 | $ | 0.79 | 964,500 | |||||||
|
June 30, 2009 |
$ | 1.98 | $ | 1.05 | 443,200 | |||||||
|
March 31, 2009 |
$ | 2.75 | $ | 1.00 | 406,400 | |||||||
|
December 31, 2008 |
$ | 6.10 | $ | 1.90 | 209,500 | |||||||
|
September 30, 2008 |
$ | 9.70 | $ | 5.01 | 208,300 | |||||||
|
June 30, 2008 |
$ | 12.43 | $ | 8.00 | 106,000 | |||||||
|
March 31, 2008 |
$ | 14.80 | $ | 10.86 | 111,600 | |||||||
-57-
As of March 15, 2010, there were approximately 280 holders of record of the common stock of the Company.
DIVIDENDS
The Company’s primary source of cash is dividends from the Bank. The Bank’s ability to pay dividends is subject to certain regulatory requirements. The California Financial Code restricts the total dividend payment of any bank in any calendar year to the lesser of (1) the bank’s retained earnings
or (2) the bank’s net income for its last three fiscal years, less distributions made to shareholders’ during the same three-year period. As of December 31, 2009, the Bank did not have retained earnings available for dividends to the Company. In addition, the Company’s ability to pay dividends to its shareholders is subject to certain covenants contained in the indentures related to the trust preferred securities issued by the Trusts and a written agreement entered into with regulatory
agencies.
The power of the Board of Directors of an insured depository institution to declare a cash dividend or other distribution with respect to capital is subject to statutory and regulatory restrictions which limit the amount available for such distribution depending upon the earnings, financial
condition and cash needs of the institution, as well as general business conditions.
-58-
Stock Performance Graph
The following chart, compare the yearly percentage changes in cumulative shareholder return on our common stock during the five fiscal years ended December 31, 2009, with (i) the Total Return Index for the Nasdaq Stock Market (U.S. Companies) (ii) the Standard and Poor’s 500 and (iii) the Total Return Index for the Nasdaq Bank Stocks,
as reported by the Center for Research in Securities Prices. The comparison assumes $100.00 was invested on December 31, 2004, in our common stock and the comparison indices, and assumes the reinvestment of all cash dividends prior to any tax effect and retention of all stock dividends. Price information from December 31, 2004 to December 31, 2009, was obtained by using Nasdaq closing prices as of the last trading day of each year.
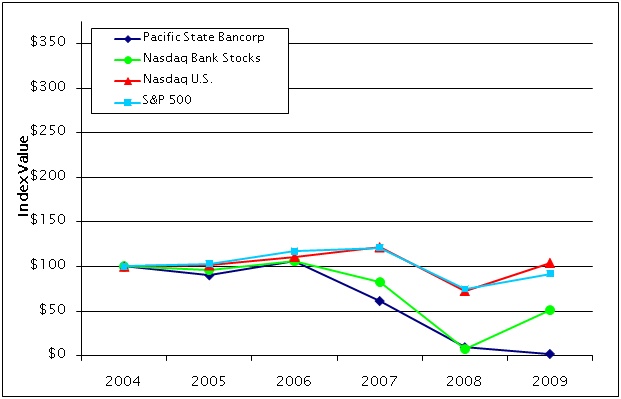
|
Period Ending |
||||||||||||||||||||||||
|
Index |
12/31/2004 |
12/31/2005 |
12/31/2006 |
12/31/2007 |
12/31/2008 |
12/31/2009 |
||||||||||||||||||
|
Pacific State Bancorp |
$ | 100.00 | $ | 90.24 | $ | 106.05 | $ | 61.32 | $ | 9.27 | $ | 1.80 | ||||||||||||
|
Nasdaq Bank Stocks |
$ | 100.00 | $ | 95.67 | $ | 106.20 | $ | 82.76 | $ | 7.30 | $ | 51.31 | ||||||||||||
|
Nasdaq U.S. |
$ | 100.00 | $ | 101.37 | $ | 111.03 | $ | 121.92 | $ | 72.49 | $ | 104.31 | ||||||||||||
|
S&P 500 |
$ | 100.00 | $ | 103.00 | $ | 117.03 | $ | 121.16 | $ | 74.53 | $ | 92.01 | ||||||||||||
-59-