Attached files
| file | filename |
|---|---|
| EX-3.2 - AMENDED COMPANY BY LAWS - ALCO STORES INC | amendedbylaws.htm |
| EX-10.6 - RAMSEY EMP AGREEMENT ADDENDUM - ALCO STORES INC | ramseyaddendum.htm |
| EX-10.5 - JOHNSON EMP AGREEMENT ADDENDUM - ALCO STORES INC | johnsonaddendum.htm |
| EX-31.2 - CFO CERTFICATION - ALCO STORES INC | cfocertification.htm |
| EX-10.4 - CANFIELD EMP AGREEMENT ADDENDUM - ALCO STORES INC | canfieldaddendum.htm |
| EX-31.1 - CEO CERTIFICATION - ALCO STORES INC | ceocertification.htm |
| EX-23.1 - ACCOUNTANT CONSENT - ALCO STORES INC | accountantconsent.htm |
| EX-10.3 - RAMSEY EMPLOYMENT AGREEMENT - ALCO STORES INC | ramseyempagreement.htm |
| EX-32.1 - CEO SOX CERTFICATION - ALCO STORES INC | ceosoxcertification.htm |
| EX-32.2 - CFO SOX CERTIFICATION - ALCO STORES INC | cfosoxcertification.htm |
| EX-10.2 - JOHNSON EMPLOYMENT AGREEMENT - ALCO STORES INC | johnsonempagreement.htm |
| EX-10.1 - CANFIELD EMPLOYMENT AGREEMENT - ALCO STORES INC | canfieldempagreement.htm |
UNITED STATES
SECURITIES AND EXCHANGE COMMISSION
Washington, D.C. 20549
FORM 10-K
|
(X) ANNUAL REPORT PURSUANT TO SECTION 13 OR 15(d) OF THE SECURITIES EXCHANGE ACT OF 1934
|
For the fiscal year ended January 31, 2010
or
|
( ) TRANSITION REPORT PURSUANT TO SECTION 13 OR 15(d) OF THE SECURITIES EXCHANGE ACT OF 1934
|
Commission File Number 0-20269

DUCKWALL-ALCO STORES, INC.
(Exact name of registrant as specified in its charter)
|
Kansas
|
48-0201080
|
|
(State or other jurisdiction of incorporation or organization)
|
(I.R.S. Employer Identification No.)
|
|
401 Cottage Street
Abilene, Kansas
|
67410-2832
|
|
(Address of principal executive offices)
|
(Zip Code)
|
Registrant's telephone number including area code: (785) 263-3350
Securities registered pursuant to Section 12(b) of the Act:
NONE
Securities registered pursuant to Section 12(g) of the Act:
Common Stock, par value $.0001 per share
(Title of Class)
Indicate by check mark if the registrant is a well-known seasoned issuer, as defined in Rule 405 of the Securities Act. Yes_____ No __X_
Indicate by check mark if the registrant is not required to file reports pursuant to Section 13 or Section 15(d) of the Exchange Act. Yes___ No _X__
Indicate by check mark whether the registrant (1) has filed all reports required to be filed by Section 13 or 15(d) of the Securities Exchange Act of 1934 during the preceding 12 months (or for such shorter period that the registrant was required to file such reports), and (2) has been subject to such filing requirements for the past 90 days. Yes X No _____
Indicate by check mark whether the registrant has submitted electronically and posted on its corporate web site, if any, every Interactive Data File required to be submitted and posted pursuant to Rule 405 of Regulation S-T during the preceding 12 months (or for such shorter period that the registrant was required to submit and post such files). Yes _____ No _____
Indicate by check mark if disclosure of delinquent filers pursuant to Item 405 of Regulation S-K is not contained herein, and will not be contained, to the best of registrant's knowledge, in definitive proxy or information statements incorporated by reference in Part III of this Form 10-K or any amendment to this Form 10-K. [X]
Indicate by check mark whether the registrant is a large accelerated filer, an accelerated filer, a non-accelerated filer or a smaller reporting company. See definitions of “accelerated filer", "large accelerated filer” and "smaller reporting company" in Rule 12b-2 of the Exchange Act. Large accelerated filer [ ] Accelerated filer [X] Non-accelerated filer (Do not check if a smaller reporting company) [ ] Smaller reporting company [ ]
Indicate by check mark whether the registrant is a shell company (as defined in Rule 12b-2 of the Exchange Act). Yes ____ No __X__
The aggregate market value of the 3,797,947 shares of Common Stock, par value $.0001 per share, of the registrant held by non-affiliates of the registrant is $64,868,935 on August 2, 2009, based on a closing sale price of $17.08. As of April 15, 2010, there were 3,826,852 shares of Common Stock outstanding.
Documents incorporated by reference: portions of the Registrant's Proxy Statement for the 2010 Annual Meeting of Stockholders are incorporated by reference in Part I and III hereof.
DUCKWALL-ALCO FISCAL 2010 FORM 10-K
|
TABLE OF CONTENTS
|
|||||
|
PART I
|
|||||
|
Item 1.
|
Business
|
3
|
|||
|
Item 1A.
|
Risk Factors
|
6
|
|||
|
Item 1B.
|
Unresolved Staff Comments
|
8
|
|||
|
Item 2.
|
Properties
|
8
|
|||
|
Item 3.
|
Legal Proceedings
|
8
|
|||
|
Item 4.
|
Reserved
|
8
|
|||
|
PART II
|
|||||
|
Item 5.
|
Market for Registrant's Common Equity, Related Stockholder Matters and Issuer Purchases of Equity Securities
|
9
|
|||
|
Item 6.
|
Selected Financial Data
|
11
|
|||
|
Item 7.
|
Management's Discussion and Analysis of Financial Condition and Results of Operations
|
12
|
|||
|
Item 7A.
|
Quantitative and Qualitative Disclosures About Market Risk
|
22
|
|||
|
Item 8.
|
Financial Statements and Supplementary Data
|
23
|
|||
|
Item 9.
|
Changes in and Disagreements With Accountants on Accounting and Financial Disclosure
|
38
|
|||
|
Item 9A.
|
Controls and Procedures
|
39
|
|||
|
Item 9B.
|
Other Information
|
40
|
|||
|
PART III
|
|||||
|
Item 10.
|
Directors and Executive Officers of the Registrant
|
40
|
|||
|
Item 11.
|
Executive Compensation
|
41
|
|||
|
Item 12.
|
Security Ownership of Certain Beneficial Owners and Management and Related Stockholder Matters
|
41
|
|||
|
Item 13.
|
Certain Relationships and Related Transactions
|
41
|
|||
|
Item 14.
|
Principal Accountant Fees and Services
|
41
|
|||
|
PART IV
|
|||||
|
Item 15.
|
Exhibits and Financial Statement Schedules
|
41
|
|||
|
Signatures
|
43
|
||||
2
PART I
ITEM 1. BUSINESS
History
Duckwall-ALCO Stores, Inc., (the “Company” or “Registrant”), was founded as a general merchandising operation in 1901 in Abilene, Kansas by A. L. Duckwall. From its founding until 1968, the Company conducted its retail operations as small variety or “dime” stores. In 1968, the Company followed an emerging trend to broad line retailing when it opened its first ALCO store. The Company's overall business strategy involves identifying and opening stores in towns that will provide the Company with the highest return on investment. This strategy includes opening ALCO stores. As of January 31, 2010, the Company operates 258 stores located in the central United States, consisting of 209 ALCO stores and 49 Duckwall stores.
The Company was incorporated on July 2, 1915 under the laws of Kansas. The Company's executive offices are located at 401 Cottage Street, Abilene, Kansas 67410-2832, and its telephone number is (785) 263-3350.
General
The Company is a regional retailer operating 258 stores in 23 states in the central United States. The Company's strategy is to target smaller markets not served by other regional or national broad line retail chains and to provide the most convenient access to retail shopping within each market. The Company's ALCO stores offer a broad line of merchandise consisting of approximately 35,000 items, including automotive, candy, crafts, domestics, electronics, fabrics, furniture, hardware, health and beauty aids, housewares, jewelry, ladies', men's and children's apparel and shoes, pre-recorded music and video, sporting goods, seasonal items, stationery and toys. The Company's smaller Duckwall stores offer a more limited selection of similar merchandise.
Of the Company's 209 ALCO stores, more than 70% operate in primary markets that do not have another broad line retailer. The ALCO stores account for approximately 96% of the Company's net sales. The current ALCO store averages approximately 21,000 square feet of selling space. The Company's store expansion program is primarily directed toward opening stores with a design prototype of approximately 21,000 square feet of selling space.
All of the Company's stores are serviced by the Company's 352,000 square foot distribution center in Abilene, Kansas.
For fiscal 2010, 2009 and 2008, the percentage of sales by product category were as follows:
|
Percentage of Sales
|
||||||||||||
|
2010
|
2009
|
2008
|
||||||||||
|
Merchandise Category:
|
||||||||||||
|
Consumables and commodities
|
34 | % | 32 | % | 34 | % | ||||||
|
Hardlines
|
33 | % | 33 | % | 34 | % | ||||||
|
Apparel and accessories
|
17 | % | 19 | % | 19 | % | ||||||
|
Home furnishings and décor
|
16 | % | 16 | % | 13 | % | ||||||
|
Total
|
100 | % | 100 | % | 100 | % | ||||||
Business Strategy
The Company intends to focus on executing a business strategy that includes the following key components:
Markets: The Company intends to open ALCO stores primarily in towns with populations of typically less than 5,000 that are in trade areas with populations of less than 16,000 where: (1) there is no direct competition from national or regional broad line retailers; (2) economic and demographic criteria indicate the market is able to commercially support a broad line retailer; and (3) the opening of an ALCO store would significantly reduce the likelihood of the entry into such market by another broad line retailer. This key component of the Company's strategy has guided the Company in both its opening of new stores and in its closing of existing stores.
Market Selection: The Company utilizes a detailed process to analyze under-served markets which includes examining factors such as distance from competition, trade area, demographics, retail sales levels, existence and stability of major employers, location of county government, disposable income, and distance from the Company’s distribution center. Markets that are determined to be sizable enough to support an ALCO and that have no direct competition from another broad line retailer are examined closely and eventually selected or passed over by the Company's experienced management team.
Store Expansion: The Company's expansion program is designed primarily around the prototype Class 21 Store. This prototype details shelf space, merchandise presentation, store items to be offered, parking, storage requirements, as well as other store design considerations. The 21,000 square feet of selling space is large enough to permit a full line of the Company's merchandise, while minimizing capital expenditures, labor costs and general overhead costs. The Company will also consider opportunities in acceptable markets to open ALCO stores in available space in buildings already constructed.
3
Advertising and Promotion: The Company utilizes full-color photography advertising circulars of eight to 20 pages distributed through newspaper insertion or, in the case of inadequate newspaper coverage, through direct mail. During fiscal 2010, these circulars were distributed 47 times in ALCO markets. In its Duckwall markets, the Company discontinued advertising in fiscal 2008. The Company’s marketing program is designed to create awareness and recognition of its competitive pricing on a comprehensive merchandise selection for the whole family. During fiscal 2011, the Company will distribute approximately 45 circulars in ALCO markets.
Store Environment: The Company's stores are open, clean, bright and offer a pleasant atmosphere with disciplined product presentation, attractive displays and efficient check-out procedures. The Company endeavors to staff its stores with courteous, highly motivated, knowledgeable store associates in order to provide a convenient, friendly and enjoyable shopping experience.
Store Development
The Company expects to open less than 10 ALCO stores during fiscal year 2011. During fiscal 2010, the Company opened one ALCO store. No ALCO stores were closed and one Duckwall store was closed, resulting in a year end total of 258 stores. The Company's strategy regarding store development is to increase sales and profitability at existing stores by continually refining the merchandising mix and improving operating efficiencies and through new store openings in the Company's targeted base of under-served markets in the central United States. The following table summarizes the Company's store development during the past three fiscal years:
|
2010
|
2009
|
2008
|
||||||||||||||||||||||
|
ALCO
|
Duckwall
|
ALCO
|
Duckwall
|
ALCO
|
Duckwall
|
|||||||||||||||||||
|
Stores Opened
|
1 | - | 15 | - | 18 | - | ||||||||||||||||||
|
Stores Closed
|
- | 1 | 11 | 8 | 3 | 9 | ||||||||||||||||||
|
Net New Stores
|
1 | (1) | 4 | (8) | 15 | (9) | ||||||||||||||||||
As of January 31, 2010, the Company owned three ALCO locations and one Duckwall location, and leased 206 ALCO locations and 48 Duckwall locations. The Company's present intention is to lease all new stores; however, the Company may own some of the ALCO locations. The investment to open a new prototype ALCO store that is leased is approximately $1.0 million for the equipment and inventory.
Store Environment and Merchandising
The Company manages its stores to attractively and conveniently display a full line of merchandise within the confines of the stores' available square footage. Corporate merchandising direction is provided to each store to ensure a consistent company-wide store presentation. To facilitate long-term merchandising planning, the Company divides its merchandise into three core categories driven by the Company's customer profile: primary, secondary, and convenience. The primary core receives management's primary focus, with a wide assortment of merchandise being placed in the most accessible locations within the stores and receiving significant promotional consideration. The secondary core consists of categories of merchandise for which the Company maintains a strong assortment that is easily and readily identifiable by its customers. The convenience core consists of categories of merchandise for which ALCO will maintain convenient (but limited) assortments, focusing on key items that are in keeping with customers' expectations for a broad line retail store. Secondary and convenience cores include merchandise that the Company feels is important to carry, as the target customer expects to find them within a broad line retail store and they ensure a high level of customer traffic. The Company continually evaluates and ranks all product lines, shifting product classifications when necessary to reflect the changing demand for products.
Purchasing
Procurement and merchandising of products is directed by the Executive Vice President - Chief Operating Officer. The Company employs nineteen merchandise buyers. Buyers are assisted by a management information system that provides them with current price, volume information and on-hand quantities by SKU (stock keeping unit), thus allowing them to react quickly with buying and pricing adjustments dictated by customer buying patterns.
The Company purchases its merchandise from approximately 1,700 suppliers. The Company generally does not utilize long-term supply contracts. Only one supplier accounted for approximately 5% of the Company's total purchases in fiscal 2010 and competing brand name and private label products are available from other suppliers at competitive prices. The Company believes that its relationships with its suppliers are good and that the loss of any one or more of its suppliers would not have a material adverse effect on the Company.
Pricing
The Company's pricing strategy, with its promotional activities, is designed to bring consistent value to the customer. In fiscal 2011, promotions on various items will be offered approximately 45 times through advertising circulars.
4
Distribution and Transportation
The Company operates a 352,000 square foot distribution center in Abilene, Kansas, from which it services all stores. The distribution center is responsible for distributing approximately 80% of the Company's merchandise, with the balance being delivered directly to the Company's stores by its vendors. The distribution center maintains an integrated management information system, allowing the Company to utilize such cost cutting efficiencies as perpetual inventories, safety programs, and employee productivity software.
Management Information Systems
The Company has made a significant investment in the purchase and implementation of industry standard technology with the intent to lower costs, improve customer service, improve associate productivity, provide necessary controls and enhance general business planning and execution. In general, the Company's merchandising systems are designed to integrate the key retailing functions of seasonal merchandise planning, purchase order management, merchandise distribution, sales information and inventory maintenance and replenishment. All of the Company's ALCO stores have POS computer terminals that capture sales information and transmit to the Company's data processing facilities where it is used to drive management, financial, and supply chain functions.
The Company has committed significant efforts towards establishing a technical infrastructure, and a core of operational systems, that will support the Company’s future needs. The Company will continue to maintain and leverage this core of systems, plus adding industry leading business area specific solutions to meet business objectives. The Company has established an integrated infrastructure of data, processes, and technology that provides the necessary business and regulatory controls, while positioning for future growth and efficiency. The Company is aligned on the need to use technology to enhance customer service, support fact based decision making, improve associate productivity and drive business functionality and efficiency.
Financial Information About Segments
The Company derives 100% of its revenue through the sale of merchandise in the United States. See Item 8. Financial Statements & Supplemental Data, Note 13, for more information.
Store Locations
As of January 31, 2010, the Company operated 209 ALCO stores in 23 states located in smaller communities in the central United States. The ALCO stores average approximately 21,000 square feet of selling space, with an additional 5,000 square feet utilized for merchandise processing, temporary storage and administration. The Company also operates 49 Duckwall stores in 9 states. The geographic distribution of the Company's stores is as follows:
|
Duckwall Stores
|
ALCO Stores
|
|||||||||||||
|
Colorado
|
4 |
Arizona
|
8 |
Montana
|
1 | |||||||||
|
Iowa
|
3 |
Arkansas
|
4 |
Nebraska
|
16 | |||||||||
|
Kansas
|
20 |
Colorado
|
13 |
New Mexico
|
8 | |||||||||
|
Nebraska
|
6 |
Florida
|
1 |
North Dakota
|
10 | |||||||||
|
New Mexico
|
1 |
Georgia
|
3 |
Ohio
|
4 | |||||||||
|
North Dakota
|
1 |
Idaho
|
5 |
Oklahoma
|
9 | |||||||||
|
Oklahoma
|
5 |
Illinois
|
10 |
South Dakota
|
11 | |||||||||
|
South Dakota
|
1 |
Indiana
|
14 |
Texas
|
28 | |||||||||
|
Texas
|
8 |
Iowa
|
9 |
Utah
|
6 | |||||||||
|
Kansas
|
26 |
Wisconsin
|
1 | |||||||||||
|
Minnesota
|
12 |
Wyoming
|
3 | |||||||||||
|
Missouri
|
7 | |||||||||||||
Competition
While the broad line retail business in general is highly competitive, the Company's business strategy is to locate its ALCO stores in smaller markets where there is no direct competition with larger national or regional broad line retail chains, and where it is believed no such competition is likely to develop. Accordingly, the Company's primary method of competing is to offer its customers a conveniently located store with a wide range of merchandise at value prices in a primary trade area population under 16,000 that does not have a large national or regional broad line retail store. The Company believes that trade area size is a significant deterrent to larger national and regional broad line retail chains. Duckwall stores are located in very small markets, and like the ALCO stores, emphasize the convenience of location to the primary customer base.
In the broad line retail business in general, price, merchandise selection, merchandise quality, advertising and customer service are all important aspects of competing. The Company encounters direct competition with national broad line retail stores in approximately 23% of its ALCO markets, and another 6% of the ALCO stores are in direct competition with regional broad line retail stores. The competing national broad line retailers are generally larger than the Company and the stores of such competitors in the Company's markets are substantially larger, have a somewhat wider selection of merchandise and are very price competitive in some lines of merchandise. Where there are no national or regional broad line retail stores directly competing with the Company's ALCO stores, the Company's customers nevertheless shop at broad line retail stores and other retailers located in regional trade centers, and to that extent the Company competes with such broad line stores and retailers. The Company also competes for retail sales with other entities, such as specialty retailers, mass merchandisers, dollar stores and the internet. In the 114 markets in which the Company operates a Class 18 Store, approximately 18,000 square feet, only 14 markets have direct competition from a national or regional broad line retailer. The Company competes with dollar stores in approximately 85 percent of its ALCO stores and approximately 40 percent of its Duckwall stores.
5
Employees
As of January 31, 2010, the Company employed approximately 4,150 people. Of these employees, approximately 480 were employed in the store support center and distribution center in Abilene, Kansas, and 3,670 in the store locations. Additional employees are hired on a seasonal basis, most of whom are sales personnel. The Company offers a broad range of company-paid benefits to our employees, including a 401(k) plan, medical and dental plans, short-term and long-term disability insurance, paid vacation and merchandise discounts. Eligibility for and the level of these benefits varies depending on the employees' full-time or part-time status and/or length of service. There is no collective bargaining agreement for any of the Company's employees. The Company considers its relations with its employees to be excellent.
Seasonality
The Company, like that of most retailers, is subject to seasonal influences. The Company’s highest sales levels occur in the fourth quarter of its fiscal year, which includes the Christmas holiday selling season. For more information on seasonality, see “Item 7 Management’s Discussion and Analysis of Financial Condition and Results of Operation – Seasonality and Quarterly Results.”
Trademarks and Service Marks
The names “Duckwall” and “ALCO” are registered service marks of the Company. The Company considers these marks and the accompanying name recognition to be valuable to the business.
Available Information
The Company files reports with the Securities and Exchange Commission (“SEC”), including Annual Reports on Form 10-K, quarterly reports on Form 10-Q, current reports on Form 8-K and other reports as required. The public may read and copy any materials the Company files with the SEC at the SEC’s Public Reference Room at 100 F Street, NE, Washington, DC 20549. The public may obtain information on the operation of the Public Reference Room by calling the SEC at 1-800-SEC-0330. The Company is an electronic filer and the SEC maintains an Internet site at www.sec.gov that contains the reports, proxy and information statements, and other information filed electronically.
The Company’s internet website is www.ALCOstores.com. Through the “Investors” portion of this website, the Company makes available, free of charge, our proxy statements, Annual Reports on Form 10-K, and any amendments to those reports as soon as reasonably practicable after such material has been filed with, or furnished to, the Securities and Exchange Commission.
Charters of our Board of Directors’ Audit Committee and Compensation Committee; and Code of Business Conduct and Ethics for Directors and Senior Officers as well as for Associates have also been posted on our website, under the caption “Investors - Corporate Governance.”
Information contained on the Company’s website is not part of this Annual Report on Form 10-K. The materials listed above will be provided without charge to any stockholder submitting a written request to the Company’s Secretary at 401 Cottage, Abilene, Kansas 67410-2832.
ITEM 1A. RISK FACTORS
Our business is subject to a variety of risks, most of which are beyond our control.
We are highly susceptible to the state of macroeconomic conditions and consumer confidence in the United States.
All of our stores are located within the United States, making our results highly dependent on U.S. consumer confidence and the health of the U.S. economy. In addition, a significant portion of our total sales is derived from stores located in these states: Kansas, Texas and Nebraska, resulting in further dependence on local economic conditions in these states. Deterioration in macroeconomic conditions and consumer confidence could negatively affect our business in many ways, including slowing sales growth or reduction in overall sales, and reducing gross margins.
We may be forced to lower prices to effectively compete, which would adversely affect our financial results.
The Company operates in the broad line retail business, which is highly competitive. Although the Company prefers markets that don’t have direct competition from national or regional broad line retail stores, competition still exists. Even in non-competitive markets, the Company’s customers shop at broad line retail stores and other retailers located in regional trade centers. The Company also competes for retail sales with other entities, such as specialty retailers, mass merchandisers, dollar stores and the internet. This competitive environment subjects the Company to the risk of reduced profitability because the Company may be forced to lower its prices, resulting in lower margins, in order to maintain its competitive position.
If we cannot effectively open new stores, our ability to improve our financial results will be adversely affected.
The growth in the Company’s sales and operating net income depends to a substantial degree on its expansion program. This expansion strategy is dependent upon the Company’s ability to open and operate new stores effectively, efficiently and on a profitable basis. The Company prefers to locate its ALCO stores in smaller retail markets where no competing broad line retail store is located within the primary trade area. The Company’s ability to open new stores timely and to expand into additional market areas depends in part on the following factors: availability of store locations, the ability to hire and train new store personnel, the ability to react to consumer needs and trends on a timely basis, and the availability of sufficient capital for expansion.
6
If we are unable to access the capital markets or obtain bank credit, our growth plans, liquidity and results of operations could suffer.
Disruptions in the capital and credit markets, as have been experienced during fiscal 2010, could adversely affect the ability of lenders to meet their commitments. Our access to funds under the credit facility is dependent on the ability of the banks that are parties to the facility to meet their funding commitments. Those banks may not be able to meet their funding commitments to us if they experience shortages of capital and liquidity or if they experience excessive volumes of borrowing requests within a short period of time.
Constrained capital markets could threaten our liquidity and capital resources. Longer term disruptions in the capital and credit markets as a result of uncertainty, changing or increased regulation, reduced alternatives, or failures of significant financial institutions could adversely affect our access to liquidity needed for our business. Any disruption could require us to take measures to conserve cash until the markets stabilize or until alternative credit arrangements or other funding for our business needs can be arranged. Such measures could include deferring capital expenditures and reducing other discretionary uses of cash. We believe operating cash flows and current credit facilities will be adequate to fund our working capital requirements, scheduled debt repayments and to support the development of our short-term and long-term operating strategies.
If we cannot effectively implement or use information technology, our financial results and operations would be adversely affected.
If we cannot effectively implement technology upgrades, it could have a material impact on the Company’s results of operations. The Company depends on information systems to process transactions, manage inventory, purchase, sell and ship goods on a timely basis. Any material disruption or slowdown of our systems could cause information to be lost or delayed which could have a negative effect on our business.
Changes in federal, state or local laws and regulations, or our failure to comply with such laws and regulations, could increase our expenses and expose us to legal risks.
Our business is subject to a wide array of laws and regulations. Significant legislative changes that impact our relationship with our workforce (none of which is represented by unions as of the end of fiscal 2010) could increase our expenses and adversely affect our operations. Examples of possible legislative changes impacting our relationship with our workforce include changes to minimum wage requirements and health care mandates. In addition, certain aspects of our business, such as credit card operations, are more heavily regulated than other areas. Changes in the regulatory environmental regarding topics such as banking and consumer credit, privacy and information security, product safety or environmental protection, among others, could cause our expenses to increase. In addition, if we fail to comply with applicable laws and regulations, particularly wage and hour laws, we could be subject to legal risk, including governmental enforcement action and class action civil litigation, which could adversely affect our results of operations.
A failure to design, implement or maintain an adequate system of internal controls could adversely affect our ability to manage our business or detect fraud.
The Company is responsible for establishing and maintaining adequate internal control over financial reporting. Internal control over financial reporting is a process designed to provide reasonable assurance regarding the reliability of financial reporting for external purposes in accordance with U.S. generally accepted accounting principles (GAAP). Internal control over financial reporting includes: maintaining records that in reasonable detail accurately and fairly reflect our transactions; providing reasonable assurance that transactions are recorded as necessary for preparation of the financial statements; providing reasonable assurance that our receipts and expenditures of our assets are made in accordance with management authorization; and providing reasonable assurance that unauthorized acquisition, use or disposition of our assets that could have a material effect on the financial statements would be prevented or detected on a timely basis. Because of its inherent limitations, internal control over financial reporting is not intended to provide absolute assurance that a misstatement of our financial statements would be prevented or detected. Any failure to maintain an effective system of internal control over financial reporting could limit our ability to report our financial results accurately and timely or to detect and prevent fraud. The Company continues to refine and test its internal control over financial reporting processes.
Our results are subject to seasonal variations.
Quarterly results of operations have historically fluctuated as a result of retail consumers purchasing patterns, with the highest quarter in terms of sales and profitability being the fourth quarter. Quarterly results of operations will likely continue to fluctuate significantly as a result of such patterns and may fluctuate due to the timing of new store openings.
Our stock price may be volatile.
No assurance can be given that operating results will not vary from quarter to quarter, and any fluctuations in quarterly operating results may result in volatility in the Company’s stock price.
We are dependent on key personnel.
The development of the Company’s business is largely dependent on the efforts of its current management team headed by Richard E. Wilson and four other executive officers. The loss of the services of one or more of these officers could have a material adverse effect on the Company.
We are exposed to interest rate risks.
The Company is subject to market risk from exposure to changes in interest rates based on its financing requirements. Changes in interest rates could have a negative impact on the Company’s profitability.
7
If we fail to anticipate and respond quickly to changing consumer preferences, our sales, gross margin and profitability could suffer.
A substantial part of our business is dependent on our ability to make trend-right decisions in apparel, home décor, seasonal offerings and other merchandise. Failure to accurately predict constantly changing consumer tastes, preferences, spending patterns and other lifestyles decisions could lead to lost sales, increased markdowns on inventory and adversely affect our results of operations.
Interruptions in our supply chain could adversely affect our results.
We are dependent on our vendors to supply merchandise in a timely and efficient manner. If a vendor fails to deliver on its commitments, whether due to financial difficulties or other reasons, we could experience merchandise shortages that could lead to lost sales. In addition, a large portion of our merchandise is sourced, directly or indirectly, from outside the United States, with China as our single largest source. Political or financial instability, trade restrictions, tariffs, currency exchange rates, the outbreak of pandemics, labor unrest, transport capacity and costs, port security or other events that could slow port activities and impact foreign trade are beyond our control and could disrupt our supply of merchandise and adversely affect our results of operations.
Lack of availability of suitable locations in which to build new stores could slow our growth, and difficulty in executing plans for new stores, expansions and remodels could increase our costs and capital requirements.
Our future growth is dependent, in part, on our ability to build new stores and expand and remodel existing stores in a manner that achieves appropriate returns on our capital investment. We compete with other retailers and businesses for suitable locations for our stores. In addition, for many sites we are dependent on a third party developer's ability to acquire land, obtain financing and secure the necessary zoning changes and permits for a larger project, of which our store may be one component. Turmoil in the financial markets has made it difficult for third party developers to obtain financing for new projects. Local land use and other regulations applicable to the types of stores we desire to construct may affect our ability to find suitable locations and also influence the cost of constructing, expanding and remodeling our stores.
Product safety concerns could adversely affect our sales and results of operations.
If our merchandise offerings, including food, drug and children’s products, do not meet applicable safety standards or our guests’ expectations regarding safety, we could experience lost sales, experience increased costs and be exposed to legal and reputational risk. All of our vendors must comply with applicable product safety laws, and we are dependent on them to ensure that the products we buy comply with all safety standards. Events that give rise to actual, potential or perceived product safety concerns, including food or drug contamination, could expose us to governmental enforcement action or private litigation and result in costly product recalls and other liabilities. In addition, negative customer perceptions regarding the safety of the products we sell could cause our customers to seek alternative sources for their needs, resulting in lost sales. In those circumstances, it may be difficult and costly for us to regain the confidence of our customers.
If we fail to protect the security of personal information about our customer, we could be subject to costly government enforcement actions or private litigation and our reputation could suffer.
The nature of our experience involves the receipt and storage of personal information about our customers. If we experience a data security breach, we could be exposed to governmental enforcement actions and private litigation. In addition, our customers could lose confidence in our ability to protect their personal information, which could cause them to discontinue usage of our credit card products or stop shopping at our stores altogether. Such events could lead to lost future sales and adversely affect our results of operations.
|
ITEM 1B.
|
UNRESOLVED STAFF COMMENTS
|
None.
|
ITEM 2.
|
PROPERTIES
|
The Company owns facilities in Abilene, Kansas that consist of a store support center (approximately 35,000 square feet), the Distribution Center (approximately 352,000 square feet) and additional warehouse space adjacent to the store support center (approximately 95,500 square feet).
Three of the ALCO stores and one of the Duckwall stores operate in buildings owned by the Company. The remainder of the stores operate in properties leased by the Company. As of January 31, 2010, such ALCO leases account for approximately 4,300,000 square feet of lease space, which expire as follows: approximately 454,000 square feet (10.6%) expire between February 1, 2010 and January 30, 2011; approximately 387,000 square feet (9.0%) expire between January 31, 2011 and January 29, 2012; and approximately 643,000 square feet (15.0%) expire between January 30, 2012 and February 3, 2013. The remainder of the leases expire through 2031. All Duckwall store leases have terms remaining of 42 months or less. The majority of the leases that are about to expire have renewal options with lease terms that are the same as the existing lease.
|
ITEM 3.
|
LEGAL PROCEEDINGS
|
Other than routine litigation from time to time in the ordinary course of business, the Company is not a party to any material litigation.
|
ITEM 4.
|
RESERVED
|
8
PART II
|
ITEM 5.
|
MARKET FOR REGISTRANT'S COMMON EQUITY, RELATED STOCKHOLDER MATTERS AND ISSUER PURCHASES OF EQUITY SECURITIES
|
The Common Stock of the Company is quoted on the NASDAQ National Market tier of The NASDAQ Stock Market under the symbol “DUCK”. The following table sets forth the range of high and low bid information for the Company's Common Stock for each quarter of fiscal 2010 and 2009.
|
Fiscal 2010
|
High
|
Low
|
||||||
|
First quarter
|
$ | 11.34 | $ | 7.77 | ||||
|
Second quarter
|
$ | 19.14 | $ | 11.35 | ||||
|
Third quarter
|
$ | 18.21 | $ | 15.89 | ||||
|
Fourth quarter
|
$ | 17.60 | $ | 11.85 | ||||
|
Fiscal 2009
|
High
|
Low
|
||||||
|
First quarter
|
$ | 23.88 | $ | 10.55 | ||||
|
Second quarter
|
$ | 16.05 | $ | 9.04 | ||||
|
Third quarter
|
$ | 16.29 | $ | 10.51 | ||||
|
Fourth quarter
|
$ | 13.15 | $ | 7.52 | ||||
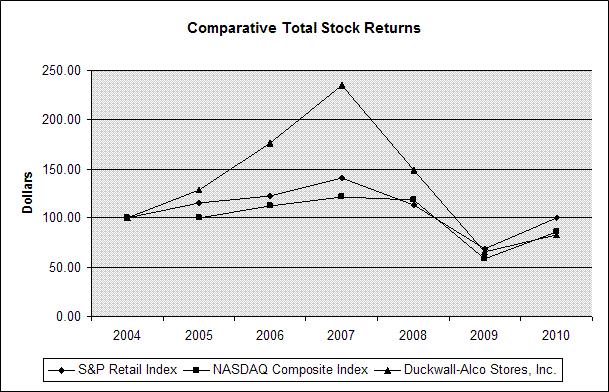
The following graph compares the cumulative total return of the Company, the NASDAQ Composite Index, and the S&P Retail Index (assuming dividends reinvested at the end of each subsequent fiscal year). The graph assumes $100 was invested on February 2, 2004 in Duckwall-ALCO Stores, Inc. Common Stock, the NASDAQ Composite Index, and the S&P Retail Index.
|
2004
|
2005
|
2006
|
2007
|
2008
|
2009
|
2010
|
||||||||||||||||||||||
|
NASDAQ Composite Index
|
100.00 | 99.91 | 112.72 | 121.28 | 118.40 | 59.00 | 85.89 | |||||||||||||||||||||
|
S&P Retail Index
|
100.00 | 115.41 | 122.43 | 140.37 | 113.09 | 69.07 | 100.06 | |||||||||||||||||||||
|
Duckwall-ALCO Stores, Inc.
|
100.00 | 128.21 | 176.07 | 234.40 | 148.61 | 65.33 | 82.98 | |||||||||||||||||||||
Based upon the data reflected in the table, at January 31, 2010, a $100 investment in the Company's Common Stock in 2004 would have a total return value of $82.98, as compared to $85.89 for the Composite NASDAQ Index and $100.06 for the S&P Retail Index.
There can be no assurances that the Company's stock performance will continue into the future with the same or similar trends depicted in the graph above. The Company does not make or endorse any predictions as to future stock performance. We did not sell any equity securities during fiscal 2010 which were not registered under the Securities Act.
As of April 15, 2010, there were approximately 1,200 holders of record of the Common Stock of the Company. The Company has not paid cash dividends on its Common Stock during the last five fiscal years. The terms of the Security Agreement, dated as of February 10, 2010, between the Company and Bank of America allow for the payment of dividends unless certain loan covenants are triggered, which did not occur in fiscal 2010 and are not expected to occur during fiscal 2011.
9
Company Repurchases of Common Stock
|
Maximum Number
|
||||||||||||||||
|
Total Number of
|
(or Approximate Dollar
|
|||||||||||||||
|
shares (or Units)
|
Value) of Shares (or
|
|||||||||||||||
|
Total Number Of
|
Purchased as Part
|
Units) that May Yet
|
||||||||||||||
|
Shares (or Units)
|
Average Price Paid
|
of Publicly Announced
|
Be Purchased Under
|
|||||||||||||
|
Period
|
Purchased
|
per Share (or Unit)
|
Plans or Programs
|
the Plans or Programs
|
||||||||||||
|
First Quarter
|
- | - | - | 174,466 | ||||||||||||
| Second Quarter | - | - | - | 174,466 | ||||||||||||
| Third Quarter | - | - | - | 174,466 | ||||||||||||
|
Fourth Quarter:
|
||||||||||||||||
|
11/02/09 - 11/29/09
|
- | - | - | 174,466 | ||||||||||||
|
11/30/09 - 01/03/10
|
- | - | - | 174,466 | ||||||||||||
|
01/04/10 - 01/31/10
|
- | - | - | 174,466 | ||||||||||||
| - | - | 174,466 | ||||||||||||||
|
As of January 31, 2010
|
25,534 | $ | 15.16 | 25,534 | 174,466 | |||||||||||
On July 1, 2008, the Company entered into a Stock Purchase Agreement with Lawrence J. Zigerelli as part his starting employment at the Company. Mr. Zigerelli purchased 10,000 shares of the Company’s common stock. The purchase price was $9.05 which was the closing price of the stock on the NASDAQ Global Market on the date of the agreement. The agreement was executed in reliance upon the exemption from securities registration afforded by Section 4(2) of the Securities Act. The proceeds of this transaction were used by the Company for general purposes.
Recent Sales of Unregistered Securities; Use of Proceeds from Registered Securities
The Company did not sell any equity securities during fiscal 2010 that were not registered under the Securities Act.
Securities Authorized For Issuance Under Equity Compensation Plans
See the information provided in the “Equity Compensation Plan Information” section of the Proxy Statement for our Annual Meeting of Stockholders on or about June 3, 2010, which information is incorporated herein by reference.
10
ITEM 6. SELECTED FINANCIAL DATA
SELECTED CONSOLIDATED FINANCIAL DATA
(dollars in thousands, except per share and store data)
|
Fiscal Year Ended
|
||||||||||||||||||||
|
52 Weeks
|
52 Weeks
|
53 Weeks
|
52 Weeks
|
52 Weeks
|
||||||||||||||||
|
January 31,
|
February 1,
|
February 3,
|
January 28,
|
January 29,
|
||||||||||||||||
|
Statement of Operations Data
|
2010
|
2009
|
2008
|
2007
|
2006
|
|||||||||||||||
|
Net sales
|
$ | 488,691 | 489,753 | 481,475 | 446,575 | 408,272 | ||||||||||||||
|
Cost of sales
|
330,179 | 335,934 | 329,195 | 304,653 | 277,060 | |||||||||||||||
|
Gross margin
|
158,512 | 153,819 | 152,280 | 141,922 | 131,212 | |||||||||||||||
|
Selling, general and administrative (1)
|
141,208 | 147,735 | 138,250 | 123,564 | 117,115 | |||||||||||||||
|
Depreciation and amortization (2)
|
9,983 | 9,302 | 9,463 | 6,512 | 5,632 | |||||||||||||||
|
Operating income (loss) from continuing operations
|
7,321 | (3,218 | ) | 4,567 | 11,846 | 8,465 | ||||||||||||||
|
Interest expense
|
2,149 | 1,867 | 3,382 | 2,729 | 1,272 | |||||||||||||||
|
Earnings (loss) from continuing operations before
|
||||||||||||||||||||
|
income taxes
|
5,172 | (5,085 | ) | 1,185 | 9,117 | 7,193 | ||||||||||||||
|
Income tax expense (benefit)
|
2,135 | (2,080 | ) | 394 | 3,213 | 2,188 | ||||||||||||||
|
Earnings (loss) from continuing operations
|
3,037 | (3,005 | ) | 790 | 5,904 | 5,005 | ||||||||||||||
|
Loss from discontinued operations, net
|
||||||||||||||||||||
|
of income tax benefit
|
(42 | ) | (1,971 | ) | (1,015 | ) | (200 | ) | (3,056 | ) | ||||||||||
|
Net earnings (loss) (1)(2)
|
$ | 2,995 | (4,976 | ) | (224 | ) | 5,704 | 1,949 | ||||||||||||
|
Per Share Information
|
||||||||||||||||||||
|
Earnings (loss) per share - basic
|
||||||||||||||||||||
|
Earnings (loss) from continuing operations
|
$ | 0.80 | (0.79 | ) | 0.21 | 1.56 | 1.23 | |||||||||||||
|
Discontinued operations
|
(0.01 | ) | (0.52 | ) | (0.27 | ) | (0.05 | ) | (0.75 | ) | ||||||||||
|
Net earnings (loss)
|
$ | 0.79 | (1.31 | ) | (0.06 | ) | 1.51 | 0.48 | ||||||||||||
|
Earnings (loss) per share - diluted
|
||||||||||||||||||||
|
Earnings (loss) from continuing operations
|
$ | 0.78 | (0.79 | ) | 0.21 | 1.54 | 1.22 | |||||||||||||
|
Discontinued operations
|
(0.01 | ) | (0.52 | ) | (0.27 | ) | (0.05 | ) | (0.74 | ) | ||||||||||
|
Net earnings (loss)
|
$ | 0.77 | (1.31 | ) | (0.06 | ) | 1.49 | 0.48 | ||||||||||||
|
Weighted average shares outstanding:
|
||||||||||||||||||||
|
Basic
|
3,797,947 | 3,809,109 | 3,807,033 | 3,792,202 | 4,083,798 | |||||||||||||||
|
Diluted
|
3,879,656 | 3,809,109 | 3,807,033 | 3,828,928 | 4,117,922 | |||||||||||||||
|
Operating Data
|
||||||||||||||||||||
|
Stores open at year-end
|
258 | 257 | 242 | 224 | 218 | |||||||||||||||
|
Stores in non-competitive markets at year-end (3)
|
199 | 199 | 185 | 170 | 168 | |||||||||||||||
|
Same-same stores at year-end (4)
|
257 | 224 | 218 | 214 | 208 | |||||||||||||||
|
Percentage of total stores in non-competitive
|
||||||||||||||||||||
|
markets (3)
|
77.1 | % | 77.4 | % | 76.4 | % | 75.9 | % | 77.1 | % | ||||||||||
|
Percentage of net sales from stores in
|
||||||||||||||||||||
|
non-competitive markets, excluding fuel (3)(5)
|
82.6 | % | 83.0 | % | 81.8 | % | 82.3 | % | 82.6 | % | ||||||||||
| Same-store sales increase (decrease) for all stores, | ||||||||||||||||||||
|
excluding fuel (4)
|
(0.7 | )% | (5.1 | )% | 1.8 | % | 4.9 | % | 3.4 | % | ||||||||||
|
Balance Sheet Data
|
||||||||||||||||||||
|
Total assets
|
$ | 194,808 | 208,775 | 185,386 | 195,420 | 178,992 | ||||||||||||||
|
Total debt (includes capital lease
|
||||||||||||||||||||
|
obligation and current maturities)
|
40,992 | 49,841 | 33,013 | 29,988 | 26,240 | |||||||||||||||
|
Stockholders' equity
|
$ | 105,733 | 102,040 | 107,172 | 106,060 | 102,147 | ||||||||||||||
11
|
(1)
|
Included in selling, general and administrative expenses is $757 of share-based compensation in fiscal 2010, $186 in fiscal 2009, $1.1 million in fiscal 2008, respectively. No expense was recorded for share-based compensation in earlier years.
|
|
(2)
|
An asset impairment charge is included in depreciation and amortization of $831 for fiscal 2010, $1.3 million for fiscal 2009, $2.1 million for fiscal 2008 and $130 for fiscal 2007, respectively. For fiscal 2009, $299 of the impairment is attributable to writing down the carrying value on property held for sale.
|
|
(3)
|
“Non-competitive” markets refer to those markets where there is not a national or regional broad line retail store located in the primary market served by the Company. The Company's stores in such non-competitive markets nevertheless face competition from various sources. See Item 1 “Business-Competition”.
|
|
(4)
|
Percentages, as adjusted to a comparable 52 week year, reflect the increase or decrease based upon a comparison of the applicable fiscal year with the immediately preceding fiscal year for stores open during the entirety of both years. For fiscal 2008, sales were reduced by the week 53 amount.
|
|
(5)
|
In fiscal 2010, the Company began including stores as same-stores in their fourteenth fiscal period of operation.
|
|
ITEM 7.
|
MANAGEMENT’S DISCUSSION AND ANALYSIS OF FINANCIAL CONDITION AND RESULTS OF OPERATION
|
Overview
Economic conditions: The current economic slowdown has caused disruptions and significant volatility in financial markets, increased rates of mortgage loan default and personal bankruptcy, and declining consumer and business confidence, which has led to decreased customer traffic and reduced levels of consumer spending, particularly on discretionary items. This decline in consumer and business confidence and the decreased levels of customer traffic and consumer spending have negatively impacted our business. We cannot predict how long the current economically challenging conditions will persist and how such conditions might affect us and our customers. Decreased customer traffic and reduced consumer spending, particularly on discretionary items, would, however, over an extended period of time negatively affect our financial condition, operating performance, revenues and income.
Operations. The Company is a regional broad line retailer operating in 23 states in the central United States.
The Company’s fiscal year ends on the Sunday closest to January 31. Fiscal years 2010 and 2009 consisted of 52 weeks and fiscal year 2008 consisted of 53 weeks, respectively. For purposes of this management's discussion and analysis of financial condition and results of operations, the financial numbers are presented in thousands.
Strategy. The Company’s overall business strategy involves identifying and opening stores in locations that will provide the Company with the highest return on investment. The Company prefers markets that do not have direct competition from national or regional broad line retail stores. The Company also competes for retail sales with other entities, such as mail order companies, specialty retailers, stores, manufacturer’s outlets and the internet.
The Company uses a variety of broad-based targeted marketing and advertising strategies to reach consumers. These strategies include full-color photography advertising circulars of eight to 20 pages distributed through newspaper insertion or, in the case of inadequate newspaper coverage, through direct mail. During fiscal 2010, these circulars were distributed 47 times in ALCO markets. For fiscal 2011, the Company currently intends to distribute these circulars a similar number of times in the ALCO markets. The Company also uses in-store marketing. The Company’s merchandising and marketing teams work together to present the products in an engaging and innovative manner, which is coordinated so that it is consistent with the current print advertisements. The Company regularly changes its banners and in-store promotions, which are advertised throughout the year, to attract consumers to visit the stores, to generate strong customer frequency and to increase average sales per customer. Net marketing and promotion costs represented approximately 1.0%, 0.8% and 0.9% of net sales in fiscal years 2010, 2009 and 2008. Management believes it has developed a comprehensive marketing strategy that will increase customer traffic and same-store sales. The Company continues to operate as a high low retailer and has included in many of its marketing vehicles cross departmental products. For example, the Company has used an Elder Care page with over-the-counter products, “as seen on TV” items, and dry meals—all targeting customers who have reached retirement age. The Company believes that by providing the breadth of these key items to this targeted audience we can serve our customers’ needs more efficiently and garner a greater share of the purchases made by this demographic. The Company’s ALCO stores offer a broad line of merchandise consisting of approximately 35,000 items, including automotive, candy, crafts, domestics, electronics, fabrics, furniture, hardware, health and beauty aids, housewares, jewelry, ladies’, men’s and children’s apparel and shoes, pre-recorded music and video, sporting goods, seasonal items, stationery and toys. The Company’s smaller Duckwall stores offer a more limited selection of similar merchandise. The Company is constantly evaluating the appropriate mix of merchandise to improve sales and gross margin performance. Corporate merchandising is provided to each store to ensure a consistent company-wide store presentation. To facilitate long-term merchandising planning, the Company divides its merchandise into three core categories: primary, secondary, and convenience. The primary core receives management’s primary focus, with a wide assortment of merchandise being placed in the most accessible locations within the stores and receiving significant promotional consideration. The secondary core consists of categories of merchandise for which the Company maintains a strong assortment that is easily and readily identifiable by its customers. The convenience core consists of categories of merchandise for which the Company maintains convenient (but limited) assortments, focusing on key items that are in keeping with customers’ expectations for a broad line retail store. Secondary and convenience cores include merchandise that the Company feels is important to carry, as the target customer expects to find them within a broad line retail store and they ensure a high level of customer traffic. The Company continually evaluates and ranks all product lines, shifting product classifications when necessary to reflect the changing demand for products. In addition, the Company’s merchandising systems are designed to integrate the key retailing functions of seasonal merchandise planning, purchase order management, merchandise distribution, sales information and inventory maintenance and replenishment. All of the Company’s ALCO stores have point-of-service computer terminals that capture sales information and transmit such information to the Company’s data processing facilities where it is used to drive management, financial, and supply chain functions.
12
Recent Events.
|
·
|
The Company completed its store transformation project during fiscal 2010. The store transformation project involved two principal components: improving work processes and shrink reduction. Improving work processes principally involved industrial engineering of work flow, stocking, cleanliness, and the efficient use of labor within our stores. Shrink reduction principally involved improving paperwork processing and vendor receipts and returns processes, cashier monitoring, manager override monitoring, reducing customer and employee theft, and enhancing physical security. During fiscal 2010, the Company achieved store level labor and benefit savings improvement of approximately $4.2 million. In addition, for fiscal 2010, the Company experienced an approximate $1.4 million decrease in gross margin due to shrink increase. Increases in shrink are contrary to the desired result of our store transformation project. In order to address the increase in shrink that we experienced, the Company has implemented a Company-wide Shrink Awareness Program to devote additional efforts to improving paperwork processing, the vendor receipts and returns processes, cashier monitoring, and manager override monitoring, reducing customer and employee theft, and enhancing physical security.
|
|
·
|
On January 29, 2010 the Company received a United States Securities and Exchange Commission Comment Letter regarding the Company's Annual Report on Form 10-K for the Year Ended February 1, 2009, Filed on April 17, 2009, File No. 0-20269, and Related Filings. The Company completed and provided its response to the Comment Letter on March 5, 2010. The Company received a follow-up Comment Letter on March 18, 2010. The Company responded to the follow-up letter on April 1, 2010. On April 13, 2010, the Company received notification from the United States Securities and Exchange Commission that they had completed their review of the Company's responses and had no further comments. |
|
·
|
On February 10, 2010, the Company closed on an Amended and Restated Credit Agreement (the "Facility") with Bank of America, N.A. and Wells Fargo Retail Finance, LLC. The $120 million Facility has a term of four years and replaces the Company's previous revolving credit facility which was in the amount of $105 million.
|
|
·
|
Richard E. Wilson joined the Company on February 15, 2010 to become the President-Chief Executive Officer
|
|
·
|
Lawrence J. Zigerelli, President – Chief Executive Officer resigned from the Company on February 19, 2010
|
|
·
|
James M. Spencer, Senior Vice President - Store Operations resigned from the Company on February 26, 2010
|
|
·
|
James Worth, Director, resigned from the Board of Directors on March 2, 2010
|
|
·
|
On March 18, 2010, the Company filed Form S-8 with the Securities and Exchange Commission registering the shares of the Company's Non-Qualified Stock Option Agreement and the Company's Incentive Stock Option Plan.
|
|
·
|
Lawrence J. Zigerelli exercised his vested options for 27,500 shares on March 19, 2010. Of which, 25,000 were vested under the Incentive Stock Option Plan and 2,500 were vested under the Non-Qualified Stock Option Agreement. |
|
·
|
James M. Spencer elected net exercise for vested options, receiving 1,405 shares on March 19, 2010 under the Incentive Stock Option Plan |
|
·
|
The Company has closed four Duckwall Stores during the first quarter of fiscal 2011. They were located in underperforming markets and were at the end of their lease term. |
Key Items in Fiscal 2010.
The Company measures itself against a number of financial metrics to assess its performance. Some of the important financial items during fiscal 2010 were:
|
·
|
Net sales decreased 0.2% to $488.7 million. Same-store sales decreased 0.7%, excluding the Company's two fuel centers, compared to the prior year.
|
|
·
|
Gross margin increased to 32.4% of sales, compared to 31.4% in the prior year. Excluding the prior year first quarter $1.3 million inventory review initiative charge, fiscal 2009 gross margin is 31.7%.
|
|
·
|
Selling, general and administrative (SG&A) expenses were 28.9% of sales, compared to 30.2% in the prior year. Excluding the prior year executive and staff severance along with the current and prior year store transformation project expenses, preopening costs and share-based compensation, fiscal 2010 and fiscal 2009 SG&A expenses, as a percent of sales, were 28.3% and 28.9%, respectively.
|
|
·
|
Net earnings per diluted share was $0.79, compared to a loss of ($1.31) per diluted share in the prior year.
|
|
·
|
Return on average equity was 2.9%, compared to (4.8%) in the prior year.
|
13
Gross margin percentage is a key measure of the Company's ability to maximize profit on the purchase and subsequent sale of merchandise, while minimizing promotional and clearance markdowns, shrinkage, damage and returns. Gross margin percentage is defined as sales less cost of sales, expressed as a percentage of sales.
Selling, general and administrative expenses are a measure of the Company’s ability to manage and control its expenses to purchase, distribute and sell merchandise.
Earnings (loss) per share ("EPS") is an indicator of the returns generated for the Company's stockholders. EPS from continuing operations was $0.78 per diluted share for fiscal 2010, compared to ($0.79) per diluted share for the prior fiscal year. Return on average equity is a measure of how much income was produced on the average equity of the Company.
Results of Operations. The following table sets forth, for the fiscal years indicated, the components of the Company's consolidated statements of operations expressed as a percentage of net sales:
|
Fiscal Year Ended
|
||||||||||||
|
52 Weeks
|
52 Weeks
|
53 Weeks
|
||||||||||
|
January 31,
|
February 1,
|
February 3,
|
||||||||||
|
2010
|
2009
|
2008
|
||||||||||
|
Net sales
|
100.0 | % | 100.0 | % | 100.0 | % | ||||||
|
Cost of sales
|
67.6 | 68.6 | 68.4 | |||||||||
|
Gross margin
|
32.4 | 31.4 | 31.6 | |||||||||
|
Selling, general and administrative
|
28.9 | 30.2 | 28.7 | |||||||||
|
Depreciation and amortization
|
2.0 | 1.9 | 2.0 | |||||||||
|
Total operating expenses
|
30.9 | 32.1 | 30.7 | |||||||||
|
Operating income (loss) from continuing operations
|
1.5 | (0.7 | ) | 0.9 | ||||||||
|
Interest expense
|
0.4 | 0.4 | 0.7 | |||||||||
|
Earnings (loss) from continuing operations before income taxes
|
1.1 | (1.1 | ) | 0.2 | ||||||||
|
Income tax expense (benefit)
|
0.4 | (0.4 | ) | 0.1 | ||||||||
|
Earnings (loss) from continuing operations
|
0.7 | (0.7 | ) | 0.1 | ||||||||
|
Loss from discontinued operations, net of income tax benefit
|
0.0 | (0.4 | ) | (0.2 | ) | |||||||
|
Net earnings (loss)
|
0.7 | % | (1.1 | ) % | (0.1 | )% | ||||||
Critical Accounting Policies
Our analysis of operations and financial condition is based on our consolidated financial statements, prepared in accordance with U.S. GAAP. Preparation of these consolidated financial statements requires us to make estimates and assumptions affecting the reported amounts of assets and liabilities at the date of the financial statements, reported amounts of revenues and expenses during the reporting period and related disclosures of contingent assets and liabilities. In the Notes to Consolidated Financial Statements, we describe our significant accounting policies used in preparing the consolidated financial statements. Our estimates are evaluated on an ongoing basis and are drawn from historical experience and other assumptions that we believe to be reasonable under the circumstances. Actual results could differ from these estimates. The following items in our consolidated financial statements require significant estimation or judgment:
Inventory: As discussed in Note 1(d) to the Consolidated Financial Statements, inventories are stated at the lower of cost or net realizable value with cost determined using the last-in, first-out “LIFO” method. Merchandise inventories in our stores are valued by the retail method. The retail method is widely used in the retail industry due to its practicality. Under the retail method, cost is determined by applying a calculated cost-to-retail ratio across groupings of similar items, known as departments. As a result, the retail method results in an averaging of inventory costs across similar items within a department. The cost-to-retail ratio is applied to ending inventory at its current owned retail valuation to determine the cost of ending inventory on a department basis. Current owned retail represents the retail price for which merchandise is offered for sale on a regular basis reduced for any permanent or clearance markdowns. Use of the retail method does not eliminate the use of management judgments and estimates, including markdowns and shrinkage, which significantly impact the ending inventory valuation at cost and the resulting gross margins. The Company continually evaluates product categories to determine if markdown action is appropriate, or if a markdown reserve should be established. As markdowns are taken as a reduction of the retail value of inventories, the Company recognizes the retail method results in valuing inventories at lower of cost or market. Management believes that the retail method provides an inventory valuation which reasonably approximates cost and results in carrying inventory at the lower of cost or market. For LIFO, the Company determines lower of cost or market by pool.
Insurance: The Company retains significant deductibles on its insurance policies for workers compensation, general liability, medical claims and prescriptions. Due to the fact that it often takes more than one year to determine the actual costs, these costs are estimated based on the Company’s historical loss experience and estimates from the insurance carriers and consultants. The Company completes an actuarial evaluation of its loss experience twice each year. In between actuarial evaluations, management monitors the cost and number of claims and compares those results to historical amounts. The Company’s actuarial method is the fully developed method. The Company records its reserves on an undiscounted basis. The Company’s prior estimates have varied from actual results due to differences related to actual claims versus estimated ultimate loss calculations. Current and future estimates could be affected by changes in those same assumptions and are reasonably likely to occur.
14
Consideration received from vendors: Cost of sales and SG&A expenses are partially offset by various forms of consideration received from our vendors. This “vendor income” is earned for a variety of vendor-sponsored programs, such as volume rebates, markdown allowances, promotions, warehouse cost reimbursement and advertising. Consideration received, to the extent that it reimburses specific, incremental and identifiable costs incurred to date, is recorded in selling, general and administrative expenses in the same period as the associated expenses are incurred. Reimbursements received that are in excess of specific, incremental and identifiable costs incurred to date are recognized as a reduction to the cost of the merchandise purchased and are reflected in costs of sales as the merchandise is sold. The Company establishes a receivable for the vendor income that is earned but not yet received. Based on provisions of the agreements in place, this receivable is computed by estimating when the Company has completed its performance and the amount has been earned. The majority of year-end receivables associated with these activities are collected within the following fiscal quarter.
Analysis of long-lived assets for impairment: The Company reviews assets for impairment at the lowest level for which there are identifiable cash flows, usually at the store level. The carrying amount of assets is compared with the expected undiscounted future cash flows to be generated by those assets over their estimated remaining economic lives. If the undiscounted cash flows are less than the carrying amount of the asset, the asset is written down to fair value. Factors that could result in an impairment review include, but are not limited to, a current period cash flow loss combined with a history of cash flow losses or a projection that demonstrates continuing losses associated with the use of a long-lived asset, or significant changes in a manner of use of the assets due to business strategies or competitive environment. Additionally, when a commitment is made to close a store in a period beyond the quarter in which the closure commitment is made, it is reviewed for impairment and depreciable lives are adjusted. The impairment evaluation is based on the estimated cash flows from continuing use until the expected disposal date plus the expected terminal value. Actual results could vary from management estimates.
Income Taxes: The Company adopted Accounting Standards Codification (ASC) Topic 740, on January 29, 2007. ASC Topic 740 prescribes a recognition threshold and a measurement standard for the financial statement recognition and measurement of tax positions taken or expected to be taken in a tax return. The recognition and measurement of tax benefits is often highly judgmental. Determinations regarding the recognition and measurement of a tax benefit can change as additional developments occur relative to the issue. Accordingly, the Company’s future results may include favorable or unfavorable adjustments to our liability for uncertain tax positions.
The Company records valuation allowances against our deferred tax assets, when necessary. Realization of deferred tax assets (such as net operating loss carryforwards) is dependent on future taxable earnings and is therefore uncertain. The Company will assess the likelihood that our deferred tax assets in each of the jurisdictions in which it operates will be recovered from future taxable income. Deferred tax assets are reduced by a valuation allowance to recognize the extent to which, more likely than not, the future tax benefits will not be realized.
Share-Based Compensation: The Company has a share-based compensation plan, which includes non-qualified stock options and nonvested share awards. See Note 1(q), Summary of Significant Accounting Policies, and Note 10, Share-based Compensation, to the Notes to Consolidated Financial Statements, included in Item 8, Financial Statements and Supplementary Data, of this Annual Report on Form 10-K, for a complete discussion of our stock-based compensation programs. We determine the fair value of our non-qualified stock option awards at the date of grant using option-pricing models. We determine the fair value of our share awards at the date of grant using generally accepted valuation techniques. Management reviews its assumptions and the valuations to determine the fair value of share-based compensation awards.
Customer Loyalty Program: The Company has a customer loyalty program which allows members to earn points for each purchase completed at any of our stores. Points earned enable members to receive a certificate that may be redeemed on future purchases at our stores. The value of points earned by our customer loyalty program members is included in accrued liabilities, based on the value of points that are projected to be redeemed, and recorded as a reduction in revenue at the time the points are redeemed.
Fiscal 2010 Compared to Fiscal 2009
Net sales for fiscal 2010 decreased $1.1 million or 0.2% to $488.7 million compared to $489.8 million for fiscal 2009. During fiscal 2010, the Company opened one ALCO store. No ALCO stores were closed and one Duckwall store was closed, resulting in a year end total of 258 stores. Net sales from same-stores decreased by $3.3 million or 0.7%, excluding the two fuel centers, in fiscal 2010 compared to fiscal 2009. Fuel sales decreased $4.7 million, in fiscal 2010 compared to fiscal 2009. Sales from non same-stores increased $7.3 million, in fiscal 2010 compared to fiscal 2009.
Gross margin for fiscal 2010 increased $4.7 million, or 3.1%, to $158.5 million compared to $153.8 million in fiscal 2009. As a percentage of net sales, gross margin increased to 32.4% in fiscal 2010 compared to 31.4% in fiscal 2009. Fiscal 2010 gross margin was positively impacted by reduced markdowns of $3.4 million, increased non same-store margin of $2.4 million and reduced freight expense of $1.7 million offset by increased shrink of $1.4 million and reduced new store allowances of $1.1 million. The decline in markdowns was the result of an inventory position more representative of customer demands in fiscal 2010 when compared to fiscal 2009. Reduced miles driven and a lower per mile freight rate allowed for less freight expense in fiscal 2010 when compared to fiscal 2009. The increase in shrink is contrary to the desired result of our store transformation project. In order to address the increase in shrink that we experienced, the Company has implemented a Company-wide Shrink Awareness Program to devote additional efforts to improving paperwork processing, the vendor receipts and returns processes, cashier monitoring, and manager override monitoring, reducing customer and employee theft, and enhancing physical security. The decline in new store allowances was due to reduced store opens in fiscal 2010 compared to fiscal 2009. Fiscal 2009 cost of sales included a $1.3 million inventory review initiative charge. Excluding this charge from fiscal 2009, gross margin is 31.7%.
Selling, general and administrative expenses decreased $6.5 million or 4.4% to $141.2 million in fiscal 2010 compared to $147.7 million in fiscal 2009. As a percentage of net sales, selling, general and administrative expenses were 28.9% in fiscal 2010 and 30.2% in fiscal 2009. The decrease in SG&A expenses is attributable to reduced severance charges of $1.9 million, preopening store costs of $1.7 million, point-of-sale hardware lease expense of $1.7 million and store level labor and benefits of $1.7 million offset by increased real property rent expense of $1.2 million and advertising costs of $797. Excluding share-based compensation, preopening store costs, store transformation project costs and executive and staff severance (Adjusted SG&A expenses) were 28.3% and 28.9%, as percentage of net sales, fiscal 2010 and 2009, respectively.
15
Depreciation and amortization expense increased $681 or 7.3% to $10.0 million in fiscal 2010 compared to $9.3 million in fiscal 2009. The increase is attributable to depreciation from stores opened in fiscal 2010 and 2009.
Operating income (loss) from continuing operations increased $10.5 million, or 327.5%, to $7.3 million in fiscal 2010 compared to ($3.2) million in fiscal 2009. Operating income (loss) from continuing operations as a percentage of net sales was 1.5% in fiscal 2010 compared to (0.7)% in fiscal 2009. Operating income (loss) from continuing operations was positively impacted by reduced markdowns of $3.4 million, increased non same-store margin of $2.4 million, reduced freight expense of $1.7 million, reduced severance charges of $1.9 million, preopening store costs of $1.7 million, point-of-sale hardware lease expense of $1.7 million and store level labor and benefits of $1.7 million offset by increased shrink of $1.4 million, increased real property rent expense of $1.2 million, reduced new store allowances of $1.1 million and advertising costs of $797.
Interest expense increased $282 or 15.1% to $2.1 million in fiscal 2010 compared to $1.9 million in fiscal 2009. The increase in interest expense was due to increased average borrowings to fund capital expenditures or other programs.
Income tax expense (benefit) on continuing operations was $2.1 million in fiscal 2010 compared to ($2.1) million in fiscal 2009. The Company's effective tax rate was 41.3% in fiscal 2010 and 40.9% in fiscal 2009. The effective tax rate is higher in fiscal 2010 due to the impact of permanent book and tax differences offset by a slight decrease in the Company's state effective tax rates.
Loss from discontinued operations, net of income tax benefit was $42 in fiscal 2010, compared to $2.0 million in fiscal 2009. One Duckwall store was closed during fiscal 2010. Three Duckwall stores and 14 ALCO stores were closed during fiscal 2009. The three Duckwall stores that were closed in fiscal 2009 were replaced by an ALCO store and are therefore shown in continuing operations. Results of all other closed stores are included in discontinued operations.
Fiscal 2009 Compared to Fiscal 2008
Net sales for fiscal 2009 increased $8.3 million or 1.7% to $489.8 million compared to $481.5 million for fiscal 2008. During fiscal 2009, the Company opened fifteen ALCO stores, of which four were in markets previously occupied by a Duckwall store. Eleven ALCO stores were closed and four Duckwall stores were closed, resulting in a year end total of 258 stores. Net sales for all stores open the full year in both fiscal 2009 and 2008 (same-stores), decreased by $22.6 million or 5.1%, excluding the two fuel centers, in fiscal 2009 compared to fiscal 2008, as adjusted for 52 week comparability. Fuel sales decreased $1.2 million, in fiscal 2009 compared to fiscal 2008. Sales from non same-stores increased $43.3 million, in fiscal 2009 compared to fiscal 2008.
Gross margin for fiscal 2009 increased $1.5 million, or 1.0%, to $153.8 million compared to $152.3 million in fiscal 2008. As a percentage of net sales, gross margin decreased to 31.4% in fiscal 2009 compared to 31.6% in fiscal 2008. Fiscal 2009 gross margin was positively impacted primarily by continued shrink improvement of $2.7 million and vendor considerations of $1.1 million, offset by inventory review initiative expenses of $1.3 million. The shrink improvement was a result of the store transformation project and a Company-wide increased Shrink Awareness Program. Improved vendor considerations were driven by increased purchases and new vendors participating in the vendor consideration program. Inventory review initiative expenses resulted from a review by the Company of its ownership in items that it has either discontinued, clearanced or are inactive. The Company has determined to implement a sell through plan to liquidate this merchandise and to develop a process to minimize the accumulation of this inventory going forward. Excluding the first quarter $1.3 million inventory review initiative charge, fiscal 2009 gross margin is 31.7%.
Selling, general and administrative expenses increased $9.5 million or 6.9% to $147.7 million in fiscal 2009 compared to $138.2 million in fiscal 2008. As a percentage of net sales, selling, general and administrative expenses were 30.2% in fiscal 2009 and 28.7% in fiscal 2008. This increase is primarily attributable to operating 33 new stores, along with $2.2 million in fees to Accenture associated with the store transformation project and executive and staff severance of $1.9 million. This increase of new stores contributed to increased employee labor and benefits of $5.6 million and real property rent of $4.7 million. In addition to the store transformation project fees of $2.2 million, also impacting SG&A expenses were executive and staff severance of $1.9 million and reduced co-op advertising offset of $603. These expense increases were somewhat mitigated by reduced share-based compensation of $944, floor care services of $520 and advertising expense of $631. Excluding share-based compensation, preopening store costs, store transformation project fees and executive and staff severance (Adjusted SG&A expenses) were 28.9% and 27.9% of sales respectively for the fiscal 2009 and fiscal 2008.
Depreciation and amortization expense decreased $161 or 1.7% to $9.3 million in fiscal 2009 compared to $9.5 million in fiscal 2008. The decrease is attributable to reduced asset impairment for fiscal 2009 compared to fiscal 2008 offset by increased depreciation from stores opened in fiscal 2009 and 2008.
Operating income (loss) from continuing operations decreased $7.8 million, or 170.5%, to ($3.2) million in fiscal 2009 compared to $4.6 million in fiscal 2008. Operating income (loss) from continuing operations as a percentage of net sales was (0.7%) in fiscal 2009 compared to 1.0% in fiscal 2008. Operating income (loss) from continuing operations was negatively impacted by store transformation project fees of $2.2 million, executive and staff severance of $1.9 million, inventory review initiative expenses of $1.3 million and reduced co-op advertising offset of $603. Operating income (loss) from continuing operations was positively impacted by continued shrink improvement of $2.7 million, increased vendor considerations of $1.1 million, reduced share-based compensation of $944, floor care services of $520 and advertising expense of $631.
Interest expense decreased $1.5 million or 44.8%, to $1.9 million in fiscal 2009 compared to $3.4 million in fiscal 2008. The decrease in interest expense was due to the reversal of accrued interest of $587 related to the uncertain tax positions liability of the Company and lower interest rates.
Income tax expense (benefit) on continuing operations were ($2.1) million in fiscal 2009 compared to $394 in fiscal 2008. The Company's effective tax rate was 40.9% in fiscal 2009 and 33.3% in fiscal 2008. The effective tax rate is higher in fiscal 2009 due to the impact of permanent book and tax differences which have remained relatively constant over the reporting periods as compared to a decrease in book income.
Loss from discontinued operations, net of income tax benefit was $2.0 million in fiscal 2009, compared to $1.0 million in fiscal 2008. Three Duckwall stores that were closed during fiscal 2009 were replaced by an ALCO store and are therefore shown in continuing operations. In addition, 14 ALCO stores were closed in fiscal 2009.
16
SG&A Detail; Certain Financial Matters
The Company has included Adjusted Gross Margin, Adjusted SG&A and Adjusted EBITDA, non-GAAP performance measures, as part of its disclosure as a means to enhance its communications with stockholders. Certain stockholders have specifically requested this information to assist them in comparing the Company to other retailers that disclose similar non-GAAP performance measures. Further, management utilizes these measures in internal evaluation, review of performance and to compare the Company’s financial measures to those of its peers. Adjusted EBITDA differs from the most comparable GAAP financial measure (earnings (loss) from continuing operations) in that it does not include certain items, as does Adjusted Gross Margin and Adjusted SG&A. These items are excluded by management to better evaluate normalized operational cash flow and expenses excluding unusual, inconsistent and non-cash charges. To compensate for the limitations of evaluating the Company's performance using Adjusted Gross Margin, Adjusted SG&A and Adjusted EBITDA, management also utilizes GAAP performance measures such as gross margin, return on investment, return on equity and cash flow from operations. As a result, Adjusted Gross Margin, Adjusted SG&A and Adjusted EBITDA may not reflect important aspects of the results of the Company’s operations.
|
For the Years Ended
|
||||||||
|
52 Weeks
|
52 Weeks
|
|||||||
|
SG&A Expenses Breakout
|
January 31, 2010
|
February 1, 2009
|
||||||
|
Store support center (1)
|
$ | 23,221 | 26,427 | |||||
|
Distribution center
|
8,728 | 9,470 | ||||||
|
401K expense
|
381 | 462 | ||||||
|
Same-store SG&A
|
104,482 | 108,324 | ||||||
|
Non same-store SG&A (2)
|
3,639 | 2,866 | ||||||
|
Share-based compensation
|
757 | 186 | ||||||
|
SG&A as reported
|
141,208 | 147,735 | ||||||
|
Less:
|
||||||||
|
Share-based compensation
|
(757 | ) | (186 | ) | ||||
|
Preopening store costs (2)
|
(128 | ) | (1,846 | ) | ||||
|
Executive and staff severance (1)
|
- | (1,942 | ) | |||||
|
Store transformation project costs (1)
|
(2,096 | ) | (2,220 | ) | ||||
|
Adjusted SG&A
|
$ | 138,227 | 141,541 | |||||
|
Adjusted SG&A as % of sales
|
28.3 | % | 28.9 | % | ||||
|
Sales per average selling square foot (3)
|
$ | 107.77 | 112.03 | |||||
|
Adjusted Gross Margin dollars per average selling square feet (3)(4)
|
$ | 34.95 | 35.49 | |||||
|
Adjusted SG&A per average selling square foot (3)
|
$ | 30.48 | 32.37 | |||||
|
Adjusted EBITDA per average selling square foot (3)(5)
|
$ | 4.47 | 3.12 | |||||
|
Average inventory per average selling square feet (3)(6)(7)
|
$ | 27.02 | 26.75 | |||||
|
Average selling square feet (3)
|
4,535 | 4,372 | ||||||
|
Total stores operating beginning of period
|
258 | 262 | ||||||
|
Total stores operating end of period
|
258 | 258 | ||||||
|
Total stores less than twelve months old
|
1 | 15 | ||||||
|
Total non same-stores
|
1 | 33 | ||||||
|
Supplemental Data:
|
||||||||
|
Same-store adjusted gross margin dollar change
|
(0.4 | )% | (8.4 | )% | ||||
|
Same-store SG&A dollar change
|
(3.6 | )% | (6.1 | )% | ||||
|
Same-store total customer count change
|
(0.1 | )% | (10.4 | )% | ||||
|
Same-store average sale per ticket change
|
(0.6 | )% | 4.0 | % | ||||
|
(1) Store support center includes executive and staff severance for first quarter of fiscal 2009 and store transformation project costs for first and second quarters of fiscal 2010 and the third and fourth quarter of fiscal 2009
|
||||||||
|
(2) Non same-stores are those stores opened in Fiscal 2009 which have not reached their fourteenth period of operation
|
||||||||
|
(3) Average selling square feet is calculated as beginning square feet plus ending square feet divided by 2
|
||||||||
|
(4) Adjusted Gross Margin includes $1.3 million inventory review initiative charge added back in first quarter fiscal 2009
|
||||||||
|
(5) Adjusted EBITDA per average selling square foot is calculated as Adjusted EBITDA divided by average selling square feet
|
||||||||
|
(6) Average store level merchandise inventory for fiscal 2010 and 2009 is calculated as beginning inventory plus ending inventory divided by 2
|
||||||||
|
(7) Excludes inventory for unopened stores
|
||||||||
17
Fiscal 2010 Compared to Fiscal 2009
Store support center expenses for fiscal 2010 decreased $3.2 million, or 12.1%. The decrease was primarily due to executive and staff severance of $1.9 million, $454 in health insurance benefits and $432 in accounting fees.
Same-store SG&A expenses decreased $3.8 million, or (3.6%). The decrease is primarily due to reduced labor expenses of $2.6 million, point-of-sale hardware lease expense of $1.7 million and benefits of $711 offset by increased advertising costs of $1.5 million.
Non same-store SG&A expenses increased $773. The Company opened one store in 2010 and 15 stores in 2009.
Reconciliation and Explanation of Non-GAAP Financial Measures
The following table shows the reconciliation of Adjusted EBITDA to net earnings (loss) from continuing operations:
|
For the Thirty-Nine
|
Trailing Twelve
|
For the Thirteen
|
||||||||||||||||||||||||||
|
52 Weeks
|
Week Periods Ended
|
Periods Ended
|
Week Periods Ended
|
52 Weeks
|
||||||||||||||||||||||||
|
Fiscal 2009
|
November 1, 2009
|
November 2, 2008
|
November 1, 2009
|
January 31, 2010
|
February 1, 2009
|
Fiscal 2010
|
||||||||||||||||||||||
|
Net earnings (loss) from continuing operations (1)
|
$ | (3,005 | ) | 1,549 | (2,368 | ) | 912 | 1,487 | (638 | ) | 3,037 | |||||||||||||||||
|
Plus:
|
||||||||||||||||||||||||||||
|
Interest
|
1,867 | 1,590 | 1,219 | 2,238 | 559 | 648 | 2,149 | |||||||||||||||||||||
|
Taxes (1)
|
(2,080 | ) | 1,310 | (2,397 | ) | 1,627 | 825 | 317 | 2,135 | |||||||||||||||||||
|
Depreciation and amortization (1)
|
9,302 | 6,973 | 5,794 | 10,481 | 3,011 | 3,509 | 9,983 | |||||||||||||||||||||
|
Share-based compensation
|
186 | 601 | 34 | 753 | 156 | 152 | 757 | |||||||||||||||||||||
|
Preopening store costs (2)
|
1,845 | 2 | 1,837 | 10 | 127 | 9 | 128 | |||||||||||||||||||||
|
Inventory review initiative
|
1,345 | - | 1,345 | - | - | - | - | |||||||||||||||||||||
|
Executive and staff severance
|
1,942 | - | 1,942 | - | - | - | - | |||||||||||||||||||||
|
Store transformation project costs
|
2,220 | 2,096 | 937 | 3,379 | - | 1,283 | 2,096 | |||||||||||||||||||||
|
=Adjusted EBITDA (1)(3)(4)(5)
|
13,622 | 14,121 | 8,343 | 19,400 | 6,165 | 5,280 | 20,285 | |||||||||||||||||||||
|
Cash
|
4,744 | 5,703 | 5,320 | 5,703 | 5,164 | 4,744 | 5,164 | |||||||||||||||||||||
|
Debt
|
49,841 | 54,180 | 58,303 | 54,180 | 40,992 | 49,841 | 40,992 | |||||||||||||||||||||
|
Debt, net of cash
|
$ | 45,097 | 48,477 | 52,983 | 48,477 | 35,828 | 45,097 | 35,828 | ||||||||||||||||||||
|
(1) These amounts will not agree with the fiscal 2009 first quarter 10-Q filing due to the one store the Company closed in the third quarter of fiscal 2009. These amounts will not agree with the fiscal year end 2009 or fiscal 2010 first quarter 10-Q filing due to the one store the Company closed in the second quarter of fiscal 2010. These stores are now shown in discontinued operations.
|
||||||||||||||||||||||||||||
|
(2) These costs are not consistent quarter to quarter as the Company does not open the same number of stores in each quarter of each fiscal year. These costs are directly associated with the number of stores that have been or will be opened and are incurred prior to the grand opening of each store.
|
||||||||||||||||||||||||||||
|
(3) For the trailing twelve periods ended January 31, 2010 the average open weeks for the Company's one non same-store is 3 weeks.
|
||||||||||||||||||||||||||||
|
(4) During fiscal year 2009, the Company made a change in its Executive Management team and Board of Directors resulting in several initiatives to reduce certain SG&A expenses. For the trailing twelve periods ended January 31, 2010, these initiatives resulted in approximately $4.3 million reduced SG&A expenses when compared to the same prior year trailing twelve periods. The initiatives include, but are not limited to, executive and staff reduction, reduced ALCO same-store hourly wages, advertising expenses, net of coop offset and floor care services along with reduced total Company insurance and travel expenses.
|
||||||||||||||||||||||||||||
|
(5) In addition to continued efforts regarding the fiscal 2009 cost reduction initiatives, the Company has also implemented new initiatives for fiscal year 2010. The fiscal 2010 initiatives include, but are not limited to, reduced point-of-sale hardware lease expense, energy expense and accident reduction programs. These initiatives achieved approximately $2.6 million in SG&A savings in fiscal 2010 when compared to the prior year same period.
|
||||||||||||||||||||||||||||
18
Seasonality and Quarterly Results
The following table sets forth the Company's net sales, gross margin, income from operations and net earnings during each quarter of fiscal 2010, 2009 and 2008.
|
First
|
Second
|
Third
|
Fourth
|
||||||||||||||
|
Quarter
|
Quarter
|
Quarter
|
Quarter(1)
|
||||||||||||||
|
Fiscal 2010
|
Net sales
|
$ | 115.4 | 125.3 | 111.5 | 136.5 | |||||||||||
|
Gross margin
|
38.5 | 42.4 | 35.7 | 41.9 | |||||||||||||
|
Earnings (loss) from continuing operations
|
(0.0 | ) | 3.0 | (1.4 | ) | 1.5 | |||||||||||
|
Net earnings (loss)
|
(0.1 | ) | 3.0 | (1.4 | ) | 1.5 | |||||||||||
|
Fiscal 2009
|
Net sales
|
$ | 105.6 | 129.2 | 114.9 | 140.1 | |||||||||||
|
Gross margin
|
31.7 | 43.3 | 37.1 | 41.7 | |||||||||||||
|
Earnings (loss) from continuing operations
|
(4.3 | ) | 3.5 | (1.5 | ) | (0.6 | ) | ||||||||||
|
Net earnings (loss)
|
(5.9 | ) | 3.3 | (1.7 | ) | (0.7 | ) | ||||||||||
|
Fiscal 2008
|
Net sales
|
$ | 105.9 | $ | 118.6 | $ | 109.9 | $ | 147.1 | ||||||||
|
Gross margin
|
32.7 | 39.4 | 35.7 | 44.5 | |||||||||||||
|
Earnings (loss) from continuing operations
|
(1.8 | ) | 3.0 | (1.4 | ) | 1.0 | |||||||||||
|
Net earnings (loss)
|
(2.2 | ) | 2.6 | (1.6 | ) | 1.0 | |||||||||||
|
(1)
|
Asset impairment charges of $831, $1.3 million and $2.1 million negatively impacted net earnings for fiscal 2010, 2009 and 2008, respectively.
|
See Note 11 of Notes to Consolidated Financial Statements for quarterly earnings per share information.
The Company’s business is subject to seasonal fluctuations. The Company’s highest sales levels occur in the fourth quarter of its fiscal year which includes the Christmas holiday selling season. The Company's results of operations in any one quarter are not necessarily indicative of the results of operations that can be expected for any other quarter or for the full fiscal year. The Company's results of operations may also fluctuate from quarter to quarter as a result of the amount and timing of sales contributed by new stores and the integration of the new stores into the operations of the Company, as well as other factors. The addition of a large number of new stores can, therefore, significantly affect the quarterly results of operations.
Inflation
Management does not believe that its merchandising operations have been materially affected by inflation over the past few years. The Company will continue to monitor costs, take advantage of vendor incentive programs, selectively buy from competitive vendors and adjust merchandise prices based on market conditions.
Liquidity and Capital Resources
At the end of fiscal 2010, working capital (defined as current assets less current liabilities) was $118.0 million compared to $119.5 million at the end of fiscal 2009 and $107.7 million at the end of fiscal 2008.
The Company's primary sources of funds are cash flow from operations, borrowings under its revolving loan credit facility, vendor trade credit financing, term loan and lease financing.
Cash provided by (used in) operating activities aggregated $16.2 million, ($3.2) million and $11.1 million, in fiscal 2010, 2009 and 2008, respectively. The increase in cash provided in fiscal 2010 relative to fiscal 2009 resulted primarily from better inventory management, income tax refunds and increased profitability of the Company. The decrease in cash provided in fiscal 2009 relative to fiscal 2008 resulted primarily from an increase in merchandise inventory, net of accounts payable.
The Company uses its revolving loan credit facility and vendor trade credit financing to fund the buildup of inventories periodically during the year for its peak selling seasons and to meet other short-term cash requirements. The revolving loan credit facility provides up to $105 million of financing in the form of notes payable and letters of credit. The loan agreement expires in January 2011. The revolving loan note payable and letter of credit balance at January 31, 2010 was $43.3 million, resulting in an available line of credit at that date of approximately $56.4 million, subject to a borrowing base calculation. Loan advances are secured by a security interest in the Company’s inventory and credit card receivables. The loan agreement contains various restrictions that are applicable when outstanding borrowings exceed $77.5 million, including limitations on additional indebtedness, prepayments, acquisition of assets, granting of liens, certain investments and payments of dividends. The Company's loan agreement contains various covenants including limitations on additional indebtedness and certain financial tests, as well as various subjective acceleration clauses. The balance sheet classification of the borrowings under the revolving loan credit facility has been determined in accordance with ASC Topic 470-10-45. As of January 31, 2010, the Company was in compliance with all covenants and subjective acceleration clauses of the debt agreements. Accordingly, this obligation has been classified as a long-term liability in the accompanying consolidated balance sheet. Short-term trade credit represents a significant source of financing for inventory to the Company. Trade credit arises from the willingness of the Company's vendors to grant payment terms for inventory purchases.
On February 10, 2010, the Company closed on an Amended and Restated Credit Agreement (the "Facility") with Bank of America, N.A. and Wells Fargo Retail Finance, LLC. The $120 million Facility has a term of four years and replaces the Company's previous revolving credit facility.
19
In fiscal 2010, the Company had net cash pay downs of $5.6 million on its revolving credit facility and made cash payments of $3.2 million to reduce its long-term debt and capital lease obligations. During fiscal 2009, the Company exercised an early buyout of an operating lease for store level point-of-sale equipment of $5.1 million. This buyout was financed through the revolving credit facility. In fiscal 2009, the Company had net cash borrowing on its revolving credit facility of $20.0 million and made cash payments of $3.2 million to reduce its long-term debt and capital lease obligations. The Company received $90 in proceeds from the exercise of outstanding stock options. In fiscal 2008, the Company entered into a term loan for $5.5 million representing the equipment costs associated with the fiscal 2008 opened stores. These proceeds were used to pay down the revolving credit facility. In fiscal 2008, the Company had net cash pay downs on its revolving credit facility of $362 and made cash payments of $2.1 million to reduce its capital lease obligations.
The Company’s long-range plan assumes growth in the number of stores and, in accordance with this plan, for fiscal 2010, one new ALCO store was opened. In fiscal 2009, 15 new ALCO stores, of which four were in markets previously occupied by a Duckwall store, were opened.
Cash used in investing activities in fiscal 2010, 2009 and 2008 totaled ($7.0) million, ($14.2) million and ($11.7) million, respectively, and consisted primarily of capital expenditures.
On March 23, 2006, the Board of Directors approved a new plan authorizing the repurchase of 200,000 shares of the Company’s common stock, of which 25,534 shares have been repurchased at an average cost of $15.16. As of January 31, 2010, 174,466 shares remain available to be repurchased.
The following table summarizes the Company’s significant contractual obligations payable as of January 31, 2010 (in thousands):
|
Payments due by Period (1)
|
||||||||||||||||||||
|
Less than
|
2 - 3 | 4 - 5 |
After
|
|||||||||||||||||
|
Contractual Obligations
|
Total
|
1 year (2)
|
years
|
years
|
5 years
|
|||||||||||||||
|
Revolving loan credit facility
|
$ | 35,159 | - | - | 35,159 | - | ||||||||||||||
|
FF&E term loan
|
2,865 | 1,451 | 1,414 | - | - | |||||||||||||||
|
Capital lease obligations
|
3,413 | 2,638 | 775 | - | - | |||||||||||||||
|
Operating leases
|
164,650 | 19,676 | 34,660 | 26,783 | 83,531 | |||||||||||||||
|
Transportation contract
|
255 | 255 | - | - | - | |||||||||||||||
|
Contingent rentals
|
9,898 | 1,192 | 2,430 | 2,510 | 3,766 | |||||||||||||||
|
Total contractual cash obligations
|
$ | 216,240 | 25,212 | 39,279 | 64,452 | 87,297 | ||||||||||||||
|
(1)
|
The principal amount of the Company’s Revolving Loan Credit Facility is shown in its contractual obligations table as the amount being paid during the year that the February 10, 2010 amended credit facility expires. Interest related to the Revolving Loan Credit Facility is dependent on the level of borrowing and variable interest rates as more fully described in Note 3 to the consolidated financial statements and is not shown in this table.
|
|
(2)
|
Total liabilities for uncertain tax positions were $54, as of January 31, 2010 and February 1, 2009, are classified on the Company's consolidated balance sheet within "Other current liabilities" and are not included in the table.
|
Expansion Plans
The continued growth of the Company is dependent, in large part, upon the Company’s ability to open and operate new stores on a timely and profitable basis. The Company currently intends to open fewer than 10 ALCO stores in fiscal 2011. While the Company believes that adequate sites are currently available, the rate of new store openings is subject to various contingencies, many of which are beyond the Company’s control. These material contingencies include:
|
·
|
the Company’s ability to hire, train, and retain qualified personnel
|
|
·
|
the availability of adequate capital resources for us to purchase inventory, equipment, and fixtures and make other capital expenditures necessary for store expansion
|
|
·
|
the ability of our landlords and developers to find appropriate financing in the current credit market to develop property to be leased by the Company
|
Historically, we have been able to hire, train, and retain qualified personnel and we anticipate being able to do so in the future. In order to address this contingency, the Company has initiated an Assistant Manager Training Program whereby the Company provides general management training to manager candidates at monthly seminars held at the Company’s corporate offices. We anticipate that this program will increase our ability to train and retain qualified personnel. We currently believe that we will have the capital resources necessary to purchase the inventory, equipment, and fixtures, and to fund the other capital expenditures necessary for the store expansions. If we lack such capital resources, however, it would limit our expansion plans and negatively impact our operations going forward. The Company has been working closely with multiple developers and landlords that the Company believes have the financial resources to develop property to be leased by the Company and hold such property as a long-term investment in their portfolios. If such developers and landlords do not have, and cannot obtain, the financial resources to develop and hold such property, it would limit our expansion plans and negatively impact our operations going forward.
Off-Balance Sheet Arrangements
The Company has not provided any financial guarantees as of year-end fiscal 2010.
The Company has not created and is not party to, any special-purpose or off-balance sheet entities for the purpose of raising capital, incurring debt or operating the business. The Company does not have any arrangements or relationships with entities that are not consolidated into the financial statements that are reasonably likely to materially affect the Company’s liquidity or the availability of capital resources.
20
New Accounting Standards
Fiscal 2009 Adoptions
In April 2009, the Financial Accounting Standards Board ("FASB") modified ASC Topic 825, Financial Instruments, and FASB ASC 270, Interim Reporting, to extend the disclosure requirements related to the fair value of financial instruments to interim financial statements of publicly traded companies. The Company adopted this guidance in the second quarter of fiscal 2010, the impact of which related only to disclosures and did not have a material effect on the Company’s financial condition, results of operations or cash flows.
In May 2009, the FASB modified FASB ASC Topic 855, Subsequent Events, which establishes general standards of accounting for and disclosure of events that occur after the balance sheet date but before financial statements are issued and requires entities to disclose the date through which they have evaluated subsequent events. The Company adopted this guidance effective August 2, 2009. The adoption of this guidance changed certain financial statement disclosures but did not have an impact on the Company’s financial condition, results of operations or cash flows.
In June 2009, the FASB issued Accounting Standards Updated (ASU) No. 2009-01 Topic 105, Generally Accepted Accounting Principles which establishes the FASB ASC. The FASB ASC is the single source of authoritative nongovernmental U.S. GAAP, superseding existing FASB, American Institute of Certified Public Accountants, Emerging Issues Task Force, and related accounting literature. The FASB ASC reorganizes the thousands of GAAP pronouncements into roughly 90 accounting topics and displays them using a consistent structure. Also included is relevant Securities and Exchange Commission guidance organized using the same topical structure in separate sections. The Company adopted this guidance effective August 2, 2009. The adoption of this guidance did not have an impact on the Company’s financial condition, results of operations or cash flows.
In August 2009, the FASB issued ASU No. 2009-05 which amends ASC Topic 820, Fair Value Measurements and Disclosures (“Topic 820”), to provide guidance on the fair value measurement of liabilities. This update requires clarification for circumstances in which a quoted price in an active market for the identical liability is not available. A reporting entity is required to measure fair value using one or more of the following techniques: 1) a valuation technique that uses either the quoted price of the identical liability when traded as an asset or quoted prices for similar liabilities or similar liabilities when traded as an asset; or 2) another valuation technique that is consistent with the principles in Topic 820 such as the income and market approach to valuation. The amendments in this update also clarify that when estimating the fair value of a liability, a reporting entity is not required to include a separate input or adjustment to other inputs relating to the existence of a restriction that prevents the transfer of the liability. This update further clarifies that if the fair value of a liability is determined by reference to a quoted price in an active market for an identical liability, that price would be considered a Level 1 measurement in the fair value hierarchy. Similarly, if the identical liability has a quoted price when traded as an asset in an active market, it is also a Level 1 fair value measurement if no adjustments to the quoted price of the asset are required. The adoption of this guidance did not have an impact on the Company’s financial condition, results of operations or cash flows.
Fiscal 2010 and Future Adoptions
In June 2009, the FASB issued ASU 2009-16, which updated ASC Topic 810: Accounting for Transfers of Financial Assets, which amends the derecognition guidance in former FASB Statement No. 140 and eliminates the exemption from consolidation for qualifying special-purpose entities. This guidance will be effective for the beginning in fiscal 2011 and adoption is not anticipated to affect our consolidated net earnings, cash flows or financial position.
In June 2009, the FASB issued ASC topic 810-10, which amends the consolidation guidance applicable to variable interest entities. The amendments will significantly affect the overall consolidation analysis under former guidance. This guidance will be effective beginning in fiscal 2011 and adoption is not anticipated to affect our consolidated net earnings, cash flows or financial position.
CAUTIONARY STATEMENT CONCERNING FORWARD-LOOKING STATEMENTS AND FACTORS THAT MAY AFFECT FUTURE RESULTS OF OPERATIONS, FINANCIAL CONDITION OR BUSINESS
Certain statements contained in this Annual Report on Form 10-K that are not statements of historical fact may constitute "forward-looking statements" within the meaning of Section 21E of the Exchange Act. These statements are subject to risks and uncertainties, as described below. Examples of forward-looking statements include, but are not limited to: (i) projections of revenues, income or loss, earnings or loss per share, capital expenditures, store openings, store closings, payment or non-payment of dividends, capital structure and other financial items, (ii) statements of plans and objectives of the Company’s management or Board of Directors, including plans or objectives relating to inventory, store development, marketing, competition, business strategy, store environment, merchandising, purchasing, pricing, distribution, transportation, store locations and information systems, (iii) statements of future economic performance, and (iv) statements of assumptions underlying the statements described in (i), (ii) and (iii). Forward-looking statements can often be identified by the use of forward-looking terminology, such as “believes,” “expects,” “may,” “will,” “should,” “could,” “intends,” “plans,” “estimates”, “projects” or “anticipates,” variations thereof or similar expressions.
Forward-looking statements are not guarantees of future performance or results. They involve risks, uncertainties and assumptions. The Company’s future results of operations, financial condition and business operations may differ materially from the forward-looking statements or the historical information stated in this Annual Report on Form 10-K. Stockholders and investors are cautioned not to put undue reliance on any forward-looking statement.
There are a number of factors and uncertainties that could cause actual results of operations, financial condition or business contemplated by the forward-looking statements to differ materially from those discussed in the forward-looking statements made herein or elsewhere orally or in writing, by, or on behalf of, the Company, including those factors described in “Item 1A. Risk Factors” above. Other factors not identified herein could also have such an effect.
21
ITEM 7A. QUANTITATIVE AND QUALITATIVE DISCLOSURES ABOUT MARKET RISK
The Company is subject to market risk from exposure to changes in interest rates based on its financing, investing and cash management activities. The Company maintains a secured line of credit at variable interest rates to meet the short-term needs of its expansion program and seasonal inventory increases. The credit line available is $105 million which carries a variable rate of interest.
On February 10, 2010, the Company closed on an Amended and Restated Credit Agreement (the "Facility") with Bank of America, N.A. and Wells Fargo Retail Finance, LLC. The $120 million Facility has a term of four years and replaces the Company's previous revolving credit facility which was in the amount of $105 million and was due on January 18, 2011. The repayment of funds borrowed under the line of credit is now due on February 9, 2014.
The Company’s borrowing arrangement contains no limitation on the change in the variable interest rate paid by the Company. Based on the Company’s average borrowing outstanding during the year of approximately $42.6 million, a 1% change either up or down in the LIBOR rate would have changed the Company’s interest expense by approximately $426.
The Company was not party to any derivative financial instruments in fiscal 2010.
22
ITEM 8. FINANCIAL STATEMENTS AND SUPPLEMENTARY DATA
INDEX TO CONSOLIDATED FINANCIAL STATEMENTS
AND FINANCIAL STATEMENT SCHEDULES
|
Page
|
||||
|
Report of Independent Registered Public Accounting Firm……………………..
|
24 | |||
|
Financial Statements:
|
||||
|
Consolidated Balance Sheets --
|
||||
|
January 31, 2010 and February 1, 2009………………………………..
|
25 | |||
|
Consolidated Statements of Operations --
|
||||
|
Fiscal years Ended January 31, 2010,
|
||||
|
February 1, 2009 and February 3, 2008……………………………….
|
26 | |||
|
Consolidated Statements of Stockholders'
|
||||
|
Equity -- Fiscal years Ended January 31, 2010,
|
||||
|
February 1, 2009 and February 3, 2008……………………..………..
|
27 | |||
|
Consolidated Statements of Cash Flows --
|
||||
|
Fiscal years Ended January 31, 2010,
|
||||
|
February 1, 2009 and February 3, 2008………………………………..
|
28 | |||
|
Notes to Consolidated Financial Statements……………………………………..
|
||||
| 29 | ||||
|
Financial Statement Schedules:
|
||||
|
No financial statement schedules are included as they are not applicable to the Company
|
||||
23
Report of Independent Registered Public Accounting Firm
The Board of Directors and Stockholders
Duckwall-ALCO Stores, Inc.:
We have audited the accompanying consolidated balance sheets of Duckwall-ALCO Stores, Inc. (the Company) as of January 31, 2010 and February 1, 2009, and the related consolidated statements of operations, stockholders’ equity, and cash flows for each of the years in the three-year period ended January 31, 2010. These consolidated financial statements are the responsibility of the Company's management. Our responsibility is to express an opinion on these consolidated financial statements based on our audit.
We conducted our audits in accordance with the standards of the Public Company Accounting Oversight Board (United States). Those standards require that we plan and perform the audit to obtain reasonable assurance about whether the financial statements are free of material misstatement. An audit includes examining, on a test basis, evidence supporting the amounts and disclosures in the financial statements. An audit also includes assessing the accounting principles used and significant estimates made by management, as well as evaluating the overall financial statement presentation. We believe that our audits provide a reasonable basis for our opinion.
In our opinion, the consolidated financial statements referred to above present fairly, in all material respects, the financial position of the Company as of January 31, 2010 and February 1, 2009, and the results of their operations and their cash flows for each of the years in the three-year period ended January 31, 2010, in conformity with U.S. generally accepted accounting principles.
As discussed in Note 7 to the consolidated financial statements, effective January 29, 2007, the Company adopted Accounting Standards Codification Topic 740 (previously Financial Accounting Standards Board (FASB) Interpretation No. 48, Accounting for Uncertainty in Income Taxes).
We also have audited, in accordance with the standards of the Public Company Accounting Oversight Board (United States), the Company’s internal control over financial reporting as of January 31, 2010, based on criteria established in Internal Control – Integrated Framework issued by the Committee of Sponsoring Organizations of the Treadway Commission (COSO), and our report dated April 15, 2010 expressed an unqualified opinion on the effectiveness of the Company’s internal control over financial reporting.
/s/ KPMG LLP
Kansas City, Missouri
April 15, 2010
24
|
Duckwall-ALCO Stores, Inc.
|
||||||||
|
Consolidated Balance Sheets
|
||||||||
|
(dollars in thousands, except share amounts)
|
||||||||
|
Assets
|
||||||||
|
January 31,
|
February 1,
|
|||||||
|
2010
|
2009
|
|||||||
|
Current assets:
|
||||||||
|
Cash and cash equivalents
|
$ | 5,164 | $ | 4,744 | ||||
|
Receivables
|
7,437 | 5,142 | ||||||
|
Prepaid income taxes
|
594 | 5,753 | ||||||
|
Inventories
|
140,375 | 146,620 | ||||||
|
Prepaid expenses
|
3,517 | 4,143 | ||||||
|
Deferred income taxes
|
3,863 | 5,348 | ||||||
|
Property held for sale
|
1,631 | 1,505 | ||||||
|
Total current assets
|
162,581 | 173,255 | ||||||
|
Property and equipment, at cost:
|
||||||||
|
Land and land improvements
|
1,455 | 1,420 | ||||||
|
Buildings and building improvements
|
11,844 | 11,369 | ||||||
|
Furniture, fixtures and equipment
|
67,304 | 69,019 | ||||||
|
Transportation equipment
|
1,303 | 1,322 | ||||||
|
Leasehold improvements
|
14,855 | 13,974 | ||||||
|
Construction work in progress
|
1,744 | 745 | ||||||
|
Total property and equipment
|
98,505 | 97,849 | ||||||
|
Less accumulated depreciation
|
67,959 | 65,591 | ||||||
|
Net property and equipment
|
30,546 | 32,258 | ||||||
|
Property under capital leases
|
11,015 | 11,015 | ||||||
|
Less accumulated amortization
|
9,385 | 7,958 | ||||||
|
Net property under capital leases
|
1,630 | 3,057 | ||||||
|
Other non-current assets
|
51 | 205 | ||||||
|
Total assets
|
$ | 194,808 | 208,775 | |||||
|
Liabilities and Stockholders' Equity
|
||||||||
|
Current liabilities:
|
||||||||
|
Current maturities of long-term debt
|
$
|
1,451 | 1,362 | |||||
|
Current maturities of capital lease obligations
|
1,623 | 1,853 | ||||||
|
Accounts payable
|
23,076 | 30,233 | ||||||
|
Accrued salaries and commissions
|
4,122 | 5,375 | ||||||
|
Accrued taxes other than income
|
4,913 | 4,941 | ||||||
|
Self-insurance claim reserves
|
4,852 | 5,309 | ||||||
|
Other current liabilities
|
4,499 | 4,676 | ||||||
|
Total current liabilities
|
44,536 | 53,749 | ||||||
|
Long term debt, less current maturities
|
1,414 | 2,865 | ||||||
|
Notes payable under revolving loan
|
35,159 | 40,714 | ||||||
|
Capital lease obligations - less current maturities
|
1,345 | 3,047 | ||||||
|
Deferred gain on leases
|
4,212 | 4,598 | ||||||
|
Deferred income taxes
|
694 | 138 | ||||||
|
Other noncurrent liabilities
|
1,715 | 1,624 | ||||||
|
Total liabilities
|
89,075 | 106,735 | ||||||
|
Stockholders' equity:
|
||||||||
|
Common stock, $.0001 par value, authorized 20,000,000 shares; issued and outstanding
|
||||||||
|
3,797,947 shares and 3,797,947 shares, respectively
|
1 | 1 | ||||||
|
Additional paid-in capital
|
39,313 | 38,615 | ||||||
|
Retained earnings
|
66,419 | 63,424 | ||||||
|
Total stockholders' equity
|
105,733 | 102,040 | ||||||
|
Total liabilities and stockholders' equity
|
$ | 194,808 | $ | 208,775 | ||||
|
See accompanying notes to consolidated financial statements.
|
||||||||
25
|
Duckwall-ALCO Stores, Inc.
|
||||||||||||
|
Consolidated Statements of Operations
|
||||||||||||
|
Fiscal Years ended January 31, 2010, February 1, 2009 and February 3, 2008
|
||||||||||||
|
(dollars in thousands, except per share amounts)
|
||||||||||||
|
52 Weeks
|
52 Weeks
|
53 Weeks
|
||||||||||
|
2010
|
2009
|
2008
|
||||||||||
|
Net sales
|
$ | 488,691 | 489,753 | 481,475 | ||||||||
|
Cost of sales
|
330,179 | 335,934 | 329,195 | |||||||||
|
Gross margin
|
158,512 | 153,819 | 152,280 | |||||||||
|
Selling, general and administrative
|
141,208 | 147,735 | 138,250 | |||||||||
|
Depreciation and amortization
|
9,983 | 9,302 | 9,463 | |||||||||
|
Total operating expenses
|
151,191 | 157,037 | 147,713 | |||||||||
|
Operating income (loss) from continuing operations
|
7,321 | (3,218 | ) | 4,567 | ||||||||
|
Interest expense
|
2,149 | 1,867 | 3,382 | |||||||||
|
Earnings (loss) from continuing operations before income taxes
|
5,172 | (5,085 | ) | 1,185 | ||||||||
|
Income tax expense (benefit)
|
2,135 | (2,080 | ) | 394 | ||||||||
|
Earnings (loss) from continuing operations
|
3,037 | (3,005 | ) | 790 | ||||||||
|
Loss from discontinued operations, net of income
|
||||||||||||
|
tax benefit of $25, $1.2 million and $632 in 2010, 2009 and 2008, respectively
|
(42 | ) | (1,971 | ) | (1,015 | ) | ||||||
|
Net earnings (loss)
|
$ | 2,995 | (4,976 | ) | (224 | ) | ||||||
|
Earnings (loss) per share
|
||||||||||||
|
Basic
|
||||||||||||
|
Continuing operations
|
$ | 0.80 | (0.79 | ) | 0.21 | |||||||
|
Discontinued operations
|
(0.01 | ) | (0.52 | ) | (0.27 | ) | ||||||
|
Net earnings (loss) per share
|
$ | 0.79 | (1.31 | ) | (0.06 | ) | ||||||
|
Earnings (loss) per share
|
||||||||||||
|
Diluted
|
||||||||||||
|
Continuing operations
|
$ | 0.78 | (0.79 | ) | 0.21 | |||||||
|
Discontinued operations
|
(0.01 | ) | (0.52 | ) | (0.27 | ) | ||||||
|
Net earnings (loss) per share
|
$ | 0.77 | (1.31 | ) | (0.06 | ) | ||||||
|
See accompanying notes to consolidated financial statements.
|
||||||||||||
26
|
Duckwall-ALCO Stores, Inc.
|
||||||||||||||||||||
|
Consolidated Statements of Stockholders' Equity
|
||||||||||||||||||||
|
Fiscal Years ended January 31, 2010, February 1, 2009 and February 3, 2008
|
||||||||||||||||||||
|
(dollars in thousands, except share amounts)
|
||||||||||||||||||||
|
Common
|
||||||||||||||||||||
|
stock
|
Additional
|
Total
|
||||||||||||||||||
|
shares
|
Common
|
paid-in
|
Retained
|
stockholders'
|
||||||||||||||||
|
outstanding
|
stock
|
capital
|
earnings
|
equity
|
||||||||||||||||
|
Balance, January 28, 2007
|
3,794,303 | $ | 1 | 37,315 | 68,744 | 106,060 | ||||||||||||||
|
Net loss for the year ended February 3, 2008
|
- | - | - | (224 | ) | (224 | ) | |||||||||||||
|
Cumulative effect of a change in accounting principle (Note 7)
|
- | - | - | (115 | ) | (115 | ) | |||||||||||||
|
Income tax benefit related to exercise of stock options
|
- | - | 14 | - | 14 | |||||||||||||||
|
Share-based compensation
|
1,130 | 1,130 | ||||||||||||||||||
|
Options exercised to purchase shares
|
16,288 | - | 307 | - | 307 | |||||||||||||||
|
Balance, February 3, 2008
|
3,810,591 | 1 | 38,766 | 68,405 | 107,172 | |||||||||||||||
|
Net loss for the year ended February 1, 2009
|
- | - | - | (4,976 | ) | (4,976 | ) | |||||||||||||
|
Repurchase and retirement of common shares
|
(22,644 | ) | - | (285 | ) | - | (285 | ) | ||||||||||||
|
Expired stock options
|
- | - | (142 | ) | - | (142 | ) | |||||||||||||
|
Share-based compensation
|
- | - | 186 | - | 186 | |||||||||||||||
|
Sale of company stock
|
10,000 | - | 90 | - | 90 | |||||||||||||||
|
Income tax benefit rate change for stock options
|
- | - | - | (5 | ) | (5 | ) | |||||||||||||
|
Balance, February 1, 2009
|
3,797,947 | $ | 1 | 38,615 | 63,424 | 102,040 | ||||||||||||||
|
Net earnings for the year ended January 31, 2010
|
- | - | - | 2,995 | 2,995 | |||||||||||||||
|
Expired stock options
|
- | - | (59 | ) | - | (59 | ) | |||||||||||||
|
Share-based compensation
|
- | - | 757 | - | 757 | |||||||||||||||
|
Balance, January 31, 2010
|
3,797,947 | $ | 1 | 39,313 | 66,419 | 105,733 | ||||||||||||||
|
See accompanying notes to consolidated financial statements.
|
||||||||||||||||||||
27
|
Duckwall-ALCO Stores, Inc.
|
||||||||||||
|
Consolidated Statements of Cash Flows
|
||||||||||||
|
Fiscal Years ended January 31, 2010, February 1, 2009 and February 3, 2008
|
||||||||||||
|
(dollars in thousands)
|
||||||||||||
|
52 Weeks
|
52 Weeks
|
53 Weeks
|
||||||||||
|
2010
|
2009
|
2008
|
||||||||||
|
Cash flows from operating activities:
|
||||||||||||
|
Net earnings (loss)
|
$ | 2,995 | (4,976 | ) | (224 | ) | ||||||
|
Adjustments to reconcile net earnings (loss) to net cash provided by (used in) operating activities:
|
||||||||||||
|
Depreciation and amortization
|
9,944 | 9,346 | 9,867 | |||||||||
|
Loss (gain) on sale of assets
|
43 | 7 | (180 | ) | ||||||||
|
Share-based compensation
|
757 | 186 | 1,130 | |||||||||
|
Tax benefit of stock options exercised
|
- | - | 14 | |||||||||
|
Deferred income tax expense, net
|
1,982 | 5,050 | (1,428 | ) | ||||||||
|
Changes in:
|
||||||||||||
|
Receivables
|
(2,295 | ) | (237 | ) | (1,846 | ) | ||||||
|
Prepaid expenses
|
626 | (1,042 | ) | (1,540 | ) | |||||||
|
Inventories
|
6,245 | (18,075 | ) | 22,861 | ||||||||
|
Accounts payable
|
(7,157 | ) | 11,099 | (16,129 | ) | |||||||
|
Prepaid income taxes
|
5,159 | (4,985 | ) | (2,560 | ) | |||||||
|
Accrued salaries and commissions
|
(1,253 | ) | 1,664 | (469 | ) | |||||||
|
Accrued taxes other than income
|
(28 | ) | 640 | 59 | ||||||||
|
Self-insured claims reserves
|
(457 | ) | 738 | 249 | ||||||||
|
Other assets and liabilities
|
(318 | ) | (2,583 | ) | 1,294 | |||||||
|
Net cash provided by (used in) operating activities
|
16,243 | (3,168 | ) | 11,098 | ||||||||
|
Cash flows from investing activities:
|
||||||||||||
|
Proceeds from the sale of assets
|
77 | 185 | 637 | |||||||||
|
Acquisition of property and equipment
|
(7,051 | ) | (14,402 | ) | (12,293 | ) | ||||||
|
Net cash used in investing activities
|
(6,974 | ) | (14,217 | ) | (11,656 | ) | ||||||
|
Cash flows from financing activities:
|
||||||||||||
|
Net borrowings (pay downs) under revolving loan credit agreement
|
(5,555 | ) | 19,999 | (362 | ) | |||||||
|
Refinancing costs on revolving loan and term loan fees
|
- | - | (256 | ) | ||||||||
|
Proceeds from exercise of outstanding stock options
|
- | - | 307 | |||||||||
|
Proceeds from stock sale
|
- | 90 | ||||||||||
|
Income tax benefit rate change for stock options
|
- | (5 | ) | - | ||||||||
|
Repurchase of stock
|
- | (285 | ) | - | ||||||||
|
Net borrowings (pay downs) under term loan
|
(1,362 | ) | (1,278 | ) | 5,505 | |||||||
|
Principal payments under capital lease obligations
|
(1,932 | ) | (1,893 | ) | (2,118 | ) | ||||||
|
Net cash (used in) provided by financing activities
|
(8,849 | ) | 16,628 | 3,076 | ||||||||
|
Net increase (decrease) in cash and cash equivalents
|
420 | (757 | ) | 2,518 | ||||||||
|
Cash and cash equivalents at beginning of year
|
4,744 | 5,501 | 2,983 | |||||||||
|
Cash and cash equivalents at end of year
|
$ | 5,164 | 4,744 | 5,501 | ||||||||
|
Supplemental disclosure of non-cash activity:
|
||||||||||||
|
Tax benefit related to stock options exercised
|
$ | - | - | 14 | ||||||||
|
See accompanying notes to consolidated financial statements.
|
||||||||||||
28
DUCKWALL-ALCO STORES, INC.
Notes to Consolidated Financial Statements
January 31, 2010, February 1, 2009 and February 3, 2008
(dollars in thousands, except for per share amounts)
|
1.
|
Summary of Significant Accounting Policies
|
|
(a)
|
Nature of Business
|
Duckwall-ALCO Stores, Inc. (the Company) is engaged in the business of retailing general merchandise throughout the central portion of the United States of America through broad line department store outlets. Merchandise is purchased for resale from many vendors, and any one transaction with individual vendors and customers does not represent a significant portion of total purchases and sales.
|
(b)
|
Principles of Consolidation
|
The consolidated financial statements include the accounts of the Company.
|
(c)
|
Basis of Presentation
|
The Company’s fiscal year ends on the Sunday nearest to January 31. Both fiscal 2010 and fiscal 2009 consisted of 52 weeks, while fiscal 2008 consisted of 53 weeks.
|
(d)
|
Inventories
|
Inventories are stated at the lower of cost or net realizable value with cost determined using the last-in, first-out “LIFO” method. Merchandise inventories in our stores are valued by the retail method. The retail method is widely used in the retail industry due to its practicality. Under the retail method, cost is determined by applying a calculated cost-to-retail ratio across groupings of similar items, known as departments. As a result, the retail method results in an averaging of inventory costs across similar items within a department. The cost-to-retail ratio is applied to ending inventory at its current owned retail valuation to determine the cost of ending inventory on a department basis. Current owned retail represents the retail price for which merchandise is offered for sale on a regular basis reduced for any permanent or clearance markdowns. Use of the retail method does not eliminate the use of management judgments and estimates, including estimates of markdowns and shrinkage, which significantly impact the ending inventory valuation at cost and the resulting gross margins. The Company continually evaluates product categories to determine if markdown action is appropriate, or if a markdown reserve should be established. The Company recognizes that the use of the retail method will result in valuing inventories at lower of cost or market if markdowns are currently taken as a reduction of the retail value of inventories. Management believes that the retail method provides an inventory valuation which reasonably approximates cost and results in carrying inventory at the lower of cost or market. For LIFO, the Company determines lower of cost or market by pool.
|
(e)
|
Property and Equipment
|
Depreciation is computed on a straight-line basis over the estimated useful lives of the assets. Amortization of capital leases is computed on a straight-line basis over the terms of the lease agreements. Major improvements are capitalized, while maintenance and repairs that do not extend the useful life of the asset are charged to expense as incurred. Estimated useful lives are as follows:
|
Buildings
|
25 years
|
|
Building improvements
|
10 years
|
|
Software
|
3 years
|
|
Furniture, fixtures and equipment
|
3 - 8 years
|
|
Transportation equipment
|
3 - 5 years
|
|
Leasehold improvements
|
2 - 10 years (not to exceed lease term)
|
For fiscal 2010, 2009 and 2008, depreciation and amortization, including asset impairment charge for continuing operations was $10.0 million, $9.3 million and $9.5 million, respectively.
The Company has sold and leased back certain stores (land and buildings) and the resulting leases qualify and are accounted for as operating leases. The Company does not have any retained or contingent interests in the stores, nor does the Company provide any guarantees, other than a guarantee of lease payments, in connection with the sale-leasebacks. The Company did not have any sale-leaseback transactions for fiscal 2010, 2009 and 2008 respectively. If a gain results from the sale-leaseback transaction, such gain is deferred and amortized over the term of the related leases (15 - 20 years).
|
(f)
|
Operating Leases
|
The Company accounts for operating leases over the initial lease term without regard to available renewal options. The Company considers free rent periods and scheduled rent increases in determining total rent expense for the initial lease term. Total rent expense is recognized on a straight-line basis over that term.
29
|
(g)
|
Insurance
|
The Company retains significant deductibles on its insurance policies for workers compensation, general liability, medical claims and prescriptions. Due to the fact that it could take more than one year to determine the actual costs, these costs are estimated based on the Company’s historical loss experience and estimates from the insurance carriers and consultants. The Company completes an actuarial evaluation of its loss experience twice each year. In between actuarial evaluations, management monitors the cost and number of claims and compares those results to historical amounts. The Company’s actuarial method is the fully developed method. The Company records its reserves on an undiscounted basis. The Company’s prior estimates have varied based on changes in assumptions related to actual claims versus estimated ultimate loss calculations. Current and future estimates could be affected by changes in those same assumptions.
|
(h)
|
Income Taxes
|
The Company accounts for income taxes under the asset and liability method. Deferred tax assets and liabilities are recognized for the future tax consequences attributable to differences between the financial statement carrying amounts of existing assets and liabilities and their respective tax bases and operating loss and tax credit carryforwards. Deferred tax assets and liabilities are measured using enacted tax rates expected to apply to taxable income in the years in which those temporary differences are expected to be recovered or settled. The effect on deferred tax assets and liabilities of a change in tax rates is recognized in income in the period that includes the enactment date. The Company reflects changes in estimates related to prior period income taxes as a component of current period income tax expense.
|
(i)
|
Net Sales
|
Sales are recorded in the period of sale. The Company excludes sales taxes from revenue. The Company has established a sales returns allowance based on the historical returns pattern experienced by the Company.
|
(j)
|
Net Earnings (Loss) Per Share
|
Basic net earnings (loss) per share is computed by dividing net earnings (loss) by the weighted average number of shares outstanding. Diluted net earnings (loss) per share reflects the potential dilution that could occur if contracts to issue securities (such as stock options) were exercised. See note 9.
|
(k)
|
Consolidated Statements of Cash Flows
|
For purposes of the consolidated statements of cash flows, the Company considers cash and cash equivalents to include currency on hand and money market funds. During fiscal 2010, 2009 and 2008, the following amounts were paid (received) for interest and income taxes:
|
2010
|
2009
|
2008
|
||||||||||
|
Interest, excluding interest on capital lease obligations and amortization of debt financing
|
||||||||||||
|
costs (net of capitalized interest of $0 in each of the fiscal years 2010, 2009 and 2008)
|
$ | 2,109 | 2,242 | 2,823 | ||||||||
|
Income taxes (received) paid
|
(4,778 | ) | 987 | 3,716 | ||||||||
|
(l)
|
Use of Estimates
|
Management of the Company has made certain estimates and assumptions in the reporting of assets and liabilities, the disclosure of contingent assets and liabilities, and the reported amounts of revenues and expenses to prepare these consolidated financial statements in conformity with U.S. GAAP. Actual results could differ from those estimates.
|
(m)
|
Long-lived Assets
|
The Company reviews assets for impairment at the lowest level for which there are identifiable cash flows, usually at the store level. The carrying amount of assets is compared with the expected undiscounted future cash flows to be generated by those assets over their estimated remaining economic lives. If the undiscounted cash flows are less than the carrying amount of the asset, the asset is written down to fair value. Factors that could result in an impairment review include, but are not limited to, a current period cash flow loss combined with a history of cash flow losses or a projection that demonstrates continuing losses associated with the use of a long-lived asset or significant changes in a manner of use of the assets due to business strategies or competitive environment. Additionally, when a commitment is made to close a store in a period beyond the quarter in which the closure commitment is made, it is reviewed for impairment and depreciable lives are adjusted. The impairment evaluation is based on the estimated cash flows from continuing use until the expected disposal date plus the expected terminal value. Actual results could vary from management estimates. Charges for asset impairment of $831, $1.3 million and $2.1 million in fiscal 2010, 2009 and 2008, respectively, are included in depreciation and amortization expense in the consolidated statements of operations. For the fiscal 2009 impairment, $299 is attributable to writing down the carrying value on property held for sale.
As of January 31, 2010, the Company has $1.6 million classified as assets held for sale. These properties are recorded at their net realizable value, net of disposal costs. The majority of the property is land. Two former ALCO store locations include buildings also. The Company used the services of a local real estate broker to determine the fair value of each property.
30
|
(n)
|
Store Closings and Discontinued Operations
|
A provision for store closure expenses is recorded when the Company discontinues using the facility. A summary of the expense and liability (included in other current liabilities) related to store closures for fiscal 2010, 2009 and 2008:
|
2010
|
2009
|
2008
|
||||||||||
|
Store closure liability at beginning of year
|
$ | 263 | - | 105 | ||||||||
|
Store closure (income) expense (included in discontinued operations)
|
(20 | ) | 769 | (71 | ) | |||||||
|
Payments
|
(153 | ) | (506 | ) | (34 | ) | ||||||
|
Store closure liability at end of year
|
$ | 90 | 263 | - | ||||||||
The Company has determined that generally each store is a component of the entity and that for each closed store (i) the operations and cash flows of the component have been eliminated from the ongoing operations of the entity and (ii) the entity will not have any significant continuing involvement in the operations of the component after the store is closed. This is a result of the Company’s stores being geographically disbursed. The results of operations for stores that have been closed by the Company (one, 15 and 10 stores in fiscal 2010, 2009 and 2008, respectively) have been reclassified to discontinued operations in the accompanying consolidated statements of operations for all periods presented. The Company does not allocate interest expense to discontinued operations. A liability is recognized for costs associated with store closings, primarily future lease costs (net of estimated sublease income), and is charged to income when the Company ceases to use the leased location.
|
(o)
|
Consideration Received from Vendors
|
Cost of sales and selling, general and administrative expenses are partially offset by various forms of consideration received from our vendors. This “vendor income” is earned for a variety of vendor-sponsored programs, such as volume rebates, markdown allowances, promotions, warehouse cost reimbursement and advertising. Consideration received, to the extent that it reimburses specific, incremental, and identifiable costs incurred to date, is recorded in selling, general and administrative expenses in the same period as the associated expenses are incurred. Reimbursements received that are in excess of specific, incremental and identifiable costs incurred to date are recognized as a reduction to the cost of the merchandise purchased and are reflected in costs of sales as the merchandise is sold. The Company establishes a receivable for the vendor income that is earned but not yet received. Based on provisions of the agreements in place, this receivable is computed by estimating when the Company has completed its performance and the amount has been earned. The Company performs detailed analyses to determine the appropriate level of the receivable in the aggregate. The majority of year-end receivables associated with these activities are collected within the following fiscal quarter.
|
(p)
|
Advertising Costs
|
The Company expenses advertising costs as incurred. The Company records payments from vendors representing reimbursements of specific identifiable costs as a reduction of that cost. Advertising expenses of $9.5 million, $7.9 million and $8.5 million in the fiscal 2010, 2009 and 2008, respectively, are included in selling, general and administrative expenses in the consolidated statements of operations. Advertising vendor income that offset advertising expenses were $4.7 million, $3.9 million and $4.5 million in fiscal 2010, 2009 and 2008, respectively. Newspaper circulars made up the majority of our advertising costs in all three years.
|
(q)
|
Share-based Compensation
|
The Company currently sponsors share-based employee benefit plans and stock option plans. The Company recognizes compensation expense for its share-based payments based on the fair value of the awards on the date of the grant. Share-based payments include stock option awards issued under the Company’s employee stock option plan, director stock option plan, stock issued through the Company’s employee stock purchase plan and stock awarded to employees through other benefit programs. See Note 10 for further information concerning these plans.
|
(r)
|
Fair Value of Financial Instruments
|
The financial instruments of the Company consist of cash and cash equivalents, short-term receivables and accounts payable, accrued expenses and long-term debt instruments, including capital leases. For notes payable under revolving loan, fair value approximates the carrying value due to the variable interest rate. Based on the borrowing rates currently available to the Company for debt with similar terms, the fair value of term debt at January 31, 2010 approximates its carrying amount of $2.9 million. For all other financial instruments including cash and cash equivalents, short-term receivables, accounts payable and accrued expenses, the carrying amounts approximate fair value due to the short maturity of those instruments.
|
(s)
|
Pre-opening Costs
|
The costs of start-up activities, including organization costs and new store openings, are expensed as incurred.
|
(t)
|
Future Accounting Pronouncements
|
In June 2009, the Financial Accounting Standards Board (FASB) issued ASU 2009-16, which updated Accounting Standards Codification (ASC) Topic 810: Accounting for Transfers of Financial Assets, codified in the Transfers and Servicing accounting principles, which amends the derecognition guidance and eliminates the exemption from consolidation for qualifying special-purpose entities. This guidance will be effective for the beginning in fiscal 2011 and adoption is not anticipated to affect our consolidated net earnings, cash flows or financial position.
31
In June 2009, the FASB issued ASC Topic 810-10, which amends the consolidation guidance applicable to variable interest entities. The amendments will significantly affect the overall consolidation analysis under former guidance. This guidance will be effective beginning in fiscal 2011 and adoption is not anticipated to affect our consolidated net earnings, cash flows or financial position.
|
(u)
|
Subsequent Events
|
On February 10, 2010, the Company closed on an Amended and Restated Credit Agreement (the "Facility") with Bank of America, N.A. and Wells Fargo Retail Finance, LLC. The $120 million Facility has a term of four years and replaces the Company's previous revolving credit facility which was in the amount of $105 million.
|
2.
|
Inventories
|
Inventories at January 31, 2010 and February 1, 2009 are stated at the lower of cost or net realizable value as determined under the LIFO method of accounting. Inventories at January 31, 2010 and February 1, 2009 are summarized as follows:
|
2010
|
2009
|
|||||||
|
FIFO cost
|
$ | 144,712 | 150,867 | |||||
|
Less LIFO and markdown reserves
|
(4,337 | ) | (4,247 | ) | ||||
|
LIFO cost
|
$ | 140,375 | 146,620 | |||||
During fiscal 2010, inventory quantities were reduced. This reduction resulted in a liquidation of LIFO inventory quantities carried at lower costs prevailing in prior years as compared with the cost of fiscal 2010 purchases, the effect of which decreased cost of goods sold by approximately $894 and increased net earnings by approximately $525 or $0.14 per diluted share.
|
3.
|
Credit Arrangements, Notes Payable and Long-term Debt
|
The Company has a loan agreement that provides a revolving loan credit facility of up to $105 million of long-term financing which expires January 18, 2011. The amount advanced (through a note or letters of credit) to the Company bears interest at (i) the higher of (a) the Federal Funds Rate plus 1/2 of 1% or (b) Bank of America, N.A. prime rate plus a margin, as defined in the agreement, which varies based on the amount outstanding or (ii) based on the LIBOR rate plus a margin, as defined in the agreement. Additionally, the Company is currently obligated to pay a commitment fee equal to 0.25% of the unused capacity. The amount advanced is generally limited to 85% of eligible inventory and eligible receivables. The loan agreement contains various restrictions that are applicable when outstanding borrowings reach certain thresholds, including limitations on additional indebtedness, prepayments, acquisition of assets, granting of liens, certain investments and payments of dividends. The Company's loan agreement contains various covenants including limitations on additional indebtedness and certain financial tests, as well as various subjective acceleration clauses. The balance sheet classification of the borrowings under the revolving loan credit facility have been determined in accordance with ASC Topic 470-10-45. As of January 31, 2010, the Company was in compliance with all covenants and subjective acceleration clauses of the debt agreements. While the balance outstanding under the current agreement is due January 18, 2011, which is less than twelve months from January 31, 2010, the Company executed a new Amended and Restated Agreement on February 10, 2010. The term of this agreement is four years. Accordingly, this obligation has been classified as a long-term liability in the accompanying consolidated balance sheet.
Notes payable outstanding at January 31, 2010 and February 1, 2009 under the revolving loan credit facility aggregated $35.2 million and $40.7 million, respectively. The lender had also issued letters of credit aggregating $8.2 million and $6.3 million, respectively, at such dates on behalf of the Company. The interest rate on $15 million of the outstanding borrowings at January 31, 2010 was 1.48% and on the remaining $20.2 million was at 3.25%. The Company had additional borrowings available at January 31, 2010 under the revolving loan credit facility amounting to approximately $56.4 million.
The Company also has a term loan which was incurred to fund new store fixtures and equipment and is secured by such fixtures and equipment. The interest rate on $2.4 million of the outstanding borrowings at January 31, 2010 was 6.35% and on the remaining $447 was at 6.54%. Principal and interest payments are due in monthly installments through December 2011.
|
Payments due by Fiscal Period
|
||||||||||||||||||||||||
|
Contractual Obligations
|
Total
|
2011
|
2012
|
2013
|
2014
|
2015
|
||||||||||||||||||
|
Revolving loan credit facility
|
$ | 35,159 | - | - | - | 35,159 | - | |||||||||||||||||
|
FF&E term loan
|
2,865 | 1,451 | 1,414 | - | - | - | ||||||||||||||||||
| $ | 38,024 | 1,451 | 1,414 | - | 35,159 | - | ||||||||||||||||||
Interest expense on notes payable and long-term debt in fiscal 2010, 2009 and 2008 aggregated $2.0 million, $1.3 million, and $2.8 million, respectively.
|
4.
|
Employee Benefits
|
The Company matches the employee’s contribution to half of the first 4% contributed by the employee with a cash contribution to the 401(K) plan. Contributions by the Company vest with the participants over a seven-year period. Expense arising due to Company matches amounted to $381, $462 and $480 for fiscal 2010, 2009, and 2008, respectively.
32
|
5.
|
Self-Insurance Claim Reserves
|
Changes to the self-insurance reserves for fiscal 2010 and 2009 are as follows:
|
2010
|
2009
|
|||||||
|
Beginning balance
|
$ | 5,309 | 4,571 | |||||
|
Reserve additions
|
1,044 | 2,326 | ||||||
|
Claims paid
|
(1,501 | ) | (1,588 | ) | ||||
|
Ending balance
|
$ | 4,852 | 5,309 | |||||
|
6.
|
Leases
|
The Company is lessee under long-term capital leases expiring at various dates. The components of property under capital leases for fiscal 2010 and 2009 are as follows:
|
2010
|
2009
|
|||||||
|
Buildings
|
$ | 2,494 | $ | 2,494 | ||||
|
Fixtures
|
1,663 | 1,663 | ||||||
|
Software
|
6,858 | 6,858 | ||||||
| 11,015 | 11,015 | |||||||
|
Less accumulated amortization
|
9,385 | 7,958 | ||||||
|
Net property under capital leases
|
$ | 1,630 | $ | 3,057 | ||||
The Company also has noncancelable operating leases, primarily for buildings, that expire at various dates.
Future minimum lease payments under all noncancelable leases, together with the present value of the net minimum lease payments pursuant to capital leases, as of January 31, 2010 are as follows:
|
|
Capital
|
Operating
|
||||||
|
Leases
|
Leases
|
|||||||
|
Fiscal year:
|
||||||||
|
2011
|
$ | 1,933 | 19,676 | |||||
|
2012
|
705 | 18,031 | ||||||
|
2013
|
455 | 16,629 | ||||||
|
2014
|
252 | 14,270 | ||||||
|
2015
|
68 | 12,513 | ||||||
|
Later years
|
- | 83,531 | ||||||
|
Total minimum lease payments
|
3,413 | $ | 164,650 | |||||
|
Less amount representing interest
|
445 | |||||||
|
Present value of net minimum lease payments
|
2,968 | |||||||
|
Less current maturities
|
1,623 | |||||||
|
Capital lease obligations, less current maturities
|
$ | 1,345 | ||||||
Minimum payments have not been reduced by minimum sublease rentals of $368 under operating leases due in the future under noncancelable subleases. They also do not include contingent rentals, which may be paid under certain store leases on the basis of percentage of sales in excess of stipulated amounts. Contingent rentals applicable to capital leases amounted to $71, $77 and $95 for fiscal 2010, 2009 and 2008, respectively.
The Company entered into a software lease and a flexible lease financing proposal regarding the lease of point-of-sale hardware with General Electric Capital Corporation (“GECC”) on December 1, 2005 and December 5, 2005, respectively. The software lease, which is a capital lease, began on January 1, 2006 and has a term of five years. The Company leased an additional $1.9 million during fiscal 2007 under this capital lease. The hardware lease, which is an operating lease, began on September 30, 2006, and had a term of four years. The Company entered into a buyout agreement with GECC on December 18, 2008 to purchase the equipment that was the subject of the hardware lease.
The interest on capital lease obligations in fiscal 2010, 2009 and 2008 aggregated $183, $225 and $306, respectively.
The following schedule presents the composition of total rent expense for all operating leases for fiscal 2010, 2009 and 2008:
|
2010
|
2009
|
2008
|
||||||||||
|
Minimum rentals
|
$ | 19,618 | 20,129 | 15,172 | ||||||||
|
Contingent rentals
|
1,180 | 1,323 | 1,468 | |||||||||
|
Less sublease rentals
|
(51 | ) | (74 | ) | (51 | ) | ||||||
| $ | 20,747 | 21,378 | 16,589 | |||||||||
33
|
7.
|
Income Taxes
|
The Company’s income tax expense (benefit) consists of the following for fiscal 2010, 2009 and 2008:
|
2010
|
2009
|
2008
|
||||||||||
|
Income tax expense (benefit) allocated to continuing operations
|
$ | 2,135 | (2,080 | ) | 394 | |||||||
|
Income tax benefit allocated to discontinued operations
|
(25 | ) | (1,227 | ) | (632 | ) | ||||||
|
Total income tax expense (benefit)
|
$ | 2,110 | (3,307 | ) | (238 | ) | ||||||
Income tax expense (benefit) attributable to continuing operations for fiscal 2010, 2009, and 2008 consists of:
|
Current
|
Deferred
|
Total
|
||||||||||
|
2010:
|
||||||||||||
|
Federal
|
$ | (380 | ) | 1,855 | 1,475 | |||||||
|
State
|
533 | 127 | 660 | |||||||||
| 153 | 1,982 | 2,135 | ||||||||||
|
2009:
|
||||||||||||
|
Federal
|
(4,270 | ) | 2,420 | (1,850 | ) | |||||||
|
State
|
(464 | ) | 234 | (230 | ) | |||||||
| (4,734 | ) | 2,654 | (2,080 | ) | ||||||||
|
2008:
|
||||||||||||
|
Federal
|
1,543 | (1,221 | ) | 322 | ||||||||
|
State
|
279 | (207 | ) | 72 | ||||||||
| $ | 1,822 | (1,428 | ) | 394 | ||||||||
Income tax expense (benefit) attributable to continuing operations was $2.1 million, ($2.0) million, and $394, for fiscal 2010, 2009 and 2008, respectively, and differs from the amounts computed by applying the Federal income tax rate of 34% as a result of the following:
|
2010
|
2009
|
2008
|
||||||||||
|
Computed “expected” tax expense (benefit)
|
$ | 1,758 | (1,729 | ) | 403 | |||||||
|
State income taxes, net of the Federal income tax expense (benefit)
|
417 | (152 | ) | 48 | ||||||||
|
Adjustment for prior period taxes
|
82 | (48 | ) | (76 | ) | |||||||
|
Federal employment credits
|
(329 | ) | (291 | ) | - | |||||||
|
Share-based compensation
|
149 | 86 | - | |||||||||
|
Other, net
|
58 | 54 | 19 | |||||||||
| $ | 2,135 | (2,080 | ) | 394 | ||||||||
The tax effects of temporary differences that give rise to significant portions of deferred tax assets and liabilities at January 31, 2010 and February 1, 2009 are presented below:
|
2010
|
2009
|
|||||||
|
Deferred tax assets:
|
||||||||
|
Capital leases
|
$ | 240 | 283 | |||||
|
Other liabilities
|
1,325 | 1,825 | ||||||
|
Insurance reserves
|
1,435 | 1,650 | ||||||
|
Vacation and sick pay accrual
|
810 | 801 | ||||||
|
Inventory
|
1,064 | 4,068 | ||||||
|
Deferred gain property and equipment
|
1,599 | 1,825 | ||||||
|
Net operating loss carryforwards and credits
|
2,017 | 1,326 | ||||||
|
Total deferred tax assets, net of $0 valuation allowance
|
8,490 | 11,778 | ||||||
|
Deferred tax liabilities:
|
||||||||
|
Property and equipment, due to differences in depreciation
|
3,714 | 4,284 | ||||||
|
Property taxes
|
239 | 303 | ||||||
|
481 (a) adjustments
|
851 | 1,329 | ||||||
|
Stock options - APIC
|
200 | 143 | ||||||
|
Other assets
|
317 | 509 | ||||||
|
Total deferred tax liabilities
|
5,321 | 6,568 | ||||||
|
Net deferred tax asset
|
$ | 3,169 | 5,210 | |||||
34
At January 31, 2010, the Company has total state net operating loss carryforwards of $11.4 million, which are available to offset future state taxable income in those states. These net operating losses begin expiring in fiscal year 2020. Due to the history of earnings and projected future results, the Company believes it is more likely than not those future operations will generate sufficient taxable income to realize the deferred tax assets. As such, at January 31, 2010 and February 1, 2009 there is no valuation allowance on the net operating losses. In assessing the realizability of deferred tax assets, management considers whether it is more likely than not that some portion or all of the deferred tax assets will not be realized. The ultimate realization of deferred tax assets is dependent upon the generation of future taxable income during the periods in which those temporary differences become deductible.
For fiscal 2010, the Company recorded book income of $5.2 million and taxable income of $6.1 million which allowed utilization of 100% of the federal net operating loss. The Company continues to expect positive book income over the next 3 years. In addition, given the 20 year carry forward period in most states, the Company also expects to realize the small amount of state net operating losses. The amount of the deferred tax asset considered realizable, however, could be reduced in the near term if estimates of future taxable income during the carryforward period are reduced.
The Company also has federal credits available in the amount of $1.5 million to offset future taxable income. Approximately $1.0 million of these credits will begin to expire in fiscal year 2028, and the remaining credits have no expiration.
The Company is currently under exam with the Internal Revenue Service (“IRS”) for its fiscal 2009 tax return. To date, the IRS has not proposed any material adjustments and the Company does not expect any material adjustments. During fiscal year 2009, the Company finalized the exam with the IRS for fiscal 2006 with no significant adjustments.
A reconciliation of the beginning and ending balances of the total amounts of gross unrecognized tax benefits is as follows:
|
2010
|
2009
|
|||||||
|
Gross unrecognized tax benefits at the beginning of:
|
$ | 57 | 2,521 | |||||
|
Increases related to prior period tax positions
|
- | 57 | ||||||
|
Decreases related to prior period tax positions
|
- | (2,481 | ) | |||||
|
Settlements
|
- | (40 | ) | |||||
|
Gross unrecognized tax benefits at the end of:
|
$ | 57 | 57 | |||||
None of the amounts included in the $57 of unrecognized tax benefits at January 31, 2010 and February 1, 2009, respectively, would affect the effective tax rate if recognized. The Company also accrued potential interest of $10 and $18 related to these unrecognized tax benefits during fiscal 2010 and 2009, respectively. No amounts were accrued for penalties with respect to the unrecognized tax benefits.
During fiscal 2010, the Company expected the unrecognized tax benefits to change due to tax planning strategies. However, not all anticipated strategies were implemented and therefore the liability did not change. However, the Company does expect to implement the remaining tax planning strategy during fiscal 2011 that would eliminate the remainder of the unrecognized tax benefits of $57. This tax planning would also eliminate the interest accrual.
The statute of limitations for the Company’s federal income tax returns is open for fiscal 2007 through fiscal 2009. The Company files in numerous state jurisdictions with varying statutes of limitation. The statute of limitations for the Company’s state returns are open from fiscal 2006 through fiscal 2009 or fiscal 2007 through fiscal 2009, depending on each state’s statute of limitations.
|
8.
|
Stockholders’ Equity
|
On March 23, 2006, the Board of Directors approved a plan authorizing the repurchase 200,000 shares of the Company’s common stock, of which 25,534 shares have been repurchased at an average cost of $15.16. As of January 31, 2010, 174,466 shares remain available to be repurchased.
|
9.
|
Earnings Per Share
|
The following is a reconciliation of the outstanding shares utilized in the computation of earnings per share:
|
2010
|
2009
|
2008
|
||||||||||
|
Weighted average shares outstanding (basic)
|
3,797,947 | 3,809,109 | 3,807,033 | |||||||||
|
Effect of dilutive options to purchase common stock
|
81,709 | - | - | |||||||||
|
As adjusted for diluted calculation
|
3,879,656 | 3,809,109 | 3,807,033 | |||||||||
The impact of certain options was excluded from the calculation of diluted earnings per share for fiscal 2009 and 2008 because the effects are antidilutive. For fiscal 2009 and 2008, antidilutive options were 26,645 and 42,702, respectively.
35
|
10.
|
Share-Based Compensation
|
Effective with fiscal 2007, the Company began recognizing compensation for its share-based payments based on the fair value of the awards. Share-based payments consist of stock option grants. The benefits of tax deductions in excess of recognized compensation expense are reported as a financing cash flow.
Total share-based compensation (a component of selling and general and administrative expenses) is summarized as follows:
|
2010
|
2009
|
2008
|
||||||||||
|
Share-based compensation expense before income taxes
|
$ | 757 | 186 | 1,130 | ||||||||
|
Income tax benefits
|
(319 | ) | (76 | ) | (375 | ) | ||||||
|
Share-based compensation expense net of income tax benefits
|
$ | 438 | 110 | 755 | ||||||||
|
Effect on:
|
||||||||||||
|
Basic earnings per share
|
$ | 0.12 | 0.03 | 0.20 | ||||||||
|
Diluted earnings per share
|
$ | 0.11 | 0.03 | 0.20 | ||||||||
Forfeitures are estimated at the time of valuation and reduce expense ratably over the vesting period. This estimate is adjusted periodically based on the extent to which actual forfeitures differ, or are expected to differ, from the previous estimate. The Company grants awards to a limited number of key employees and officers, thus, actual forfeitures can vary significantly from estimated amounts. Actual forfeitures exceeded estimated forfeitures for fiscal 2010 and 2009 resulting in a reduction of previously recorded share-based compensation of $129 and $480, respectively.
On July 1, 2008, the Company entered into a Non-Qualified Stock Option Agreement with Lawrence J. Zigerelli as part of his employment with the Company. Mr. Zigerelli was granted the right to purchase 10,000 shares of the Company’s common stock at a purchase price of $9.05, which was equal to the closing price of the common stock on the NASDAQ Global Market Exchange on the grant date. The options will vest in equal amounts over a four year period unless certain Company events occur. The options will terminate if Mr. Zigerelli ceases to be a full time employee of the Company. The options will also terminate, if unexercised, five years from the date of grant. The Company issued these shares from the unissued shares authorized.
Stock Incentive Plan
Under our 2003 Incentive Stock Option Plan, options may be granted to officers and key employees, not to exceed 500,000 shares. According to the terms of the plan, the per share exercise price of options granted shall not be less than the fair market value of the stock on the date of grant and such options will expire no later than five years from the date of grant. The options vest in equal amounts over a four year requisite service period beginning from the grant date unless certain Company events occur. In the case of a stockholder owning more than 10% of the outstanding voting stock of the Company, the exercise price of an incentive stock option may not be less than 110% of the fair market value of the stock on the date of grant and such options will expire no later than five years from the date of grant. Also, the aggregate fair market value of the stock with respect to which incentive stock options are exercisable on a tax deferred basis for the first time by an individual in any calendar year may not exceed $100. In the event that the foregoing results in a portion of an option exceeding the $100 limitation, such portion of the option in excess of the limitation shall be treated as a nonqualified stock option. At January 31, 2010, the Company had 101,250 remaining shares authorized for future option grants. Upon exercise, the Company issues these shares from the unissued shares authorized.
Under our Non-Qualified Stock Option Plan for Non-Management Directors, options may be granted to Directors of the Company who are not otherwise officers or employees of the Company, not to exceed 200,000 shares. According to the terms of the plan, the per share exercise price of options granted shall not be less than the fair market value of the stock on the date of grant and such options will expire five years from the date of grant. The options vest in equal amounts over a four year requisite service period beginning from the grant date unless certain Company events occur. All options under the plan shall be non-qualified stock options. As of January 31, 2010, the Company had 77,500 shares remaining to be issued under this plan. Upon exercise, the Company will issue these shares from the unissued shares authorized.
Under our Non-Qualified Stock Option Agreement with Lawrence J. Zigerelli as part of his starting employment with the Company on July 1, 2008, Mr. Zigerelli was granted the right to purchase 10,000 shares of the Company’s common stock. According to the terms of the plan, the per share exercise price of options granted shall not be less than the fair market value of the stock on the date of grant and such options will expire no later than five years from the date of grant. The options vest in equal amounts over a four year requisite service period beginning from the grant date unless certain Company events occur. The options will terminate if Mr. Zigerelli ceases to be a full time employee of the Company. The Company issues these grants from the unissued shares authorized. There are no shares remaining to be issued under this plan.
The fair value of each option grant is separately estimated. The fair value of each option is amortized into share-based compensation on a straight-line basis over the requisite service period as discussed above. We have estimated the fair value of all stock option awards as of the date of the grant by applying a modified Black-Scholes pricing valuation model. The application of this valuation model involves assumptions that are judgmental and highly sensitive in the determination of share-based compensation, including expected stock price volatility. The assumptions used in determining the fair value of options granted in the last three fiscal years and a summary of the methodology applied to develop each assumption are as follows:
36
|
2010
|
2009
|
2008
|
||||||||||
|
Expected price volatility
|
48.93 | % | 36.60 | % | 25.64 | % | ||||||
|
Risk-free interest rate
|
1.48 | % | 2.54 | % | 4.79 | % | ||||||
|
Weighted average expected lives in years
|
4.8 | 4.5 | 3.8 | |||||||||
|
Dividend yield
|
0.00 | % | 0.00 | % | 0.00 | % | ||||||
EXPECTED PRICE VOLATILITY -- This is a measure of the amount by which a price has fluctuated or is expected to fluctuate. The Company uses actual historical changes in the market value of its stock to calculate expected price volatility because management believes that this is the best indicator of future volatility. The Company calculates monthly market value changes from the date of grant over a past period to determine volatility. An increase in the expected volatility will increase share-based compensation.
RISK-FREE INTEREST RATE -- This is the applicable U.S. Treasury rate for the date of the grant over the expected term. An increase in the risk-free interest rate will increase share-based compensation.
EXPECTED LIVES -- This is the period of time over which the options granted are expected to remain outstanding and is based on management’s expectations in relation to the holders of the options. Options granted have a maximum term of five years. An increase in the expected life will increase share-based compensation.
DIVIDEND YIELD --- The Company has not made any dividend payments nor does it have plans to pay dividends in the foreseeable future. An increase in the dividend yield will decrease share-based compensation.
A summary of stock option activity for the Company’s most recent fiscal year is as follows:
|
Weighed
|
||||||||||||||||
|
Weighed
|
Average
|
Aggregate
|
||||||||||||||
|
Number
|
Average
|
Remaining
|
Intrinsic
|
|||||||||||||
|
Of
|
Exercise
|
Contractual
|
Value (in
|
|||||||||||||
|
Shares
|
Price
|
Term
|
thousands)
|
|||||||||||||
|
Outstanding February 1, 2009
|
555,375 | $ | 18.86 | |||||||||||||
|
Granted
|
45,000 | 13.95 | ||||||||||||||
|
Forfeited/Expired
|
(75,500 | ) | 22.67 | |||||||||||||
|
Outstanding January 31, 2010
|
524,875 | $ | 17.99 | 3.0 | $ | - | ||||||||||
|
Vested and expected to vest at January 31, 2010
|
409,900 | $ | 18.00 | 3.0 | $ | - | ||||||||||
|
Exercisable at January 31, 2010
|
181,625 | $ | 23.29 | 2.4 | $ | - | ||||||||||
The aggregate intrinsic values in the table above represent the total difference between the Company's closing stock price on January 31, 2010 and the option respective exercise price, multiplied by the number of in-the-money options as of January 31, 2010. As of January 31, 2010, total estimated unrecognized share-based compensation related to non-vested stock options is $958 with a weighted average recognition period of 2.3 years.
Other information relative to option activity during the fiscal years ended January 31, 2010, February 1, 2009 and February 3, 2008 is as follows:
|
2010
|
2009
|
2008
|
||||||||||
|
Weighted Average Grant Date Fair Value of Stock
|
||||||||||||
|
Options Granted (per share)
|
$ | 5.47 | $ | 4.16 | $ | 10.93 | ||||||
|
Total Fair Value of Stock Options Vested
|
790 | 632 | 1,262 | |||||||||
|
Total Intrinsic Value of Stock Options Exercised
|
- | - | 396 | |||||||||
37
|
11.
|
Quarterly Financial Information (Unaudited)
|
Financial results by quarter are as follows:
|
First
|
Second
|
Third
|
Fourth
|
||||||||||||||
|
Quarter
|
Quarter
|
Quarter
|
Quarter(1)(2)
|
||||||||||||||
|
Fiscal 2010
|
Net sales
|
$ | 115,405 | 125,291 | 111,494 | 136,501 | |||||||||||
|
Gross margin
|
38,537 | 42,411 | 35,659 | 41,905 | |||||||||||||
|
Earnings (loss) from continuing operations
|
(47 | ) | 3,031 | (1,434 | ) | 1,487 | |||||||||||
|
Net earnings (loss)
|
(50 | ) | 3,031 | (1,437 | ) | 1,451 | |||||||||||
|
Net earnings (loss) per share (2):
|
|||||||||||||||||
|
Basic
|
(0.01 | ) | 0.80 | (0.38 | ) | 0.38 | |||||||||||
|
Diluted
|
(0.01 | ) | 0.78 | (0.38 | ) | 0.37 | |||||||||||
|
Fiscal 2009
|
Net sales
|
$ | 105,626 | 129,186 | 114,880 | 140,061 | |||||||||||
|
Gross margin
|
31,723 | 43,318 | 37,124 | 41,654 | |||||||||||||
|
Earnings (loss) from continuing operations
|
(4,316 | ) | 3,452 | (1,503 | ) | (638 | ) | ||||||||||
|
Net earnings (loss)
|
(5,852 | ) | 3,256 | (1,665 | ) | (715 | ) | ||||||||||
|
Net earnings (loss) per share (2):
|
|||||||||||||||||
|
Basic
|
(1.54 | ) | 0.85 | (0.44 | ) | (0.19 | ) | ||||||||||
|
Diluted
|
(1.54 | ) | 0.85 | (0.44 | ) | (0.19 | ) | ||||||||||
|
Fiscal 2008
|
Net sales
|
$ | 105,878 | 118,635 | 109,909 | 147,053 | |||||||||||
|
Gross margin
|
32,710 | 39,353 | 35,711 | 44,506 | |||||||||||||
|
Earnings (loss) from continuing operations
|
(1,815 | ) | 2,981 | (1,379 | ) | 1,003 | |||||||||||
|
Net earnings (loss)
|
(2,232 | ) | 2,594 | (1,635 | ) | 1,049 | |||||||||||
|
Net earnings (loss) per share (2):
|
|||||||||||||||||
|
Basic
|
(0.59 | ) | 0.68 | (0.43 | ) | 0.28 | |||||||||||
|
Diluted
|
(0.59 | ) | 0.67 | (0.43 | ) | 0.27 | |||||||||||
|
(1)
|
Asset impairment charges of $831, $1.3 million and $2.1 million negatively impacted net earnings for fiscal 2010, 2009 and 2008, respectively.
|
|
(2)
|
Earnings per share amounts are computed independently for each of the quarters presented. Therefore, the sum of the quarterly earnings per share in fiscal 2010, 2009 and 2008 does not equal the total computed for the year.
|
||
|
12.
|
Related Party Transactions
|
For five store locations, the Company had a landlord who was a member of the Board of Directors up until the first quarter of fiscal 2009. Operating lease payments to related parties (board member) amounted to approximately $607 in fiscal 2008.
|
13.
|
Business Operations
|
The Company’s business activities include operation of ALCO stores and Duckwall stores. Even though the Company has two types of stores, it is operating them as a single segment.
The Company has many suppliers with which it conducts business. For fiscal years 2010 and 2009, only one vendor represented approximately 5% of the Company's merchandise purchases. For both years, the supplier was Proctor & Gamble. The loss of this one vendor would not have adverse effects on the ability to obtain like products and overall results of operations.
For fiscal 2010, 2009 and 2008, the percentage of sales by product category were as follows:
|
Percentage of Sales
|
||||||||||||
|
2010
|
2009
|
2008
|
||||||||||
|
Merchandise Category:
|
||||||||||||
|
Consumables and commodities
|
34 | % | 32 | % | 34 | % | ||||||
|
Hardlines
|
33 | % | 33 | % | 34 | % | ||||||
|
Apparel and accessories
|
17 | % | 19 | % | 19 | % | ||||||
|
Home furnishings and décor
|
16 | % | 16 | % | 13 | % | ||||||
|
Total
|
100 | % | 100 | % | 100 | % | ||||||
|
ITEM 9.
|
CHANGES IN AND DISAGREEMENTS WITH ACCOUNTANTS ON ACCOUNTING AND FINANCIAL DISCLOSURE
|
None
38
ITEM 9A. CONTROLS AND PROCEDURES
(a) Evaluation of Disclosure Controls and Procedures
Under the supervision and with the participation of our management, including our principal executive officer and principal financial officer, we conducted an evaluation of the effectiveness of the design and operation of our disclosure controls and procedures (as defined in Rules 13a-15(e) and 15d-15(e) under the Securities Exchange Act of 1934, as amended) as of the end of the period covered by this report. Based on that evaluation, our principal executive officer and principal financial officer concluded that our disclosure controls and procedures were effective as of the end of the period covered by this report, to ensure that information required to be disclosed in our reports filed or submitted under the Exchange Act is (1) recorded, processed, summarized and reported within the time periods specified in the Securities and Exchange Commission’s rules and forms and (2) accumulated and communicated to the Company’s management, including our principal executive officer and principal financial officer, as appropriate to allow timely decisions regarding required disclosure.
(b) Management’s Report on Internal Control over Financial Reporting
Management of the Company is responsible for establishing and maintaining internal control over financial reporting as defined in Rule 13a-15(f) under the Securities and Exchange Act of 1934, as amended. The Company’s internal control system is a process designed to provide reasonable assurance regarding the reliability of financial reporting and the preparation of financial statements for external reporting purposes in accordance with U.S. GAAP. Because of its inherent limitations, internal control over financial reporting may not prevent or detect misstatements. Also, projections of any evaluation of effectiveness to future periods are subject to the risk that controls may become inadequate because of changes in conditions, or that the degree of compliance with the policies or procedures may deteriorate.
Management assessed the effectiveness of the Company’s internal control over financial reporting as of January 31, 2010 based on the criteria established in Internal Control- Integrated Framework issued by the Committee of Sponsoring Organizations of the Treadway Commission (“COSO”). As a result of this assessment, management concluded that the Company’s internal control over financial reporting was effective as of January 31, 2010.
Our independent auditor, KPMG LLP, the independent registered public accounting firm that audited the financial statements included in this report on Form 10-K and, as part of its audit, has issued an attestation report, included herein, on the effectiveness of our internal control over financial reporting.
(c) Changes in Internal Control over Financial Reporting
There have been no changes in our internal control over financial reporting during fiscal 2010 that have materially affected or are reasonably likely to materially affect our internal control over financial reporting.
(d) Report of Independent Registered Public Accounting Firm
The Board of Directors and Stockholders
Duckwall-ALCO Stores, Inc.:
We have audited Duckwall-ALCO Stores, Inc. (the Company’s) internal control over financial reporting as of January 31, 2010, based on criteria established in Internal Control – Integrated Framework, issued by the Committee of Sponsoring Organizations of the Treadway Commission (COSO). The Company’s management is responsible for maintaining effective internal control over financial reporting and for its assessment of the effectiveness of internal control over financial reporting, included in the accompanying Item 9A(b), Management’s Report on Internal Control over Financial Reporting. Our responsibility is to express an opinion on the Company’s internal control over financial reporting based on our audit.
We conducted our audit in accordance with the standards of the Public Company Accounting Oversight Board (United States). Those standards require that we plan and perform the audit to obtain reasonable assurance about whether effective internal control over financial reporting was maintained in all material respects. Our audit included obtaining an understanding of internal control over financial reporting, assessing the risk that a material weakness exists, and testing and evaluating the design and operating effectiveness of internal control based on the assessed risk. Our audit also included performing such other procedures as we considered necessary in the circumstances. We believe that our audit provides a reasonable basis for our opinion.
A company’s internal control over financial reporting is a process designed to provide reasonable assurance regarding the reliability of financial reporting and the preparation of consolidated financial statements for external purposes in accordance with generally accepted accounting principles. A company’s internal control over financial reporting includes those policies and procedures that (1) pertain to the maintenance of records that, in reasonable detail, accurately and fairly reflect the transactions and dispositions of the assets of the company; (2) provide reasonable assurance that transactions are recorded as necessary to permit preparation of financial statements in accordance with generally accepted accounting principles, and that receipts and expenditures of the company are being made only in accordance with authorizations of management and directors of the company; and (3) provide reasonable assurance regarding prevention or timely detection of unauthorized acquisition, use, or disposition of the company’s assets that could have a material effect on the financial statements.
Because of its inherent limitations, internal control over financial reporting may not prevent or detect misstatements. Also, projections of any evaluation of effectiveness to future periods are subject to the risk that controls may become inadequate because of changes in conditions, or that the degree of compliance with the policies or procedures may deteriorate.
In our opinion, the Company maintained, in all material respects, effective internal control over financial reporting as of January 31, 2010, based on criteria established in Internal Control – Integrated Framework, issued by the Committee of Sponsoring Organizations of the Treadway Commission.
39
We also have audited, in accordance with the standards of the Public Company Accounting Oversight Board (United States), the consolidated balance sheets of the Company as of January 31, 2010 and February 1, 2009, and the related consolidated statements of operations, stockholders’ equity, and cash flows for each of the years in the three-year period ended January 31, 2010, and our report dated April 15, 2010 expressed an unqualified opinion on those consolidated financial statements.
/s/ KPMG LLP
Kansas City, Missouri
April 15, 2010
ITEM 9B. OTHER INFORMATION
None
PART III
ITEM 10. DIRECTORS, EXECUTIVE OFFICERS AND CORPORATE GOVERNANCE OF THE REGISTRANT
For information with respect to the Company’s Directors, the Board of Directors’ Audit Committee, the Board of Directors' Nominating Committee and the written code of ethics, see the information provided in the “Proposal One – Election of Directors”, “Information About Directors Nominees”, "Information about the Nominating Committee", “Code of Ethics” and “Certain Information Concerning the Board and Its Committees” sections of the Proxy Statement for the Annual Meeting of Stockholders on or about June 3, 2010, which information is incorporated herein by reference. For information with respect to Section 16 reports, see the information provided in the “Section 16(a) Beneficial Ownership Reporting Compliance” section of the Proxy Statement for the Annual Meeting of Stockholders on or about June 4, 2009, which information is incorporated herein by reference.
The Company’s executive officers as of April 15, 2010, are as follows:
|
Name
|
Age
|
Position
|
|||
|
Richard E. Wilson
|
48 |
President - Chief Executive Officer
|
|||
|
Jane F. Gilmartin
|
54 |
Executive Vice President
|
|||
|
Donny R. Johnson
|
49 |
Executive Vice President
|
|||
|
Edmond C. Beaith
|
46 |
Senior Vice President
|
|||
|
Tom L. Canfield
|
56 |
Senior Vice President
|
|||
Except as set forth below, all of the executive officers have been associated with the Company in their present position or other capacity for more than the past five years. There are no family relationships among the executive officers of the Company.
Richard E. Wilson has served as President and Chief Executive Officer of the Company since February 15, 2010. Prior to, from December, 2007 until he joined the Company, Mr. Wilson served as Principal of Corporate Alliance Group, a management consulting company specializing in marketing, product development, planning, strategy and brand management for the retail and wholesale trade. Prior to forming Corporate Alliance Group, Mr. Wilson was Senior Vice President, General Merchandise, for BJ’s Wholesale Club from May, 2005 to February, 2007. From August, 2003 to April, 2005, Mr. Wilson was Senior Vice President, Home Furnishings for the Macy’s division of Federated Department Stores, Inc., the parent company of department stores such as Macy’s and Bloomingdales. Mr. Wilson has also previously served as an executive with the Filene’s division of May Department Stores.
Jane F. Gilmartin has served as Executive Vice President and Chief Operating Officer of the Company since July 24, 2008. From July 2006 to February 2007, Ms. Gilmartin served as Senior Vice President and Chief Merchandising Officer of Levitz Furniture, Inc. Prior thereto, Ms. Gilmartin served as Executive Vice President and Chief Merchandising Officer for Linens ‘N Things from August 2005 to March 2006, Senior Vice President of Ross Stores, Inc. from November 2003 to August 2005, and Chief Executive Officer, Chairman and President of International Art, Inc. from January 2002 to November 2003. Ms. Gilmartin has approximately 30 years experience in the retail industry.
Donny R. Johnson has served as Executive Vice President, Chief Financial Officer of the Company since July 1, 2008. Mr. Johnson served as the Company’s Interim Chief Executive Officer from February 22, 2008 to June 30, 2008. Mr. Johnson served as Senior Vice President, Chief Financial Officer from August 1, 2007 until February 21, 2008. For the five years prior to that, he was Executive Vice President and Chief Financial Officer for Brookshire Brothers. Mr. Johnson has approximately 20 years experience in the retail industry.
Edmond C. (Ted) Beaith has served as Senior Vice President and Chief Information Officer since August 25, 2008. From August 2007, Mr. Beaith was the Senior Retail Practice Manager - Western US for Capgemini USA, after serving as Managing Principal of the Retail Consulting Group of Agilysys, Inc., from April 2001 to July 2007. Prior to his consulting career, Mr. Beaith has approximately 20 years in retail experience, including roles as Chief Information Officer of Brookshire Brothers and the Kohlberg Grocery Companies.
Tom L. Canfield, Jr. has served as Senior Vice President, Logistics and Administration since 2006. From 1973 to 2006, Mr. Canfield served in various capacities with the Company. Mr. Canfield has approximately 35 years of experience in the retail industry.
40
ITEM 11. EXECUTIVE COMPENSATION
The Registrant's Proxy Statement to be used in connection with the Annual Meeting of Stockholders to be held on or about June 3, 2010, contains under the caption “Executive Compensation and Other Information” the information required by Item 11 of Form 10-K, and such information is incorporated herein by this reference.
ITEM 12. SECURITY OWNERSHIP OF CERTAIN BENEFICIAL OWNERS AND MANAGEMENT AND RELATED STOCKHOLDER
MATTERS
The Registrant's Proxy Statement to be used in connection with the Annual Meeting of Stockholders to be held on or about June 3, 2010, contains under the caption “Security Ownership of Certain Beneficial Owners, Directors and Management” the information required by Item 12 of Form 10-K and such information is incorporated herein by this reference.
ITEM 13. CERTAIN RELATIONSHIPS AND RELATED TRANSACTIONS AND DIRECTOR INDEPENDENCE
The Registrant's Proxy Statement to be used in connection with the Annual Meeting of Stockholders to be held on or about June 3, 2010, contains under the captions “Related Party Transactions" and "Certain Information Concerning the Board and Its Committees” the information required by Item 13 of Form 10-K and such information is incorporated herein by this reference.
ITEM 14. PRINCIPAL ACCOUNTANT FEES AND SERVICES
The Registrant's Proxy Statement to be used in connection with the Annual Meeting of Stockholders to be held on or about June 3, 2010, contains under the caption “Ratification of Selection of Independent Public Accountants” the information required by Item 14 of Form 10-K and such information is incorporated herein by this reference.
PART IV
ITEM 15. EXHIBITS AND FINANCIAL STATEMENT SCHEDULES
|
(a)
|
Documents filed as part of this report
|
|
(1)
|
Consolidated Financial Statements
|
|
The financial statements are listed in the index for Item 8 of this Form 10-K.
|
|
|
(2)
|
Financial Statement Schedules
|
|
All schedules are omitted because they are inapplicable, not required, or the information is included elsewhere in the Consolidated Financial Statements or the notes thereto.
|
|
|
(3)
|
Exhibits
|
|
The exhibits filed with or incorporated by reference in this report are listed below:
|
Number Description
| 3.1 |
Articles of Incorporation of Duckwall-ALCO Stores, Inc., amended as of June 13, 1994 and restated solely for filing with the Securities and Exchange Commission (filed as Exhibit 3.1 to Company's Quarterly Report on Form 10-Q for the fiscal quarter ended August 1, 2004 and incorporated herein by reference).
|
|
|
3.2
|
Bylaws of Duckwall-ALCO Stores, Inc. (filed as Exhibit 3.2 to Company's Quarterly Report on Form 10-Q for the fiscal quarter ended August 1, 2004 and incorporated herein by reference).
|
|
|
4.1
|
Specimen of Duckwall-ALCO Stores, Inc. Common Stock Certificate. (filed as Exhibit 4.1 to Company’s Quarterly Report on Form 10-Q for the fiscal quarter ended August 3, 2008 and incorporated herein by reference).
|
|
|
4.2
|
Reference is made to the Amended and Restated Articles of Incorporation described under 3.1 above and Bylaws described under 3.2 above.
|
|
|
10.1
|
Employment Agreement dated January 5, 2006 between the Company and Tom L. Canfield, Jr. is incorporated as Exhibit 10.1.
|
|
|
10.2
|
Employment Agreement dated August 1, 2007 between the Company and Donny R. Johnson is incorporated as Exhibit 10.2.
|
|
|
10.3
|
Employment Agreement dated January 5, 2006 between the Company and Jon A. Ramsey is incorporated as Exhibit 10.3.
|
|
|
10.4
|
Addendum to Employment Agreement dated December 31, 2008 between the Company and Tom L. Canfield, Jr. is incorporated as Exhibit 10.4.
|
|
|
10.5
|
Addendum to Employment Agreement dated December 31, 2008 between the Company and Donny R. Johnson is incorporated as Exhibit 10.5.
|
|
|
10.6
|
Addendum to Employment Agreement dated December 31, 2008 between the Company and Jon A. Ramsey is incorporated as Exhibit 10.6.
|
|
41
|
10.7
|
Employment Agreement dated August 25, 2008 between the Company and Edmond C. Beaith is incorporated by reference to Exhibit 10.7 to the Current Report on Form 8-K of the Company dated August 25, 2008.
|
|
10.8
|
Separation Agreement and Release, dated as of August 1, 2008, between the Company and Anthony C. Corradi, including consulting agreement is incorporated by reference to Exhibit 10.8 to the Current Report on Form 8-K of the Company dated August 1, 2008.
|
|
10.9
|
Employment Agreement dated December 11, 2009 between the Company and James M. Spencer is incorporated by reference to Exhibit 10.9 to the Current Report on Form 8-K of the Company dated December 17, 2009.
|
|
10.10
|
Separation Agreement and Release, dated as of February 4, 2009, between the Company and Phillip D. Hixon is incorporated by reference to Exhibit 10.10 to the Current Report on Form 8-K of the Company dated February 4, 2009.
|
|
10.11
|
Addendum to Employment Agreement effective as of May 31, 2009 between the Company and Mr. Zigerelli is incorporated by reference to Exhibit 10.11 to the Current Report on Form 8-K of the Company dated June 3, 2009.
|
|
10.12
|
Addendum to Employment Agreement effective as of May 31, 2009 between the Company and Ms. Gilmartin is incorporated by reference to Exhibit 10.12 to the Current Report on Form 8-K of the Company dated June 3, 2009.
|
|
10.13
|
Departure of Directors or Certain Officers; Election of Directors; Appointment of Certain Officers; Compensatory Arrangements is incorporated by reference to Exhibit 10.13 to the Current Report on Form 8-K of the Company dated January 12, 2010. On December 31, 2009, Royce Winsten, the Chairman of the Board of Directors of the Company, was awarded a special bonus for the amount of $50,000.
|
|
10.14
|
Separation Release, dated as of February 1, 2010, between the Company and James M. Spencer, is incorporated by reference to Exhibit 10.14 to the Current Report on Form 8-K of the Company dated February 1, 2010.
|
|
10.15
|
Loan and Security Agreement, dated as of February 10, 2010, between the Company and Bank of America, N.A., and Wells Fargo Retail Finance, LLC.
|
|
10.16
|
Employment Agreement dated December 11, 2009 between the Company and Richard E. Wilson is incorporated by reference to Exhibit 10.16 to the Current Report on Form 8-K of the Company dated February 25, 2010.
|
|
10.17
|
Resignation of Director. On March 2, 2010 James V. Worth resigned from the Board of Directors is incorporated by reference to Exhibit 10.17 to the Current Report on Form 8-K of the Company dated March 2, 2010.
|
|
10.18
|
Separation Agreement and Release, dated as of March 17, 2010, between the Company and Lawrence J. Zigerelli, is incorporated by reference to Exhibit 10.18 to the Current Report on Form 8-K of the Company dated March 16, 2010.
|
|
23.1
|
Consent of Independent Registered Public Accounting Firm.
|
|
31.1
|
Certification of Chief Executive Officer of Duckwall-ALCO Stores, Inc. dated April 15, 2010, pursuant to Rule 13a-4(a) under the Securities Exchange Act of 1934, as adopted pursuant to Section 302 of the Sarbanes-Oxley Act of 2003.
|
|
31.2
|
Certification of Chief Financial Officer of Duckwall-ALCO Stores, Inc. dated April 15, 2010, pursuant to Rule 13a-4(a) under the Securities Exchange Act of 1934, as adopted pursuant to Section 302 of the Sarbanes-Oxley Act of 2003.
|
|
32.1
|
Certification of Chief Executive Officer of Duckwall-ALCO Stores, Inc, dated April 15, 2010, pursuant to 18 U.S.C. Section 1350, as adopted pursuant to Section 906 of the Sarbanes-Oxley Act of 2002, which is furnished with this Annual Report on Form 10-K for the year ended January 31, 2010 and is not treated as filed in reliance upon § 601(b)(32) of Regulations S-K.
|
|
32.2
|
Certification of Chief Financial Officer of Duckwall-ALCO Stores, Inc., dated April 15, 2010, pursuant to 18 U.S.C. Section 1350, as adopted pursuant to Section 906 of the Sarbanes-Oxley Act of 2002, which is furnished with this Annual Report on Form 10-K for the year ended January 31, 2010 and is not treated as filed in reliance upon § 601(b)(32) of Regulations S-K.
|
42
SIGNATURES
Pursuant to the requirements of Section 13 or 15(d) of the Securities and Exchange Act of 1934, the registrant has duly caused this report to be signed on its behalf by the undersigned, thereunto duly authorized.
DUCKWALL-ALCO STORES, INC.
by /s/ Richard E. Wilson
President and Chief Executive Officer
Dated: April 15, 2010
Pursuant to the requirements of the Securities Exchange Act of 1934, this report has been signed below by the following persons on behalf of the registrant and in the capacities and on the dates indicated:
|
Signature and Title
|
Date
|
|||
|
/s/ Richard E. Wilson
|
April 15, 2010
|
|||
|
Richard E. Wilson
|
||||
|
President and Chief Executive Officer
|
||||
|
(Principal Executive Officer)
|
||||
|
/s/ Donny R. Johnson
|
April 15, 2010
|
|||
|
Donny R. Johnson
|
||||
|
Executive Vice President - Chief Financial Officer
|
||||
|
(Principal Financial and Accounting Officer)
|
||||
|
/s/ Raymond A.D. French
|
April 15, 2010
|
|||
|
Raymond A.D. French
|
||||
|
Director
|
||||
|
/s/ Dennis E. Logue
|
April 15, 2010
|
|||
|
Dennis E. Logue
|
||||
|
Director
|
||||
|
/s/ Lolan C. Mackey
|
April 15, 2010
|
|||
|
Lolan C. Mackey
|
||||
|
Director
|
||||
|
/s/ Royce L. Winsten
|
April 15, 2010
|
|||
|
Royce L. Winsten
|
||||
|
Director - Chairman of Board
|
43