Attached files
| file | filename |
|---|---|
| 8-K - FORM 8-K - ALLSCRIPTS HEALTHCARE SOLUTIONS, INC. | d8k.htm |
| EX-99.1 - APRIL 7, 2010 EARNINGS CALL TRANSCRIPT - ALLSCRIPTS HEALTHCARE SOLUTIONS, INC. | dex991.htm |
 Allscripts
Investor
Presentation
–
April,
2010
Exhibit 99.2 |
 2
Forward Looking Statements
This press release contains forward-looking statements within the meaning of the federal securities
laws. Statements regarding future events, developments, the Company's future performance, as well
as management's expectations, beliefs, intentions, plans, estimates or projections relating to
the future are forward-looking statements within the meaning of these laws. These
forward-looking statements are subject to a number of risks and uncertainties, some of which
are outlined below. As a result, actual results may vary materially from those anticipated by
the forward-looking statements. Among the important factors that could cause actual results to differ
materially from those indicated by such forward-looking statements are: the volume and timing of
systems sales and installations; length of sales cycles and the installation process; the
possibility that products will not achieve or sustain market acceptance; the timing, cost and
success or failure of new product and service introductions, development and product upgrade
releases; the impact of the securities class action and other pending or threatened litigation;
competitive pressures including product offerings, pricing and promotional activities; our ability
to establish and maintain strategic relationships; undetected errors or similar problems in our
software products; compliance with existing laws, regulations and industry initiatives and
future changes in laws or regulations in the healthcare industry; possible regulation of the
Company's software by the U.S. Food and Drug Administration; failure to achieve certification
under the Health Information Technology for Economic and Clinical Health Act could result in
increased development costs, a breach of some customer obligations and put Allscripts at a competitive
disadvantage in the marketplace; unexpected requirements to achieve interoperability certification
pursuant to The Certification Commission for Healthcare Information Technology could result in
increased development and other costs for Allscripts; the possibility of product-related
liabilities; our ability to attract and retain qualified personnel; our ability to identify and
complete acquisitions, manage our growth and integrate acquisitions; the ability to recognize
the benefits of the merger with Misys Healthcare Systems, LLC ("Misys"); the integration of Misys with
the Company and the possible disruption of current plans and operations as a result thereof; the
implementation and speed of acceptance of the electronic record provisions of the American
Recovery and Reinvestment Act of 2009; maintaining our intellectual property rights and
litigation involving intellectual property rights; risks related to third-party suppliers;
our ability to obtain, use or successfully integrate third-party licensed technology; breach of
our security by third parties; and the risk factors detailed from time to time in our reports filed
with the Securities and Exchange Commission, including our 2009 Annual Report on Form 10-K
available through the Web site maintained by the Securities and Exchange Commission at
www.sec.gov. The Company undertakes no obligation to update publicly any forward-looking
statement, whether as a result of new information, future events or otherwise.
|
 3
Agenda
›
Market Opportunity
›
“The Time is Now”
›
Why Allscripts?
›
Financial Update |
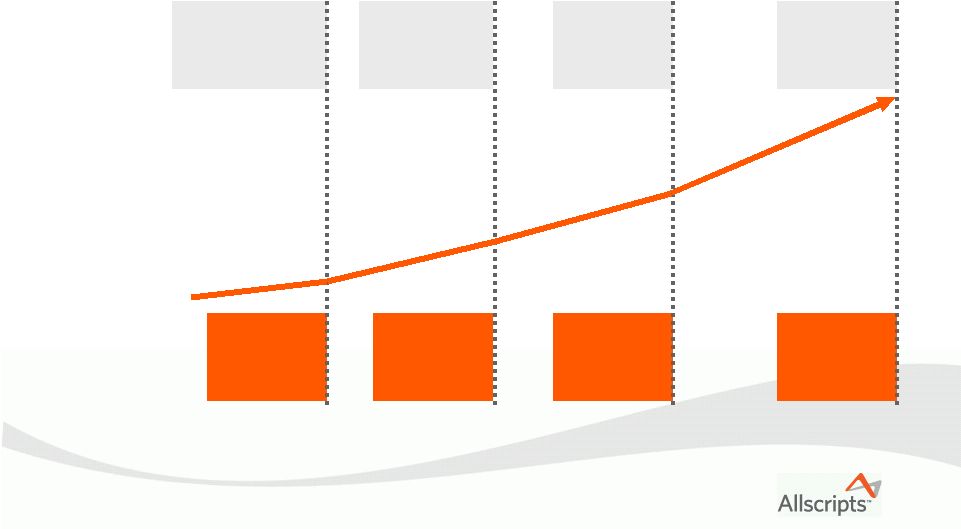
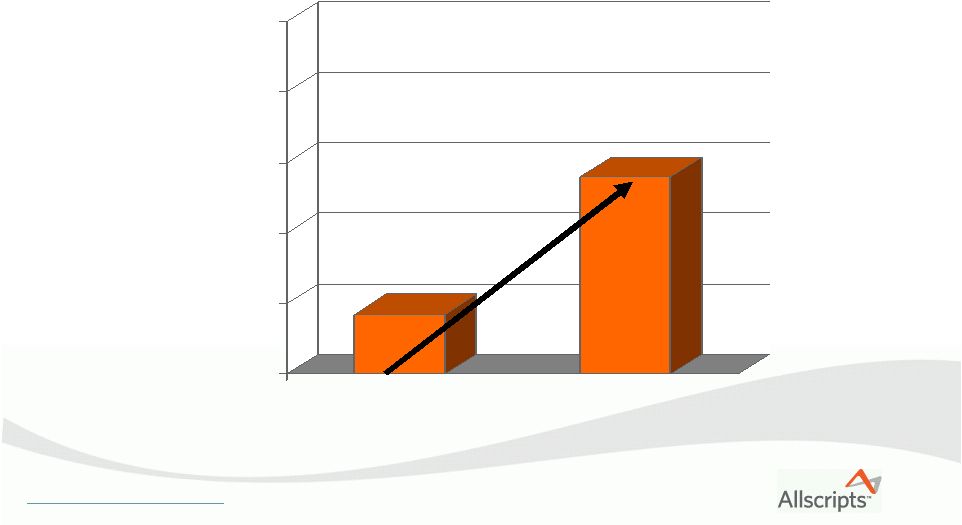
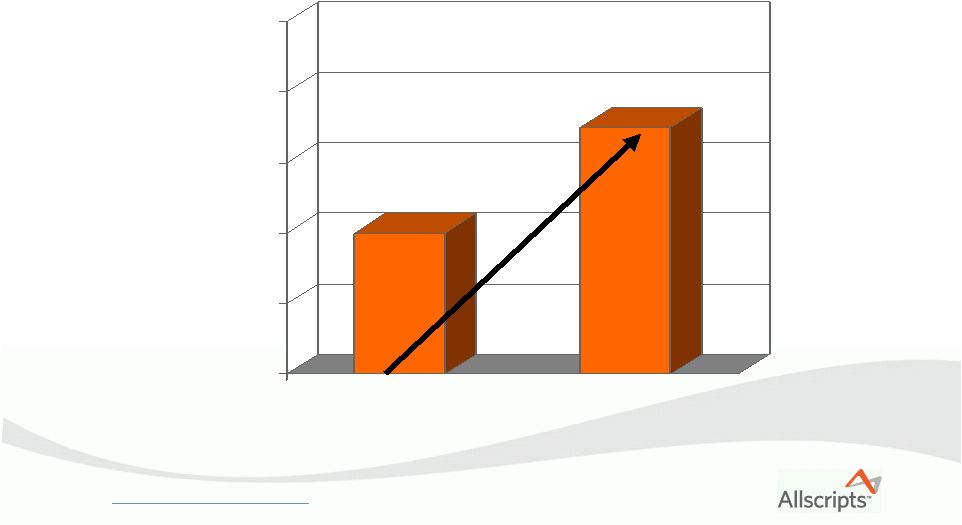
 We
are at the beginning of what we expect will be the
single
fastest transformation
of any industry in US history |
 5
2010: The “Year of the EHR” |
 6
2010: The Year of the EHR
<20
%
Approx. 20% EHR
Physician Penetration
-Early Adopters
~
$30B
~$30 Billion in
Federal Funding
70
%
70% of Funding Will Be
Spent
in First 3 Years
Lower IT Investment in Healthcare Than Any Other Sector of Economy
Sources: United States Dept. of Health and Human Services: Fiscal Year 2010
Budget in Brief, ARRA Centers for Disease Control and Prevention
|
 7
Market Potential
Practice Size
Total # of Practices
EHR Penetration
(FY08/09)
1-3 Physicians
163,000
~10%
4-9 Physician
27,000
~20%
10-25 Physicians
8,000
~25%
26+ Physicians
2,000
~40%
Total
200,000
~12%
Source: SK&A = SK&A Information Services which sells databases for sales
and marketing success in healthcare industry 7 |
 8
Once in a Lifetime Opportunity… |
 9
Meaningful Use 101: Key Components
›
The EHR Must be Certified
& Include e-Prescribing
›
The EHR Must be Connected
›
The EHR Must Include Reporting Capabilities on Clinical
Quality Metrics
›
The EHR Must be Used in a Meaningful Way |
 10
“If you wait to purchase an EHR until the rules are final ...
I will put my reputation on the line and say that you will
not achieve meaningful use in 2011.”
Dr. Mark Leavitt
Chair of CCHIT
February 2010
The Time is Now… |
 11
70% of
Funding
Used
2013
First
Checks
Cut
Q1
2011
ARRA
Announced
Q1
2009
MU
Finalized
Q1
2010
Catalysts for EHR Adoption
~20%
Physician
Penetration(a)
(a) ~20% estimate based on number of ambulatory physicians; penetration as a
percentage of number of physician practices, is approximatley ~12%
|
 |
 13
Go…
$44,000 to $64,000/MD &
$2,000,000/Hospital |
 14
Guarantee our EHRs will meet the MU
certification criteria
The Assurance
Go… |
 15
Go…
The Assurance
Set by Allscripts Clients:
160,000 MDs
800 Hospitals
8,000 Post Acute Care Facilities |
 16
Why Allscripts?
›
Leadership
The clear leader in providing innovative software, connectivity and
information solutions that empower physicians and other healthcare
providers
to
improve
the
health
of
both
their
patients
and
their
bottom
line
›
A Safe Choice
Financially Strong
Revenue of ~ $700 mm
R&D F2010 ~$70 mm
›
People & Experience |
 17
Our Footprint…
160,000 Physicians
8,000 Post-Acute Providers
800 Hospitals
and 80 million Rx… |
 18
Comprehensive Portfolio…
Across the Continuum of Care |
 19 |
 20
An Industry-Leading Portfolio |
 21
Connect |
 22
Powerful Engine to Drive Sales
Hospital/Community Distribution Partners
Exclusive Relationships: Henry Schein; Cardinal Health
Allscripts
Distribution Network
~250 Direct Sales Professionals
Direct Marketing |
 23
Our Approach –
Allscripts Everywhere
MyWay
& Professional
•
Certification
Guarantee
•
Regional Extension
Center Strategy
•
Leverage installed
base
•
Distribution Network
•
Turn-key to Live
Professional & Enterprise
•
Certification Guarantee
•
Community Partners
•
Leverage installed base
•
Distribution Network
•
READY
Enterprise
•
Surround Suite
•
Community Partners
•
CONNECT
•
READY
1-3
Physicians
4-25
Physicians
25+
Physicians &
Community |
    Summary -
Unparalleled Market Opportunity
Rapid Transformation
The Choice is Allscripts
Allscripts –
“Built to Last” |
 25
Financial Overview |
 26
Allscripts –
Financial Highlights
Bookings Momentum
$297 mm –
28% growth fiscal YTD
~$720.0 mm Revenue Run Rate
Top Line Visibility
63% recurring revenue in 3Q Fiscal 2010
Significant Mix of SaaS Bookings
22% in most recent quarter; 24% YTD
source of recurring revenue
Improving Gross Margins
56.5% in Q3 vs. 51.8% year-ago
Significant Operating Leverage
Substantial R&D Expenditures
estimated $70 mm or ~10% of Fiscal 2010 Revenue
Strong Financial Position |
 27
Fiscal 3Q 2010 & YTD Bookings Results
% Change
2/28/09
2/28/10
Nine Months Ended
+28%
+25%
% Change
$231.5
$84.4
2/28/09
Total Bookings
Total Bookings
Quarter Ended
$296.8
$105.5
2/28/10
Strong 3Q and YTD bookings across all product offerings
|
 28
Fiscal 3Q 2010 Revenue and Net Income
+39%
$13.3
$18.5
Net Income
+33%
$0.09
$0.12
EPS
+12%
$160.7
$179.9
Revenue
-
65%
65%
% YTD Recurring Revenue
% Change
Q3 ‘09
Q3 ‘10 |
 29
Fiscal 3Q 2010
Non-GAAP(a)
Revenue and Net Income
+18%
$21.7
$25.6
Non-GAAP Net Income(a)
+21%
$0.14
$0.17
Non-GAAP EPS (a)
+16%
$155.3
$180.4
Non-GAAP Revenue(a)
-
65%
65%
% YTD Recurring Revenue
% Change
Q3 ‘09
Q3 ‘10
(a) Please see reconciliation and footnotes in appendix to this presentation
regarding non-GAAP revenue, net income and diluted earnings per share
for the three months ended February 28, 2010 and 2009. Information
also available at http://investor.allscripts.com
|
 30
Non-GAAP(a) Gross Profit Margin
Improvement: Q3 2010 vs. Q3 2009
50%
52%
54%
56%
58%
60%
(a) Please see reconciliation and footnotes in appendix to this presentation
regarding non-GAAP gross profit margin for the three months ended
February 28, 2010 and 2009. Additional information also available at
http://investor.allscripts.com Q3 F2009
56.6%
Q3 F2010
54.5%
+210 BPS |
 31
Non-GAAP(a) Net Income Growth:
Q3 2010 vs. Q3 2009
$20.0
$22.0
$24.0
$26.0
$28.0
$30.0
(a) Please see reconciliation and footnotes in appendix to this presentation
regarding non-GAAP net income for the three months ended February 28,
2010 and 2009. Additional information also available at
http://investor.allscripts.com
Q3 F2009
$21.7mm
$25.6 mm
Q3 F2010
+18% Growth |
 32
Non-GAAP(a) Diluted Earnings Per Share:
Q3 2010 vs. Q3 2009
$0.10
$0.12
$0.14
$0.16
$0.18
$0.20
(a) Please see reconciliation and footnotes in appendix to this presentation
regarding non-GAAP diluted earnings per share for the three months ended
February 28, 2010 and 2009 . Additional information also available at
http://investor.allscripts.com Q3 F2009
$0.14
$0.17
Q3 F2010
+21% Growth |
 33
Fiscal 2010 Outlook
$105.0 -
$112.0
Bookings(a)
$0.64 -
$0.65
Non-GAAP diluted EPS(b)
~150.0
Adjusted Weighted Diluted Shares
Outstanding
$700.0 -
$705.0
Revenue
$67.0 -
$68.5
Net income
$97.0 -
$98.5
Non-GAAP net income(b)
$0.44 -
$0.45
2010E
Diluted EPS
Financial Metrics
(a)
Bookings guidance range for fourth quarter ending May 31, 2010
(b)
Please see reconciliation and footnotes in appendix to this presentation regarding
non-GAAP net income and EPS for the year ending May 31, 2010.
Information also available at http://investor.allscripts.com |
    Summary -
Excellent Sales Momentum
Large Mix of Recurring Revenue =
Excellent Top Line Visibility
Operating Leverage
Superior Long-Term Financial Model
Allscripts –
“Built to Last” |
 |
 36
Appendix: Non-GAAP Reconciliation
GAAP –
non-GAAP revenue reconciliation for the three months ended February 28, 2009
and 2010.
$180.4
$155.3
Revenue, non-GAAP
-
(8.5)
Elimination of prepackaged medications
0.5
3.1
Deferred revenue adjustment
$179.9
$160.7
Revenue, as reported
Revenue
Feb-10
Feb-09
2010
2009
Q3
Q3 |
 37
Appendix: Non-GAAP Reconciliation
GAAP –
non-GAAP gross profit margin reconciliation for the three months ended
February 28, 2009 and 2010.
0.5
3.1
Deferred revenue adjustment
56.6%
54.5%
% of non-GAAP revenue
$102.2
$84.6
Gross profit, non-GAAP
-
(1.8)
Elimination of prepackaged medications
56.5%
51.8%
% of revenue
$101.7
$83.3
Gross profit, as reported
Gross profit
Feb-10
Feb-09
2010
2009
Q3
Q3 |
 38
Appendix: Non-GAAP Reconciliation
GAAP –
non-GAAP EPS reconciliation for the three months ended February 28, 2009 and
2010. $25.6
$21.7
Net income, non-GAAP
$0.17
$0.14
Net income per share, non-GAAP, diluted
(4.0)
(5.5)
Non-GAAP adjustments tax effected at 39%
for 2010 & 40% for 2009
$0.12
$0.09
Net income per share, as reported, diluted
0.7
-
Tax rate alignment
-
3.5
Transaction-related expense
5.6
6.1
Acquisition-related amortization expense
4.3
2.2
Stock based compensation
0.5
3.1
Deferred revenue adjustment
-
(1.0)
Elimination of prepackaged medications
$ 18.5
$ 13.3
Net income, as reported
Net income
Feb-10
Feb-09
2010
2009
Q3
Q3 |
 39
Appendix: Non-GAAP Reconciliation
GAAP –
non-GAAP Net Income and EPS reconciliation for the year ended May 31, 2009 and
2010 4.9
7.8
Deferred revenue adjustment
$0.64 to $0.65
$0.65
$0.61
Non-GAAP EPS
150.7
126.3
Share count
$97.0 to $98.5
$98.0
$76.8
Non-GAAP Net income
(19.3)
(29.9)
Tax effect of non-GAAP
adjustments (41% in 2009 and
39% in 2010)
5.3
39.9
Transaction-related expense
22.6
20.4
Acquisition-related amortization
expense
16.5
8.2
Stock based compensation
-
(2.3)
Elimination of prepackaged
medications
-
6.7
Allscripts pre-merger
Adjustments*
$0.44 to $0.45
$0.45
$0.21
GAAP EPS
$67.0 to $68.5
$68.0
$26.0
Net income
Guidance Range
Fiscal 2010
Guidance
Fiscal 2009 |
 40
Basis of Presentation
The Company's GAAP results for the three and nine months ended February 28, 2010
include results of Allscripts for each such period. The Company's GAAP
results for the three and nine months ended February 28, 2009 include the
results of Misys Healthcare (Misys)
for
each
period
and
the
results
of
Allscripts
subsequent
to
a
merger
effected
on
October
10,
2008,
at
which
time
the
Company's
legal
name
was
changed
to
Allscripts-
Misys Healthcare Solutions, Inc.
Supplemental and non-GAAP financial information is also available at
http://investor.allscripts.com.
Please see next page for a further discussion of non-GAAP
measures. |
 41
Explanation of Non-GAAP Financial Measures
›
Allscripts reports its financial results in accordance with generally accepted
accounting principles, or GAAP. To supplement this information, Allscripts
presents in this press release non-GAAP revenue, gross profit and net income, including non-GAAP net income on
a per share basis, which are non-GAAP financial measures under Section 101 of
Regulation G under the Securities Exchange Act of 1934, as amended.
Non-GAAP revenue consists of GAAP revenue as reported and legacy Allscripts revenue for periods prior to the
consummation date of the Merger and adds back the acquisition related deferred
revenue adjustment booked for GAAP purposes and excludes revenue from
prepackaged medications. Non-GAAP gross profit consists of GAAP gross profit as reported and legacy Allscripts
gross profit for periods prior to the consummation date of the Merger and adds back
the acquisition related deferred revenue adjustment booked for GAAP purposes
and excludes revenue from prepackaged medications. Non-GAAP net income consists of GAAP net income
as reported and includes legacy Allscripts net income for periods prior to the
consummation date of the Merger, excludes acquisition- related
amortization, stock-based compensation expense and transaction-related expenses, adds back the acquisition related deferred
revenue adjustment and excludes net income from prepackaged medications, in each
case net of any related tax effects. Acquisition-Related Amortization.
Acquisition-related amortization expense is a non-cash expense arising from the acquisition of
intangible assets in connection with acquisitions or investments. Allscripts
excludes acquisition-related amortization expense from non-GAAP net
income because it believes (i) the amount of such expenses in any specific period may not directly correlate to the
underlying performance of Allscripts business operations and (ii) such expenses
can vary significantly between periods as a result of
new
acquisitions
and
full
amortization
of
previously
acquired
intangible
assets.
Management
believes
that
this
adjustment
facilitates comparisons of the separate pre-merger results of legacy Misys and
legacy Allscripts to that of the Company's post- merger results.
Investors should note that the use of these intangible assets contributed to revenue in the periods presented and
will contribute to future revenue generation and should also note that such
expense will recur in future periods. Stock-Based Compensation Expense.
Stock-based compensation expense is a non-cash expense arising from the grant of stock
awards to employees. Allscripts excludes stock-based compensation expense from
non-GAAP net income because it believes (i) the amount of such expenses
in any specific period may not directly correlate to the underlying performance of Allscripts business
operations
and
(ii)
such
expenses
can
vary
significantly
between
periods
as
a
result
of
the
timing
of
grants
of
new
stock-based
awards, including grants in connection with acquisitions. Investors should note
that stock-based compensation is a key incentive offered to employees
whose efforts contributed to the operating results in the periods presented and are expected to contribute to
operating results in future periods and should also note that such expense will
recur in future periods. Transaction-Related Expenses.
Transaction-related expenses are fees and expenses, including legal, investment banking and
accounting fees, incurred in connection with announced transactions. Allscripts
excludes transaction-related expenses from non- GAAP net income
because it believes (i) the amount of such expenses in any specific period may not directly correlate to the
underlying performance of Allscripts business operations and (ii) such expenses
can vary significantly between periods Acquisition Related Deferred Revenue
Adjustment. Deferred revenue adjustment reflects the fair value adjustment to deferred
revenues acquired in connection with the Merger. The fair value of deferred
revenue represents an amount equivalent to the estimated cost plus an
appropriate profit margin, to perform services related to legacy Allscripts software and product support,
which
assumes
a
legal
obligation
to
do
so,
based
on
the
deferred
revenue
balances
as
of
October
10,
2008.
Allscripts
adds
back
this deferred revenue adjustment for non-GAAP revenue and non-GAAP net
income because it believes the inclusion of this amount directly correlates
to the underlying performance of Allscripts operations and facilitates comparisons of the separate pre-
merger results of legacy Misys and legacy Allscripts to that of the Company's
post-merger results. Tax Rate Alignment. Tax adjustment to align
the current fiscal quarter's effective tax rate to the expected annual effective tax rate. |