Attached files
SECURITIES AND EXCHANGE
COMMISSION
Washington, D.C. 20549
Washington, D.C. 20549
———————
FORM 10-K
———————
FORM 10-K
———————
| x |
ANNUAL REPORT PURSUANT TO SECTION 13 OR
15(d) OF THE SECURITIES EXCHANGE ACT OF 1934
|
|
|
-For the fiscal
year ended January 31, 2010
|
||
| o |
TRANSITION REPORT PURSUANT TO SECTION 13
OR 15(d) OF THE SECURITIES EXCHANGE ACT OF
1934
|
|
Commission File
Number: 0-21393
———————
SEACHANGE INTERNATIONAL, INC.
(Exact name of registrant as specified in its charter)
———————
SEACHANGE INTERNATIONAL, INC.
(Exact name of registrant as specified in its charter)
———————
| Delaware (State or other jurisdiction of incorporation or organization) |
04-3197974 (IRS Employer Identification No.) |
50 Nagog Park, Acton, MA
01720
(Address of principal executive offices, including zip code)
(Address of principal executive offices, including zip code)
(978)-897-0100
(Registrant’s telephone number, including area code)
(Registrant’s telephone number, including area code)
Securities Registered Pursuant To Section
12(b) Of The Act:
Common Stock, $.01 par
value
Securities Registered Pursuant To Section
12(g) Of The Act:
None
———————
———————
Indicate by check mark if the registrant is a well-known seasoned issuer,
as defined in Rule 405 of the Securities Act. Yes o No x
Indicate by check mark if the
registrant is not required to file reports pursuant to Section 13 or Section
15(d) of the Act. Yes o
No x
Indicate by check mark whether the
registrant: (1) has filed all reports required to be filed by Section 13 or
15(d) of the Securities Exchange Act of 1934 during the preceding 12 months (or
for such shorter period that the registrant was required to file such reports),
and (2) has been subject to such filing requirements for the past 90 days.
Yes x No o
Indicate by check mark whether the registrant has submitted
electronically and posted on its corporate Web site, if any, every Interactive
Data File required to be submitted and posted pursuant to Rule 405 of Regulation
S-T during the preceding 12 months (or for such shorter period that the
registrant was required to submit and post such files). Yes o No o
Indicate by check mark whether the registrant is a large accelerated
filer, an accelerated filer, a non-accelerated filer, or a smaller reporting
company. See the definitions of “large accelerated filer,” “accelerated filer”
and “smaller reporting company” in Rule 12b-2 of the Exchange Act.
| Large accelerated filer o | Accelerated filer x |
| Non-accelerated filer o | Smaller reporting company o |
Indicate by check mark whether the registrant is a shell company (as
defined in Rule 12b-2 of the Exchange Act). Yes o No x
As of July 31, 2009, the aggregate
market value of the voting stock held by non-affiliates of the registrant, based
upon the closing price for the registrant’s Common Stock on the Nasdaq Global
Select Market on such date was $260,485,787. The number of shares of the
registrant’s Common Stock outstanding as of the close of business on March 25,
2010 was 31,072,068.
DOCUMENTS INCORPORATED BY
REFERENCE:
Portions of the definitive Proxy Statement (which is expected to be filed
within 120 days after the Company’s fiscal year end) relating to the
registrant’s Annual Meeting of Stockholders to be held on or about July 15, 2010
to be filed pursuant to Regulation 14A are incorporated by reference into Part
III of this Annual Report on Form 10-K.
PART I
ITEM 1. Business
SeaChange International, Inc. (“SeaChange”, “we” or “us”), a Delaware
corporation founded on July 9, 1993, is a leading developer, manufacturer and
marketer of digital video systems and services. These products and services
facilitate the aggregation, licensing, storage, management and distribution of
video, television programming and advertising content. We sell our products and
services worldwide to cable system operators, including Cablevision, Comcast,
Cox Communications, Virgin Media, and Rogers; telecommunications companies,
including Telekom Austria, Turk Telekom and Verizon Communications; and
broadcast television companies, including ABC Disney, Ascent Media, Clear
Channel, China Central Television and Viacom.
Our digital video systems are designed to enable our customers to reduce
subscriber turnover and access new revenue-generating opportunities from
subscribers, advertisers and electronic commerce initiatives. Using our products
and services, we believe our customers can increase their revenues by offering
additional services such as on demand television, which allows, for example, the
operator to offer a variety of programming for viewing whenever a subscriber
chooses and incorporates the ability for subscribers to pause, rewind and
fast-forward on demand content. Our systems also allow our customers to insert
advertising into broadcast and on demand programming. Our advertising systems
allow our customers to target advertising segments to specific subscribers in a
particular geographic and/or demographic market. In addition, our systems enable
broadband system operators to offer other interactive television services that
allow subscribers to customize and/or dynamically interact with their
television, enhancing their viewing experience.
The primary thrust of our business has been supplying systems to deliver
video assets in the evolving “On Demand” television environment. Through
acquisitions and partnerships we have expanded our capabilities, products and
services to address the needs of video content owners, broadcasters, and content
aggregators, and to address the delivery of content to devices other than the
television, such as mobile phones and PCs. Our products and services include
hardware and software for content management and delivery systems, middleware
that drives set top box applications such as games, advertising systems that
help pay for content and services that involve the acquisition and distribution
of video content. We believe that our strategy of expanding our product line
will position SeaChange to support and maintain our existing customer base, take
advantage of new customers entering the on demand marketplace and to enter
adjacent markets.
Our core technologies provide a foundation for products and services that
can be deployed in next generation systems capable of increased levels of
subscriber interactivity. We have received several awards for technological
excellence, including Emmy Awards for our patented MediaCluster ® technology and for our
role in the growth of video on demand.
Industry Background
Cable System Operators and
Telecommunications Companies
According to SNL Kagan, the number of households paying for TV access
today, such as cable subscription but excluding satellite, has been estimated at
111 million in the Americas and approximately 600 million worldwide. Over the
last several years, cable system operators and telecommunications companies have
spent billions of dollars to upgrade their networks from analog to digital,
yielding a significant increase in available bandwidth, channel capacity and
two-way interactive capability. We believe this investment reflects their intent
to provide video on demand, advertising insertion, internet access and other
value-added services to their customers that will differentiate them from
competing service providers, including satellite delivery systems.
2
In 2001, North American cable system operators and telecommunications
companies began the deployment of residential video on demand capability
allowing subscribers to watch video programming at any time with pause, rewind,
fast forward and a number of additional interactive capabilities. All of the
major North American cable system operators have deployed video on demand
services in one or more major residential markets. The various on demand
applications offered by cable system operators and, increasingly,
telecommunications operators, include movies-on-demand, subscription video on
demand, such as Home Box Office (HBO), as well as news, sports, music videos,
games, niche programming and time-shifted broadcast programming.
Cable companies have also begun to market telephone services. In
response, telecommunications operators, notably AT&T and Verizon in the
U.S., are aggressively providing competitive digital television and video
services. Elsewhere, international telecommunications companies with high-speed
network capacity are actively exploring and launching similar television
services.
In addition, because cable television programming is transmitted over
broadband (high bandwidth networks), cable system and telecom operators have the
opportunity to segment and target their programming to viewers in selected
geographies. In the future, we believe that the ability of operators to target
viewers will extend to individual household-level targeting of advertisements in
video on demand applications, generating revenue which may help support the
worldwide deployment and growth of video on demand content and
services.
Increased demand for video and audio content over the internet will also
require a substantial increase in storage capacity and bandwidth over time. We
believe that cable system operators and telecommunications companies will play
an integral role in providing these broadband internet applications. We also
believe that in order to offer high quality video applications over the
internet, cable system operators and telecommunications companies will need more
storage and delivery systems capable of complex management and scheduling of
video streams.
Broadcast Television
Companies
Both domestically and internationally, broadcast television companies
face a number of new challenges to their business. In digital broadcasting,
changing ownership trends, new consumer alternatives (e.g., cable television,
satellite television, or internet) and evolving viewership models (e.g.,
Personal Video Recorders (PVR), cell phones, Personal Digital Assistants (PDA),
etc.) are creating a more complex competitive environment for our customers that
calls for greater efficiencies and business innovation. We believe broadcast
television companies are therefore turning away from their out-dated tape-based
systems with robotic libraries, which are cumbersome and require high levels of
maintenance and manual intervention.
Some television broadcasters are using digital bandwidth to originate
multiple program streams. As this application further develops, television
broadcasters will require more video storage and delivery systems that can
effectively manage and deliver these multiple television signals. As a result,
we believe that television broadcasters will continue to automate their entire
programming and advertising to reduce overall operating costs and improve
reliability. We expect new opportunities to emerge for broadcasters and video on
demand operators to create new business synergies that will likely require
digital video storage and delivery systems.
SeaChange Business
Segments
In fiscal 2009, we realigned our business segments and financial
reporting structure to better portray the Company’s strategic direction and
potential areas for growth. The Company now reports its financial results within
three segments: Software, Servers and Storage, and Media Services. Financial
information about our business segments is included in Management’s Discussion
and Analysis of Financial Condition and Results of Operations and the
Consolidated Financial Statements.
3
| Year ended January 31, | |||||||||||||||||
| 2010 | 2009 | 2008 | |||||||||||||||
| Amount | % | Amount | % | Amount | % | ||||||||||||
| (in thousands, except percentages) | |||||||||||||||||
| Revenues by segment: | |||||||||||||||||
| Software | $ | 131,314 | 65 | % | $ | 132,237 | 65 | % | $ | 113,269 | 63 | % | |||||
| Servers and Storage | 50,557 | 25 | % | 53,640 | 27 | % | 48,997 | 27 | % | ||||||||
| Media Services | 19,794 | 10 | % | 15,959 | 8 | % | 17,627 | 10 | % | ||||||||
| Total | $ | 201,665 | $ | 201,836 | $ | 179,893 | |||||||||||
Software
In 2006, we began selling our
SeaChange Axiom®
On Demand software independent of our hardware and offering subscription
services for the software in an effort to increase market share and enhance
revenue stability through more recurring revenues. Additionally, by porting our
software to other third party hardware platforms, we expect to increase our
market share with opportunities at competitive vendors’
installations.
We also develop, sell and support
software products in the middleware and advertising categories. Our middleware
and application business is focused on producing set-top box client middleware
software products and end-to-end interactive television applications, and
performing system integration and software customization services. Our client
middleware solutions include the VODlink® Platform Suite built
for and deployed on common North American cable set top boxes, and the TV
Navigator™ platform deployed in Europe and Asia.
Our advertising insertion software
products are available for both the traditional analog environment (the way that
video signals have been transmitted for the past 60 years), and for the digital
environment, which provides the cable operator with a significant increase in
available bandwidth, channel capacity and two-way capability. Based on currently
available industry sources and our internal data, we believe our Spot System is
the leading analog video insertion system in the United States in the
multichannel television market for advertisements and other short-form video.
Over the last several years, our customers have begun to migrate to digital
video ad insertion, and we believe our digital video ad insertion system is
establishing a strong market position as well. Our SeaChange AdPulse™ On Demand
Advertising software platform allows operators to generate new advertising
revenue from inserting ads, dynamically, in on demand content while it provides
detailed tracking and reporting on views and usage of inserted ads.
In September of 2009 we acquired a
private software company, eventIS Group B.V. (“eventIS”), in Eindhoven, the
Netherlands. eventIS is Europe’s leading provider of video on demand back-office
software supporting operators in 25 countries. This software complements and
extends the capabilities of our video on demand products.
We expect that eventIS’s
leading market position in Europe will foster increased revenue growth as
VOD investments in Europe are forecasted to grow significantly over the
next several years. According to SNL Kagan, there are 80 million cable
television subscribers in Europe compared to 70 million in the United States.
However, unlike in the U.S., digital cable penetration rates are quite low.
Penetration rates in Europe are expected to rise with the increased investments
in VOD products and services from European cable television
providers.
In February 2010, we acquired
VividLogic Inc (“VividLogic”), a private California software provider.
VividLogic’s products and services will allow the Company to expand its software
product portfolio to participate more competitively in the middleware and home
network markets. VividLogic provides applications and development services for
Consumer Electronics (“CE”) manufacturers, cable television, equipment
manufacturers and cable television providers. VividLogic’s software products and
services focus on home networking applications and “tru2way” development. In the
home networking area, VividLogic’s emphasis is on the development of software to
meet the content protection requirements under the IEEE 1394 requirements. In
addition, VividLogic is working with CE manufacturers and service providers to
develop software to be used in next generation home media gateways. In the
tru2way area, VividLogic provides products and services for CE and set top box
manufacturers who are looking to migrate their hardware for tru2way capability.
Tru2way is a technology software platform sponsored by the U.S. cable
television industry that is expected to foster interactive television
applications for consumers.
4
Revenue sources from the Software
segment fall into two categories:
- product revenues such as
licensing, and software development for those products; and
- related services such as subscriptions (annual software subscriptions for upgrades), professional services, installation, training, project management, product maintenance, and technical support for those software products.
Servers and
Storage
Combining the advantages of standards-based hardware with our patented
MediaCluster®
technology, our hardware products deliver high-density streaming, clustered
ingest and scalable storage for video on demand, time-shifted TV, network PVR
(Personal Video Recorder) applications, as well as broadcast play to air and
archiving.
Revenue sources for our Servers and Storage segment fall into several
categories. New deployments are typically sold on a capacity basis and include
one year of maintenance. As our customers add more content and more users, they
return to purchase more streaming and storage capacity. The additional content
usually also leads to increased usage levels by the subscribers which also
translates in to add-on-sales. Recurring revenue consists of maintenance
contracts after the first year.
We offer several configurations of our MediaCluster video servers to meet
the evolving needs of our customers for independently scalable ingest, streaming
and storage.
Servers and Storage segment
includes:
- product revenues from video on
demand (“VOD”) and broadcast server product lines and
- related services such as professional services, installation, training, project management, product maintenance, and technical support for those products.
Media Services
Through the acquisitions of On Demand Group Limited (ODG), in fiscal
2006, and Mobix Interactive Ltd., in fiscal 2009, SeaChange expanded its media
content services, consisting of content aggregation and distribution. ODG is a
leader in Europe in the development and deployment of Pay TV services. This
division specializes in aggregating content for video on demand and Pay-Per-View
platforms, and provides marketing, promotional and production services to cable
operators and telecommunications providers throughout Europe.
As an example, we source, acquire, package, and market Virgin Media’s
video on demand services by providing access to content from local and Hollywood
studio providers in multiple formats including music, television programs and
feature length movies. Through ODG, we have a content rights management system
and a content preparation center for incorporating video content for VOD
services from the major content suppliers around the world.
Revenue from the Media Services
segment is generated from customer contracts depending on the services
rendered.
Key Products and Services
SeaChange Video On Demand
System
We have developed and are deploying a video on demand system to cable
television companies and telecommunications companies. Our video on demand
system consists of:
5
- MediaCluster video servers that
reside at various points in a broadband network system and are used to ingest,
store and play or stream videos as requested;
- SeaChange Axiom® On Demand video
software to manage and control the system and to support integration with
third-party systems and applications;
- Spot Advertising Systems hardware
and software and AdPulse On Demand Advertising System;
- Interactive middleware that
enables operators to run multiple services, including video on demand and
personal video recorders on multiple platforms;
- Record System, a time-shifting
television application that enables broadcasted programming to be
automatically encoded by broadband operators, with complete trick-mode
functionality (fast-forward, pause and rewind); and
- Interfaces to digital headend modulators, control systems and subscriber management systems.
Our video on demand system allows our customers to offer interactive
services such as the following to their subscribers:
- Video on demand. This interactive service allows
residential users and commercial users (e.g., hotel guests) to review lists of
available movies and/or programming content, order individual movies and/or
programs and view them in real-time. Users have full control over the video
stream.
- Subscription Video on
demand. This service
provides premium channel offerings, such as those offered by HBO, Showtime or
Starz, in an on-demand manner, as well as on a scheduled basis. Similar to our
video on demand service, our subscription video on demand service allows
subscribers to review lists of available premium channel content, order
individual programs and watch them at home with full video player
control.
- Networked Digital Video Recording.
This service provides
users with interactive control over broadcasted television programming,
enabling viewers to watch sports, news, and other program types with full
video cassette recorder and personal video recorder-like (e.g., TiVo® recorders) control
over the video stream. We enable the provision of this service through our
servers and software located in broadband local transmission sites known as
headends. We believe this service also has the potential to accommodate new
advertising techniques, such as ad replacement or limited fast-forward
functionality.
- Targeted and Interactive Advertising.
This service supports
interactive advertising or advertising where the subscriber controls the path
and delivery of an advertisement, in a video on demand service and in other
forms of programming that result in a dedicated communications link between
the subscribers’ set top box and the video on demand system itself. This
service allows purchases over the television, such as one might do with a web
browser over the internet.
- DVD Now™ on Demand Service. This interactive service brings DVD functionality to video on demand applications and provides a common standard for distributing and presenting video content. Our software tools and applications provide the capability to transform DVDs, including their menus and content chapter and options, into video on demand applications.
SeaChange Axiom® On
Demand video software is
the end-to-end business solution for video on demand services. Software modules
act in unison to manage and automate every aspect of operations – streams,
subscribers, billing, network load and more. The product is built on an open
architecture, meaning it can be deployed by any service provider regardless of
streaming, storage or network architectures. SeaChange Axiom On Demand video
software is comprised of three components:
6
- On Demand Services manage and deliver rich media content to a
variety of consumer devices.
- Personalized Applications Platform
enables operators to provide
subscribers with innovative services such as games and movies on
demand.
- Advanced Management Tools give operators the ability to reduce their costs and garner operational efficiencies through sophisticated system management tools.
SeaChange Axiom On Demand Services consist of the essential functions that manage
core on demand network resources such as servers, bandwidth and storage. Modules
administer network bandwidth through session and resource management to ensure
efficient content delivery. Content propagation optimizes both network usage and
storage by continually monitoring demand for content, and moving content to
locations where it is needed most. The Connection Manager Service software
mediates client requests, establishing the shortest path between the client and
the requested content. Asset Management is responsible for managing the life
cycle of content stored on the system. The Asset Manager provides full
visibility into the location and state of the content in the system through a
browser-based graphical user interface (GUI). Additional Axiom On Demand
Services include the Recording System that captures broadcast programs and
publishes them as VOD content and the Axiom Content Dynamics module that
automates dynamic insertion of advertisement and other content into VOD
streams.
SeaChange Axiom Personalized Applications software provides a broad range of on-demand
applications to enhance the viewer experience.
SeaChange Axiom Advance Management Tools provide engineering and operations personnel
with tools that aid in the control of the system. Problem identification and
resolution, data warehouse management, subscriber management and a configuration
suite all help in reducing operational costs while improving overall system
efficiencies.
Advertising
Products
Our family of Spot Systems automates the complex process of advertisement
and other video insertion across multiple channels and geographic zones for
cable system operators and telecommunications providers. Through our embedded
proprietary software, our Spot System allows cable system and telecom operators
to insert local and regional advertisements and other videos into a specific
time allocated by television networks such as CNN, MTV, ESPN, BET, Discovery
Channel and Nickelodeon. The Spot System is capable of inserting advertising
into digital and analog channels including HD and delivering targeted
advertising, as well as advertising with interactive links to content on video
on demand systems, as well as to other interactive advertising
systems.
The Spot System is an integrated solution comprised of hardware
platforms, software applications, data networks and easy to use graphical
interfaces. Our Spot System is designed to be installed at local transmission
sites, known as headends, and advertising sales business offices. Our video
insertion process consists of six steps:
- Encoding. The process begins with our encoding
software, which in real time transforms and compresses analog to digital
short- and long-form video.
- Storage. Our Spot System organizes, manages and
stores these video streams in a disk-based video library capable of storing
thousands of advertisements.
- Scheduling. Our advertising management software
coordinates with the traffic and billing application to determine the
designated time slot, channel and geographic zone for each video
stream.
- Distribution. Our strategic digital video software then
copies the video files from the master video library and distributes them over
the operator’s data network to appropriate headends, where they are stored in
video servers for future play.
- Insertion. Following a network cue, our video switch
module automatically inserts the video stream into the network feed
(initiating the analog conversion, if necessary), where they are then seen by
television viewers.
- Verification. After the video streams run, our proprietary software and hardware verifies the content, accuracy, timing and placement of these video streams to facilitate proper customer billing.
7
SeaChange AdPulse™ On Demand Advertising
System
The SeaChange AdPulse System consists of an advertising and inventory
management system called the SeaChange AdPulse On Demand Ad Manager and a
package of enhancements for the core VOD system called SeaChange Axiom® Content Dynamics
software that provide functions tailored to the special needs of managing,
propagating, playing out and tracking of ads.
Key features of the AdPulse On
Demand Ad Manager include:
- Inventory Management—the ability
to define advertising avails (slots) in on demand content. The inventory is
managed by creating an inventory definition that specifies a content group (by
program, provider, or content category) to which the inventory definition will
apply, then specifying the number and placement of ad breaks and the number of
spots per break for programs in that content group.
- Order Entry—the ability to specify
the rules by which different ad copy will be inserted into on demand content
by assigning advertising copy to defined inventory.
- Dynamic Ad Placement Decisions—the
ability to modify a playlist at run-time to add, delete, or change ads played
with assets based on defined ad placement rules.
- Interior Ad Breaks – ad insertion
and /or replacement at ad breaks within an on demand content stream if
interior ad breaks are marked with SCTE-35 descriptors.
- Operational Reporting—the ability
to view and track aspects of the overall operation of the SeaChange AdPulse
Manager, such as whether advertising copy required to execute an order has
been received and propagated.
- Business Reporting—the ability to
view and track specific business aspects of the SeaChange AdPulse Manager,
such as which inventory has been sold and which is unsold, a summary of orders
from a specific client, etc.
- Verification Reporting—the ability to track and view data about execution of orders, views of ad copy, and user action during the ad views.
This system allows operators to generate new advertising revenue
inserting ads, dynamically, in on demand content while it provides detailed
tracking and reporting on views and usage of inserted ads. During 2007,
we saw the first commercial deployment of our SeaChange AdPulse On Demand
advertising software platform. Since then, we have had successful trials and
deployments with several operators including: Virgin Media, Cox Communications,
and Sunflower Broadband.
SeaChange Middleware Software
Products
Middleware provides seamless, access across devices made by different
manufacturers to content across wired and/or wireless devices. We offer two
middleware software products to operators and content developers: VODlink
software and TV Navigator software.
SeaChange VODlink
software is comprised of three software modules that work together to enhance
the user experience. The three components: VODlink Platform Suite, VODlink
Portal and VODlink Games help operators jump-start their VOD offerings with a
collection of games, a pop-up portal to ease navigation and provide marketing of
content, and a suite of tools that allow easy development and integration of
custom applications.
8
SeaChange TV Navigator software is a platform that incorporates an optional
Electronic Program Guide (EPG – the user interface) that is completely
customizable, communications applications such as TV-mail, chat, ticker display
and messaging, and audience measurement tools that collect and report on usage
statistics.
SeaChange Servers and
Storage
Designed for enterprise-wide video system deployments the patented
SeaChange MediaCluster architecture delivers massive, independently scalable,
storage, streaming and ingest capabilities. MediaCluster dramatically reduces
the cost of storing and delivering video assets. We offer several configurations
of the MediaCluster to meet the demands of different video delivery
applications.
SeaChange Flash
MediaServers
Our flash memory-based servers provide 100% non-volatile, diskless edge
streaming, stream expansion and time-shifted TV. These servers allow operators
to deploy diskless streamers at the edge locations and locate centralized
storage and storage management at the head-end locations in their networks. The
Flash MediaServers also reduce operational costs. Compared to traditional
spinning hard disk drives, flash memory has no moving parts, therefore it is
more reliable and consumes less power.
SeaChange MDS
MediaServers
Combining the advantages of standards-based hardware with the SeaChange
patented MediaCluster technology, the MDS products provide high density
streaming, clustered memory ingest and scalable storage. The MDS complements our
widely deployed disk-based video servers while providing independent scalable
streaming, storage and memory and can be deployed as a standalone system or a
streaming booster for existing systems.
Broadcast and Specialty
Servers
Additionally, we supply special function servers based on our
MediaCluster technology for the broadcast industry. Our Broadcast MediaCluster
System is composed of multiple individual video servers arranged in a cluster
acting as one system. This system is designed to provide high-quality digital
video storage and playback for use with automation systems in broadcast
television stations. This product is intended to replace on-air tape decks used
to store and play back advertising, movies and other programming from video tape
cart systems and, in some cases, to replace the cart systems themselves. Our
Broadcast MediaCluster System is designed for customers both in larger broadcast
television markets, which use station automation systems, and in smaller
markets, which use control software included in the system.
As with the video on demand system, our Broadcast MediaCluster System is
designed to simultaneously record, encode, store to a disk and play video
content using compression and decompression hardware. These products seamlessly
integrate into television broadcasters’ current tape-based operations and meet
the high performance requirements of television broadcasters. Our Broadcast
MediaCluster System has features that enable the television broadcaster to have
end-to-end functionality and reliability, including the capability to schedule
programming for a week of television content.
Media Services
The Media Services segment encompasses the business activities of the On
Demand Group and Mobix Interactive, U.K. based wholly-owned subsidiaries of
SeaChange. The Media Services group focuses on the acquisition, licensing,
preparation, management and marketing of content as well as custom consulting
services. Virgin Media in the U.K. is ODG’s largest customer. In the past two
years, ODG also added the Hellenic Telecommunication Organisation (OTE), Telekom
Austria, TTnet, Du Telekom, and Neuf Telecom.
9
ODG also has established joint ventures to provide specialized content
and services. In 2005, ODG launched FilmFlex in the U.K., a joint venture with
Walt Disney and Sony Pictures to provide an on demand movie service to Virgin
Media. In December of 2007, ODG sold its interest in the FilmFlex joint venture
to the other investors for approximately $18 million.
In Germany, ODG entered into a joint venture with the TeleMunchen Gruppe,
a German media company whose activities include the production and acquisition
of German-language feature films, television productions and classical music
programs. This joint venture has launched a pay-per-view service for Kabel
Deutschland Gruppe (KDG). KDG has approximately nine million subscribers and has
begun to deploy digital services. We expect to transition the pay-per-view
service to a full-fledged VOD service as the digital rollout occurs. In addition
to providing pay-per-view services to KDG, the joint venture also provides
pay-per-view services to Unity Media and Telekom Austria. The joint venture also
announced that it will be providing VOD content and services in 2010 to Kabel
BW, one of Germany’s largest cable television operators.
In November 2008, through ODG, we acquired Mobix Interactive Limited in
the U.K. Mobix complements ODG’s television VOD services business by offering
mobile VOD services to wireless network operators. Today, Mobix supports mobile
subscribers for its customers 3 in the U.K. and Vodacom in South Africa.
Service and Support
We install, maintain and support our hardware and software products
worldwide. We offer basic and advanced on-site training for customer employees.
We currently provide installation, maintenance and technical support to all our
customers. We offer maintenance and technical support to customers, agents and
distributors of our hardware, software and systems on a 24-hour, seven-day a
week basis. Generally, our systems sales include at least one year of free
maintenance.
A separate professional services group provides network design and
architecture as well as systems integration services.
Customer support centers worldwide provide 24/7 coverage. We have support
centers in the U.S., the Netherlands, Philippines, China, Japan, U.K., France,
Turkey and Ireland.
Strategy
Our strategy is to be the leading provider of video solutions in the
television industry. We develop, manufacture and market digital video systems
and services that include the management, aggregation, licensing, storage, and
distribution of video, television, gaming and advertising content. The key
elements of our strategy are to:
- Develop, Maintain and Extend
Long-term Customer Relationships. We focus our product development,
marketing and direct sales efforts on maintaining and extending long-term
customer relationships with cable system operators, telecommunications
companies and television broadcasters across the world. We have formed
important relationships with customers that have grown from advertisement and
other short-form video insertion to video on demand systems and other
interactive television services, storage systems and streaming systems. We
believe that the fundamental shift from broadcast to on demand applications
and the growing emphasis on interactive technologies will continue to present
opportunities for us to develop, market and support solutions to our existing
customers as well as to new additional markets.
- Offer Integrated Solutions. Our customers operate complex networks that require the delivery and management of video programming across multiple channels and target zones. We believe that our integrated solutions can provide advantages in cost and implementation for digital video applications while interoperating with existing and emerging third-party equipment and software. To continue to address these needs, we intend to provide and further develop, internally and with our partners, integrated applications and support services for our customers. We believe that providing complete integrated solutions has been a significant factor in our success in the advertising and video on demand markets to date.
10
- Establish and Maintain
Technological Leadership. We believe our competitive position is
dependent in large part on the features and performance of our systems. As a
result, we focus our research and development efforts on introducing systems
with improved hardware and software capabilities. We have been granted patents
and have patents pending for our various technologies. We have received
several awards for technological excellence, including Emmy Awards for our
patented MediaCluster ®
technology and for our
role in the growth of video on demand. As of January 31, 2010, 41% of our
employees were focused on research and product development
efforts.
- Provide Superior Customer Service and Support. Our products operate in customer environments where continuous operation is critical. As a result, we believe that providing a high level of service and support gives us a competitive advantage and is a differentiating factor in developing and maintaining key customer relationships. Our in-depth industry and application knowledge allows us to better understand the service needs of our customers. As of January 31, 2010, 37% of our employees were dedicated to customer service and support, including project design and implementation, maintenance, installation and training. Customers have access to service personnel via 24/7 telephone support. In addition, we believe that the acquisitions and investments that we have made in media services and in system integration and customization services have positioned us as an integral partner with our customers to ensure optimal performance of their systems.
Customers
We currently sell our products
primarily to cable system operators, broadcast and telecommunications
companies.
Our customer base is highly concentrated among a limited number of large
customers, primarily due to the fact that the cable, movie, broadcast, and
telecommunications industries in the United States are dominated by a limited
number of large companies. A significant portion of our revenues across each of
our segments in any given fiscal period have been derived from substantial
orders placed by these large organizations. For the year ended January 31, 2010,
Comcast and Virgin Media comprised 27% and 12%, respectively, of our total
sales. We expect that we will continue to be dependent upon a limited number of
customers for a significant portion of our revenues in future periods. As a
result of this customer concentration, our business, financial condition and
results of operations could be materially adversely affected by the failure of
anticipated orders to materialize and by deferrals or cancellations of orders as
a result of changes in customer requirements or new product announcements or
introductions. In addition, the concentration of customers may cause variations
in revenue, expenses and operating results on a quarterly basis due to
seasonality of orders or the timing and relative size of orders received and
shipped during a fiscal quarter.
We do not believe that our backlog at any particular time is meaningful
as an indicator of our future level of sales for any particular period. Because
of the nature of our products and our use of standard components, substantially
the entire backlog at the end of a quarter can be manufactured and shipped to
the customer before the end of the following quarter. However, because of the
requirements of particular customers these orders may not be shipped or, if
shipped, the related revenues may not be recognized in the ensuing quarter.
Therefore, there is no direct correlation between the backlog at the end of any
quarter and our total sales for the following quarter or other
periods.
Selling and Marketing
We sell and market our products in the United States primarily through a
direct sales organization and internationally through direct sales and
independent agents and distributors, complemented by a coordinated marketing
effort of our product marketing personnel. Direct sales activities in the United
States are conducted from our Massachusetts headquarters and through sales
representatives deployed across the country. We also market certain of our
products to systems integrators and value-added resellers.
In light of the complexity of our digital video products, we primarily
employ a consultative direct sales process. Working closely with customers to
understand and define their needs enables us to obtain better information
regarding market requirements, enhance our expertise in our customers’
industries, and more effectively and precisely convey to customers how our
solutions address the customer’s specific needs. In addition to the direct sales
process, customer references and visits by potential customers to sites where
our products are in place are often critical in the sales process.
11
We use several marketing programs focused on our targeted markets to
support the sale and distribution of our products. We use exhibitions at a
limited number of prominent industry trade shows and conferences and
presentations at technology seminars to promote awareness of us and our
products. We also publish articles in trade and technical journals and we
produce promotional product literature.
Research and Product Development
Our management believes that our success will depend to a substantial
degree upon our ability to develop and introduce in a timely fashion new
integrated solutions and enhancements to our existing products that meet
changing customer requirements in our current and new markets. We have made, and
intend to continue to make, substantial investments in product and technological
development. Our direct sales and marketing groups closely monitor changes in
customer needs, changes in the marketplace and emerging industry standards, and
are therefore better able to focus our research and development efforts to
address these evolving industry requirements.
We believe that the experience of our product development personnel is an
important factor in our success. We perform our research and product development
activities at our headquarters and in offices in New Hampshire, Pennsylvania,
California, the Netherlands, Philippines, and China.
Manufacturing
Our manufacturing operation is located at our facility in Acton,
Massachusetts. This manufacturing operation consists primarily of component and
subassembly procurement, systems integration and final assembly, testing and
quality control of the complete systems. We rely on independent contractors to
manufacture components and subassemblies to our specifications. Each of our
products undergoes testing and quality inspection at the final assembly stage.
Competition
The markets in which we compete are characterized by intense competition,
with a large number of suppliers providing different types of products to
different segments of the markets. In new markets for our products, we compete
principally based on price. In markets in which we have an established presence,
we compete principally on the basis of the breadth of our products’ features and
benefits, including the flexibility, scalability, professional quality, ease of
use, reliability and cost effectiveness of our products, and our reputation and
the depth of our expertise, customer service and support. While we believe that
we currently compete favorably overall with respect to these factors and that
our ability to provide integrated solutions to manage, store and distribute
digital video differentiates us from our competitors, in the future we may not
be able to continue to compete successfully with respect to these factors. In
the market for long-form video products including video on demand, we compete
with various companies offering video server platforms such as Concurrent
Computer Corp., Arris Group Inc. (through its 2007 acquisition of C-Cor
Corporation), Cisco Systems, Inc. (through its 2006 acquisition of Arroyo Video
Solutions, Inc.), Motorola, Inc. (through its 2006 acquisition of Broadbus
Technologies, Inc.) and Ericsson (through its 2007 acquisition of Tandberg
Television). In the television broadcast market, we compete against Thomson,
Omneon Video Networks, Sony Corporation and Harris Incorporated. In the digital
advertisement insertion market, we generally compete with Ericsson and Arris
Group Inc. We expect the competition in each of these markets to intensify in
the future as existing and new competitors with significant market presence and
financial resources, including computer hardware and software companies and
television equipment manufacturers, enter these rapidly evolving markets.
Many of our current and prospective competitors have significantly
greater financial, technical, manufacturing, sales, marketing and other
resources. As a result, these competitors may be able to devote greater
resources to the development, promotion, sale and support of their products.
Moreover, these companies may introduce additional products that are competitive
with ours or enter into strategic relationships to offer complete solutions, and
in the future our products may not be able to compete effectively with these
products.
12
Proprietary Rights
Our success and our ability to compete are dependent, in part, upon our
proprietary rights. We have been granted sixteen U.S. patents and have filed
foreign patent applications related thereto for various technologies developed
and used in our products. In addition, we rely on a combination of contractual
rights, trademark laws, trade secrets and copyright laws to establish and
protect our proprietary rights in our products. It is possible that in the
future not all of these patent applications will be issued or that, if issued,
the validity of these patents would not be upheld. It is also possible that the
steps taken by us to protect our intellectual property will be inadequate to
prevent misappropriation of our technology or that our competitors will
independently develop technologies that are substantially equivalent or superior
to our technology. In addition, the laws of some foreign countries in which our
products are or may be distributed do not protect our proprietary rights to the
same extent as do the laws of the United States. We have been involved in
significant intellectual property litigation, and we may be a party to
litigation in the future to enforce our intellectual property rights or as a
result of an allegation that we infringe others’ intellectual property.
Employees
As of January 31, 2010, we employed 1,223 persons, including 502 in
research and development, 458 in customer service and support, 93 in selling and
marketing, 31 in manufacturing and 139 in general and administration functions.
We believe that our relations with our employees are good. None of our employees
are represented by a collective bargaining agreement.
Geographic Information
Geographic information is included in Management’s Discussion and
Analysis of Financial Condition and Results of Operations and the Consolidated
Financial Statements.
Available Information
SeaChange is subject to the informational requirements pursuant to
Section 13(a) or 15(d) of the Securities Exchange Act of 1934, as amended (the
“Exchange Act”).
SeaChange files periodic reports,
proxy statements and other information with the Securities and Exchange
Commission (SEC). Such reports, proxy statements and other information may be
obtained by visiting the Public Reference Room of the SEC at 100 F Street, N.E.,
Washington, DC 20549 or by calling the SEC at 1-800-SEC-0330. In addition, the
SEC maintains an internet site (http://www.sec.gov) that contains reports, proxy
and information statements and other information regarding issuers that file
electronically.
Financial and other information about SeaChange, including SeaChange’s
Code of Ethics and Business Conduct and charters for SeaChange’s Audit
Committee, Compensation Committee and Corporate Governance and Nominating
Committee, is available on our website (www.schange.com).
We make available free of charge on our website our annual report on Form 10-K,
quarterly reports on Form 10-Q, current reports on Form 8-K and amendments to
those reports filed or furnished pursuant to the Exchange Act as soon as
reasonably practicable after we electronically file such material with, or
furnish it to, the SEC. The information contained on our web site is not
incorporated by reference into this document and should not be considered a part
of this Annual Report. Our web site address is included in this document as an
inactive textual reference only.
13
ITEM 1A. Risk Factors
Any statements contained in this Form 10-K that do not describe
historical facts may constitute forward-looking statements as that term is
defined in the Private Securities Litigation Reform Act of 1995. These
statements relate to future events or our future financial performance and are
identified by words such as “may,” “will,” “could,” “should,” “expect,” “plan,”
“intend,” “seek,” “anticipate,” “believe,” “estimate,” “potential,” or
“continue” or other comparable terms or the negative of those terms.
Forward-looking statements in this Form 10-K include certain statements
regarding the effect of certain accounting standards on our financial position
and results of operations, the effect of certain legal claims against us,
projected changes in our revenues, earnings and expenses, exchange rate
sensitivity, interest rate sensitivity, liquidity, product introductions,
industry changes and general market conditions. Our actual future results may
differ significantly from those stated in any forward-looking statements. Any
such forward-looking statements contained herein are based on current
expectations, but are subject to a number of risks and uncertainties that may
cause actual results to differ materially from expectations. Factors that may
cause such differences include, but are not limited to, the factors discussed
below. Each of these factors, and others, are discussed from time to time in our
filings with the SEC.
Our business is dependent on customers’
continued spending on video systems and services, and reductions by customers in
spending adversely affect our business.
Our performance is dependent on
customers’ continued spending for video systems and services. Spending for these
systems and services is cyclical and can be curtailed or deferred on short
notice. A variety of factors affect the amount of spending, and, therefore, our
sales and profits, including:
- general economic
conditions;
- customer specific financial or
stock market conditions;
- availability and cost of
capital;
- governmental
regulation;
- demand for
services;
- competition from other providers
of video systems and services;
- acceptance of new video systems
and services by our customers; and
- real or perceived trends or uncertainties in these factors.
Any reduction in
spending by our customers would adversely affect our business. We continue to
have limited visibility into the capital spending plans of our current and
prospective customers. Fluctuations in our revenue can lead to even greater
fluctuations in our operating results. Our planned expense levels depend in part
on our expectations of future revenue. Our planned expenses include significant
investments, particularly within the research and development organization,
which we believe are necessary to continue to provide innovative solutions to
meet our current and prospective customers’ needs. As a result, it is difficult
to forecast revenue and operating results. If our revenue and operating results
are below the expectations of our investors and market analysts, it could cause
a decline in the price of our common stock.
Our future success is dependent on the
continued development of the video-on-demand market and if video-on-demand does
not continue to gain broad market acceptance, our business may not continue to
grow.
An increasing portion of our revenue in the last year has come from sales
and services related to our video-on-demand products. However, the
video-on-demand market continues to develop as a commercial market, both within
and outside North America, and may not gain broad market acceptance. The
potential size of the video-on-demand market and the timing of its development
are uncertain. The success of this market requires that broadband system
operators continue to upgrade their cable networks to support digital two-way
transmission service and successfully market video-on-demand and similar
services to their cable television subscribers. Some cable system operators,
particularly outside of North America, are still in the early stages of
commercial deployment of video-on-demand service to major residential cable
markets and, accordingly, to date our digital video systems have been
commercially available only to a limited number of subscribers. Also, the
telecommunications companies have also begun to adapt their networks to support
digital two-way transmission and begun marketing video-on-demand services. If
cable system operators and telecommunications companies fail to make the capital
expenditures necessary to upgrade their networks or determine that broad
deployment of video-on-demand services is not viable as a business proposition
or if our digital video systems cannot support a substantial number of
subscribers while maintaining a high level of performance, our revenues will not
grow as we have planned.
14
Our business is impacted by worldwide economic
cycles, which are difficult to predict.
The global economy and financial markets experienced disruption in 2009,
including, among other things, extreme volatility in security prices, severely
diminished liquidity and credit availability, rating downgrades of certain
investments and declining valuations of others. Governments have taken historic
actions intended to address extreme market conditions that include severely
restricted credit. There may be a further deterioration in financial markets and
confidence in major economies. We are unable to predict the likely duration and
severity of the current disruptions in financial markets, credit availability,
and adverse economic conditions throughout the world. These economic
developments affect businesses such as ours and those of our customers and
vendors in a number of ways that could result in unfavorable consequences to us.
Further disruption and deterioration in economic conditions may reduce customer
purchases of our products and services, thereby reducing our revenues and
earnings. In addition, such adverse decline in economic conditions may, among
other things, result in increased price competition for our products and
services, increased risk in the collectability of our accounts receivable from
our customers, increased risk in potential reserves for doubtful accounts and
write-offs of accounts receivable, and higher operating costs as a percentage of
revenues. In 2009 and 2010, we have taken actions to address the effects of the
economic crisis, including implementing cost control and reduction measures. It
is possible that we may need to take further cost control and reduction
measures. We cannot predict whether these measures will be sufficient to offset
certain of the negative trends that might affect our business.
We have taken measures to address slowdowns in
the market for our products and services, which could have long-term negative
effects on our business or impact our ability to adequately address a rapid
increase in customer demand.
We have taken measures to address slowdowns in the market for our
products and services. These measures include shifting more of our operations to
lower cost regions, outsourcing manufacturing processes, implementing cost
reduction programs, reducing the number of our employees, and reducing planned
capital expenditures and expense budgets. We cannot ensure that the measures we
have taken will not impair our ability to effectively develop and market
products and services, to remain competitive in the industries in which we
compete, to operate effectively, to operate profitably during slowdowns or to
effectively meet a rapid increase in customer demand. These measures may have
long-term negative effects on our business by reducing our pool of technical
talent, decreasing or slowing improvements in our products and services, making
it more difficult to hire and retain talented individuals and to quickly respond
to customers or competitors in an upward cycle.
Because our customer base is highly concentrated among a limited number
of large customers, the loss of or reduced demand of these customers could have
a material adverse effect on our business, financial condition and results of
operations.
Our customer base is highly concentrated among a limited number of large
customers, and, therefore, a limited number of customers account for a
significant percentage of our revenues in any year. We generally do not have
written agreements that require customers to purchase fixed minimum quantities
of our products. Our sales to specific customers tend to vary significantly from
year to year depending upon these customers’ budgets for capital expenditures
and our new product introductions. We believe that a significant amount of our
revenues will continue to be derived from a limited number of large customers in
the future. The loss of, or reduced demand for products or related services
from, any of our major customers could have a material adverse effect on our
business, financial condition and results of operations.
In addition, the industry has experienced consolidation among our
customers which may cause delays or reductions in capital expenditure plans
and/or increased competitive pricing pressures as the number of available
customers decline and their relative purchasing power increases in relation to
suppliers. Any of these factors could adversely affect our business.
15
Cancellation or deferral of purchases of our
products could cause our operating results to be below the expectations of the
public market stock analysts who cover our stock, resulting in a decrease in the
market price of our common stock.
We derive a substantial portion of our revenues from purchase orders that
exceed $1.0 million in value. Therefore, any significant cancellation or
deferral of purchases of our products could have a material adverse effect on
our business, financial condition and results of operations in any particular
quarter due to the resulting decrease in revenue and gross margin and our
relatively fixed costs. In addition, to the extent significant sales occur
earlier than expected, operating results for subsequent quarters may be
adversely affected because our operating costs and expenses are based, in part,
on our expectations of future revenues, and we may be unable to adjust spending
in a timely manner to compensate for any revenue shortfall. Because of these
factors, in some future quarter our operating results may be below the
expectations of public market analysts and investors which may adversely affect
the market price of our common stock.
Timing of significant customer orders may
cause our quarterly operating results to fluctuate, making period-to-period
comparisons of our operating results less meaningful.
We have experienced significant variations in the revenue, expenses and
operating results from quarter to quarter and these variations are likely to
continue. We believe that fluctuations in the number and size of orders
being placed from quarter to quarter are principally attributable to the buying
patterns and budgeting cycles of broadband system operators, including
telecommunications companies, and broadcast companies, the primary buyers of the
digital video-on-demand, advertising and broadcast systems, respectively. We
expect that there will continue to be fluctuations in the number and value of
orders received. As a result, our results of operations have in the past and
likely will, at least in the near future, fluctuate in accordance with this
purchasing activity making period-to-period comparisons of our operating results
less meaningful. In addition, because these factors are difficult for us to
forecast, our business, financial condition and results of operations for one
quarter or a series of quarters may be adversely affected and below the
expectations of public market analysts and investors, resulting in a decrease in
the market price of our common stock.
Due to the lengthy sales cycle involved in the
sale of our products, our quarterly results may vary and should not be relied on
as an indication of future performance.
Digital video-on-demand, advertising, movie and broadcast products are
relatively complex and their purchase generally involve a significant commitment
of capital, with attendant delays frequently associated with large capital
expenditures and implementation procedures within an organization. Moreover, the
purchase of these products typically requires coordination and agreement among a
potential customer’s corporate headquarters and its regional and local
operations. For these and other reasons, the sales cycle associated with the
purchase of our digital video-on-demand, advertising, movie and broadcast
products is typically lengthy and subject to a number of significant risks,
including customers’ budgetary constraints and internal acceptance reviews, over
which we have little or no control. Based upon all of the foregoing, we believe
that our quarterly revenues and operating results are likely to vary
significantly in the future, that period-to-period comparisons of our results of
operations are not necessarily meaningful and that these comparisons should not
be relied upon as indications of future performance.
If there were a decline in demand or average
selling prices for our products, including our Video-On-Demand Systems and
Advertising Systems, our revenues and operating results would be materially
affected.
We expect our VOD and advertising products to continue to account for a
significant portion of our revenues. Accordingly, a decline in demand or average
selling prices for these products, whether as a result of new product
introductions by others, price competition, technological change, inability to
enhance the products in a timely fashion, or otherwise, could have a material
adverse effect on our business, financial condition and results of operations.
If we are unable to manage our growth and the
related expansion in our operations effectively, our business may be harmed
through a diminished ability to monitor and control effectively our operations,
and a decrease in the quality of work and innovation of our employees.
Our ability to successfully offer new products and services and implement
our business plan in a rapidly evolving market requires effective planning and
management. We are also continuing to transition towards greater reliance on our
video-on-demand products and services for an increased portion of our total
revenue. In light of the growing complexities in managing our expanding
portfolio of products and services, our anticipated future operations will
continue to strain our operational and administrative resources. To manage
future growth effectively, we must continue to improve our operational controls
and internal controls over financial reporting, and to integrate the businesses
we have acquired and our new personnel and to manage our expanding international
operations. A failure to manage our growth may harm our business through a
decreased ability to monitor and control effectively our operations, and a
decrease in the quality of work and innovation of our employees upon which our
business is dependent.
16
Because our business is susceptible to risks associated with
international operations, we may not be able to maintain or increase
international sales of our products, and we may not realize the full amount of
the anticipated savings in connection with our continued trend towards the
manufacture and assembly of our products outside of North America and
EMEA.
Our international operations are expected to continue to account for a
significant portion of our business in the future. However, in the future we may
be unable to maintain or increase international sales of our products and
services. Our international operations are subject to a variety of
risks, including:
- difficulties in establishing and
managing international distribution channels;
- difficulties in selling, servicing
and supporting overseas products and in translating products into foreign
languages;
- the uncertainty of laws and
enforcement in certain countries relating to the protection of intellectual
property;
- multiple and possibly overlapping
tax structures;
- negative tax consequences such as
withholding taxes and employer payroll taxes;
- changes in labor laws and
regulations affecting our ability to hire and retain employees;
and
- economic or political changes in international markets.
We are exposed to fluctuations in currency
exchange rates that could negatively impact our financial results and cash
flows.
To date, most of our revenues have been denominated in U.S. dollars,
while a significant portion of our international expenses are incurred in the
local currencies of countries in which we operate. Because a portion of our
business is conducted outside the United States and the post-closing-payments to
the former shareholders of eventIS Group B.V. are partially denominated in
Euros, we face exposure to adverse movements in foreign currency exchange rates.
These exposures may change over time as business practices evolve, and they
could have a material adverse impact on our financial results and cash flows. An
increase in the value of the dollar could increase the real cost to our
customers of our products in those markets outside the United States where we
often sell in dollars, and a weakened dollar could increase local currency
operating costs.
Currency exchange rate fluctuations could
reduce our overall profits.
With the exception of On Demand Group (and its wholly-owned
subsidiaries), eventIS Group B.V. and SeaChange B.V. the United States dollar is
the functional currency for our international subsidiaries; therefore, all
foreign translation currency gains and losses are included in our Consolidated
Statements of Operations. In preparing our consolidated financial statements,
certain financial information is required to be translated from foreign
currencies to the United States dollar using either the spot rate or the
weighted-average exchange rate. If the United States dollar changes relative to
applicable local currencies, there is a risk our reported sales, operating
expenses, and net income could significantly fluctuate. We are not able to
predict the degree of exchange rate fluctuations, nor can we estimate the effect
any future fluctuations may have upon our future operations.
Our ability to compete could be jeopardized if we are unable to protect
our intellectual property rights from third-party
challenges.
Our success and ability to compete depends upon our ability to protect
our proprietary technology that is incorporated into our products. We rely on a
combination of patent, copyright, trademark and trade secret laws and
restrictions on disclosure to protect our intellectual property rights. Although
we have issued patents, we cannot assure that any additional patents will be
issued or that the issued patents will not be invalidated. We also enter into
confidentiality or license agreements with our employees, consultants and
corporate partners, and control access to and distribution of our software,
documentation and other proprietary information. Despite these precautions, it
may be possible for a third party to copy or otherwise misappropriate and use
our products or technology without authorization, particularly in foreign
countries where the laws may not protect our proprietary rights as fully as in
the United States. We may need to resort to litigation in the future to enforce
our intellectual property rights, to protect our trade secrets or to determine
the validity and scope of the proprietary rights of others. If competitors are
able to use our technology, our ability to compete effectively could be
harmed.
17
We have been and in the future could become
subject to litigation regarding intellectual property rights, which could
seriously harm our business and require us to incur significant legal costs to
defend our intellectual property rights.
The industry in which we operate is characterized by vigorous protection
and pursuit of intellectual property rights or positions, which on occasion,
have resulted in significant and often protracted litigation. We have from time
to time received, and may in the future receive, communications from third
parties asserting infringements on patent or other intellectual property rights
covering our products or processes. We have been involved in significant
intellectual property litigation, and we may be a party to litigation in the
future to enforce our intellectual property rights or as a result of an
allegation that we infringe others’ intellectual property. Any parties asserting
that our products infringe upon their proprietary rights would force us to
defend ourselves and possibly our customers or manufacturers against the alleged
infringement, as many of our commercial agreements require us to defend and/or
indemnify the other party against intellectual property infringement claims
brought by a third party with respect to our products. These claims and any
resulting lawsuit, if successful, could subject us to significant liability for
damages and invalidation of our proprietary rights. This possibility of multiple
damages serves to increase the incentive for plaintiffs to bring such
litigation. In addition, these lawsuits, regardless of their success, would
likely be time-consuming and expensive to resolve and would divert management
time and attention away from our operations.
Although we carry general liability insurance, our insurance may not
cover potential claims of this type or may not be adequate to indemnify us for
all liability that may be imposed. In addition, any potential intellectual
property litigation also could force us to stop selling, incorporating or using
the products that use the infringed intellectual property or obtain from the
owner of the infringed intellectual property right a license to sell or use the
relevant technology, although this license may not be available on reasonable
terms, or at all, or redesign those products that use the infringed intellectual
property. If we are forced to take any of the foregoing actions, our business
may be seriously harmed.
If content providers, such as movie studios,
limit the scope of content licensed for use in the digital video-on-demand
market, our business, financial condition and results of operations could be
negatively affected because the potential market for our products would be more
limited than we currently believe and have communicated to the financial
markets.
The success of the video-on-demand market is contingent on content
providers, such as movie studios, permitting their content to be licensed for
use in this market. Content providers may, due to concerns regarding either or
both marketing and illegal duplication of the content, limit the extent to which
they provide content to the video-on-demand market. A limitation of content for
the video-on-demand market would indirectly limit the market for our
video-on-demand system which is used in connection with that market.
If we are unable to successfully introduce new
products or enhancements to existing products, our financial condition and
operating results may be adversely affected by a decrease in sales of our
products.
Because our business plan is based on technological development of new
products and enhancements to our existing products, our future success is
dependent on our successful introduction of these new products and enhancements.
In the future we may experience difficulties that could delay or prevent the
successful development, introduction and marketing of these and other new
products and enhancements, or find that our new products and enhancements do not
adequately meet the requirements of the marketplace or achieve market
acceptance. Announcements of currently planned or other new product offerings
may cause customers to defer purchasing our existing products. Moreover, despite
testing by us and by current and potential customers, errors or failures may be
found in our products, and, even if discovered, may not be successfully
corrected in a timely manner. These errors or failures could cause delays in
product introductions and shipments, or require design modifications that could
adversely affect our competitive position. Our inability to develop new products
or enhancements on a timely basis or the failure of these new products or
enhancements to achieve market acceptance could have a material adverse effect
on our business, financial condition and results of operations.
18
Because we purchase certain material
components used in manufacturing our products from sole suppliers and we use a
limited number of third party manufacturers to manufacture our products, our
business, financial condition and results of operations could be materially
adversely affected by a failure of these suppliers or manufacturers.
Certain key components of our products are currently purchased from a
sole supplier, including computer chassis, switching gear, an interface
controller video transmission board, encoder and decoder hardware, and operating
system and applications software. We have in the past experienced quality
control problems, where products did not meet specifications or were damaged in
shipping, and delays in the receipt of these components. These problems were
generally of short duration and did not have a material adverse effect on our
business and results of operations. However, we may in the future experience
similar types of problems which could be more severe or more prolonged. While we
believe that there are alternative suppliers available for these components, we
believe that the procurement of these components from alternative suppliers
could take up to a year. In addition, these alternative components may not be
functionally equivalent or may be unavailable on a timely basis or on similar
terms. The inability to obtain sufficient key components as required, or to
develop alternative sources if and as required in the future, could result in
delays or reductions in product shipments which, in turn, could have a material
adverse effect on our business, financial condition and results of operations.
In addition, we rely on a limited number of third parties who manufacture
certain components used in our products. While to date there has been suitable
third party manufacturing capacity readily available at acceptable quality
levels, in the future there may not be manufacturers that are able to meet our
future volume or quality requirements at a price that is favorable to us. Any
financial, operational, production or quality assurance difficulties experienced
by these third party manufacturers that result in a reduction or interruption in
supply to us could have a material adverse effect on our business, financial
condition and results of operations.
If we are not able to obtain necessary
licenses or distribution rights for third-party technology at acceptable prices,
or at all, our products could become obsolete or we may not be able to deliver
certain product offerings.
We have incorporated third-party licensed technology into our current
products and our product lines. From time to time, we may be required to license
additional technology from third parties to develop new products or product
enhancements or to provide specific solutions. Third-party licenses may not be
available or continue to be available to us on commercially reasonable terms.
The inability to maintain or re-license any third-party licenses required in our
current products or to obtain any new third-party licenses necessary to develop
new products and product enhancements or provide specific solutions could
require us to obtain substitute technology of lower quality or performance
standards or at greater cost. Such inabilities could delay or prevent us from
making these products or enhancements or providing specific solutions, which
could seriously harm the competitiveness of our products.
If we are unable to successfully compete in
our marketplace, our financial condition and operating results may be adversely
affected.
We currently compete against both computer companies offering video
server platforms and more traditional analog video playback systems. In the
digital advertisement insertion market, we compete against suppliers of both
analog tape-based and digital systems. In addition, a number of well-funded
companies have been discussing broadband internet VOD services for home
television viewing. If these products are developed, they may be more cost
effective than our VOD solutions, which could result in cable system operators
and telecommunications companies discontinuing purchases of our on-demand
products.
19
Due to the rapidly evolving markets in which we compete, additional
competitors with significant market presence and financial resources, including
computer hardware and software companies and television equipment manufacturers,
may enter those markets, thereby further intensifying competition. Increased
competition could result in price reductions and loss of market share which
would adversely affect our business, financial condition and results of
operations. Many of our current and potential competitors have greater
financial, selling and marketing, technical and other resources than we do.
Moreover, our competitors may also foresee the course of market developments
more accurately than we. Although we believe that we have certain technological
and other advantages over our competitors, realizing and maintaining these
advantages will require a continued high level of investment by us in research
and product development, marketing and customer service and support. In the
future we may not have sufficient resources to continue to make these
investments or to make the technological advances necessary to compete
successfully with our existing competitors or with new competitors.
If we are unable to compete effectively, our business, prospects,
financial condition and operating results would be materially adversely affected
because of the difference in our operating results from the assumptions on which
our business model is based.
If we fail to respond to rapidly changing
technologies related to digital video, our business, financial condition and
results of operations would be materially adversely affected because the
competitive advantage of our products relative to those of our competitors would
decrease.
The markets for our products are characterized by rapidly changing
technology, evolving industry standards and frequent new product introductions
and enhancements. Future technological advances in the television and video
industries may result in the availability of new products or services that could
compete with the solutions provided by us or reduce the cost of existing
products or services, any of which could enable our existing or potential
customers to fulfill their video needs better and more cost efficiently than
with our products. Our future success will depend on our ability to enhance our
existing digital video products, including the development of new applications
for our technology, and to develop and introduce new products to meet and adapt
to changing customer requirements and emerging technologies. In the future, we
may not be successful in enhancing our digital video products or developing,
manufacturing and marketing new products which satisfy customer needs or achieve
market acceptance. In addition, there may be services, products or technologies
developed by others that render our products or technologies uncompetitive,
unmarketable or obsolete, or announcements of currently planned or other new
product offerings either by us or our competitors that cause customers to defer
or fail to purchase our existing solutions.
Our financial condition and results of
operations could be materially adversely affected by the performance of the
companies in which we have made and may in the future make equity investments.
We have made non-controlling equity investments in complementary
companies, including On Demand Deutschland GmbH & Co. KG, Casa Systems,
Inc., Minerva Networks, Inc. and InSite One, Inc., and we may in the future make
additional investments in these and/or other companies. These investments may
require additional capital and may not generate the expected rate of return that
we believed possible at the time of making the investment. This may adversely
affect our financial condition or results of operations. Also, investments in
development-stage companies may generate other than temporary declines in fair
value of our investment that would result in impairment charges.
We may not fully realize the benefits of our
acquisitions of eventIS Group B.V or VividLogic, Inc., and these and future
acquisitions may be difficult to integrate, disrupt our business, dilute
stockholder value or divert management attention.
As part of our business strategy, we have acquired and may in the future
seek to acquire or invest in new businesses, products or technologies that we
believe could complement or expand our business, augment our market coverage,
enhance our technical capabilities or otherwise offer growth opportunities.
Acquisitions, including our acquisitions of eventIS Group B.V. and VividLogic,
Inc. could create risks for us, including:
- difficulties in assimilation of
acquired personnel, operations, technologies or products which may affect our
ability to develop new products and services and compete in our rapidly
changing marketplace due to a resulting decrease in the quality of work and
innovation of our employees upon which our business is dependent;
and
- adverse effects on our existing business relationships with suppliers and customers, which may be of particular importance to our business because we sell our products to a limited number of large customers, we purchase certain components used in manufacturing our products from sole suppliers and we use a limited number of third party manufacturers to manufacture our product.
20
In addition, if we consummate acquisitions through an exchange of our
securities, our existing stockholders could suffer significant dilution.
Acquisitions, even if successfully completed, may not generate any additional
revenue or provide any benefit to our business.
We may make future acquisitions or enter into
joint ventures that are not successful, which could seriously harm our
business.
Historically, we have acquired technology or businesses to supplement and
expand our product offerings. In the future, we could acquire additional
products, technologies or businesses, or enter into joint venture arrangements,
for the purpose of complementing or expanding our business as occurred with
VividLogic Inc. in fiscal 2011, eventIS Group B.V. in fiscal 2010, Mobix
Interactive Ltd. in fiscal 2009 and On Demand Deutschland GMBH in fiscal 2007.
Negotiation of potential
acquisitions or joint ventures and our integration of acquired products,
technologies or businesses could divert management’s time and resources. Future
acquisitions could cause us to issue equity securities that would dilute
existing stockholders, incur contingent liabilities, amortize intangible assets,
or write off in-process research and development and other acquisition-related
expenses that could have a material adverse affect on our business, results of
operations, cash flow and financial condition. We may not be able to properly
integrate acquired products, technologies or businesses with our existing
products and operations, train, retain and motivate personnel from the acquired
businesses, or combine potentially different corporate cultures. Failure to do
so could deprive us of the intended benefits of those acquisitions. In addition,
we may be required to write-off acquired research and development if further
development of purchased technology becomes unfeasible, which may adversely
affect our business, results of operations, cash flow and financial
condition.
If our goodwill or intangible assets become
impaired, we may be required to record a significant charge to
earnings.
Under accounting principles generally accepted in the United States, we
review our intangible assets for impairment when events or changes in
circumstances indicate the carrying value may not be recoverable. Goodwill is
required to be tested for impairment at least annually. Factors that may be
considered a change in circumstances indicating that the carrying value of our
goodwill or other intangible assets may not be recoverable include declines in
our stock price and market capitalization, or future cash flows projections. Our
valuation methodology for assessing impairment requires management to make
judgments and assumptions based on projections of future operating performance.
We operate in highly competitive environments and projections of future
operating results and cash flows may vary significantly from actual results. We
may be required to record a significant noncash charge to earnings in our
financial statements during the period in which any impairment of our goodwill
or other intangible assets is determined.
We may experience risks in our investments due
to changes in the market, which could adversely affect the value or liquidity of
our investments.
We maintain a portfolio of cash equivalents and short-term and long-term
investments in a variety of securities which may include commercial paper,
certificates of deposit, money market funds and government debt securities.
These available-for-sale investments are subject to interest rate risk and may
decline in value if market interest rates increase. These investments are
subject to general credit, liquidity, market and interest rate risks. As a
result, we may experience a reduction in value or loss of liquidity of our
investments. In addition, should any investment cease paying or reduce the
amount of interest paid to us, our interest income would suffer. These market
risks associated with our investment portfolio may have a negative adverse
effect on our results of operations, liquidity and financial
condition.
The success of our business model could be
influenced by changes in the regulatory environment, such as changes that either
would limit capital expenditures by television, cable or telecommunications
operators or reverse the trend towards deregulation in the industries in which
we compete.
21
The telecommunications and television industries are subject to extensive
regulation which may limit the growth of our business, both in the United States
and other countries. The growth of our business internationally is dependent in
part on deregulation of the telecommunications industry abroad similar to that
which has occurred in the United States and the timing and magnitude of which is
uncertain. Broadband system operators are subject to extensive government
regulation by the Federal Communications Commission and other federal and state
regulatory agencies. These regulations could have the effect of limiting capital
expenditures by broadband system operators and thus could have a material
adverse effect on our business, financial condition and results of operations.
The enactment by federal, state or international governments of new laws or
regulations, changes in the interpretation of existing regulations or a reversal
of the trend toward deregulation in these industries could adversely affect our
customers, and thereby materially adversely affect our business, financial
condition and results of operations.
We may not be able to hire and retain highly
skilled employees, particularly which could affect our ability to compete
effectively because our business is technology-based.
Our success depends to a significant degree upon the continued
contributions of our key personnel, many of whom would be difficult to replace.
We believe that our future success will also depend in large part upon our
ability to attract and retain highly skilled managerial, engineering, customer
service, selling and marketing, finance, administrative and manufacturing
personnel, as our business is technology-based. Because competition for these
personnel is intense, we may not be able to attract and retain qualified
personnel in the future. The loss of the services of any of the key personnel,
the inability to attract or retain qualified personnel in the future or delays
in hiring required personnel, particularly software engineers and sales
personnel could have a material adverse effect on our business, financial
condition and results of operations because our business is
technology-based.
We may have additional tax
liabilities.
We are subject to income taxes in both the United States and numerous
foreign jurisdictions. Significant judgment is required in determining our
worldwide provision for income taxes. In the ordinary course of our business,
there are many transactions and calculations where the ultimate tax
determination is uncertain. We are regularly under audit by tax authorities.
Although we believe our tax estimates are reasonable, the final determination of
tax audits and any related litigation could be materially different from our
historical income tax provisions and accruals. The results of an audit or
litigation could have a material effect on our income tax provision, net income,
or cash flows in the period or periods for which that determination is made.
In addition, we are subject to sales, use and similar taxes in many
countries, jurisdictions and provinces, including those states in the United
States where we maintain a physical presence or have a substantial nexus. These
taxing regimes are complex. For example, in the United States, each state and
local taxing authority has its own interpretation of what constitutes a
sufficient physical presence or nexus to require the collection and remittance
of these taxes. Similarly, each state and local taxing authority has its own
rules regarding the applicability of sales tax by customer or product type.
System errors, failures, or interruptions
could cause delays in shipments, require design modifications or replacements
which may have a negative impact on our business and damage our reputation and
customer relationships.
System errors or failures may adversely affect our business, financial
condition and results of operations. Despite our testing and testing by current
and potential customers, not all errors or failures may be found in our products
or, if discovered, successfully corrected in a timely manner. These errors or
failures could cause delays in product introductions and shipments or require
design modifications that could adversely affect our competitive position.
Further, some errors may not be detected until the systems are deployed. In such
a case, we may have to undertake major replacement programs to correct the
problem. Our reputation may also suffer if our customers view our products as
unreliable, whether based on actual or perceived errors or failures in our
products.
Further, a defect, error or performance problem with our on-demand
systems could cause our customers’ VOD offerings to fail for a period of time or
be degraded. Any such failure would cause customer service and public relations
problems for our customers. As a result, any failure of our customers’ systems
caused by our technology, including the failure of third party technology
incorporated therein or therewith, could result in delayed or lost revenue due
to adverse customer reaction, negative
publicity regarding us and our products and services and claims for substantial
damages against us, regardless of our responsibility for such failure. Any claim
could be expensive and require us to spend a significant amount of resources. In
circumstances where third party technology incorporated with or in our systems
includes a defect, error or performance problem or fails for any reason, we may
have to replace such third party technology at our expense and be responsible to
our customers for their corresponding claims. Such replacements or claims could
be expensive and could require us to spend a significant amount of
resources.
22
Our stock price may be
volatile.
Historically, the market for technology stocks has been extremely
volatile. Our common stock has experienced, and may continue to experience,
substantial price volatility. The occurrence of any one or more of the factors
noted above could cause the market price of our common stock to fluctuate. In
addition, during 2008 and 2009 the stock market in general, and the NASDAQ Stock
Market and technology companies in particular, have experienced extreme price
and volume fluctuations that have often been unrelated or disproportionate to
the operating performance of such companies. These broad market and industry
factors may materially adversely affect the market price of our common stock,
regardless of our actual operating performance. In the past, following periods
of volatility in the market price of a company’s securities, securities class
action litigation has often been instituted against such companies.
Any weaknesses identified in our system of
internal controls by us and our independent registered public accounting firm
pursuant to Section 404 of the Sarbanes-Oxley Act of 2002 could have an adverse
effect on our business.
Section 404 of the Sarbanes-Oxley Act of 2002 requires that companies
evaluate and report on their systems of internal control over financial
reporting. In addition, our independent registered public accounting firm must
report on its evaluation of those controls. In future periods, we may identify
deficiencies, including as a result of the loss of the services of one or more
of our key personnel, in our system of internal controls over financial
reporting that may require remediation. There can be no assurances that any such
future deficiencies identified may not be significant deficiencies or material
weaknesses that would be required to be reported in future periods.
ITEM 1B. Unresolved Staff
Comments
None
23
ITEM 2. Properties
| Lease/ | ||||||||
| Location | Own | Principal Use | Segment | Square | ||||
| Acton, Massachusetts | Own | Corporate Headquarters, video software
engineering and manufacturing |
Software, Servers and Storage | 1 | ||||
| Greenville, New Hampshire | Own | Video Storage engineering,
logistics and services |
Servers and Storage | |||||
| Greenville, New Hampshire | Lease | Video Servers and broadcast product engineering |
Servers and Storage | |||||
| Fort Washington, Pennsylvania | Lease | Software Development, digital
video and interactive television |
Software | |||||
| London, United Kingdom | Own | ODG head corporate offices and video content processing services |
Media Services |
In addition, we also lease research and development and/or sales and
support offices in Illinois, Nevada, California, France, Ireland, Singapore,
Germany, Japan, India, Turkey, Philippines, UK, Russia, Mexico, the Netherlands,
and China. We believe that existing facilities are adequate to meet our
foreseeable requirements.
ITEM 3. Legal Proceedings
On July 31, 2009, Arris Corporation (“Arris”) filed a contempt motion in
the U.S. District Court for the District of Delaware against SeaChange
International relating to U.S. Patent No 5,805,804 (the “804 patent”), a patent
owned by Arris. In its motion, Arris is seeking further patent royalties and the
enforcement of the permanent injunction entered by the Court on April 6, 2006
against certain SeaChange products. On August 3, 2009, SeaChange filed a
complaint seeking a declaratory judgment from the Court that its products do not
infringe the ‘804 patent and asserting certain equitable defenses. SeaChange
also filed a motion to consolidate the Arris contempt motion with the
declaratory judgment action and requested a status conference on SeaChange’s
declaratory judgment action. On August 25, 2009, Arris filed 1) an answer to
SeaChange’s complaint that included a counterclaim of patent infringement under
the ‘804 patent; and 2) a motion to stay the declaratory judgment action until
the resolution of the contempt motion. On January 13, 2010 the parties filed
proposed scheduling orders for SeaChange’s declaratory judgment action. The
Court has not yet entered a schedule in either action. SeaChange
believes that Arris’ contempt motion is without merit, and that SeaChange
products do not infringe the remaining claims under the ‘804
patent.
SeaChange enters into agreements in the ordinary course of business with
customers, resellers, distributors, integrators and suppliers. Most of these
agreements require SeaChange to defend and/or indemnify the other party against
intellectual property infringement claims brought by a third party with respect
to SeaChange’s products. From time to time, SeaChange also indemnifies customers
and business partners for damages, losses and liabilities they may suffer or
incur relating to personal injury, personal property damage, product liability,
and environmental claims relating to the use of SeaChange’s products and
services or resulting from the acts or omissions of SeaChange, its employees,
authorized agents or subcontractors. For example, SeaChange has received
requests from several of its customers for indemnification of patent litigation
claims asserted by Acacia Media Technologies, USA Video Technology Corporation,
Multimedia Patent Trust, Microsoft Corporation and VTran Media Technologies.
Management performed an analysis of these requests, evaluating whether any
potential losses were probable and estimable.
24
PART II
ITEM 5. Market for Registrant’s Common Equity
and Related Stockholder Matters
Market Information
Our common stock (symbol, “SEAC”) began trading on NASDAQ on November 5,
1996 and currently trades on the Nasdaq Global Select Market.
On March 25, 2010, the last reported sale price of our common stock on
NASDAQ was $7.37 per share and there were approximately 132 holders of record of
our common stock. We believe that the number of beneficial holders of our common
stock exceeds 5,683.
The following table sets forth the quarterly high and low closing sales
prices per share reported on NASDAQ for our last two fiscal years ended January
31, 2010 and 2009.
| Fiscal Year 2010 | Fiscal Year 2009 | ||||||||||
| High | Low | High | Low | ||||||||
| Three Month Period Ended: | |||||||||||
| First Quarter | $ | 6.81 | $ | 4.32 | $ | 7.48 | $ | 5.50 | |||
| Second Quarter | 9.23 | 6.06 | 8.32 | 6.60 | |||||||
| Third Quarter | 9.85 | 6.77 | 9.70 | 6.46 | |||||||
| Fourth Quarter | 6.97 | 5.50 | 8.17 | 5.92 | |||||||
Dividend Policy
We have never declared or paid any cash dividends on our common stock,
since inception, and do not expect to pay cash dividends on our common stock in
the foreseeable future. We currently intend to retain all of our future earnings
for use in operations and to finance the expansion of our business.
Equity Compensation Plan
Information
The following table provides information about the common stock that may
be issued upon the exercise of options, warrants and rights under all of
SeaChange’s existing equity compensation plans as of January 31, 2010, including
the Amended and Restated 2005 Equity Compensation Incentive Plan, the Amended
and Restated 1995 Stock Option Plan, the 1996 Non-Employee Director Stock Option
Plan and the Third Amended and Restated 1996 Employee Stock Purchase Plan.
| Number of securities | ||||||||||
| remaining available | ||||||||||
| Weighted- | for future issuance | |||||||||
| Number of securities | average exercise | under equity | ||||||||
| to be issued upon | price of | compensation plans | ||||||||
| exercise of outstanding | outstanding | (excluding securities | ||||||||
| options, warrants and | options, warrants | reflected | ||||||||
| Plan category | rights | and rights | in column (a)) | |||||||
| (a) | (b) | (c) | ||||||||
| Equity compensation plans approved by security holders(1) | 3,934,973 | (2) | $ | 15.41 | (4) | 2,202,596 | (3) | |||
25
| (1) | Consists of the Amended and Restated 2005 Equity Compensation Incentive Plan, the Amended and Restated 1995 Stock Option Plan, the 1996 Non-Employee Director Stock Option Plan and the Third Amended and Restated 1996 Employee Stock Purchase Plan. | |
| (2) | Excludes the shares to be issued for the period ended May 31, 2009 under the Third Amended and Restated 1996 Employee Stock Purchase Plan, because the number of shares to be issued upon exercise of currently outstanding options there under cannot be determined, as it will be determined on May 31, 2010, the last day of the payment period, and will be for a maximum of 1,125 shares per eligible participant. | |
| (3) | As of January 31, 2010, 2,202,596 shares remained available for issuance under the Amended and Restated 2005 Equity Compensation Incentive Plan and no shares remained available for grant under the Third Amended and Restated 1996 Employee Stock Purchase Plan. | |
| (4) | Excludes the weighted average exercise price for shares to be issued under the Third Amended and Restated 1996 Employee Stock Purchase Plan, as amended, because the weighted average exercise price of currently outstanding options there under cannot be determined, as it will be equal to 85% of the lower of the average market price of the common stock on December 1, 2009 and May 28, 2010, the first and last business day of the applicable payment period. | |
Repurchase of our Equity Securities
On March 11, 2009, the Board of
Directors authorized the repurchase of up to $20 million of SeaChange’s common
stock, par value $.01 per share, through a share repurchase program. As
authorized by the program, shares were purchased in the open market or through
privately negotiated transactions in a manner consistent with applicable
securities laws and regulations, including pursuant to a Rule 10b5-1 plan
maintained by the Company.
PURCHASES OF EQUITY SECURITIES
| Period | Total Number of Shares | Average Price Paid per | Total Number of Shares | Maximum Number | ||
| (or Units) Purchased | Share (Or Units) (1) | (Or Units) Purchased as | (or Approximate | |||
| Part of Publicly Announced | Dollar Value) of | |||||
| Plans or Programs | Shares (Or Units) that | |||||
| May Yet Be | ||||||
| Purchased Under the | ||||||
| Plans or Programs | ||||||
| November 1, 2009 to | ||||||
| November 30, 2009 | - | $ | - | - | $ | 18,279,693 |
| December 1, 2009 to | ||||||
| December 31, 2009 | 175,000 | 5.99 | 175,000 | 17,231,687 | ||
| January 1, 2010 to | ||||||
| January 31, 2010 | - | - | - | 17,231,687 | ||
| Total | 175,000 | $ | 5.99 | 175,000 | $ | 17,231,687 |
The repurchase program terminated on
January 31, 2010. During the three months ended January 31, 2010, the Company
repurchased 175,000 shares at a cost of $1.0 million. During the year ended
January 31, 2010, the Company repurchased 473,415 shares at a cost of $2.8
million. The Company did not repurchase any shares from its management or other
insiders.
26
STOCK PERFORMANCE GRAPH
The following graph compares the change in the cumulative total
stockholder return on SeaChange’s common stock during the period from the close
of trading on January 31, 2005 through January 31, 2010, with the cumulative
total return on the Center for Research in Securities Prices (“CRSP”) Index for
the Nasdaq Stock Market (U.S. Companies) and a SIC Code Index based on
SeaChange’s SIC Code. The comparison assumes $100 was invested on January 31,
2005 in SeaChange’s common stock at the $16.42 closing price on January 31, 2005
and in each of the foregoing indices and assumes reinvestment of dividends, if
any.
The following graph is not “soliciting material,” is not deemed filed
with the SEC and is not to be incorporated by reference in any filing of
SeaChange under the Securities Act or the Exchange Act, whether made before or
after the date hereof and irrespective of any general incorporation language in
any such filing. The stock price performance shown on the following graph is not
necessarily indicative of future price performance. Information used on the
graph was obtained from a third party provider, a source believed to be
reliable, but SeaChange is not responsible for any errors or omissions in such
information.
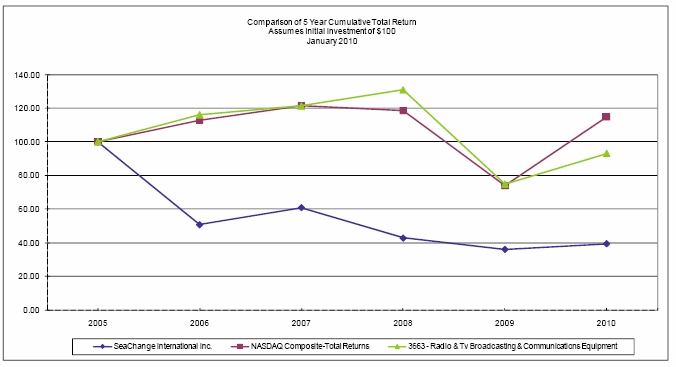
Notes:
| A. | The lines represent monthly index levels derived from compounded daily returns that include all dividends. | ||
| B. | If the monthly interval, based on the fiscal year-end, is not a trading day, the preceding trading day is used. | ||
| C. | The Index level for all series was set to 100 on January 31, 2005. | ||
27
ITEM 6. Selected Financial Data
The following consolidated selected financial data should be read in
conjunction with “Management’s Discussion and Analysis of Financial Condition
and Results of Operations” and our consolidated financial statements and related
notes included elsewhere in this Annual Report on Form 10-K. The selected
financial data for the years ended January 31, 2008, 2007 and 2006 have been
recast to reflect the reclassification of foreign currency gain (loss) from
operating expenses to other income (expense), net below operating
income.
| Year ended January 31, | |||||||||||||||||||
| 2010 | 2009 | 2008 | 2007 | 2006 | |||||||||||||||
| (in thousands, except per share data) | |||||||||||||||||||
| Consolidated Statement of Operations Data: | |||||||||||||||||||
| Revenues: | |||||||||||||||||||
| Products | $ | 101,941 | $ | 117,372 | $ | 105,769 | $ | 95,000 | $ | 73,516 | |||||||||
| Services | 99,724 | 84,464 | 74,124 | 66,334 | 52,748 | ||||||||||||||
| Total revenues | 201,665 | 201,836 | 179,893 | 161,334 | 126,264 | ||||||||||||||
| Costs of revenues: | |||||||||||||||||||
| Products | 38,961 | 46,533 | 52,464 | 48,334 | 45,555 | ||||||||||||||
| Services | 59,451 | 52,007 | 46,465 | 37,189 | 28,315 | ||||||||||||||
| Total cost of revenue | 98,412 | 98,540 | 98,929 | 85,523 | 73,870 | ||||||||||||||
| Gross profit | 103,253 | 103,296 | 80,964 | 75,811 | 52,394 | ||||||||||||||
| Operating expenses: | |||||||||||||||||||
| Research and development | 50,664 | 43,042 | 42,699 | 40,917 | 34,475 | ||||||||||||||
| Selling and marketing | 25,842 | 27,506 | 23,073 | 22,383 | 18,681 | ||||||||||||||
| General and administrative | 21,719 | 20,979 | 20,240 | 18,873 | 13,915 | ||||||||||||||
| Amortization of intangibles | 2,826 | 1,575 | 2,952 | 5,664 | 2,201 | ||||||||||||||
| Total operating expenses | 101,051 | 93,102 | 88,964 | 87,837 | 69,272 | ||||||||||||||
| Income (loss) from operations | 2,202 | 10,194 | (8,000 | ) | (12,026 | ) | (16,878 | ) | |||||||||||
| Interest income, net | 607 | 2,050 | 1,927 | 1,355 | 2,038 | ||||||||||||||
| Other (expense), net | (462 | ) | (925 | ) | (43 | ) | (320 | ) | (339 | ) | |||||||||
| Impairment on investment in affiliate | - | - | - | (150 | ) | - | |||||||||||||
| Gain on sale of investment in affiliate | - | - | 10,031 | - | - | ||||||||||||||
| Income (loss) before income taxes and equity income | |||||||||||||||||||
| (loss) in earnings of affiliates | 2,347 | 11,319 | 3,915 | (11,141 | ) | (15,179 | ) | ||||||||||||
| Income tax expense (benefit) | 371 | 575 | 2,156 | (1,632 | ) | (2,941 | ) | ||||||||||||
| Equity (loss) income in earnings of affiliate, net of tax | (653 | ) | (770 | ) | 1,143 | 1,272 | 39 | ||||||||||||
| Net income (loss) | $ | 1,323 | $ | 9,974 | $ | 2,902 | $ | (8,237 | ) | $ | (12,199 | ) | |||||||
| Earnings (loss) per share: | |||||||||||||||||||
| Basic | $ | 0.04 | $ | 0.32 | $ | 0.10 | $ | (0.29 | ) | $ | (0.43 | ) | |||||||
| Diluted | $ | 0.04 | $ | 0.32 | $ | 0.10 | $ | (0.29 | ) | $ | (0.43 | ) | |||||||
| Consolidated Balance Sheet Data (as of January 31): | |||||||||||||||||||
| Working capital | $ | 60,887 | $ | 89,549 | $ | 88,344 | $ | 57,820 | $ | 45,759 | |||||||||
| Total assets | 267,147 | 233,983 | 217,896 | 199,296 | 207,797 | ||||||||||||||
| Deferred revenue | 46,793 | 32,974 | 19,103 | 21,806 | 20,045 | ||||||||||||||
| Long-term liabilities | 15,808 | 3,745 | 3,391 | 1,121 | 1,353 | ||||||||||||||
| Total liabilities | 89,225 | 61,747 | 52,494 | 42,876 | 54,053 | ||||||||||||||
| Total stockholders’ equity | 177,922 | 172,236 | 165,402 | 156,420 | 153,744 | ||||||||||||||
28
ITEM 7. Management’s Discussion and Analysis
of Financial Condition and Results of Operations
You should read the following discussion and analysis together with our
consolidated financial statements, related notes and other financial information
appearing elsewhere in this report. In addition to historical information, the
following discussion and other parts of this report contain forward-looking
information that involves risks and uncertainties. Our actual results could
differ materially from those anticipated by such forward-looking information due
to a number of factors including risks discussed in Item 1A. “Risk Factors,” and
elsewhere in this Annual Report on Form 10-K. These risks could cause our actual
results to differ materially from any future performance suggested
below.
Overview
We are a leading developer, manufacturer and marketer of digital video
systems and services including, the aggregation, licensing, storage, management
and distribution of video, television programming, and advertising content to
cable system operators, telecommunications companies and broadcast television
companies.
On November 19, 2008, On Demand Group (“ODG”), a subsidiary of SeaChange,
acquired all the outstanding capital stock of Mobix Interactive Limited
(“Mobix”) a London, England based company that provides software and content
services related to the deployment of mobile video services for wireless network
operators. Under the terms of the Share Purchase Agreement, ODG paid the
shareholders of Mobix $3.0 million in cash. On March 16, 2009, ODG paid $700,000
upon achieving one of the performance goals within the share purchase agreement.
In addition, on September 16, 2009, the Company and the former shareholders of
Mobix amended the original share purchase agreement to provide for the
satisfaction of any future contingent consideration with a payment of $1.8
million.
On September 1, 2009, the Company completed its acquisition of eventIS
Group B.V. (”eventIS”). eventIS, based in Eindhoven, the Netherlands, provides
video on demand (“VOD”) and linear broadcast software and related services to
cable television and telecommunications companies primarily in Europe. The
Company acquired eventIS to expand its VOD solutions into the European market.
At the closing, the Company made a cash payment to the former shareholder of
eventIS of $34.4 million plus $2.2 million based on an estimated working capital
adjustment in accordance with the eventIS Share Purchase Agreement. In addition,
in January 2010 the Company made a payment of $395,000 for final settlement of
the working capital adjustment. On each of the first, second and third
anniversaries of the closing date, the Company is obligated to make additional
fixed payments of deferred purchase price under the eventIS Share Purchase
Agreement (the “Deferred Fixed Purchase Price Payments”), each such payment to
be in an aggregate amount of $2.8 million with $1.7 million payable in cash and
$1.1 million payable by the issuance of restricted shares of SeaChange common
stock, which will vest in equal installments over three years starting on the
first anniversary of the date of issuance. Under the earnout provisions of the
eventIS Share Purchase Agreement, if certain performance goals are met over each
of the three periods ending January 31, 2013, the Company will be obligated to
make additional cash payments to the former shareholder of eventIS.
Acquisition-related costs recognized include legal, accounting, valuation and
other professional services of $1.0 million for fiscal 2010. The transaction
costs were expensed and recorded in general and administrative expenses in the
Consolidated Statement of Operations.
On February 1, 2010, the Company completed its acquisition of VividLogic,
Inc. (”VividLogic”). VividLogic, based in Fremont, California, provides in-home
infrastructure software for high definition televisions, home gateways, and
set-top boxes to cable television service providers, set-top box manufacturers
and consumer electronics (CE) suppliers. The Company acquired VividLogic to
expand its in home solutions. At the closing, the Company made a cash payment of
$12.0 million, of which $1.2 million was deposited in escrow with respect to
certain indemnification matters. In addition, VividLogic shareholders are
entitled to $8.5 million in cash from working capital at the time of the
closing. Of this amount $3.5 million was paid at closing. Of the balance, $1.5
million will be paid on May 1, 2010 and August 1, 2010 and $2 million will be
paid on the one year anniversary of the closing. Fixed deferred cash payments of
$1.0 million will be paid on February 1, 2011, 2012, and 2013. Under the earnout
provisions of the purchase agreement, the Company will be obligated to make
additional payments based upon the operating results of VividLogic over the
three one-year periods following the closing. Acquisition-related costs
recognized include legal, accounting, valuation and other professional services
of $400,000 for fiscal 2010. The transaction costs were expensed and recorded in
general and administrative expenses in the Consolidated Statement of Operations.
29
During the first quarter of fiscal
2011, the Company initiated actions to lower its cost structure as it strives to
generate increased profitability for this fiscal year. The first quarter of
fiscal 2011 will include pre-tax restructuring charges to its income
statement totaling approximately $1.7 million related to the termination of
approximately 47 employees.
Until the end of fiscal 2008, the Company was managed and operated as
three segments, Broadcast, Broadband and Services. In its first quarter of
fiscal 2009, the Company realigned its previously reported segments into three
new reporting segments: Software, Servers and Storage, and Media Services as
segments defined by the authoritative accounting guidance. The Company believes
this reorganization better reflects the increasing importance and magnitude of
its software products and services as well as the scale of its ODG subsidiary. A
description of the three reporting segments is as follows:
- Software segment includes product revenues
from the Company’s Advertising, VOD, Middleware and Broadcast software,
related services such as professional services, installation, training,
project management, product maintenance, technical support and software
development for those software products, and operating expenses relating to
the Software segment such as research and development, selling and marketing
and amortization of intangibles. The Software segment includes the results of
eventIS from the date of the acquisition on September 1, 2009.
- Servers and Storage segment
includes product revenues from VOD and Broadcast server product lines and
related services such as professional services, installation, training,
project management, product maintenance, and technical support for those
products and operating expenses relating to the Servers and Storage segment,
such as research and development and selling and marketing.
- Media Services segment includes the operations of ODG, and commencing in fiscal 2009 the operations of Mobix Interactive, activities which include content acquisition and preparation services for television and wireless service providers and related operating expenses.
Under this revised reporting structure, the Company determined there are
significant functions, and therefore costs considered corporate expenses that
are not allocated to the reportable segments for the purposes of assessing
performance and making operating decisions. These unallocated costs include
general and administrative expenses, other than general and administrative
expenses related to Media Services, interest and other income, net, taxes and
equity losses in affiliates, which are managed separately at the corporate
level.
The segment data for the fiscal year ended January 31, 2008 has been
recast to reflect the realignment of the new segments. Prior to fiscal 2009,
services revenues, which included ODG revenues, were reported in the Services
segment and the Company did not separately track these service revenues and
costs by these new segments, except for ODG. Accordingly, management has made
certain assumptions to determine the amount of service revenues and service
costs attributed to the Software and Servers and Storage reporting segments for
the fiscal year ended January 31, 2008. The basis of the assumptions for all
such revenues, costs and expenses includes significant judgments and
estimations. There are no inter-segment revenues for the periods. The Company
does not separately track all assets by operating segments nor are the segments
evaluated under this criterion.
We have experienced fluctuations in our product revenues from quarter to
quarter due to the timing of the receipt of customer orders and the shipment of
those orders. The factors that impact the timing of the receipt of customer
orders include among other factors:
- the customer’s receipt of authorized
signatures on their purchase orders;
- the budgetary approvals within the
customer’s company for capital purchases; and
- the ability to process the purchase order within the customer’s organization in a timely manner.
30
Factors that may impact
the shipment of customer orders include:
- the availability of material to
produce the product;
- the time required to produce and
test the product before delivery; and
- the customer’s required delivery date.
During these economic times, many customers may delay or reduce capital
expenditures. This could result in reductions in sales of our products, longer
sales cycles, difficulties in collection of accounts receivable, excess and
obsolete inventory, gross margin deterioration, slower adoption of new
technologies, increased price competition and supplier difficulties. We believe
that the recent global economic slowdown caused certain customers to reduce or
delay capital spending plans in fiscal 2010 primarily in our Advertising and
Broadcast products, and expect that these conditions could persist into fiscal
2011. In addition, we have experienced increased price-based competition from
our competitors, which resulted in the reduction of the prices of some of our
products, which reduced our revenues and adversely affected our gross
margin.
The delay in the timing of receipt and shipment of any one customer order
can result in significant fluctuations in our revenue reported on a quarterly
basis.
Our operating results are significantly influenced by a number of
factors, including the mix of products sold and services provided, pricing,
costs of materials used in our products and the expansion of our operations
during the fiscal year. We price our products and services based upon our costs
and consideration of the prices of competitive products and services in the
marketplace. The costs of our products primarily consist of the costs of
components and subassemblies that have generally declined from product
introduction to product maturity. As a result of the growth of our business, our
operating expenses have historically increased in the areas of research and
development, selling and marketing and administration. In the current state of
the economy, we currently expect that customers may still have limited capital
spending budgets as we believe they are dependent on advertising revenues to
fund their capital equipment purchases. Accordingly, we expect our financial
results to vary from quarter to quarter and our historical financial results are
not necessarily indicative of future performance. In light of the higher
proportion of our international business, we expect movements in foreign
exchange rates to have a greater impact on our operating results and the equity
section of our balance sheet in the future.
Our ability to continue to generate revenues within the markets that our
products are sold and to generate cash from operations and net income is
dependent on several factors which include:
- market acceptance of the products and
services offered by our customers and increased subscriber usage and demand
for these products and services;
- selection by our customers of our
products and services versus the products and services being offered by our
competitors;
- our ability to introduce new
products to the market in a timely manner and to meet the demands of the
market for new products and product enhancements;
- our ability to maintain gross
margins from the sale of our products and services at a level that will
provide us with cash to fund our operations given the pricing pressures within
the market and the costs of materials to manufacture our products;
- our ability to control operating
costs given the fluctuations that we have experienced with revenues from
quarter to quarter; and
- our ability to successfully integrate businesses acquired by us, including eventIS, VividLogic, Inc and Mobix Interactive, Ltd.
31
Summary of Critical Accounting Policies;
Significant Judgments and Estimates
Our discussion and analysis of our financial condition and results of
operations are based upon our consolidated financial statements, which have been
prepared in accordance with accounting principles generally accepted in the
United States of America. The preparation of these financial statements requires
us to make significant estimates and judgments that affect the reported amounts
of assets, liabilities, revenues and expenses, and related disclosure of
contingent assets and liabilities. These items are regularly monitored and
analyzed by management for changes in facts and circumstances, and material
changes in these estimates could occur in the future. Changes in estimates are
recorded in the period in which they become known. We base our estimates on
historical experience and various other assumptions that we believe to be
reasonable under the circumstances. Actual results may differ from our estimates
if past experience or other assumptions do not turn out to be substantially
accurate.
We believe that the accounting policies described below are critical to
understanding our business, results of operations and financial condition
because they involve significant judgments and estimates used in the preparation
of our consolidated financial statements. An accounting policy is deemed to be
critical if it requires a judgment or accounting estimate to be made based on
assumptions about matters that are highly uncertain, and if different estimates
that could have been used, or if changes in the accounting estimates that are
reasonably likely to occur periodically, could materially impact our
consolidated financial statements. Other significant accounting policies,
primarily those with lower levels of uncertainty than those discussed below, are
also critical to understanding our consolidated financial statements. The notes
to our consolidated financial statements contain additional information related
to our accounting policies and should be read in conjunction with this
discussion.
Principles of Consolidation. The Company consolidates the financial
statements of its wholly-owned subsidiaries and all inter-company accounts are
eliminated in consolidation. SeaChange also holds minority investments in the
capital stock of certain private companies having product offerings or customer
relationships that have strategic importance. The Company evaluates its equity
and debt investments and other contractual relationships with affiliate
companies in order to determine whether the guidelines regarding the
consolidation of variable interest entities (“VIE”) should be applied in the
financial statements. Consolidation guidelines address consolidation by business
enterprises of variable interest entities that possess certain characteristics.
A VIE is defined as an entity in which equity investors do not have the
characteristics of a controlling financial interest or do not have sufficient
equity at risk for the entity to finance its activities without additional
subordinated financial support. The primary beneficiary is required to
consolidate the financial position and results of the VIE. The Company has
concluded that it is not the primary beneficiary for any variable interest
entities as of January 31, 2010.
The Company’s investments in affiliates include investments accounted for
under the cost method and the equity method of accounting. The investments that
represent less than a 20% ownership interest of the common shares of the
affiliate are carried at cost. Under the equity method of accounting, which
generally applies to investments that represent 20% to 50% ownership of the
common shares of the affiliate, SeaChange’s proportionate ownership share of the
earnings or losses of the affiliate are included in equity loss in earnings of
affiliates in the consolidated statement of operations.
We periodically review indicators of the fair value of our investments in
affiliates in order to assess whether available facts or circumstances, both
internally and externally, may suggest an other than temporary decline in the
value of the investment. The carrying value of an investment in an affiliate may
be affected by the affiliate’s ability to obtain adequate funding and execute
its business plans, general market conditions, industry considerations specific
to the affiliate’s business, and other factors. The inability of an affiliate to
obtain future funding or successfully execute its business plan could adversely
affect our equity earnings of the affiliate in the periods affected by those
events. Future adverse changes in market conditions or poor operating results of
the affiliates could result in equity losses or an inability to recover the
carrying value of the investments in affiliates that may not be reflected in an
investment’s current carrying value, thereby possibly requiring an impairment
charge in the future. We record an impairment charge when we believe an
investment has experienced a decline in value that is
other-than-temporary.
Revenue Recognition and Allowance for Doubtful
Accounts. The accounting
related to revenue recognition is complex and affected by interpretations of the
rules and an understanding of industry practices. As a result, revenue
recognition accounting rules require us to make significant judgments. Revenues
from sales of hardware, software and systems that do not require significant
modification or customization of the underlying software are recognized when
title and risk of loss has passed to the customer, there is evidence of an
arrangement, fees are fixed or determinable and collection of the related
receivable is considered probable. Customers are billed for installation,
training, project management and at least one year of product maintenance and
technical support at the time of the product sale. Revenue from these activities
are deferred at the time of the product sale and recognized ratably over the
period these services are performed. Revenue from ongoing product maintenance
and technical support agreements are recognized ratably over the period of the
related agreements. Revenue from software development contracts that include
significant modification or customization, including software product
enhancements, is recognized based on the percentage of completion contract
accounting method using labor efforts expended in relation to estimates of total
labor efforts to complete the contract. For contracts, where some level of
profit is assured but the Company is only able to estimate ranges of amounts of
total contract revenue and total contract cost, the Company uses the lowest
probable level of profits in accounting for the contract revenues and costs.
Accounting for contract amendments and customer change orders are included in
contract accounting when executed. Revenue from shipping and handling costs and
other out-of-pocket expenses reimbursed by customers are included in revenues
and cost of revenues. Our share of inter-company profits associated with sales
and services provided to affiliated companies is eliminated in consolidation in
proportion to our equity ownership.
32
Our transactions frequently involve the sales of hardware, software,
systems and services in multiple element arrangements. Revenues under multiple
element arrangements are recorded based on the residual method of accounting.
Under this method, the total arrangement value is allocated first to undelivered
elements, based on their fair values, with the remainder being allocated to the
delivered elements. Where fair value of undelivered service elements has not
been established, the total arrangement value is recognized over the period
during which the services are performed. The amounts allocated to undelivered
elements, which may include project management, training, installation,
maintenance and technical support and hardware and software components, are
based upon the price charged when these elements are sold separately and
unaccompanied by the other elements. The amount allocated to installation,
training and project management revenue is based upon standard hourly billing
rates and the estimated time required to complete the service. These services
are not essential to the functionality of systems as these services do not alter
the equipment’s capabilities, are available from other vendors and the systems
are standard products. For multiple element arrangements that include software
development with significant modification or customization and systems sales
where vendor-specific objective evidence of the fair value does not exist for
the undelivered elements of the arrangement (other than maintenance and
technical support), percentage of completion accounting is applied for revenue
recognition purposes to the entire arrangement with the exception of maintenance
and technical support.
We recognize revenue for product and services only in those situations
where collection from the customer is probable. The Company performs ongoing
credit evaluations of customers’ financial condition but generally does not
require collateral. For some international customers, the Company may require an
irrevocable letter of credit to be issued by the customer before the purchase
order is accepted. The Company monitors payments from customers and assesses any
collection issues. The Company maintains allowances for specific doubtful
accounts and other risk categories of accounts based on estimates of losses
resulting from the inability of the Company’s customers to make required
payments and records these allowances as a charge to general and administrative
expenses. The Company bases its allowances for doubtful accounts on historical
collections and write-off experience, current trends, credit assessments, and
other analysis of specific customer situations. While such credit losses have
historically been within our expectations and the allowances established, we
cannot guarantee that we will continue to experience the same credit loss rates
that we have in the past. If the financial condition of our customers were to
change, additional allowances may be required or established allowances may be
considered unnecessary. Judgment is required in making these determinations and
our failure to accurately estimate the losses for doubtful accounts and ensure
that payments are received on a timely basis could have a material adverse
effect on our business, financial condition and results of
operations.
Service revenue from content processing provided to our customers is
recognized when services are provided, based on contracted rates. Upfront fees
received for services are recognized ratably over the period earned, whichever
is the longer of the contract term or the estimated customer relationship.
Any taxes assessed by a governmental authority related to
revenue-producing transactions (e.g. sales or value-added taxes) are reported on
a net basis and excluded from revenues.
Inventories and Reserves. Inventories are stated at the lower of cost or net realizable value.
Cost is determined using the first-in, first-out (FIFO) method. Inventories
consist primarily of components and subassemblies and finished products held for
sale. All of SeaChange’s hardware components are purchased from outside vendors.
The value of inventories is reviewed quarterly to determine that the carrying
value is stated at the lower of cost or net realizable value. SeaChange records
charges to reduce inventory to its net realizable value when impairment is
identified through the quarterly review process. The obsolescence evaluation is
based upon assumptions and estimates about future demand and possible
alternative uses and involves significant judgments. For the years ended January
31, 2010, 2009 and 2008, we recorded inventory write-downs of $600,000, $1.0
million, and $2.1 million, respectively.
33
Accounting for Business Combinations In our business combinations, we are required
to recognize the assets acquired, liabilities assumed, contractual
contingencies, and contingent consideration at their fair value on the
acquisition date. The purchase price allocation process requires management to
make significant estimates and assumptions, especially at acquisition date with
respect to intangible assets, estimated contingent consideration payments and
pre-acquisition contingencies. Although we believe the assumptions and estimates
we have made have been reasonable and appropriate, they are based in part on
historical experience and information obtained from the management of the
acquired company and are inherently uncertain. Examples of critical estimates in
accounting for acquisitions include but are not limited to:
- the estimated fair value of the
acquisition-related contingent consideration, which is calculated using a
probability-weighted discounted cash flow model based upon the forecasted
achievement of post acquisition bookings targets;
- the future expected cash flows
from product sales, support agreements, consulting contracts, other customer
contracts and acquired developed technologies and patents;
and
- the relevant discount rates.
Unanticipated events and circumstances may occur which may affect the
accuracy or validity of such assumptions, estimates or actual results.
Additionally, any change in the fair value of the acquisition-related contingent
consideration subsequent to the acquisition date, including changes from events
after the acquisition date, such as changes in our estimate of the bookings that
are expected to be achieved, will be recognized in earnings in the period of the
estimated fair value change. A change in fair value of the acquisition-related
contingent consideration could have a material effect on the statement of
operations and financial position in the period of the change in
estimate.
Goodwill. In
connection with acquisitions of operating entities, we recognize the excess of
the purchase price over the fair value of the net assets acquired as goodwill.
Goodwill is not amortized, but is evaluated for impairment, at the reporting
unit level, annually in our third quarter as of August 1. Goodwill of a
reporting unit also is tested for impairment on an interim basis in addition to
the annual evaluation if an event occurs or circumstances change which would
more likely than not reduce the fair value of a reporting unit below its
carrying amount. Changes in operating performance, market conditions and other
factors may adversely impact estimates of expected future cash flows. Any
impairment indicated by this analysis would be measured as the amount by which
the carrying value exceeds estimated fair value based on forecasted cash flows,
discounted at a rate commensurate with the risks involved.
Goodwill is evaluated at the reporting unit level, which is equivalent to
our business segments. We have three reporting segments, the Software segment,
Servers and Storage segment and Media Services segment. The goodwill balance as
of January 31, 2010 is as follows:
| Servers & | Media | |||||||||||
| Software | Storage | Services | Totals | |||||||||
| (in thousands ) | ||||||||||||
| Goodwill | $ | 35,536 | $ | 754 | $ | 19,586 | $ | 55,876 | ||||
On August 1, 2009, we performed our annual impairment testing of goodwill
for each of the reporting units with goodwill balances. We first calculated the
fair value of each reporting unit using a discounted cash flow methodology. We
then performed “Step 1” and compared the fair value of each reporting unit of
accounting to its carrying value as of August 1, 2009.
The process of evaluating goodwill for impairment requires several
judgments and assumptions to be made to determine the fair value of the
reporting units, including the method used to determine fair value, discount
rates, expected levels of cash flows, revenues and earnings, and the selection
of comparable companies used to develop market based assumptions. Consistent
with prior years, we employed a five year discounted cash flow methodology to
arrive at the fair value of each reporting unit. In calculating the fair value,
we derived the standalone projected five year cash flows for all three reporting
units. This process starts with the projected cash flows of each of the three
reporting units and then the cash flows are discounted. We use the discounted
cash flow methodology as our principal technique as we believe that the
discounted cash flows approach provides greater detail and opportunity to
reflect facts, circumstances and economic conditions for each reporting
unit.
34
We determined that based on our annual goodwill test, the reporting fair
values of all three of our reporting units containing goodwill balances exceeded
their carrying values. In aggregate, there was excess fair value over the
carrying value of the net assets ranging from $53-$73 million. Below is a
summary of the fair values ranges calculated by the company as of August 1,
2009:
| Premium Ranges over | ||
| Carrying Value | ||
| Software | 102%-138% | |
| Servers and Storage | 67%-102% | |
| Media Services | 15% |
Key data points included in the
market capitalization calculation were as follows:
- Shares outstanding as of August 1,
2009: 30.9 million; and
- Trailing 32 day average closing price as of August 1, 2009: $8.30 per share.
Accordingly, as no impairment indicator existed as of August 1, 2009, our
annual impairment test date, and the implied fair value of goodwill exceeded the
carrying value of any of our three reporting units, we determined that goodwill
was not at risk of failing “Step 1” and was appropriately stated as of August 1,
2009.
To validate our conclusions and determine the reasonableness of our
annual impairment test, we also performed the following:
- Reconciled our estimated
enterprise value to market capitalization comparing the aggregate, calculated
fair value of our reporting units to our market capitalization as of August 1,
2009, our annual impairment test date. As compared with the market
capitalization value of $256 million as of August 1, 2009, the aggregate
carrying values of our three reporting units was approximately $178
million;
- Prepared a “reporting unit” fair
value calculation using discounted cash flows;
- Reviewed the historical operating
performance of each reporting unit for the current fiscal
year;
- Performed a sensitivity analysis
on key assumptions such as weighted-average cost of capital and terminal
growth rates; and
- Reviewed market participant assumptions.
The discounted cash flows used to estimate fair values were based on
assumptions regarding each reporting unit’s estimated projected future cash
flows and estimated weighted-average cost of capital that a market participant
would use in evaluating the reporting unit in a purchase transaction. We
employed one weighted-average cost of capital rate for all our reporting units.
The estimated weighted-average cost of capital was based on the risk-free
interest rate and other factors such as equity risk premiums and the ratio of
total debt to equity capital. In performing the annual impairment tests, we took
steps to ensure appropriate and reasonable cash flow projections and assumptions
were used. The average rate used to discount the estimated future cash flows for
each of the reporting units was 18%.
Our projections for the next five years included increased revenue and
operating expenses, in line with the expected revenue growth over the next five
years based on current market and economic conditions and our historical
knowledge of the reporting units. Historical growth rates served as only one
input to the projected future growth used in the goodwill impairment analysis.
These historical growth rates were adjusted based on other inputs from
management regarding anticipated customer contracts. We projected growth for
each reporting unit ranging from 8% to 17% annually for the Software and Servers
and Storage segments, and from 11% to 26% annually for the Media Services
segment. The higher projected growth for the Media Services segment is due to
the recent contract wins by ODG and Mobix. We estimated the operating expenses
based on a rate consistent with the current experience for each reporting unit
and estimated revenue growth over the next five years. The failure of any of our
reporting units to execute as forecasted over the next five years could have an
adverse affect on our annual impairment test. Future adverse changes in market
conditions or poor operating results of the reporting unit could result in
losses or an inability to recover the carrying value of the investments in
reporting units, thereby possibly requiring an impairment charge in the future.
We record an impairment charge when we believe an investment has experienced a
decline in value that is other-than-temporary.
35
We also monitor economic, legal and other factors as a whole and for each
reporting unit between annual impairment tests to ensure that there are no
indicators that make it more likely than not that there has been a decline in
the fair value of the reporting unit below its carrying value. Specifically, we
monitor industry trends, our market capitalization, recent and forecasted
financial performance of our reporting units and the timing and nature of any
restructuring activities. If these estimates or the related assumptions change,
we may be required to record non-cash impairment charges for these assets in the
future.
During the fourth quarter of fiscal 2010, the Company evaluated the
impairment analysis and updated for the change in market capitalization as from
August 1, 2009 to January 31, 2010. While no impairment charges resulted from
the analyses performed during the fourth quarter of fiscal 2010, impairment
charges may occur in the future due to changes in projected revenue growth
rates, projected operating margins or estimated discount rates, among other
factors. Historical or projected revenues or cash flows may not be indicative of
actual future results. Due to uncertain market conditions, it is possible that
future impairment reviews may indicate additional impairments of goodwill and/or
other intangible assets, which could result in charges that could be material to
our results of operations and financial position.
Long –Lived Assets.
SeaChange also evaluates property and equipment, investments, intangible assets
and other long-lived assets on a regular basis for the existence of facts or
circumstances, both internal and external that may suggest an asset is not
recoverable. If such circumstances exist, SeaChange evaluates the carrying value
of long-lived assets to determine if impairment exists based upon estimated
undiscounted future cash flows over the remaining useful life of the assets and
compares that value to the carrying value of the assets. SeaChange’s cash flow
estimates contain management’s best estimates, using appropriate and customary
assumptions and projections at the time.
Intangible assets consist of customer contracts, completed technology,
in-process research and development, non-competition agreements, patents and
trademarks and are respectively assigned to the operating segments. The
intangible assets are amortized to cost of sales and operating expenses, as
appropriate, on a straight-line or accelerated basis in order to reflect the
period that the assets will be consumed. In-process research and development
assets as of the acquisition date were recorded as indefinite-lived intangible
assets and will be subject to impairment testing at least annually. The useful
life of the intangible asset recognized will be reconsidered if and when an
in-process research and development project is completed or
abandoned.
SeaChange develops software for resale in markets that are subject to
rapid technological change, new product development and changing customer needs.
The time period during which software development costs can be capitalized from
the point of reaching technological feasibility until the time of general
product release is very short, and consequently, the amounts that could be
capitalized are not material to the Company’s financial position or results of
operations. Software development costs relating to sales of software requiring
significant modification or customization are charged to costs of product
revenues.
Amortization expense of capitalized software is recorded over the period
of economic consumption or the life of the agreement, whichever results in the
higher expense, starting with the first shipment of the product to a customer.
Amortization expense of capitalized software was $5,000 and $100,000 for the
fiscal years ended January 31, 2010 and 2009, respectively.
Accounting for Income Taxes. As part of the process of preparing our financial statements, we are
required to estimate our provision for income taxes in each of the jurisdictions
in which we operate. This process involves estimating our actual current tax
exposure, including assessing the risks associated with tax audits, together
with assessing temporary differences resulting from the different treatment of
items for tax and accounting purposes. These differences result in deferred tax
assets and liabilities, which are included within our balance sheet.
36
Deferred income tax assets and liabilities are recognized for the future
tax consequences attributable to differences between the financial statement
carrying amounts of existing assets and liabilities and their respective income
tax bases, and operating loss and tax credit carryforwards. We evaluate the
weight of all available evidence to determine whether it is more likely than not
that some portion or all of the deferred income tax assets will not be realized.
We will record a valuation allowance if the likelihood of realization of the
deferred tax assets in the future is reduced based on an evaluation of objective
verifiable evidence. Significant management judgment is required in determining
our income tax provision, our deferred tax assets and liabilities and any
valuation allowance recorded against our deferred tax assets. We have
established a valuation allowance against our United States deferred tax assets
due to indications that they may not be fully realized. The amount of the
deferred tax asset considered realizable is subject to change based on future
events, including generating sufficient pre-tax income in future periods. In the
event that actual results differ from these estimates, our provision for income
taxes could be materially impacted. SeaChange does not provide for U.S. federal
and state income taxes on the undistributed earnings of its non-U.S.
subsidiaries that are considered indefinitely reinvested in the operations
outside the U.S.
Authoritative guidance as it relates to income tax liabilities states
that the minimum threshold a tax position is required to meet before being
recognized in the financial statements is “more likely than not” (i.e., a
likelihood of occurrence greater than fifty percent). The recognition threshold
is met when an entity concludes that a tax position, based solely on its
technical merits, is more likely than not to be sustained upon examination by
the relevant taxing authority. Those tax positions failing to qualify for
initial recognition are recognized in the first interim period in which they
meet the more likely than not standard, or are resolved through negotiation or
litigation with the taxing authority, or upon expiration of the statute of
limitations. Derecognition of a tax position that was previously recognized
occurs when an entity subsequently determines that a tax position no longer
meets the more likely than not threshold of being sustained.
We file annual income tax returns in multiple taxing jurisdictions around
the world. A number of years may elapse before an uncertain tax position is
audited and finally resolved. While it is often difficult to predict the final
outcome or the timing of resolution of any particular uncertain tax position, we
believe that our reserves for income taxes reflect the most likely outcome. We
adjust these reserves as well as the related interest and penalties, in light of
changing facts and circumstances. If our estimate of tax liabilities proves to
be less than the ultimate assessment, a further charge to expense would result.
If payment of these amounts ultimately proves to be unnecessary, the reversal of
the liabilities would result in tax benefits being recognized in the period when
we determine the liabilities are no longer necessary. The changes in estimate
could have a material impact on our financial position and operating results. In
addition, settlement of any particular position could have a material and
adverse effect on our cash flows and financial position.
Share-based Compensation. We account for all employee and non-employee director stock-based
compensation awards using the authoritative guidance regarding share based
payments. We have continued to use the Black-Scholes pricing model as the most
appropriate method for determining the estimated fair value of all applicable
awards. Determining the appropriate fair value model and calculating the fair
value of share-based payment awards requires the input of highly subjective
assumptions, including the expected life of the share-based payment awards and
stock price volatility. Management estimated the volatility based on the
historical volatility of our stock. The assumptions used in calculating the fair
value of share-based payment awards represent management’s best estimates, but
these estimates involve inherent uncertainties and the application of
management’s judgment. As a result, if circumstances change and we use different
assumptions, our share-based compensation expense could be materially different
in the future. In addition, we are required to estimate the expected forfeiture
rate and only recognize expense for those shares expected to vest. If our actual
forfeiture rate is materially different from our estimate, the share-based
compensation expense could be significantly different from what we have recorded
in the current period. The estimated fair value of SeaChange’s stock-based
options and performance-based restricted stock units, less expected forfeitures,
is amortized over the awards’ vesting period on a graded vesting basis, whereas
the restricted stock units and Employee Stock Purchase Plan stock units are
amortized on a straight line basis.
Restructuring. During the first quarter of fiscal 2011, the Company completed a
restructuring and will record restructuring charges primarily related to
employee severance. Restructuring charges represent our best estimate of the
associated liability at the date the charges are recognized. Adjustments for
changes in assumptions are recorded as a component of operating expenses in the
period they become known. Differences between actual and expected charges and
changes in assumptions could have a material effect on our restructuring accrual
as well as our consolidated results of operations.
37
Foreign Currency Translation. For subsidiaries where the U.S. dollar is
designated as the functional currency of the entity, we translate that entity’s
monetary assets and liabilities denominated in local currencies into U.S.
dollars (the functional and reporting currency) at current exchange rates, as of
each balance sheet date. Non-monetary assets (e.g., inventories, property,
plant, and equipment and intangible assets) and related income statement
accounts (e.g., cost of sales, depreciation, amortization of intangible assets)
are translated at historical exchange rates between the functional currency (the
U.S. dollar) and the local currency. Revenue and other expense items are
translated using average exchange rates during the fiscal period. Translation
adjustments and transaction gains and losses on foreign currency transactions,
and any unrealized gains and losses on short-term inter-company transactions are
included in other income or expense, net.
For subsidiaries where the local currency is designated as the functional
currency, we translate the subsidiaries’ assets and liabilities into U.S.
dollars (the reporting currency) at current exchange rates as of each balance
sheet date. Revenue and expense items are translated using average exchange
rates during the period. Cumulative translation adjustments are presented as a
separate component of stockholders’ equity. Exchange gains and losses on foreign
currency transactions and unrealized gains and losses on short-term
inter-company transactions are included in other income or expense,
net.
The aggregate foreign exchange transaction losses included as other
expense, net on the Consolidated Statement of Operations were $572,000, $951,000
and $43,000 for the years ended January 31, 2010, 2009 and 2008, respectively.
Non GAAP Measures
As part of our ongoing review of financial information related to our business,
we regularly use non-GAAP measures, in particular adjusted non-GAAP earnings per
share, as we believe they provide a meaningful insight into our business and
trends. We also believe that these adjusted non-GAAP measures provide readers of
our financial statements with useful information and insight with respect to the
results of our business. However, the presentation of adjusted non-GAAP
information is not intended to be considered in isolation or as a substitute for
results prepared in accordance with GAAP. Below are tables for 2010, 2009 and
2008 which detail and reconcile GAAP and adjusted non-GAAP earnings per share:
| Twelve months Ended | Twelve months Ended | Twelve months Ended | ||||||||||||||||||||||||||
| January 31, 2010 | January 31, 2009 | January 31, 2008 | ||||||||||||||||||||||||||
| GAAP | Adjustment | Non-GAAP | GAAP | Adjustment | Non-GAAP | GAAP | Adjustment | Non-GAAP | ||||||||||||||||||||
| Revenues | $ | 201,665 | $ | 1,807 | $ | 203,472 | $ | 201,836 | $ | - | $ | 201,836 | $ | 179,893 | $ | - | $ | 179,893 | ||||||||||
| Operating expenses: | 101,051 | 101,051 | 93,102 | - | 93,102 | 88,964 | - | 88,964 | ||||||||||||||||||||
| Stock-based compensation | - | 3,105 | 3,105 | - | 3,954 | 3,954 | - | 3,978 | 3,978 | |||||||||||||||||||
| Amortization of intangible assets - eventIS | - | 978 | 978 | - | - | - | - | - | - | |||||||||||||||||||
| Amortization of intangible assets - other | - | 2,487 | 2,487 | - | 2,025 | 2,025 | - | 4,205 | 4,205 | |||||||||||||||||||
| Acquisition related costs | - | 1,413 | 1,413 | - | - | - | - | - | - | |||||||||||||||||||
| Restructuring | 6,000 | 6,000 | ||||||||||||||||||||||||||
| 101,051 | 7,983 | 109,034 | 93,102 | 5,979 | 87,123 | 88,964 | 14,183 | 103,147 | ||||||||||||||||||||
| Income from operations | 2,202 | 9,790 | 11,992 | 10,194 | 5,979 | 16,173 | (8,000 | ) | 14,183 | 6,183 | ||||||||||||||||||
| Income tax impact expense (benefit) | 371 | 3,106 | 3,477 | 575 | 2,073 | 2,648 | 2,156 | 4,895 | 7,051 | |||||||||||||||||||
| Net income | $ | 1,323 | $ | 6,684 | $ | 8,007 | $ | 9,974 | $ | 3,906 | $ | 13,880 | $ | 2,902 | $ | 9,288 | $ | 12,190 | ||||||||||
| Diluted income per share | $ | 0.04 | $ | 0.21 | $ | 0.25 | $ | 0.32 | $ | 0.12 | $ | 0.44 | $ | 0.10 | $ | 0.31 | $ | 0.41 | ||||||||||
| Diluted weighted average common shares | ||||||||||||||||||||||||||||
| outstanding | 31,433 | 31,433 | 31,433 | 31,192 | 31,192 | 31,192 | 30,000 | 30,000 | 30,000 | |||||||||||||||||||
In managing and reviewing our business performance, we exclude a number
of items required by GAAP. Management believes that excluding these items
mentioned below is useful in understanding trends and managing our operations.
We believe it is useful for investors to understand the effects of these items
on our total operating expenses.
Deferred software revenue: Business combination accounting rules require us to account for the
fair value of customer contracts assumed in connection with our acquisitions. In
connection with the acquisition of eventIS Group B.V. on September 1, 2009, the
book value of our deferred software revenue was reduced by approximately $5.3
million in the adjustment to fair value. Because these customer contracts may
take up to 18 months to complete, our GAAP revenues subsequent to this
acquisition do not reflect the full amount of software revenues on assumed
customer contracts that would have otherwise been recorded by eventIS Group B.V.
We believe this adjustment is useful to investors as a measure of the ongoing performance of our
business because we have historically experienced high renewal rates on similar
customer contracts, although we cannot be certain that customers will renew
these contracts.
38
Stock-based compensation expenses: We have excluded the effect of stock-based
compensation and stock-based payroll expenses from our non-GAAP operating
expenses and net income measures. Although stock-based compensation is a key
incentive offered to our employees, we continue to evaluate our business
performance excluding stock-based compensation expenses. Stock-based
compensation expenses will recur in future periods.
Amortization of intangible assets: We have excluded the effect of amortization
of intangible assets from our non-GAAP operating expenses and net income
measures. Amortization of intangibles is inconsistent in amount and frequency
and is significantly affected by the timing and size of our
acquisitions.
Acquisition related and other expenses: We incurred significant expenses in
connection with our acquisitions of eventIS Group B.V. and VividLogic, Inc. and
also incurred certain other operating expenses, which we generally would not
have otherwise incurred in the periods presented as a part of our continuing
operations. Acquisition related and other expenses consist of transaction costs,
costs for transitional employees, other acquired employee related costs, and
integration related professional services.
Restructuring: We
incurred charges due to the restructuring of our business including severance
charges and impairment charges related to capitalized software licenses, which
we generally would not have otherwise incurred in the periods presented as part
of our continuing operations.
39
Fiscal Year Ended January 31, 2010 Compared to
the Fiscal Year Ended January 31, 2009
The following table sets forth summarized consolidated financial
information for each of the two fiscal years ended January 31, 2010 and
2009.
| Year Ended | ||||||||
| January 31, | ||||||||
| 2010 | 2009 | |||||||
| (in thousands ) | ||||||||
| Revenues: | ||||||||
| Products | $ | 101,941 | $ | 117,372 | ||||
| Services | 99,724 | 84,464 | ||||||
| Total revenues | 201,665 | 201,836 | ||||||
| Costs and expenses: | ||||||||
| Cost of product revenues | 38,961 | 46,533 | ||||||
| Cost of service revenues | 59,451 | 52,007 | ||||||
| Research and development | 50,664 | 43,042 | ||||||
| Selling and marketing | 25,842 | 27,506 | ||||||
| General and administrative | 21,719 | 20,979 | ||||||
| Amortization of intangibles | 2,826 | 1,575 | ||||||
| Income from operations | 2,202 | 10,194 | ||||||
| Other income, net | 145 | 1,125 | ||||||
| Income before income taxes and equity income in earnings of affiliates | 2,347 | 11,319 | ||||||
| Income tax expense | 371 | 575 | ||||||
| Equity loss in earnings of affiliates, net of tax | (653 | ) | (770 | ) | ||||
| Net income | $ | 1,323 | $ | 9,974 | ||||
Revenues
The following table summarizes information about the Company’s reportable
segments for each of the two fiscal years ended January 31, 2010 and
2009.
40
| Fiscal Year Ended | |||||||||
| January 31, | |||||||||
| 2010 | 2009 | % | |||||||
| (in thousands, except for percentage data) | |||||||||
| Software revenues: | |||||||||
| Product | $ | 66,968 | $ | 78,397 | -15 | % | |||
| Services | 64,346 | 53,840 | 20 | % | |||||
| Total Software revenues | $ | 131,314 | $ | 132,237 | -1 | % | |||
| Servers and Storage revenues: | |||||||||
| Products | $ | 34,974 | $ | 38,975 | -10 | % | |||
| Services | 15,583 | 14,665 | 6 | % | |||||
| Total Servers and Storage revenues | $ | 50,557 | $ | 53,640 | -6 | % | |||
| Media Services Revenue: | |||||||||
| Services | $ | 19,794 | $ | 15,959 | 24 | % | |||
| Total consolidated revenue: | |||||||||
| Product | $ | 101,942 | $ | 117,372 | -13 | % | |||
| Services | 99,723 | 84,464 | 18 | % | |||||
| Total consolidated revenues | $ | 201,665 | $ | 201,836 | 0 | % | |||
Product Revenue. Product revenue decreased 13% to $101.9
million in the fiscal year ended January 31, 2010 from $117.4 million in the
fiscal year ended January 31, 2009. Product revenues from the Software segment
accounted for 66% and 67% of the total product revenues in the years ended
January 31, 2010 and 2009, respectively. The Servers and Storage segment
accounted for 34% and 33% of total product revenues in the fiscal years ended
January 31, 2010 and 2009, respectively. The decrease in product revenues
between years is primarily due to lower Advertising Insertion and Broadcast
product revenues which was attributable to weaker advertising revenues for our
customers resulting in reduced capital spending for these products.
Service Revenue. Service revenues increased 18% to $99.7
million in the fiscal year ended January 31, 2010 from $84.5 million in the
fiscal year ended January 31, 2009. Service revenue for the Software segment
accounted for 65% and 64% of the total services revenue in the fiscal years
ended January 31, 2010 and 2009, respectively. Servers and Storage services
revenue accounted for 16% and 17% of total services revenue in the fiscal year
ended January 31, 2010 and 2009, respectively, while Media Services revenue
accounted for 19% of total services revenue for the fiscal years ended January
31, 2010 and 2009. The increase in Services revenues was primarily in our
Software segment and was due to increased VOD support maintenance and
professional services and the inclusion of five months of eventIS for fiscal
2010, and is also due to higher contract revenues in our Media Services segment.
For the fiscal year ended January
31, 2010 and 2009, two customers each accounted for more than 10%, and
collectively accounted for 39% and 43%, respectively, of our total revenues.
Revenues from these customers were primarily in the Software and Servers and
Storage segment. We believe that a significant amount of our revenues will
continue to be derived from a limited number of customers.
International products and services
revenues accounted for approximately 35% or $71.6 million and 36% or $72.7
million of total revenues in the fiscal years ended January 31, 2010 and 2009,
respectively. We expect that international products and services revenues will
remain a significant portion of our business in the future. A majority of our
international sales are made in United States dollars (USD), and for the fiscal
years 2010 and 2009, approximately 67% and 78%, of international revenues were
transacted in USD.
41
Software Revenue. Revenues from our software segment decreased
1% to $131.3 million in the fiscal year ended January 31, 2010 from $132.2
million in the fiscal year ended January 31, 2009. The year over year decline in
software product revenues was primarily due to significantly lower software
licensing revenue from our Advertising Insertion products and our Broadcast
software products due to the unfavorable advertising environment for our
customers for those products as noted above. In addition, there were also two
large nonrecurring orders during our fiscal 2009 for our VODlink and VOD
hospitality software products. These decreases were partially offset by higher
software licensing revenues of Axiom and higher VOD subscription revenue
primarily from two large U.S. customers. In addition we had higher shipments of
our VOD AdPulse software products primarily to Virgin Media.
The 20% increase in service revenue for the Software segment was
primarily due to higher VOD product maintenance revenues from a growing
installed base of products, higher VOD software installation revenues and the
inclusion of five months of eventIS for fiscal 2010.
Servers and Storage Revenue. Revenues from the Server and Storage segment
decreased 6% to $50.6 million for the fiscal year ended January 31, 2010 from
$53.6 for the fiscal year ended January 31, 2009. The decrease in servers and
storage product revenues of 10% compared to the previous year was due primarily
to lower order driven Broadcast server revenue partially offset by higher
increased shipments of VOD servers primarily to two large U.S. service
providers, a large customer in Latin America and several customers in China. The
6% year over year increase in services revenue in the Servers and Storage
segment is due to increased installation revenue for VOD server products year
over year.
Media Services Revenue. Revenues from Media Services increased 24% to $19.8 million in the year
ended January 31, 2010 compared to the year ended January 31, 2009. The increase
in revenue was due primarily to a full year’s impact of revenue from customers
in Greece and Turkey for which we began to recognize revenue late in fiscal year
2009 and the recent contract wins during fiscal year with customers in France,
Dubai and Cyprus.
Product Gross Profit. Costs of product revenues consist primarily of the cost of purchased
material components and subassemblies, labor and overhead relating to the final
assembly and testing of complete systems and related expenses, and labor and
overhead costs related to software development contracts. The gross profit
percentage for products increased from 60% in the fiscal year ended January 31,
2009 to 62% in the fiscal year ended January 31, 2010. The year over year
increase in product gross profit percentages between years was due mainly to
higher margin VOD software products accounting for a greater portion of total
product revenues combined with lower Broadcast server products revenues, which
typically carry lower margins.
Services Gross Profit. Cost of services revenues consist primarily of labor, materials and
overhead relating to the installation, training, product maintenance and
technical support, software development, project management and costs associated
with providing media services. The service gross profit percentage increased 2%
year over year due primarily to the inclusion of eventIS for five months of
fiscal 2010.
Software Gross Profit. Software segment gross margin was 61% and 58% in the years ended January
31, 2010 and 2009, respectively. The increase in product gross profit
percentages between years is due mainly to a more favorable product mix of
higher margin VOD software products and higher Software services maintenance
revenue year over year with comparable headcount-related costs.
Servers and Storage Gross Profit. Servers and Storage segment gross margin of
40% in the year ended January 31, 2010 was six points lower than in the year
ended January 31, 2009 due to increased shipments of lower margin VOD servers
due to lower product pricing for a large U.S. customer and lower service margins
as a result of higher VOD server headcount-related costs to service the larger
installed base of products.
Media Services Gross Profit. Media Services segment gross margin of 17% in
the year ended January 31, 2010 was two points higher than in the year ended
January 31, 2009 due principally to absorbing all content processing in-house
that was previously provided by a third party. This occurred during our second
and third quarters of fiscal 2010 and we expect to receive the full year’s
benefits in fiscal 2011.
Research and Development. Research and development expenses consist primarily of the compensation
of development personnel, depreciation of development and test equipment and an
allocation of related facilities expenses. Research and development expenses
were 25% and 21% of total revenues for fiscal year ended January 31, 2010 and
2009, respectively, and increased $7.6 million year over year. The increase year
over year is primarily due to increased headcount costs related to the VOD and
TV Navigator product lines, increased facilities-related expenses and five
months of eventIS for fiscal 2010. We
expect that total research and development expenses will increase in the fiscal
year 2011 primarily due to a full year’s impact of the recent acquisitions of
eventIS and VividLogic
42
Selling and Marketing. Selling and marketing expenses consist primarily of compensation
expenses, including sales commissions, travel expenses and certain promotional
expenses. Selling and marketing expenses decreased 6% from $27.5 million or 14%
of total revenues in the fiscal year ended January 31, 2009 to $25.8 million, or
13% of total revenues, in the fiscal year ended January 31, 2010. This decrease
in total expenses is primarily due to lower compensation and benefits of $1.3
million, $800,000 of lower external commission and $300,000 in travel offset by
the inclusion of five months of eventIS in fiscal 2010. We expect that in total
selling and marketing expenses will increase in fiscal year 2011 as we will have
a full year’s impact of the recent acquisition of eventIS.
General and Administrative. General and administrative expenses consist primarily of the
compensation of executive, finance, human resource and administrative personnel,
legal and accounting services and an allocation of related facilities expenses.
In the fiscal year ended January 31, 2010, general and administrative expenses
of $21.7 million, or 11% of total revenues, increased 4% from $21.0 million, or
10% of total revenues, in the fiscal year ended January 31, 2009. General and
administrative expenses increased primarily due to acquisition-related costs of
$1.4 million and professional fees of $400,000 offset by lower compensation
expense and benefits of $400,000 and bad debt expense of $700,000.
Amortization of Intangibles. Amortization expense consists of the
amortization of acquired intangible assets which are operating expenses and not
considered costs of revenues. Amortization of intangible assets increased from
$1.6 million in the fiscal year ended January 31, 2009 to $2.8 million in the
fiscal year ended January 31, 2010 which included a full years impact of
amortization expense for our Mobix intangible assets which were acquired in
November 2008, and five months of amortization expense of eventIS intangible
assets which were acquired on September 1, 2009. Amortization is also based on the future
economic value of the related intangible assets which is generally higher in the
earlier years of the assets’ lives. We expect amortization expense to increase
as we include in fiscal 2011 the full year’s impact of the recent eventIS and
VividLogic acquisitions.
An additional $638,000 and $350,000 of amortization expense related to
acquired technology was charged to cost of sales for the years ended January 31,
2010 and 2009, respectively.
Other income (expense).
The table below provides
detail regarding our other income (expense):
| Fiscal Year ended | ||||||||
| January 31, | ||||||||
| 2010 | 2009 | |||||||
| (in thousands) | ||||||||
| Interest income | $ | 763 | $ | 2,107 | ||||
| Interest expense | (156 | ) | (57 | ) | ||||
| Foreign exchange (loss) | (572 | ) | (951 | ) | ||||
| Gain on sale of fixed assets | 22 | - | ||||||
| Gain on sale of marketable securities | 88 | 26 | ||||||
| $ | 145 | $ | 1,125 | |||||
Interest Income.
Interest income, net was $600,000 in the fiscal year ended January 31, 2010 and
$2.1 million in the fiscal year ended January 31, 2009. The decrease in interest
income is primarily due to the lower cash balance in fiscal 2010 compared to
fiscal 2009 due to our recent acquisitions of eventIS and Mobix, the purchase of
our London facility and lower prevailing interest rates earned on our marketable
securities.
Foreign exchange (loss). The decrease in foreign exchange losses was a result of the change in
rates between the USD and foreign currencies during fiscal 2010 compared to
fiscal 2009. In light of the high proportion of our international businesses, we
expect the risk of any adverse movements in foreign currency exchange rates
could have an impact on our results within the Consolidated Statements of
Operations.
43
Equity Loss in Earnings of Affiliates. Equity loss in earnings of affiliates was
$653,000 in the fiscal year ended January 31, 2010 compared with $770,000 in
equity loss in earnings of affiliates for fiscal year-ended January 31, 2009.
The equity loss in earnings of affiliates consists of our 50% ownership share of
On Demand Deutschland GmbH & Co. KG, our German joint venture, under the
equity method of accounting.
Income Tax Provision. Our effective tax rate and income tax provision for fiscal 2010 was 16%
and $371,000 compared to an effective tax rate of 5% and $600,000 for the fiscal
year ended January 31, 2009. The difference between the underlying effective tax
rate for the year ended January 31, 2010 and the federal statutory rate of 35%
is primarily due to income tax expense on foreign source pre-tax income
generated at our international subsidiaries which carry lower tax rates. In
addition, the Company tax rate decreased in the U.S. based on the benefit of
releasing a portion of the valuation for the utilization of foreign tax credits
and Federal research and development credits.
At January 31, 2010 and 2009, we provided a valuation allowance for the
full amount of U.S. net deferred tax assets due to the uncertainty of
realization of those assets. We will continue to assess the need for the
valuation allowance at each balance sheet date based on all available evidence.
If we determine that we can realize some portion or all of the net deferred tax
assets, the valuation allowance would be reversed and a corresponding increase
in net income would be recognized during the period.
44
Fiscal Year Ended January 31, 2009 Compared to
the Fiscal Year Ended January 31, 2008
The following table sets forth summarized consolidated financial
information for each of the two fiscal years ended January 31, 2009 and
2008.
| Year Ended | ||||||||
| January 31, | ||||||||
| 2009 | 2008 | |||||||
| (in thousands) | ||||||||
| Revenues: | ||||||||
|
Products
|
$ | 117,372 | $ | 105,769 | ||||
|
Services
|
84,464 | 74,124 | ||||||
| Total revenues | 201,836 | 179,893 | ||||||
| Costs and expenses: | ||||||||
|
Cost of product revenues
|
46,533 | 52,464 | ||||||
|
Cost of service revenues
|
52,007 | 46,465 | ||||||
|
Research and development
|
43,042 | 42,699 | ||||||
|
Selling and marketing
|
27,506 | 23,073 | ||||||
|
General and administrative
|
20,979 | 20,240 | ||||||
|
Amortization of intangibles
|
1,575 | 2,952 | ||||||
| Income (loss) from operations | 10,194 | (8,000 | ) | |||||
|
Other income, net
|
1,125 | 1,884 | ||||||
|
Gain on sale of investment in
affiliate
|
- | 10,031 | ||||||
| Income before income taxes and equity income in earnings of affiliates | 11,319 | 3,915 | ||||||
| Income tax expense | 575 | 2,156 | ||||||
| Equity (loss) income in earnings of affiliates, net of tax | (770 | ) | 1,143 | |||||
| Net income | $ | 9,974 | $ | 2,902 | ||||
Revenues
The following table summarizes information about the Company’s reportable
segments for each of the two fiscal years ended January 31, 2009 and 2008.
Segment data for fiscal 2008 is presented on a basis consistent with the fiscal
2009 data and the changed reporting data segment structure.
45
| January 31, | |||||||||||
| 2009 | 2008 | % | |||||||||
| (in thousands, except for percentage data) | |||||||||||
| Software revenues: | |||||||||||
|
Products
|
$ | 78,397 | $ | 69,762 | 12 | % | |||||
|
Services
|
53,840 | 43,507 | 24 | % | |||||||
| Total Software revenues | $ | 132,237 | $ | 113,269 | 17 | % | |||||
| Servers and Storage revenues: | |||||||||||
|
Products
|
$ | 38,975 | $ | 36,007 | 8 | % | |||||
|
Services
|
14,665 | 12,990 | 13 | % | |||||||
| Total Servers and Storage revenues | $ | 53,640 | $ | 48,997 | 9 | % | |||||
| Media Services Revenue: | |||||||||||
|
Services
|
$ | 15,959 | $ | 17,627 | -9 | % | |||||
| Total consolidated revenue: | |||||||||||
|
Products
|
$ | 117,372 | $ | 105,769 | 11 | % | |||||
|
Services
|
84,464 | 74,124 | 14 | % | |||||||
| Total consolidated revenues | $ | 201,836 | $ | 179,893 | 12 | % | |||||
Product Revenue. Product revenue increased 11% to $117.4 million in the fiscal year ended
January 31, 2009 from $105.8 million in the fiscal year ended January 31, 2008.
Product revenues from the Software segment accounted for 67% and 66% of the
total product revenues in the years ended January 31, 2009 and 2008,
respectively. The Servers and Storage segment accounted for 33% and 34% of total
product revenues in the fiscal years ended January 31, 2009 and 2008,
respectively.
Service Revenue.
Service revenues increased 14% to $84.5 million in the fiscal year ended January
31, 2009 from $74.1 million in the fiscal year ended January 31, 2008. Services
revenue for the Software segment accounted for 64% and 59% of the total services
revenue in the fiscal years ended January 31, 2009 and 2008, respectively.
Servers and Storage services revenue accounted for 17% and 18% of total services
revenue in the fiscal year ended January 31, 2009 and 2008, respectively, while
Media Services revenue accounted for 19% and 23% of total services revenue for
the fiscal years ended January 31, 2009 and 2008, respectively.
For the fiscal year ended January 31, 2009, two customers each accounted
for more than 10% and collectively accounted for 43% of our total revenues and
these same two customers each accounted for more than 10% and collectively
accounted for 45% of our total revenues for the year ended January 31, 2008.
Revenues from these customers were primarily in the Software and Servers and
Storage segment.
International products and services revenues accounted for approximately
36% or $72.7 million and 38% or $ 68.4 million of total revenues in the fiscal
years ended January 31, 2009 and 2008, respectively. A majority of our
international sales are made in United States dollars (USD), and for the fiscal
years 2009 and 2008, approximately 78% and 74%, of international revenues were
transacted in USD.
Media Services has designated the Great Britain Pound (GBP) as its
functional currency. For the fiscal years 2009 and 2008, approximately 76% and
85%, respectively of the Media Services revenues were sales in GBP and 24% and
11%, respectively were made in Euros. During the third and fourth quarter of
fiscal 2009, Media Services’ financial results were translated to USD for
reporting purposes, and the depreciation of the GBP compared to the USD has
impacted the amount of revenue recorded by our Media Services during fiscal
2009.
Software Revenue.
Revenues from our software segment increased 17% to $132.2 million in the fiscal
year ended January 31, 2009 from $113.3 million in the fiscal year ended January
31, 2008. The year over year growth was primarily due to increased software
licensing revenue from shipments of Advertising Insertion, Axiom, VODlink, Media
Client and our VOD hospitality software products which were partially offset by
$7.9 million of lower software subscription revenues from Comcast. The 24%
increase in service revenue for the Software segment was primarily due to higher
Advertising and VOD product maintenance revenues from a growing installed base
of products and installation revenue from the completion of several large
projects during fiscal 2009.
46
Servers and Storage Revenue. Revenues from the Server and Storage segment
increased 9% to $53.6 million for the fiscal year ended January 31, 2009 from
$49.0 for the fiscal year ended January 31, 2008. The increase in product
revenues of 8% compared to the previous year was due primarily to higher VOD
server revenue from increased shipments of our new flash servers during our
fourth quarter of fiscal 2009. The 13% year over year increase in services
revenue in the Servers and Storage segment is due to increased installation
revenue from VOD and broadcast servers products year over year.
Media Services Revenue. Revenues from Media Services decreased 9% to $16.0 million in the year
ended January 31, 2009 compared to the year ended January 31, 2008. The decrease
in revenue was due primarily to the impact of the weakening of GBP compared to
the USD during fiscal 2009 compared to the previous year. Valued at a constant
USD/GBP exchange rate, ODG increased revenue year over year by 5% with two
additional customers in Europe.
Product Gross Profit. Costs of product revenues consist primarily of the cost of purchased
material components and subassemblies, labor and overhead relating to the final
assembly and testing of complete systems and related expenses, and labor and
overhead costs related to software development contracts. The gross profit
percentage for products increased from 50% in the fiscal year ended January 31,
2008 to 60% in the fiscal year ended January 31, 2009. The increase in product
gross profit percentages between years were primarily due to higher sales
volume-related margin from our Advertising Insertion, Axiom, VODlink and our VOD
hospitality software products. In addition, the Company recorded a charge of
$4.1 million in connection with asset impairments taken during fiscal 2008 which
significantly lowered our fiscal 2008 product gross margin.
Services Gross Profit. Cost of services revenues consist primarily of labor, materials and
overhead relating to the installation, training, product maintenance and
technical support, software development, project management and costs associated
with providing media services. Costs of services revenues increased from $46.5
million in the fiscal year ended January 31, 2008 to $52.0 million in the fiscal
year ended January 31, 2009 while our service gross profit percentage was
relatively flat year over year. The increase in the cost of service of $5.5
million was due to increased headcount-related costs to service our increased
installed base of systems.
Software Gross Profit. Software segment gross margin was 58% and 51% in the years ended January
31, 2009 and 2008, respectively. The increase in product gross profit
percentages between years is due mainly to a favorable product mix of higher
margin Advertising Insertion and VOD software product revenue in the fiscal year
ended January 31, 2009 compared to the fiscal year ended January 31, 2008, as
well as the asset impairments taken in fiscal year 2008.
Servers and Storage Gross Profit. Servers and Storage segment gross margin of
46% in the years ended January 31, 2009 was six points higher than in the year
ended January 31, 2008 because of increased shipment of higher margin VOD flash
servers and lower manufacturing costs due to headcount and other cost reductions
taken in fiscal year 2008.
Media Services Gross Profit. Media Services segment gross margin of 15% in
the year ended January 31, 2009 was two points lower than in the year ended
January 31, 2008 due principally to higher year over year higher headcount
related expenses to support additional revenue.
Research and Development. Research and development expenses consist primarily of the compensation
of development personnel, depreciation of development and test equipment and an
allocation of related facilities expenses. Research and development expenses
were 21% and 24% of total revenues for fiscal year ended January 31, 2009 and
2008, respectively, and increased $300,000 year over year. The increase is
primarily due to higher software-related headcount and related expenses of
$900,000 offset by lower contract labor of $500,000.
Selling and Marketing. Selling and marketing expenses consist primarily of compensation
expenses, including sales commissions, travel expenses and certain promotional
expenses. Selling and marketing expenses increased 19% from $23.1 million or 13%
of total revenues in the fiscal year ended January 31, 2008 to $27.5 million, or
14% of total revenues, in the fiscal year ended January 31, 2009. This increase
in total expenses is primarily due to $1.9 million in increased salaries and
benefits attributable to the hiring of additional sales and marketing employees,
increased commissions of approximately $1.7 million due to higher revenues and
distributor commissions of $900,000 offset by lower trade show
expenses.
47
General and Administrative. General and administrative expenses consist primarily of the
compensation of executive, finance, human resource and administrative personnel,
legal and accounting services and an allocation of related facilities expenses.
In the fiscal year ended January 31, 2009, general and administrative expenses
of $21.0 million, or 10% of total revenues, increased 4% from $20.2 million, or
11% of total revenues, in the fiscal year ended January 31, 2008. General and
administrative expenses increased approximately $800,000 due to higher general
and administrative expenses at ODG of $600,000 primarily due to higher
headcount, higher bad debt expense of $400,000, offset by lower accounting
fees.
Amortization of Intangibles. Amortization expense consists of the
amortization of acquired intangible assets which are operating expenses and not
considered costs of revenues. Amortization of intangible assets decreased from
$3.0 million in the fiscal year ended January 31, 2008 to $1.6 million in the
fiscal year ended January 31, 2009 due primarily to the sale of the Company’s
equity investment in FilmFlex and the related intangible assets in fiscal 2008.
An additional $350,000 and $490,000 of amortization expense related to
acquired technology was charged to cost of sales for the years ended January 31,
2009 and 2008, respectively.
The table below provides detail
regarding our other expense (income) :
| Fiscal Year ended | ||||||||
| January 31, | ||||||||
| 2009 | 2008 | |||||||
| (in thousands) | ||||||||
| Interest income | $ | 2,107 | $ | 1,981 | ||||
| Interest expense | (57 | ) | (54 | ) | ||||
| Foreign exchange (loss) | (951 | ) | - | |||||
| Gain on sale of marketable securities | 26 | - | ||||||
| $ | 1,125 | $ | 1,927 | |||||
Interest Income, net. Interest income, net was $2.1 million in the fiscal year ended January
31, 2009 and $1.9 million in the fiscal year ended January 31, 2008. The
increase in interest income is primarily due to the increase in average cash
balance in fiscal 2009 compared to fiscal 2008.
Foreign exchange (loss). The increase in foreign exchange losses was a result of the increased
strength of the USD against the foreign currencies held by our subsidiaries in
the second half of fiscal 2009 compared to fiscal 2008.
Gain on Sale of Investment in Affiliate. The gain of $10 million was the result the
sale of our equity investment in FilmFlex during the fourth quarter of fiscal
2008.
Equity Loss in Earnings of Affiliates. Equity loss in earnings of affiliates was
$800,000 in the fiscal year ended January 31, 2009 compared with $1.1 million in
income for fiscal year-ended January 31, 2008. The equity income (loss) in
earnings of affiliates consists of our proportionate ownership share of the net
income (loss) under the equity method of accounting. For fiscal year 2009, the
losses consisted of our 50% ownership share in our German joint venture, On
Demand Deutschland GmbH & Co. KG. For fiscal 2008 (until December 2007, when
we sold FilmFlex), the equity income in earnings of affiliates consisted of our
proportionate ownership share of the earnings of FilmFlex and the losses of On
Demand Deutschland GmbH & Co. KG.
Income Tax Provision. Our effective tax rate and income tax provision for fiscal 2009 was 5%
and $600,000 respectively compared to an effective tax rate of 55% and $2.2
million respectively for the fiscal year ended January 31, 2008. The decrease in
the effective tax rate was due to the reduction of our valuation allowance from
the utilization in fiscal 2009 of a $1.4 million foreign tax credit attributable
to the taxable gain from the sale of our equity investment in FilmFlex during
fiscal 2008. In addition, the fiscal 2009 tax rate was also reduced for the
entitlement and claim of the benefit for a refundable research and development
credit of $300,000 as a result of the tax stimulus package passed by the U.S.
Congress in 2008. For the fiscal year 2008, the income tax provision was
primarily attributable to the taxable gains recorded for ODG’s transfer of
assets to and the reimbursement of previously paid costs from On Demand
Deutschland GmbH & Co. KG and taxable gain on the sale of our equity
investment in FilmFlex.
48
At January 31, 2009 and 2008, we provided a valuation allowance for the
full amount of net deferred tax assets due to the uncertainty of realization of
those assets. We will continue to assess the need for the valuation allowance at
each balance sheet date based on all available evidence. If we determine that we
can realize some portion or all of the net deferred tax assets, the valuation
allowance would be reversed and a corresponding increase in net income would be
recognized during the period.
Liquidity and Capital Resources
Historically, we have financed our operations and capital expenditures
primarily with the proceeds from sales of our common stock and cash flows
generated from operations. During fiscal 2010, cash and marketable securities
decreased by $35.8 million from $84.3 million at January 31, 2009 to $48.5
million at January 31, 2010, largely due to cash used for the acquisition of
eventIS, and open market repurchases of our common stock, offset by cash
provided by operations. Working capital decreased $28.6 million to $60.9 million
at January 31, 2010 from $89.5 million at January 31, 2009. We believe that
existing funds combined with available borrowings under our revolving line of
credit and cash provided by future operating activities are adequate to satisfy
our working capital, potential acquisitions, capital expenditure requirements
and other contractual obligations for the foreseeable future, including at least
the next 24 months.
Our operating activities provided net cash of $8.6 million. Cash provided
by operating activities was the result of the net income of $1.3 million and
non-cash charges of $14.8 million which were primarily from depreciation and
amortization, stock-based based compensation, charges for inventory valuation
and accounts receivable allowance. These amounts were offset by increases to
inventory, accounts receivable, and prepaid expenses, and lower accounts payable
and accrued expenses. The increase in accounts receivable was primarily related
to the timing of product shipped in the fourth quarter of fiscal 2010 compared
to the fourth quarter of fiscal 2009. The decrease in accrued expenses was the
result of lower performance-based compensation accruals.
Our investing activities used $33.0 million of cash primarily due to cash
payments aggregating $35.0 million, net of cash acquired, for our September 1,
2009 acquisition of eventIS, an earnout payment to the former shareholders of
Mobix, additional cash invested in unconsolidated entities, and $8.4 million of
capital expenditures. These amounts were offset by $10.7 million of net sales
and maturities of marketable securities during the fiscal year.
Our financing activities used $800,000 primarily due to the purchase of
$2.8 million of the Company’s stock under the share repurchase program which was
partially offset by proceeds from the issuance of common stock for the exercise
of employee stock options and the employee stock purchase plan of $1.8
million.
Debt Instruments and Related Covenants
The Company maintains a revolving line of credit with RBS Citizens (a
subsidiary of the Royal Bank of Scotland Group plc) for $15.0 million which
expires on October 31, 2010. Loans made under this revolving line of credit bear
interest at a rate per annum equal to the bank’s prime rate. Borrowings under
this line of credit are collateralized by substantially all of our assets. The
loan agreement requires SeaChange to comply with certain financial covenants. On
August 31, 2009, these financial covenants were amended to reflect the
acquisition of eventIS. As of January 31, 2010, we were in compliance with the
financial covenants and there were no amounts outstanding under the revolving
line of credit.
Off-Balance Sheet Arrangements
The Company does not
have any off-balance sheet arrangements as defined in Item 303(a)(4)(ii) of
Regulation S-K.
49
Contractual Obligations
The following table reflects our current and contingent contractual
obligations to make potential future payments as of January 31, 2010 (in
thousands):
| Less than one | One to three | Three to five | ||||||||||
| Total | year | years | years | |||||||||
| (in thousands) | ||||||||||||
| Purchase obligations | $ | 6,649 | $ | 6,429 | $ | - | $ | - | ||||
| Non-cancelable lease obligations | 5,563 | 2,763 | 2,739 | 61 | ||||||||
| Contingent consideration | 9,514 | 2,940 | 6,574 | - | ||||||||
| Foreign exchange contract | 1,664 | 1,664 | - | - | ||||||||
| Total | $ | 23,390 | $ | 13,796 | $ | 9,313 | $ | 61 | ||||
The purchase obligations include
open, non-cancelable purchase commitments from our suppliers.
The Company has excluded from the table above uncertain tax liabilities
as defined by authoritative guidance due to the uncertainty of the amount and
period of payment. As of January 31, 2010, the Company has gross unrecognized
tax benefits of $7.6 million.
On February 27, 2007, ODG, a wholly-owned subsidiary of SeaChange,
entered into an agreement with Tele-Munchen Fernseh GmbH & Co.
Produktionsgesellschaft (TMG) to create a joint venture named On Demand
Deutschland GmbH & Co. KG. The related Shareholder’s Agreement requires ODG
and TMG to provide cash contributions up to $4.2 million upon the request of the
joint venture’s management and approval by the shareholders of the joint
venture. To date the Company has contributed $1.2 million as required per the
shareholders agreement.
Under the share purchase agreement with the former shareholder of
eventIS, on each of the first, second and third anniversaries of the closing
date, the Company is obligated to make additional fixed payments of deferred
purchase price, each such payment to be in an aggregate amount of $2.8 million
with $1.7 million payable in cash and $1.1 million payable by the issuance of
restricted shares of SeaChange common stock, which will vest in equal
installments over three years starting on the first anniversary of the date of
issuance. At the option of the former shareholder of eventIS, up to forty
percent of this payment in Restricted Stock may be payable in cash. Under the
earnout provisions of the share purchase agreement if certain performance goals
are met over each of the three periods ending January 31, 2013, the Company will
be obligated to make additional cash payments to the former shareholder of
eventIS.
At the closing of the VividLogic acquisition, the Company made a cash
payment to the former shareholders of VividLogic of $12.0 million In addition,
the VividLogic shareholders are entitled to $8.5 million in cash from available
working capital of which $3.5 was paid at the closing. Of the remaining $5.0
million of estimated working capital adjustment to be paid in cash, $1.5 million
will be paid on each of May 1, 2010 and August 1, 2010 and $2 million will be
paid on the February 1, 2011. On each of the first, second and third
anniversaries of the closing date, the Company is also obligated to make
additional fixed payments of deferred purchase price of $1.0 million in cash. In
addition, the Company may also be obligated to make earnout payments if certain
performance goals are met over each of the three periods ending February 1,
2011, February 1, 2012 and February 1, 2013.
We are occasionally required to post letters of credit, issued by a
financial institution, to secure certain sales contracts. Letters of credit
generally authorize the financial institution to make a payment to the
beneficiary upon the satisfaction of a certain event or the failure to satisfy
an obligation. The letters of credit are generally posted for one-year terms and
are usually automatically renewed upon maturity until such time as we have
satisfied the commitment secured by the letter of credit. We are obligated to
reimburse the issuer only if the beneficiary collects on the letter of credit.
We believe that it is unlikely we will be required to fund a claim under our
outstanding letters of credit. As of January 31, 2010, the full amount of the
letters of credit of $707,000 was supported by our credit facility.
50
Effects of Inflation
Our management believes that
financial results have not been significantly impacted by inflation and price
changes.
Impact of Recently Adopted Accounting
Guidance
Business
Combinations
In December 2007, the Financial Accounting Standards Board (“FASB”)
issued revised accounting guidance requiring the use of fair value, defined as
“the price that would be received to sell an asset or paid to transfer a
liability in an orderly transaction between market participants at the
measurement date.” The new guidance also changes the method of applying the
acquisition method in a number of significant aspects. Any change in the fair
value of the acquisition-related consideration subsequent to the acquisition
date, including changes from events after the acquisition date, such as changes
in the estimate of the performance goals, will be recognized in earnings in the
period the estimated fair value changes; acquisition costs will generally be
expensed as incurred; noncontrolling interests will be valued at fair value at
the acquisition date; in-process research and development will be recorded at
fair value as an indefinite-lived intangible asset at the acquisition date;
restructuring costs associated with a business combination will generally be
expensed subsequent to the acquisition date; and changes in deferred tax asset
valuation allowances and income tax uncertainties after the acquisition date
generally will affect income tax expense. The new guidance amends Accounting for Income Taxes such that adjustments made to valuation allowances on deferred taxes and
acquired tax contingencies associated with acquisitions that closed prior to the
effective date of this guidance would also apply the provisions of this new
guidance. The new guidance was effective for fiscal years beginning after
December 15, 2008, and was adopted by the Company on February 1, 2009. See our
Note 6 to Consolidated Financial Statements for disclosures relating to the
acquisition of eventIS Group B.V. on September 1, 2009 and VividLogic, Inc on
February 1, 2010.
Measuring Liabilities at Fair
Value
In August 2009, the FASB issued an authoritative update to Fair Value Measurements and Disclosures. This update provides amendments to reduce
potential ambiguity in financial reporting when measuring the fair value of
liabilities. Among other provisions, this update provides clarification in
circumstances in which a quoted price in an active market for the identical
liability is not available, a reporting entity is required to measure fair value
using one or more of the valuation techniques described in the authoritative
update. The update will become effective upon issuance for subsequent interim
and annual periods. The Company adopted this standard on October 31, 2009. The
Company has determined that the update had no impact on its financial condition
or results of operations.
Interim Disclosures about Fair Value
of Financial Instruments
In April 2009, the FASB issued new accounting guidance requiring
additional disclosures about the fair value of financial instruments in interim
as well as in annual financial statements. The Company adopted this standard on
July 31, 2009.
Determining Fair Value When the Volume and Level of Activity for the
Asset or Liability Have Significantly Decreased and Identifying Transactions
That Are Not Orderly
In April 2009, the FASB issued new accounting guidance providing
guidelines for making fair value measurements more consistent with the
principles presented in the Fair Value Measurements and Disclosures guidance. This new accounting guidance
provides additional guidelines in determining whether a market is active or
inactive, and whether a transaction is distressed, is applicable to all assets
and liabilities (i.e. financial and nonfinancial). The Company adopted this
standard on April 30, 2009.
Recent Accounting Guidance Not Yet Effective
Determining which Entity has a
Controlling Financial Interest in a Variable Interest Equity
In December 2009, the FASB amended authoritative guidance regarding the
quantitative-based risks and rewards calculation for determining which reporting
entity, if any, has a controlling financial interest in a variable interest
entity with an approach focused on identifying which reporting entity has the
power to direct the activities of a variable interest entity that most
significantly impact the entity’s economic performance and (1) the obligation to
absorb losses of the entity or (2) the right to receive benefits from the
entity. An approach that is expected to be primarily qualitative will be more
effective for identifying which reporting entity has a controlling financial
interest in a variable interest entity. The amendments in this update also
require additional disclosures about a reporting entity’s involvement in
variable interest entities, which will enhance the information provided to users
of financial statements. The update will become effective for the first annual
period starting after November 15, 2009. This guidance will be adopted by the
Company on a prospective basis beginning February 1, 2010. The Company is
currently assessing the impact this amendment may have on its results of
operations and financial position.
51
Revenue Recognition for Arrangements with
Multiple Deliverables
In September 2009, the Financial Accounting Standards Boards (“FASB”)
amended the guidance for revenue recognition in multiple-element arrangements.
It has been amended to remove from the scope of industry specific revenue
accounting guidance for software and software related transactions, tangible
products containing software components and non-software components that
function together to deliver the product’s essential functionality. The guidance
now requires an entity to provide updated guidance on whether multiple
deliverables exist, how the deliverables in an arrangement should be separated
and the consideration allocated, and allocates revenue in an arrangement using
estimated selling prices of deliverables for these products if a vendor does not
have vendor-specific objective evidence (“VSOE”) or third-party evidence of
selling price. The guidance also eliminates the use of the residual method and
requires an entity to allocate revenue using the relative selling price method
for these products. The accounting changes summarized are effective for fiscal
years beginning on or after June 15, 2010, with early adoption permitted.
Adoption may either be on a prospective basis or by retrospective application.
The Company is currently assessing the impact of these amendments on its
accounting and reporting systems and processes; however, at this time the
Company is unable to quantify the impact of their adoption on its financial
statements or determine the timing and method of its adoption. The Company
believes the impact of the new guidance on future multi-element arrangements may
result in earlier recognition of revenue in future periods.
ITEM 7A. Quantitative and Qualitative
Disclosures about Market Risk
Foreign Currency Exchange
Risk
We face exposure to
financial market risks, including adverse movements in foreign currency exchange
rates and changes in interest rates. These exposures may change over time as
business practices evolve and could have a material adverse impact on our
financial results. Our foreign currency exchange exposure is primarily
associated with product sales arrangements or settlement of intercompany
payables and receivables among subsidiaries and its parent company, and/or
investment/equity contingency considerations denominated in the local currency
where the functional currency of the foreign subsidiary is the U.S.
dollar.
Substantially all of our
international product sales are payable in United States Dollars (USD) or in the
case of our Media Services operations in the United Kingdom and eventIS in the
Netherlands, payable in local currencies, providing a natural hedge for receipts
and local payments. In light of the high proportion of our international
businesses, we expect the risk of any adverse movements in foreign currency
exchange rates could have an impact on our translated results within the
Consolidated Statements of Operations. In addition, for the year ended January
31, 2010 the Company generated a foreign currency translation loss of $7.9
million which was recorded as accumulated other comprehensive gain increasing
the Company’s equity section of the balance sheet over the prior
year.
The Company has entered
into a forward foreign currency exchange contract to manage exposure related to
liabilities denominated in Euros. SeaChange does not enter into derivative
financial instruments for trading purposes. At January 31, 2010, we had one
forward contract to buy Euros totaling €1.2 million that
settles on September 1, 2010. While SeaChange does not anticipate that near-term
changes in exchange rates will have a material impact on its operating results,
financial position and liquidity, a sudden and significant change in the value
of foreign currencies could harm the Company’s operating results, financial
position and liquidity.
The U.S. Dollar is the
functional currency for a majority of our international subsidiaries. All
foreign currency gains and losses are included in interest and other income,
net, in the accompanying Consolidated Statements of Operations. In fiscal year
2010, the Company recorded approximately $572,000 in losses due to international
subsidiary translations and cash settlements of revenues and
expenses.
52
Interest Rate Risk
Exposure to market risk
for changes in interest rates relates primarily to the Company’s investment
portfolio of marketable debt securities of various issuers, types and maturities
and to SeaChange’s borrowings under its bank line of credit facility. The
Company does not use derivative instruments in its investment portfolio, and its
investment portfolio only includes highly liquid instruments. Our cash and
marketable securities include cash equivalents, which we consider to be
investments purchased with original maturities of nine months or less. There is
risk that losses could be incurred if the Company were to sell any of its
securities prior to stated maturity. Given the short maturities and investment
grade quality of the portfolio holdings at January 31, 2010, a sharp rise in
interest rates should not have a material adverse impact on the fair value of
our investment portfolio. Additionally, our long term marketable investments,
which are carried at the lower of cost or market, have fixed interest rates, and
therefore are subject to changes in fair value. At January 31, 2010, we had $2.1
million in short-term marketable securities and $8.7 million in long-term
marketable securities.
ITEM 8. Financial Statements and Supplementary
Data
See the consolidated financial statements fields as part of this Annual
Report on Form 10-K as listed under Item 15 below.
ITEM 9. Changes in and Disagreements with
Accountants on Accounting and Financial Disclosure
None.
ITEM 9A. Controls and Procedures
(A) Evaluation of Disclosure Controls and
Procedures
We evaluated the effectiveness of our disclosure controls and procedures,
as defined in the Securities Exchange Act of 1934, as amended (the “Exchange
Act”) Rule 13a-15(e), as of the end of the period covered by this Annual Report
on Form 10-K. William C. Styslinger, III, our Chief Executive Officer, and Kevin
M. Bisson, our Chief Financial Officer, participated in this evaluation. Based
upon that evaluation, Messrs. Styslinger and Bisson concluded that our
disclosure controls and procedures were effective as of the end of the period
covered by the report.
53
(B) Report of Management on Internal Control
over Financial Reporting
Our management is responsible for establishing and maintaining adequate
internal control over financial reporting. Our internal control system was
designed to provide reasonable assurance regarding the reliability of financial
reporting and the preparation of financial statements for external purposes in
accordance with generally accepted accounting principles.
Our internal control over financial reporting includes those policies and
procedures that (i) pertain to the maintenance of records that, in reasonable
detail, accurately and fairly reflect the transactions and dispositions of our
assets; (ii) provide reasonable assurance that transactions are recorded as
necessary to permit preparation of financial statements in accordance with
generally accepted accounting principles, and that our receipts and expenditures
are being made only in accordance with authorizations of our management and
directors, and (iii) provide reasonable assurance regarding prevention or timely
detection of unauthorized acquisition, use or disposition of our assets that
could have a material effect on the financial statements.
Because of inherent limitations, internal control over financial
reporting may not prevent or detect misstatements. Also, projections of any
evaluation of effectiveness to future periods are subject to the risk that
controls may become inadequate because of changes in conditions, or that the
degree of compliance with the policies or procedures may deteriorate.
Our management assessed the effectiveness of our internal control over
financial reporting as of January 31, 2010. In making this assessment,
management used the criteria set forth by the Committee of Sponsoring
Organizations of the Treadway Commission (COSO) in Internal Control—Integrated Framework. Based on our assessment, management concluded
that, as of January 31, 2010, our internal control over financial reporting was
effective based on those criteria.
The effectiveness of our internal control over financial reporting as of
January 31, 2010 has been audited by Grant Thornton LLP, our independent
registered public accounting firm, as stated in their report which is included
immediately below.
To the Board of Directors and
Shareholders of SeaChange International, Inc.
We have audited
SeaChange International, Inc. (a Delaware Corporation) and subsidiaries
internal control over financial reporting as of January 31, 2010, based on
criteria established in Internal Control—Integrated Framework issued by the
Committee of Sponsoring Organizations of the Treadway Commission (COSO).
SeaChange International, Inc.’s management is responsible for maintaining
effective internal control over financial reporting and for its assessment of
the effectiveness of internal control over financial reporting, included in the
accompanying Management’s Report on Internal Control over Financial Reporting.
Our responsibility is to express an opinion on SeaChange International, Inc. and
subsidiaries’ internal control over financial reporting based on our
audit.
We conducted our audit
in accordance with the standards of the Public Company Accounting Oversight
Board (United States). Those standards require that we plan and perform the
audit to obtain reasonable assurance about whether effective internal control
over financial reporting was maintained in all material respects. Our audit
included obtaining an understanding of internal control over financial
reporting, assessing the risk that a material weakness exists, testing and
evaluating the design and operating effectiveness of internal control based on
the assessed risk, and performing such other procedures as we considered
necessary in the circumstances. We believe that our audit provides a reasonable
basis for our opinion.
A company’s internal
control over financial reporting is a process designed to provide reasonable
assurance regarding the reliability of financial reporting and the preparation
of financial statements for external purposes in accordance with generally
accepted accounting principles. A company’s internal control over financial
reporting includes those policies and procedures that (1) pertain to the
maintenance of records that, in reasonable detail, accurately and fairly reflect
the transactions and dispositions of the assets of the company; (2) provide
reasonable assurance that transactions are recorded as necessary to permit
preparation of financial statements in accordance with generally accepted
accounting principles, and that receipts and expenditures of the company are
being made only in accordance with authorizations of management and directors of
the company; and (3) provide reasonable assurance regarding prevention or timely
detection of unauthorized acquisition, use, or disposition of the company’s
assets that could have a material effect on the financial
statements.
Because of its inherent
limitations, internal control over financial reporting may not prevent or detect
misstatements. Also, projections of any evaluation of effectiveness to future
periods are subject to the risk that controls may become inadequate because of
changes in conditions, or that the degree of compliance with the policies or
procedures may deteriorate.
In our opinion,
SeaChange International, Inc. and subsidiaries’ maintained, in all material
respects, effective internal control over financial reporting as of January 31,
2010, based on criteria established in Internal Control—Integrated Framework issued by COSO.
We also have audited, in
accordance with the standards of the Public Company Accounting Oversight Board
(United States), the consolidated balance sheets of SeaChange International,
Inc. and subsidiaries as of January 31, 2010 and 2009, and the related
consolidated statement of operations, stockholders’ equity and comprehensive
income (loss), and cash flows for each of the three years in the period ended
January 31, 2010 and our report dated April 9, 2010 expressed an
unqualified opinion.
/s/ Grant Thornton LLP
Boston,
Massachusetts
April 9, 2010
April 9, 2010
(C) Changes in Internal Control over Financial
Reporting
As a result of the evaluation completed by management, and in which
Messrs. Styslinger and Bisson participated, we have concluded that there were no
changes during the fiscal quarter ended January 31, 2010 in our internal control
over financial reporting, which have materially affected, or are reasonably
likely to materially affect, our internal control over financial reporting.
54
ITEM 9B. Other Information
None.
PART III
ITEM 10. Directors, Executive Officers and
Corporate Governance
Information concerning the directors of SeaChange is hereby incorporated
by reference from the information contained under the heading “Election of
Directors” in SeaChange’s definitive proxy statement related to SeaChange’s
Annual Meeting of Stockholders to be held on or about July 15, 2010 which will
be filed with the Commission within 120 days after the close of the fiscal year
(the “Definitive Proxy Statement”).
Certain information concerning directors and executive officers of
SeaChange is hereby incorporated by reference to the information contained under
the headings “Information Concerning Executive Officers”, and “Section 16(a)
Beneficial Ownership Reporting Compliance”, “Availability of Corporate
Governance Documents” and “Audit Committee” in our Definitive Proxy Statement.
ITEM 11. Executive Compensation
Information concerning executive compensation is hereby incorporated by
reference to the information contained under the headings “Compensation
Discussion and Analysis” and “Compensation of Directors” in the Definitive Proxy
Statement.
ITEM 12. Security Ownership of Certain
Beneficial Owners and Management and Related Stockholder Matters
Information concerning security ownership of certain beneficial owners
and management is hereby incorporated by reference to the information contained
under the headings “Securities Ownership of Certain Beneficial Owners and
Management” and “Compensation Discussion and Analysis” in the Definitive Proxy
Statement.
ITEM 13. Certain Relationships and Related
Transactions, and Director Independence
Information concerning certain relationships and related transactions is
hereby incorporated by reference to the information contained under the heading
“Certain Relationships and Related Transactions” and “Determination of Director
Independence” in the Definitive Proxy Statement.
ITEM 14. Principal Accountant Fees and
Services
Information concerning Principal accountant fees and services is hereby
incorporated by reference to the information contained under the heading
“Ratification of Appointment of Independent Registered Public Accounting Firm”
in the Definitive Proxy Statement.
55
PART IV
ITEM 15. Exhibits and Financial Statement
Schedules.
(a)(1) INDEX TO THE CONSOLIDATED FINANCIAL
STATEMENTS
The following Consolidated Financial Statements of the Registrant are
filed as part of this Annual Report on Form 10-K:
| Page | |
| Report of Independent Registered Public Accounting Firm | 62 |
| Consolidated Balance Sheet as of January 31, 2010 and 2009 | 63 |
| Consolidated Statement of Operations for the years ended January 31, 2010, 2009 and 2008 | 64 |
| Consolidated Statement of Stockholders’ Equity and Comprehensive Income (Loss) for the | |
| years ended January 31, 2010, 2009 and 2008 | 65 |
| Consolidated Statement of Cash Flows for the years ended January 31, 2010, 2009 and 2008 | 66 |
| Notes to Consolidated Financial Statements | 67 |
(a)(2) INDEX TO FINANCIAL STATEMENT SCHEDULE
The following Financial Statement
Schedule of the Registrant is filed as part of this report:
| Page | |
| Schedule II—Valuation and Qualifying Accounts and Reserves | 101 |
Schedules not listed above have been omitted because the information
requested to be set forth therein is not applicable or is shown in the
accompanying consolidated financial statements or notes thereto.
(a)(3) INDEX TO EXHIBITS
See attached Exhibit Index of this
Annual Report on Form 10-K.
(b) EXHIBITS
The Company hereby files as part of this Form 10-K the Exhibits listed in
Item 15 (a) (3) above. Exhibits which are incorporated herein by reference can
be inspected and copied at the public reference facilities maintained by the
Securities and Exchange Commission (the “Commission”), 450 Fifth Street, Room
1024, N.W., Washington, D.C. 20549. Copies of such material can also be obtained
from the Public Reference Section of the Commission, 450 Fifth Street, N.W.,
Washington, D.C. 20549, at prescribed rates.
(c) FINANCIAL STATEMENT SCHEDULES
The Company hereby files as part of
this Form 10-K the consolidated financial statements schedule listed in Item 15
(a) (2) above, which is attached hereto.
56
SIGNATURES
Pursuant to the requirements of Section 13 or 15 (d) of the Securities
Exchange Act of 1934, SeaChange International, Inc. has duly caused this report
to be signed on its behalf by the undersigned, thereunto duly
authorized.
Dated: April 9,
2010
| SEACHANGE INTERNATIONAL, INC. | |
| By: | /s/ WILLIAM C. STYSLINGER, III |
| William C. Styslinger, III | |
| Chief Executive Officer, | |
| Chairman of the Board and Director | |
POWER OF ATTORNEY AND
SIGNATURES
KNOW ALL MEN BY THESE PRESENTS, that each person whose signature appears
below constitutes and appoints William C. Styslinger, III and Kevin M. Bisson,
jointly and severally, his attorney-in-fact, each with the power of
substitution, for him in any and all capacities, to sign any amendments to this
Report on Form 10-K and to file same, with exhibits thereto and other documents
in connection therewith, with the Securities and Exchange Commission, hereby
ratifying and confirming all that each of said attorneys-in-fact, or his
substitute or substitutes, may do or cause to be done by virtue
hereof.
Pursuant to the requirements of the Securities Exchange Act of 1934, this
report has been signed below by the following persons on behalf of the
Registrant and in the capacities and on the dates indicated.
| Signature | Title(s) | Date | ||
| /s/ WILLIAM C. STYSLINGER, III | Chief Executive Officer, Chairman | April 9, 2010 | ||
| William C. Styslinger, III | of the Board and Director (Principal | |||
| Executive Officer) | ||||
| /s/ KEVIN M. BISSON | Chief Financial Officer, Senior Vice | April 9, 2010 | ||
| Kevin M. Bisson | President, Finance and Administration, | |||
| Treasurer and Secretary (Principal Financial | ||||
| and Accounting Officer) | ||||
| /s/ MARY PALERMO COTTON | Director | April 9, 2010 | ||
| Mary Palermo Cotton | ||||
| /s/ THOMAS F. OLSON | Director | April 9, 2010 | ||
| Thomas F. Olson | ||||
| /s/ CARLO SALVATORI | Director | April 9, 2010 | ||
| Carlo Salvatori | ||||
| /s/ CARMINE VONA | Director | April 9, 2010 | ||
| Carmine Vona | ||||
| /s/ REIJANE HUAI | Director | April 9, 2010 | ||
| ReiJane Huai |
57
EXHIBIT INDEX
| Exhibit No. | Description | |||
| 2.1 | Share Purchase Agreement relating to the sale and purchase of the whole issued and to be issued share capital of Mobix Interactive Capital, dated as of November 14, 2008, by and among On Demand Group Limited and the other parties set forth on the signature pages thereto (filed as Exhibit 2.1 to the Company’s Current Report on Form 8-K previously filed on November 25, 2008 with the Commission (File No. 000-21393) and incorporated herein by reference). | |||
| 2.2 | Agreement for the Entire Issued Share Capital of eventIS Group B.V. dated as of September 1, 2009 by and among Ventise Holding B.V., SeaChange B.V. and SeaChange International, Inc. (filed as Exhibit 2.1 to the Company’s Quarterly Report on 10-Q previously filed on September 8, 2009 (File No. 000-21393) and incorporated herein by reference). | |||
| 2.3 | Agreement and Plan of Merger, dated as of January 6, 2010, by and among SeaChange International, Inc., Vividlogic, Inc., Vulcan Acquisition, Inc. and Shiva Patibanda in the limited capacity of Stockholder Representative (filed as Exhibit 2.1 to the Company’s Current Report on Form 8-K previously filed on January 8, 2010 with the Commission (File No. 000-21393) and incorporated herein by reference). | |||
| 3.1 | Amended and Restated Certificate of Incorporation of the Company (filed as Exhibit 3.3 to the Company’s Registration Statement on Form S-1 previously filed on November 4, 1996 with the Commission (File No. 333-12233) and incorporated herein by reference). | |||
| 3.2 | Certificate of Amendment, filed May 25, 2000 with the Secretary of State in the State of Delaware, to the Amended and Restated Certificate of Incorporation of the Company (filed as Exhibit 4.1 to the Company’s Quarterly Report on 10-Q previously filed on December 15, 2000 with the Commission (Filed No. 000-21393) and incorporated herein by reference). | |||
| 3.3 | Amended and Restated By-laws of the Company (filed as Exhibit 3.5 to the Company’s Registration Statement on Form S-1 previously filed on November 4, 1996 with the Commission (File No. 333-12233) and incorporated herein by reference). | |||
| 4.1 | Specimen certificate representing the Common Stock (filed as Exhibit 4.1 to the Company’s Registration Statement on Form S-1 previously filed on November 4, 1996 with the Commission (File No. 333-12233) and incorporated herein by reference). | |||
| 4.2 | Amended and Restated Certificate of Incorporation of the Company (filed as Exhibit 3.3 to the Company’s Registration Statement on Form S-1 previously filed on November 4, 1996 with the Commission (File No. 333-12233) and incorporated herein by reference). | |||
| 4.3 | Certificate of Amendment, filed May 25, 2000 with the Secretary of State in the State of Delaware, to the Amended and Restated Certificate of Incorporation of the Company (filed as Exhibit 4.2 to the Company’s registration statement on Form S-3 previously filed on December 6, 2000 with the Commission (Filed No. 333-51386) and incorporated herein by reference). | |||
| 10.1 | Amended and Restated 2005 Equity Compensation and Incentive Plan (filed as Appendix A to the Company’s Proxy Statement on Schedule 14A previously filed May 25, 2007 with the Commission (File No. 000-21393) and incorporated herein by reference). | |||
| 10.2 | Form of Restricted Stock Unit Agreement pursuant to the Company’s 2005 Equity Compensation and Incentive Plan (filed as Exhibit 10.1 to the Company’s Current Report on Form 8-K previously filed December 14, 2005 with the Commission (File No. 000-21393) and incorporated herein by reference). | |||
58
| Exhibit No. | Description | |||
| 10.3 | Form of Incentive Stock Option Agreement pursuant to the Company’s 2005 Equity Compensation and Incentive Plan (filed as Exhibit 10.3 to the Company’s Annual Report on Form 10-K previously filed on April 17, 2006 with the Commission (File No. 000-21393) and incorporated herein by reference). | |||
| 10.4 | Form of Non-Qualified Stock Option Agreement pursuant to the Company’s 2005 Equity Compensation and Incentive Plan (filed as Exhibit 10.4 to the Company’s Annual Report on Form 10-K previously filed on April 17, 2006 with the Commission (File No. 000-21393) and incorporated herein by reference). | |||
| 10.5 | Amended and Restated 1995 Stock Option Plan (filed as Annex B to the Company’s Proxy Statement on Form 14a previously filed on May 31, 2001 with the Commission (File No. 000-21393) and incorporated herein by reference). | |||
| 10.6 | Form of Incentive Stock Option Agreement pursuant to SeaChange’s Amended and Restated 1995 Stock Option Plan (filed as Exhibit 99.1 to the Company’s Current Report on Form 8-K filed on October 6, 2004 with the Commission (File No. 000-21393) and incorporated herein by reference). | |||
| 10.7 | Form of Non-Qualified Stock Option Agreement pursuant to SeaChange’s Amended and Restated 1995 Stock Option Plan (filed as Exhibit 99.2 to the Company’s Current Report on Form 8-K filed on October 6, 2004 with the Commission (File No. 000-21393) and incorporated herein by reference). | |||
| 10.8 | 1996 Non-Employee Director Stock Option Plan (filed as Exhibit 10.2 to the Company’s Registration Statement on Form S-1 previously filed on November 4, 1996 with the Commission (File No. 333-12233) and incorporated herein by reference). | |||
| 10.9 | Third Amended and Restated 1996 Employee Stock Purchase Plan of the Company (filed as Appendix A to the Company’s Definitive Proxy Statement filed on Schedule 14A previously filed on May 30, 2008 with the Commission (File No. 000-21393) and incorporated herein by reference). | |||
| 10.10 | Loan and Security Agreement, dated as of October 22, 2001, by and between Citizens Bank of Massachusetts and the Company (filed as Exhibit 10.1 to the Company’s Quarterly Report on Form 10-Q previously filed on December 13, 2001 with the Commission (File No. 000-21393) and incorporated herein by reference). | |||
| 10.11 | Amendment No. 1, dated as of June 14, 2002, by and between the Company and Citizen’s Bank of Massachusetts, to that certain Loan and Security Agreement, dated as of October 22, 2001, by and between the Company and Citizen’s Bank of Massachusetts (filed as Exhibit 10.1 to the Company’s Quarterly Report on Form 10-Q previously filed on September 13, 2002 with the Commission (File No. 000-21393) and incorporated herein by reference). | |||
| 10.12 | Amendment No. 2, dated as of April 21, 2003, between the Company and Citizen’s Bank of Massachusetts, to that certain Loan and Security Agreement, dated as of October 22, 2001 by and between the Company and Citizen’s Bank of Massachusetts (filed as Exhibit 10.7 to the Company’s Annual Report on Form 10-K previously filed on May 1, 2003 with the Commission (File No. 000-21393) and incorporated herein by reference). | |||
| 10.13 | Amendment No. 3, dated as of December 1, 2003, between the Company and Citizens Bank of Massachusetts, to that certain Loan and Security Agreement, dated as of October 22, 2001 by and between the Company and Citizens Bank of Massachusetts (filed as Exhibit 10.1 to the Company’s Quarterly Report on Form 10-Q filed on December 15, 2003 with the Commission (File No. 000-21393) and incorporated herein by reference). | |||
59
| Exhibit No. | Description | |||
| 10.14 | Amendment No. 8, dated as of April 14, 2006, between the Company and Citizens Bank of Massachusetts, to that certain Loan and Security Agreement, dated as of October 22, 2001, by and between the Company and Citizens Bank of Massachusetts (filed as Exhibit 10.15 to the Company’s Annual Report on Form 10-K previously filed on April 17, 2006 with the Commission (File No. 000-21393) and incorporated herein by reference). | |||
| 10.15 | Amendment No. 12, dated as of August 17, 2007, between the Company and Citizens Bank of Massachusetts, to that certain Loan and Security Agreement, dated as of October 22, 2001, by and between the Company and Citizens Bank of Massachusetts (filed as Exhibit 10.1 to the Company’s Quarterly Report on Form 10-Q previously filed on April 17, 2006 with the Commission (File No. 000-21393) and incorporated herein by reference). | |||
| 10.16 | Amendment No. 14, dated as of October 31, 2008, between the Company and RBS Citizens, to that certain Loan and Security Agreement, dated as of October 22, 2001, by and between the Company and RBS Citizens (filed as Exhibit 10.1 to the Company’s Quarterly Report on Form 10-Q previously filed December 8, 2008 with the Commission (File No. 000-21393) and incorporated herein by reference). | |||
| 10.17 | License Agreement dated May 30, 1996 between Summit Software Systems, Inc. and the Company (filed as Exhibit 10.7 to the Company’s Registration Statement on Form S-1 previously filed on November 4, 1996 with the Commission (File No. 333-12233) and incorporated herein by reference). | |||
| 10.18 | Amended and Restated Change-in-Control Severance Agreement, dated as of December 21, 2009, by and between the Company and Kevin Bisson (filed as Exhibit 10.1 to the Company’s Current Report on Form 8-K previously filed December 21, 2009 with the Commission (File No. 000-21393) and incorporated herein by reference). | |||
| 10.19 | Amended and Restated Change-in-Control Severance Agreement, dated as of December 21, 2009, by and between SeaChange and Steven M. Davi (filed as Exhibit 10.2 to the Company’s Current Report on Form 8-K previously filed December 21, 2009 with the Commission (File No. 000-21393) and incorporated herein by reference). | |||
| 10.20 | Amended and Restated Change-in-Control Severance Agreement, dated as of December 21, 2009, by and between the Company and Ira Goldfarb (filed as Exhibit 10.3 to the Company’s Current Report on Form 8-K filed on December 21, 2009 with the Commission (File No. 000-21393) and incorporated herein by reference). | |||
| 10.21 | Amended and Restated Change-in-Control Severance Agreement, dated as of December 21, 2009, by and between SeaChange and Yvette Kanouff (filed as Exhibit 10.5 to the Company’s Current Report on Form 8-K previously filed December 21, 2009 with the Commission (File No. 000-21393) and incorporated herein by reference). | |||
| 10.22 | Amended and Restated Change-in-Control Severance Agreement, dated as of December 21, 2009, by and between the Company and Bruce Mann (filed as Exhibit 10.6 to the Company’s Current Report on Form 8-K previously filed December 21, 2009 with the Commission (File No. 000-21393) and incorporated herein by reference). | |||
| 10.23 | Amended and Restated Change-in-Control Severance Agreement, dated as of December 21, 2009, by and between the Company and William C. Styslinger, III (filed as Exhibit 10.7 to the Company’s Current Report on Form 8-K previously filed December 21, 2009 with the Commission (File No. 000-21393) and incorporated herein by reference). | |||
60
| Exhibit No. | Description | |||
| 10.24 | Executive Services Agreement, dated as of September 23, 2005, by and between On Demand Management Limited and Anthony Kelly (filed as Exhibit 10.2 to the Company’s Current Report on Form 8-K previously filed September 29, 2005 with the Commission (File No. 000-21393) and incorporated herein by reference). | |||
| 10.25 | Separation Agreement and General Release, dated as of March 10, 2010, by and between SeaChange International, Inc. and Ed Dunbar (filed as Exhibit 10.1 to the Company’s Current Report on Form 8-K previously filed on March 12, 2010 with the Commission (File No. 000-21393) and incorporated herein by reference). | |||
| 21.1* | List of Subsidiaries of the Registrant. | |||
| 23.1* | Consent of Grant Thornton LLP. | |||
| 24.1 | Power of Attorney (included on signature page). | |||
| 31.1* | Certification Pursuant to Rule 13a-14(a) of the Exchange Act, as Adopted Pursuant to Section 302 of the Sarbanes-Oxley Act of 2002. | |||
| 31.2* | Certification Pursuant to Rule 13a-14(a) of the Exchange Act, as Adopted Pursuant to Section 302 of the Sarbanes-Oxley Act of 2002. | |||
| 32.1* | Certification Pursuant to 18 U.S.C. Section 1350, as Adopted Pursuant to Section 906 of the Sarbanes-Oxley Act of 2002. | |||
| 32.2* | Certification Pursuant to 18 U.S.C. Section 1350, as Adopted Pursuant to Section 906 of the Sarbanes-Oxley Act of 2002. | |||
____________________
| * | Provided herewith. |
61
REPORT OF INDEPENDENT REGISTERED PUBLIC
ACCOUNTING FIRM
To the Board of
Directors and Shareholders of SeaChange International, Inc.
We have audited the
accompanying consolidated balance sheets of SeaChange International, Inc. (a
Delaware corporation) and subsidiaries (collectively the “Company”) as of January
31, 2010 and 2009, and the related consolidated statements of operations,
stockholders' equity and comprehensive income (loss), and cash flows for each of
the three years in the period ended January 31, 2010. Our audits of the basic
financial statements included the financial statement schedule listed in the
index appearing under Item 15 (a) (2). These financial statements and financial
statement schedule are the responsibility of the Company's management. Our
responsibility is to express an opinion on these financial statements and
financial statement schedule based on our audits.
We conducted our audits
in accordance with the standards of the Public Company Accounting Oversight
Board (United States). Those standards require that we plan and perform the
audit to obtain reasonable assurance about whether the financial statements are
free of material misstatement. An audit includes examining, on a test basis,
evidence supporting the amounts and disclosures in the financial statements. An
audit also includes assessing the accounting principles used and significant
estimates made by management, as well as evaluating the overall financial
statement presentation. We believe that our audits provide a reasonable basis
for our opinion.
In our opinion, the
consolidated financial statements referred to above present fairly, in all
material respects, the financial position of SeaChange International, Inc. and
subsidiaries as of January 31, 2010 and 2009, and the results of their
operations and their cash flows for each of the three years in the period ended
January 31, 2010, in conformity with accounting principles generally accepted in
the United States of America. Also in our opinion, the related financial
statement schedule, when considered in relation to the basic financial
statements taken as a whole, presents fairly, in all material respects, the
information set forth therein.
We also have audited, in
accordance with the standards of the Public Company Accounting Oversight Board
(United States), SeaChange International, Inc. and subsidiaries internal control
over financial reporting as of January 31, 2010, based on criteria established
in Internal Control—Integrated
Framework issued by the Committee of Sponsoring Organizations of the
Treadway Commission (COSO) and our report dated April 9, 2010 expressed an
unqualified opinion thereon.
/s/ Grant Thornton LLP
April 9, 2010
62
SEACHANGE INTERNATIONAL, INC.
CONSOLIDATED BALANCE SHEET
(in thousands, except share data)
CONSOLIDATED BALANCE SHEET
(in thousands, except share data)
| January 31, | January 31, | |||||||
| 2010 | 2009 | |||||||
| Assets | ||||||||
| Current assets: | ||||||||
| Cash and cash equivalents | $ | 37,647 | $ | 62,458 | ||||
| Restricted cash | 73 | 1,431 | ||||||
| Marketable securities | 2,114 | 9,447 | ||||||
| Accounts receivable, net of allowance for doubtful accounts of $852 in 2010 | ||||||||
| and $853 in 2009, respectively | 50,337 | 41,513 | ||||||
| Unbilled receivables | 3,941 | 4,595 | ||||||
| Inventories, net | 17,830 | 17,251 | ||||||
| Prepaid expenses and other current assets | 7,253 | 3,902 | ||||||
| Deferred tax asset | 2,474 | 217 | ||||||
| Total current assets | 121,669 | 140,814 | ||||||
| Property and equipment, net | 39,682 | 35,217 | ||||||
| Marketable securities, long-term | 8,688 | 12,415 | ||||||
| Investments in affiliates | 13,697 | 13,043 | ||||||
| Intangible assets, net | 26,264 | 4,621 | ||||||
| Goodwill | 55,876 | 27,422 | ||||||
| Other assets | 1,271 | 451 | ||||||
| Total assets | $ | 267,147 | $ | 233,983 | ||||
| Liabilities and Stockholders’ Equity | ||||||||
| Current liabilities: | ||||||||
| Accounts payable | $ | 10,371 | $ | 11,951 | ||||
| Other accrued expenses | 11,174 | 10,974 | ||||||
| Customer deposits | 4,279 | 1,966 | ||||||
| Deferred revenues | 34,158 | 26,237 | ||||||
| Deferred tax liabilities | 800 | 137 | ||||||
| Total current liabilities | 60,782 | 51,265 | ||||||
| Deferred revenue, long-term | 12,635 | 6,737 | ||||||
| Other liabilities, long-term | 6,574 | — | ||||||
| Distribution and losses in excess of investment | 1,469 | 1,745 | ||||||
| Deferred tax liabilities and taxes payable, long-term | 7,765 | 2,000 | ||||||
| Total liabilities | 89,225 | 61,747 | ||||||
| Commitments and contingencies (Note 10) | ||||||||
| Stockholders Equity: | ||||||||
| Convertible preferred stock, $0.01 par value, 5,000,000 shares authorized, | ||||||||
| none issued or outstanding | — | — | ||||||
| Common stock, $0.01 par value; 100,000,000 shares authorized; 32,563,063 and | ||||||||
| 31,822,838 shares issued; 31,216,267 and 30,949,457 | 326 | 318 | ||||||
| respectively | ||||||||
| Additional paid-in capital | 211,504 | 206,411 | ||||||
| Treasury stock, at cost 1,346,796 and 873,381 common shares , respectively | (8,757 | ) | (5,989 | ) | ||||
| Accumulated deficit | (17,450 | ) | (18,773 | ) | ||||
| Accumulated other comprehensive (loss) income | (7,701 | ) | (9,731 | ) | ||||
| Total stockholders’ equity | 177,922 | 172,236 | ||||||
| Total liabilities and stockholders’ equity | $ | 267,147 | $ | 233,983 | ||||
The accompanying notes
are an integral part of these consolidated financial statements.
63
SEACHANGE INTERNATIONAL, INC.
CONSOLIDATED STATEMENT OF OPERATIONS
(in thousands, except per share data)
CONSOLIDATED STATEMENT OF OPERATIONS
(in thousands, except per share data)
| Fiscal Year ended January 31, | |||||||||||
| 2010 | 2009 | 2008 | |||||||||
| Revenues: | |||||||||||
| Products | $ | 101,941 | $ | 117,372 | $ | 105,769 | |||||
| Services | 99,724 | 84,464 | 74,124 | ||||||||
| Total revenues | 201,665 | 201,836 | 179,893 | ||||||||
| Cost of revenues: | |||||||||||
| Products | 38,961 | 46,533 | 52,464 | ||||||||
| Services | 59,451 | 52,007 | 46,465 | ||||||||
| Total cost of revenues | 98,412 | 98,540 | 98,929 | ||||||||
| Gross profit | 103,253 | 103,296 | 80,964 | ||||||||
| Operating expenses: | |||||||||||
| Research and development | 50,664 | 43,042 | 42,699 | ||||||||
| Selling and marketing | 25,842 | 27,506 | 23,073 | ||||||||
| General and administrative | 21,719 | 20,979 | 20,240 | ||||||||
| Amortization of intangibles | 2,826 | 1,575 | 2,952 | ||||||||
| Total operating expenses | 101,051 | 93,102 | 88,964 | ||||||||
| Income (loss) from operations | 2,202 | 10,194 | (8,000 | ) | |||||||
| Interest income | 763 | 2,107 | 1,981 | ||||||||
| Interest expense | (156 | ) | (57 | ) | (54 | ) | |||||
| Other expense, net | (462 | ) | (925 | ) | (43 | ) | |||||
| Gain on sale of investment in affiliate | - | - | 10,031 | ||||||||
| Income before income taxes and equity loss in earnings | |||||||||||
| of affiliates | 2,347 | 11,319 | 3,915 | ||||||||
| Income tax expense | 371 | 575 | 2,156 | ||||||||
| Equity (loss) income in earnings of affiliates, net of tax | (653 | ) | (770 | ) | 1,143 | ||||||
| Net income | $ | 1,323 | $ | 9,974 | $ | 2,902 | |||||
| Earnings per Share: | |||||||||||
| Basic income per share | $ | 0.04 | $ | 0.32 | $ | 0.10 | |||||
| Diluted income per share | $ | 0.04 | $ | 0.32 | $ | 0.10 | |||||
| Weighted average common shares outstanding: | |||||||||||
| Basic | 30,860 | 30,724 | 29,634 | ||||||||
| Diluted | 31,433 | 31,192 | 30,000 | ||||||||
The accompanying notes
are an integral part of these consolidated financial statements.
64
SEACHANGE INTERNATIONAL,
INC.
CONSOLIDATED STATEMENT OF STOCKHOLDER'S EQUITY AND COMPREHENSIVE INCOME (LOSS)
(in thousands, except per share data)
CONSOLIDATED STATEMENT OF STOCKHOLDER'S EQUITY AND COMPREHENSIVE INCOME (LOSS)
(in thousands, except per share data)
| Accumulated other | ||||||||||||||||||||||||||||||||||||
| comprehensive | Treasury | |||||||||||||||||||||||||||||||||||
| Common Stock | income(loss) | Stock | ||||||||||||||||||||||||||||||||||
| Number | Additional | Cumulative | Unrealized | Number | Total | |||||||||||||||||||||||||||||||
| of | Par | paid-in | Accumulated | translation | gain/loss on | of | Stockholders' | Comprehensive | ||||||||||||||||||||||||||||
| shares | value | capital | Deficit | adjustment | investments | shares | Amount | Equity | income (loss) | |||||||||||||||||||||||||||
| Balance January 31, 2007 | 29,384,887 | $ | 293 | $ | 184,976 | $ | (31,649 | ) | $ | 1,588 | $ | (13 | ) | (39,784 | ) | $ | - | $ | 155,195 | |||||||||||||||||
| Issuance of common stock | ||||||||||||||||||||||||||||||||||||
| pursuant to exercise of stock options | 189,623 | 2 | 1,120 | - | - | - | 1,122 | |||||||||||||||||||||||||||||
| Issuance of common stock in connection | ||||||||||||||||||||||||||||||||||||
| with the employee stock purchase plan | 245,535 | 3 | 1,554 | - | - | - | 1,557 | |||||||||||||||||||||||||||||
| Issuance of common stock pursuant to | ||||||||||||||||||||||||||||||||||||
| vesting of restricted stock units | 124,050 | 1 | (1 | ) | - | - | - | - | ||||||||||||||||||||||||||||
| Stock-based compensation expense | - | - | 3,978 | - | - | - | 3,978 | |||||||||||||||||||||||||||||
| Change in fair value on | ||||||||||||||||||||||||||||||||||||
| marketable securities, net of tax | - | - | - | - | 449 | - | - | 449 | $ | 449 | ||||||||||||||||||||||||||
| Translation adjustment | - | - | - | - | 199 | - | - | 199 | 199 | |||||||||||||||||||||||||||
| Net income | - | - | - | 2,902 | - | - | 2,902 | 2,902 | ||||||||||||||||||||||||||||
| Comprehensive income | $ | 3,550 | ||||||||||||||||||||||||||||||||||
| Balance at January 31, 2008 | 29,944,095 | 299 | 191,627 | (28,747 | ) | 1,787 | 436 | (39,784 | ) | - | 165,402 | |||||||||||||||||||||||||
| Issuance of common stock | ||||||||||||||||||||||||||||||||||||
| pursuant to exercise of stock options | 223,006 | 4 | 1,176 | - | - | - | 1,180 | |||||||||||||||||||||||||||||
| Issuance of common stock in connection | ||||||||||||||||||||||||||||||||||||
| with the employee stock purchase plan | 236,707 | 3 | 1,560 | - | - | - | 1,563 | |||||||||||||||||||||||||||||
| Issuance of common stock pursuant to | ||||||||||||||||||||||||||||||||||||
| vesting of restricted stock units | 287,642 | 1 | - | - | - | - | 1 | |||||||||||||||||||||||||||||
| Issuance of common stock pursuant to | ||||||||||||||||||||||||||||||||||||
| third earnout for ODG acquisition | 1,131,388 | 11 | 8,094 | - | - | - | 8,105 | |||||||||||||||||||||||||||||
| Stock-based compensation expense | - | - | 3,954 | - | - | - | 3,954 | |||||||||||||||||||||||||||||
| Purchase of treasury shares | (833,597 | ) | (5,989 | ) | (5,989 | ) | ||||||||||||||||||||||||||||||
| Change in fair value on | ||||||||||||||||||||||||||||||||||||
| marketable securities, net of tax | - | - | - | - | 23 | - | - | 23 | $ | 23 | ||||||||||||||||||||||||||
| Translation adjustment | - | - | - | - | (11,977 | ) | - | - | (11,977 | ) | (11,977 | ) | ||||||||||||||||||||||||
| Net income | - | - | - | 9,974 | - | - | 9,974 | 9,974 | ||||||||||||||||||||||||||||
| Comprehensive loss | $ | (1,980 | ) | |||||||||||||||||||||||||||||||||
| Balance at January 31, 2009 | 31,822,838 | 318 | 206,411 | (18,773 | ) | (10,190 | ) | 459 | (873,381 | ) | (5,989 | ) | 172,236 | |||||||||||||||||||||||
| Issuance of common stock | ||||||||||||||||||||||||||||||||||||
| pursuant to exercise of stock options | 47,805 | 1 | 483 | - | - | - | - | 484 | ||||||||||||||||||||||||||||
| Issuance of common stock in connection | ||||||||||||||||||||||||||||||||||||
| with the employee stock purchase plan | 282,889 | 3 | 1,510 | - | - | - | - | - | 1,513 | |||||||||||||||||||||||||||
| Issuance of common stock pursuant to | ||||||||||||||||||||||||||||||||||||
| vesting of restricted stock units | 409,531 | 4 | (4 | ) | - | - | - | - | - | - | ||||||||||||||||||||||||||
| Stock-based compensation expense | - | - | 3,104 | - | - | - | - | - | 3,104 | |||||||||||||||||||||||||||
| Purchase of treasury shares | - | - | (473,415 | ) | (2,768 | ) | (2,768 | ) | ||||||||||||||||||||||||||||
| Change in fair value on | ||||||||||||||||||||||||||||||||||||
| marketable securities, net of tax | - | - | - | - | - | (262 | ) | - | - | (262 | ) | $ | (262 | ) | ||||||||||||||||||||||
| Translation adjustment | - | - | - | - | 2,292 | - | - | - | 2,292 | 2,292 | ||||||||||||||||||||||||||
| Net income | - | - | - | 1,323 | - | - | - | - | 1,323 | 1,323 | ||||||||||||||||||||||||||
| Comprehensive income | $ | 3,353 | ||||||||||||||||||||||||||||||||||
| Balance at January 31, 2010 | 32,563,063 | $ | 326 | $ | 211,504 | $ | (17,450 | ) | $ | (7,898 | ) | $ | 197 | (1,346,796 | ) | $ | (8,757 | ) | $ | 177,922 | ||||||||||||||||
The accompanying notes
are an integral part of these consolidated financial statements.
65
SEACHANGE INTERNATIONAL, INC.
CONSOLIDATED STATEMENT OF CASH FLOWS
(in thousands)
CONSOLIDATED STATEMENT OF CASH FLOWS
(in thousands)
| Year ended January 31, | |||||||||||
| 2010 | 2009 | 2008 | |||||||||
| Cash flows from operating activities: | |||||||||||
| Net income | $ | 1,323 | $ | 9,974 | $ | 2,902 | |||||
| Adjustments to reconcile net income to net cash provided by operating activities: | |||||||||||
| Depreciation | 7,995 | 7,216 | 7,892 | ||||||||
| Amortization of intangibles and capitalized software | 3,461 | 2,025 | 4,205 | ||||||||
| Impairment of capitalized software | - | - | 4,056 | ||||||||
| Inventory valuation charge | 585 | 1,085 | 2,130 | ||||||||
| Provision for doubtful accounts receivable | 75 | 761 | 486 | ||||||||
| Discounts earned and amortization of premiums on marketable securities | 110 | 22 | (14 | ) | |||||||
| Equity loss (income) in earnings of affiliates | 654 | 770 | (1,143 | ) | |||||||
| Gain on sale of investment in affiliate | - | - | (10,031 | ) | |||||||
| Stock-based compensation expense | 3,105 | 3,954 | 3,978 | ||||||||
| Deferred income taxes | (1,210 | ) | (124 | ) | (1,021 | ) | |||||
| Excess tax benefit related to share based compensation expense | (159 | ) | - | - | |||||||
| Changes in operating assets and liabilities: | |||||||||||
| Accounts receivable | (4,380 | ) | (15,524 | ) | 54 | ||||||
| Unbilled receivables | 654 | 2,772 | (1,805 | ) | |||||||
| Inventories | (3,926 | ) | (7,509 | ) | 2,981 | ||||||
| Prepaid expenses and other assets | (3,657 | ) | (1,508 | ) | 547 | ||||||
| Accounts payable | (3,048 | ) | 2,672 | (355 | ) | ||||||
| Accrued expenses | (3,232 | ) | 331 | 4,568 | |||||||
| Customer deposits | 2,313 | 707 | (757 | ) | |||||||
| Deferred revenues | 7,901 | 13,946 | (2,705 | ) | |||||||
| Other | 35 | 92 | 104 | ||||||||
| Net cash provided by operating activities | 8,599 | 21,662 | 16,072 | ||||||||
| Cash flows from investing activities: | |||||||||||
| Purchases of property and equipment | (8,355 | ) | (12,948 | ) | (5,768 | ) | |||||
| Proceeds from sale of property and equipment | - | - | 468 | ||||||||
| Purchases of marketable securities | (43,402 | ) | (57,063 | ) | (32,109 | ) | |||||
| Proceeds from sale and maturity of marketable securities | 54,091 | 59,740 | 32,150 | ||||||||
| Acquisition of businesses and payment of contingent consideration, net of cash acquired | (35,019 | ) | (3,204 | ) | (154 | ) | |||||
| Investments in affiliates | (1,824 | ) | (43 | ) | - | ||||||
| Capital distribution from investment in affiliate | - | - | 880 | ||||||||
| Proceeds from sale of investment in affiliate | - | - | 18,187 | ||||||||
| (Deposit) release of restricted cash | 1,512 | (1,500 | ) | - | |||||||
| Net cash (used in) provided by investing activities | (32,997 | ) | (15,018 | ) | 13,654 | ||||||
| Cash flows from financing activities: | |||||||||||
| Purchase of treasury stock | (2,768 | ) | (5,989 | ) | - | ||||||
| Proceeds from issuance of common stock relating to the stock plans | 1,838 | 2,743 | 2,679 | ||||||||
| Excess tax benefit related to share based compensation expense | 159 | - | - | ||||||||
| Net cash (used in) provided by financing activities | (771 | ) | (3,246 | ) | 2,679 | ||||||
| Effect of exchange rates on cash | 358 | (4,299 | ) | (225 | ) | ||||||
| Net (decrease) increase in cash and cash equivalents | (24,811 | ) | (901 | ) | 32,180 | ||||||
| Cash and cash equivalents, beginning of period | 62,458 | 63,359 | 31,179 | ||||||||
| Cash and cash equivalents, end of period | $ | 37,647 | $ | 62,458 | $ | 63,359 | |||||
| Supplemental disclosure of cash flow information: | |||||||||||
| Income taxes paid | $ | 554 | $ | 1,267 | $ | 709 | |||||
| Interest paid | 41 | 38 | 43 | ||||||||
| Supplemental disclosure of non-cash activities: | |||||||||||
| Transfer of items originally classified as inventories to equipment | 2,841 | 3,488 | 1,589 | ||||||||
| Issuance of equity for ODG contingent consideration | - | 8,105 | - | ||||||||
| Conversion of accounts receivable to equity related to investment in affiliate | - | 332 | - | ||||||||
The accompanying notes
are an integral part of these consolidated financial statements.
66
SEACHANGE INTERNATIONAL,
INC.
NOTES TO CONSOLIDATED FINANCIAL STATEMENTS
NOTES TO CONSOLIDATED FINANCIAL STATEMENTS
1. Nature of
Business
SeaChange International, Inc. (“SeaChange” or “the Company”),
headquartered in Acton, Massachusetts, is a leading developer, manufacturer and
marketer of digital video systems and services including the aggregation,
licensing, storage, management and distribution of video, television
programming, and advertising content to cable system operators,
telecommunications companies and broadcast television companies.
2. Summary of Significant Accounting
Policies
Significant accounting policies followed in the preparation of the
accompanying consolidated financial statements are as follows:
Use of Estimates
The preparation of these financial statements in conformity with
accounting principles generally accepted in the United States of America
requires the Company to make estimates and judgments that affect the reported
amounts of assets, liabilities, revenues and expenses, and disclosure of
contingent assets and liabilities. On an ongoing basis, management evaluates
these estimates and judgments, including those related to revenue recognition,
valuation of inventory and accounts receivable, valuation of investments and
income taxes, stock-based compensation, goodwill, intangible assets and related
amortization. The Company bases these estimates on historical and anticipated
results and trends and on various other assumptions that the Company believes
are reasonable under the circumstances, including assumptions as to future
events. These estimates form the basis for making judgments about the carrying
values of assets and liabilities that are not readily apparent from other
sources. By their nature, estimates are subject to an inherent degree of
uncertainty. Actual results may differ from management’s estimates.
Principles of
Consolidation
The Company consolidates the financial statements of its wholly-owned
subsidiaries and all intercompany accounts are eliminated in consolidation.
SeaChange also holds minority investments in the capital stock of certain
private companies having product offerings or customer relationships that have
strategic importance. The Company evaluates its equity and debt investments and
other contractual relationships with affiliate companies in order to determine
whether the guidelines regarding the consolidation of variable interest entities
(“VIE”) should be applied in the financial statements. Consolidation guidelines
address consolidation by business enterprises of variable interest entities that
possess certain characteristics. A variable interest entity is defined as an
entity in which equity investors do not have the characteristics of a
controlling financial interest or do not have sufficient equity at risk for the
entity to finance its activities without additional subordinated financial
support. The primary beneficiary is required to consolidate the financial
position and results of the VIE. The Company has concluded that it is not the
primary beneficiary for any variable interest entities during the fiscal year
ended January 31, 2010.
Equity
Investments
The Company’s investments in affiliates include investments accounted for
under the cost method and the equity method of accounting. The investments that
represent less than a 20% ownership interest of the common shares of the
affiliate are carried at cost. Under the equity method of accounting, which
generally applies to investments that represent 20% to 50% ownership of the
common shares of the affiliate, SeaChange’s proportionate ownership share of the
earnings or losses of the affiliate are included in equity income in earnings of
affiliates in equity income (loss) in earnings of affiliates in the consolidated
statement of operations.
67
The Company periodically reviews
indicators of the fair value of its investments in affiliates in order to assess
whether available facts or circumstances, both internally and externally, may
suggest an other than temporary decline in the value of the investment.
The carrying value of an investment in an affiliate may be affected by the
affiliate’s ability to obtain adequate funding and execute its business plans,
general market conditions, industry considerations specific to the affiliate’s
business, and other factors. The inability of an affiliate to obtain future
funding or successfully execute its business plan could adversely affect the
Company’s equity earnings of the affiliate in the periods affected by those
events. Future adverse changes in market conditions or poor operating results of
the affiliates could result in equity losses or an inability to recover the
carrying value of the investments in affiliates that may not be reflected in an
investment’s current carrying value, thereby possibly requiring an impairment
charge in the future. The Company records an impairment charge when it
believes an investment has experienced a decline in value that is
other-than-temporary.
Revenue Recognition
Revenues from sales of hardware, software and systems that do not require
significant modification or customization of the underlying software are
recognized when title and risk of loss has passed to the customer, there is
evidence of an arrangement, fees are fixed or determinable and collection of the
related receivable is considered probable. Customers are billed for
installation, training, project management and at least one year of product
maintenance and technical support at the time of the product sale. Revenue from
these activities are deferred at the time of the product sale and recognized
ratably over the period these services are performed. Revenue from ongoing
product maintenance and technical support agreements are recognized ratably over
the period of the related agreements. Revenue from software development
contracts that include significant modification or customization, including
software product enhancements, is recognized based on the percentage of
completion contract accounting method using labor efforts expended in relation
to estimates of total labor efforts to complete the contract. Accounting for
contract amendments and customer change orders are included in contract
accounting when executed. Revenue from shipping and handling costs and other
out-of-pocket expenses reimbursed by customers are included in revenues and cost
of revenues. SeaChange’s share of intercompany profits associated with sales and
services provided to affiliated companies are eliminated in consolidation in
proportion to our equity ownership.
SeaChange’s transactions frequently involve the sales of hardware,
software, systems and services in multiple element arrangements. Revenues under
multiple element arrangements are recorded based on the residual method of
accounting. Under this method, the total arrangement value is allocated first to
undelivered elements, based on their fair values, with the remainder being
allocated to the delivered elements. Where fair value of undelivered service
elements has not been established, the total arrangement value is recognized
over the period during which the services are performed. The amounts allocated
to undelivered elements, which may include project management, training,
installation, maintenance and technical support and certain hardware and
software components, are based upon the price charged when these elements are
sold separately and unaccompanied by the other elements. The amount allocated to
installation, training and project management revenue is based upon standard
hourly billing rates and the estimated time required to complete the service.
These services are not essential to the functionality of systems as these
services do not alter the equipment’s capabilities, are available from other
vendors and the systems are standard products. For multiple element arrangements
that include software development with significant modification or customization
and systems sales where vendor-specific objective evidence of the fair value
does not exist for the undelivered elements of the arrangement (other than
maintenance and technical support), percentage of completion accounting is
applied for revenue recognition purposes to the entire arrangement with the
exception of maintenance and technical support.
Service revenue from content processing provided to the Company’s
customers is recognized when services are provided, based on contracted rates.
Upfront fees received for services are recognized ratably over the period
earned, whichever is the longer of the contract term or the estimated customer
relationship.
Any taxes assessed by a governmental authority related to
revenue-producing transactions (e.g. sales or value-added taxes) are reported on
a net basis and excluded from revenues.
Concentration of Credit Risk and
Major Customers
Financial instruments which potentially expose SeaChange to
concentrations of credit risk include cash equivalents, investments in treasury
bills, certificates of deposits and commercial paper, trade accounts receivable,
accounts payable and accrued liabilities. The Company restricts its cash
equivalents and investments in marketable securities to repurchase agreements
with major banks and U.S. government and corporate securities which are subject
to minimal credit and market risk.
68
For trade accounts receivable, SeaChange evaluates customers’ financial
condition, requires advance payments from certain of its customers and maintains
reserves for potential credit losses. The Company performs ongoing credit
evaluations of customers’ financial condition but generally does not require
collateral. For some international customers, SeaChange requires an irrevocable
letter of credit to be issued by the customer before the purchase order is
accepted. The Company monitors payments from customers and assesses any
collection issues. The Company maintains allowances for specific doubtful
accounts and other risk categories of accounts based on estimates of losses
resulting from the inability of the Company’s customers to make required
payments and records these allowances as a charge to general and administrative
expenses. SeaChange bases its allowances for doubtful accounts on historical
collections and write-off experience, current trends, credit assessments, and
other analysis of specific customer situations. At January 31, 2010 and 2009,
SeaChange had an allowance for doubtful accounts of $852,000 and $853,000,
respectively, to provide for potential credit losses. At January 31, 2010, three
separate customers accounted for 23%, 16%, and 11%, respectively, of SeaChange’s
gross accounts receivable balance. At January 31, 2009, two separate customers
accounted for 27% and 14%, respectively, of SeaChange’s gross accounts
receivable balance.
Cash Equivalents and Marketable
Securities
SeaChange accounts for investments in accordance with authoritative
guidance that defines investment classifications. The Company determines the
appropriate classification of debt securities at the time of purchase and
reevaluates such designation as of each balance sheet date. SeaChange’s
investment portfolio consists of money market funds, corporate debt investments,
asset-backed securities, government-sponsored enterprises, and state and
municipal obligations. All highly liquid investments with an original maturity
of three months or less when purchased are considered to be cash equivalents.
All cash equivalents are carried at cost, which approximates fair value.
SeaChange’s marketable securities are classified as available-for-sale and are
reported at fair value with unrealized gains and losses, net of tax, reported in
stockholders’ equity as a component of accumulated other comprehensive income or
loss. The amortization of premiums and accretions of discounts to maturity are
computed under the effective interest method and are included in interest
income. Interest on securities is recorded as earned and is also included in
interest income. Any realized gains or losses would be shown in the accompanying
consolidated statements of operations in other income or expense.
The Company evaluates its investments on a regular basis to determine
whether an other-than-temporary decline in fair value has occurred. This
evaluation consists of a review of several factors, including, but not limited
to: the length of time and extent that an investment has been in an unrealized
loss position; the existence of an event that would impair the issuer's future
earnings potential; and the Company’s intent and ability to hold an investment
for a period of time sufficient to allow for any anticipated recovery in fair
value. Declines in value below cost for investments where it is considered
probable that all contractual terms of the investment will be satisfied, is due
primarily to changes in interest rates, and where the company has the intent and
ability to hold the investment for a period of time sufficient to allow a market
recovery, and are not assumed to be other-than-temporary. Any
other-than-temporary declines in fair value are recorded in earnings and a new
cost basis for the investment is established.
Inventory
Valuation
Inventories are stated at the lower of cost or net realizable value. Cost
is determined using the first-in, first-out (FIFO) method. Inventories consist
primarily of components and subassemblies and finished products held for sale.
The values of inventories are reviewed quarterly to determine that the carrying
value is stated at the lower of cost or net realizable value. SeaChange records
charges to reduce inventory to its net realizable value when impairment is
identified through the quarterly review process. The obsolescence evaluation is
based upon assumptions and estimates about future demand, or possible
alternative uses and involves significant judgments. For the years ended January
31, 2010, 2009 and 2008, the Company recorded inventory write-downs of
$569,000, $1.0 million, and $2.1 million, respectively.
Property and
Equipment
Property and equipment consists of land and buildings, office and
computer equipment, leasehold improvements, demonstration equipment, deployed
assets and spare components and assemblies used to service SeaChange’s installed
base.
69
Demonstration equipment consists of systems manufactured by SeaChange for
use in marketing and selling activities. Property and equipment are recorded at
cost and depreciated over their estimated useful lives. Leasehold improvements
are amortized over the shorter of their estimated useful lives or the term of
the respective leases using the straight-line method. Deployed assets consist of
movie systems owned and manufactured by SeaChange that are installed in a hotel
environment. Deployed assets are depreciated over the life of the related
service agreements. Capitalized service and spare components are depreciated
over the estimated useful lives using the straight-line method. Maintenance and
repair costs are expensed as incurred. Upon retirement or sale, the cost of the
assets disposed of, and the related accumulated depreciation, are removed from
the accounts, and any resulting gain or loss is included in the determination of
net income.
Goodwill and Long-Lived Assets
The Company recognizes the excess of the purchase price over the fair
value of the net tangible and intangible assets acquired as goodwill. At the
time of acquisition, goodwill is assigned to the operating segment as the
applicable reporting unit for the goodwill impairment review. Goodwill is not
amortized, but is evaluated for impairment, at the reporting unit level,
annually in the third fiscal quarter. Goodwill of a reporting unit also is
tested for impairment on an interim basis in addition to the annual evaluation
if an event occurs or circumstances change such as declines in sales, earnings
or cash flows, decline in the Company’s stock price, or material adverse changes
in the business climate, which would more likely than not reduce the fair value
of a reporting unit below its carrying amount. The process of evaluating
goodwill for impairment requires several judgments and assumptions to be made to
determine the fair value of the reporting units, including the method used to
determine fair value, discount rates, expected levels of cash flows, revenues
and earnings, and the selection of comparable companies used to develop market
based assumptions.
The Company accounts for business acquisitions in accordance with
authoritative guidance which determines and records the fair values of assets
acquired, liabilities, contractual contingencies and contingent consideration
assumed as of the dates of acquisition. The purchase price allocation process
requires management to make significant estimates and assumptions, especially at
the acquisition date with respect to intangible assets and estimated contingent
consideration payments.
SeaChange also evaluates property and equipment, intangible assets and
other long-lived assets on a regular basis for the existence of facts or
circumstances, both internal and external that may suggest an asset is not
recoverable. If such circumstances exist, SeaChange evaluates the carrying value
of long-lived assets to determine if impairment exists based upon estimated
undiscounted future cash flows over the remaining useful life of the assets and
compares that value to the carrying value of the assets. SeaChange’s cash flow
estimates contain management’s best estimates, using appropriate and customary
assumptions and projections at the time.
Intangible assets consist of customer contracts, completed technology,
in-process research and development, non-competition agreements, patents and
trademarks and are respectively assigned to the operating segments. The
intangible assets are amortized to cost of sales and operating expenses, as
appropriate, on a straight-line or accelerated basis in order to reflect the
period that the assets will be consumed. In-process research and development
assets as of the acquisition date are recorded as indefinite-lived intangible
assets and are subject to impairment testing at least annually. The useful life
of the intangible asset recognized will be reconsidered if and when in-process
research and development project is completed or abandoned.
SeaChange develops software for resale in markets that are subject to
rapid technological change, new product development and changing customer needs.
The time period during which software development costs can be capitalized from
the point of reaching technological feasibility until the time of general
product release is very short, and consequently, the amounts that could be
capitalized are not material to the Company’s financial position or results of
operations. Software development costs relating to sales of software requiring
significant modification or customization are charged to costs of product
revenues.
70
During fiscal 2008, the Company determined that purchased capitalized
software licenses that were classified as Other assets on the Company’s
Consolidated Balance Sheets was impaired, resulting in a reduction to Other
assets of $4.1 million and a corresponding increase to Cost of revenues on the
Company’s Consolidated Statement of Operations for the year ended January 31,
2008. The Company concluded that three separate capitalized software licenses
that were purchased for eventual use in current and future products of the
Company were impaired based on its determination that triggering events had
occurred during fiscal 2008 that warranted consideration of an impairment of
long-lived assets. The Company abandoned plans to use the capitalized software
licenses in any new or existing Company products during fiscal 2008. With no
identified future cash flows to substantiate further capitalization of these
software licenses, the Company determined these assets to be impaired during the
fiscal year ended January 31, 2008.
Amortization expense is recorded over the period of economic consumption
or the life of the agreement, whichever results in the higher expense, starting
with the first shipment of the product to a customer. Amortization expense
charged to cost of sales was $638,000, $100,000 and $4.8 million for the fiscal
years ended January 31, 2010, 2009 and 2008, respectively. Of the $4.8 million
fiscal year 2008 amortization, $4.1 million includes accelerated amortization
taken in the second quarter to align the recognition of amortization expense
with the remaining economic life of the purchased software.
Income Taxes
Accounting for Income Taxes. As part of the process of preparing the Company’s financial statements,
the Company is required to estimate its provision for income taxes in each of
the jurisdictions in which it operates. This process involves
estimating its actual current tax exposure, including assessing the risks
associated with tax audits, together with assessing temporary differences
resulting from the different treatment of items for tax and accounting purposes.
These differences result in deferred tax assets and liabilities, which are
included within the Company’s balance sheet.
Deferred income tax assets and liabilities are recognized for the future
tax consequences attributable to differences between the financial statement
carrying amounts of existing assets and liabilities and their respective income
tax bases, and operating loss and tax credit carryforwards. The Company
evaluates the weight of all available evidence to determine whether it is more
likely than not that some portion or all of the deferred income tax assets will
not be realized. The Company will record a valuation allowance if the likelihood
of realization of the deferred tax assets in the future is reduced based on an
evaluation of objective verifiable evidence. Significant management judgment is
required in determining its income tax provision, its deferred tax assets and
liabilities and any valuation allowance recorded against its deferred tax
assets. The Company has established a valuation allowance against its United
States deferred tax assets due to indications that they may not be fully
realized. The amount of the deferred tax asset considered realizable is subject
to change based on future events, including generating sufficient pre-tax income
in future periods. In the event that actual results differ from these estimates,
the Company’s provision for income taxes could be materially impacted. SeaChange
does not provide for U.S. federal and state income taxes on the undistributed
earnings of its non-U.S. subsidiaries that are considered indefinitely
reinvested in the operations outside the U.S.
Authoritative guidance as it relates to income tax liabilities states
that the minimum threshold a tax position is required to meet before being
recognized in the financial statements is “more likely than not” (i.e., a
likelihood of occurrence greater than fifty percent). The recognition threshold
is met when an entity concludes that a tax position, based solely on its
technical merits, is more likely than not to be sustained upon examination by
the relevant taxing authority. Those tax positions failing to qualify for
initial recognition are recognized in the first interim period in which they
meet the more likely than not standard, or are resolved through negotiation or
litigation with the taxing authority, or upon expiration of the statute of
limitations. Derecognition of a tax position that was previously recognized
occurs when an entity subsequently determines that a tax position no longer
meets the more likely than not threshold of being sustained.
The Company files annual income tax returns in multiple taxing
jurisdictions around the world. A number of years may elapse before an uncertain
tax position is audited and finally resolved. While it is often difficult to
predict the final outcome or the timing of resolution of any particular
uncertain tax position, the Company believes that its reserves for income taxes
reflect the most likely outcome. The Company adjusts these reserves as well as
the related interest and penalties, in light of changing facts and
circumstances. If its estimate of tax liabilities proves to be less than the
ultimate assessment, a further charge to expense would result. If payment of
these amounts ultimately proves to be unnecessary, the reversal of the
liabilities would result in tax benefits being recognized in the period when the
Company determines the liabilities are no longer necessary. The changes in
estimate could have a material impact on the Company’s financial position and
operating results. In addition, settlement of any particular position could have
a material and adverse effect on the Company’s cash flows and financial
position.
71
Share-based Compensation.
The Company accounts for all employee and non-employee director
stock-based compensation awards using the authoritative guidance regarding share
based payments. The Company has continued to use the Black-Scholes pricing model
as the most appropriate method for determining the estimated fair value of all
applicable awards. Determining the appropriate fair value model and calculating
the fair value of share-based payment awards requires the input of highly
subjective assumptions, including the expected life of the share-based payment
awards and stock price volatility. Management estimated the volatility based on
the historical volatility of the Company’s stock. The assumptions used in
calculating the fair value of share-based payment awards represent management’s
best estimates, but these estimates involve inherent uncertainties and the
application of management’s judgment. As a result, if circumstances change and
the Company uses different assumptions, the Company’s share-based compensation
expense could be materially different in the future. In addition, the Company is
required to estimate the expected forfeiture rate and only recognize expense for
those shares expected to vest. If the Company’s actual forfeiture rate is
materially different from its estimate, the share-based compensation expense
could be significantly different from what it has recorded in the current
period. The estimated fair value of SeaChange’s stock-based options and
performance-based restricted stock units, less expected forfeitures, is
amortized over the awards’ vesting period on a graded vesting basis, whereas the
restricted stock units and Employee Stock Purchase Plan stock units are
amortized on a straight line basis.
Foreign Currency Translation
For subsidiaries where the U.S. dollar is designated as the functional
currency of the entity, the Company translates that entity’s monetary assets and
liabilities denominated in local currencies into U.S. dollars (the functional
and reporting currency) at current exchange rates, as of each balance sheet
date. Non-monetary assets (e.g., inventories, property, plant, and equipment and
intangible assets) and related income statement accounts (e.g., cost of sales,
depreciation, amortization of intangible assets) are translated at historical
exchange rates between the functional currency (the U.S. dollar) and the local
currency. Revenue and other expense items are translated using average exchange
rates during the fiscal period. Translation adjustments and transactions gains
and losses on foreign currency transactions, and any unrealized gains and losses
on short-term inter-company transactions are included in other income or
expense, net.
For subsidiaries where the local currency is designated as the functional
currency, the Company translates its assets and liabilities into U.S. dollars
(the reporting currency) at current exchange rates as of each balance sheet
date. Revenue and expense items are translated using average exchange rates
during the period. Cumulative translation adjustments are presented as a
separate component of stockholders’ equity. Exchange gains and losses on foreign
currency transactions and unrealized gains and losses on short-term
inter-company transactions are included in other income or expense, net.
The aggregate foreign exchange transaction losses included as other
(expense) income, net on the Consolidated Statement of Operations were $572,000,
$951,000 and $43,000 for the years ended January 31, 2010, 2009 and 2008,
respectively.
Comprehensive Income (Loss)
SeaChange presents accumulated other comprehensive income (loss) and
total comprehensive income (loss) in the Statement of Stockholders’ Equity.
Total comprehensive income (loss) consists primarily of net income (loss),
cumulative translation adjustments and unrealized gains and losses on marketable
securities, net of income tax.
Forward Exchange Contracts not
Designated as Hedging Instruments
SeaChange enters into
foreign currency forward exchange contracts (“forward exchange contracts”) to
manage its exposure to the foreign currency exchange risk related to the fixed
deferred purchase price associated with the acquisition of eventIS Group B.V.
The purpose of the Company’s foreign currency risk management program is to
reduce volatility in earnings caused by exchange rate fluctuation. The Company
does not enter into derivative financial instruments for trading or speculative
purposes. The Company does not designate these forward exchange contracts as
hedging instruments, as such, they do not qualify for hedge accounting
treatment. Therefore, the foreign currency forward contracts are recorded at
fair value, with the gain or loss on these transactions recorded in the
consolidated statements of operations within “other expense, net” in the period
in which they occur. As of January 31, 2010, the Company had one outstanding
foreign currency exchange forward contract to buy Euros totaling €1.2 million
that settles on September 1, 2010. During the year ended January 31, 2010, the
Company recorded approximately $87,000 of losses related to its foreign currency
exchange forward contract. The Company’s foreign currency exchange contract is
an over-the-counter instrument. There is an active market for these instruments,
and therefore, they are classified as Level 1 in the fair value
hierarchy.
72
Advertising
Costs
Advertising costs are charged to expense as incurred. Advertising costs
were $386,000, $340,000 and $300,000 for the years ended January 31, 2010, 2009
and 2008, respectively.
Earnings Per
Share
Earnings per share are presented in accordance with authoritative
guidance, which requires the presentation of “basic” earnings per share and
“diluted” earnings per share. Basic earnings per share is computed by dividing
earnings available to common shareholders by the weighted-average shares of
common stock outstanding during the period. For the purposes of calculating
diluted earnings per share, the denominator includes both the weighted average
number of shares of common stock outstanding during the period and the weighted
average number of potential common stock, such as stock options, employee stock
purchase plan, and restricted stock, calculated using the treasury stock method.
For the fiscal year
ended January 31, 2010, 2009 and 2008 respectively, 3,601,606, 3,699,228 and
4,673,372 of common shares issuable upon the exercise of stock options are
anti-dilutive and have been excluded from the diluted earnings per share
computation as the exercise prices of these common shares were above the market
price of the common stock for the periods indicated. Below is a summary
of the shares used in calculating basic and diluted earnings per share for the
periods indicated:
| Year ended January 31, | |||||
| 2010 | 2009 | 2008 | |||
| Weighted average shares used in calculating earnings | |||||
| per share—Basic | 30,860,194 | 30,724,301 | 29,633,660 | ||
| Dilutive common stock equivalents | 573,174 | 468,174 | 365,955 | ||
| Weighted average shares used in calculating earnings | |||||
| per share—Diluted | 31,433,368 | 31,192,475 | 29,999,615 | ||
Impact of Recently Adopted Accounting
Guidance
Business
Combinations
In December 2007, the Financial Accounting Standards Board (“FASB”)
issued revised accounting guidance requiring the use of fair value, defined as
“the price that would be received to sell an asset or paid to transfer a
liability in an orderly transaction between market participants at the
measurement date.” The new guidance also changes the method of applying the
acquisition method in a number of significant aspects. Any change in the fair
value of the acquisition-related consideration subsequent to the acquisition
date, including changes from events after the acquisition date, such as changes
in the estimate of the performance goals, will be recognized in earnings in the
period the estimated fair value changes; acquisition costs will generally be
expensed as incurred; noncontrolling interests will be valued at fair value at
the acquisition date; in-process research and development will be recorded at
fair value as an indefinite-lived intangible asset at the acquisition date;
restructuring costs associated with a business combination will generally be
expensed subsequent to the acquisition date; and changes in deferred tax asset
valuation allowances and income tax uncertainties after the acquisition date
generally will affect income tax expense. The new guidance amends Accounting for Income Taxes such that adjustments made to valuation allowances on deferred taxes and
acquired tax contingencies associated with acquisitions that closed prior to the
effective date of this guidance would also apply the provisions of this new
guidance. The new guidance was effective for fiscal years beginning after
December 15, 2008, and was adopted by the Company on February 1, 2009. See our
Note 6 to Consolidated Financial Statements for disclosures relating to the
acquisition of eventIS Group B.V. on September 1, 2009 and VividLogic, Inc on
February 1, 2010.
73
Measuring Liabilities at Fair Value
In August 2009, the FASB issued an authoritative update to Fair Value Measurements and Disclosures. This update provides amendments to reduce
potential ambiguity in financial reporting when measuring the fair value of
liabilities. Among other provisions, this update provides clarification in
circumstances in which a quoted price in an active market for the identical
liability is not available, a reporting entity is required to measure fair value
using one or more of the valuation techniques described in the authoritative
update. The update will become effective upon issuance for subsequent interim
and annual periods. The Company adopted this standard on October 31, 2009. The
Company has determined that the update had no impact on its financial condition
or results of operations.
Interim Disclosures about Fair Value
of Financial Instruments
In April 2009, the FASB issued new accounting guidance requiring
additional disclosures about the fair value of financial instruments in interim
as well as in annual financial statements. The Company adopted this standard on
July 31, 2009.
Determining Fair Value
When the Volume and Level of Activity for the Asset or Liability Have
Significantly Decreased and Identifying Transactions That Are Not Orderly
In April 2009, the FASB issued new accounting guidance providing
guidelines for making fair value measurements more consistent with the
principles presented in the Fair Value Measurements and Disclosures guidance. This new accounting guidance
provides additional guidelines in determining whether a market is active or
inactive, and whether a transaction is distressed, is applicable to all assets
and liabilities (i.e. financial and nonfinancial). The Company adopted this
standard on April 30, 2009.
Recent Accounting Guidance Not Yet Effective
Determining which Entity has a
Controlling Financial Interest in a Variable Interest Equity
In December 2009, the FASB amended authoritative guidance regarding the
quantitative-based risks and rewards calculation for determining which reporting
entity, if any, has a controlling financial interest in a variable interest
entity with an approach focused on identifying which reporting entity has the
power to direct the activities of a variable interest entity that most
significantly impact the entity’s economic performance and (1) the obligation to
absorb losses of the entity or (2) the right to receive benefits from the
entity. An approach that is expected to be primarily qualitative will be more
effective for identifying which reporting entity has a controlling financial
interest in a variable interest entity. The amendments in this update also
require additional disclosures about a reporting entity’s involvement in
variable interest entities, which will enhance the information provided to users
of financial statements. The update will become effective for the first annual
period starting after November 15, 2009. This guidance will be adopted by the
Company on a prospective basis beginning February 1, 2010. The Company is
currently assessing the impact this amendment may have on its results of
operations and financial position.
74
Revenue Recognition for Arrangements
with Multiple Deliverables
In September 2009, the Financial Accounting Standards Boards (“FASB”)
amended the guidance for revenue recognition in multiple-element arrangements.
It has been amended to remove from the scope of industry specific revenue
accounting guidance for software and software related transactions, tangible
products containing software components and non-software components that
function together to deliver the product’s essential functionality. The guidance
now requires an entity to provide updated guidance on whether multiple
deliverables exist, how the deliverables in an arrangement should be separated
and the consideration allocated, and allocates revenue in an arrangement using
estimated selling prices of deliverables for these products if a vendor does not
have vendor-specific objective evidence (“VSOE”) or third-party evidence of
selling price. The guidance also eliminates the use of the residual method and
requires an entity to allocate revenue using the relative selling price method
for these products. The accounting changes summarized are effective for fiscal
years beginning on or after June 15, 2010, with early adoption permitted.
Adoption may either be on a prospective basis or by retrospective application.
The Company is currently assessing the impact of these amendments on its
accounting and reporting systems and processes; however, at this time the
Company is unable to quantify the impact of their adoption on its financial
statements or determine the timing and method of its adoption. The Company
believes the impact of the new guidance on future multi-element arrangements may
result in earlier recognition of revenue in future periods.
3. Fair value of Assets and
Liabilities
The applicable accounting guidance establishes a framework for measuring
fair value and expands required disclosure about the fair value measurements of
assets and liabilities. This guidance requires the Company to classify and
disclose assets and liabilities measured at fair value on a recurring basis, as
well as fair value measurements of assets and liabilities measured on a
non-recurring basis in periods subsequent to initial measurement, in a
three-tier fair value hierarchy as described below.
The guidance defines fair value as the exchange price that would be
received for an asset or paid to transfer a liability in the principal or most
advantageous market for the asset or liability in an orderly transaction between
market participants on the measurement date. Valuation techniques used to
measure fair value must maximize the use of observable inputs and minimize the
use of unobservable inputs. The guidance describes three levels of inputs that
may be used to measure fair value:
- Level 1 — Observable inputs that
reflect quoted prices for identical assets or liabilities in active
markets.
- Level 2 — Observable inputs other
than Level 1 prices, such as quoted prices for similar assets or
liabilities; quoted prices in
markets that are not active; or other inputs that are observable or can be
corroborated by observable
market data for substantially the full term of the assets or liabilities. The
Company primarily uses broker
quotes for valuation of its short-term investments.
- Level 3 — Unobservable inputs that are supported by little or no market activity and that are significant to the fair value of the assets or liabilities.
75
The Company’s financial assets and liabilities that are measured at fair
value on a recurring basis as of January 31, 2010 are as follows:
| January 31, | Fair Value Measurements Using | |||||||||||
| 2010 | Level 1 | Level 2 | Level 3 | |||||||||
| (in thousands) | ||||||||||||
| Financial assets: | ||||||||||||
| Cash | $ | 32,725 | $ | 32,725 | - | - | ||||||
| Cash equivalents | 4,922 | 4,922 | - | - | ||||||||
| Available for sale marketable securities: | ||||||||||||
| Current marketable securities: | ||||||||||||
| U.S. government agency issues | 2,114 | 2,114 | - | - | ||||||||
| Non-current marketable securities: | ||||||||||||
| U.S. government agency issues | 8,688 | 8,688 | - | - | ||||||||
| Total | $ | 48,449 | $ | 48,449 | $ | - | $ | - | ||||
| Forward exchange contract | $ | 1,664 | $ | 1,664 | $ | - | $ | - | ||||
| Other liabilities: | ||||||||||||
| Acquisition-related consideration | $ | 9,514 | $ | - | $ | - | $ | 9,514 | ||||
The Company’s financial assets and liabilities that are measured at fair
value on a recurring basis as of January 31, 2009 are as follows:
| January 31, | Fair Value Measurements Using | |||||||||||
| 2009 | Level 1 | Level 2 | Level 3 | |||||||||
| (in thousands) | ||||||||||||
| Cash | $ | 56,953 | $ | 56,953 | - | - | ||||||
| Cash equivalents | 5,505 | 5,505 | - | - | ||||||||
| Financial assets: | ||||||||||||
| Available for sale marketable securities: | ||||||||||||
| Current marketable securities: | ||||||||||||
| U.S. government agency issues | 9,447 | 9,447 | - | - | ||||||||
| Non-current marketable securities: | ||||||||||||
| U.S. government agency issues | 11,415 | 11,415 | - | - | ||||||||
| State and municipal obligations | 1,000 | - | - | 1,000 | ||||||||
| Total | $ | 84,320 | $ | 83,320 | $ | - | $ | 1,000 | ||||
The Company’s auction rate securities were measured at fair value on a
recurring basis using significant Level 3 inputs as of January 31, 2009.
76
The following tables set forth a reconciliation of assets and liabilities
measured at fair value on a recurring basis with the use of significant
unobservable inputs (Level 3):
| Level 3 | |||||||
| Marketable Securities | |||||||
| Year Ended January 31 | |||||||
| 2010 | 2009 | ||||||
| Beginning balance | $ | 1,000 | $ | 1,000 | |||
| Sales | (950 | ) | - | ||||
| Realized loss recorded in other expense | (50 | ) | - | ||||
| Ending balance | $ | - | $ | 1,000 | |||
| Accrued | ||||
| Contingent Consideration | ||||
| Year Ended January 31 | ||||
| 2010 | ||||
| Beginning balance | $ | - | ||
| eventIS acquisition | 10,098 | |||
| Settlement of working capital | (395 | ) | ||
| Change in fair value | (107 | ) | ||
| Translation adjustment | (82 | ) | ||
| Ending balance | $ | 9,514 | ||
The Company relies on mark to market valuations to record the fair value
of the Company’s available for sale security assets which are measured under a
Level 1 input. These assets are publicly traded equity securities for which
market prices are readily observable and recorded. At January 31, 2010, the
Company had $2.1 million in short-term marketable securities and $8.7 million in
long-term marketable securities. During fiscal 2010, the Company sold its $1
million par value auction rate security back to the issuer for $950,000 and
incurred a $50,000 realized loss recorded in other expense, net.
The Company determines the appropriate classification of debt securities
at the time of purchase and reevaluates such designation as of each balance
sheet date. SeaChange’s investment portfolio consists of money market funds,
corporate debt investments, asset-backed securities, government-sponsored
enterprises, and state and municipal obligations. All highly liquid investments
with an original maturity of three months or less when purchased are considered
to be cash equivalents. All cash equivalents are carried at cost, which
approximates fair value. SeaChange’s marketable securities are classified as
available-for-sale and are reported at fair value with unrealized gains and
losses, net of tax, reported in stockholders’ equity as a component of
accumulated other comprehensive income or loss. The amortization of premiums and
accretions of discounts to maturity are computed under the effective interest
method and is included in interest income. Interest on securities is recorded as
earned and is also included in interest income. Any realized gains or losses
would be shown in the accompanying consolidated statements of operations in
other expense, net.
77
The following is a summary of available-for-sale securities, including
the cost basis, aggregate fair value and gross unrealized gains and losses, for
cash equivalents, short-and long-term marketable securities portfolio as of
January 31, 2010 and 2009:
| Gross | Gross | |||||||||||
| Unrealized | Unrealized | Estimated | ||||||||||
| Cost | Gains | Losses | Fair Value | |||||||||
| (in thousands) | ||||||||||||
| January 31, 2010: | ||||||||||||
| Cash | $ | 32,725 | $ | - | $ | - | $ | 32,725 | ||||
| Cash equivalents | 4,922 | - | - | 4,922 | ||||||||
| Cash and cash equivalents | 37,647 | - | - | 37,647 | ||||||||
| US government agency issues | 2,023 | 91 | - | 2,114 | ||||||||
| Marketable securities—short-term | 2,023 | 91 | - | 2,114 | ||||||||
| US government agency issues | 8,276 | 161 | - | 8,437 | ||||||||
| Corporate debt securities | 250 | 1 | - | 251 | ||||||||
| Marketable securities—long-term | 8,526 | 162 | - | 8,688 | ||||||||
| Total cash equivalents and marketable securities | $ | 48,196 | $ | 253 | $ | - | $ | 48,449 | ||||
| January 31, 2009: | ||||||||||||
| Cash | $ | 56,953 | $ | - | $ | - | $ | 56,953 | ||||
| Cash equivalents | 5,505 | - | - | 5,505 | ||||||||
| Cash and cash equivalents | 62,458 | - | - | 62,458 | ||||||||
| US government agency issues | 9,280 | 163 | - | 9,443 | ||||||||
| Corporate debt securities | 4 | - | - | 4 | ||||||||
| Marketable securities—short-term | 9,284 | 163 | - | 9,447 | ||||||||
| US government agency issues | 10,117 | 275 | - | 10,392 | ||||||||
| Corporate debt securities | 1,003 | 20 | - | 1,023 | ||||||||
| State and municipal obligations | 1,000 | - | - | 1,000 | ||||||||
| Marketable securities—long-term | 12,120 | 295 | - | 12,415 | ||||||||
| Total cash equivalents and marketable securities | $ | 83,862 | $ | 458 | $ | - | $ | 84,320 | ||||
During the years ended January 31, 2010, 2009 and 2008,
available-for-sale securities were sold for total proceeds of $11.6 million,
$8.0 million, and $0, respectively. The gross realized gains and losses fiscal
years 2010, 2009 and 2008 were immaterial. For purposes of determining gross
realized gains and losses, the cost of securities sold is based on specific
identification.
Contractual maturities of
available-for-sale debt securities at January 31, 2010 are as follows (in
thousands):
| Estimated | |||
| Fair Value | |||
| Maturity of one year or less | $ | 2,114 | |
| Maturity between one and five years | 8,688 | ||
| Total | $ | 10,802 | |
The Company concluded that there were no declines in investments recorded
as of January 31, 2010, 2009 and 2008 and the Company does not have any
investments in a gross unrealized loss position as of January 31, 2010 and 2009.
The unrealized holding gains, net of tax, on available-for-sale securities in
the amount of $262,000, $23,000 and $449,000 for the years ended January 31,
2010, 2009 and 2008, respectively, have been included in stockholders’ equity as
a component of accumulated other comprehensive income or loss.
Cash, Cash Equivalents and
Marketable Securities
Cash and cash equivalents consist primarily of highly liquid investments
in money market mutual funds, government sponsored enterprise obligations,
treasury bills, commercial paper and other money market securities with
remaining maturities at date of purchase of 90 days or less. The carrying value
of cash, cash equivalents and marketable securities at January 31, 2010 and 2009
was $48.4 million and $84.3 million, respectively, and approximated fair
value.
78
Restricted
Cash
Pursuant to certain lease agreements and share purchase agreements, we
are required to maintain cash reserves, classified as restricted cash. Current
restricted cash totaled $73,000 and $1.4 million at January 31, 2010 and 2009,
respectively.
Foreign Currency Exchange Risk
The Company entered into a foreign exchange forward contract denominated
in Euros to hedge against a portion of the foreign currency exchange risk
associated with the acquisition of eventIS Group B.V. for the fixed deferred
purchase price. The purpose of the Company’s foreign currency risk management
program is to reduce volatility in earnings caused by exchange rate
fluctuations. Authoritative guidance requires companies to recognize all of the
derivative financial instruments as either assets or liabilities at fair value
in the consolidated balance sheets based upon quoted market prices for
comparable instruments. The Company’s derivative instrument did not meet the
criteria for hedge accounting within authoritative guidance. Therefore, the
foreign currency forward contracts are recorded at fair value, with the gain or
loss on these transactions recorded in the consolidated statements of operations
within “interest and other income, net” in the period in which they occur. The
Company does not use derivative financial instruments for trading or speculative
purposes. As of January 31, 2010, the Company had one outstanding foreign
currency exchange forward contract to buy Euros totaling ¬1.2 million that
settles on September 1, 2010. During the year ended January 31, 2010, the
Company recorded approximately $87,000 of losses related to its foreign currency
exchange forward contract. Typically, any losses or gains on the forward
exchange contracts are offset by re-measurement losses or gains on the
underlying balances denominated in non-functional currencies. The Company’s
foreign currency exchange contract is an over-the-counter instrument. There is
an active market for these instruments, and therefore, they are classified as
Level 1 in the fair value hierarchy.
Acquisition-Related Consideration
We determined the fair value of the acquisition-related consideration in
connection with the acquisition of eventIS Group BV in September 2009 using a
probability-weighted discounted cash flow model. This fair value measurement is
based on significant inputs not observed in the market and thus represents a
Level 3 measurement. Any change in the fair value of the acquisition-related
consideration for the deferred fixed purchase price and earnout payments
subsequent to the acquisition date, including changes from events after the
acquisition date, such as changes in our estimate of the performance goals, will
be recognized in earnings in the period the estimated fair value changes. The
fair value of the acquisition-related consideration to be distributed directly
to the eventIS selling shareholder is to be $10.1 million.
4. Consolidated Balance Sheet
Detail
Inventories consist of the
following:
| Year ended January 31, | ||||||
| 2010 | 2009 | |||||
| (in thousands) | ||||||
| Components and assemblies | $ | 11,316 | $ | 8,501 | ||
| Finished products | 6,514 | 8,750 | ||||
| Total inventories, net | $ | 17,830 | $ | 17,251 | ||
79
Property and equipment, net consist
of the following:
| Estimated useful | Year ended January 31, | |||||||||
| life (years) | 2010 | 2009 | ||||||||
| (in thousands) | ||||||||||
| Land | $ | 4,295 | $ | 4,165 | ||||||
| Buildings | 20 | 13,364 | 15,940 | |||||||
| Office furniture and equipment | 5 | 2,867 | 2,887 | |||||||
| Computer equipment, software and demonstration equipment | 3 | 65,815 | 49,688 | |||||||
| Deployed assets | 2-7 | 3,280 | 3,280 | |||||||
| Service and spare components | 5 | 8,731 | 8,296 | |||||||
| Leasehold improvements | 1-7 | 2,629 | 1,993 | |||||||
| Automobiles and trucks | 5 | 211 | 592 | |||||||
| Construction in progress | 1,048 | 3,413 | ||||||||
| 102,240 | 90,254 | |||||||||
| Less - Accumulated depreciation and amortization | (62,558 | ) | (55,037 | ) | ||||||
| Total property and equipment, net | $ | 39,682 | $ | 35,217 | ||||||
Depreciation and amortization expense of fixed assets was $8.0 million,
$7.2 million and $7.9 million for the years ended January 31, 2010, 2009 and
2008, respectively.
Other accrued expenses consist of
the following:
| Year ended January 31, | ||||||
| 2010 | 2009 | |||||
| (in thousands) | ||||||
| Acquisition-related consideration | $ | 2,941 | $ | - | ||
| Accrued compensation and commissions | 3,051 | 5,107 | ||||
| Employee benefits | 585 | 1,935 | ||||
| Accrued other | 4,597 | 3,550 | ||||
| Total other accrued expenses | $ | 11,174 | $ | 10,592 | ||
5. Investments in Affiliates
SeaChange periodically reviews indicators of the fair value of its
investments in affiliate companies in order to assess whether available facts or
circumstances, both internally and externally, may suggest an other than
temporary decline in the fair value of the investment. There were no indications
of other than temporary declines in the fair value of investments in affiliates
as of January 31, 2010 and 2009, respectively. The Company’s investments in
affiliates under the cost method of accounting are as follows:
| Year ended January 31, | ||||||
| 2010 | 2009 | |||||
| (in thousands) | ||||||
| Casa | $ | 8,897 | $ | 8,243 | ||
| Minerva | 1,000 | 1,000 | ||||
| Insite One | 2,748 | 2,748 | ||||
| Visible World | 552 | 552 | ||||
| Other investments | 500 | 500 | ||||
| Total investments in affiliates | $ | 13,697 | $ | 13,043 | ||
Casa Systems. The
Company has a 19.8% ownership interest in Casa Systems, Inc. (“Casa”), a
Massachusetts development stage company that specializes in video-on-demand
products within the telecommunications and television markets. The investment is
represented by shares of convertible preferred stock, and the shares are
convertible at SeaChange’s option into shares of Casa’s common stock on a
one-to-one basis. The convertible preferred stock accrues dividends at the rate
per annum of $0.3832 per share and the payment of the cumulative accruing
dividends must be declared by the Board of Directors of Casa. In June of 2009,
the Company invested $654,000 in convertible preferred stock, preserving its
19.8% ownership interest of Casa Systems, Inc. Consistent with prior periods,
SeaChange accounts for this investment under the cost method of accounting. For
fiscal 2010, 2009 and 2008, SeaChange purchased $52,000, $98,000 and $984,000,
respectively, of equipment from Casa Systems.
80
Minerva. SeaChange owns 1.3 million shares of
preferred stock representing 2.5% of the total capital stock of Minerva
Networks, Inc. (“Minerva”), a California based company specializing in software
products for the telecommunications and television markets. The preferred shares
are convertible to 1.3 million shares of common stock under certain conditions
as defined in the Stock Purchase Agreement. SeaChange accounts for this
investment under the cost method of accounting.
InSite One. The
company has approximately 12% ownership of the total capital stock of InSite
One, Inc. (“InSite”). In February 2008, the Company agreed to convert the
outstanding accounts receivable balance of $332,000 as of January 31, 2008 for
474,300 shares of InSite One’s Series E Convertible Preferred Stock. SeaChange
accounts for this investment under the cost method of accounting. In total, for
fiscal years 2010, 2009 and 2008 SeaChange recognized revenues of $31,000,
$164,000 and $711,000, respectively, from InSite One.
Visible World. SeaChange owns less than 5% of the common and preferred stock of Visible
World and is accounting for this investment under the cost method of accounting.
In fiscal 2004, SeaChange and Visible World signed a revised Marketing Agreement
in which SeaChange agreed to receive warrants to purchase 2.8 million shares of
preferred stock of Visible World in lieu of future royalties that would have
been earned by SeaChange relating to revenue earned by Visible World in
accordance with an agreement between Visible World and Comcast Cable Corporation
(“Comcast”). The warrants vested over the five year term of the agreement
between Visible World and Comcast and ended in fiscal year 2009. SeaChange
estimated the fair value of these warrants to be $223,000 and included the
amount in investments in affiliates with an offsetting amount included in
deferred revenue. SeaChange recognized the deferred revenue over a five year
period, the term of the agreement ending in fiscal year 2009. For fiscal years
2010, 2009 and 2008, SeaChange recognized revenues of approximately $641,000,
$703,000 and $971,000 respectively, from Visible World.
6. Acquisitions and
Dispositions
FilmFlex Movies
Limited
On December 21, 2007, SeaChange sold all of its 33% equity investment in
FilmFlex Movies Limited (“FilmFlex”) to the two other existing shareholders in
FilmFlex (Sony and Disney) and to FilmFlex. The aggregate consideration received
by the Company in connection with this sale was $17.9 million in cash resulting
in a gain of approximately $10.0 million. Concurrent with the FilmFlex
divestiture, ODG executed a two year outsourcing services agreement, which
expired on December 21, 2009, which provided FilmFlex with selected planning,
production and operations support services. Total revenues for fiscal year 2010,
2009, and 2008 were $1.7 million, $2.7 million, and $3.3 million, respectively.
On Demand Deutschland GmbH & Co.
KG
On February 27, 2007, the On Demand Group Limited (“ODG”), a wholly-owned
U.K. subsidiary of SeaChange, entered into an agreement with Tele-Munchen
Fernseh GmbH & Co. Produktionsgesellschaft (TMG) to create a joint venture
named On Demand Deutschland GmbH & Co. KG. On Demand Deutschland specializes
in establishing on-demand and pay-per-view services on multiple platforms in
German-speaking Europe. ODG contributed $2.8 million to acquire its 50%
ownership interest in the joint venture of which $2.6 million consisted of the
fair value of customer contracts and content license agreements contributed by
ODG and $154,000 represented a cash contribution. The customer contracts and
licensed content had no book value. SeaChange determined that this investment is
an operating joint venture and does not require consolidation. Consequently,
SeaChange accounts for this investment under the equity method of
accounting.
81
ODG’s original investment in the joint venture was recorded at $154,000
representing the US dollar equivalent of the initial cash contribution. The
difference between the book and fair value of the customer contracts and content
license agreements is being accreted over the expected five year life of the
contracts and recorded as a gain and an increase in the investment. This gain
will be partially offset by ODG’s 50% share of the joint venture’s amortization
expense over the same period related to the acquired contracts and content
license agreements. ODG also recorded a net payable amount to the joint venture
of $337,000 as of the joint venture formation date (February 27, 2007)
reflecting the transfer of net liabilities incurred by ODG related to the joint
venture as well as the joint venture’s reimbursement of previously incurred
costs by ODG of $787,000 related to joint venture activities prior to its
formation. Consistent with authoritative guidance regarding non-monetary
transactions, ODG did not record other income in connection with the
reimbursement of these costs or any other gains as ODG is deemed to have a
commitment to support the operations of the joint venture. ODG treated the
reimbursement and other gain for a total of $869,000 as a capital distribution
in excess of the carrying value of its investment in the joint venture. This
capital distribution will be accreted over the expected five year life of the
customer contracts and recorded as a gain and an increase in the investment in
the joint venture. ODG recorded an income tax provision during fiscal 2008 of
$1.1 million for the taxable gain recognized by ODG related to the $2.6 million
contribution of customer contracts and content licenses to and the reimbursement
of previously paid costs from the joint venture.
ODG entered into a Service Agreement with the joint venture whereby ODG
provides content aggregation, distribution, marketing and administration
services to the joint venture under an arm’s length fee structure. For the years
ended January 31, 2010, 2009 and 2008, ODG recorded revenues of $1.8 million,
$1.5 million, and $1.0, respectively, related to the Service Agreement. ODG’s
share of profits from this agreement in proportion to its equity ownership
interest is eliminated in consolidation.
The Shareholder’s Agreement requires both ODG and TMG to provide cash
contributions up to $4.2 million upon the request of the joint venture’s
management and approval by the shareholders of the joint venture. For the year
ended January 31, 2010, ODG and TMG each made additional cash contributions of
$1.2 million to the joint venture.
ODG recorded its proportionate share of the joint venture’s losses for
the fiscal years ended January 31, 2010 and 2009 of $653,000 and $770,000,
respectively, and a gain of $1.1 million in the fiscal year ended January 31,
2008. Due to the capital distribution and ODG’s share of the joint venture’s net
loss exceeding the book value of its investment in the joint venture, the
investment is recorded as a long-term liability of $1.5 million and $1.7 million
at January 31, 2010 and 2009, respectively.
Mobix Interactive Limited
On November 19, 2008, ODG acquired all the outstanding capital stock (the
“Mobix Shares”) of Mobix Interactive Limited (“Mobix”) pursuant to the Share
Purchase Agreement relating to the sale and purchase of the whole issued and to
be issued share capital of Mobix Interactive Limited, dated as of November 18,
2008 (the “Mobix Share Purchase Agreement”). Mobix is a London, England based
company that provides software and content services related to the deployment of
mobile video services for wireless network operators.
At the closing, ODG paid the shareholders of Mobix $3.0 million in cash
for the Mobix Shares in addition to $1.5 million paid into escrow. The $1.5
million deposited in escrow was subsequently returned to ODG on May 27, 2009 due
to Mobix failing to meet certain performance goals within the Mobix Share
Purchase Agreement. In addition, on March 16, 2009, ODG paid $700,000 to the
former shareholders of Mobix due to Mobix achieving one of the performance goals
within the Mobix Share Purchase Agreement, which is reflected in the preliminary
purchase price allocation. On September 16, 2009, the Company and the
former shareholders of Mobix amended the original Mobix Share Purchase Agreement
to provide for the satisfaction of the future contingent considerations with a
payment of $1.8 million. The amount was recorded as additional
goodwill.
The acquisition was accounted for under the purchase method of
accounting. Accordingly, the financial position and results of operations of
Mobix’s business have been consolidated subsequent to the acquisition date. The
finalization of the valuation for Mobix in the third quarter of fiscal 2010
resulted in a decrease to goodwill of $1.4 million, and an increase in
intangible assets of $1.9 million and a deferred tax liability of $500,000.
82
| (in thousands) | |||
| Consideration: | |||
| Cash paid, net of cash acquired of $209 | $ | 5,268 | |
| Transaction costs | 414 | ||
| Total consideration | $ | 5,682 | |
| Allocation of the purchase consideration: | |||
| Tangible assets acquired | $ | 591 | |
| Intangible assets: | |||
| Non-compete agreements | 380 | ||
| Software technology | 431 | ||
| Customer contracts | 1,043 | ||
| Goodwill | 4,654 | ||
| Liabilities assumed | (898 | ) | |
| Deferred tax liability | (519 | ) | |
| $ | 5,682 | ||
SeaChange determined that the goodwill included the value of the Mobix
work force and expected synergies in global sales and marketing, especially
within the European market, and in content services related to the deployment of
mobile video services for wireless network operators. The goodwill generated
from the acquisition is not tax deductible. The acquired assets, including
goodwill, have been assigned to the Media Service operating segment.
eventIS Group B.V.
On September 1, 2009, the Company acquired the entire share capital (the
“eventIS Shares”) pursuant to the Agreement for the Acquisition of the Entire
Share Capital of eventIS Group B.V. (the “eventIS Share Purchase Agreement”) of
eventIS Group B.V. (”eventIS”). eventIS, based in Eindhoven, the Netherlands,
provides video on demand and linear broadcast software and related services to
cable television and telecommunications companies primarily in Europe. The
results of eventIS’s operations have been included in the consolidated financial
statements since the acquisition date. The Company acquired eventIS to expand
its VOD solutions into the European market.
Fair Value of Consideration
Transferred
At the closing, the Company made a cash payment to the former shareholder
of eventIS equal to the sum of the initial purchase price under the eventIS
Share Purchase Agreement of approximately $34.4 million plus $2.2 million based
on an estimated working capital adjustment in accordance with the eventIS Share
Purchase Agreement. The final working capital adjustment was settled during the
fourth quarter of fiscal 2010 for an additional payment of
$395,000.
On each of the first, second and third anniversaries of the closing date,
the Company is obligated to make additional fixed payments of deferred purchase
price under the eventIS Share Purchase Agreement (the “Deferred Fixed Purchase
Price Payments”), each such payment to be in an aggregate amount of $2.8 million
with $1.7 million payable in cash and $1.1 million payable by the issuance of
restricted shares of SeaChange common stock, which will vest in equal
installments over three years starting on the first anniversary of the date of
issuance (“Restricted Stock”). At the option of the former shareholder of
eventIS, up to forty percent of this payment in Restricted Stock may be payable
in cash. Under the earnout provisions of the eventIS Share Purchase Agreement,
if certain performance goals are met over each of the three periods ending
January 31, 2013, the Company will be obligated to make additional cash payments
to the former shareholder of eventIS (each, an “Earnout Payment”).
83
The total acquisition date fair value of the consideration transferred
was estimated at $46.7 million, which included the initial payments totaling
$36.6 million in cash plus the fair value of the additional consideration to be
paid to the former eventIS shareholder totaling $10.1 million. The total
acquisition date fair value of consideration transferred was as
follows:
| (in thousands) | |||
| Payment of cash to eventIS shareholders | $ | 36,631 | |
| Acquisition-related deferred consideration | 10,098 | ||
| Total acquisition-date fair value | $ | 46,729 | |
A liability was recognized for the acquisition date fair value of the
acquisition-related consideration for the deferred fixed purchase price, and the
estimated earnout payments and working capital adjustments. Any change in the
fair value of the acquisition-related consideration subsequent to the
acquisition date, including changes from events after the acquisition date, such
as changes in our estimate of the meeting of performance goals, will be
recognized in earnings in the period the estimated fair value changes. The fair
value estimate is based on the probability weighted bookings to be achieved over
the earnout period. A change in fair value of the acquisition-related
consideration could have a material effect on the statement of operations and
financial position in the period of the change in estimate.
Allocation of Consideration
Transferred
The identifiable assets acquired and liabilities assumed in the eventIS
acquisition were recognized and measured as of the acquisition date, September
1, 2009, based on their estimated fair values. The excess of the acquisition
date fair value of consideration transferred over the estimated fair value of
the net tangible assets and intangible assets acquired was recorded as
goodwill.
The following table summarizes the estimated fair values of the assets
acquired and liabilities assumed at the eventIS acquisition date.
| (in thousands) | ||||
| Payment of cash to eventIS shareholders | $ | 36,631 | ||
| Acquisition-related deferred consideration | 10,098 | |||
| Total acquisition-date fair value | $ | 46,729 | ||
| (in thousands) | ||||
| Cash and cash equivalents | $ | 4,374 | ||
| Accounts receivable | 4,237 | |||
| Inventory | 98 | |||
| Other tangible assets | 695 | |||
| Intangible assets | 23,833 | |||
| Total identifiable assets acquired | 33,237 | |||
| Accounts payable and other liabilities | (2,069 | ) | ||
| Deferred taxes | (4,495 | ) | ||
| Deferred revenue | (6,207 | ) | ||
| Total liabilities assumed | (12,771 | ) | ||
| Goodwill | 26,263 | |||
| Net assets acquired | $ | 46,729 | ||
84
Intangible
Assets
The Company engaged a third-party valuation firm to assist in the
determination of the fair value of the eventIS intangible assets. In determining
the fair value of the intangible assets, the Company considered, among other
factors, the intended use of acquired assets, analyses of historical financial
performance and estimates of future performance of eventIS’s products. The fair
values of identified intangible assets were calculated using an income approach
based on estimates and assumptions provided by eventIS’s and the Company’s
management. The rates utilized to discount net cash flows to their present
values were based on a weighted average cost of capital of 17%. This discount
rate was determined after consideration of the rate of return on debt capital
and equity that typical investors would require in an investment in companies
similar in size and operating in similar markets as eventIS. The following table
sets forth the components of identified intangible assets associated with the
eventIS acquisition and their estimated useful lives:
| Useful life | Fair Value | ||||
| (in thousands) | |||||
| Existing technology | 3-9 years | $ | 6,748 | ||
| In process research and development | indefinite | 574 | |||
| Non-compete agreements | 3 years | 2,153 | |||
| Customer contracts | 10 years | 13,927 | |||
| Trademarks | 4 years | 431 | |||
| Total intangible assets | $ | 23,833 | |||
SeaChange determined the useful life of intangible assets based on the
expected future cash flows associated with the respective asset. Existing
technology is comprised of products that have reached technological feasibility
and are part of eventIS’s product line. In-process research and development
assets as of the acquisition date of $574,000 were recorded as indefinite-lived
intangible assets and will be subject to impairment testing at least annually.
The useful life of the intangible asset recognized will be reconsidered if and
when in-process research and development projects are completed or abandoned.
Customer contracts represent the underlying relationships and agreements with
eventIS’s installed customer base. Trademarks represent the fair value of the
brand and name recognition associated with the marketing of eventIS’s products
and services. Non-compete agreements represent the fair value of the non-compete
with the former shareholders and key employees and will be amortized over the
term of the agreement. Amortization of existing technology is included in cost
of product revenue, and amortization expense for customer relationships and
trademarks is included in operating expenses.
Goodwill
Of the total eventIS purchase price of $46.7 million, $26.3 million was
allocated to goodwill. Goodwill represents the excess of the purchase price of
an acquired business over the fair value of the underlying net tangible and
intangible assets. SeaChange determined that the goodwill included the value of
the eventIS work force and expected synergies in global sales and marketing,
especially within the European market, and in the deployment of VOD systems.
SeaChange considers the acquired business an addition to the Company’s Software
reporting segment. The Company made this determination based upon the financial
information provided and reviewed by our Chief Executive Officer (the chief
operating decision maker) and the similar economic characteristics to our other
products in our Software segment. None of the goodwill associated with the
eventIS acquisition is deductible for income tax purposes.
Deferred Revenue
In connection with the allocation of consideration transferred, SeaChange
recorded the fair value of the customer contract obligations assumed from
eventIS. The fair value of the customer contract obligations was determined
using a cost build-up approach. The cost build-up approach determines fair value
by estimating the costs relating to fulfilling the obligations plus a normal
profit margin. The sum of the costs and operating profit approximates, in
theory, the amount that SeaChange would be required to pay a third party to
assume the service obligations. The costs to fulfill the service obligations
were based on the historical direct costs and indirect costs related to
eventIS’s contracts with its customers. Direct costs include personnel directly
engaged in providing service and support activities, while indirect costs
consist of estimated general and administrative expenses based on normalized
levels as a percentage of revenue. Profit associated with selling efforts was
excluded because eventIS had concluded the selling efforts on the service
contracts prior to the date of the Company’s acquisition. The research and
development costs associated with the customer contracts has been included in
the fair value determination, as these costs were deemed to represent a legal
obligation to the customers at the time of acquisition. SeaChange recorded $6.2
million of deferred revenue to reflect the fair value of eventIS’s service
obligations assumed.
85
Acquisition-related Costs
Acquisition-related costs recognized
for the twelve months ended January 31, 2010 include transaction costs.
SeaChange recorded transaction costs such as legal, accounting, valuation and
other professional services of $1.0 million for the twelve months ended January
31, 2010. The transaction costs were expensed and recorded in general and
administrative expenses in the Consolidated Statement of Operations. During the
fiscal year 2010, the Company recorded a charge of $110,000 which is included as
interest expense in the Consolidated Statement of Operations for the change in
fair value of the deferred fixed purchase price.
7. Goodwill and Intangible
Assets
At January 31, 2010 and 2009, the
Company had goodwill of $55.9 million and $27.4 million, respectively. The
change in the carrying amount of goodwill for the years ended January 31, 2010
and 2009 are as follows:
| Broadband | Services | Servers & | Media | |||||||||||||||||||||
| Segment | Segment | Software | Storage | Services | Total | |||||||||||||||||||
| (in thousands) | ||||||||||||||||||||||||
| Balance at January 31, 2008 | $ | 11,169 | $ | 18,302 | $ | - | $ | - | $ | - | $ | 29,471 | ||||||||||||
| Reallocation | (11,169 | ) | (18,302 | ) | 10,398 | 771 | 18,302 | $ | - | |||||||||||||||
| Mobix acquisition | - | - | - | - | 3,348 | 3,348 | ||||||||||||||||||
| Realized deferred tax asset (Note 14) | - | - | (236 | ) | (17 | ) | - | (253 | ) | |||||||||||||||
| Cumulative translation adjustment | - | - | - | - | (5,144 | ) | (5,144 | ) | ||||||||||||||||
| Balance at January 31, 2009 | - | - | 10,162 | 754 | 16,506 | 27,422 | ||||||||||||||||||
| Mobix consideration payments | - | - | - | - | 2,478 | 2,478 | ||||||||||||||||||
| Revaluation of Mobix intangibles | - | - | - | - | (1,387 | ) | (1,387 | ) | ||||||||||||||||
| eventIS acquisition | - | - | 26,263 | - | - | 26,263 | ||||||||||||||||||
| Cumulative translation adjustment | - | - | (889 | ) | - | 1,989 | 1,100 | |||||||||||||||||
| Balance at January 31, 2010 | $ | - | $ | - | $ | 35,536 | $ | 754 | $ | 19,586 | $ | 55,876 | ||||||||||||
The goodwill reallocation shown in
the table above relates to the reorganization of the Company’s reportable
segments finalized in the first quarter of fiscal 2009. The goodwill formerly
included in the Broadband and Services segments was allocated between the
Software, Servers and Storage and Media Services segments based on a relative
fair value approach using management estimates of fair value of the segments. No
impairment was recorded as a result of the change in segments. As of August 1,
2009, SeaChange reviewed the recoverability of goodwill associated with its
three reporting units, Software, Servers and Storage and Media Services, and
determined that there was no goodwill impairment.
At January 31, 2010 and 2009, the
Company had recorded net intangible assets of $26.3 million and $4.6 million
respectively, consisting of patents, customer contracts, non-compete agreements,
completed technology, in-process research and development and
trademarks.
86
Intangible assets, net, consisted of
the following:
| Non-compete | Completed | In-process | Trademark | ||||||||||||||||||||
| Intangible Assets | Customer Contracts | Agreements | Technology | R & D | and Other | Total | |||||||||||||||||
| Balance as of January 31, 2009 | $ | 13,945 | $ | - | $ | 2,867 | $ | - | $ | 948 | $ | 17,760 | |||||||||||
| eventIS intangible | 13,927 | 2,154 | 6,747 | 574 | 431 | 23,833 | |||||||||||||||||
| Mobix intangible | 1,043 | 380 | 431 | - | - | 1,854 | |||||||||||||||||
| Cumulative translation adjustment | (272 | ) | (47 | ) | (141 | ) | (20 | ) | 12 | (468 | ) | ||||||||||||
| Balance as of January 31, 2010 | $ | 28,643 | $ | 2,487 | $ | 9,904 | $ | 554 | $ | 1,391 | $ | 42,979 | |||||||||||
| Non-compete | Completed | In-process | Trademark | ||||||||||||||||||||
| Accumulated Amortization | Customer Contracts | Agreements | Technology | R & D | and Other | Total | |||||||||||||||||
| Balance as of January 31, 2009 | $ | 9,689 | $ | - | $ | 2,593 | $ | - | $ | 857 | $ | 13,139 | |||||||||||
| Current period amortization | 2,221 | 308 | 626 | - | 309 | 3,464 | |||||||||||||||||
| Cumulative translation adjustment | 74 | (18 | ) | 31 | - | 25 | 112 | ||||||||||||||||
| Balance as of January 31, 2010 | $ | 11,984 | $ | 290 | $ | 3,250 | $ | - | $ | 1,191 | $ | 16,715 | |||||||||||
| Intangible Assets, net, as of January 31, 2010 | $ | 16,659 | $ | 2,197 | $ | 6,654 | $ | 554 | $ | 200 | $ | 26,264 | |||||||||||
Estimated useful lives and the
amortization basis for the intangible assets are as follows:
| Estimated Useful Life and Amortization Basis | ||
| Customer contracts | 1 - 8 years using economic consumption life basis | |
| Non compete agreements | 2 - 3 years economic life of the agreement | |
| Completed technology | 4 - 6 years using economic consumption life basis | |
| In-process R & D | indefinite life | |
| Trademarks and other | 5 years using economic consumption life basis |
Amortization expense for intangible
assets was $3.5 million, $2.0 million and $3.4 million for the years ended
January 31, 2010, 2009 and 2008, respectively. In the years ended January 31,
2010, 2009 and 2008, $638,000, $450,000, and $490,000, respectively, were
charged to cost of product revenues. In the years ended January 31, 2010, 2009
and 2008, $2.8 million, $1.6 million and $3.0 million, respectively, were
charged to operating expense. The total amortization expense for each of the
next five fiscal years is as follows.
| Amortization | |||
| Expense | |||
| (in thousands) | |||
| Fiscal 2011 | $ | 4,349 | |
| Fiscal 2012 | 4,269 | ||
| Fiscal 2013 | 4,146 | ||
| Fiscal 2014 | 3,135 | ||
| Fiscal 2015 and therafter | 9,811 | ||
| Total Future Amortization | $ | 25,710 | |
Actual amounts may change from such
estimated amounts due to fluctuations in foreign currency exchange rates,
additional intangible asset acquisitions, potential impairment, accelerated
amortization, or other events.
8. Lines of
Credit
The Company maintains a revolving
line of credit with RBS Citizens (a subsidiary of the Royal Bank of Scotland
Group plc) for $15.0 million which expires on October 31, 2010. Loans made under
this revolving line of credit bear interest at a rate per annum equal to the
bank’s prime rate. Borrowings under this line of credit are collateralized by
substantially all of our assets. The loan agreement requires SeaChange to comply
with certain financial covenants. On August 31, 2009, these financial covenants
were amended to reflect the acquisition of eventIS. As of January 31, 2010, we
were in compliance with the financial covenants and there were no amounts
outstanding under the revolving line of credit.
87
We are occasionally required to post letters of credit, issued by a
financial institution, to secure certain sales contracts. Letters of credit
generally authorize the financial institution to make a payment to the
beneficiary upon the satisfaction of a certain event or the failure to satisfy
an obligation. The letters of credit are generally posted for one-year terms and
are usually automatically renewed upon maturity until such time as we have
satisfied the commitment secured by the letter of credit. We are obligated to
reimburse the issuer only if the beneficiary collects on the letter of credit.
We believe that it is unlikely we will be required to fund a claim under our
outstanding letters of credit. As of January 31, 2010 the full amount of the
letters of credit of $704,000 was supported by our credit facility.
9. Commitments and
Contingencies
SeaChange leases certain of its operating facilities, automobiles and
office equipment under non-cancelable operating leases, which expire at various
dates through 2015. Rental expense under operating leases was $2.6 million, $3.7
million and $3.1 million for the years ended January 31, 2010, 2009 and 2008,
respectively. Future commitments under minimum lease payments as of January 31,
2010 are as follows:
| Operating | ||
| Leases | ||
| (in thousands) | ||
| Fiscal Year ended January 31, 2011 | $ | 2,763 |
| 2012 | 2,125 | |
| 2013 | 615 | |
| 2014 | 51 | |
| 2015 | 9 | |
| Minimum lease payments | $ | 5,563 |
SeaChange has non-cancelable purchase commitments for its inventories of
approximately $6.6 million at January 31, 2010.
ARRIS Litigation
On July 31, 2009, Arris Corporation
(“Arris”) filed a contempt motion in the U.S. District Court for the District of
Delaware against SeaChange International relating to U.S. Patent No 5,805,804
(the “804 patent”), a patent owned by Arris. In its motion, Arris is seeking
further patent royalties and the enforcement of the permanent injunction entered
by the Court on April 6, 2006 against certain SeaChange products. On August 3,
2009, SeaChange filed a complaint seeking a declaratory judgment from the Court
that its products do not infringe the ‘804 patent and asserting certain
equitable defenses. SeaChange also filed a motion to consolidate the Arris
contempt motion with the declaratory judgment action and requested a status
conference on SeaChange’s declaratory judgment action. On August 25, 2009, Arris filed 1) an answer
to SeaChange’s complaint that included a counterclaim of patent infringement
under the ‘804 patent; and 2) a motion to stay the declaratory judgment action
until the resolution of the contempt motion. On January 13, 2010 the parties
filed proposed scheduling orders for SeaChange's declaratory judgment action.
The Court has not yet entered a schedule in either action. SeaChange believes
that Arris’ contempt motion is without merit, and that SeaChange products do not
infringe the remaining claims under the ‘804 patent.
88
Guarantees, Indemnification and
Warranties
SeaChange provides indemnification, to the extent permitted by law, to
its officers, directors, employees and agents for liabilities arising from
certain events or occurrences while the officer, director, employee, or agent is
or was serving at SeaChange’s request in such capacity. With respect to
acquisitions, SeaChange provides indemnification to or assumes indemnification
obligations for the current and former directors, officers and employees of the
acquired companies in accordance with the acquired companies’ bylaws and
charter. As a matter of practice, SeaChange has maintained directors’ and
officers’ liability insurance including coverage for directors and officers of
acquired companies.
SeaChange enters into agreements in the ordinary course of business with
customers, resellers, distributors, integrators and suppliers. Most of these
agreements require SeaChange to defend and/or indemnify the other party against
intellectual property infringement claims brought by a third party with respect
to SeaChange’s products. From time to time, SeaChange also indemnifies customers
and business partners for damages, losses and liabilities they may suffer or
incur relating to personal injury, personal property damage, product liability,
and environmental claims relating to the use of SeaChange’s products and
services or resulting from the acts or omissions of SeaChange, its employees,
authorized agents or subcontractors. For example, SeaChange has received
requests from several of its customers for indemnification of patent litigation
claims asserted by Acacia Media Technologies, USA Video Technology Corporation
and VTran Media Technologies. Management performed an analysis of these requests
under authoritative guidance regarding accounting for
contingencies.
SeaChange warrants that its products, including software products, will
substantially perform in accordance with its standard published specifications
in effect at the time of delivery. Most warranties have at least a one year
duration that generally commence upon installation. In addition, SeaChange
provides maintenance support to its customers and therefore allocates a portion
of the product purchase price to the initial warranty period and recognizes
revenue on a straight line basis over that warranty period related to both the
warranty obligation and the maintenance support agreement. When SeaChange
receives revenue for extended warranties beyond the standard duration, it is
deferred and recognized on a straight line basis over the contract period.
Related costs are expensed as incurred.
In the ordinary course of business, SeaChange provides minimum purchase
guarantees to certain of its vendors to ensure continuity of supply against the
market demand. Although some of these guarantees provide penalties for
cancellations and/or modifications to the purchase commitments as the market
demand decreases, most of the guarantees do not. Therefore, as the market demand
decreases, SeaChange re-evaluates the accounting implications of guarantees and
determines what charges, if any, should be recorded.
With respect to its agreements covering product, business or entity
divestitures and acquisitions, SeaChange provides certain representations and
warranties and agrees to indemnify and hold such purchasers harmless against
breaches of such representations, warranties and covenants. With respect to its
acquisitions, SeaChange may, from time to time, assume the liability for certain
events or occurrences that took place prior to the date of
acquisition.
SeaChange provides such guarantees and indemnification obligations after
considering the economics of the transaction and other factors including but not
limited to the liquidity and credit risk of the other party in the transaction.
SeaChange believes that the likelihood is remote that any such arrangement could
have a material adverse effect on its financial position, results of operation
or liquidity. SeaChange records liabilities, as disclosed above, for such
guarantees based on the Company’s best estimate of probable losses which
considers amounts recoverable under any recourse provisions.
10. Stockholders’
Equity
Stock
Authorization
The Board of Directors is authorized to issue from time to time up to an
aggregate of 5,000,000 shares of preferred stock, in one or more series. Each
such series of preferred stock shall have the number of shares, designations,
preferences, voting powers, qualifications and special or relative rights or
privileges to be determined by the Board of Directors, including dividend
rights, voting rights, redemption rights and sinking fund provisions,
liquidation preferences, conversion rights and preemptive rights.
89
Stock Repurchase
Program
On February 13, 2008, the Board of Directors authorized the repurchase of
up to $20.0 million of its common stock, par value $0.01 per share, through a
share repurchase program which expired on December 31, 2008. During fiscal 2009,
833,597 shares of our common stock had been purchased as part of this repurchase
program at an average price of $7.16.
On March 11, 2009, the Board of Directors authorized the repurchase of up
to $20 million of its common stock through a share repurchase program, which
expired on January 31, 2010. During fiscal 2010, 473,415 shares of our common
stock were purchased for $2.8 million at an average price of $5.85 as part of
this repurchase program.
11. Segment
Information
Until the end of fiscal 2008, the Company was managed and operated as
three segments, Broadcast, Broadband and Services. In its first quarter of
fiscal 2009, the Company realigned its previously reported segments into three
new reporting segments: Software, Servers and Storage, and Media Services, as
segments defined by authoritative guidance. The Company believes this
reorganization better reflects the increasing importance and magnitude of its
software products and services as well as the scale of its ODG subsidiary. A
description of the three new reporting segments is as follows:
- Software segment includes product
revenues from the Company’s Advertising, VOD, Middleware and Broadcast
software, related services such as professional services, installation,
training, project management, product maintenance, technical support and
software development for those software products, and operating expenses
relating to the Software segment such as research and development, selling and
marketing and amortization of intangibles. The Software segment includes the
results of eventIS Group B.V. from the date of the acquisition on September 1,
2009.
- Servers and Storage segment
includes product revenues from the VOD and Broadcast server product lines and
related services such as professional services, installation, training,
project management, product maintenance, and technical support for those
products and operating expenses relating to the Servers and Storage segment,
such as research and development and selling and marketing.
- Media Services segment includes the operations of ODG, including Mobix Interactive, activities which include content acquisition and preparation services for television and wireless service providers and related operating expenses.
Under this revised reporting structure, the Company further determined
that there are significant functions, and therefore costs considered corporate
expenses and are not allocated to the reportable segments for the purposes of
assessing performance and making operating decisions. These unallocated costs
include general and administrative expenses, other than general and
administrative expenses related to Media Services, interest and other income,
net, taxes and equity losses in affiliates, which are managed separately at the
corporate level.
The segment data for the fiscal years ended January 31, 2008 has been
recast to reflect the realignment of the new segments. Prior to fiscal 2009,
services revenues, which included ODG revenues, were reported in the Services
segment and the Company did not separately track these service revenues and
costs by these new segments, except for ODG. Accordingly, management has made
certain assumptions to determine the amount of service revenues and service
costs attributed to the Software and Servers and Storage reporting segments for
the fiscal year January 31, 2008. The basis of the assumptions for all such
revenues, costs and expenses includes significant judgments and estimations.
There are no inter-segment revenues for the periods shown below. The Company
does not separately track all assets by operating segments nor are the segments
evaluated under this criterion.
90
The following summarizes the income
(loss) from operations by reportable operating segment:
| Year ended January 31, | |||||||||||
| 2010 | 2009 | 2008 | |||||||||
| (inthousands) | |||||||||||
| Software | |||||||||||
| Revenue: | |||||||||||
| Products | $ | 66,968 | $ | 78,397 | $ | 69,762 | |||||
| Services | 64,346 | 53,840 | 43,507 | ||||||||
| Total revenue | 131,314 | 132,237 | 113,269 | ||||||||
| Gross profit | 79,543 | 76,087 | 58,238 | ||||||||
| Operating expenses: | |||||||||||
| Research and development | 39,592 | 33,373 | 31,035 | ||||||||
| Selling and marketing | 16,624 | 16,417 | 13,259 | ||||||||
| General and administrative | 480 | - | - | ||||||||
| Amortization of intangibles | 2,268 | 1,456 | 2,146 | ||||||||
| Total operating expenses | 58,964 | 51,246 | 46,440 | ||||||||
| Income from operations | $ | 20,579 | $ | 24,841 | $ | 11,798 | |||||
| Servers and Storage | |||||||||||
| Revenue: | |||||||||||
| Products | $ | 34,974 | $ | 38,975 | $ | 36,007 | |||||
| Services | 15,583 | 14,665 | 12,990 | ||||||||
| Total revenue | 50,557 | 53,640 | 48,997 | ||||||||
| Gross profit | 20,426 | 24,865 | 19,730 | ||||||||
| Operating expenses: | |||||||||||
| Research and development | 11,072 | 9,669 | 11,664 | ||||||||
| Selling and marketing | 9,218 | 11,025 | 9,703 | ||||||||
| Total operating expenses | 20,290 | 20,694 | 21,367 | ||||||||
| Income (loss) from operations | $ | 136 | $ | 4,171 | $ | (1,637 | ) | ||||
| Media Services | |||||||||||
| Service revenue | $ | 19,794 | $ | 15,959 | $ | 17,627 | |||||
| Gross profit | 3,284 | 2,344 | 2,996 | ||||||||
| Operating expenses: | |||||||||||
| Selling and marketing | - | 64 | 111 | ||||||||
| General and administrative | 2,918 | 3,049 | 2,449 | ||||||||
| Amortization of intangibles | 677 | 119 | 806 | ||||||||
| Total operating expenses | 3,595 | 3,232 | 3,366 | ||||||||
| Loss from operations | $ | (311 | ) | $ | (888 | ) | $ | (370 | ) | ||
| Unallocated Corporate | |||||||||||
| Operating expenses: | |||||||||||
| General and administrative | $ | 18,202 | $ | 17,930 | $ | 17,791 | |||||
| Total unallocated corporate expenses | $ | 18,202 | $ | 17,930 | $ | 17,791 | |||||
| Consolidated income (loss) from operations | $ | 2,202 | $ | 10,194 | $ | (8,000 | ) | ||||
91
The following summarizes
revenues by customers’ geographic locations. Certain reclassifications have been
made to conform prior period amounts to current period presentation, including
the reclassification of revenue originated in Canada from Latin American to
North American revenue:
| Year ended January 31, | |||||||||||||||||
| 2010 | 2009 | 2008 | |||||||||||||||
| Amount | % | Amount | % | Amount | % | ||||||||||||
| (in thousands, except percentages) | |||||||||||||||||
| Revenues by customers' geographic locations: | |||||||||||||||||
| North America | $ | 133,947 | 66 | % | $ | 139,457 | 69 | % | $ | 118,970 | 66 | % | |||||
| Europe and Middle East | 45,787 | 23 | % | 44,059 | 22 | % | 40,767 | 23 | % | ||||||||
| Asia Pacific and other international locations | 8,456 | 4 | % | 14,165 | 7 | % | 12,705 | 7 | % | ||||||||
| Latin America | 13,475 | 7 | % | 4,155 | 2 | % | 7,451 | 4 | % | ||||||||
| Total | $ | 201,665 | $ | 201,836 | $ | 179,893 | |||||||||||
Total revenues for the United States
for the years ended January 31, 2010, 2009, and 2008, were $130.1 million,
$130.2 million, and $111.8 million, respectively.
The following summarizes fixed
assets, net by geographic locations:
| Year ended January 31, | |||||||||||
| 2010 | 2009 | ||||||||||
| Amount | % | Amount | % | ||||||||
| (in thousands, except percentages) | |||||||||||
| Fixed assets, net by geographic locations: | |||||||||||
| North America | $ | 24,058 | 61 | % | $ | 24,497 | 70 | % | |||
| Europe and Middle East | 11,280 | 28 | % | 7,280 | 21 | % | |||||
| Asia Pacific and other international locations | 4,344 | 11 | % | 3,440 | 10 | % | |||||
| Total | $ | 39,682 | $ | 35,217 | |||||||
12. Stock-Based Compensation and
Stock Incentive Plans
SeaChange uses on a modified
prospective basis, the provisions of the authoritative guidance which requires
the measurement and recognition of compensation expense for all share-based
payment awards made to employees and directors including employee stock options,
restricted stock units and employee stock purchases related to the Employee
Stock Purchase Plan (“ESPP”) based on estimated fair values. The fair value of
SeaChange’s stock-based options and performance-based restricted stock units,
less expected forfeitures, is amortized over the awards’ vesting period on a
graded vesting basis, whereas the restricted stock units and Employee Stock
Purchase Plan stock units are amortized on a straight line basis. SeaChange has
applied the provisions of authoritative guidance allowing the use of a
“simplified” method, in developing an estimate of the expected term of “plain
vanilla” share options.
Stock-based compensation includes
expense charges for all stock-based awards to employees and directors. Such
awards include option grants, restricted stock unit awards, and shares expected
to be purchased under an employee stock purchase plan. The estimated fair value
of SeaChange’s stock-based options and performance-based restricted stock units,
less expected forfeitures, is amortized over the awards’ vesting period on a
graded vesting basis, whereas the restricted stock units and ESPP stock units
are amortized on a straight line basis.
92
The effect of recording stock-based
compensation was as follows:
| Year ended January 31, | ||||||||
| 2010 | 2009 | 2008 | ||||||
| (in thousands) | ||||||||
| Stock-based compensation expense by type of award: | ||||||||
| Stock options | $ | 94 | $ | 304 | $ | 1,060 | ||
| Restricted stock units | 639 | 996 | 775 | |||||
| Performance-based restricted stock units | 1,628 | 2,061 | 1,557 | |||||
| Employee stock purchase plan | 744 | 593 | 586 | |||||
| Total stock-based compensation | $ | 3,105 | $ | 3,954 | $ | 3,978 | ||
Since additional option grants and
restricted stock unit awards are expected to be made each year and options and
awards vest over several years, the effects of applying authoritative guidance
for recording stock-based compensation for the year ended January 31, 2010 are
not indicative of future amounts.
Determining Fair
Value
SeaChange records the fair value of
stock options, including rights granted under the ESPP, using the Black-Scholes
valuation model. Key input assumptions used to estimate the fair value of stock
options include the exercise price, the expected option term, the risk-free
interest rate over the option’s expected term, the expected annual dividend
yield and the expected stock price volatility. The expected option term was
determined using the “simplified” method for “plain vanilla” options. The
expected stock price volatility was established using a blended volatility,
which is an average of the historical volatility of SeaChange’s common stock
over a period of time equal to the expected term of the stock option, and the
average volatility of SeaChange’s common stock over the most recent one-year and
two-year periods.
The fair value of stock options
granted was estimated at the date of grant using the following
assumptions:
| Year ended January 31, | |||||
| 2010 | 2009 | 2008 | |||
| Expected term (in years) | 4-5 | 4-5 | 4-5 | ||
| Expected volatility (range) | 61% | 52%-56% | 46%-50% | ||
| Weighted average volatility | 61% | 52% | 48% | ||
| Risk-free interest rate | 1.2% | 2.6%-2.9% | 3.2%-5.1% | ||
| Weighted average interest rate | 1.2% | 2.9% | 4.6% | ||
| Expected dividend yield | 0% | 0% | 0% | ||
The fair value of ESPP stock granted
was estimated at the date of grant using following assumptions:
| Year ended January 31, | |||||
| 2010 | 2009 | 2008 | |||
| Expected term (in years) | 0.5 | 0.5 | 0.5 | ||
| Weighted average volatility | 71% | 61% | 42% | ||
| Weighted average interest rate | 0.3% | 2.8% | 4.6% | ||
| Expected dividend yield | 0% | 0% | 0% | ||
Stock Option
Plans
Amended and Restated 2005 Equity
Compensation and Incentive Plan
The Amended and Restated 2005 Equity
Compensation and Incentive Plan (the “2005 Plan”) provides for the grant of
incentive stock options, nonqualified stock options, restricted stock,
restricted stock units, and “other” non-stock option awards as determined by the
plan administrator for the purchase of up to an aggregate of 2,800,000 shares of
SeaChange’s common stock by officers, employees, consultants and directors of
SeaChange. The Company may satisfy awards upon the exercise of stock options or
restricted stock units with either newly issued shares. The Board of Directors
is responsible for administration of the 2005 Plan and determining the term of
each award, award exercise price, number of shares for which each award is
granted and the rate at which each award is exercisable. As of January 31, 2010,
there were 2,202,596 shares available for future grant. The Company has made an
undertaking not to issue an amount of awards under the 2005 Plan greater than
two percent of the aggregate shares outstanding per fiscal year.
93
Option awards may be granted to
employees at an exercise price per share of not less than 100% of the fair
market value per common share on the date of the grant (not less than 110% for
an incentive stock option granted to a 10% or more stockholder). Incentive stock
options may be granted only to those employees of SeaChange to the extent that
the fair value of the options granted that become exercisable during any one
calendar year plus previously granted incentive stock options that become
exercisable in that period is less than $100,000. Restricted stock units and
other equity-based non-stock option awards may be granted to any officer,
employee, director or consultant at a purchase price per share as determined by
the Board of Directors. Awards granted under the 2005 Plan generally vest over
three years and expire seven years from the date of the grant (five years for
incentive stock options granted to holders of more than 10% of SeaChange’s
voting stock).
1995 Stock Option
Plan
In July 2005, SeaChange’s Board of
Directors terminated the 1995 Stock Option Plan and began granting stock options
under the Company’s 2005 Plan. The Amended and Restated 1995 Stock Option Plan
(the “1995 Stock Option Plan”) provided for the grant of incentive stock options
and nonqualified stock options. The Board of Directors is responsible for
administration of the 1995 Stock Option Plan and determining the term of each
option, option exercise price, number of shares for which each option is granted
and the rate at which each option is exercisable. Options generally vest ratably
over four years. SeaChange may not grant an employee incentive stock options
with a fair value in excess of $100,000 that are initially exercisable during
any one calendar year. Options granted under the 1995 Stock Option Plan
generally expire ten years from the date of the grant (five years for incentive
stock options granted to holders of more than 10% of SeaChange’s voting
stock).
Director Option
Plan
In May 2002, SeaChange’s Board of
Directors terminated the SeaChange International, Inc. 1996 Non-Employee
Director Stock Option Plan (the “Director Option Plan”) and began granting stock
options to the Board of Directors under the Company’s 1995 Stock Option Plan. In
June 1996, the Board of Directors adopted and the stockholders approved the
Director Option Plan which provided for the grant of options to full time
directors of SeaChange.
The following table summarizes the
stock option activity (excluding restricted stock units:
| Year ended January 31, | |||||||||||||||||
| 2010 | 2009 | 2008 | |||||||||||||||
| Weighted | Weighted | Weighted | |||||||||||||||
| average | average | average | |||||||||||||||
| exercise | exercise | exercise | |||||||||||||||
| Shares | price | Shares | price | Shares | price | ||||||||||||
| Outstanding at beginning of period | 4,228,237 | $ | 15.43 | 4,884,205 | $ | 14.99 | 5,936,735 | $ | 14.85 | ||||||||
| Granted | 60,000 | 6.23 | 13,500 | 8.71 | 41,550 | 8.81 | |||||||||||
| Exercised | (47,805 | ) | 6.79 | (223,006 | ) | 5.29 | (189,623 | ) | 5.91 | ||||||||
| Forfeited/expired/cancelled | (305,459 | ) | 15.38 | (446,462 | ) | 15.51 | (904,457 | ) | 15.65 | ||||||||
| Outstanding at end of period | 3,934,973 | $ | 15.41 | 4,228,237 | $ | 15.43 | 4,884,205 | $ | 14.99 | ||||||||
| Options exercisable at end of period | 3,865,221 | $ | 15.56 | 4,169,492 | $ | 15.53 | 4,577,138 | $ | 15.49 | ||||||||
| Weighted average remaining | |||||||||||||||||
| contractual term (in years) | 3.38 | 4.06 | 4.78 | ||||||||||||||
94
The weighted-average fair valuation
at grant date of stock options granted during the years ended January 31, 2010,
2009 and 2008, was $3.21, $3.52 and $3.89, respectively. As of January 31, 2010,
the unrecognized stock-based compensation related to the unvested stock options
was $82,000 net of estimated forfeitures. Total unrecognized compensation cost
will be adjusted for any future changes in estimated changes in forfeitures.
This cost will be recognized over an estimated weighted average amortization
period of eleven months.
The total intrinsic value of options
exercised during the years ended January 31, 2010, 2009 and 2008 was
approximately $60,000, $576,000 and $299,000, respectively, with intrinsic value
defined as the difference between the market price on the date of exercise and
the grant date price.
The cash received from employees as
a result of employee stock options exercises during fiscal years 2010, 2009 and
2008 was $324,000, $1.2 million, and $1.1 million, respectively.
The following table summarizes
information about employee and director stock options outstanding and
exercisable as of January 31, 2010:
| Options Outstanding | Options Exercisable | ||||||||||
| Weighted | |||||||||||
| average | |||||||||||
| remaining | Weighted | Weighted | |||||||||
| contractual | average | average | |||||||||
| Number | terms | exercise | Number | exercise | |||||||
| outstanding | (years) | price | exercisable | price | |||||||
| Range of exercise prices | |||||||||||
| $5.85 to 6.88 | 623,810 | 3.13 | $ | 6.49 | 563,810 | $ | 6.52 | ||||
| 6.93 to 9.19 | 432,819 | 3.58 | 7.74 | 423,067 | 7.73 | ||||||
| 9.96 to 12.21 | 522,786 | 3.45 | 11.19 | 522,786 | 11.20 | ||||||
| 12.42 to 13.76 | 467,973 | 3.44 | 13.56 | 467,973 | 13.56 | ||||||
| 14.12 to 15.59 | 406,622 | 3.44 | 15.02 | 406,622 | 15.02 | ||||||
| 15.62 to 17.39 | 413,273 | 3.44 | 16.54 | 413,273 | 16.55 | ||||||
| 17.56 to 22.00 | 120,682 | 3.31 | 19.22 | 120,862 | 19.22 | ||||||
| 23.31 to 23.31 | 418,326 | 3.24 | 23.31 | 418,326 | 23.31 | ||||||
| 24.10 to 34.00 | 474,952 | 3.44 | 29.43 | 474,952 | 29.43 | ||||||
| 35.50 to 39.13 | 53,550 | 3.44 | 37.35 | 53,550 | 37.35 | ||||||
| 3,934,793 | 3.38 | $ | 15.40 | 3,865,221 | $ | 15.56 | |||||
Restricted Stock
Units
Pursuant to the 2005 Plan, SeaChange
may grant restricted stock units that entitle the recipient to acquire shares of
SeaChange’s common stock. Awards of restricted stock units vest in equal
increments on each of the first three anniversaries of the grant of the award.
Stock-based compensation expense associated with the restricted stock units is
charged for the market value of the Company’s stock on the date of grant,
assuming nominal forfeitures, and is amortized over the awards’ vesting period
on a straight-line basis for awards with only a service condition and graded
vesting basis for awards that include both a performance and service
condition.
95
The following table summarizes
the restricted stock unit activity:
| Year ended January 31, | |||||||||||||||||
| 2010 | 2009 | 2008 | |||||||||||||||
| Weighted | Weighted | Weighted | |||||||||||||||
| average | average | average | |||||||||||||||
| grant date | grant date | grant date | |||||||||||||||
| Shares | fair value | Shares | fair value | Shares | fair value | ||||||||||||
| Nonvested at beginning of period | 458,674 | $ | 8.99 | 230,508 | $ | 8.99 | 240,676 | $ | 8.61 | ||||||||
| Awarded | 523,346 | 6.45 | 519,814 | 7.30 | 129,214 | 8.27 | |||||||||||
| Vested | (409,531 | ) | 7.22 | (287,648 | ) | 6.40 | (124,050 | ) | 7.70 | ||||||||
| Forfeited/expired/cancelled | - | - | (4,000 | ) | 6.93 | (15,332 | ) | 7.32 | |||||||||
| Nonvested at end of period | 572,489 | $ | 7.94 | 458,674 | $ | 8.72 | 230,508 | $ | 8.99 | ||||||||
As of January 31, 2010 the
unrecognized stock-based compensation related to the unvested restricted stock
units was $2.0 million. This cost will be recognized over an estimated weighted
average amortization period of 1.6 years.
Employee Stock Purchase
Plan
In September 1996, SeaChange’s Board
of Directors adopted and the stockholders approved an employee stock purchase
plan (the “ESPP”), effective January 1, 1997 as amended July 16, 2008, which
provides for the issuance of a maximum of 2.2 million shares of common stock to
participating employees who meet eligibility requirements. Employees who would
immediately after the purchase own 5% or more of the total combined voting power
or value of SeaChange’s stock and directors who are not employees of SeaChange
may not participate in the ESPP. The purchase price of the stock is 85% of the
lesser of the average market price of the common stock on the first or last
business day of each six-month plan period. During the fiscal years ended
January 31, 2010, 2009 and 2008, 282,889, 236,707 and 236,553 shares of common
stock, respectively, were issued under the Stock Purchase Plan. The cash
received from employees as a result of the ESPP during fiscal 2010, 2009 and
2008 was $1.5 million, $1.6 million, and $1.6 million, respectively. As of
January 31, 2010, there were 205,555 shares available for future
grant.
13. Income Taxes
The components of income (loss)
before income taxes are as follows:
| Year ended January 31, | ||||||||||
| 2010 | 2009 | 2008 | ||||||||
| (in thousands) | ||||||||||
| Domestic | $ | (2,719 | ) | $ | 2,840 | $ | (13,191 | ) | ||
| Foreign | 5,066 | 8,479 | 17,106 | |||||||
| $ | 2,347 | $ | 11,319 | $ | 3,915 | |||||
96
The components of the income tax
(expense) benefit are as follows:
| Year ended January 31, | ||||||||||||
| 2010 | 2009 | 2008 | ||||||||||
| (in thousands) | ||||||||||||
| Current: | ||||||||||||
| Federal | $ | (271 | ) | $ | 296 | $ | (192 | ) | ||||
| State | 32 | (80 | ) | - | ||||||||
| Foreign | (1,214 | ) | (915 | ) | (2,985 | ) | ||||||
| (1,453 | ) | (699 | ) | (3,177 | ) | |||||||
| Deferred: | ||||||||||||
| Foreign | 1,082 | 124 | 1,021 | |||||||||
| $ | (371 | ) | $ | (575 | ) | $ | (2,156 | ) | ||||
The income tax expense computed using the federal statutory income tax
rate differs from SeaChange’s effective tax rate primarily due to the following:
| Year ended January 31, | ||||||||||||
| 2010 | 2009 | 2008 | ||||||||||
| (in thousands ) | ||||||||||||
| Statutory U.S. federal tax rate | $ | (861 | ) | $ | (3,962 | ) | $ | (1,370 | ) | |||
| State taxes, net of federal tax benefit | 29 | 52 | 147 | |||||||||
| Change in valuation allowance on U.S. net deferred tax assets | (1,157 | ) | 527 | 1,620 | ||||||||
| Non-deductible stock compensation expense | (133 | ) | (255 | ) | (465 | ) | ||||||
| Other | (126 | ) | (35 | ) | 82 | |||||||
| Gain on transfer of intangible assets | - | - | (1,055 | ) | ||||||||
| Gain on sale of FilmFlex | - | - | (4,008 | ) | ||||||||
| Current year impact of FIN 48 | (463 | ) | (529 | ) | (638 | ) | ||||||
| Research and development tax credits | 130 | 650 | 695 | |||||||||
| Foreign tax rate differential | 2,210 | 2,977 | 2,836 | |||||||||
| $ | (371 | ) | $ | (575 | ) | $ | (2,156 | ) | ||||
SeaChange’s effective tax rate was 16%, 5%, and 55% in the years ended
January 31, 2010, 2009 and 2008, respectively.
97
The components of deferred income
taxes are as follows:
| Year ended January 31, | ||||||||
| 2010 | 2009 | |||||||
| (in thousands) | ||||||||
| Deferred tax assets: | ||||||||
| Inventories | $ | 1,846 | $ | 2,202 | ||||
| Deferred revenue | 4,395 | 1,188 | ||||||
| Accrued expenses | 442 | 1,093 | ||||||
| Capitalized intangible costs | 1,034 | 1,228 | ||||||
| Stock-based compensation expense | 1,933 | 1,787 | ||||||
| Various tax credit carryforwards—federal and state | 4,297 | 3,868 | ||||||
| Net operating loss carryforwards | 3,291 | 4,332 | ||||||
| Other | 726 | 673 | ||||||
| Deferred tax assets | 17,964 | 16,371 | ||||||
| Less: Valuation allowance | (14,903 | ) | (15,692 | ) | ||||
| Net deferred tax assets | 3,061 | 679 | ||||||
| Deferred tax liabilities: | ||||||||
| Property and equipment | (314 | ) | (486 | ) | ||||
| Intangible assets | (6,144 | ) | (168 | ) | ||||
| Other | - | (146 | ) | |||||
| Deferred tax liabilities | (6,458 | ) | (800 | ) | ||||
| Total net deferred tax liabilities | $ | (3,397 | ) | $ | (121 | ) | ||
At January 31, 2010, SeaChange had federal, state and foreign net
operating loss carryforwards of $1.5 million, $17.1 million and $9.8 million
respectively, which can be used to offset future tax liabilities and expire at
various dates beginning in fiscal 2016. Utilization of these net operating loss
carryforwards may be limited pursuant to provisions of the respective local
jurisdiction. At January 31, 2010, SeaChange had federal and state research and
development credit carryforwards of approximately $2.9 million and $1.0 million,
respectively and state investment tax credit carryforwards of $259,000. The
federal credit carryforwards will expire at various dates beginning in fiscal
2011 if not utilized. Certain state credit carryforwards will expire at various
dates beginning in fiscal 2011, while certain other state credit carryforwards
may be carried forward indefinitely. Utilization of these credit carryforwards
may be limited pursuant to provisions of the respective local jurisdiction.
SeaChange also has alternative minimum tax credit carryforwards of $558,000
which is available to reduce future federal regular income taxes over an
indefinite period.
SeaChange reviews quarterly the adequacy of the valuation allowance for
deferred tax assets. The Company has evaluated the positive and negative
evidence bearing upon the realizability of its deferred tax assets and has
established a valuation allowance of approximately $14.9 million for such
assets, which are comprised principally of net operating loss carryforwards,
research and development credits, deferred revenue, inventory and stock based
compensation. If SeaChange continues to generate pre-tax income in the future,
some portion or all of the valuation allowance could be reversed and a
corresponding increase in net income would be reported in future periods. The
$3.2 million increase in net deferred tax liabilities was largely due to the
acquisition of eventIS in September 2009.
At January 31, 2010, the Company has indefinitely reinvested $35.4
million of the cumulative undistributed earnings of certain foreign
subsidiaries. Approximately $26.2 million of such earnings would be subject to
U.S. taxes if repatriated to the U.S. Through January 31, 2010, the Company has
not provided deferred income taxes on the undistributed earnings of its foreign
subsidiaries because such earnings are considered to be indefinitely reinvested
outside the U.S. Non-US income taxes are, however, provided on those foreign
subsidiaries’ undistributed earnings. Determination of the potential deferred
income tax liability on these undistributed earnings in not practicable because
such liability, if any, is dependent on circumstances existing if and when
remittance occurs.
98
For the year ended January 31, 2010, the Company recognized an additional
tax expense for unrecognized tax benefits of $521,000. None of the amounts
included in the balance of unrecognized tax benefits at January 31, 2010 of $7.0
million are related to tax positions for which it is reasonably possible that
the total amounts could significantly change during the next twelve months. The
Company recognizes accrued interest and penalties related to uncertain tax positions in income tax expense. A
reconciliation of the beginning and ending balance of the total amounts of gross
unrecognized tax benefits, excluding interest of $596,000 is as follows (in
thousands):
| Year ended January 31, | |||||||
| 2010 | 2009 | ||||||
| (in thousands) | |||||||
| Balance of gross unrecognized tax benefits, beginning of period | $ | 6,404 | $ | 5,773 | |||
| Gross amounts of increases in unrecognized tax benefits as a result of | |||||||
| tax positions taken in the current period | 521 | 752 | |||||
| Effect of currency translation | 60 | (121 | ) | ||||
| Balance of gross unrecognized tax benefits, end of period | $ | 6,985 | $ | 6,404 | |||
The Company and its subsidiaries file income tax returns in U.S. federal
jurisdiction, various state jurisdictions, and various foreign jurisdictions.
During 2006, the Company was notified by the Internal Revenue Service (“IRS”)
that they would examine our 2004 through 2007 federal tax returns. During fiscal
2010, the IRS completed its examination of the Company’s federal tax returns for
such years and the Company and the IRS agreed to certain adjustments resulting
in an additional tax credit of $7,000. The Company is no longer subject to U.S.
federal examinations before 2007. However, the taxing authorities still have the
ability to review the propriety of certain tax attributes created in closed
years if such tax attributes are utilized in an open tax year, such as our
federal research and development credit carryovers.
14. Employee Benefit Plan
SeaChange sponsors a 401(k) retirement savings plan (the “Plan”).
Participation in the Plan is available to full-time employees who meet
eligibility requirements. Eligible employees may contribute up to 25% of their
annual salary, subject to certain limitations. SeaChange matched contributions
up to 50% of the first 6% of compensation. During the fiscal years ended January
31, 2010, 2009 and 2008, SeaChange contributed $1.4 million, $802,000 and
$566,000, respectively. The Company also contributes to various retirement plans
in our international subsidiaries, of which the amounts will vary, according to
the local foreign plans specific to each location.
15. Subsequent Events
VividLogic Inc.
On February 1, 2010, the Company completed its acquisition of VividLogic,
Inc. (”VividLogic”). VividLogic, based in Fremont, California provides in-home
infrastructure software for high definition televisions, home gateways, and
set-top boxes to cable television service providers, set-top box manufacturers
and consumer electronics (CE) suppliers. The Company acquired VividLogic to
expand its in-home solutions.
At the closing, the Company made a cash payment of $12.0 million, of
which $1.2 million was deposited in escrow with respect certain indemnification
matters, plus $3.5 million based on an estimated working capital. $1.5 million
will be paid on each of May 1, 2010 and August 1, 2010, respectively, and $2
million will be paid on the one year anniversary of the closing. The final
working capital adjustment will be settled during the first quarter of fiscal
2011 absent a dispute as to the final adjustment amount. In addition, payments
of fixed deferred purchase price in the amount of $1.0 million will be paid on
each of February 1, 2011, 2012, and 2013. Under the earnout agreement, the
Company will be obligated to make additional payments based upon the operating
results of VividLogic over the three one year periods following the closing.
Acquisition-related costs incurred for the twelve months ended January 31, 2010
include transaction costs. SeaChange recorded transaction costs such as legal,
accounting, valuation and other professional services of $400,000. The
transaction costs were expensed and recorded in general and administrative
expenses in the Consolidated Statement of Operations.
99
Restructuring
During the first quarter of fiscal 2011, the Company initiated actions to
lower its cost structure as it strives to generate sustainable profitability for
next year. The first quarter will include pre-tax restructuring charges to its
income statement totaling approximately $1.7 million related to the termination
of approximately 47 employees.
17. Related Party
ReiJane Huai, a director of the Company, elected on August 28, 2009, is
the Chairman and CEO of FalconStor Software Inc, from whom the Company purchases
products used in the manufacture of SeaChange products. Product purchases from
FalconStor Software were $550,000 for the fiscal year ended January 31, 2010. As
of January 31, 2010, the Company had no liability to FalconStor Software, Inc.
18. Quarterly Results of
Operations—Unaudited
The following table sets forth certain unaudited quarterly results of
operations for the fiscal years ended January 31, 2010 and 2009. In the opinion
of management, this information has been prepared on the same basis as the
audited consolidated financial statements and all necessary adjustments,
consisting only of normal recurring adjustments, have been included in the
amounts stated below to present fairly the quarterly information when read in
conjunction with the audited consolidated financial statements and notes thereto
included elsewhere in this Annual Report on Form 10-K. The quarterly operating
results are not necessarily indicative of future results of operations.
| Three months ended | |||||||||||||||||||||||||
| April 30, | July 31, | October 31, | January 31, | April 30, | July 31, | October 31, | January 31, | ||||||||||||||||||
| 2008 | 2008 | 2008 | 2009 | 2009 | 2009 | 2009 | 2010 | ||||||||||||||||||
| Revenue | $ | 45,384 | $ | 50,705 | $ | 51,795 | $ | 53,952 | $ | 48,876 | $ | 46,507 | $ | 53,290 | $ | 52,992 | |||||||||
| Gross profit | 22,762 | 24,640 | 28,143 | 27,751 | 25,018 | 23,714 | 27,557 | 26,964 | |||||||||||||||||
| Operating expenses | 22,580 | 23,509 | 23,176 | 23,837 | 23,714 | 24,204 | 26,977 | 26,156 | |||||||||||||||||
| Net income (loss) | 343 | 1,487 | 3,367 | 4,777 | 998 | (376 | ) | 657 | 44 | ||||||||||||||||
| Earnings (loss) per | |||||||||||||||||||||||||
| share-Basic | 0.01 | 0.05 | 0.11 | 0.16 | 0.03 | (0.01 | ) | 0.02 | - | ||||||||||||||||
| Earnings (loss) per | |||||||||||||||||||||||||
| share-Diluted | 0.01 | 0.05 | 0.11 | 0.15 | 0.03 | (0.01 | ) | 0.02 | - | ||||||||||||||||
100
Schedule II
SEACHANGE INTERNATIONAL, INC.
VALUATION OF QUALIFYING ACCOUNTS AND RESERVES
SEACHANGE INTERNATIONAL, INC.
VALUATION OF QUALIFYING ACCOUNTS AND RESERVES
Years ended January 31, 2010, 2009 and
2008
| Balance at | |||||||||||||||||
| beginning of | Charged to costs | Deductions and | Other | Balance at end | |||||||||||||
| period | and expenses | write-offs | Adjustments | of period | |||||||||||||
| (in thousands) | |||||||||||||||||
| Accounts Receivable Allowance: | |||||||||||||||||
| Year ended January 31, 2010 | $ | 853 | $ | 75 | $ | (76 | ) | $ | - | $ | 852 | ||||||
| Year ended January 31, 2009 | 663 | 670 | (480 | ) | - | 853 | |||||||||||
| Year ended January 31, 2008 | 466 | 486 | (224 | ) | (65 | ) | 663 | ||||||||||
| Balance at | |||||||||||||||||
| beginning of | Balance at end | ||||||||||||||||
| period | Additions | Deletions | Adjustments | of period | |||||||||||||
| (in thousands) | |||||||||||||||||
| Deferred Tax Assets Valuation Allowance: | |||||||||||||||||
| Year ended January 31, 2010 | $ | 15,692 | $ | - | $ | (789 | ) | $ | - | $ | 14,903 | ||||||
| Year ended January 31, 2009 | 13,319 | 2,373 | - | - | 15,692 | ||||||||||||
| Year ended January 31, 2008 | 18,785 | - | (1,393 | ) | (4,073 | ) | 13,319 | ||||||||||
101