Attached files
UNITED STATES
SECURITIES AND EXCHANGE COMMISSION
Washington, D.C. 20549
Form 10-K
(Mark One)
|
[√] |
ANNUAL REPORT PURSUANT TO SECTION 13 OR 15(d) OF THE SECURITIES EXCHANGE ACT OF 1934 |
For the fiscal year ended December 31, 2009
or
|
[ ] |
TRANSITION REPORT UNDER SECTION 13 OR 15(d) OF THE SECURITIES EXCHANGE ACT OF 1934 |
For the transition period from __________________ to __________________
Commission file number: 33-139037
![]() Resources Corp.
Resources Corp.
(Name of registrant as specified in its charter)
|
Nevada |
91-1956240 |
|
(State or other jurisdiction of incorporation or organization) |
(I.R.S. Employer Identification No.) |
|
360 Bay Street, Suite 301, Toronto, Ontario Canada |
M5H 2V6 |
|
(Address of principal executive offices) |
(Zip Code) |
|
Registrant’s telephone number, including area code: |
(416) 366-4227 |
Securities registered under Section 12(b) of the Act:
|
Title of each class |
Name of each exchange on which registered |
|
None |
Not applicable |
Securities registered under Section 12(g) of the Act:
None
(Title of class)
Indicate by check mark if the registrant is a well-known seasoned issuer, as defined in Rule 405 of the Securities Act.
[ ] Yes [√] No
Indicate by check mark if the registrant is not required to file reports pursuant to Section 13 or Section 15(d) of the Act.
[ ] Yes [√] No
Indicate by check mark whether the registrant (1) has filed all reports required to be filed by Section 13 or 15(d) of the Securities Exchange Act of 1934 during the preceding 12 months (or for such shorter period that the registrant was required to file such reports), and (2) has been subject to such filing requirements for the past 90 days.
[√] Yes [ ] No
Indicate by check mark if disclosure of delinquent filers pursuant to Item 405 of Regulation S-K is not contained herein, and will not be contained, to the best of the registrant’s knowledge, in definitive proxy or information statements incorporated by reference in Part III of this Form 10-K or any amendment to this Form 10-K.
[ ]
Indicate by check mark whether the registrant is a large accelerated filer, an accelerated filer, a non-accelerated filer, or a smaller reporting company:
|
Large accelerated filer |
[ ] |
Accelerated filer |
[ ] |
|
Non-accelerated filer |
[ ] |
Smaller reporting company |
[√] |
(Do not check if smaller reporting company)
Indicate by check mark whether the registrant is a shell company (as defined in Rule 12b-2 of the Exchange Act)
[ ] Yes [√] No
The aggregate market value of the voting and non-voting common equity held by non-affiliates computed by reference to the price at which the common equity was sold or the average bid and asked prices of such common equity, as of June 30, 2009, was approximately $22,215,985 based on the closing price of the shares as of that date of $0.74 per share.
As of March 29, 2010, we had 33,400,586 issued and outstanding shares of common stock.
DOCUMENTS INCORPORATED BY REFERENCE
The following documents of the Registrant are incorporated by reference in this Report: None
TABLE OF CONTENTS
|
|
|
Page |
|
PART I |
|
|
|
|
|
|
|
Item 1. |
Description of Business |
4 |
|
Item 1A. |
Risk Factors |
7 |
|
Item 1B. |
Unresolved Staff Comments |
12 |
|
Item 2. |
Properties |
12 |
|
Item 3. |
Legal Proceedings |
44 |
|
Item 4. |
Submission of Matters to a Vote of Security Holders |
45 |
|
|
|
|
|
PART II |
|
|
|
|
|
|
|
Item 5. |
Market for Registrant’s Common Equity, Related Stockholder Matters and Issuer Purchases of Equity Securities. |
45 |
|
Item 6. |
Selected Financial Data |
46 |
|
Item 7. |
Management’s Discussion and Analysis of Financial Conditions and Results of Operations |
46 |
|
Item 7A. |
Quantitative and Qualitative Disclosures about Market Risk |
52 |
|
Item 8. |
Financial Statements and Supplementary Data |
52 |
|
Item 9. |
Changes in and Disagreements with Accountants on Accounting and Financial Disclosure |
52 |
|
Item 9A(T). |
Controls and Procedures |
52 |
|
Item 9B. |
Other Information |
52 |
|
|
|
|
|
PART III |
|
|
|
|
|
|
|
Item 10. |
Directors, Executive Officers and Corporate Governance |
53 |
|
Item 11. |
Executive Compensation |
58 |
|
Item 12. |
Security Ownership of Certain Beneficial Owners and Management and Related Stockholder Matters |
62 |
|
Item 13. |
Certain Relationships and Related Transactions, and Director Independence |
64 |
|
Item 14. |
Principal Accounting Fees and Services |
65 |
|
|
|
|
|
PART IV |
|
|
|
|
|
|
|
Item 15. |
Exhibits, Financial Statement Schedules |
65 |
|
|
|
|
|
SIGNATURES |
|
67 |
- 2 -
CAUTIONARY STATEMENT REGARDING FORWARD-LOOKING INFORMATION
This Report contains forward-looking statements with respect to our financial condition, results of operations, business prospects, plans, objectives, goals, strategies, future events, capital expenditure, and exploration and development efforts. Words such as “anticipates”, “expects”, “intends”, “plans”, “forecasts”, “projects”, “budgets”, “believes”, “seeks”, “estimates”, “could”, “might”, “should”, and similar expressions identify forward-looking statements. Although we believe that our plans, intentions and expectations reflected in these forward-looking statements are reasonable, we cannot be certain that these plans, intentions or expectations will be achieved. Actual results, performance or achievements could differ materially from those contemplated, expressed or implied by the forward-looking statements. These statements include comments regarding the establishment and estimates of mineral reserves and mineral resources, production, production commencement dates, productions costs, cash operating costs per ounce, total cash costs per ounce, grade, processing capacity, potential mine life, feasibility studies, development costs, capital and operating expenditures, exploration, the closing of certain transactions including acquisitions and offerings.
The following, in addition to the factors described elsewhere in this Report under “Risk Factors”, are among the factors that could cause actual results to differ materially from the forward-looking statements:
|
|
● |
unexpected changes in business and economic conditions; |
|
|
● |
significant increases or decreases in gold prices; |
|
|
● |
changes in interest rates and currency exchange rates; |
|
|
● |
unanticipated grade changes; |
|
|
● |
changes in metallurgy; |
|
|
● |
access and availability of materials, equipment, supplies, labor and supervision, power and water; |
|
|
● |
determination of mineral resources and mineral reserves; |
|
|
● |
availability of drill rigs; changes in project parameters; |
|
|
● |
costs and timing of development of new mineral reserves; results of current and future exploration activities; |
|
|
● |
results of pending and future feasibility studies; joint venture relationships; |
|
|
● |
political or economic instability, either globally or in the countries in which we operate; |
|
|
● |
local and community impacts and issues; |
|
|
● |
timing of receipt of government approvals; accidents and labor disputes; environmental costs and risks; and |
|
|
● |
competitive factors, including competition for property acquisitions; and availability of capital at reasonable rates or at all. |
With respect to any forward-looking statement that includes a statement of its underlying assumptions or bases, we believe such assumptions or bases to be reasonable and have formed them in good faith, assumed facts or bases almost always vary from actual results, and the differences between assumed facts or bases and actual results can be material depending on the circumstances. When, in any forward-looking statement, we express an expectation or belief as to future results, that expectation or belief is expressed in good faith and is believed to have a reasonable basis, but there can be no assurance that the stated expectation or belief will result or be achieved or accomplished. All subsequent written and oral forward-looking statements attributable to us, or anyone acting on our behalf, are expressly qualified in their entirety by the cautionary statements. Except for our ongoing obligations to disclose material information under the Federal securities laws, we do not undertake any obligations to publicly release any revisions to any forward-looking statements to reflect events or circumstances after the date of this Report or to reflect unanticipated events that may occur. These forward-looking statements speak only as of the date of this Report and you should not rely on these statements without also considering the risks and uncertainties associated with these statements and our business.
- 3 -
PART I
|
Item 1. |
BUSINESS |
Description of Business
We are engaged in the exploration of gold properties exclusively in the Republic of Ghana (“Ghana”), West Africa. Exploration means we are engaged in the search for mineral deposits or reserves which could be economically and legally extracted or produced and typically includes the review of existing data, grid establishment, geological mapping, geophysical surveying, trenching and pitting to test the areas of anomalous soil samples and reverse circulation and/or diamond drilling to test targets followed by infill drilling, if successful, to define a resource and, perhaps ultimately, a reserve.
Our interests in our projects (collectively, the “Projects” and individually, the “Project”), are held by our Ghanaian subsidiaries, through prospecting licenses and mining leases granted by the Government of Ghana for licensed or leased areas respectively located within and upon concessions in Ghana. A concession is a grant of a tract of land made by a government or other controlling authority in exchange for an agreement that the land will be used for a specific purpose. We have the following six Projects all of which are in the exploration stage:
|
|
● |
Kwabeng Project. Our interest in this Project is held by a mining lease. In January 2007, we commenced an early stage pre-production mining process whereby a sample area of ore was processed, the results of which assisted us in determining the best way and most profitable manner in which to mine the gold to be recovered from the mineralized material at our Kwabeng Project. The foregoing process was internally referred to by our company as a “Bulk Test”. We tested 32,906.70 bank cubic meters (“BCM”) of mineralized material at our Kwabeng Project that we processed through our floating placer gold washing processing plant (the “Wash Plant”) and recovered 608.50 ounces of gold. Following completion of the Bulk Test, our company made modifications to our Wash Plant. We recovered gold from the mineralized material at our Kwabeng Project since January 19, 2007. In October 2008, we temporarily suspended our operations at the Kwabeng Project while management of our company (“Management”) considered a more economic and efficient manner in which to extract and process the gold recovered from the mineralized material at this Project. As of December 31, 2009: (i) the total mineralized material that has been recovered from our Kwabeng Project is 361,791.66 BCM; (ii) we have recovered 8,814.82 fine ounces of gold from the mineralized material at our Kwabeng Project; and (iii) we have sold 8,814.82 fine ounces of gold for cash proceeds of $6,843,965. As of the date of this Report, with respect to any future recovery of gold operations at this Project, we plan to negotiate with independent Ghanaian contract miners and operators to assume such operations on fixed payment terms to our company (see “The Kwabeng Project – Future Exploration Activities”). |
|
|
● |
Pameng Project. Our interest in this Project is held by a mining lease. This Project is in the exploration stage. Since January 1, 2009, being the beginning of the fiscal year for which this Report is filed, we did not conduct any exploration activities on this Project. As of the date of this Report, we have not planned for any exploration activities during the next 12 months, however, we may consider doing so at a later date. |
|
|
● |
Banso Project. Our interest in this Project is held by a prospecting license. This Project is in the exploration stage. Since January 1, 2009, being the beginning of the fiscal year for which this Report is filed, we did not conduct any exploration activities on this Project. As of the date of this Report, we have not planned for any additional exploration activities during the next 12 months, however, we may consider doing so at a later date. |
|
|
● |
Muoso Project. Our interest in this Project is held by a prospecting license. This Project is in the exploration stage. From December 1, 2009 to February 20, 2010, we conducted a trenching program totaling 546 linear-meters on this Project. As at the date of this Report: (i) we are currently in the process of compiling and interpreting the trench geological and analytical result data; and (ii) we have not planned for any additional exploration activities during the next 12 months, however, we may consider doing so at a later date. |
- 4 -
|
|
● |
Apapam Project. Our interest in this Project is held by a mining lease. This Project is in the exploration stage. Since January 1, 2009, being the beginning of the fiscal year for which this Report is filed, we have completed a reverse circulation (“RC”) drill program of 50 holes totaling 4,715 meters from July 14 to September 26, 2009 (see “Phase II Drill Program – Apapam Project” for the results of this program). As of the date of this Report: (i) we have engaged SEMS Exploration Services (‘SEMS”) to prepare an independent technical report consistent with the Canadian Securities Administrators National Instrument 43-101 – Standards of Disclosure for Mineral Projects, Form 43-101F1 – Technical Report and Companion Policy 43-101 CP (“NI 43-101”) on this Project (see “The Apapam Project – Work in Progress”); (ii) we have engaged SRK Consulting (Canada) Inc. (“SRK”) to conduct a detailed structural study of our Kibi Gold Trend located on this Project (see “The Apapam Project – Work in Progress”); and (iii) we have planned a Phase III drilling program (the “Phase III Drill Program”) to be commenced during the next 12 months (see “The Apapam Project – 2010 Phase III Drill Program – Kibi Gold Trend”. |
|
|
● |
Edum Banso Project. We have an option to acquire the interest in this Project which is held by a prospecting license. This Project is in the exploration stage. Since January 1, 2009, being the beginning of the fiscal year for which this Report is filed, we did not conduct any exploration activities on this Project. As of the date of this Report, we have not planned for any additional exploration activities during the next 12 months, however, we may consider doing so at a later date. |
To a much lesser extent, we currently hold, through our wholly-owned subsidiary, Xtra Oil & Gas Ltd. (“XOG”), an 18.9% interest in a petroleum and natural gas lease located in Alberta, Canada which we acquired in April 2008. During the next 12 months, we plan to consider the potential divestiture of our interest.
As of the date of this Report, we have received cash proceeds of $391,414 derived from the recovery of gold during the Bulk Test, have subsequently derived cash proceeds of $6,452,551 from the recovery of gold from the mineralized material at our Kwabeng Project since April 24, 2007, have achieved losses since inception, have minimal operations, and currently rely upon the sale of our securities to fund our operations.
During the next 12 months, we plan to focus our efforts primarily on exploration activities at our Apapam Project, in particular, conducting the Phase III Drill Program of our Kibi Gold Trend, to develop this Project. The estimated cost for our planned Phase III Drill Program is approximately $1,000,000. Our general and administrative costs will be approximately $1,000,000 (which includes approximately $500,000 in non-cash expenses) for the next 12 months. Based on approved expenditures in our corporate operating budget for the next 12 months, we anticipate spending a minimum of approximately $2,000,000, however, we would not expend this amount unless we are successful in raising additional capital for such purposes. Upon completion of our planned exploration program at our Apapam Project, in particular, the Phase III Drill Program, we plan to spend an additional $5,000,000 in drilling expenditures in the Kibi Gold Trend to identify a potential resource. This $5,000,000 drilling program cannot be completed unless our company is successful in raising additional capital. At December 31, 2009, we had working capital of approximately $2,119,159, comprised of current assets of $2,602,232 less current liabilities of $483,073. Our current assets were comprised mostly of $622,670 in cash and cash equivalents, a deposit for equipment to be purchased of $151,506 and $1,781,594 in trading securities.
Corporate History
Xtra-Gold Resources Corp. (“we” or the “company”) was incorporated under the laws of the State of Nevada on September 1, 1998 under the name Silverwing Systems Corporation (“Silverwing”) with an authorized capital consisting of 25,000,000 shares of common stock at a par value of $.001 per share. From the incorporation of Silverwing until March 14, 1999, we were inactive. Thereafter until June 1999, we were involved in the negotiation and closing of the acquisition of a business opportunity described below.
On June 23, 1999, we acquired all of the issued and outstanding shares of Advertain On-Line Canada, Inc. (“Advertain”) from the sole shareholder of Advertain in exchange for 1,550,000 shares of common stock (24% of our then issued and outstanding shares of common stock). At the time of the acquisition, Advertain was in the business of creating and developing computer software for an Internet web site called “Advertain.com” and maintaining and operating the said web site. The primary purpose of the web site was to collect and distribute entertaining advertising on the Internet. This transaction resulted in the formation of our being a holding company for Advertain, our then only wholly-owned subsidiary. Since our only business activities was the business activities of Advertain, the president of Advertain joined our then current management as president of our company. On August 19, 1999, we changed our name to Advertain On-Line Inc. to better describe our intended business.
From the date of the acquisition of Advertain on June 23, 1999 to December 31, 2000, our principal business activities were the continuation of the business activities of Advertain. We continued to fund the activities of Advertain through December 31, 2000.
- 5 -
After December 31, 2000 we continued to use our best efforts to fund Advertain. Since we were unable to complete further funding, it was decided, on May 21, 2001, to abandon our interest in Advertain and enter into a plan to dispose of Advertain and reorganize our company for a future acquisition. On May 21, 2001, our then president, who was also president of Advertain, resigned since we determined to dispose of Advertain, and our former president, who was a director at the time, was appointed president. On June 15, 2001, we sold the shares we owned in Advertain back to the former sole shareholder and president of Advertain. On June 18, 2001, we consolidated our outstanding common shares on a basis of 20 for 1, adopted a new business plan to develop and operate laser eye correction (lasik surgery) clinics, and changed our name to RetinaPharma International, Inc. (“RetinaPharma”) to better describe our new intended business plan, which was ultimately never developed for lack of capital. No change of management occurred between May 21, 2001, when our former president rejoined our company as described above, and October 31, 2003 when we acquired our subsidiary, XGRI, as described below.
From June 18, 2001 to October 31, 2003, we were inactive except for searching for a business opportunity to acquire. During this period our principal shareholders made capital contributions as needed to pay certain debts and fund our minimal activities, which consisted of locating a business opportunity. In addition, on July 22, 2002, we consolidated our outstanding common shares on a basis of 5 for 1. In the fall of 2002, through the referral to our former president by our current president, we commenced discussions for the acquisition of XGRI, as described below.
On October 31, 2003, we acquired all of the issued and outstanding shares of Xtra-Gold Resources, Inc., a Florida corporation (“XGRI”) from the shareholders of XGRI, all of which were unaffiliated third parties, in exchange for 10,070,000 shares of common stock (approximately 80% of our then issued and outstanding shares of our common stock). This transaction resulted in a change of control of our company and the formation of our being a holding company for XGRI, our then only wholly-owned subsidiary. As a result of this change in control, the president and directors of XGRI were appointed as our new management, and management immediately prior to this acquisition resigned. Subsequently, on November 22, 2003, we executed a 5 for 1 forward stock split. On December 16, 2003, we changed our name to Xtra-Gold Resources Corp. and increased the number of shares of common stock we are authorized to issue to 250,000,000 shares effective December 19, 2003. We undertook this name change to better describe our intended business. As a condition for the acquisition of XG Mining in December 2004, two former officers and directors of our company agreed to return 47,000,000 of the original shares of common stock issued in connection with the acquisition of XGRI for cancellation and these shares were subsequently cancelled in May 2005.
XGRI was incorporated on October 24, 2003 and its only operations prior to the share exchange was the issuance of 10,070,000 shares to its two founders in exchange for an option to develop a mining property located in Switzerland and the sale of 50,000 shares of its common stock to pay certain expenses.
On October 20, 2005, we amended the name of XGRI to Xtra Energy Corp. (“Xtra Energy”). On October 20, 2005, we incorporated our wholly-owned subsidiary, Xtra Oil & Gas Ltd. (“XOG”), an Alberta, Canada corporation, and on March 2, 2006, we incorporated our wholly-owned subsidiary, Xtra Oil & Gas (Ghana) Limited (“XOG Ghana”), an Accra, Ghana corporation for the business purpose set forth hereunder. On April 7, 1998, our wholly-owned subsidiary Xtra-Gold Exploration Limited (“XGEL”), a Ghana corporation, was formed. On June 7, 1989, our 90% owned subsidiary, Xtra-Gold Mining Limited (“XG Mining”), a Ghana corporation, was formed.
Location
As at the date of this Report, our corporate office is located at 360 Bay Street, Suite 301, Toronto, Ontario, Canada, M5H 2V6, and our telephone number there is (416) 366-4227. We use this office as our mailing address, to maintain our corporate records and to perform limited administrative functions. We maintain a technical and administrative office at our field camp (the “Field Camp”) located at 2 Masalakye Street, in the town of Kwabeng, Ghana. References in this Report to “Xtra-Gold”, “company”, “we”, “us” and “our” are to Xtra-Gold Resources Corp., a Nevada corporation, and our wholly owned subsidiaries, Xtra Energy, XOG; XGEL, XOG Ghana and our 90% owned subsidiary, XG Mining.
Employees
As at the date of this Report, our company has no salaried employees. Our President devotes approximately 90% of his time to our company. Our Vice-President, Exploration devotes approximately 90% of his time in consulting services to our company. We further engage the consulting services of our Vice-President, Ghana Operations and our Vice-President, Community Relations for our Ghanaian subsidiaries, both of whom devote a variable percentage of their time in consulting services to our company on an “as needed” basis. We also engage our Secretary and Treasurer with respect to corporate and administrative services who devotes a variable percentage of his time in consulting services to our company on an “as needed” basis.
Other Pertinent Information
Our fiscal year end is December 31.
- 6 -
|
Item 1A. |
RISK FACTORS |
AN INVESTMENT IN THE SECURITIES OFFERED HEREBY IS SPECULATIVE IN NATURE AND INVOLVES A HIGH DEGREE OF RISK. THE FOLLOWING FACTORS ARE BELIEVED BY MANAGEMENT TO BE THE MATERIAL RISKS THAT SHOULD BE CAREFULLY CONSIDERED BY INVESTORS BEFORE PURCHASING OUR SHARES.
WE ARE CURRENTLY IN THE EXPLORATION STAGE WITH RESPECT TO ALL OUR PROJECTS. THE CHANCE OF EVER REACHING THE PRODUCTION STAGE AT OUR PROJECTS IS UNCERTAIN.
All of our Projects are in the exploration stage. Our exploration efforts are subject to risks which are beyond our control, including:
|
|
● |
mineral exploration involves a high degree of risk and few properties which are explored are ever developed into producing mines and our exploration efforts may never result in the discovery of commercial bodies of mineralization; |
|
|
● |
the identification of potential gold mineralization based on surface analysis; |
|
|
● |
the availability of prospective land; |
|
|
● |
the availability of government granted reconnaissance and exploration licenses; |
|
|
● |
the availability of financial resources to fund our exploration and development activities; |
|
|
● |
we may experience delays in obtaining, or be unable to obtain, the necessary approvals, licenses, permits or surface land and easement rights necessary to develop our Projects which could delay or prevent us from continuing our exploration and development efforts; and |
|
|
● |
illicit mining on one or more of our Projects by artisanal miners could result in environmental damage and surface depletion of mineral deposits making the future mining of those deposits not economically feasible. |
WE WILL NEED SUBSTANTIAL ADDITIONAL CAPITAL TO CONTINUE EXPLORATION ACTIVITIES AT ALL OF OUR PROJECTS. IF WE CANNOT RAISE ADDITIONAL CAPITAL AS NEEDED, OUR ABILITY TO EXECUTE OUR BUSINESS PLAN AND FUND OUR ONGOING OPERATIONS WILL BE IN JEOPARDY.
We estimate that the cost for the exploration programs at all of our Projects will be an aggregate of approximately $1,000,000, in particular, for conducting the Phase III Drill Program of our Kibi Gold Trend located on our Apapam Project and our general and administrative costs will be approximately $1,000,000 (which includes approximately $500,000 in non-cash expenses) for the next 12 months. Based on approved expenditures in our corporate operating budget for 2010, we anticipate spending a minimum of approximately $2,000,000 over the next 12 months, however, we would not expend this amount unless we are able to raise additional capital for such purposes. Our future capital requirements depend on a number of factors, including our ability to raise additional capital, manage our business and control our expenses. As described elsewhere in this Report, at December 31, 2009, we had working capital of approximately $2,119,159, comprised of current assets of $2,602,232, mostly $622,670 in cash and cash equivalents, $151,506 for a deposit on equipment to be purchased and $1,781,594 in trading securities, less current liabilities of $483,073. We are exploring various financing alternatives to meet our projected costs and expenses. We cannot assure you that we will be able to obtain the necessary financing for our Projects on favorable terms or at all. Additionally, if the actual costs to execute our business plan are significantly higher than we expect, we may not have sufficient funds to cover these costs and we may not be able to obtain other sources of financing. The failure to obtain all necessary financing would prevent us from executing our business plan and would impede our ability to sustain operations or become profitable, and we could be forced to cease our operations.
ALL OF OUR PROJECTS ARE IN THE EXPLORATION STAGE AND MAY NOT RESULT IN THE DISCOVERY OF COMMERCIAL BODIES OF MINERALIZATION WHICH WOULD RESULT IN OUR DISCONTINUING THAT PROJECT. SUBSTANTIAL EXPENDITURES ARE REQUIRED TO DETERMINE IF A PROJECT HAS ECONOMICALLY MINEABLE MINERALIZATION.
All of our Projects are in the exploration stage. Mineral exploration involves a high degree of risk and few properties which are explored are developed into producing mines. The exploration efforts on our Projects may not result in the discovery of commercial bodies of mineralization which would require us to discontinue that project. Substantial expenditures are required to
- 7 -
determine if a project has economically mineable mineralization. It could take several years to establish proven and probable mineral reserves. Due to these uncertainties, we cannot assure you that current and future exploration programs will result in the discovery of mineral resources or reserves.
OPERATIONS AT OUR APAPAM PROJECT COULD BE ADVERSELY AFFECTED IF WE ARE UNABLE TO OBTAIN FROM THE GOVERNMENT AUTHORITIES A GRANT OF OUR GROUND APPLICATION TO AN EXTENSION OF THE CONCESSION AREA TO COVER CERTAIN DRILL INTERCEPTS AT THIS PROJECT.
We have recently made an application to the Ghana Minerals Commission (“Min Com”) to grant us a ground extension of 1.66 square kilometers (“sq km”) the land covered by our mining lease for our Apapam Project to include certain Zone 3 drill intercepts (see “The Apapam Project – 2009 Phase II Drill Program Results”). There is no assurance that we will ever receive the grant to the ground extension from Min Com which could potentially have an adverse effect on our operations at this Project.
THE DEVELOPMENT OF ALL OF OUR PROJECTS MAY BE DELAYED DUE TO DELAYS IN RECEIVING REGULATORY PERMITS AND APPROVALS, WHICH COULD IMPEDE OUR ABILITY TO DEVELOP OUR PROJECTS WHICH, ABSENT RAISING ADDITIONAL CAPITAL, COULD CAUSE US TO CURTAIL OR DISCONTINUE DEVELOPMENT, IF ANY.
We may experience delays in developing our Projects. The timing of development at our Projects depends on many factors, some of which are beyond our control, including the:
|
|
● |
timely issuance of permits; and |
|
|
● |
acquisition of surface land and easement rights required to develop and operate our Projects, particularly if we are required to acquire surface land through expropriation in connection with our mineral concessions. |
These delays could increase development costs at our Projects, affect project economic viability, or prevent us from completing the development of our Projects.
WE MAY NOT BE ABLE TO OBTAIN, RENEW OR CONTINUE TO COMPLY WITH ALL OF THE PERMITS NECESSARY TO DEVELOP EACH OF OUR PROJECTS WHICH WOULD FORCE US TO DISCONTINUE DEVELOPMENT, IF ANY, ON THAT PROJECT.
Pursuant to Ghanaian law, we must obtain various approvals, licenses or permits in connection with the development, if any, of our Projects in connection with environmental protection and the use of water resources. In addition to requiring permits for the development of our mineral concessions located at each of our Projects, we may need to obtain other permits and approvals during the life of these Projects. Obtaining, renewing and continuing to comply with the necessary governmental permits and approvals can be a complex and time-consuming process. The failure to obtain or renew the necessary permits or licenses or continue to meet their requirements could delay future development and could increase our costs related to such activities.
THE GOVERNMENT OF GHANA HAS THE RIGHT TO INCREASE ITS OWNERSHIP INTEREST OF 10% IN OUR XG MINING SUBSIDIARY FOR A CONSIDERATION AGREED UPON BY THE PARTIES OR BY ARBITRATION AND HAS A RIGHT OF PRE-EMPTION TO PURCHASE ALL MINERALS PRODUCED BY XG MINING. IF THE GOVERNMENT OF GHANA WERE TO EXERCISE ANY OF ITS RIGHTS, OUR RESULTS OF OPERATIONS IN FUTURE PERIODS COULD BE ADVERSELY IMPACTED.
The Government of Ghana currently has a 10% free carried interest in XG Mining, one of our Ghanaian subsidiaries that holds three mining leases covering our Kwabeng, Pameng and Apapam concessions. The Government of Ghana also has: (a) the right to acquire an additional interest in XG Mining for a price to be determined by agreement or arbitration; (b) the right to acquire a special share (as defined in the Minerals and Mining Act, 2006 (Act 703)) in XG Mining at any time for or such consideration as the Government of Ghana and XG Mining might agree; and (c) a right of pre-emption to purchase all minerals raised, won or obtained in Ghana. While we are not aware of the Government of Ghana having ever exercised such right of pre-emption, we cannot assure you that the Government of Ghana would not seek to exercise one or more of these rights which, if exercised, could have an adverse affect on our results of operations in future periods. If the Government of Ghana should exercise its right to either acquire the additional interest in XG Mining or its right to acquire the special share, any profit we might otherwise report from XG Mining’s operations would be proportionally reduced in the same percentage as the minority interest attributable to the Government of Ghana in that subsidiary would be increased. If the Government of Ghana should exercise its right to purchase all gold and other minerals produced by XG Mining, the price it would pay may be lower than the price we could sell the gold or other minerals for in transactions with third parties and it could result in a reduction in any revenues we might otherwise report from XG Mining’s operations.
- 8 -
OUR ACTIVITIES ARE SUBJECT TO ENVIRONMENTAL LAWS AND REGULATIONS THAT MAY INCREASE OUR COSTS OF DOING BUSINESS AND MAY RESTRICT OUR OPERATIONS.
All of our exploration activities in Ghana are subject to regulation by governmental agencies under various environmental laws. To the extent we conduct exploration activities or undertake new exploration or future mining activities in other foreign countries, we will also be subject to environmental laws and regulations in those jurisdictions. These laws address emissions into the air, discharges into water, management of waste, management of hazardous substances, protection of natural resources, antiquities and endangered species, and reclamation of lands disturbed by mining operations. Environmental legislation in many countries is evolving and the trend has been towards stricter standards and enforcement, increased fines and penalties for non-compliance, more stringent environmental assessments of proposed projects and increasing responsibility for companies and their officers, directors and employees. Compliance with environmental laws and regulations may require significant capital outlays and may cause material changes or delays in our intended activities. We cannot assure you that future changes in environmental regulations will not adversely affect our business, and it is possible that future changes in these laws or regulations could have a significant adverse impact on some portion of our business, causing us to re-evaluate those activities at that time.
In addition, we may be exposed to potential environmental impacts during any full scale mining operation. At such time of commencement of full scale mining, if ever, we plan to negotiate posting of a reclamation bond to quantify the reclamation costs. We anticipate that the dollar amount of reserves established for exposure to environmental liabilities is $150,000, as estimated by the EPA, however, we are currently unable to predict the ultimate cost of compliance or the extent of liability risks.
OUR ACTIVITIES ARE AND WILL BE SUBJECT TO COMPLEX LAWS, SIGNIFICANT GOVERNMENT REGULATIONS AND ACCOUNTING STANDARDS THAT MAY DELAY OR PREVENT OPERATIONS AT OUR PROJECTS AND CAN ADVERSELY AFFECT OUR OPERATING COSTS, THE TIMING OF OUR OPERATIONS, OUR ABILITY TO OPERATE AND OUR FINANCIAL RESULTS.
Our business, exploration activities and any future development activities and mining operations are and will be subject to extensive Ghanaian, United States and other foreign, federal, state, territorial and local laws and regulations and also exploration, development, production, exports, taxes, labor standards, waste disposal, protection of the environment, reclamation, historic and cultural resource preservation, mine safety and occupational health, reporting and other matters, as well as accounting standards. Compliance with these laws, regulations and standards or the imposition of new such requirements could adversely affect our operating and future development costs, the timing of our operations, our ability to operate and our financial results. These laws and regulations governing various matters include:
|
|
● |
environmental protection; |
|
|
● |
management of natural resources; |
|
|
● |
exploration, development of mines, production and post-closure reclamation; |
|
|
● |
export and import controls and restrictions; |
|
|
● |
price controls; |
|
|
● |
taxation; |
|
|
● |
labor standards and occupational health and safety, including mine safety; |
|
|
● |
historic and cultural preservation; and |
|
|
● |
generally accepted accounting principles. |
The costs associated with compliance with these laws and regulations may be substantial and possible future laws and regulations, or more stringent enforcement of current laws and regulations by governmental authorities, could cause additional expense, capital expenditures, restrictions on or suspensions of our operations and delays in the development of our Projects. These laws and regulations may allow governmental authorities and private parties to bring lawsuits based upon damages to property and injury to persons resulting from the environmental, health and safety impacts of our past and current operations, and could lead to the imposition of substantial fines, penalties or other civil or criminal sanctions. In addition, our failure to comply strictly with applicable laws, regulations and local practices relating to permitting applications or reporting requirements could result in loss, reduction or expropriation of entitlements, or the imposition of additional local or foreign parties as joint venture partners. Any such loss, reduction, expropriation or imposition of partners could have a materially adverse effect on our operations or business.
- 9 -
WE DEPEND ON THE CONTINUED SERVICES OF OUR VICE-PRESIDENT, EXPLORATION. THE LOSS AND FAILURE TO REPLACE HIM MAY DAMAGE OUR OPERATIONS AND MAY DELAY OUR EXPLORATION ACTIVITIES AND OUR ABILITY TO COMMENCE DEVELOPMENT IN FUTURE PERIODS.
Our future success depends upon the continued services of our geological team, , in particular, our Vice-President, Exploration. The exploration experience of this individual with respect to the geological knowledge and experience that is fundamental to our business operations is unique and if we were to lose his services, we may encounter difficulty in replacing him. If we were unable to replace our Vice-President, Exploration in a timely manner, it may lead to our having to delay our exploration or future development activities, if any. In this event, any trading market for our securities and your ability to liquidate your investment would be negatively impacted and you could lose your entire investment in our company. We do not maintain key person insurance on this individual.
WE MAY EXPERIENCE DIFFICULTY IN ENGAGING THE SERVICES OF QUALIFIED PERSONNEL IN CONNECTION WITH OUR TECHNICAL OPERATIONS AT OUR PROJECTS.
In the event of the loss of any of our key technical personnel at any of our Projects, we may have difficulty finding qualified replacements. Our inability to hire and retain the services of qualified persons for these positions in a timely manner could impede our exploration activities at any of our Projects which would have a material adverse effect on our ability to conduct our business.
IF WE DO NOT OBTAIN NEW FINANCINGS, THE AMOUNT OF FUNDS AVAILABLE TO US TO PURSUE OUR EXPLORATION ACTIVITIES AT OUR APAPAM PROJECT AND TO PURSUE FURTHER EXPLORATION OF OUR OTHER MINERAL PROPERTIES WILL BE REDUCED AND OUR PLAN OF OPERATIONS MAY BE ADVERSELY AFFECTED.
We have relied on recent private placement financings in order to fund exploration programs including our drilling programs at our Apapam Project. We will continue to require additional financing to complete our plan of operations including our Phase III Drill Program at our Apapam Project and to carry out any exploration activities on our other mineral Projects. Any impairment in our ability to raise additional funds through financings would reduce the available funds for our planned Phase III Drill Program at our Apapam Project, with the result that our plan of operations may be adversely affected.
THE MARKETABILITY OF OUR COMMON STOCK MAY BE ADVERSELY IMPACTED AS A RESULT OF THE REGULATORY HISTORY OF ONE OF OUR EXECUTIVE OFFICERS AND DIRECTORS. IN THIS EVENT, YOUR ABILITY TO LIQUIDATE YOUR INVESTMENT IN OUR COMPANY COULD BE ADVERSELY IMPACTED AND YOU COULD LOSE SOME OR ALL OF YOUR INVESTMENT IN OUR COMPANY.
Since one of our officers and directors has a regulatory history, potential investors could decide not to purchase our securities out of concern which could impair the liquidity of our common stock. As a result, you may find it more difficult to sell your investment in our company at a time when you wish to liquidate your position, or at all.
WE HAVE VOLUNTARILY IMPLEMENTED VARIOUS CORPORATE GOVERNANCE MEASURES, HOWEVER, IN THE ABSENCE OF IMPLEMENTING ALL MEASURES REQUIRED BY A NATIONAL SECURITIES EXCHANGE, OUR STOCKHOLDERS MAY HAVE REDUCED PROTECTIONS AGAINST INTERESTED DIRECTOR TRANSACTIONS, CONFLICTS OF INTEREST AND OTHER MATTERS.
Recent Federal legislation, including the Sarbanes-Oxley Act of 2002, has resulted in the adoption of various corporate governance measures designed to promote the integrity of the corporate management and the securities markets. Some of these measures have been adopted in response to legal requirements. Other measures have been adopted by companies in response to the requirements of national securities exchanges, such as the NYSE or The NASDAQ Stock Market (‘NASDAQ”), on which their securities are listed. Among the corporate governance measures rules of national securities exchanges are those that address board of directors’ independence, audit committee oversight, and the adoption of a code of ethics. As our stock is not listed on a national securities exchange, we are not required to adopt these corporate governance standards. However, in November 2009, our board of directors (“Board”) voluntarily established Audit, Compensation and Nominating and Corporate Governance Committees and we have adopted many of the corporate governance measures which we would otherwise be required to adopt if our securities were listed on a national securities exchange. It is possible that if we were to adopt all of the corporate governance measures, stockholders would benefit from somewhat greater assurances that internal corporate decisions were being made by disinterested directors and that policies had been implemented to define responsible conduct. Prospective investors should bear in mind our current corporate governance measures in formulating their investment decisions.
- 10 -
OUR COMMON STOCK IS CURRENTLY QUOTED ON THE OTC BULLETIN BOARD (“OTCBB”) AND TRADING IN THE SHARES IS LIMITED. BECAUSE OUR STOCK CURRENTLY TRADES BELOW $5.00 PER SHARE, AND IS QUOTED ON THE OTCBB, OUR STOCK IS CONSIDERED A “PENNY STOCK” WHICH CAN LIMIT OR MAKE TRADING AND LIQUIDITY IN OUR STOCK MORE DIFFICULT TO EFFECTUATE.
The SEC has adopted regulations that generally define a penny stock to be any equity security that has a market price of less than $5.00 per share, subject to certain exemptions. Such exemptions include an equity security listed on a national securities exchange or quoted on NASDAQ and an equity security issued by an issuer that has net tangible assets of at least $2,000,000, if such issuer has been in continuous operation for more than three (3) years. Unless such an exemption is available, the regulations require the delivery of a disclosure document to the investor explaining the penny stock market and the risks associated therewith prior to any transaction involving a penny stock. In addition, as long as the common stock is not listed on a national securities exchange or at any time that the company has less that $2,000,000 in net tangible assets, trading in the common stock is covered by Rule 15g-9 under the Securities Exchange Act of 1934, as amended (the “Exchange Act”), for non-exchange listed securities. Under that rule, broker-dealers who recommend such securities to persons other than established customers and accredited investors must make a special written suitability determination for the purchaser and receive the purchaser’s written agreement to a transaction prior to sale. Securities are exempt from this rule if the market price is at least $5.00 per share. To the extent that we do not meet the exemptions under the Penny Stock Rule, there will be reduced liquidity in the market.
OUR COMMON STOCK PRICE IS LIKELY TO BE HIGHLY VOLATILE, WHICH COULD CAUSE THE VALUE OF YOUR INVESTMENT TO DECLINE.
The market price of our Common Stock may be highly volatile. Investors may not be able to resell their shares of our Common Stock following periods of volatility because of the market’s adverse reaction to volatility. Factors that could cause such volatility may include, among other things:
|
|
● |
actual or anticipated fluctuations in our quarterly operating results; |
|
|
● |
large purchases or sales of our Common Stock; |
|
|
● |
additions or departures of key personnel; |
|
|
● |
investor perception of our business prospects; |
|
|
● |
conditions or trends in other industry related companies; |
|
|
● |
changes in the market valuations of publicly traded companies in general and other industry-related companies; and |
|
|
● |
worldwide political, economic and financial conditions. |
WE ARE SUBJECT TO FLUCTUATIONS IN CURRENCY EXCHANGE RATES, WHICH COULD MATERIALLY ADVERSELY AFFECT OUR FINANCIAL POSITION.
Our primary currency for operations is the United States dollar and, to a lesser extent, the “Cedi”, the Ghanaian currency. We maintain most of our working capital in United States dollars. Our investment portfolio is primarily denominated in Canadian dollars. We convert our United States funds to foreign currencies as certain payment obligations become due. Accordingly, we are subject to fluctuations in the rates of currency exchange between the United States dollar and these foreign currencies and these fluctuations, which are beyond our control, could materially affect our financial position and results of operations. A significant portion of the operating costs of our Projects are in Cedi. We obtain services and materials and supplies from providers in West Africa. The costs of goods and services could increase or decrease due to changes in the value of the United States dollar or the Cedi or other currencies. Consequently, exploration and development of our Projects could be more costly than anticipated.
IT MAY BE DIFFICULT FOR STOCKHOLDERS TO ENFORCE ANY JUDGMENT OBTAINED IN THE UNITED STATES AGAINST US OR OUR OFFICERS OR DIRECTORS, WHICH MAY LIMIT THE REMEDIES OTHERWISE AVAILABLE TO OUR STOCKHOLDERS.
All of our directors and officers are residents of countries other than the United States and all or a substantial portion of such persons’ assets are located outside the United States. As a result, it may be difficult or impossible for investors to:
|
|
● |
effect service of process on our directors or officers, or |
- 11 -
|
|
● |
enforce any United States judgment they receive against us or our officers or directors in a foreign court, or |
|
|
● |
enforce within the United States any judgments obtained against us or our officers or directors, |
including judgments predicated upon the securities laws of the United States or any state thereof. In addition, there is uncertainty as to whether foreign courts would be competent to hear original actions brought in such foreign court against us or such persons predicated upon the securities laws of the United States or any state thereof. Consequently, you may be effectively prevented from pursuing remedies under U.S. federal securities laws against us or our officers and directors. The foregoing risks also apply to those experts identified in this Report that are not residents of the United States.
WE CANNOT PREDICT WHETHER WE WILL SUCCESSFULLY EFFECTUATE OUR CURRENT BUSINESS PLAN. EACH PROSPECTIVE PURCHASER IS ENCOURAGED TO CAREFULLY ANALYZE THE RISKS AND MERITS OF AN INVESTMENT IN THE SHARES AND SHOULD TAKE INTO CONSIDERATION WHEN MAKING SUCH ANALYSIS, AMONG OTHERS, THE RISK FACTORS DISCUSSED ABOVE.
|
Item 1B. |
UNRESOLVED STAFF COMMENTS |
|
|
None. |
|
Item 2. |
PROPERTIES |
Real Property
We do not own any real property, however, we do own the mineral rights on our Projects. All of our exploration activities are currently conducted at project sites located in Ghana. Mining leases or prospecting licenses to which we are a party, granting us the right to operate at our Kwabeng, Pameng, Apapam, Banso and Muoso and Edum Banso Projects, are described elsewhere in this Report.
We currently conduct limited administrative activities from our corporate office located at Suite 301, 360 Bay Street, Toronto, Ontario, Canada, M5H 2V6, where we have leased 1,163 square feet for a 66 month term commencing on May 1, 2007, at approximately $3,405 (CAD$3,868) per month.
As of the date of this Report, our technical and administrative activities are conducted at our Field Camp located in Kwabeng, Ghana. We do not pay any rent as we own the Field Camp. Our technical and administrative activities were also previously conducted from an office located at House No. 15, Ade-Coker Road, East Legon, Accra, Ghana. As of February 2009, we terminated the lease for these premises as a cost-saving measure.
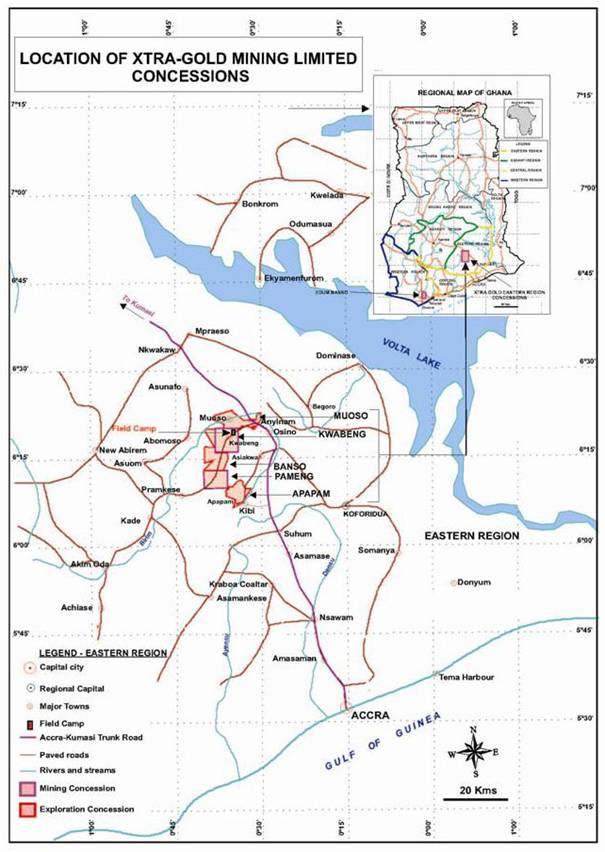
Map of Properties and Operations
The map, on the following page, shows the locations of our Kwabeng, Pameng, Apapam, Banso and Muoso and Edum Banso Projects all of which are described in further detail in this Report.
- 12 -
- 13 -
Description of Properties
Except for our Apapam Project, each of our other mineral exploration projects; namely our Kwabeng, Project, our Banso and Muoso Project, our Edum Banso Project and our Pameng Project are currently at an early stage of evaluation and no mineralized material or reserve estimates have been made at any of our Projects. As of the date of this Report, except for our planned Phase III Drill Program of our Kibi Gold Trend located on our Apapam Project, there is no exploration activities currently being conducted on our other Projects or have any such activities been planned for the next 12 months, however, we may consider doing so at a later date. Prior to January 1, 2009, being the commencement of the fiscal year covered by this Report, we had completed preliminary lode gold exploration programs at our Banso and Muoso, Apapam and Edum Banso Projects and their respective results are noted hereunder. Except for our recovery of gold operations at our Kwabeng Project, we have not receovered or produced any gold at our Apapam, Pameng, Banso and Muoso and Edum Banso Projects.
Three concessions totaling 118.92 sq km; namely our Kwabeng Project, Pameng Project and our Apapam Project, which is located to the south of our Kwabeng and Pameng Projects, are contiguous to our Banso and Muoso Project.
Kwabeng and Pameng Projects
Access and Location
Access to our Kwabeng Project can be gained by driving northwest from the City of Accra on the Accra-Kumasi Trunk Road, which is the main paved national highway, for approximately 110 km until arrival at Anyinam. Make a left hand turn at the road sign that reads “Kwabeng” in the middle of the Town of Anyinam and drive southwest approximately 10 km until arrival at a sign reading “Xtra-Gold Mining” before reaching the town of Kwabeng.
Access to our Pameng Project can be gained by driving northwest from the City of Accra on the Accra-Kumasi Trunk Road, which is the main paved national highway, for approximately 125 km until arrival at the village of Pameng where there is a road sign reading “Pameng”. Make a left hand turn at the Pameng sign and drive southwest approximately 2 km to reach our Pameng concession. Our Pameng concession is located approximately 15 km south-southwest from our Field Camp.
Title to Properties
We hold 30-year mining leases expiring on July 26, 2019 on our Kwabeng and Pameng mining concessions (see “Mining Leases - Kwabeng and Pameng Projects”) and a 7-year mining lease on our Apapam mining concession expiring on December 17, 2015 (see “Mining Lease - Apapam Project”). Our interest in our Banso and Muoso Project is held in a prospecting license (see “Banso and Muoso Prospecting License”) and our interest in our Edum Banso Project is held through an option agreement (see “The Edum Banso Project - Option Agreement for Prospecting License”).
Historical Work
These two Projects have had very little exploration for lode source gold deposits; however, there has been detailed exploration for placer gold deposits. The Kwabeng, Pameng and Apapam Projects contain approximately 12,583,000 BCM with an average grade of 0.568 grams of gold/BCM. In addition to the mineralized material, there is potential to define reserves with further exploration.
The placer gold deposit currently located at our Kwabeng concession was mined by the former owner in the early 1990’s for 15 months and produced approximately 16,800 ounces of gold before operations were ceased due to mining difficulties as noted hereunder. The placer gold is contained in a gravel deposit distributed across the floor of the river valleys west of the Atewa Range which can easily be excavated.
Field Camp at Kwabeng Project
In addition to the three mining leases, XG Mining owns the Wash Plant and the Field Camp which is a functional living compound for mining personnel and is also comprised of offices and facilities for stores, engineering and exploration activities. Our Wash Plant and our Field Camp are located on the property included in our Kwabeng concession, close to the town of Kwabeng.
Former Ownership
In the early 1990’s, the former mining lessee invested approximately $24,000,000 to open and operate a mine at the Kwabeng concession. The mining operation lasted for 15 months and 16,800 ounces of gold was produced before the mine was shut down due to a poor gold price, mining methodology and a lack of funds to continue mining operations.
- 14 -
Bulk Test
We completed the Bulk Test of the mineralized material located at our Kwabeng Project on March 25, 2007. During the Bulk Test, we collected, processed, analyzed and sold the gold recovered from the Bulk Test. We obtained the necessary approvals and permits from the Ghanaian government authorities prior to commencing the Bulk Test.
Mining Leases – Kwabeng and Pameng Projects
Our subsidiary, XG Mining, which is owned by us as to a 90% interest, entered into two individual mining leases on July 26, 1989 with The Government of the Republic of Ghana (the “Government of Ghana”), which holds a 10% interest in XG Mining, covering an area of 44.76 sq km with respect to the Kwabeng concession and 40.51 sq km with respect to the Pameng concession (collectively, the “Lease Area”), located in the East Akim District of the Eastern Region of the Republic of Ghana. These mining leases have a 30 year term expiring on July 26, 2019. We have been granted surface and mining rights by the Government of Ghana to work, develop and produce gold in the lease area (including processing, storing and transportation of ore and materials). With respect to each mining lease, we are: (i) required to pay applicable taxes and annual rental fees of approximately $15 to the Government of Ghana; and (ii) committed to pay a royalty in each quarter through the Commissioner of Internal Revenue based on the production for that quarter within 30 days from the quarter end as well as a royalty on all timber felled in accordance with existing legislation. Under the terms and conditions of each mining lease, we are required to furnish to the Secretary for Lands and Natural Resources (now the Minister of Lands, Forestry and Mines), the Chief Inspector of Mines (now the Head of the Inspectorate Division of the Minerals Commission) (the “HIDMC”), the Chief Executive of the Minerals Commission and the Director of Geological Survey (now the Director of Ghana Geological Survey (the “DGGS”) (collectively referred to as the “Government Authorities”) (i) a report in each quarter not later than 30 days after the quarter end in connection with quantities of gold won, quantities sold, revenue received and royalties payable for that quarter; (ii) a report half-yearly not later than 40 days after the half year end to the aforementioned government authorities summarizing the results of operations in the Lease Area during the half year and technical records to be maintained by the company as particularly set forth in the respective mining leases (the “Technical Records”), which report shall further contain a description for any geological or geophysical work carried out by the company during that half year and a plan upon a scale approved by the Head of the Inspectorate Division of the Minerals Commission showing mine workings and dredging areas; (iii) a report not later than 60 days after the end of each financial year to the Government Authorities (except for the DGGS) summarizing the results of its operations in the Lease Area during that financial year and the Technical Records, which report shall further contain a description of the proposed operations for the following year with an estimate of the production and revenue to be obtained; (iv) a report not later than three months after the expiration or termination of the respective mining leases, to the Government Authorities, giving an account of the geology of the Lease Area including the stratigraphic and structural conditions and a geological map on a scale prescribed in the Mining Regulations; (v) a report to the Government Authorities (except for HIDMC and DGGS) of any proposed alteration to its regulations and a report of the particulars of any proposed transfer of any share of its capital stock representing 1% of more of the total number of issued and outstanding shares; (vi) a report to the Government Authorities on the particulars of any fresh share issuance or borrowings in excess of an amount equal to the stated capital of XG Mining; and (vii) having regard to items (v) and (vi), these reports shall be submitted not less than 60 days in advance of the proposed alteration, transfer, issue or borrowing; (viii) a copy of XG Mining’s annual financial reports including a balance sheet, profit and loss account and notes thereto certified by a qualified accountant who is a member of the Ghana Institute of Chartered Accountants not later than 180 days after the financial year end to the Government Authorities (except for HIDMC and DGGS); and (ix) such other reports and information in connection with our operations to the Government Authorities as they may reasonably require. We are entitled to surrender all or any part of our interest in the lease area upon providing proper notice to the Government of Ghana. We have the right to terminate our interest in each mining lease if the subject mine can no longer be economically worked, by giving not less than nine months’ notice to the Government Authorities, without prejudice to any obligation or liability incurred prior to such termination. The Government of Ghana has the right to terminate our interest in the mining leases if (i) we fail to make payments when due; (ii) contravene or fail to comply with terms and conditions of mining lease (however, we have three months to remedy from the notice of such event); (iii) become insolvent or commit an act of bankruptcy; or (iv) submit false statements to the Government Authorities.
The mining leases further provide that XG Mining shall report forthwith to the Government Authorities in the event it discovers any other minerals in the Lease Area, who in turn will provide XG Mining with the first option to prospect further and to work the said minerals subject to satisfactory arrangements made between XG Mining and the Government Authorities.
Recovery and Sale of Gold
As of December 31, 2009, we have sold an aggregate of 8,814.82 ounces of gold recovered from the mineralized material at our Kwabeng Project. We do not have an exclusive agreement with any company or entity to buy the gold that we recover.
- 15 -
Resumption of Recovery of Gold Operations
We do not plan to resume recovery of gold operations at our Kwabeng Project. As stated elsewhere in this Report, we plan to focus our efforts and our financial resources primarily on planned exploration activities of the Kibi Gold Trend located on our Apapam Project, in particular, we have planned the Phase III Drill Program at this Project (see “The Apapam Project – Future Exploration Activities”). With respect to any mineralized material at our Kwabeng Project, we plan to enter into negotiations with independent Ghanaian contract miners and operators to assume such operations at this Project on fixed payment terms to our company. Also, the current gold price (approximately $1,100 per ounce) is significantly greater compared to the gold price during the previous mining effort by the former operator of this Project (approximately $300 per ounce). On the basis of an annual recovery of gold of approximately 360,000 BCM, we anticipate that recovery of gold operations could be sustained for 20 years, however, this will depend upon numerous factors including the grade and commercial recoverability of the mineralized material and the selling gold price at the relevant time.
Ancillary Operations
|
|
Kwabeng Field Camp |
Our company already possesses our fully operational and well maintained Field Camp comprised of an administrative office, living quarters and workshop facilities located on our Kwabeng concession which is accessible by paved road located approximately 2 hours drive from the capital city of Accra. Our Field Camp is the base of operations for the majority of our administrative activities and all of our exploration activities. All of our senior staff is accommodated in the Field Camp with our junior staff located in the surrounding towns and villages. XG Mining has rehabilitated the Field Camp which included installation of a communication system for Internet access, electronic mail, telephone and facsimile service and minor construction repairs. Our Field Camp is within cell phone coverage and is supplied with electricity from the national power grid, which lines run along the road accessing our Field Camp.
|
|
Fuel and Spare Parts Supply |
We deliver fuel from Accra by tanker and discharge the fuel into and store the fuel in the fuel tank facility located within our Field Camp. We purchase spare parts for all of our equipment either locally or from suppliers overseas and store such parts in the secure spare parts warehouse located at our Field Camp.
|
|
Workspace |
There is adequate office space at our Field Camp to accommodate our administrative, geology, surveying, equipment maintenance and other departments, as well as their technical support and our laborers.
|
|
Equipment Purchases |
During 2009, we purchased a new excavator to carry out trenching and drill pad activities.
|
|
Equipment Maintenance |
Any maintenance of our excavator, or other equipment which we may own, will be carried out in the workshops located within our Field Camp.
Capital Expenditures
We do not anticipate any capital expenditures in the next 12 months in connection with recovery of gold operations as we have not planned to conduct such operations during this period. As stated elsewhere in this Report, we plan to negotiate with independent Ghanaian contract miners and operators to resume such operations.
Banso and Muoso Projects
Our Banso and Muoso Projects consist of two concessions totaling 107.32 sq km. We hold one prospecting license, as more particularly described hereunder, for the Banso and Muoso concessions which are situated in the Eastern Region of Ghana approximately 80 kilometers north of Accra. These concessions lie in the Kibi-Winneba Gold Belt on the western flanks of the prominent Atewa Range, which is underlain by Birimian greenstone, phyllites, meta-tuffs, epi-diorite, meta-greywacke and chert. The valleys, over which the concessions are located, are underlain by thick sequences of Birimian metasediments. The north-western end of the Atewa Range is the type-locality for the Birimian metasediments and metavolcanics.
- 16 -
This area is one of the oldest placer gold mining areas of Ghana, dating back many centuries. Historical exploration and mining has mainly focused on placer gold. Prior to our acquisition of the Banso and Muoso concessions, to the best of our knowledge and based on mining records in Ghana, there has never been a detailed documented bedrock exploration program conducted on these concessions.
Our Banso and Muoso Project is at an early stage of evaluation and no mineralized material or reserve estimates have been made. Prior to the period covered by this Report, we had completed preliminary lode gold exploration programs including grid establishment, soil sampling, prospecting/geological mapping, pitting/trenching and geophysics, aimed at identifying lode gold (hardrock) mineral occurrences at our Banso and Muoso Project, the results of which are noted hereunder. From December 1, 2009 to February 20, 2010, we conducted a 546 linear-meters trenching program at our Muoso Project. Details of the trenching program are noted below under “Ankaase Trench 2009 Trenching Program”.
Access and Location
|
|
Muoso Concession |
Access to the Muoso Concession is gained by driving northwest approximately 80 km from Accra on the paved Accra-Kumasi Trunk Road. This highway passes through the easternmost portion of the Muoso concession and shares a common boundary with the Kwabeng Concession. From the town of Osino, one would drive northwest approximately 5 km to the town of Anyinam, from which an all weather direct road heads south through the centre of the Muoso Concession and onto the Banso Concession, approximately 15 km south of the Accra-Kumasi Trunk Road. The town of Muoso is approximately 10 km from Anyinam. A number of dirt roads, trails and footpaths offer additional access to this concession. Our Project is located approximately 10 km south-southeast from our Field Camp.
|
|
Banso Concession |
Access to the Banso Concession is gained by driving northwest approximately 136 km from Accra on the paved Accra-Kumasi Trunk Road. Our Project is located approximately 11 km south-southwest from our Field Camp.
Banso and Muoso Prospecting License
Our wholly-owned subsidiary, XGEL entered into a prospecting license with the Government of Ghana on September 24, 2001 covering a licensed area of 107.32 sq km (the “Banso and Muoso Licensed Area”). The current term of the prospecting license has been extended to December 21, 2010 on approval by Min Com. A further application for renewal of the prospecting license, requires our submission of (i) a comprehensive terminal report, including logs of pits and assay results; (ii) a detailed financial report; (iii) a site plan indicating the areas to be retained and those to be shed off; (iv) evidence of annual ground rent payments; and (v) an environmental permit from the EPA. Under the prospecting license, we have been granted the right and license by the Government of Ghana to conduct geological and geophysical investigations in the licensed area to determine adequate quantity of geologically proven and mineable reserve of gold and diamonds (directly or through agents, contractors or sub-contractors). The terms and conditions of the prospecting license include, among other things, our requirement to (i) conduct a preliminary pitting program (Phase I); (ii) conduct a reserve definition program (Phase II); and (iii) prepare an engineering/feasibility report (Phase III); (iv) provide an annual report in prescribed form within 60 days after each calendar year to various mining regulatory bodies and government authorities (collectively, the “Authorities”). We have the right to (i) assign or mortgage our interest in the prospecting license, subject to obtaining the consent of the Government of Ghana who may impose certain conditions in connection therewith; (ii) surrender our interest in the prospecting license; and (iii) renew the term of the prospecting license for a license for a period of two years or such other renewal period may be granted in accordance with applicable mining laws of Ghana. The Government of Ghana has the right to terminate the prospecting license in the event we (i) fail to make payments when due; (ii) contravene or fail to comply with terms and conditions of the prospecting license; (iii) become insolvent or commit an act of bankruptcy; or (iv) submit false statements to the Government of Ghana. In any of the foregoing events, we have 21 days in which to remedy any of these occurrences. If upon expiration of prospecting license, we have fulfilled our obligations and have established to the Government of Ghana that development of a mine from ore reserves established within the licensed area is economical and financially feasible, the Government of Ghana shall grant us with first option to (i) acquire a lease for purposes of mining in the licensed area of the Banso and Muoso Project; and ii) participate in a mining project in the licensed area, subject to negotiation with the Government of Ghana of satisfactory terms for such license and participation.
- 17 -
Regional Exploration Program
On July 4, 2004, we commenced the first exploration stage on these concessions with fieldwork ending on August 23, 2004. We contracted with CME & Company (“CME”) to conduct the exploration program. Fieldwork included stream sediment sampling, line cutting, GPS surveying of the grid and soil sampling. Acquisition and interpretation of airborne geophysical data and satellite imagery was also undertaken.
Results
Results from the first phase of exploration evidenced a bedrock gold source within both the Banso and Muoso concessions. Silt sampling indicated significant gold values, with soil sampling showing several significant anomalous zones. The gold-in-soil anomalies appear to correlate with an interpreted contact between the Birimian volcanoclastics and metasediments.
Further Exploration Work
On April 27, 2005, we further contracted with CME to conduct a second stage exploration program at our Banso and Muoso Project located at the Banso and Muoso concessions. The work program included detailed grid establishment and soil sampling, ground magnetometer surveying, updating the geodatabase and recommendations for future work. The purpose of this program was to determine areas of gold mineralization at the Banso and Muoso concessions that can be followed up with induced polarization (“IP”) surveys, trenching and diamond drilling.
Fieldwork included the following:
Grid Establishment
Grid placement was based on the results from the 2004 regional work program. Four grids were established in the areas of primary interest, one on the Muoso concession and three on the Banso concession. The grids on the latter concession are referred to as Area 1, Area 2 and Area 3.
Soil Sampling
Soil sampling was undertaken along all grid lines established during this work program. From the 6,961 established stations, 177 locations were not sampled due to possible contamination from villages, streams and/or swamps.
A total of 6,516 samples were submitted for gold and 6,066 samples for arsenic analyses. A breakdown of the gold results per property area includes:
|
|
● |
Muoso Grid |
3,318 |
|
|
● |
Banso Area 1 Grid |
1,560 |
|
|
● |
Banso Area 2 Grid |
696 |
|
|
● |
Banso Area 3 Grid |
942 |
Results, Interpretation and Conclusions
Soil sample geochemistry has been completed over selected portions of the anomalous zones indicated by the 2004 regional sampling program. Work during the 2005 program suggests the presence of a bedrock source within both the Muoso and Banso concessions.
Values greater than the threshold value (mean + 2 standard deviations) of 0.063 ppm gold are considered to be anomalous. The term “ppm” represents “part per million” where 1 ppm = 1 gram per tonne (g/t) = 1,000 part per billion (ppb). On the Muoso concession 284 samples (9%) out of the 3,318 samples submitted for gold analyses yielded values greater than the threshold value; while at Banso 152 samples (5%) out of the 3,198 samples submitted for gold analyses yielded values greater than the 0.063 ppm Au threshold value.
At the southwest boundary of the concession several gold-in-soil anomalies appear, the largest of which measures 350 meters in length and up to 300 meters in width. Immediately below this is an easterly trending anomaly with a strike length of approximately 300 meters and a width of approximately 75 meters.
- 18 -
At Muoso the most significant gold-in-soil anomalies occur along the inferred location of the northeast-southwest trending dolerite dyke. Secondary anomalies occur to the east of this dyke and are oriented sub-parallel to the strike of the dyke. These may represent possible structural events (shears/faults) lying along geological contacts (planes of weakness). In the southwest portion of the grid, a possible north-south to northwest-southeast trending gold anomaly is coincident with inferred faulting in similar directions. In the southwestern area of the Muoso grid, two of the arsenic anomalies flank the sides of the north-south trending gold anomaly.
At Banso, each of the three grids outlined two gold-in-soil anomalies. The Area I anomalies trend northwest-southeast and occur at the junction of cross cutting structures. Within Area 2 and 3, linear gold anomalies trend northeast-southwest, parallel to the regional geological trend. The western most gold anomaly in Area 3 flanks the margins of a strong magnetic high (possible intrusive). Arsenic anomalies at Banso typically occur on hill/ridge tops with the gold anomalies flanking the sides of the arsenic anomalies.
The soil sampling program at Banso was successful in locating a number of gold-in-soil anomalies (> 0.063 ppm Au), the most significant of these is located about 400 meters NE of Abesim Township (i.e. Area 3). This anomalous zone has an average width of about 50 meters and a length of about 500 meters and follows the northeasterly regional geological trend.
Recommendations
The following staged exploration program was recommended to further advance the geological knowledge of the concessions:
|
|
● |
An estimated 200 kilometers of grid to be cut at Muoso and Banso. This will include the extension of selected existing lines and the establishment of new ones. In addition, soil sampling, geochemical analysis, GPS and ground magnetometer surveys should be conducted on the newly established grid lines. |
|
|
● |
A grid should be established within the eastern areas of the Muoso concession, and soil samples collected, to follow up on anomalous silt samples taken in the previous sample program. |
|
|
● |
At Banso, a grid should be cut within the northern portion to cover those areas that returned anomalous silt samples. Additional soil sampling is proposed to confirm and further define the anomalous area. |
|
|
● |
Auger sampling to depths of 2.5 meters should be conducted on both concessions testing sites that returned greater than 0.1 ppm gold in soils. |
|
|
● |
Trenches are recommended at selected sites at both concessions to investigate gold-in-soil anomalies and the relationship the anomalies have to geology/structure. An estimated 300 meters of trenching, to 3.0 meter depth, is recommended. |
|
|
● |
Approximately 50 line kilometers of surface IP surveying may be carried out on priority areas as identified in previous sampling/work programs. |
Phase II Exploration Program
We entered into a Phase II exploration contract in September 2006 with CME incorporating some of the above recommendations, including additional grid establishment, soil geochemical surveying, and prospecting on the Muoso concession; and a pitting/trenching program designed to test the geochemical signature at depth of the three primary gold-in-soil anomalies detected on the Banso concession by the Phase I exploration program (i.e. Banso Area 1, 2, 3).
The work program for this project was completed in December 2006 at a cost of approximately $200,000. The results of this program are noted hereunder.
The Phase II exploration program commenced on September 27, 2006 with fieldwork ending December 2, 2006 on the Muoso and Banso Concessions. Work included the following:
|
|
● |
Grid establishment (Muoso Concession): 67.4 line-km; |
|
|
● |
Soil sampling: 2,338 samples collected, 1,438 sample submitted for gold analysis; |
|
|
● |
Rock sampling: 177 samples; |
- 19 -
|
|
● |
GPS surveying: 67.4 km; |
|
|
● |
Trenching and pitting (Banso Concession): 4 trenches (80.2 meters) and 61 pits, 183 horizontal channel samples, 197 vertical channel samples, 24 rock samples. |
|
|
Muoso Concession Soil and Rock Sampling |
|
|
(A) |
Grid Layout / Soil Sampling Methodology |
The soil sampling program encompassed a combined semi-detailed (200m) and detailed (100m) soil sampling grid (67.4 km) covering the eastern 5.5 km portion of the Muoso concession. Grid placement was designed to cover the Birimian volcanic-sediment contact and an inferred NE - trending regional structure; which we believe represent highly favorable environments for the hosting of lode gold deposits throughout Ghana.
A total of 2,338 soil samples were collected from all cross lines with 1,438 samples submitted for gold analyses. All samples collected from the 100 meter spaced lines were submitted for analysis. Along 200 meter spaced lines, every second sample was submitted for analysis. The held back samples may be submitted at a later date to bracket any anomalous samples. Rock sampling was undertaken concurrent with the soil sampling program. A total of 166 rock samples were collected at Muoso with sample collection typically confined to the immediate vicinity of grid lines.
|
|
(B) |
Soil / Rock Sampling Results |
Soil sampling from the program extended the grid to the east and identified significant geochemical anomalies over this portion of the concession. Values greater than the threshold value (mean + 2 standard deviations) of 0.10 ppm gold are considered to be anomalous. The term “ppm” represents “part per million” where 1 ppm = 1 gram per tonne (g/t) = 1,000 part per billion (ppb). 152 samples (11%) out of the 1,438 samples submitted for gold analyses yielded values greater than the 0.10 ppm gold threshold value; including 53 samples (4%) returning values greater than 0.20 ppm gold. Contouring of the gold in soil results suggests an “S-fold” geochemical anomaly (> 0.10 ppm Au) in the very eastern part of the concession.
Rock sampling in the northern portion of the anomaly (around the highway) returned no significant results. The geochemical anomaly here is located in the valley of the Birim River and may be an alluvial (paleoplacer) occurrence.
Three (3) rock samples collected in the southern part of the anomaly yielded anomalous gold values from oxidized quartz and phyllite floats. These rock floats are located up on the hillsides in the soil anomaly, well out of any obvious alluvial influence, thus indicating the potential for lode gold mineralization in the vicinity.
A second linear anomaly (> 0.10 ppm Au) is present, extending 4.5 km in an ESE direction from 9000E/18800N to 12750E/21200N. The anomaly is narrow (100 to 150 meters) and tends to occasionally pinch-out. Airborne geophysical and LANDSAT interpretation (Naas, 2004) identifies a possible correlating ESE-trending structure (fault?) although it requires extending that structure to the east. Another interpreted structure, trending SE may intersect the aforementioned structure in the area of the previously described geochemical anomaly.
Banso Pitting / Trenching Program
|
|
(A) |
Pit / Trench Program Design and Sampling Methodology |
A pitting - trenching program was carried out to test the geochemical signature at depth of the three primary gold-in-soil anomalies detected on the Banso concession by the Phase I exploration program (i.e. Banso Area 1, 2, 3). Single sample anomalies were pitted, while two or more continuous soil sample anomalies were trenched.
- 20 -
Pits were dug manually by pickaxes and shovels; with pit dimensions typically being 1 meter wide by 2 meters long by 3 meters deep. Two horizontal samples and three vertical samples were collected from all the pits that reached the saprolite. Only vertical samples were collected from pits that did not reach saprolite. Grab and chip samples were also collected from quartz veins and veinlets. A total of 305 samples were collected from 61 pits excavated according to the following distribution in the Area 1, 2, and 3 gold-in-soil anomalies.
|
|
● |
25 pits (125 samples) from Area 1; |
|
|
● |
13 pits (65 samples) from Area 2; and |
|
|
● |
23 pits (115 samples) from Area 3. |
Trenches were also dug manually to a width of one meter and an average depth of 3.0 meters. The four trenches excavated on the Area 3 anomaly consisted of one 50 meter trench and three 10 meter trenches. All trenches encountered saprolite. A total of 80 horizontal samples were collected at 1 meter intervals approximately 0.20 meter above the trench floor.
|
|
(B) |
Pitting / Trenching and Rock Sampling Results |
The current pitting - trenching program tested the gold-in-soil anomalies in the subsurface, preferably in the saprolite horizon.
Area 1 / Area 2
Two pits out of the 25 pits excavated in Area 1 and one pit out of the 13 pits in Area 2 returned anomalous gold results. But these anomalous values reflect auriferous quartz gravels of probable alluvial provenance.
Area 3
Pitting - trenching and surface rock sampling in the eastern portion of the Area 3 grid returned exploration - significant results indicative of potential lode gold mineralization in the vicinity.
Vertical sampling in Pit 3P2 returned a length weighted average grade of 1.36 ppm Au over 1.70 meters and horizontal sampling yielded a length weighted average grade of 1.69 ppm Au over 2.10 meters. The term “ppm” represents “part per million” where 1 ppm = 1 gram per tonne (g/t) = 1,000 part per billion (ppb). A 0.4 meter channel sample across a vein present in this pit returned 0.75 ppm Au. Pit 3P6 returned exploration - significant results of 1.91 ppm over 1.00 meters (vertical) and 1.74 ppm Au over 1.00 meters (horizontal). The former is from the upper (near-surface) horizon. The latter appears associated with quartz veining observed in the saprolite. Quartz veins were mapped in many pits and are generally associated with the anomalous gold values, though the converse is not necessarily true.
The four trenches (3T1 to 3T4) were excavated along a single line (1400N) between 11570E and 11680E. Eleven samples (14%) out of the 80 channel samples (1 meter) collected from the four (4) trenches yielded anomalous gold values (> 0.10 ppm Au). Trench sampling returned similar sub economic but exploration - significant results as with the pits. Trench 3T4 yielded a length weighted average grade of 0.41 ppm Au over 4.0 meters; with the mineralization appearing to be associated with a quartz vein oriented at 324 (degree)/30 (degree) E. A similar modest mineralized zone in 3T3 of 0.16 ppm Au over 4.00 meters is associated with a quartz vein stringer zone oriented similarly at 315 (degree)/30 (degree) E. In 3T2, a zone returning 0.29 ppm Au over 2.00 meters appears associated with veins oriented at 220 (degree)/50-58 (degree) W. Structural understanding based on the limited vein exposure precludes any conclusions at this point.
Rock sampling (11 samples) in the vicinity of the trenches and pits returned three (3) anomalous gold values from massive quartz boulders. This suggests a potential lode source for gold in this area.
- 21 -
|
|
(C) |
Recommendations |
Recommended work to further advance the project includes:
|
|
(I) |
The gold-in-soil anomalies of the Muoso Concession should be pitted and trenched where consecutive anomalies exist; |
|
|
(II) |
A total of 10 kilometers of soil sampling is recommended at the Banso Concession. This includes the extension of selected existing lines and the establishment of new ones; and |
|
|
(III) |
Rock sampling should continue throughout the Concessions. |
2008 Banso – Muoso Target Follow Up Program
Exploration work on the Banso-Muoso prospecting license during the 2008 reporting period was aimed at advancing the lode gold targets produced by the Phase I (2005) and Phase II (2006) work programs. Work focused on the further evaluation of the Banso Area 3 and Ankaase gold-in-soil anomalies located at the southern extremity of the Banso, and eastern extremity of the Muoso concessions, respectively.
The Banso concession was subjected to manual trenching and soil geochemistry on an intermittent basis from late November 2007 to May 2008, while hand auger sampling and trenching programs were implemented at the Muoso concession on an intermittent basis from February to November, 2008. All geotechnical field work such as mapping and sampling was conducted in-house by XGEL personnel. Grid establishment (line cutting) and manual trench excavation was conducted on a contract basis by Amofah and Associates of Accra and Andaco Enterprises Limited of Kwabeng, respectively.
All gold results for the following exploration programs are reported in “ppm Au” (part per million gold). The term “ppm” represents “part per million” where 1 ppm = 1 gram per tonne (g/t) = 1,000 part per billion (ppb).
Banso Concession Exploration Activities
Banso Area 3 Trenching
Three hand-dug trenches totaling 138 meters were excavated on the Banso Area 3 gold-in-soil anomaly located at the southeastern extremity of the Banso concession. Trenches Nos. TAB001 to TAB003 were excavated in a north-south direction, across the Phase II (2006) trenching located along the L1400N gold-in-soil anomaly, to test the subsurface expression of an extensive ENE-trending quartz float train discovered during prospecting. Trenches TAB002 and TAB003 form a continuous trench extending over a 112 meter length. A total of 69 horizontal channel samples were collected at 2 metre intervals, with shorter samples utilized in areas of geological interest (i.e. quartz veining).
Trenches TAB002 – TAB003 exposed a system of intermittent, ENE-trending, quartz veining extending over a 80 meter trench-length, including a 10 meter zone encompassing three parallel quartz veins ranging from 0.25 meters to 0.35 meters in width, within the northern portion of TAB002. Two of the quartz veins yielded significant gold values of 4.64 ppm and 7.67 ppm over true-widths of 0.25 meters and 0.28 meters, respectively. The TAB002-TAB003 trench yielded intermittent, anomalous gold values over it’s entire 112 meter length. Including exploration significant intervals of 0.19 ppm gold over 46 meters and 0.22 ppm gold over 16 meters.
Banso Area 3 Soil Sampling
The Banso Area 3 gold-in-soil anomaly was covered by a new, detailed (100 m), north-south oriented, soil geochemistry grid designed to better define the ENE-trending, gold-bearing quartz vein system discovered in trenches TAB002 and TAB003. A total of 460 soil samples were collected at 25 meter intervals along the 12.625 line-kilometers of cross lines. Including the Regional Exploration (2004) and Phase II (2005) work programs a total of 1,702 soil samples have been collected on the Banso Area 3 grid.
The anomalous threshold for the soil sample results was set at 0.05 ppm gold based on past work experience in the Kibi Belt. 205 (12%) out of the 1,702 soil samples returned gold values greater than the 0.05 ppm anomalous threshold, including: 43 (2.5%) samples over 0.25 ppm; 22 (1.3%) samples over 0.50 ppm; and 14 (0.8%) samples over 1.0 ppm gold.
- 22 -
The combined soil geochemistry surveys outlined three parallel, ENE-trending, gold-in-soil anomalous trends across a 600 meter distance. The gold-in-soil anomalies (> 0.05 ppm Au), ranging from 50 meter to 150 meter in width, tend to be patchy in nature and / or pinch-out along their 600 meter to 1,500 meter trend-extents. The northernmost anomalous trend exhibits a good correlation with the quartz vein system identified in trenches TAB002-TAB003.
Muoso Concession Exploration Activities
Ankaase Trend Auger Sampling
As a follow up to the Phase II (2006) soil geochemistry survey, a hand-auger program was implemented on the Ankaase gold-in-soil anomaly located at the eastern extremity of the Muoso concession. The auger sampling was designed to test the geochemical signature of the gold-in-soil anomalies at depth within the saprolite horizon in order to better define trenching targets. A total of 99 sites, totaling 371 linear-meters, were augered to an average depth of approximately 3.75 meters (5m max.). A one (1) meter sample was collected from the saprolite horizon at the bottom of each hole. Auger hole spacing was typically at 25 meters, with some 12.5 meter infilling.
The anomalous threshold for the auger sample results was set at 0.10 ppm gold based on past work experience in the Kibi Belt. 21 (21%) out of the 99 auger samples returned gold values greater than the 0.10 ppm anomalous threshold; including 4 samples over 0.5 ppm and a maximum value of 2.46 ppm. The auger sampling proved to be an efficient trench target definition method.
Ankaase Trend 2008 Trenching Program
The 2008 scout trenching program encompassed 19 hand dug trenches, ranging from 8 meters to 236 meters in length and from 1.5 meters to 3.5 meters in depth, and totaling 805 linear meters. The reconnaissance trenching was designed to test the geochemical signature at depth, within the in situ saprolite (oxidized rock) horizon, of the southern half (1.4 km) of the extensive Ankaase Gold Trend; an over 3.5 km long, NE-trending, anomalous gold-in-soil trend characterized by the widespread occurrence of auriferous quartz floats.
This initial reconnaissance trenching program yielded very encouraging results and confirmed that the extensive Ankaase gold-in-soil trend is spatially associated with a typical “Ashanti” style shear zone setting developed proximal to a Birimian metavolcanic-metasediment contact with associated Belt granitoids.
A total of 511 horizontal channel samples were collected from a canal excavated along the bottom sidewall of the trench (~ 0.10m above floor). Samples were typically 2 metres in length, with shorter (1 m) samples utilized in areas of geological interest (i.e. quartz veining). 85 (17%) out of the 511 channel samples returned gold values greater than 0.5 ppm, including: 52 (10%) samples over 1.0 ppm; and 20 (4%) samples over 3.0 ppm gold.
Nine (9) out of the 19 trenches yielded significant gold intercepts as presented in Table 1; with an additional seven (7) trenches yielding anomalous, exploration significant gold values; and three (3) trenches failing to return any anomalous gold values.
Table 1: Significant Trench Specifications – Ankaase Gold Trend
|
Trench ID |
From (meters) |
To (meters) |
Trench Length (meters) (1) |
Gold (2) (ppm) |
|
|
| |||||
|
TMU001 |
17.00 |
25.00 |
8.00 |
2.08 |
|
|
including |
17.00 |
21.00 |
4.00 |
3.59 |
|
|
TMU002 |
42.00 |
44.00 |
2.00 |
13.70 |
|
|
TMU004 |
4.00 |
22.00 |
18.00 |
1.75 |
|
|
including |
19.00 |
20.00 |
1.00 |
9.37 |
|
|
TMU004 |
47.00 |
58.00 |
11.00 |
1.24 |
|
|
including |
48.00 |
52.00 |
4.00 |
2.75 |
|
|
TMU005 |
0.00 |
62.00 |
62.00 |
0.43 |
|
|
including |
2.00 |
26.00 |
24.00 |
0.63 |
|
|
TMU008-010 |
N/A |
N/A |
24.00 |
1.79 |
|
|
including |
|
|
1.00 |
7.00 |
|
- 23 -
|
Trench ID |
From (meters) |
To (meters) |
Trench Length (meters) (1) |
Gold (2) (ppm) |
|
|
TMU015 |
0.00 |
15.00 |
15.00 |
1.06 |
|
|
including |
8.00 |
12.00 |
4.00 |
2.16 |
|
|
TMU016 |
20.00 |
26.00 |
6.00 |
4.73 |
|
|
TMU019 |
15.00 |
29.00 |
14.00 |
2.08 |
|
|
including |
16.00 |
20.00 |
4.00 |
6.52 |
|
|
including |
18.00 |
19.00 |
1.00 |
10.95 |
|
|
(1) |
Reported intercepts are trench-lengths; true width of mineralization is unknown at this time. |
|
(2) |
The term “ppm” represents “part per million” where 1 ppm = 1 gram per tonne (g/t). |
|
Note: |
Trenches #TMU003, 011, 012, 013, 014, 017 and 108 yielded anomalous, exploration significant gold value. Trenches #TMU006, 007 and 009 yielded no anomalous gold values. |
Trenching to date has intermittently traced an approximately 150 meter to 200 meter wide, NE-trending deformation zone over an approximately 1.4 km strike length. This structural corridor is characterized by several sub parallel, shear hosted, gold-bearing quartz vein zones ranging from less than 1 meter to approximately 24 meters in trench length; with individual quartz veins ranging from less than 1 cm to 5.5 meters in trench length. A granitoid body exhibiting widespread, low grade gold mineralization (0.43 ppm gold over 62 meters) exposed within trench TMU005 at the southwestern extremity of the Ankaase Gold Trend is also of significant exploration interest.
Ankaase Trend 2009-2010 Trenching Program
The 2009-2010 trenching program encompassed 12 hand dug trenches, ranging from 30 meters to 68 meters in length and from 1.2 meters to 3.5 meters in depth, and totaling 546.0 linear meters. This trenching program commenced on December 1, 2009 and was completed on February 20, 2010. By the end of 2009, five trenches totaling approximately 208.0 meters had been excavated and channel sampled. The reconnaissance follow-up trenching was designed to better define the structural controls of the mineralization identified during the initial 2008 scout trenching program. As at the date of this Report, we are currently in the process of compiling and interpreting the trench geological and analytical result data.
Future Exploration Activities
While we have not planned any exploration activities during the next 12 months, additional trenching and geophysics may be planned to better define the structural controls of the known mineralization and to test the northern half (approximately 1,700 meters) of the Ankaase Trend.
Resources
No ore resources have been identified on our Banso and Muoso Projects.
The Apapam Project
Access and Location
Our Apapam Project concession lies within the Kibi-Winneba area in the Eastern Region of Ghana and is located on the eastern flank of the Atewa Range along the headwaters of the Birim River in the immediate vicinity of the district capital of Kibi, approximately 75 km NNW of the nation’s capital city of Accra. Access to our Apapam Project is by driving northwest from Accra on the paved Accra-Kumasi Trunk Road which is the main national highway for approximately 90 km until the town of Kibi, marked by a road sign, is reached. One would make a left hand turn at the Kibi sign and drive southwest for approximately 5 km to arrive at our Apapam concession. A tarred road emanating from the Accra-Kumasi Trunk Road approximately 15 km northeast of Kibi dissects the north-central and south-eastern portions of our concession, while the tarred road servicing the town of Apapam provides access to the concession’s south-western extremity. Our Apapam Project is located approximately 20 km south-southeast from our Field Camp.
The Kibi-Winneba area is characterized by a narrow sequence of Birimian metavolcanics underlying most of the Atewa Range, which is covered by an extensive laterite/bauxite capping, and surrounded by a thick package of Birimian metasediments dominating the flanks and the lower lying areas. Our Apapam Project covers the Birimian volcanic-sediment contact which we believe represents a highly favorable environment for the hosting of lode gold deposits throughout Ghana.
- 24 -
Prior to the exploration work conducted by our company as noted hereunder, very little systematic exploration work for bedrock gold deposits has been conducted in the Kibi area since the 1930s.
Phase I Exploration Program
A first phase exploration program was implemented by geological consultant CME on the Apapam concession from August 12 to September 23, 2006. The Phase I exploration program undertaken in 2006 consisted of regional stream sediment sampling, followed by gridded soil sampling, rock sampling and detailed sampling of several adits located 400 meters northwest of Kibi. The work program for this Project was completed at a cost of approximately $100,000. The results of this program are noted hereunder.
In addition, a reconnaissance geology / prospecting program covering the west-central portion of the Apapam concession was also intermittently implemented by the Xtra-Gold exploration staff from November 2006 to February 2007. The results to date from the various surveys show very promising evidence for the presence of a bedrock gold source within the Apapam concession.
|
|
Phase I fieldwork consisted of the following: |
|
|
● |
Concession-wide stream sediment sampling survey (88 samples collected from 44 sites); |
|
|
● |
Survey grid establishment (33.78 line-km); |
|
|
● |
Soil sampling (1,306 samples); |
|
|
● |
GPS surveying (33.78 line-km); |
|
|
● |
Rock sampling (89 samples); and |
|
|
● |
Historical adit and bulldozer cut sampling (100 samples). |
Stream Sediment Sampling
A total of 88 samples were collected from 44 sample sites from two major streams and their respective tributaries; including 44 silt samples for geochemical analysis (BLEG) and 44 pan concentrate samples for visual gold grain counts.
Values greater than the threshold value (mean + 2 standard deviations) of 0.14 ppm are considered to be anomalous. Five (5) samples (11%) yielded values greater than the threshold value. Gold grain count of the pan concentrates showed visible gold grains in 36 of the 44 samples (82%); with the average gold grain count per sample being five (5) small grains.
The stream sediment anomalies are divided into two zones as follows:
Zone A (Adansu Anomaly): Consists of 1.5 km stretch from Line 158+00N westwards at an average width of 1.0 km along the northwestern boundary of the concession
Zone B (Kokorabo Anomaly): Consists of 3.0 km stretch by 2.0 km in width to cover the area between the southwestern boundary of the concession and the floodplains of river Birim and river Krensen
Soil Sampling Survey
A total of 1,306 soil samples were collected from 30.58 line - kilometers of cross lines established within the Kibi North and Kibi South survey grids. Grid location was based on testing historical mineral occurrences located on and around Kibi Mountain (Kibi North Grid) and promising silt samples results from creeks southeast of Kibi (Kibi South Grid). Line spacing was 100-meter interval within the Kibi Mountain area of the North Grid and 400 meters elsewhere within the gridded areas. Soil samples were collected at a depth of 60 cm at 25 meter intervals along the SE - NW trending grid lines. Soil samples were by analyzed by Fire Assay and reported in parts per billion (1 ppb = 0.001 ppm). The term “ppm” represents “part per million” where 1 ppm = 1 gram per tonne (g/t) = 1,000 part per billion (ppb).
The geochemical soil survey conducted on the Apapam concession produced several interesting gold-in-soil anomalies that are listed below. A geochemical trend of 050-060 (degree) (ENE-WSW) is in conformity with the regional geological trend. Values greater than the threshold value (mean plus 2 standard deviations) of 0.098 ppm gold are considered to be anomalous. A total of 105 samples (8% out of the 1,306 samples submitted for analysis produced gold-in-soil values greater than the threshold value of 0.098 ppm gold.
- 25 -
Area 1: The area consists of the following 50 meter to 125 meter wide anomalous zones extending over a minimum 200 meter distance on three (3) adjacent grid lines. The limits of this anomaly located on the northwestern flank of Kibi Mountain are well defined by the present soil survey.
|
|
● |
L163+00N, from 51+75E to 52+75E (100 meters), 5 samples average 0.12 ppm Au |
|
|
● |
L164+00N, from 51+75E to 53+00E (125 meters), 6 samples averaging 0.25 ppm Au |
|
|
● |
L165+00N, from 52+75E to 53+25E (50 meters), 3 samples averaging 0.21 ppm Au |
Area 2: The area is defined by three (3) 125 meter to 250 meter wide anomalous zones extending over a 600 meter distance on the following three (3) grid lines. Further detailed soil sampling is required to well define limits of the area.
|
|
● |
L166+00N, from 39+75E to 42+25E (250 meters), 11 samples averaging 0.27 ppm Au |
|
|
● |
L170+00N, from 44+00E to 45+75E (175 meters), 8 samples averaging 0.41 ppm Au |
|
|
● |
L172+00N, from 45+75E to 47+00E (125 meters), 6 samples averaging 0.30 ppm Au |
Area 3: This area consists of a single 225 meter wide gold-in-soil anomalous zone extending from 42+75E to 45+00E on L 158+00N (10 samples averaging 0.23 ppm Au). Further detailed soil sampling is required to well define limits of the area.
Area 4: This area consists of a single 100 meter wide gold-in-soil anomalous zone extending from 41+00E to 42+00E on L 170+00N (5 samples averaging 0.18 ppm Au). Further detailed soil sampling is required to well define limits of the area.
Rock and Historical Adit Sampling
A total of 89 rock (float) samples were collected during stream sediment and soil sampling traversing. In addition, three historical adits ranging from 7 to 85 meters in length and a bedrock face exposed along a bulldozer cut, located on and in the vicinity of Kibi Mountain were also sampled during the Apapam Phase I exploration program. A total of 77 channel samples were collected from the three adits and 23 samples from the bulldozer cut face. Rock and adit samples were analyzed by Fire Assay and reported in parts per billion (1 ppb = 0.001 ppm). Rock and adit samples returning greater than 1,000 ppb (1.0 ppm) gold were re-analyzed by Fire Assay with results reported in grams per metric tonne (1 g/t = 1.0 ppm). The term “ppm” represents “part per million” where 1 ppm = 1 gram per tonne (g/t) = 1,000 part per billion (ppb).
Seven (8%) out of the 89 rock (float) samples returned anomalous gold values greater than the threshold value (mean + 2 standard deviations). Three adits and a bulldozer cut were located and sampled during the current exploration program. Adit 1 was extensively sampled but no significant values reported. Adit 2 has indicated potential for lode gold mineralization in the Kibi Mountain area. Three (3) channel samples collected in this adit returned a length weighted average grade of 3.47 ppm Au over 3.80 meters; including 6.36 ppm over 1.7 meters. Adit 2 falls within the Area 1 gold-in- soil anomaly. No significant values were returned from Adit 3, although sampling was not able to reach the end of the adit due to unsafe ground conditions. The channel sampling (23 samples) of the bedrock face exposed in the bulldozer cut on the southwest side of Kibi Mountain returned a single anomalous value of 1.52 ppm Au over a 1.00 meter length.
Reconnaissance Geology / Prospecting Program
A reconnaissance geology / prospecting program covering the west-central portion of the Apapam concession was intermittently implemented by the Xtra-Gold exploration staff from November 2006 to February 2007. The program was initiated to follow-up on the anomalous gold-in-silt sample results returned by the 2006 concession-wide stream sediment sampling program (i.e. Zone A-Adansu Anomaly).
The reconnaissance program identified a 150 meter long, NW - trending gold anomalous float train located approximately 400m west-northwest of the anomalous gold-in-silt sample yielded by the Adansu stream. The rock floats typically consist of strongly silicified metavolcanic cross-cut by sheeted to stockworked quartz stringers exhibiting disseminated boxworks after pyrite.
An historical rock pit was also located within the west-central portion of the concession. Grab samples collected from sheared quartz-iron carbonate veining within the 3.5 meter deep pit returned anomalous gold values. This auriferous vein occurrence is located approximately 550 meters west-northwest of the open-ended Area 3 gold-in-soil anomaly described in the above Soil Sampling section.
- 26 -
Recommendations
Recommended work to further advance the project includes: (a) reconnaissance soil sample gridding for the evaluation of the two (2) anomalous areas defined by the stream sediment sampling, and the auriferous float train and rock pit areas identified during the in-house reconnaissance geology program; (b) and detailed soil sampling and / or pitting-trenching to further define the limits of the four (4) gold-in-soil anomalies and to test their geochemical signature at depth.
Phase II Exploration Program
A reconnaissance trenching program was intermittently implemented by the Xtra- Gold exploration staff from February 2007 to December 2007 on the Apapam concession. The trenching was carried out to test the geochemical signature at depth of the gold-in-soil anomalies detected within the north-western portion of the concession during the Phase I work program and to obtain additional geological / structural information in order to optimize the design of detailed trenching and drilling targets. A total of 542 channel samples were collected from 21 trenches totaling 1,090 linear-meters.
In order to obtain an independent assessment of the 2007 Xtra-Gold trenching results, a 43-101 compliant data verification program was undertaken by CME Consultants Inc. CI, a division of CME, from December 3 to 7, 2007. The program involved the resampling of selected trenches which yielded exploration-significant gold mineralization intervals. CMECI is a Canada-based geological consultancy with over 15 years of project management experience in Ghana. The Apapam data validation program was implemented under the direct supervision of a professional geologist registered with the Association of Professional Engineers and Geoscientists of British Columbia. The trenching program results noted hereunder correspond to the results returned by the independent CMECI data verification program.
Trenching; Methodology / Targets
A total of 21 trenches ranging from 2 meters to 224 meters in length were excavated by Xtra-Gold personnel within the north-western portion of the Apapam concession during the 2007 reconnaissance trenching program. A total of 542 channel samples (2 meters) were collected from the 21 trenches totaling 1,090 linear-meters. Trenches were manually excavated by pickaxes and shovels to a typical width of 1 meter and an average depth of 3 meters, with some sections of the trenches reaching 4.0 meters in depth. Trenching typically extended down to the saprolite horizon but locally the saprolite could not be reached due to safety concerns. Trench specifications are presented in Table 1 below.
The bulk of the trenching efforts, including 8 trenches totaling 834 linear-meters (approx. 75%), focused on testing the Area #1, #2, and #3 gold-in-soil anomalies detected during the 2006 Phase I work program. Five (5) trenches totaling 112 meters were excavated to test the subsurface along the train of gold anomalous rock floats encountered during the November 2006 reconnaissance geology / prospecting program (i.e. Ahwiniase Area). An additional 8 trenches totaling 144 meters were excavated to test the subsurface in the general area of the historical rock pit also discovered during said prospecting program (i.e. Adadietem Area).
Table 1: Trench Specifications – Apapam Concession
|
Trench No. |
Area / Zone |
Location (UTM Zone 30N) |
Length |
Trench |
No Channel | |
|
Easting |
Northing | |||||
|
TKB001 |
Area No. 1 |
769824 |
683276 |
102 |
320 |
51 |
|
TKB002 |
Area No. 1 |
769961 |
683117 |
74 |
320 |
37 |
|
TKB003 |
Area No. 1 |
769736 |
683251 |
110 |
316 |
55 |
|
TKB004 |
Area No. 2 |
769700 |
684137 |
224 |
318 |
112 |
|
TKB005 |
Area No. 2 |
769896 |
684217 |
116 |
316 |
58 |
|
TKB005A |
Area No. 2 |
769812 |
684297 |
36 |
316 |
18 |
|
TAD001 |
Adadietem |
768012 |
683691 |
20 |
140 |
10 |
|
TAD002 |
Adadietem |
768091 |
683618 |
22 |
315 |
11 |
|
TAD003 |
Area No. 3 |
768748 |
683474 |
126 |
317 |
63 |
|
TAD004 |
Adadietem |
768012 |
683691 |
50 |
320 |
25 |
|
TAD005 |
Adadietem |
768043 |
683708 |
12 |
320 |
6 |
|
TAD006 |
Adadietem |
768008 |
683744 |
8 |
320 |
4 |
|
TAD007 |
Area No. 3 |
768757 |
783573 |
46 |
317 |
23 |
|
TAH001 |
Ahwiniase |
767291 |
682664 |
80 |
315 |
40 |
|
TAH002 |
Ahwiniase |
766982 |
683002 |
22 |
140 |
11 |
|
TAH003 |
Ahwiniase |
767264 |
682711 |
24 |
315 |
12 |
- 27 -
|
Trench No. |
Area / Zone |
Location (UTM Zone 30N) |
Length |
Trench |
No Channel | |
|
Easting |
Northing | |||||
|
PAD001 |
Ahwiniase |
767981 |
683666 |
4 |
345 |
2 |
|
PAD002 |
Ahwiniase |
n/a |
n/a |
4 |
305 |
1 |
|
PAD003 |
Ahwiniase |
767927 |
683753 |
4.5 |
340 |
1 |
|
PAD004 |
Ahwiniase |
767977 |
683765 |
4 |
320 |
1 |
|
PAD006 |
Ahwiniase |
767940 |
683801 |
2 |
320 |
1 |
|
Note: |
Trenches #TAD001 and #TAD004 extend from a common point of origin in opposite directions resulting in one continuous trench. |
|
|
(ii) |
Trenching Results / CMECI Data Verification Program |
Based on past work experience in Ghana, the Xtra-Gold geological personnel arbitrarily established channel sample intervals yielding weighted average grades greater than 1.0 ppm gold has been exploration significant. The term “ppm” represents “part per million” where 1 ppm = 1 gram per tonne (g/t) = 1,000 part per billion (ppb). Nevertheless, anomalous channel sample results below the 1.0 ppm gold threshold remain of considerable exploration interest and will be subjected to further investigation. Sixty-one (61) out of the 542 channel samples (11%) yielded gold values greater than the 1.0 ppm exploration-significant threshold.
Four (4) out of the 21 trenches yielded length-weighted average grade intervals greater than the arbitrarily set exploration - significant threshold of 1.0 ppm gold, including: trench #TKB003 in gold-in-soil anomaly Area #1 (i.e. Kibi Mountain); trenches #TKB004 and #TKB005 in gold-in-soil anomaly Area #2; and trench #TAD001 in the Adadietem Area.
The independent data verification program undertaken by CMECI from December 3 to 7, 2007 encompassed the complete resampling of the exploration-significant intervals (= 1.0 ppm Au) from the four (4) above noted trenches. The CMECI resampling included 116 channel samples totaling 115.41 linear meters. Sampling consisted of a horizontal channel cut along the sidewall of the trench, approximately 0.2 meters above the trench floor. Sampling was typically established at one meter intervals, with sample lengths locally adjusted to accommodate geological features.
Forty-six (46) out of the 116 channel samples (39.5%) collected by CMECI returned values greater than 1.0 ppm gold. Exploration - significant gold intervals (= 1 ppm Au) from the independent data validation program are presented in Table 2. Note that all the weighted average grade intervals represent trench lengths and are not necessarily indicative of the true widths of the mineralization. Calculation of true widths within trenches can be difficult, as not all geological features are properly exposed. In addition, these mineralized intervals currently represent isolated features for which no strike extension can be measured due to the relatively long distances between the trenches; additional infill soil sampling and trenching is required to define the actual strike length of the mineralization.
At Apapam, gold mineralization has been found to occur in several different geological features, including steeply and flat - lying quartz veins and alteration haloes proximate to the quartz veining. The presence of shallow dipping (“flat lying”) veins may produce an exaggeration in both the width and grade of the mineralization. The effect of shallow veining is apparent in trench #TKB004 where a 4.07 ppm gold grade over a 11.0 meter trench - length is estimated to represent a true width of 3 to 4 meters due to the flat lying nature of the quartz veins. As previously noted calculation of true widths within trenches can be difficult, as not all the geological features are properly exposed.
Table 2: Significant Trench Intersections – Apapam Concession
|
Trench No. |
Zone / Area |
Intervals (meters) |
Gold | ||
|
From |
To |
Length | |||
|
TKB003 |
Area No. 1 |
46.36 |
54.10 |
7.74 |
1.60 |
|
TKB003 |
Area No. 1 |
64.10 |
74.55 |
10.45 |
1.62 |
|
including |
|
68.00 |
70.25 |
2.25 |
4.64 |
|
TKB004 |
Area No. 2 |
194.00 |
196.00 |
2.00 |
1.70 |
|
TKB004 |
Area No. 2 |
203.00 |
214.00 |
11.00(1) |
4.07 |
|
TKB005 |
Area No. 2 |
61.00 |
74.00 |
13.00 |
5.23 |
|
including |
Adadietem |
69.00 |
71.00 |
2.00 |
14.45 |
|
TAD001 |
Adadietem |
0.00 |
1.00 |
1.00 |
4.95 |
|
TAD001 |
Adadietem |
4.00 |
8.00 |
4.00 |
1.82 |
|
TAD001 |
Adadietem |
11.00 |
15.00 |
4.00 |
1.18 |
- 28 -
|
(1) |
Apparent Width: Estimated to represent a true width of 3 to 4 meters based on shallow dipping (“flat lying”) nature of the quartz veining. |
|
Note: |
All intersections represent trench lengths and are not necessarily indicative of the true width of the mineralization. |
Sample Analyses
Samples taken during the data verification program were analyzed at Eco Tech Laboratory Ltd., an ISO9001 registered laboratory located in British Columbia, Canada. Prepared samples are weighed to 30 grams and fused along with proper fluxing materials. The bead is digested in aqua regia and analyzed on an atomic absorption instrument. Values are reported in parts per billion (1 ppb = 0.001 ppm or 0.001 g/t). Samples returning greater than 500 ppb (0.5 ppm) gold were re-analysed by the metallic gold assay method. The purpose of this analysis was to determine if there was a “nugget effect” with the gold mineralization. The process involved taking minus 140 mesh fraction, homogenize it, then take 2 samples sub samples for gold fire assay. The plus 140 mesh material was assayed in its entirety. The resultant fire assay bead is digested with acid and after parting is analyzed on a Perkin Elmer atomic absorption machine using air-acetylene flame to 0.03 grams/tonne (0.03 ppm) detection limit. Results are collated by computer and are printed along with accompanying quality control data (repeats and standards).
2008 Kibi Gold Trend Follow-Up Program
Exploration work on the Apapam concession during the 2008 reporting period was aimed at advancing the lode gold targets identified within the the Kibi Gold Trend; an over 5.5 km long, NE-trending, anomalous gold-in-soil trend characterized by four (4) extensive, higher grade zones ranging from approximately 800 meters by 75-300 meters to 1,000 meters by 100-500 meters in area.
An extensive soil geochemistry survey covering approximately 47 line-kilometers (1,827 samples) was implemented in early 2008 to further define the extensive Kibi gold-in-soil trend. The entire Apapam grid was also covered by IP / Resistivity (62 km) and ground magnetometer (79 km) surveys to help map the extent of the granitoid bodies spatially associated with the gold occurrences, and to provide information on the strike extent and attitude of the mineralized structures.
The 2008 Apapam trenching program encompassed 22 trenches totaling approximately 1,375 linear meters, including: 8 trenches (425 m) on Zone 2 (TKB006-013); and 14 trenches (950 m) on Zone 3 (TAD008-021) of the 5.5 km long Kibi gold-in-soil trend.
A “Phase I” scout drilling program encompassing 18 diamond drill holes, ranging from 60 meters to 320.5 meters in length, and totalling 3,001 linear meters was implemented on the Apapam concession from August 30 to October 28, 2008. This reconnaissance drilling was designed to test the depth continuity of gold mineralization discovered in trenches excavated on Zone 2 and Zone 1 of the Kibi Gold Trend.
This initial reconnaissance drilling program yielded very encouraging results and demonstrated that the granitoid-hosted gold mineralization occurrences intersected along the Kibi gold-in-soil trend offers potential for shallow oxide mineralization amenable to bulk mining and heap leaching, as well as large primary gold systems at depth.
All gold results for the following exploration programs are reported in “ppm Au” (part per million gold). The term “ppm” represents “part per million” where 1 ppm = 1 gram per tonne (g/t) = 1,000 part per billion (ppb).
Recommended work to further advance the project includes: (a) additional mechanical trenching to further define the geological / structural nature and extent of the granitoid-host gold mineralization in Zone 2 and 3; and (b) a 5,000 m combined reverse circulation / diamond drilling program. The estimated cost of the follow-up exploration program is approximately $800,000.
Apapam Grid Expansion
The Apapam grid was expanded to provide control for detail (100m) soil sampling coverage of the gold-in-soil anomalies yielded by the Phase I (2006) work program and the gold occurrences identified in the 2007 trenching, located at the northwestern extremity of the concession, and for reconnaissance (200m) soil sampling to follow-up on anomalous gold-in-silt samples identified in streams at the southwestern extremity of the property. A total of 54.45 line-kilometers of cross-lines and 2.1 kilometers of baselines were established. The expanded grid now covers the entire northwestern portion of the concession with a total of 78.8 line-kilometers of southeast trending cross-lines extending along a 6.1 kilometer baseline.
- 29 -
Soil Geochemistry Survey
An extensive soil geochemistry survey was undertaken on the Apapam concession to provide detailed (100m) soil sampling coverage of the gold-in-soil anomalies yielded by the Phase I (2006) work program and the gold occurrences identified in the 2007 trenching, located at the northwestern extremity of the concession, and for reconnaissance (200m) soil sampling to follow-up on anomalous gold-in-silt samples identified in streams at the southwestern extremity of property during the 2004 Regional Exploration program. A total of 1,827 soil samples were collected at 25 meter intervals along the 46.975 line-kilometers of cross lines. Including the Phase I (2006) work program, a total of 2,859 soil samples have been collected on the Apapam grid.
The anomalous threshold for the soil sample results was set at 0.075 ppm gold based on past exploration experience on the Apapam concession. 666 (23%) out of the 2,859 soil samples returned gold values greater than the 0.075 ppm anomalous threshold, including: 236 (8%) samples over 0.150 ppm; 95 (3.5%) samples over 0.30 ppm; and 61 (2%) samples over 0.5 ppm gold.
The expanded soil survey outlined an over 5.5 km long, NE-trending, anomalous gold-in-soil trend (“Kibi gold-in-soil trend”) characterized by four (4) extensive, higher grade zones (i.e. Zone 1 to 4) ranging from approximately 800 meters by 75-300 meters to 1,000 meters by 100-500 meters in area. This gold-in-soil anomalous trend (> 0.075 ppm Au) tends to be patchy in nature and/or to pinch-out along its 5.5 km extent. The gold-in-soil anomalies exhibit a good spatial relationship with the bedrock gold occurrences identified to date in trenches at the northwestern extremity of the Apapam concession.
IP / Resistivity and Magnetometer Surveys
An IP / Resistivity survey covering the entire 5.5 km extent of the Kibi gold-in-soil trend was conducted to help define drill targets for the Phase I drill program. The 61.9 line-kilometer IP / Resistivity (Time Domain) survey, covering the entire extent of the Kibi gold-in-soil trend at 200 meter spacing, with some 100 meter detail sections centred on known gold showings, was conducted using a Pole-Dipole Array with a dipole length of 50 meters and dipole separations of n = 1 to 6. This survey design should yield an approximate depth of investigation of about 175 to 200 meters at n=6.
The IP / Resistivity survey helped map the extent of the granitoid bodies spatially associated with the gold occurrences identified to date by trenching and drilling, and yielded information on the strike extent and attitude of the mineralized structures.
A ground magnetometer survey encompassing 78.8 line-kilometers was also conducted on the Apapam grid. The magnetometer survey was implemented to help map the geology of the Kibi gold-in-soil trend area and to assist in the IP / Resistivity survey interpretation. The geophysical surveys were implemented in August to September 2008 by Sagax Afrique of Ouagadougou, Burkina Faso.
Kibi Gold-In-Soil Trend Trenching Program
The 2008 Apapam trenching program encompassed 22 trenches totaling approximately 1,375 linear meters, including: 8 trenches (425 m) on Zone 2 (TKB006-013); and 14 trenches (950 m) on Zone 3 (TAD008-021) of the 5.5 km long Kibi gold-in-soil trend. The 19 hand dug and 3 mechanical trenches, ranging from 20 meters to 154 meters in length and from 1.5 meters to 4.0 meters in depth, were designed to test the geochemical signature at depth, within the in situ saprolite (oxidized rock) horizon, of the gold-in-soil anomalies. To date, a total of 35 trenches totaling approximately 2,320 m have been excavated on the Kibi gold-in-soil trend.
Trenching exposed widespread occurrences of classical granitoid-hosted gold mineralization in Zone 2 and 3. Mineralization is hosted by swarms of granitoid bodies interpreted to be emplaced along splay structures off an inferred NE-trending regional structure. The broadly spaced trenching encountered significant granitoid-hosted gold mineralization, over trench lengths ranging from 10 meters to 45 meters, spread out over approximately 975 meter and 500 meter E-W distances in Zone 2 and 3, respectively. In addition several granitoid occurrences yielded lower grade but still exploration significant anomalous gold values. Significant gold intercepts from the 2008 trenching program, as well as significant intercepts from the 2007 Zone 2 trenching, are presented in Table 3 below. The term “ppm” represents “part per million” where 1 ppm = 1 gram per tonne (g/t) = 1,000 part per billion (ppb).
A total of 14 manual trenches totaling approximately 950 linear meters (TAD008-TAD021) were completed in 2008 on Zone 3 of the Kibi gold-in-soil trend, located approximately 700 meters southwest of the Phase I drilling area on Zone 2. To date saprolitic occurrences of altered granitoid exhibiting quartz-iron carbonate veining and oxidized sulphide sites have been encountered in six (6) trenches on Zone 3.
The Zone 3 trenching yielded two (2) significant granitoid-hosted gold mineralization intercepts: 4.93 ppm gold over 45 meters, including 10.12 ppm gold over 12 meters; and 1.60 ppm gold over 18 meters, including 9.89 ppm gold over 2 meters, in trenches TAD019 and TAD016, respectively. In addition, reconnaissance trenching of the Zone 3 gold-in-soil anomaly in 2007 yielded an intercept of 1.09 ppm gold over a 10 meter trench length in trench TAD001-TAD004. The remaining three (3) mineralized granitoid occurrences yielded lower grade but exploration significant, anomalous gold values.
- 30 -
Table 3: Significant Trench Intersections – Kibi Gold Trend (Length Weighted Average Grades)
|
Trench ID |
Intervals (meters) |
Gold | ||
|
From |
To |
(1) Trench Length | ||
|
TKB002 |
12.00 |
14.00 |
2.00 |
8.79 |
|
TKB003 |
46.36 |
54.10 |
7.74 |
1.60 |
|
TKB003 |
64.10 |
74.55 |
10.45 |
1.62 |
|
including |
68.00 |
70.25 |
2.25 |
4.64 |
|
TKB004 |
194.00 |
214.00 |
20.00 |
2.54 |
|
including |
203.00 |
214.00 |
11.00 (2) |
4.07 |
|
TKB005 |
60.00 |
90.00 |
30.00 |
2.49 |
|
including |
61.00 |
74.00 |
13.00 |
5.23 |
|
including |
69.00 |
71.00 |
2.00 |
14.45 |
|
TKB006 |
58.00 |
94.00 |
36.00 (3) |
1.46 |
|
including |
64.00 |
81.00 |
17.00 |
2.20 |
|
including |
64.00 |
65.00 |
1.00 |
7.90 |
|
TAD001-004 |
- |
- |
10.00 |
1.09 |
|
including |
- |
- |
1.00 |
4.95 |
|
TKB010 |
0.00 |
42.00 |
42.00 |
1.29 |
|
including |
15.00 |
28.00 |
13.00 |
2.26 |
|
TKB011 |
12.00 |
27.00 |
15.00 |
1.26 |
|
including |
19.00 |
25.00 |
6.00 |
2.41 |
|
TKB012 |
1.00 |
5.00 |
4.00 |
2.51 |
|
TAD016 |
23.00 |
41.00 |
18.00 |
1.60 |
|
including |
33.00 |
35.00 |
2.00 |
9.89 |
|
TAD019 |
16.00 |
61.00 |
45.00 |
4.93 |
|
including |
16.00 |
46.00 |
30.00 |
6.23 |
|
including |
34.00 |
46.00 |
12.00 |
10.12 |
|
including |
42.00 |
44.00 |
2.00 |
17.00 |
|
(1) |
Reported intercepts are trench-lengths; true width of mineralization is unknown at this time. |
|
(2) |
Estimated to represent a true width of ~ 4m due to flat lying nature of quartz veining. |
|
(3) |
Apparent Width: Estimated to represent a true width of ~ 25 meters based on flat lying nature of the quartz veining |
Phase I Drill Program – Kibi Gold Trend
The Apapam scout drilling program (the “Phase I Drill Program”) encompassed 18 diamond drill holes (NQ2 core), ranging from 60 meters to 320.5 meters in length, and totaling 3,001 linear meters. This reconnaissance drilling was designed to test the depth continuity of gold mineralization discovered in trenches excavated on Zone 2 and Zone 1 of the Kibi Gold Trend; an over 5.5 km long, NE-trending, anomalous gold-in-soil trend characterized by four (4) extensive, higher grade zones ranging from approximately 800 meters by 75-300 meters to 1,000 meters by 100-500 meters in area. The diamond drilling program was implemented from August 30 to October 28, 2008 by Burwash Drilling of Cobble Hill, British Columbia, Canada.
This initial reconnaissance drilling program yielded very encouraging results and demonstrated that the granitoid-hosted gold mineralization occurrences intersected along the Kibi gold-in-soil trend offers potential for shallow oxide mineralization amenable to bulk mining and heap leaching, as well as large primary gold systems at depth.
The first 15 holes of the program targeted gold mineralization discovered in four (4) trenches, TKB005, TKB004, TKB006, and TKB009-010, spread out over an approximately 975 meter E-W distance on the Zone 2 gold-in-soil anomaly. Thirteen (13) out of the 15 holes on Zone 2 yielded significant gold intercepts, including 10 holes intersecting significant granitoid-hosted gold mineralization over 7 meter to 45 meter core lengths. Significant gold intercepts are presented in Table 4 below. The term “ppm” represents “part per million” where 1 ppm = 1 gram per tonne (g/t) = 1,000 part per billion (ppb).
- 31 -
Mineralized material consists of altered quartz diorite and tonalite exhibiting quartz-iron carbonate veining, and disseminated sulphides. Mineralization discovered to date by trenching and/or drilling on Zone 2 and Zone 3 appears to be hosted by swarms of granitoid bodies, ranging from 5.5 meters to 79 meters in core length, interpreted to be emplaced along splay structures off an inferred NE-trending regional structure.
Limited drilling to date traced the granitoid-hosted gold mineralization over a 200 meter strike length and to a vertical depth of 100 meters at the Trench TKB004 Zone, including gold intercepts of: 2.11 ppm gold over 25.4 meters; 0.87 ppm gold over 15 meters and 1.28 ppm gold over 33 meters; 2.24 ppm gold over 16 meters; and 2.78 ppm gold over 15 meters in holes KBD08012, KBD08013, KBD08014, and KBD08015, respectively. Similarly, mineralization at the Trench TKB005 Zone was traced over an approximately 135 meter strike length and to a vertical depth of 76 meters in holes KBD08003 and KBD08004 and KBD08010 and KBD08011, including significant intercepts of 8.49 ppm gold over 12 meters and 4.83 ppm gold over 7 meters in holes KBD08004 and KBD08010, respectively.
Limited Zone 1 scout drilling (3 holes) intersected a typical “Ashanti” style shear zone setting developed proximal to a metavolcanic-metasediment contact with a spatially associated granitoid body. Hole KBD08017 yielded intermittent, exploration significant, anomalous gold values over a 60 meter core length, including encouraging intercepts of 1.43 ppm gold over 13.5 meters, 1.04 ppm gold over 6 meters, and 1.02 ppm gold over 8 meters. In addition, Trench TKB012 excavated on a gold-in-soil anomaly, located approximately 100 meters west of hole KBD08017, returned a channel sample intercept of 2.51 ppm gold over a 4 meter trench length.
Recommended work to further advance our Project includes: (a) additional mechanical trenching to further define the geological / structural nature and extent of the granitoid-host gold mineralization in Zone 2 and 3; and (b) a 5,000 m combined reverse circulation / diamond drilling program. The estimated cost of the follow-up exploration program is approximately $800,000.
Table 4: Significant Drill Intercepts – Kibi Gold Trend Project (Length Weighted Average Grades)
|
Hole ID |
Intervals (meters) |
Gold |
Comments (2) | |||
|
From |
To |
(1) Core Length | ||||
|
KBD08001 |
107 |
108 |
1 |
8.77 |
| |
|
KBD08001 |
132 |
133 |
1 |
13.65 |
| |
|
KBD087002 |
No significant results |
|
|
| ||
|
KBD08003 |
22.5 |
35 |
12.5 |
2.04 |
GRD | |
|
including |
22.5 |
24 |
1.5 |
5.51 |
| |
|
including |
29 |
32 |
3 |
3.65 |
| |
|
KBD08004 |
76 |
88 |
12 |
8.49 |
GRD | |
|
including |
76 |
77 |
1 |
28.50 |
| |
|
including |
77 |
78 |
1 |
42.40 |
| |
|
including |
80 |
85 |
5 |
5.64 |
| |
|
KBD08005 |
22 |
39 |
17 |
1.18 |
GRD | |
|
including |
33 |
39 |
6 |
2.04 |
| |
|
KBD08005 |
45 |
60 |
15 |
1.02 |
GRD | |
|
KBD08006 |
116 |
117 |
1 |
31.30 |
VG | |
|
KBD08007 |
65 |
78 |
13 |
1.02 |
GRD | |
|
including |
72 |
76 |
4 |
2.06 |
| |
|
KBD08008 |
15 |
60 |
45 |
1.01 |
GRD | |
|
including |
37 |
49 |
12 |
2.01 |
VG | |
|
KBD08009 |
No significant results |
|
|
| ||
|
KBD08010 |
47 |
54 |
7 |
4.83 |
GRD | |
|
KBD08010 |
58 |
59 |
1 |
9.58 |
| |
|
KBD08011 |
106 |
116 |
10 |
1.01 |
| |
|
including |
115 |
116 |
1 |
4.53 |
| |
|
KBD08012 |
46.6 |
72 |
25.4 |
2.11 |
GRD, VG | |
|
including |
63 |
72 |
9 |
3.95 |
| |
|
(including) |
63 |
64 |
1 |
13.60 |
| |
|
KBD08013 |
72 |
87 |
15 |
0.87 |
GRD | |
- 32 -
|
Hole ID |
Intervals (meters) |
Gold |
Comments (2) | ||
|
From |
To |
(1) Core Length | |||
|
KBD08013 |
96 |
129 |
33 |
1.28 |
GRD |
|
including |
98.3 |
105 |
6.7 |
2.40 |
|
|
including |
122 |
128 |
6 |
2.70 |
|
|
KBD08014 |
115 |
131 |
16 |
2.24 |
GRD |
|
including |
116 |
126 |
10 |
3.23 |
VG |
|
KBD08015 |
20 |
35 |
15 |
2.78 |
GRD |
|
including |
27 |
34 |
7 |
5.06 |
|
|
(including) |
32 |
33 |
1 |
9.48 |
|
|
KBD08015 |
42 |
45 |
3 |
2.37 |
GRD |
|
KBD08015 |
63 |
64 |
1 |
16.40 |
GRD |
|
KBD08016 |
No significant results |
|
|
| |
|
KBD08017 |
82.5 |
96 |
13.5 |
1.43 |
|
|
KBD08017 |
115 |
121 |
6 |
1.04 |
|
|
KBD08017 |
135 |
143 |
8 |
1.02 |
|
|
KBD08018 |
No significant results |
|
|
| |
|
(1) |
Reported intercepts are core-lengths; true width of mineralization is unknown at this time. |
|
(2) |
GRD – Granitoid hosted / associated; VG – Visible gold noted. |
Phase II Drill Program – Kibi Gold Trend
The Phase II drill program (the “Phase II Drill Program”) at our Apapam Project encompassed 50 RC holes, ranging from 40 meters to 150 meters in length, and totalling 4,715 linear meters including 27 holes for 2,478 meters on Zone 2 and 23 holes totaling 2,237 meters on Zone 3. Fifteen initial RC holes targeted the Trench TKB005 and Trench TKB004 gold zones located at the southeast extremity of Zone 2 of the Kibi Gold Trend; an over 5.5 km long, northeast trending, anomalous gold-in-soil trend characterized by four extensive higher grade zones ranging from approximately 800 meters by 75 to 300 meters to 1,000 meters by 100 to 500 meters in area. The Phase II Drill Program was designed to: (i) test the dip and strike extensions of the four gold target zones identified in Zone 2 during the Phase I Drill Program; (ii) assess the depth continuity of gold mineralization discovered in trenches excavated in Zone 3, an approximately 1,000 meter by 100 to 500 meter gold-in-soil anomaly located approximately 700 meters southwest of the Zone 2 drilling conducted under the Phase I Drill Program in 2008; and (iii) test IP / Resistivity anomalies spatially associated with the Kibi gold-in-soil trend. The Phase II Drill Program was designed to build upon the 2008 Phase I diamond drill results and to continue to demonstrate that the widespread, classical granitoid-hosted gold mineralization developed along the Kibi Gold Trend offers potential for shallow oxide mineralization amenable to bulk mining and heap leaching, as well as large primary gold systems at depth. The Phase II Drill Program was implemented from July 14, 2009 to September 26, 2009 by BLY Ghana Ltd., a subsidiary of Boart Longyear.
Drilling Results from Trenches TKB005 and TKB004 Zones (15 Holes) - Zone 2 - Kibi Gold Trend Project
Eleven out of the initial 15 of the 27 RC holes on Zone 2 yielded significant gold intercepts, with all mineralized intercepts consisting of granitoid-hosted gold mineralization spanning from one meter to 78 meters in core length. Mineralization identified to date by trenching and drilling on Zone 2 appears to be hosted by a series of sill-like granitoid bodies hosted within a folded metasediment-metavolcanic rock sequence. Mineralized material consists of altered quartz diorite and tonalite exhibiting quartz-iron carbonate veining and disseminated sulphides. Significant gold intercepts for the Trench TKB005 and TKB004 zones are set forth in Table 5 hereunder.
To date, gold mineralization at the Trench TKB005 zone has been traced over an approximately 220 meter strike length and to a vertical depth of approximately 75 meters. Highlights from the present drilling includes intercepts of 6.29 g/t over 23 meters, including 8.55 g/t over 10 meters, in hole KBRC09047 and 2.97 g/t over 18 meters, including 6.32 g/t over 8 meters in hole KBRC09042. These two holes tested the central portion of the zone in a scissor pattern designed to better characterize the lithological and structural controls of the gold mineralization intersected in diamond drill holes KBD08003 and KBD08004 from the Phase I drill program. Field and trench mapping indicates that the Trench TKB005 zone mineralization is hosted by a moderate, easterly dipping granitoid body exhibiting an extensive, shallow to moderate, westerly dipping, sheeted quartz vein system. Hole KBD09042 (270° AZ / -50° dip) intersected the host granitoid sill at approximately right angles from a collar position on the eastern (hanging wall) flank of the granitoid body. While hole KBRC09047 (090° Az / -55° dip) was drilled down the dip of the host granitoid sill in order to transect the westerly dipping, sheeted quartz veining at approximately right angles, with the hole remaining within the confines of the host granitoid body to a down hole depth of 23 meters.
- 33 -
Table 5: Significant Drill Intercepts – Kibi Gold Trend Project (Zone 2 – RC Holes KBRC09042 to KBRC09056)
|
|
From |
To |
Core Length (1) |
Gold |
|
|
KBRC09042 |
19 |
37 |
18 |
2.97 |
Trench TKB005 |
|
including |
23 |
31 |
8 |
6.32 |
|
|
(including) |
23 |
24 |
1 |
13.90 |
|
|
(including) |
28 |
29 |
1 |
12.70 |
|
|
|
|
|
|
|
|
|
KBRC09043 |
23 |
34 |
11 |
2.27 |
Trench TKB005 |
|
including |
25 |
29 |
4 |
5.27 |
|
|
|
|
|
|
|
|
|
KBRC09044 |
25 |
27 |
2 |
2.29 |
Trench TKB005 |
|
|
|
|
|
|
|
|
KBRC09045 |
22 |
32 |
10 |
2.48 |
Trench TKB005 |
|
including |
22 |
26 |
4 |
4.05 |
|
|
|
|
|
|
|
|
|
KBRC09046 |
41 |
54 |
13 |
1.04 |
Trench TKB005 |
|
including |
41 |
44 |
3 |
2.24 |
|
|
|
|
|
|
|
|
|
KBRC09047 |
0 |
23 |
23 |
6.29 |
Trench TKB005 |
|
including |
0 |
10 |
10 |
8.66 |
|
|
(including) |
0 |
1 |
1 |
10.90 |
|
|
(including) |
1 |
2 |
1 |
11.60 |
|
|
(including) |
3 |
4 |
1 |
12.65 |
|
|
(including) |
8 |
9 |
1 |
14.30 |
|
|
(including) |
9 |
10 |
1 |
13.50 |
|
|
including |
13 |
14 |
1 |
11.15 |
|
|
|
|
|
|
|
|
|
KBRC0948 |
No Significant Results |
|
|
Trench TKB004 | |
|
|
|
|
|
|
|
|
KBRC09049 |
52 |
53 |
1 |
7.53 |
Trench TKB004 |
|
KBRC09049 |
63 |
65 |
2 |
3.48 |
|
|
KBRC09050 |
51 |
56 |
5 |
1.98 |
Trench TKB004 |
|
including |
51 |
52 |
1 |
4.31 |
|
|
|
|
|
|
|
|
|
KBRC09051 |
28 |
37 |
9 |
2.69 |
Trench TKB005 |
|
including |
31 |
35 |
4 |
4.09 |
|
|
KBRC09052 |
No Significant Results |
|
|
Trench TKB005 | |
|
|
|
|
|
|
|
|
KBRC09053 |
No Significant Results |
|
|
Trench TKB004 | |
|
|
|
|
|
|
|
|
KBRC09054 |
No Significant Results |
|
|
Trench TKB004 | |
|
|
|
|
|
|
|
|
KBRC09055 |
4 |
82 |
78 |
1.44 |
Trench TKB004 |
|
including |
22 |
35 |
13 |
3.26 |
|
|
(including) |
22 |
26 |
4 |
6.28 |
|
|
(including) |
22 |
23 |
1 |
11.15 |
|
|
including |
56 |
76 |
20 |
2.27 |
|
|
(including) |
72 |
75 |
3 |
4.83 |
|
|
KBRC09056 |
25 |
43 |
18 |
1.33 |
Trench TKB004 |
|
including |
37 |
43 |
6 |
3.08 |
|
|
KBRC09056 |
58 |
78 |
20 |
2.01 |
|
|
including |
71 |
77 |
6 |
4.29 |
|
|
(1) Reported intercepts are core-lengths; true width of mineralization is unknown at this time. | |||||
- 34 -
Drilling Results from Trenches TKB006 and TKB010 Zones (12 Holes) - Zone 2 - Kibi Gold Trend Project
Seven out of the 12 remainingdrill holes on Zone 2 were designed to better define gold mineralization at Trench TKB006 and Trench TKB010 zones identified during the initial scout Phase I Drill Program at the northwest extremity of Zone 2 of the Kibi Gold Trend; one hole targeted a new gold zone exposed in recent trenching (trenches TKB014E and TKB014F); two holes probed previously untested gold-in-soil anomalies and two holes tested an IP / Resistivity anomaly spatially associated with a gold-in-soil anomaly. In addition, a total of 960 linear meters of mechanized trenching (38 trenches) was also conducted on Zone 2 in conjunction with this drill program to better define the surface trace of the host granitoid bodies, to test strike extension of known mineralization and to test gold-in-soil anomalies and geophysical targets.
Five out of the above-noted seven holes targeting the Trench TKB006, TKB010 and TKB014E-TKB014F zones yielded significant gold intercepts, with all mineralized intercepts consisting of granitoid-hosted gold mineralization spanning from one meter to 76 meters in core length. Mineralization identified to date by trenching and drilling, spread out over an approximately 975 meter east-west distance on the Zone 2 gold-in-soil trend, appears to be hosted by a series of sill-like granitoid bodies hosted within a folded metasediment-metavolcanic rock sequence.
Mineralized material consists of altered quartz diorite and tonalite exhibiting quartz-iron carbonate veining and disseminated sulphides.
Drilling highlights include granitoid-hosted gold mineralization intercepts from surface of 39.0 meters grading 9.23 g/t gold uncut (3.54 g/t gold cut) including 10.0 meters grading 33.15 g/t gold uncut (10.95 g/t gold cut) in drill hole KBRC09060 and 76.0 meters grading 1.62 g/t gold, including 20.0 meters grading 3.36 g/t gold (and including 5.25 g/t gold over 9.0 meters) in hole KBRC09068. Significant gold intercepts for holes KBRC09057 to KBRC09068 are set forth in Table 6 hereunder.
Table 6: Significant Drill Intercepts – Kibi Gold Trend Project (Zone 2 – RC Holes KBRC09057 to KBRC09068)
|
|
From |
To |
Core Length (1) |
Gold |
|
|
KBRC09057 |
Anomalous |
|
|
Trench TKB006 | |
|
|
|
|
|
|
|
|
KBRC09058 |
No Significant Intersection |
|
|
Gold-In-Soil Anomaly | |
|
|
|
|
|
|
|
|
KBRC09059 |
29 |
38 |
9 |
0.65 |
Trench TKB006 |
|
including |
29 |
32 |
3 |
1.05 |
|
|
|
|
|
|
|
|
|
KBRC09060 |
1 |
40 |
39 |
3.54 * |
Trench TKB006 |
|
including |
4 |
28 |
24 |
5.29 * |
|
|
and including |
4 |
14 |
10 |
10.95 * |
|
|
and including |
6 |
7 |
1 |
10.85 |
|
|
and including |
8 |
9 |
1 |
22.60 |
|
|
and including |
9 |
10 |
1 |
272.00 (uncut) |
|
|
|
|
|
|
|
|
|
KBRC09061 |
No Significant Intersection |
|
|
Trench TKB006 | |
|
|
|
|
|
|
|
|
KBRC09062 |
9 |
13 |
4 |
4.03 |
Trench TKB014E-F |
|
including |
9 |
10 |
1 |
9.32 |
|
|
|
|
|
|
|
|
|
KBRC09063 |
No Significant Intersection |
|
|
Geophysical Target | |
|
|
|
|
|
|
|
|
KBRC09064 |
No Significant Intersection |
|
|
Geophysical Target | |
|
|
|
|
|
|
|
|
KBRC09065 |
5 |
8 |
3 |
2.40 |
Trench TKB006 |
|
including |
6 |
7 |
1 |
4.87 |
|
|
KBRC09065 |
54 |
55 |
1 |
3.98 |
|
|
|
|
|
|
|
|
|
KBRC09066 |
No Significant Intersection |
|
|
Gold-In-Soil Anomaly | |
|
|
|
|
|
|
|
- 35 -
|
|
From |
To |
Core Length (1) |
Gold |
|
|
KBRC09067 |
14 |
19 |
5 |
1.16 |
Trench TKB010 |
|
including |
15 |
16 |
1 |
3.86 |
|
|
KBRC09067 |
30 |
34 |
4 |
1.99 |
|
|
including |
30 |
31 |
1 |
5.76 |
|
|
|
|
|
|
|
|
|
KBRC09068 |
0 |
76 |
76 |
1.62 |
Trench TKB010 |
|
including |
4 |
45 |
41 |
2.15 |
|
|
and including |
4 |
24 |
20 |
3.36 |
|
|
and including |
4 |
13 |
9 |
5.25 |
|
|
and including |
4 |
5 |
1 |
19.50 |
|
|
and including) |
41 |
42 |
1 |
10.40 |
|
|
|
|
|
|
|
|
|
(1) Reported intercepts are core-lengths; true width of mineralization is unknown at this time. | |||||
|
* Gold values cut to 50 grams per tonne (g/t) | |||||
|
Note: “Significant Intercepts” satisfy following criteria: greater than (>) 5.0 gram gold x meter product and >0.5 g/t gold. | |||||
Holes KBRC09057, KBRC09059 to KBRC09061 and KBRC09065 further tested the Trench TKB006 gold zone situated in the north-central portion of the approximately 1,000 meter long Zone 2 gold-in-soil anomaly. Additional mechanized trenching and geological mapping during this drilling campaign appears to indicate that the Trench TKB006 Zone is characterized by two, NNW-trending, approximately eight meters and 40 meters wide, sill-like granitoid bodies lying approximately 25 meters apart within a metasediment rock sequence. Hole KBRC09060 targeting an extensive system of NE to SE trending quartz veining developed within the wider, eastern granitoid body returned an intercept from surface of 39.0 meters grading 9.23 g/t gold uncut (3.54 g/t gold cut), including 10.0 meters grading 33.15 g/t gold uncut (10.95 g/t gold cut). Drilling to date, including initial scout drill hole KBD08005, which returned intercepts of 1.18 g/t gold over 17.0 meters and 1.02 g/t gold over 15.0 meters, has traced the Trench TKB006 gold zone mineralization over an approximately 160 meter strike distance.
Hole KBRC09062, designed to undercut gold mineralization discovered by trenching of a previously untested gold-in-soil anomaly lying approximately 225 meters west-northwest of the Trench TKB006 zone, yielded a granitoid-hosted gold mineralization intercept of 4.03 g/t gold over 4.0 meters, including one meter grading 9.32 g/t gold. The two target trenches positioned end to end on the same soil geochemical anomaly line both returned significant channel sample intercepts separated by an approximately 20.5 meter distance, including 8.49 g/t gold over a 5.0 meter trench-length, including 2.0 meters grading 14.85 g/t gold, in trench TKB014E and 6.86 g/t gold over an 8.0 meter trench-length, including 1.0 meter grading 22.4 g/t gold, in trench TKB014F. This new gold zone is considered especially interesting given the values defined at this early stage and the extent of the untested gold-in-soil anomalies present along lines 167N to L169N within the approximately 400 meter gap between the Trench TKB006 and TKB010 zones.
Holes KBRC09067 and KBRC09068 further tested the Trench TKB010 gold zone located at the north-western extremity of the approximately 1,000 meter long Zone 2 gold-in-soil anomaly. Hole KBRC09068 targeting an extensive system of NE to NW trending quartz veining exposed in Trench TKB010 returned a granitoid-hosted gold mineralization intercept from surface of 76.0 meters grading 1.62 g/t gold, including 20.0 meters grading 3.36 g/t gold (and including 5.25 g/t gold over 9.0 meters). Drilling and trenching to date, including initial scout drill hole KBD08008, which returned an intercept of 1.01 g/t gold over 45.0 meters (including 2.01 g/t gold over 12.0 meters), have traced the Trench TKB010 gold zone mineralization over an approximately 150 meter distance along the inner, northern margin of an east to southeast trending granitoid body.
Results from 23 Scout RC Holes - Zone 3 - Kibi Gold Trend
Drilling highlights for Zone 3 include granitoid-hosted gold mineralization intercepts of 30.0 meters grading 3.52 g/t gold, including 14.0 meters grading 6.47 g/t gold, from a down hole depth of 8.0 meters in hole KBRC09019; 4.0 meters grading 4.86 g/t gold from a down hole depth of 26 meters in hole KBRC09023 and 8.0 meters grading 4.95 g/t gold, including 3.0 meters grading 12.89 g/t gold, from surface in hole KBRC09024. Significant gold intercepts for holes KBRC09019 to KBRC09041 are set forth in table 7 hereunder.
Similarly to Zone 2, all Zone 3 mineralization targets are near surface, remain open in all directions and offer potential for shallow oxide mineralization amenable to bulk mining and heap leaching, as well as large primary gold systems at depth. The limited scout drilling returned several significant gold intercepts over an approximately 825.0 meter E-W distance across Zone 3. To date, Zone 2 and Zone 3 drilling has traced the granitoid-hosted gold mineralization over an approximately 2,100 meter distance along the NE-trending Kibi Gold Trend.
- 36 -
This initial Zone 3 scout drilling formed part of the 4,715 meter Phase II RC Drill Program which included 27 holes for 2,478 meters on Zone 2 and 23 holes totaling 2,237 meters on Zone 3 of the the Kibi Gold Trend; an over 5.5 km long, NE-trending, anomalous gold-in-soil trend characterized by four extensive higher grade zones ranging from approximately 800 meters by 75-300 meters to 1,000 meters by 100-500 meters in area. The present drilling was designed to undercut surface gold mineralization exposed in reconnaissance trenches, and to test geophysical Induced Polarization (‘IP’) / Resistivity and /or gold-in-soil anomalies on Zone 3; an approximately 1,000 meter by 100-500 meter, gold-in-soil anomaly located approximately 700 meters to the southwest of the main Zone 2 drilling area.
Table 7: Significant Drill Intercepts – Kibi Gold Trend Project (Zone 3 – RC Holes KBRC09019 to KBRC09041)
|
|
From |
To |
Core Length (1) (meters) |
Gold Grams Per Tonne |
|
Hole Location |
|
KBRC09019 |
12 |
42 |
30 |
3.52 |
Trench TAD019 |
Mining Lease |
|
including |
16 |
30 |
14 |
6.47 |
|
|
|
and including |
26 |
30 |
4 |
14.27 |
|
|
|
and including |
16 |
17 |
1 |
15.00 |
|
|
|
and including |
26 |
27 |
1 |
19.10 |
|
|
|
and including |
29 |
30 |
1 |
25.10 |
|
|
|
|
|
|
|
|
|
|
|
KBRC09020 |
36 |
39 |
3 |
1.01 |
Trench TAD007 |
Mining Lease |
|
KBRC09020 |
58 |
60 |
2 |
4.10 |
|
|
|
|
|
|
|
|
|
|
|
KBRC09021 |
5 |
14 |
9 |
0.94 |
Trench TAD001- |
Staking Application (2) |
|
including |
5 |
6 |
1 |
4.92 |
|
|
|
KBRC09021 |
30 |
36 |
6 |
0.74 |
|
|
|
|
|
|
|
|
|
|
|
KBRC09022 |
No Significant Intercept |
|
|
Trench TAD014 |
Staking Application (2) | |
|
|
|
|
|
|
|
|
|
KBRC09023 |
26 |
30 |
4 |
4.86 |
Trench TAD001- |
Staking Application (2) |
|
KBRC09023 |
36 |
42 |
6 |
0.42 |
|
|
|
|
|
|
|
|
|
|
|
KBRC09024 |
0 |
8 |
8 |
4.95 |
Trench TAD001- |
Staking Application (2) |
|
including |
0 |
1 |
1 |
32.90 |
|
|
|
KBRC09024 |
24 |
46 |
22 |
0.29 |
|
|
|
KBRC09024 |
73 |
74 |
1 |
3.12 |
|
|
|
|
|
|
|
|
|
|
|
KBRC09025 |
22 |
29 |
7 |
0.91 |
Trench TAD014 |
Staking Application (2) |
|
|
|
|
|
|
|
|
|
KBRC09026 |
No Significant Intercept |
|
|
Trench TAD001- |
Staking Application (2) | |
|
KBRC09027 |
27 |
42 |
15 |
1.18 |
Trench TAD001- |
Staking Application (2) |
|
including |
34 |
37 |
3 |
4.09 |
|
|
|
KBRC09027 |
62 |
68 |
6 |
1.03 |
|
|
|
|
|
|
|
|
|
|
|
KBRC09028 |
48 |
60 |
12 |
0.25 |
Trench TAD001- |
Staking Application (2) |
|
KBRC09028 |
76 |
85 |
9 |
0.52 |
|
|
|
|
|
|
|
|
|
|
|
KBRC09029 |
5 |
35 |
30 |
0.84 |
Trench TAD001- |
Staking Application (2) |
|
including |
5 |
9 |
4 |
2.00 |
|
|
|
KBRC09029 |
70 |
75 |
5 |
0.82 |
|
|
|
|
|
|
|
|
|
|
- 37 -
|
|
From |
To |
Core Length (1) (meters) |
Gold Grams Per Tonne |
|
Hole Location | |
|
KBRC09030 |
30 |
43 |
13 |
0.67 |
Trench TAD016 |
Mining Lease | |
|
including |
31 |
36 |
5 |
1.21 |
|
| |
|
KBRC09030 |
59 |
70 |
11 |
0.42 |
|
| |
|
including |
68 |
70 |
2 |
1.59 |
|
| |
|
KBRC09031 |
19 |
26 |
7 |
0.74 |
Trench TAD015- |
Mining Lease | |
|
including |
22 |
24 |
2 |
1.63 |
|
| |
|
|
|
|
|
|
|
| |
|
KBRC09032 |
126 |
146 |
20 |
0.33 |
Trench TAD015- |
Mining Lease | |
|
including |
126 |
132 |
6 |
0.66 |
|
| |
|
|
|
|
|
|
|
| |
|
KBRC09033 |
No Significant Intercept |
|
|
Trench TAD016 |
Staking Application (2) / | ||
|
|
|
|
|
|
|
| |
|
KBRC09034 |
4 |
9 |
5 |
0.54 |
Gold-in-Soil Anomaly |
Staking Application (2) / | |
|
|
|
|
|
|
|
| |
|
KBRC09035 |
No Significant Intercept |
|
|
Trench TAD001- |
Staking Application (2) | ||
|
|
|
|
|
|
|
| |
|
KBRC09036 |
1 |
20 |
19 |
0.67 |
Trench TAD001- |
Staking Application (2) | |
|
including |
5 |
13 |
8 |
1.00 |
|
| |
|
|
|
|
|
|
|
| |
|
KBRC09037 |
3 |
10 |
7 |
0.36 |
Trench TAD001- |
Staking Application (2) | |
|
KBRC09037 |
47 |
75 |
28 |
0.87 |
|
| |
|
including |
47 |
53 |
6 |
1.99 |
|
| |
|
|
|
|
|
|
|
| |
|
KBRC09038 |
61 |
92 |
31 |
0.57 |
Trench TAD001- |
Staking Application (2) | |
|
including |
61 |
70 |
9 |
1.01 |
|
| |
|
and including |
62 |
63 |
1 |
3.64 |
|
| |
|
|
|
|
|
|
|
| |
|
|
|
|
|
|
|
| |
|
KBRC09039 |
23 |
24 |
1 |
39.80 |
Trench TAD019 |
Mining Lease | |
|
|
|
|
|
|
|
| |
|
KBRC09040 |
No Significant Intercept |
|
|
Trench TAD007 |
Mining Lease | ||
|
|
|
|
|
|
|
| |
|
KBRC09041 |
No Significant Intercept |
|
|
Trench TAD007 |
Mining Lease | ||
|
(1) Reported intercepts are core - lengths; true width of mineralization is unknown at this time. (2) “Staking Application” formally received by the Minerals Commission of Ghana on November 19, 2009, and is currently being processed, thus securing Xtra-Gold’s priority staking status but there is no absolute assurance that this parcel of ground will be granted to Xtra-Gold. | |||||||
The present drilling includes five holes to test the Trench TAD019 and TAD007 targets located at the south-eastern extremity of the Zone 3 gold-in-soil anomaly, and 18 holes to assess the Trench TAD001 – TAD004, TAD015 – TAD021 and TAD016 targets within the north-central portion of the gold-in-soil anomaly. Fourteen out of the 23 scout holes returned significant gold intercepts, with an additional three holes yielding anomalous gold intercepts. (see QA-QC disclosure section for “Significant” and “Anomalous” intercept criteria). All mineralized intercepts consisted of granitoid-hosted and/or granitoid-associated gold mineralization, with mineralized material typically consisting of altered quartz diorite and tonalite exhibiting quartz-iron carbonate veining and disseminated sulphides.
- 38 -
Hole KBRC09019 targeting an extensive system of granitoid-hosted, NE-trending, moderately NW-dipping, sheeted quartz veins discovered in Trench TAD019 returned a significant mineralized intercept of 30.0 meters grading 3.52 g/t gold, including 14.0 meters grading 6.47 g/t gold, from a down hole depth of 8.0 meters. For reference purposes, Trench TAD019 yielded a channel sample intercept of 4.93 g/t gold over 45.0 meters, including 10.12 g/t gold over 12.0 meters. Hole KBRC09039, representing the second hole of a scissor drill pattern designed to determine the dip attitude of the host granitoid body, returned an intercept of 39.80 g/t gold over 1.0 meter from a quartz vein in mafic metavolcanic rock along the footwall flank of the granitoid body. Hole KBRC09020, targeting a zone of anomalous gold values in Trench TAD007 located approximately 65.0 meters to the west of the KBRC09019 collar, yielded granitoid-hosted mineralization intercepts of 1.01 g/t gold over 3.0 meters and 4.10 g/t gold over 2.0 meters.
A total of 18 holes were drilled within the north-central portion of the Zone 3 gold-in-soil anomaly which is characterized by an approximately 800 meter long IP Chargeability anomaly exhibiting a spatial relationship with a geophysically inferred, NE-trending, regional structural trend. Eleven of these holes tested the north-eastern, Moderate Chargeability / Very High Resistivity portion (200 meters) of the IP anomaly exhibiting a coincidental gold-in-soil signature and anomalous trench results (i.e. Trench TAD001 – TAD004 Zone).
The limited, shallow RC drilling outlined an approximately 135.0 meter wide, NE-trending, granitoid hosted, structural corridor appearing to encompass at least five (5) distinct, gold-bearing, sheeted vein zones ranging from 1.0 meter to 31.0 meters in core length. Eight (8) out of the 11 Trench TAD001 – TAD004 Zone holes returned significant gold intercepts, including seven (7) holes yielding multiple significant and/or anomalous gold intercepts.
The mineralized structural corridor is characterized by significant gold intercepts over 1.0 meter to 8.0 meter core lengths occurring within more extensive, lower grade, mineralization envelopes attaining 15.0 meters to 31.0 meters in core length. Holes KBRC09024 and KBRC0937, intersecting what appears to be the same sheeted vein zone approximately 35.0 meters horizontally apart within the central section of the structural corridor returned mineralized intercepts of 8.0 meters grading 4.95 g/t gold, including 3.0 meters grading 12.89 g/t gold, and 28.0 meters grading 0.87 g/t gold, respectively. Similarly, holes KBRC09023 and KBRC09038, drilled in a scissor pattern along the northern margin of the structural corridor, yielded 4.0 meters grading 4.86 g/t gold and 31.0 meters grading 0.57 g/t gold, respectively from intercepts located approximately 8.0 meters horizontally apart along the same mineralized structure.
Thirteen out of the 18 holes described above were drilled on open ground along the northern flank of the Apapam Mining Lease, with the drill traces extending from approximately 50.0 meters to 300.0 meters outside the concession boundary, and two (2) additional holes straddle the concession boundary. Following the completion of a professional land survey, the approximately 1.42 sq km wedge of open ground lying between the Apapam Mining Lease and the Atewa Forest Reserve boundary was staked by us to cover the mineralization targets identified by the holes in question. The staking application was formally received by Min Com on November 19, 2009 and is currently being processed, thus securing our priority staking status, however, there is no absolute assurance that this parcel of ground will be granted to our company. Refer to Significant Intercept Table above for claim status of individual Zone 3 drill holes.
Gold Intercept Reporting Criteria
Unless otherwise indicated, “Reported Intercepts” represent core-lengths; true width of mineralization is unknown at this time. Individual sample results were length weighted to yield average composite interval grades as reported. “Significant Intercepts” satisfy following criteria: greater than (>) 5.0 gram gold x meter product and > 0.5 g/t gold. “Anomalous” signifies at least one intercept > 2.0 gram gold x meter product and >0.25 g/t gold. Intersections are constrained with a 0.25 g/t gold minimum cut-off grade at the top and bottom of the intercept, with a 50 g/t upper cut-off grade applied, and a maximum of five consecutive meters of internal dilution (less than 0.25 g/t gold). All internal intervals yielding above 10 g/t gold are indicated within the intersection.
Quality-Control Program
We have implemented a quality-control program to ensure best practice in the sampling and analysis of the drill core, RC samples and trench channel samples. Drill core is HQ diameter (63.5 mm) in upper oxidized material (regolith) and NQ diameter (47.6 mm) in the lower fresh rock portion of the hole. Drill core is saw cut and half the core is sampled in standard intervals. The remaining half of core is stored in a secure location. RC samples are taken at one meter intervals under dry drilling conditions by experienced geologists, with all samples weighed on site. Trench samples consist of continuous, horizontal channels collected from a canal excavated along the bottom sidewall of the trench (~ 0.10 meter above floor). All samples are transported in security-sealed bags to the ALS Chemex Laboratory (“ALS Chemex”) in Kumasi, Ghana. ALS Chemex is an ISO 9001:2000 certified laboratory. A one kg split of the sample is pulverized to better than 85% passing 75 microns, and analyzed by industry standard 50 gram fire assay fusion with atomic absorption spectroscopy (AAS) finish; with gravimetric finish on samples exceeding 10 g/t gold. Our company inserts a certified reference standard (low to high grade), analytical blank, and field duplicate sample in every batch of 20 drill core / RC chip / trench channel samples. Validation parameters are established in the database to ensure quality control.
- 39 -
As of the date of this Report, we (i) we have engaged SEMS Exploration Services (‘SEMS”) to prepare an independent technical report consistent with the Canadian Securities Administrators National Instrument 43-101 – Standards of Disclosure for Mineral Projects, Form 43-101F1 – Technical Report and Companion Policy 43-101 CP (“NI 43-101”) on this project (see “The Apapam Project – Work in Progress”); (ii) we have engaged SRK Consulting (Canada) Inc. to conduct a detailed structural study of the Kibi Gold Trend located on this project (see “The Apapam Project – Work in Progress”); and (iii) we have planned the Phase III Drill Program to be commenced during the next 12 months (see “The Apapam Project – 2010 Phase III Drill Program – Kibi Gold Trend”.
Work in Progress
As of the date of this Report, we: (i) are conducting a geological – geophysical compilation encompassing the extensive geological / structural mapping of access roads, drill pads and trenches conducted in conjunction with the Phase II Drill Program in preparation for a follow-up drill program which we plan to commence in 2010 as noted hereunder; (ii) have engaged SEMS Exploration Services (“SEMS”) to prepare an independent technical report (the “43-101 Report”) consistent with the Canadian Securities Administrators National Instrument 43-101 – Standards of Disclosure for Mineral Projects, Form 43-101F1 – Technical Report and Companion Policy 43-101 CP (“NI 43-101”) on this project; and (iii) have engaged SRK Consulting (Canada) Inc. (“SRK”) to conduct a detailed structural study of the Kibi Gold Trend located on this project.
The 43-101 Report is intended to act as an accurate and current technical summary of the geology and gold potential of our Apapam Project. The scope of work should include, but not be limited to, the review and audit of the QA/QC procedures for drilling and sampling, economic potential of the gold mineralization intersectedin the 2008 diamond drill and 2009 RC programs, and a staged exploration strategy / budget for the further advancement of this Project. Exploration activities on this Project for the 2008-2009 period, i.e. soil geochemistry, geophysics, trenching, since the April 9, 2008 NI 43-101 Technical Report by CMECI, covering work for the 2006-2007 period, should also be documented. The 43-101 Report to be prepared by SEMS should also include the documentation of the exploration expenditures incurred by us on this Project within the last three years, i.e. a minimum of $100,000.
We have engaged SRK to conduct a detailed structural study of the Kibi Gold Trend located on our Apapam Project, including (i) conducting field and drill core investigations; (ii) assisting with the analysis of geological and structural data collected to date; and (iii) providing insights on the geological and structural controls on the distribution of the gold mineralization.
2010 Phase III Drill Program – Kibi Gold Trend
Based on the results of the 2009 Phase II Drill Program, the Board has approved the follow-up Phase III Drill Program to be conducted in 2010 at an estimated cost of $1,000,000 to: (i) further test the dip and strike extensions of the gold mineralization zones identified in the Phase I and Phase II drill programs; and (ii) test IP / Resistivity anomalies spatially associated with the Kibi gold-in-soil trend. We plan to conduct further drilling activities during the next 12 months at an estimated cost of $5,000,000, subject to successful completion of raising additional capital.
Resources
No ore resources have been identified on our Apapam Project.
Mining Lease – Apapam Project
XG Mining’s interest in the Apapam Project was previously held by a prospecting license granted by The Government of Ghana on March 29, 2004 covering a licensed area of 33.65 sq km. Subsequently, in May 2008, XG Mining made an application to The Government of Ghana to convert the prospecting license to a mining lease. Our application received parliamentary approval resulting in The Government of Ghana granting and registering a mining lease to XG Mining on the following terms and conditions.
Our subsidiary, XG Mining, which is owned by us as to a 90% interest, entered into a mining lease dated December 18, 2008 (the “Apapam mining lease”) with The Government of Ghana, who holds a 10% free carried interest in XG Mining. The Apapam mining lease covers an area of 33.65 sq km (the “Lease Area”) and is located in the East Akim District of the Eastern Region of the Republic of Ghana. The Apapam mining lease has a 7 year term expiring on December 17, 2015 and can be renewed for a further 30 year term in accordance with the Minerals and Mining Act, 2006 (Act 703) by making application not less than six months prior to the expiration of the mining lease. We have been granted surface and mining rights by the Government of Ghana to work, develop and produce gold in the Lease Area (including the processing, storing and transportation of ore and materials). With respect to the Apapam mining lease, we are: (i) required to pay applicable taxes and annual rental fees to the Government of Ghana of approximately $15; and (ii) committed to pay a royalty in each quarter to the Government of Ghana, through the Commissioner of Internal Revenue, based on the production for that quarter within 30 days from the quarter end as well as a royalty on all timber felled in accordance with existing legislation. Under the terms and conditions of the Apapam mining lease, we are required to (i) commence
- 40 -
commercial production of gold within two years from the date of the mining lease; (ii) conduct our operations with due diligence, efficiency, safety and economy, in accordance with good commercial mining practices and in a proper and workmanlike manner, observing sound technical and engineering principles using appropriate modern and effective equipment, machinery, materials and methods and paying particular regard to the conservation of resources, reclamation of land and environmental protection generally; (iii) mine and extract ore in accordance with subparagraph (ii) herein, utilizing methods which include dredging, quarrying, pitting, trenching, stoping and shaft sinking in the Lease Area.
We are further required to furnish (i) a report in each quarter not later than 30 days after the quarter end to the Government Authorities in connection with quantities of gold won in that quarter, quantities sold, revenue received and royalties payable; (ii) a report half-yearly not later than 40 days after the half year end to the Government Authorities summarizing the results of operations during the half year and Technical Records, which report shall also contain a description of any geological or geophysical work carried out by our company in that half year and a plan upon a scale approved by the HIDMC showing dredging areas and mine workings; (iii) aa report in each financial year not later than 60 days after the end of the financial year summarizing the results of our operations in the Lease Area during that financial year and the Technical Records, which report shall further contain a description of the proposed operations for the following year with an estimate of the production and revenue to be obtained; (iv) a report not later than three months after the expiration or termination of the mining lease, to the Government Authorities giving an account of the geology of the Lease Area including the stratigraphic and structural conditions and a geological map on scale prescribed in the Mining Regulations; (v) a report to the Government Authorities (except for HIDMC and DGGS) of any proposed alteration to our regulations, (vi) a report to the Government Authorities (except for HIDMC and DGGS) on the particulars of any fresh share issuance or borrowings in excess of an amount equal to the stated capital of XG Mining; (vii) having regard to items (v) and (vi), these reports shall be submitted not less than 21 days in advance of the proposed alteration, issuance or borrowing; (viii) a copy of XG Mining’s annual financial reports to the Government Authorities (except for HIDMC and DGGS) including a balance sheet, profit and loss account and notes thereto certified by a qualified accountant, who is a member of the Ghana Institute of Chartered Accountants, not later than 180 days after the financial year end; and (ix) such other reports and information in connection with our operations to Government Authorities as they may reasonably require. We are entitled to surrender all of our rights in respect of any part of the Lease Area not larger in aggregate than 20% of the Lease Area by providing not less than two months’ notice to the Government of Ghana. We may surrender a larger part of the Lease Area by providing not less than 12 months’ notice. We have the right to terminate our interest in the Apapam mining lease if the mine can no longer be economically worked, by giving not less than nine months’ notice to the Government Authorities, without prejudice to any obligation or liability incurred prior to such termination. The Government of Ghana has the right to terminate our interest in the Apapam mining lease if (i) we fail to make payments when due; (ii) contravene or fail to comply with terms and conditions of the mining lease (however, we have 120 days to remedy from the notice of such event); (iii) become insolvent or commit an act of bankruptcy; or (iv) submit false statements to the Government Authorities.
The Apapam mining lease further provides that XG Mining shall report forthwith to the Government Authorities in the event it discovers any other mineral deposits apart from gold and silver in the Lease Area, who in turn will provide XG Mining with the first option to prospect further and to work the said minerals subject to satisfactory arrangements between made between XG Mining and the Government Authorities.
The Edum Banso Project
Access and Location
Our Edum Banso Project lies within the south Ashanti gold belt in the Western Region of Ghana and is located approximately 235 kilometers west of Accra and 15 kilometers northwest of Takoradi, the regional capital.
Access to this Project is by asphalt road from Accra to Takoradi and by gravel road from Takoradi to Edum Banso through the town of Apowa. Internal access within the concession area is quite poor, however there are many footpaths that interconnect the scattered settlements within this concession. Our Edum Banso Project is located approximately 200 km southwest from our Field Camp.
Option Agreement for Prospecting License
Our wholly-owned subsidiary, XGEL entered into an option agreement dated October 17, 2005 (the “Adom Option Agreement”) with Adom Mining Ltd. (“Adom”), a 100% wholly registered Ghanaian company, who is the registered proprietor of a prospecting license which Adom entered into with The Government of Ghana on May 8, 1991, covering a licensed area of 20.60 sq km (the “Edum Banso Licensed Area”). The current term of the prospecting license has been extended to December 1, 2010 on approval by Min Com. A further application for renewal of the prospecting license requires our submission of (i) a comprehensive terminal report, including logs of pits and assay results; (ii) a detailed financial report; (iii) a site plan indicating the areas to be retained and those to be shed off; (iv) evidence of annual ground rent payments; and (v) an environmental permit from the EPA.
- 41 -
Previously, Newmont Ghana Limited (“Newmont”) had entered into an option agreement with Adom in connection with the Edum Banso Project, however abandoned their interest.
Under the terms and conditions of the prospecting license, Adom has the right to prospect for and prove gold under or in the licensed area including the right to conduct such geological and geophysical investigations in the licensed area in order to determine an adequate quantity of geologically proven and mineable reserve of gold (directly or through agents, contractors or sub-contractors). Under the prospecting license, the holder has the right to (i) assign or mortgage its interest in the prospecting license, subject to obtaining the consent of the Government of Ghana who may impose certain conditions in connection therewith; (ii) surrender its interest in the prospecting license; and (iii) renew the term of the prospecting license for a period of two years or such other renewal period as may be granted in accordance with applicable mining laws of Ghana.
The Government of Ghana has the right to terminate the prospecting license in the event the holder of the prospecting license (i) fails to make payments when due; (ii) contravenes or fails to comply with terms and conditions of prospecting license; (iii) becomes insolvent or commits an act of bankruptcy; or (iv) submits false statements to the Government of Ghana. In any of the foregoing events, the holder will have 21 days in which to remedy any of these occurrences. If upon expiration of prospecting license, the holder has fulfilled its obligations and has established to the Government of Ghana that development of a mine from ore and reserves established within the licensed area is economical and financially feasible, the Government of Ghana shall grant the holder with first option to (i) acquire a license for purposes of mining gold in the licensed area of the Edum Banso concession; and (ii) participate in mining project in licensed area, subject to negotiation with the Government of Ghana of satisfactory terms for such license and participation.
At the time of execution of the Adom Option Agreement, we paid Adom $5,000 as consideration for entering into the agreement with us. We are required to pay Adom additional payments of $5,000 on the anniversary date of the Adom Option Agreement for each year that we hold an interest in such agreement. The term of the Adom Option Agreement is for five years. There are no other termination rights available to Adom.
We are required to make an additional payment of $200,000 to Adom at the time of commencement of the production of gold in or on the Edum Banso Project; provided, however in the event less than two million ounces of proven and probable reserves are discovered in or on the Edum Banso Project, this payment shall be reduced to $100,000. Under the terms and conditions of the Adom Option Agreement, Adom has granted XGEL the sole and exclusive right and option to acquire all of its right, title and interest in the prospecting license, which option may be exercised by XGEL at any time during the term. Adom has further granted XGEL the exclusive right of free and unrestricted access to the Edum Banso Project to explore, develop and, provided XGEL has exercised the option, to mine, extract, remove and sell any and all ores, minerals, concentrates or other products from the Edum Banso Project. Upon XGEL’s written election to exercise the option, Adom shall forthwith transfer the prospecting license to XGEL, subject only to a reserved royalty of 2% of the net smelter returns (“NSR”) from all ores, minerals or other products mined and removed from the Edum Banso Project and sold by XGEL. In the event less than two million ounces of proven and probable reserves are discovered in or on the Adom Project, the reserved royalty shall be 1% of the NSR. Adom has granted XGEL the exclusive right and option, exercisable by XGEL at any time to purchase the entirety of the reserved royalty for the sum of $2,000,000. No payment of the actual NSR shall be credited toward the reserved royalty purchase price. In the event less than two million ounces of proven and probable reserves are discovered in or on the Edum Banso Project, the reserved royalty purchase price shall be $1,000,000. Pursuant to the terms of an amending agreement entered into between the parties on October 19, 2006, XGEL has the right, without the prior consent of Adom, to assign or transfer its rights under the Option Agreement and the option to any affiliate or third party or to enter into a joint venture in connection therewith provided that any assignment, transfer or joint venture by XGEL shall be subject to agreement by the assignee, transferee or joint venture partner to be bound by the terms of this agreement.
Geology
The Edum Banso concession is underlain by basic to intermediate metavolcanic rocks, volcanoclastic rocks, greywackes and phyllites of the Upper Birimian Formation. These rocks are intruded by Dixcove suite granites in the north, mainly composed of hornblende granites, granodiorites, and gabbros and diorites in the south. Similar intrusive granites in Ghana have been proven to host disseminated sulphide hosted gold mineralization. Two major thrust faults interpreted from aeromagnetic data run north by northeast through the project area.
Historic Work
The only gold production on the concession was from local miners working the auriferous gravels and quartz veins as reported by J.W. Lunn in the 1930s. Amercosa (formerly AngloAmerican) reportedly worked on the project in the late 1990’s, however the results from this work are not published. St. Jude Resources, a Canadian public mining company, conducted geophysical surveys including magnetic and induced polarization surveys. The prospective structures identified in these surveys were followed up by geochemical surveys which included soil, trench and pit sampling.
- 42 -
Stream sediment sampling throughout the entire concession area by Newmont Mining in 2003 defined a broad anomalous gold zone approximately 7 km long by 1.5 km wide, roughly conforming to the regional geological trend. Follow-up soil (1,109 samples) and rock sampling by Newmont in 2004 further constrained this broadly anomalous area into two distinctive anomalies, while geophysical interpretation suggests they are coincident with the surface expression of two major North-South oriented thrust faults.
Phase I Exploration Program
A first phase exploration program (the “Phase I Work Program”) was implemented on the Edum Banso concession from August 2007 to January 2008 by Torkornoo & Associates Limited (“TAL”), at a cost of approximately $177,000. TAL is a Ghanaian geological consultancy with the principal being a professional geologist registered with The Australasian Institute of Mining and Metallurgy (AusIMM).
Based on the complex structural nature of gold deposits identified to date by Third Parties within the Hwini-Butre/Benso-Subriso gold district, the Phase I Work Program encompassed infill soil sampling, reconnaissance geology / prospecting, hand auger sampling and trenching designed to identify cost-effective drill targets. The tighter soil geochemical coverage (200m) was implemented to better define the length-extents and trends of the gold-in-soil anomalies detected by the historical Newmont soil program (2004). The deep auger components of the program was proposed to test the geochemical signature of gold-in-soil anomalies at depth in order to better define trenching and drilling targets. The results of this program are noted hereunder.
Phase I fieldwork consisted of the following:
|
|
● |
Grid establishment: 8.4 km baseline, 73.8 km gridlines; |
|
|
● |
Soil sampling: 2,703 samples collected, 1,815 samples submitted for gold analysis; |
|
|
● |
Rock sampling: 68 samples; |
|
|
● |
Hand auger sampling: 252 holes / samples; |
|
|
● |
Trenching: 6 trenches (319 meters), 214 channel samples. |
Soil / Rock Sampling; Methodology – Results
The first pass of the soil sampling survey was carried out using a classical digging tool called a “soso” to a typical depth 0.5 meters. Infill sampling in areas of interest was implemented by shallow auger sampling to a 1.0 meter depth. A total 1,815 soil samples were submitted for gold analysis.
TAL arbitrarily set the anomalous threshold for the soil sample results at 0.05 ppm gold based on past work experience in the Hwini-Butre / Benso-Subriso gold district. 123 out of the 1,815 soil samples (approx. 7%) returned gold values greater than the 0.05 ppm anomalous threshold. The soil geochemistry survey outlined a 8.0 km long by approximately 0.6 km wide, gold-in-soil anomalous trend conforming to the regional NNE structural trend. This gold-in-soil anomaly (> 0.05 ppm Au) tends to be patchy in nature and / or to pinch-out along its 8.0 km extent. The term “ppm” represents “part per million” where 1 ppm = 1 gram per tonne (g/t) = 1,000 part per billion (ppb). Four areas (i.e. Zone A, B, C and D) within the defined gold-in-soil anomalous corridor were relative continuity and / or the favorable geological and structural settings of the gold-in-soil anomalies.
Zone A, located to the north of the town of Edum Banso, extends from gridline 14700N to 15200N (500 meters). Zone B, located to the northeast of the hamlet of Edum Dominase, extends from line 11300N to 12100N (800 meters). Zone C is an approximately 200 meter by 200 meter area located in the east-central portion of the concession. This zone is characterized by three (3) consecutive, strongly anomalous gold-in-soil values over a 50 meter distance on Line 11300N. Zone D consists of a NE-trending zone of discrete gold-in-soil values extending from L8200N to L9900N (1,700 meters) at the south-western extremity of the concession.
Based on geophysical interpretation, including airborne magnetic and radiometric data, the Zone C and Zone D gold-in-soil anomalies appear to be spatially associated with the contact between the Birimian Metavolcanics and the circular Mpohor Intrusive Complex.
- 43 -
A total of 68 rock (float) samples were collected during reconnaissance geological mapping carried out alongside the soil sampling. This rock sampling produced a single exploration-significant gold value from a float of iron oxide stained quartz located to the south of the Zone D gold-in-soil anomaly. Similarly to the Zone C and Zone D anomalies this anomalous quartz float also appears to lie proximate to the inferred metavolcanic-Mpohor Complex contact.
Deep Auger Sampling; Methodology – Results
As a follow up to the soil sampling a deep auger program was implemented on the four priority areas to test the geochemical signature of the gold-in-soil anomalies at depth within the saprolite horizon in order to better define trenching targets. A total of 252 sites were augered to an average depth of approximately 4.0 meters with a one (1) meter sample collected from the saprolite horizon at the bottom of each hole. Auger hole spacing was typically 25 meters, with some 12.5 meter infilling.
TAL set the anomalous threshold for the auger sample results at 0.10 ppm gold based on past work experience in the Hwini-Butre / Benso-Subriso gold district. 19 (7.5%) out of the 252 deep auger samples returned gold values greater than the 0.10 ppm anomalous threshold.
Manual Trenching; Methodology – Results
The Zone A and Zone D deep auger anomalies (> 0.10 ppm Au) were further tested by three (3) trenches totaling 160 meters and three (3) trenches totaling 159 meters, respectively. The trenches were manually excavated with pickaxes and shovels to a vertical depth of 4 meters. A total of 214 channel samples were collected from the sidewall of the six (6) trenches totaling 319 meters. Samples consisted of horizontal channels, typically 1 meter or 2 meters in length, cut approximately 0.1 meter above the floor of the trench.
The Zone A trenching failed to yield any significant gold results. Trench EBTR005 yielded the only exploration – significant gold results from the Zone D trenching in the form of a length-weighted average grade of 1.23 ppm gold over a 4 meter trench-length (2 samples). The anomalous section is characterized by chlorite altered mafic metavolvanic rock hosting fine, iron oxide stained, quartz stringers.
Results / Recommendations
Although the Edum Banso Phase I Work Program only yielded limited exploration-significant gold results, the spatial association of the Zone C and Zone D gold-in-soil and deep auger anomalies, the anomalous trench EBTR005 channel samples, and the auriferous quartz float, with the geophysically interpreted, north-western rim of the Mpohor Intrusive Complex is of considerable exploration significance.
Economically significant gold mineralization is known to exist along the south- eastern margin of the circular Mpohor Complex, approximately 2 km to the south-east of the Edum Banso concession. Although published information, geophysical interpretation, and the results of the present work program indicate that the Edum Banso concession shares a similar geological / structural setting as the deposits located on the south- eastern rim of the Mpohor Complex, it by no means implies that the Edum Banso property hosts similar mineral deposits.
Recommended work to further advance the project includes: (a) additional deep auger sampling of the Zone C and Zone D gold-in-soil anomalies; (b) continued reconnaissance geology and rock (float) sampling along the inferred margin of the Mpohor Complex; and (c) detail structural interpretation of the property area based on the airborne magnetic and radiometric data. Further exploration activities will be planned once an ongoing geological, geochemical and geophysical data compilation has been completed. As at the date of this Report, we have not planned to conduct any exploration activities on this project during the next 12 months, however, we may consider doing so at a later date.
Resources
No ore resources have been identified on our Edum Banso Project.
|
Item 3. |
LEGAL PROCEEDINGS |
Neither our company nor any of our subsidiaries is a party or of which any of our property is the subject in any material pending legal proceedings that exceeds 10% of our current assets and our subsidiaries on a consolidated basis. Our company was party to a lawsuit for the sum of $121,336.66 filed in the Ghanaian courts pertaining to payment for excavation services provided by a subcontractor. We believed the debt had previously been discharged through the transfer of shares to the subcontractor in 2008. As at the date of this Report, the lawsuit has been settled and we agreed to pay $108,000 to the subcontractor in return for the shares previously issued. Upon payment by our company of $108,000, the shares were returned to us and cancelled.
- 44 -
|
Item 4. |
SUBMISSION OF MATTERS TO A VOTE OF SECURITY HOLDERS |
No matters were submitted to a vote of our security holders, through the solicitation of proxies or otherwise, during the fourth quarter ended December 31, 2009.
PART II
|
Item 5. |
MARKET FOR REGISTRANT’S COMMON EQUITY, RELATED STOCKHOLDER MATTERS AND ISSUER PURCHASES OF EQUITY SECURITIES |
Market information
|
|
(i) |
Bid and ask prices for our common stock are quoted from broker dealers on the OTCBB under the symbol “XTGR”. |
|
|
(ii) |
The following table sets forth the range of high and low bid prices for our common stock on the OTCBB for each full quarterly period within the two most recent fiscal years and any subsequent interim period for which financial statements are included, or are required to be included by Article 3 of Regulation S-X. The quotations reflect inter-dealer prices and do not include mark-ups or mark-downs or commissions and do not represent actual transactions. |
|
PERIOD |
HIGH BID |
LOW BID |
|
October 1, 2009 through December 31, 2009 |
$1.15 |
$0.83 |
|
July 1, 2009 through September 30, 2009 |
$1.03 |
$0.57 |
|
April 1, 2009 through June 30, 2009 |
$0.76 |
$0.39 |
|
January 1, 2009 through March 31, 2009 |
$0.77 |
$0.36 |
|
October 1, 2008 through December 31, 2008 |
$1.50 |
$0.25 |
|
July 1, 2008 through September 30, 2008 |
$1.73 |
$1.10 |
|
April 1, 2008 through June 30, 2008 |
$2.05 |
$1.21 |
|
January 1, 2008 through March 31, 2008 |
$1.45 |
$1.15 |
|
October 1, 2007 through December 31, 2007 |
$1.40 |
$0.90 |
|
July 1, 2007 through September 30, 2007 |
$1.35 |
$0.55 |
|
April 1, 2007 through June 30, 2007 |
$1.14 |
$0.66 |
|
January 1, 2007 through March 31, 2007 |
$0.98 |
$0.67 |
|
October 1, 2006 through December 31, 2006 |
$1.30 |
$0.60 |
|
July 1, 2006 through September 30, 2006 |
$1.30 |
$0.90 |
|
April 1, 2006 through June 30, 2006 |
$1.28 |
$0.96 |
|
January 1, 2006 through March 31, 2006 |
$1.25 |
$0.94 |
The last reported sales price of our common stock on OTCBB on March 29, 2010 was $1.12.
Holders
As of March 29, 2010, we have 563 shareholders of record holding 33,400,586 issued and outstanding Shares having a par value of $0.001 per common share.
Dividends
We have never declared or paid any cash dividends on our common stock. We intend to retain future earnings, if any, to finance the expansion of our business, and we do not anticipate that any cash dividends will be paid in the foreseeable future. Any future determination to pay dividends will be at the discretion of our Board and will depend on our earnings, capital requirements, expansion plans, financial condition and other relevant factors. Our retained earnings deficit currently limits our ability to pay dividends.
- 45 -
Securities Authorized for Issuance Under Equity Compensation Plans
The following table sets forth information relating to our outstanding equity compensation plans as of December 31, 2009:
|
|
NUMBER OF SECURITIES TO BE ISSUED UPON EXERCISE OF OUTSTANDING OPTIONS, WARRANTS AND RIGHTS |
WEIGHTED AVERAGE EXERCISE PRICE OF OUTSTANDING OPTIONS, WARRANTS AND RIGHTS |
NUMBER OF SECURITIES REMAINING AVAILABLE FOR FUTURE ISSUANCE UNDER EQUITY COMPENSATION PLANS (INCUDING SECURITIES REFLECTED IN COLUMN (A) |
|
Equity Compensation Plans Approved by Security Holders |
N/A |
N/A |
N/A |
|
Equity Compensation Plans Not Approved by Security Holders |
|
|
|
|
2005 Equity Incentive Compensation Plan (1) |
972,000 |
$ 0.73 |
1,928,000 |
|
|
|
|
|
|
TOTAL |
972,000 |
$ 0.73 |
1,928,000 |
|
(1) |
As of December 31, 2009, 100,000 options have been exercised under the 2005 Equity Incentive Compensation Plan by our former Project Manager, Operations. |
A description of our 2005 Equity Incentive Compensation Plan is contained later in this Report under Part III, Item 11 – “Executive Compensation - Stock Option Plans”.
Recent Sales of Unregistered Securities; Use of Proceeds from Registered Securities
We have not sold any unregistered equity securities during the period covered by this Report, other than those previously reported in our quarterly reports on Form 10-Q or in our current reports on Form 8-K filed with the Securities and Exchange Commission.
|
Item 6. |
SELECTED FINANCIAL DATA |
As a smaller reporting company, we are not required to provide the information required under this item.
|
Item 7. |
MANAGEMENT’S DISCUSSION AND ANALYSIS OF FINANCIAL CONDITIONS AND RESULTS OF OPERATIONS |
The following discussion and analysis of our consolidated financial conditions and results of operations for the year ended December 31, 2009 and 2008 should be read in conjunction with the consolidated financial statements and the related notes to our consolidated financial statements and other information presented elsewhere in this Report. The following discussion contains forward-looking statements that reflect our plans, estimates and beliefs. Our actual results could differ materially from those discussed in the forward-looking statements. Factors that could cause or contribute to such differences include, but are not limited to those discussed below and elsewhere in this Report, particularly in the item entitled “Risk Factors” beginning on page 7 of this Report. Our consolidated audited financial statements are stated in United States Dollars and are prepared in accordance with United States Generally Accepted Accounting Principles.
Plan of Operations
We are a gold exploration company engaged in the exploration of gold properties in the Republic of Ghana, West Africa. Our mining portfolio currently consists of 246.84 sq km comprised of 51.67 sq km for our Banso Project, 55.65 sq km for our Muoso Project, 33.65 sq km for our Apapam Project, 44.76 sq km for our Kwabeng Project, 40.51 sq km for our Pameng Project and 20.60 sq km for our Edum Banso Project, or 60,969 acres, pursuant to the leased and licensed areas set forth in our respective mining leases, prospecting licenses and/or option agreement.
Our strategic plan is, with respect to our gold projects: (i) to focus our efforts and dedicate our financial resources toward the potential to drill out a resource and, perhaps ultimately, a reserve of the Kibi Gold Trend located on our Apapam Project; (ii) to define a resource and, perhaps ultimately, a reserve on our other exploration projects; (iii) to enter into negotiations with independent Ghanaian contract miners and operators to assume our recovery of gold operations at our Kwabeng Project with a view to these contractors conducting recovery of gold operations for fixed payments to our company; and (iv) to acquire further interests in gold mineralized projects that fall within the criteria of providing a geological basis for development of drilling initiatives that can enhance shareholder value by demonstrating the potential to define reserves.
- 46 -
As part of our current business strategy, we plan to continue engaging technical personnel under contract where possible as Management believes that this strategy, at its current level of development, provides the best services available in the circumstances, leads to lower overall costs, and provides the best flexibility for our business operations.
We anticipate that our ongoing efforts, subject to adequate funding being available, will continue to be focused on the exploration and development of our Projects and completing acquisitions in strategic areas.
Our ability to continue to expand land acquisitions and drilling opportunities during the next 12 months is dependent on adequate capital resources being available. In October 2008, we temporarily suspended our operations at our Kwabeng Project while Management considered a more economic and efficient manner in which to extract and process the gold recovered from the mineralized material at this Project. As at the date of this Report, we have not planned to resume operations at our Kwabeng Project. During the next 12 months, we plan to (i) enter into negotiations to contract out the recovery of gold operations at this Project, as noted above; (ii) advance the development of our Kibi Gold Trend located on our Apapam Project by carrying out the Phase III Drill Program; and (iii) acquire further interests in mineral projects by way of acquisition or joint venture participation.
We anticipate that, over the next 12 months, we will spend an aggregate of approximately $2,000,000 comprised of $1,000,000 for exploration expenses in connection with our planned Phase III Drill Program of our Kibi Gold Trend located on our Apapam Project and approximately $1,000,000 for general and administrative expenses (which includes approximately $500,000 in non-cash expenses). However, we may not expend this amount unless we are able to raise additional capital. Upon completion of our planned exploration program at our Apapam Project, in particular, the Phase 3 Drill Program, we plan to spend an additional $5,000,000 in drilling expenditures in the Kibi Gold Trend to identify a potential resource. This $5,000,000 drilling program cannot be completed unless our company is successful in raising additional capital.
We require additional capital to implement our plan of operations. We anticipate that these funds primarily will be raised through equity and debt financing or from other available sources of financing. If we raise additional funds through the issuance of equity or convertible debt securities, it may result in the dilution in the equity ownership of investors in our common stock. There can be no assurance that additional financing will be available upon acceptable terms, if at all. If adequate funds are not available or are not available on acceptable terms, we may be unable to take advantage of prospective new opportunities or acquisitions, which could significantly and materially restrict our operations, or we may be forced to discontinue our current projects.
The cash proceeds derived from the sale of 12.40 fine ounces of gold recovered from the mineralized material at our Kwabeng Project during the year ended December 31, 2009, as discussed elsewhere in this Report, was categorized as Recovery of Gold. Since April 24, 2007 to December 31, 2009, we have recovered 8,814.82 fine ounces of gold from the mineralized material at our Kwabeng Project and derived cash proceeds of $6,843,965 from the related gold sales.
Results of Operations for the Year Ended December 31, 2009 Compared to the Year Ended December 31, 2008
Our loss for the year ended December 31, 2009 was $1,038,124 as compared to a loss of $3,231,403 for the year ended December 31, 2008, a decrease of $2,193,279. We incurred expenses of $2,105,612 in the year ended December 31, 2009 as compared to $6,239,722 in the year ended December 31, 2008, a decrease of $4,134,110. The decrease in expenses in the year ended December 31, 2009 can be primarily attributed to (a) a significant decrease in operational costs at our Kwabeng Project due to the suspension of operations at this Project since October 2008; and (b) limited or no exploration activities at our Banso and Muoso Project, our Edum Banso Project and our Pameng Project as compared to $5,140,679 expended on these Projects in the year ended December 31, 2008. Exploration expenses of $1,080,488 were incurred for the year ended December 31, 2009 as compared to $5,140,679 for the year ended December 31, 2008 and were primarily incurred in connection with drilling expenditures for our Phase II Drill Program at our Apapam Project, a trenching program at our Muoso Project, permitting costs and license renewal fees. General and administrative expenses (“G&A”) were $957,332 as compared to $1,035,369 for the year ended December 31, 2008. A down-sizing of management consultants, a significant reduction in legal costs and operational costs at our Kwabeng Project and a decrease in administrative costs in the year ended December 31, 2009 attributed to the decrease in our G&A.
Our loss for the year ended December 31, 2009 was less than our loss for the year ended December 31, 2008, partially due to (i) a significant net unrealized gain on trading securities of $789,934 (compared to a loss of $857,980 in 2008); and (ii) a foreign exchange gain of $303,243 (compared to a foreign exchange loss of $424,559 in 2008). Trading securities were comprised mostly of investments in common shares and income trust units of resource companies. The net unrealized gain can be attributed to an increase in the market value of those securities due to improved market conditions and less economic strain, in particular, the significant stability of the Canadian dollar in which our marketable securities are denominated.
- 47 -
Other items totaled a gain of $1,067,488 for the year ended December 31, 2009 compared to a gain of $3,008,319 for the year ended December 31, 2008. In particular, during the year ended December 31, 2009, due to the continued suspension of operations at our Kwabeng Project, we only recovered and sold 12.40 fine ounces of gold recovered from the mineralized material at this Project for cash proceeds of $10,958 which was booked as Recovery of Gold as compared to $4,140,765 for the year ended December 31, 2008. We had a foreign exchange gain of $303,243 for the year ended December 31, 2009 (2008 – loss of $424,559) which can be attributed to the sharp appreciation of the Canadian dollar. Additionally, the continuing weakness of the US dollar decreased our expenses that are denominated in other foreign currencies. Consequently, transactions denominated in US dollars would be less expensive.
Our portfolio of marketable securities had an unrealized gain of $789,934 (compared to an unrealized loss of $857,980 in 2008) due to improved market conditions and less economic strain than experienced in 2008. Our securities portfolio realized a loss of $172,638 on the sale of trading securities during the year ended December 31, 2009 compared to a gain in 2008 of $2,585. Other income of $138,558, derived from dividends, decreased on account of less investment activity during 2009 (2008 - $196,621). The decrease in our interest expense (2009 - $2,567; 2008 - $49,113) is largely attributable to our cessation of interest payable under convertible debentures due to the automatic conversion of the debentures in June 2008.
Our basic and diluted loss per share for the year ended December 31, 2009 was $0.03 compared to $0.11 per share for the year ended December 31, 2008. The weighted average number of shares outstanding was 32,101,330 at December 31, 2009 compared to 30,389,400 for the year ended December 31, 2008. The increase in the weighted average number of shares outstanding can be attributed to (i) the issuance of 2,100,875 shares in connection with private placement financings completed during fiscal 2009; and (ii) the repurchase and cancellation of 200,000 shares at $0.25 per share from a former shareholder of our company.
Liquidity and Capital Resources
Historically, our principal source of funds is our available resources of cash and cash equivalents and investments, as well as debt and equity financings. During the year ended December 31, 2009, we received cash proceeds of $10,958 derived from the sale of gold recovered from the mineralized material at our Kwabeng Project during this financial reporting period.
Unrealized Gain on Trading Securities
Unrealized gain on trading securities represents the change in value of securities as of the end of the financial reporting period. For the year ended December 31, 2009, we recognized an unrealized gain of $789,934 on trading securities, as compared to an unrealized loss of $857,980 for the year ended December 31, 2008. The change reflects a significant rebound in the value of our resource company investments following a significant decline during 2008. Trading securities were comprised mostly of investments in common shares and income trust units of resource companies.
Liquidity Discussion
Net cash provided by financing activities for the year ended December 31, 2009 was $1,612,710 (2008 - $2,489,460).
As of December 31, 2009, we had working capital equity of $2,119,159, comprised of current assets of $2,602,232 less current liabilities of $483,073. Our current assets were comprised mostly of $622,670 in cash and cash equivalents, $151,506 for a deposit on equipment and $1,781,594 in trading securities, which is based on our analysis of the ready saleable nature of the securities including an existing market for the securities, the lack of any restrictions for resale of the securities and sufficient active volume of trading in the securities. Our trading securities are held in our investment portfolio with an established brokerage in Canada in which we primarily invest in the common shares and income trust fund units of publicly traded resource companies.
We have historically relied on equity and debt financings to finance our ongoing operations. Existing working capital, possible debt instruments, anticipated warrant exercises, further private placements and anticipated cash flow are expected to be adequate to fund our operations over the next year. We have no lines of credit or other bank financing arrangements. Generally, we have financed operations to date through the proceeds of the private equity financings and a convertible debt financing. In connection with our business plan during the next 12 months, Management anticipates operating expenses as follows: (i) $1,000,000 for exploration activities, in particular, our planned Phase III Drill Program of our Kibi Gold Trend located on our Apapam Project; and (ii) $1,000,000 for general and administrative costs (which includes approximately $500,000 in non-cash expenses). Upon completion of our planned exploration program at our Apapam Project, in particular, the Phase 3 Drill Program, we plan to spend an additional $5,000,000 in drilling expenditures in the Kibi Gold Trend to identify a potential resource. This $5,000,000 drilling program cannot be completed unless our company is successful in raising additional capital.
- 48 -
Until we achieve profitability, we will need to raise additional capital for our exploration programs. We intend to finance these expenses with our cash proceeds and to the extent that our cash proceeds are not sufficient, then from further sales of our equity securities or debt securities, or from investment income. Thereafter, we may need to raise additional capital to meet long-term operating requirements. Additional financing may not be available upon acceptable terms, or at all. If adequate funds are not available or are not available on acceptable terms, we may not be able to take advantage of prospective new business endeavors or opportunities or existing agreements and projects which could significantly and materially restrict our business operations.
The independent auditors’ report accompanying our December 31, 2009 and December 31, 2008 consolidated financial statements contains an explanatory paragraph expressing doubt about our ability to continue as a going concern. The consolidated financial statements have been prepared “assuming that we will continue as a going concern”, which contemplates that we will realize our assets and satisfy our liabilities and commitments in the ordinary course of business.
Material Commitments
Mineral Property Commitments
Save and except for fees payable from time to time to (i) the Minerals Commission for an extension of an expiry date of a prospecting license (current consideration fee payable is $15,000) or mining lease or annual operating permits; (ii) the EPA for the issuance of permits prior to the commencement of any work at a particular concession or the posting of a bond in connection with any mining operations undertaken by our company; and (iii) a legal obligation associated with our mineral properties for clean up costs when work programs are completed, we are committed to expend an aggregate of less than $500 in connection with annual or ground rent and mining permits to enter upon and gain access to the following concessions and such other financial commitments arising out of any approved exploration programs in connection therewith:
|
|
(i) |
the Kwabeng concession (Kwabeng Project); |
|
|
(ii) |
the Pameng concession (Pameng Project); |
|
|
(iii) |
the Banso and Muoso concessions (Banso and Muoso Project); |
|
|
(iv) |
the Apapam concession (Apapam Project); and |
|
|
(v) |
the Edum Banso concession (Edum Banso Project). |
Upon and following the commencement of gold production at any of our Projects, a royalty of 5% of the net smelter returns is payable quarterly to the Government of Ghana.
With respect to the Edum Banso Project:
|
|
(a) |
$5,000 is payable to Adom Mining Limited (“Adom”) on the anniversary date of the Option Agreement in each year that we hold an interest in the agreement; |
|
|
(b) |
$200,000 is payable to Adom when the production of gold is commenced (or $100,000 in the event that less than 2 million ounces of proven and probable reserves are discovered on our project at this concession; and |
|
|
(c) |
an aggregate production royalty of 2% of the net smelter returns (“NSR”) from all ores, minerals and other products mined and removed from the project, except if less than 2 million ounces of proven and probable reserved are discovered in or at the Project, then the royalty shall be 1% of the NSR. |
Repayment of Convertible Debentures and Accrued Interest
We issued Convertible Debentures aggregating the face value of $900,000 in July 2005 under which interest was calculated at 7% per annum. Interest only payments were payable quarterly on the last days of September, December, March and June in each year of the term or until such time that the principal was repaid in the full. The Convertible Debenture holders were entitled, at their option, to convert, at any time and from time to time, until payment in full of their respective Convertible Debentures, all or any part of the outstanding principal amount of the Convertible Debenture, plus the Accrued Interest, into shares (the “Conversion Shares”) of our common stock at the conversion price of $1.00 per share (the “Conversion Price”). Each Convertible Debenture provided for the automatic conversion of the outstanding principal amount and all accrued but unpaid interest, into shares of our common stock, at the Conversion Price, in the event that our common stock traded for 20 consecutive trading days (a) with a closing bid price of at least $1.50 per share and (b) a cumulative trading volume during such twenty (20) trading day period of at least 1,000,000 shares.
- 49 -
In June 2008, we provided notice of the automatic conversion of the Convertible Debentures and in July 2008 we converted $650,000 of the aggregate principal of $900,000 of the Convertible Debentures by way of the issuance of 650,000 Conversion Shares. Subsequent to the year ended December 31, 2009, in February 2010 we converted the outstanding principal of $250,000 owing under one remaining Convertible Debenture by way of the issuance of 250,000 Conversion Shares.
Purchase of Significant Equipment
During the next 12 months, we do not expect to purchase significant equipment to conduct our exploration activities. During 2009, we purchased a new excavator to carry out trenching and drill pad activities. In addition, in connection with our exploration activities at our Projects, we own the equipment necessary to carry out such activities, except for a drill rig which we plan to rent.
Off Balance Sheet Arrangements
We have no off balance sheet arrangements.
Significant Accounting Applications
Application of Critical Accounting Policies
We believe the following critical accounting policies affect our more significant judgments and estimates used in the preparation of our financial statements.
Mineral Properties
The valuation of our mineral properties (the “Assets”) is based upon the fair value of cash or securities issued as consideration for the purchase of the Assets.
Asset Retirement Obligation
The fair value of our asset retirement obligation is recorded as liabilities when they are incurred. As such, the valuation could be affected by the following:
Costs - When work actually commences on asset retirement obligations, actual costs could materially differ from what has been projected. This would materially affect the value of the obligation.
Ghanaian laws and regulations - If the Government of Ghana approves or changes laws and regulations that affect mining operations in Ghana, the cost of meeting our asset retirement obligations could change materially.
Deferred Income Taxes
As we have no history of profitability and currently have derived limited cash proceeds, we have recognized a 100% valuation allowance on our future tax assets. If our company becomes profitable in the future, a material amount of these future tax assets could actually be realized.
Stock-based Compensation
Our company accounts for stock-based compensation under the provisions of ASC 718, “Compensation-Stock Compensation”. Under the fair value recognition provisions, stock-based compensation expense is measured at the grant date for all stock-based awards to employees and directors and is recognized as an expense over the requisite service period, which is generally the vesting period. The Black-Scholes option valuation model is used to calculate fair value.
Our company accounts for stock compensation arrangements with nonemployees in accordance with ASC 718 which require that such equity instruments are recorded at their fair value on the measurement date. The measurement of stock-based compensation is subject to periodic adjustment as the underlying equity instruments vest. Nonemployee stock-based compensation charges are amortized over the vesting period on a straight-line basis. For stock options granted to nonemployees, the fair value of the stock options is estimated using a Black-Scholes valuation model.
- 50 -
Recent Accounting Pronouncements
|
● |
During the third quarter of 2009, our company adopted the FASB Accounting Standards Codification and the Hierarchy of Generally Accepted Accounting Principles in accordance with FASB ASC Topic 105,”Generally Accepted Accounting Principles”(the Codification). The Codification has become the source of authoritative U.S. generally accepted accounting principles (GAAP) recognized by the FASB to be applied by nongovernmental entities. Rules and interpretive releases of the Securities and Exchange Commission (SEC) under authority of federal securities laws are also sources of authoritative GAAP for SEC registrants. Effective with our company’s adoption on July 1, 2009, the Codification has superseded all prior non-SEC accounting and reporting standards. All other non-grandfathered non-SEC accounting literature not included in the Codification has become non-authoritative. As the adoption of the Codification only affected how specific references to GAAP literature have been disclosed in the notes to our condensed consolidated financial statements, it did not result in any impact on our results of operations, financial condition, or cash flows. |
|
● |
In December 2007, the FASB issued authoritative guidance related to non-controlling interests in consolidated financial statements, which was an amendment of ARB No. 51. This guidance is set forth in ASC 810, Consolidation. ASC 810 establishes accounting and reporting standards for the non-controlling interest in a subsidiary and for the deconsolidation of a subsidiary. This accounting standard is effective for fiscal years beginning on or after December 15, 2008, which for the Company was the fiscal year beginning January 1, 2009. The Company adopted ASC 810 at January 1, 2009, which resulted in $76,629 allocated to the non-controlling interest. |
|
● |
In September 2009, the FASB issued authoritative guidance regarding multiple-deliverable revenue arrangements. This guidance addresses how to separate deliverables and how to measure and allocate consideration to one or more units of accounting. Specifically, the guidance requires that consideration be allocated among multiple deliverables based on relative selling prices. The guidance establishes a selling price hierarchy of (1) vendor-specific objective evidence, (2) third-party evidence and (3) estimated selling price. This guidance is effective for annual periods beginning after June 15, 2010 but may be early adopted as of the beginning of an annual period. The Company is currently evaluating the effect that this guidance will have on consolidated financial position and results of operations. |
|
● |
ASC 855-10-20, “Subsequent Events” establishes accounting and reporting standards for events that occur after the balance sheet date but before financial statements are issued or are available to be issued and requires the disclosure of the date through which a company has evaluated subsequent events. This statement is effective for our third quarter ended September 30, 2009 and the adoption did not have an impact on the condensed consolidated financial statements. See Note 17 for the required disclosures. |
|
● |
In April 2009, the FASB issued ASC 820-10-65 formerly FASB Staff Position FAS 157-4, “Determining Fair Value When the Volume and Level of Activity for the Asset or Liability Have Significantly Decreased and Identifying Transactions That Are Not Orderly” (“FSP 157-4”). This provides significant guidance for determining when a market has become inactive as well as guidance for determining whether transactions are not orderly. It also provides guidance on the use of valuation techniques and the use of broker quotes and pricing services. It reiterates that fair value is based on an exit price and also that fair value is market-driven and not entity-specific. The accounting standard of codification applies to all assets and liabilities within the scope of ASC 820 and is effective for all interim and annual periods ending after June 15, 2009. The adoption of ASC 820-10-65 did not have a material effect on our results of operations, financial position, and cash flows. |
|
● |
In April 2009, the FASB issued ASC 320-10-65, formerly FASB Staff Position FAS 115-2, FAS 124-2 and EITF 99-20-2, “Recognition and Presentation of Other-Than-Temporary Impairments” (“FSP 115-2”). This accounting standard provides guidance related to determining the amount of an other-than-temporary impairment (OTTI) of debt securities and prescribes the method to be used to present information about an OTTI in the financial statements. It is effective for all interim and annual periods ending after June 15, 2009. The adoption of FSP 115-2 did not have a material effect on our results of operations, financial position, and cash flows. |
|
● |
In April 2009, the FASB issued ASC 825-10-65, formerly FASB Staff Position FAS 107-1 and APB 28-1, “Interim Disclosures about Fair Value of Financial Instruments” (“FSP 107-1”), which increases the frequency of fair value disclosures to a quarterly basis instead of an annual basis. The guidance relates to fair value disclosures for any financial instruments that are not currently reflected on the balance sheet at fair value. This ASC is effective for interim and annual periods ending after June 15, 2009. The adoption did not have a material effect on our results of operations, financial position, and cash flows. |
We do not anticipate that the adoption of the foregoing pronouncements will have a material effect on our company’s consolidated financial position or results of operations.
- 51 -
|
Item 7A. |
QUANTITATIVE AND QUALITATIVE DISCLOSURES ABOUT MARKET RISK |
As a smaller reporting company, we are not required to provide the information required under this item.
|
Item 8. |
FINANCIAL STATEMENTS AND SUPPLEMENTARY DATA |
Our financial statements are contained in pages F-1 through F-29, which appear at the end of this annual report.
|
Item 9. |
CHANGES IN AND DISAGREEMENTS WITH ACCOUNTANTS ON ACCOUNTING AND FINANCIAL DISCLOSURE |
There have been no changes in and disagreements with our accountants on accounting and financial disclosure from the inception of our company through to the date of this Report.
|
Item 9A(T). |
CONTROLS AND PROCEDURES |
Disclosure Controls and Procedures
Our management, including our Chief Executive Officer who also serves as our Chief Financial Officer, evaluated the effectiveness of our disclosure controls and procedures (as defined in Exchange Act Rule 13a-15(e)) as of the end of the period covered by this Report.
Based on that evaluation, our Chief Executive Officer concluded that as of the end of the period covered by this Report our disclosure controls and procedures were not effective such that the information required to be disclosed in our Securities and Exchange Commission reports (i) is recorded, processed, summarized and reported within the time periods specified in SEC rules and forms; and (ii) is accumulated and communicated to our management, including our Chief Executive Officer, to allow timely decisions regarding required disclosure. Our Chief Executive Officer is not a financial or accounting professional, and we lack any accounting staff who are sufficiently trained in the application of U.S. generally accepted accounting principles. Until such time as we hire a chief financial officer or similarly titled person with the requisite experience in the application of U.S. GAAP, there is a likelihood that we may experience material weaknesses in our disclosure controls that may result in errors in our financial statements in future periods.
Our management, including our Chief Executive Officer, does not expect that our disclosure controls and procedures or our internal controls will prevent all error and all fraud. A control system, no matter how well conceived and operated, can provide only reasonable, not absolute, assurance that the objectives of the control system are met. Further, the design of a control system must reflect the fact that there are resource constraints and the benefits of controls must be considered relative to their costs. Due to the inherent limitations in all control systems, no evaluation of controls can provide absolute assurance that all control issues and instances of fraud, if any, within our company have been detected.
Management’s Report on Internal Control over Financial Reporting
As we were not subject to the reporting requirements of the Securities Exchange Act of 1934 at December 31, 2009, our management was not then required to assess the effectiveness of our internal control over financial reporting as of December 31, 2009 pursuant to Section 404 of the Sarbanes-Oxley Act of 2002.
This annual report does not include an attestation report of our independent registered public accounting firm regarding internal control over financial reporting. Management’s report was not subject to attestation by our registered public accounting firm pursuant to temporary rules of the Securities and Exchange Commission that permit us to provide only management’s report in this annual report.
Changes in Internal Control over Financial Reporting
There has been no change in our internal control over financial reporting identified in connection with our evaluation that occurred during the last fiscal quarter that have materially affected, or are reasonably likely to materially affect, our internal control over financial reporting.
|
Item 9B. |
OTHER INFORMATION |
None.
- 52 -
PART III
|
Item 10. |
DIRECTORS, EXECUTIVE OFFICERS AND CORPORATE GOVERNANCE |
Directors and Executive Officers
The following individuals serve as our executive officers and members of our Board:
|
Name |
Age |
Position |
|
James Longshore |
43 |
President, Chief Executive Officer, Chief Financial Officer and Director |
|
Richard W. Grayston |
65 |
Chairman of the Board and Director |
|
Peter Minuk |
45 |
Director and Secretary and Treasurer |
|
Robert H. Montgomery |
48 |
Director |
|
Paul Zyla |
65 |
Director |
|
Yves Pierre Clement |
45 |
Vice-President, Exploration |
|
Victor Nkansa |
51 |
Vice-President, Ghana Operations |
|
Alhaji Nantogma Abudulai |
67 |
Vice-President, Community Relations |
James Werth Longshore, BA, Economics
President (Principal Executive Officer), Principal Financial Officer and Director
Mr. Longshore is one of the founders of our company and was appointed as President in March 2007 and a director in November 2006. Mr. Longshore has been a director of our Ghanaian subsidiaries, XGEL and XOG Ghana, since April 2006 and XG Mining, since June 2006 and an officer and director of Xtra Energy since March 2007. Mr. Longshore has approximately 18 years of business experience. Since 1995 to the present, Mr. Longshore has been President of Brokton International Ltd. (“Brokton”), a Turks & Caicos Islands, British West Indies based private investment company focused on investing in natural resource companies. Since February 2004 until February 2006, Mr. Longshore has provided financial advisory consulting services to our company through his corporation, Brokton. From 1990 to 1995, he was a salesman for UNUM Insurance Company selling in both the United States and Canada.
During the prior five years, Mr. Longshore has not been an officer and/or director of any other public companies.
In August 2002, Mr. Longshore, formerly known as James Pincock, entered into a settlement agreement and order with the Ontario Securities Commission (the “OSC”). Pursuant to a settlement agreement reached between the OSC and Mr. Longshore, he voluntarily agreed to abide by the order which included, among other things, that he cease trading in securities for five years from the date of the order (until August 27, 2007), with the exception that after three years he can trade in securities beneficially owned by him in his personal accounts in his name, and that he be prohibited from becoming or acting as an officer or director of any issuer in Ontario or an officer or director of any issuer which has an interest directly or indirectly in any registrant, for a period of five years. Mr. Longshore paid the OSC approximately $17,740 for cost incurred by the OSC and its Staff with respect to the proceeding. Mr. Longshore disclosed this matter to the company prior to his appointment as a director and advised that as he was a non-resident of Ontario at the relevant time, he had sought, relied and acted upon poor financial and legal advice of Ontario advisors and completed certain securities transactions which ultimately gave rise to the Order.
Mr. Longshore devotes approximately 90% of his time to our company. He currently provides 10% of his time to unrelated companies. During 2009, through Brokton, he entered into a management consulting agreement with our company to provide services as the general manager to XG Mining and XGEL. The renewal of this agreement for 2010 is currently being reviewed by the Compensation Committee.
Richard Walter Grayston
Chairman and Director
Mr. Grayston was appointed as Chairman and a director of our company in March 2007. Since 1985, Mr. Grayston has been a self-employed business consultant with more than 25 years of experience in financial and economic consulting and public company management including preparation of valuations, feasibility studies, capital budgeting, financial reorganizations, profit improvement studies and business plans and going public and business brokerage during which time he has provided his consulting services to oil and gas, mineral exploration, technology, manufacturing, retail and wholesale consumer businesses.
Mr. Grayston received a Ph.D. in Finance and Economics from the University of Chicago in 1971, a MBA from the University of Chicago in 1969, a BA of Commerce from the University of British Columbia in 1966 and has been a certified general accountant since 1977.
During the prior five years, Mr. Grayston has been an officer and/or director of the following public companies.
- 53 -
|
Name of Company |
Position(s) Held |
Term of Office |
|
|
|
|
|
Verbina Resources Inc. (1) |
Director |
November 2009 to present |
|
Ruby Red Resources Inc. (2) |
President and Chief Executive Officer |
October 2009 to present |
|
|
Interim Chief Financial Officer and |
October 2009 to |
|
|
Vice President, Finance |
December 2009 |
|
|
Chief Financial Officer and |
August 2008 to December 2009 |
|
|
Vice President Finance |
August 2008 to December 2009 |
|
Ranger Canyon Energy Inc. (3) |
Director |
May 2008 to present |
|
|
Chief Executive Officer and |
October 2008 to present |
|
|
Chief Financial Officer |
October 2008 to present |
|
New Cantech Ventures Inc. (4) |
Director |
January 1991 to May 2008 |
|
|
(1) |
Verbina Resources Inc. is a mineral exploration TSX Venture Exchange (the “TSXV”) listed issuer. |
|
|
(2) |
Ruby Red Resources Inc. is a mineral exploration TSXV listed issuer. |
|
|
(3) |
Ranger Canyon Energy Inc. is a private Alberta, Canada oil and gas company seeking listing on the TSXV. |
|
|
(4) |
New Cantech Ventures Inc. is an oil and gas and mineral exploration (diamonds and gold) TSXV listed issuer. |
Peter Minuk
Secretary and Treasurer and Director
Mr. Minuk was appointed as Vice-President, Finance (“VP, Finance”) and a director of our company in March 2007. He resigned as VP, Finance effective January 31, 2009 and was subsequently appointed Secretary and Treasurer on August 11, 2009 following the resignation of Kiomi Mori from this office. Mr. Minuk has more than 22 years of experience in finance and investment as well as experience in project management, training and developing staff and client relationships. From February 1, 2009 to May 31, 2009, he provided limited consulting services to our company. From June 1, 2009 to the present, Mr. Minuk has been a business analyst consultant for Industry Canada where he is responsible for reviewing proposals relating to regional development of public infrastructure projects and provides oversight over 40 projects assigned to him by the Federal Development Ontario Department which is responsible for administering a variety of government stimulus programs, resources and initiatives for the southern Ontario region. Prior to joining our company, from 1990 to 2006, Mr. Minuk was employed by BMO InvestorLine (“BMO”) in connection with implementing project management protocols. Mr. Minuk received a Masters Certificate in Project Management from the Schulich School of Business, York University in 2005. He obtained his FCSI (Fellow of the Canadian Securities Institute) in 1989 and completed the Business Administration program from Southern Alberta Institute of Technology in 1985.
During the prior five years, Mr. Minuk has not been an officer and/or director of any other public companies.
Mr. Minuk devotes approximately 10% of his time in consulting services to our company. He provides 90% of his time to unrelated companies. There is no management consulting agreement in force at this time nor has Mr. Minuk entered into a non-competition and non-disclosure agreement with our company.
Robert Hudson Montgomery, CA
Director
Mr. Montgomery was appointed as a director of our company in March 2007. Mr. Montgomery has more than 15 years of experience as a chartered accountant and auditor. Since September 2009 to the present, he has been a consultant to the Royal Bank of Canada, Capital Markets, Product Finance. Prior thereto, Mr. Montgomery was a consultant to CIBC Mellon, Internal Audit and Corporate Compliance Department (September to November 2008) and a consultant to Bank of Montreal, Corporate Audit Department (August 2007 to June 2008). Since February 2004 to June 2008, Mr. Montgomery has been a Sarbanes Oxley contractor to the Canadian Imperial Bank of Commerce (CIBC), from February 2004 to January 2005, the Bank of Montreal (BMO) from January to September 2005, Dundee Wealth Management, a major Canadian investment dealer from September 2005 to December 2006 where he was responsible for documentation and testing of key financial and non-financial controls for various lines of business and assisted in the preparation and transfer of Sarbanes Oxley audit files and supporting documentation from their project groups to internal and external auditors, and the Toronto Dominion Bank from May to August 2007. He was not employed during the periods November 2008 to January 2009, July to September 2008 and January to May 2007).
Mr. Montgomery assisted in the design of process narrative and control testing documents, planned and supervised the control testing program at a major Canadian investment dealer and assisted in the remediation of control gaps and weaknesses identified during the testing process and as identified by its external auditors. At CIBC, Mr. Montgomery assisted in the update and maintenance a database identifying key accounts, linking them to controls procedures, testing and lines of business and assisted in the remediation of control gaps and weaknesses identified during the testing process. He obtained his Chartered Accountant designation from the Institute of Chartered Accountants of Ontario in 1994 and a BA, Double Major Economics and Geography from the University of Victoria, Victoria, British Columbia in 1985.
- 54 -
During the prior five years, Mr. Montgomery has not been an officer and/or director of any other public companies.
Paul Norman Zyla
Director
Mr. Zyla was appointed as a director of our company in January 2010. Mr. Zyla has over 25 years of resource-based public company experience. Since September 1993 to the present, Mr. Zyla has been a self-employed consultant to the mining industry. Mr. Zyla was the former President, Secretary and Treasurer and a director of our company from November 2003 to August 2005.
During the prior five years, Mr. Zyla has been an officer and/or director of the following public companies:
|
Name of Company |
Position(s) Held |
Term of Office |
|
|
|
|
|
Verbina Resources Inc. (1) |
President, Secretary-Treasurer |
November 2009 to present |
|
|
and Director |
|
|
|
(1) |
Verbina Resources Inc. is mineral exploration TSXV listed issuer. |
Yves Pierre Clement, P. Geo.
Vice-President, Exploration
Mr. Clement was appointed Vice-President, Exploration of our company in May 2006. Mr. Clement has over 21 years experience in the generation, evaluation and development of a wide variety of mineral resources hosted by a broad spectrum of geological environments in Canada and South America. Prior to joining our company, Mr. Clement was senior project geologist for Lake Shore Gold Corp. in the Timmins lode gold camp from August 2005 to April 2006 and was formerly exploration manager for Aurora Platinum Corp.’s Sudbury operations from August 2000 to July 2005. Prior to joining Aurora, Mr. Clement was senior project geologist/exploration manager for Southwestern Resources Corp. where he was responsible for the generation of precious and base metal exploration opportunities in Peru and Chile. Mr. Clement’s experience will allow us to further maximize the value of our existing portfolio of projects, as well as allowing us to expand our strategy of growth through strategic acquisitions.
During the prior five years, Mr. Clement has been an officer and/or director of the following public companies:
|
Name of Company |
Position(s) Held |
Term of Office |
|
|
|
|
|
Ginguro Exploration Inc. (1) |
Vice President, Exploration |
March 2005 to July 2009 |
|
|
(1) |
Ginguro Exploration Inc. is a gold exploration TSXV listed issuer. |
Mr. Clement devotes approximately 90% of his time in consulting services to our company. He provides 10% of his time to unrelated companies. Our company and Mr. Clement entered into a management consulting agreement on May 1, 2006 for a three year term expiring on May 1, 2009. Prior to the expiration of this agreement, we mutually agreed to renew this agreement for a further one year term (see “Management Consulting Agreement with Vice-President, Exploration”). Mr. Clement has not entered into a non-competition and non-disclosure agreement with our company.
Victor Nkansa, CA, BA, Economics, MBA, Finance
Vice-President, Ghana Operations
Mr. Nkansa was appointed as Vice-President, Ghana Operations of our company in December 2009. Mr. Nkansa has assumed the responsibilities of this position previously held by Mr. Abudalai, which includes overseeing our operations in Ghana under the supervision of our President, James Longshore, who is also the President and General Manager of our Ghanaian subsidiaries. Mr. Nkansa is also the Secretary and a director of our Ghanaian subsidiaries. He is familiar and experienced with respect to obtaining mining permits, prospecting and reconnaissance licenses and the government regulations relating thereto and is knowledgeable in connection with environmental and forestry issues, immigration and customs affairs. His experience and background will assist us with respect to acquiring approvals, prospecting licenses, mining leases and related permits and renewals from the relevant government authorities in order to advance our operations in Ghana and acting as our primary government liaison in connection therewith. Mr. Nkansa has more than 26 years of business experience, the last 12 years of which have been in the mining industry. Since 2004, he has been the Controller of our Ghanaian subsidiaries where his responsibilities included the provision of accounting services and assisting with the facilitation of license renewals with respect to our property interests.
During the prior five years, Mr. Nkansa has not been an officer and/or director of any other public companies.
- 55 -
As at the date of this Report, Mr. Nkansa devotes a variable amount of his time in consulting services to our company, as he is currently engaged on an “as needed” basis. There is no management consulting agreement in force at this time. He has not entered into a non-competition and non-disclosure agreement with our company.
Alhaji Nantogma Abudulai, BA
Vice-President, Community Relations
Mr. Abudulai was appointed as Vice-President, Community Relations of our company in December 2008. He was formerly Vice-President, Ghana Operations of our company from April 2005 to December 2008. He is the former Secretary and President, Community Relations and a director of our Ghanaian subsidiaries which positions he resigned from in December 2008. Mr. Abudulai has more than 15 years of business experience in the mining industry. Since 1994 to the present, he has been the managing director of CME (Ghana) Ltd. and a director of CME (Nigeria) Ltd. where his responsibilities included protocol and coordination of government and local authority affairs in Ghana and overseeing logistical support. He is also the President of the Canadian Business Association in Ghana. Mr. Abudulai’s primary responsibilities with our company are the continued improvement of community relations on behalf of our Ghanaian subsidiaries.
During the prior five years, Mr. Abudulai has not been an officer and/or director of any other public companies:
As at the date of this Report, Mr. Abudulai devotes a variable amount of his time in consulting services to our company, as he is currently engaged on an “as needed” basis. He provides the majority of his time to unrelated companies. There is no management consulting agreement in force at this time. He previously entered into a non-disclosure agreement with our company which remains in force.
There are no family relationships between any of the executive officers and directors. Each director currently holds office until he resigns or his successor is elected at an annual stockholders’ meeting.
Consultants
One of our business strategies is to outsource other services as required by our company from time to time by engaging consultants on an “as needed” basis or entering into special purpose contracts with a view to maintaining our overhead at a reasonable, affordable cost.
Compliance with Section 16(a) of the Exchange Act
We are not currently subject to Section 16(a) of the Securities Exchange Act of 1934, and, therefore, our directors and executive officers, and persons who own more than 10% of our common stock are not required to file with the Securities and Exchange Commission reports disclosing their initial ownership and changes in their ownership of our common stock.
Corporate Governance Matters
Audit Committee
While we are not currently subject to any law, rule or regulation requiring that we establish or maintain an audit committee, our Board determined it advisable and in the best interests of our stockholders to establish an audit committee (the “Audit Committee”) in November 2009.
Our Audit Committee assists the Board in fulfilling its oversight responsibility relating to:
|
|
● |
the integrity of our financial statements; |
|
|
● |
our compliance with legal and regulatory requirements; and |
|
|
● |
the qualifications and independence of our independent registered public accountants. |
Our Audit Committee has adopted a written charter pursuant to which the committee provides: (i) an independent review and oversight of our company's financial reporting processes, internal controls and independent auditors; (ii) a forum separate from Management in which auditors and other interested parties can candidly discuss concerns. By effectively carrying out its functions and responsibilities, our Audit Committee helps to ensure that: (i) Management properly develops and adheres to a sound system of internal controls; (ii) procedures are in place to objectively assess Management's practices and internal controls; and (iii) the outside auditors, through their own review, objectively assess our company's financial reporting practices. Our Audit Committee is directly responsible for the appointment, compensation, retention and oversight of the work of any registered public accounting firm engaged for the purpose of preparing or issuing an audit report or performing other audit, review or attest services for our company.
- 56 -
Our Audit Committee is composed of two directors; namely Richard Grayston, who is also Chairman of our Audit Committee and Robert Montgomery, both of whom have been determined by the Board to be “independent,” as defined in the Marketplace Rules of the NASDAQ.
Board of Directors Independence
Our Board consists of five members. Although, we are not currently subject to any law, rule or regulation requiring that all or any portion of our Board include “independent” directors, three of our directors are considered to be “independent” directors, as defined in the Marketplace Rules of the NASDAQ.
Audit Committee Financial Expert
Each of Richard Grayston and Robert Montgomery is an “audit committee financial expert” within the meaning of Item 401(h)(1) of Regulation S-K. In general, an “audit committee financial expert” is an individual member of the audit committee who (a) understands generally accepted accounting principles and financial statements, (b) is able to assess the general application of such principles in connection with accounting for estimates and accruals, (c) has experience preparing, auditing, analyzing or evaluating financial statements comparable to the breadth and complexity of issues that can reasonably be expected to be raised by the company’s financial statements, (d) understands internal controls over financial reporting (e) understands audit committee functions, and (f) is an independent director.
Code of Ethics
In December 2009, we adopted a new and expanded Code of Ethics applicable to our principal executive officer, principal financial and accounting officers and persons performing similar functions. A Code of Ethics is a written standard designed to deter wrongdoing and to promote (a) honest and ethical conduct, (b) full, fair, accurate, timely and understandable disclosure in regulatory filings and public statements, (c) compliance with applicable laws, rules and regulations, (d) the prompt reporting violation of the code and (e) accountability for adherence to the Code. A copy of our Code of Ethics is filed as an exhibit to this Report. We will provide a copy of our Code of Ethics, without charge, to any person desiring a copy of the Code of Ethics, by written request to us at our principal offices.
Nominating and Corporate Governance Committee
We established a nominating and governance committee in November 2009. The Nominating and Corporate Governance Committee has adopted a written charter pursuant to which the committee: (i) recommends the slate of director nominees for election to our Board; (ii) identifies and recommends candidates to fill vacancies on our Board; (iii) reviews the composition of Board committees; and (iv) monitors compliance with, reviews and recommends changes to our various corporate governance policies and guidelines.
The committee also prepares and supervises the Board’s annual review of director independence and the Board’s annual self-evaluation. The Nominating and Corporate Governance Committee is composed of two directors, both of which have been determined by the Board to be “independent,” as defined in the Marketplace Rules of the NASDAQ.
A majority of the persons serving on our Board must be “independent”. Thus, the committee has considered transactions and relationships between each director or any member of his immediate family and us or our affiliates, including those reported under “Certain Relationships and Related Transactions” below. The committee also reviewed transactions and relationships between directors or their affiliates and members of our senior management or their affiliates. As a result of this review, the committee affirmatively determined that each of Messrs. Grayston, Montgomery and Zyla are independent.
Nomination of Directors
The committee considers all qualified candidates for our Board identified by members of the committee, by other members of the Board, by senior management and by our stockholders. The committee reviews each candidate including each candidate’s independence, skills and expertise based on a variety of factors, including the person’s experience or background in management, finance, regulatory matters and corporate governance. Further, when identifying nominees to serve as director, the Nominating and Corporate Governance Committee seeks to create a Board that is strong in its collective knowledge and has a diversity of skills and experience with respect to accounting and finance, management and leadership, vision and strategy, business operations, business judgment, industry knowledge and corporate governance. In addition, prior to nominating an existing director for re-election to the Board, the Nominating and Corporate Governance Committee will consider and review an existing director’s Board and committee attendance and performance, length of Board service, experience, skills and contributions that the existing director brings to the Board, equity ownership in our company and independence.
- 57 -
The committee follows the same process and uses the same criteria for evaluating candidates proposed by members of the Board, members of senior management and stockholders. Based on its assessment of each candidate, the committee recommends candidates to the Board. However, there is no assurance that there will be any vacancy on the Board at the time of any submission or that the committee will recommend any candidate for the Board.
Compensation Committee
We established a compensation committee (the “Compensation Committee”) in November 2009. The Compensation Committee has adopted a written charter pursuant to which the committee is responsible for overseeing our compensation programs and practices, including our executive compensation plans and incentive compensation plans. Our Chief Executive Officer provides input to the Compensation Committee with respect to the individual performance and compensation recommendations for the other executive officers. Although the committee’s charter authorizes the committee to retain an independent consultant, no third party compensation consultant was engaged for 2009. The Compensation Committee is composed of two directors, all of whom have been determined by the Board to be “independent,” as defined in the Marketplace Rules of the NASDAQ.
|
Item 11. |
EXECUTIVE COMPENSATION |
Summary Compensation Table
The following table sets forth information relating to all compensation awarded to, earned by or paid by us during each of the two fiscal years ended December 31, 2009 and 2008 respectively, to: (a) our chief (principal) executive officer; (b) each of our executive officers who was awarded, earned or we paid more than $100,000; and (c) up to two additional individuals for whom disclosure would have been made in this table but for the fact that the individual was not serving as an executive officer of our company at December 31, 2009. The value attributable to any option awards is computed in accordance with ASC 718 (Accounting Standards Codification, Topic 718).
SUMMARY COMPENSATION TABLE
|
NAME AND |
YEAR |
SALARY |
BONUS |
STOCK AWARDS |
OPTION AWARDS |
NON-EQUITY |
NONQUALIFIED DEFERRED COMPENSATION EARNINGS |
ALL OTHER COMPENSATION |
TOTAL |
|
|
|
|
|
|
|
|
|
|
|
|
James Longshore |
2009 2008
|
0 0
|
0 0
|
0 0
|
79,637 13,948
|
0 0 |
0 0 |
60,000 0 |
139,637 13,948 |
|
|
|
|
|
|
|
|
|
|
|
|
Yves Clement Vice-President, Exploration (2) |
2009 2008 |
0 N/A |
8,000 N/A |
0 N/A |
151,946 N/A |
0 N/A |
0 N/A |
83,000 N/A |
242,946 N/A |
|
(1) |
Mr. Longshore was appointed as our CEO and CFO on March 3, 2007. Our company entered into a management consulting agreement with Brokton International Ltd. (“Brokton”), a corporation of which Mr. Longshore is the sole officer, director and shareholder from which Mr. Longshore received this compensation for the provision of consulting services as the general manager of XG Mining and XGEL during the year ended December 31, 2009. |
|
(2) |
Mr. Clement was appointed as our Vice-President, Exploration, on May 1, 2006. Our company entered into a management consulting agreement with Mr. Clement (see “Management Consulting Agreement with Vice-President, Exploration” hereunder). |
As of the date of this Report, Mr. Longshore does not currently receive any monetary compensation in his capacity as our Chief Executive Officer or as our Chief Financial Officer, however, the Compensation Committee is currently reviewing a compensation package for Mr. Longshore for 2010. The terms of any future compensation to be paid to Mr. Longshore will be determined by our Compensation Committee. At such time, the Compensation Committee will consider a number of factors in determining Mr. Longshore’s compensation including the scope of his duties and responsibilities to our company and our subsidiaries and the time he devotes to our business. At the Compensation Committee’s discretion, it will be determined whether to consult with any experts or other third parties in fixing the amount of Mr. Longshore’s compensation. During fiscal 2009, Mr. Longshore received a compensation package, through Brokton, for providing his consulting services as general manager to XG Mining and XGEL. He was reimbursed for out-of-pocket expenses incurred on behalf of our company in connection with carrying out his duties and responsibilities.
- 58 -
Management Consulting Agreements
During the period covered by this Report, we had entered into the following management consulting agreements with two officers of our company.
Management Consulting Agreement with Chief Executive Officer
We entered into a management consulting agreement on January 3, 2009 with Brokton to provide the consulting services of our Chief Executive Officer, James Longshore, as general manager for XG Mining and XGEL for a one year term which expired on December 31, 2009. Brokton was paid $5,000 per month for providing Mr. Longshore’s services. As of the date of this Report, our Compensation Committee is reviewing the renewal of this agreement for the ensuing year.
Management Consulting Agreement with Vice-President, Exploration
We entered into a management consulting agreement with our Vice-President, Exploration (VPE”), Yves Clement, on May 1, 2006 for a term of 36 months which expired on May 1, 2009. Prior to the expiration of this agreement, we negotiated terms for renewal of this agreement for a further one year term with our VPE. Our VPE is paid approximately $8,804 (Cdn$10,000) per month and is reimbursed for expenses incurred by him on behalf of our company. Our VPE shall be paid compensation equivalent to 18 months’ fees, based on the rate of compensation being paid at the relevant time in the event of (i) termination without cause; or (ii) a Change of Control. Our VPE provides certain services to our company including, but not limited to, making project or property site attendances as may be required from time to time, preparing progress reports with respect to our mineral exploration projects, conducting due diligence as may be required from time to time in connection with potential mineral properties; reviewing geological data and liaising with principal owners of mineral properties in which our company may wish to acquire an interest, meeting with government authorities and retaining technical experts, making recommendations to the Board and its relevant committees with respect to the acquisition and/or abandonment of mineral exploration properties and preparing and implementing, subject to Board approval, plans for the operation of our company including plans for exploration programs, costs of operations and other expenditures in connection with our mineral projects.
Compensation of Management
The terms of the foregoing management consulting agreements were determined at the time by our then constituted Board. As at the date of this Report, our Compensation Committee has complete authority to determine the amount of compensation to be paid and the other terms of management compensation. At the time of entering into the foregoing agreements, our Board did not consult with any consultants or other third parties in determining the amount of compensation to be paid under the management consulting agreements.
Outstanding Equity Awards at Fiscal Year End
The following table sets forth information concerning our grant of options to purchase shares of our common stock during the fiscal year ended December 31, 2009 to each person named in the Summary Compensation table.
|
NAME |
NUMBER OF SECURITIES UNDERLYING UNEXERCISED OPTIONS |
NUMBER OF SECURITIES UNDERLYING UNEXERCISED OPTIONS |
EQUITY INCENTIVE PLAN AWARDS NUMBER OF SECURITIES UNDERLYING UNEXERCISED UNEARNED OPTIONS |
OPTION EXERCISE PRICE |
OPTION EXPIRATION DATE |
NUMBER OF SHARES OR UNITS OF STOCK THAT |
MARKET VALUE OF SHARES OR UNITS OF STOCK THAT |
EQUITY INCENTIVE PLANA AWARDS NUMBER OF UNEARNED SHARES, UNITS OR OTHER RIGHTS THAT |
EQUITY INCENTIVE PLAN AWARDS MARKET OR PAYOUT VALUE OF UNEARNED SHARES, UNITS OR OTHER RIGHTS THAT |
|
|
|
|
|
|
|
|
|
|
|
|
James Longshore |
0 |
0 |
0 |
N/A |
N/A |
0 |
0 |
0 |
0 |
|
|
|
|
|
|
|
|
|
|
|
|
Yves Clement |
0 |
0 |
0 |
N/A |
N/A |
0 |
0 |
0 |
0 |
- 59 -
2005 Equity Incentive Compensation Plan
On June 21, 2005, our Board authorized, approved and adopted, our 2005 Equity Incentive Compensation Plan. As the Plan was not submitted to our shareholders for approval and was not approved by our shareholders, we are not permitted to issue any options qualifying as incentive stock options under Section 422 of the Internal Revenue Code of 1986, as amended. A total of 3,000,000 shares of our common stock have been reserved for issuance under the Plan. As at the date of this Report, we have granted options to purchase an aggregate of 972,000 shares of our common stock. During 2009, 108,000 options were cancelled pursuant to Board approval.
The purpose of the Plan is to encourage stock ownership by our officers, directors, key employees and consultants, and to give such persons a greater personal interest in the success of our business and an added incentive to continue to advance and contribute to us. Our Board, or a committee of the Board, will administer the Plan including, without limitation, the selection of the persons who will be awarded stock grants and granted options, the type of options to be granted, the number of shares subject to each option and the exercise price.
Plan options may only be non-qualified options. In addition, the Plan allows for the inclusion of a reload option provision, which permits an eligible person to pay the exercise price of the option with shares of common stock owned by the eligible person and receive a new option to purchase shares of common stock equal in number to the tendered shares. Furthermore, compensatory stock amounts may also be issued. The term of each plan option and the manner in which it may be exercised is determined by our Board or a committee of the Board. All awards granted under the Plan are made on a case by case basis, and the Board does not have any policy regarding timing of grants, amount of shares subject to any option to be granted or the exercise price, except that the Board does consider and/or approve option grants to incoming officers and directors at the time of their appointment.
Eligibility
Our officers, directors, key employees and consultants are eligible to receive stock grants and non-qualified options under the Plan.
Administration
The Plan will be administered by our Board or an underlying committee. The Board or an underlying committee determines from time to time those of our officers, directors, key employees and consultants to whom stock grants or plan options are to be granted, the terms and provisions of the respective option agreements, the time or times at which such options shall be granted, the dates such Plan options become exercisable, the number of shares subject to each option, the purchase price of such shares and the form of payment of such purchase price. All other questions relating to the administration of the Plan, and the interpretation of the provisions thereof and of the related option agreements, are resolved by our Board or an underlying committee. As of the date of this Report, the entire Board administers the Plan.
Shares Subject to Awards
We have currently reserved 3,000,000 of our authorized but unissued shares of common stock for issuance under the Plan, and a maximum of 3,000,000 shares may be issued, unless the Plan is subsequently amended, subject to adjustment in the event of certain changes in our capitalization, without further action by our Board and stockholders, as required. Subject to the limitation on the aggregate number of shares issuable under the Plan, there is no maximum or minimum number of shares as to which a stock grant or Plan option may be granted to any person. Shares used for stock grants and Plan options may be authorized and unissued shares or shares reacquired by us. Shares covered by Plan options which terminate unexercised or shares subject to stock awards which are forfeited or cancelled will again become available for grant as additional options or stock awards, without decreasing the maximum number of shares issuable under the Plan.
The Plan provides that, if our outstanding shares are increased, decreased, exchanged or otherwise adjusted due to a share dividend, forward or reverse share split, recapitalization, reorganization, merger, consolidation, combination or exchange of shares, an appropriate and proportionate adjustment shall be made in the number or kind of shares subject to unexercised options and in the purchase price per share under such options. Any adjustment, however, does not change the total purchase price payable for the shares subject to outstanding options. In the event of our proposed dissolution or liquidation, a proposed sale of all or substantially all of our assets, a merger or tender offer for our shares of common stock, the option may be assumed, converted or replaced by the successor corporation (if any) or may substitute equivalent awards or provide substantially similar consideration to awardees. In the event such successor corporation (if any) refuses or otherwise declines to assume or substitute awards, as provided above, (i) the vesting of any or all Awards granted pursuant to this Plan will accelerate immediately prior to the effective date of a transaction described above and (ii) any or all Options granted pursuant to the Plan will become exercisable in full prior to the consummation of such event at such time and on such conditions as our Board or an underlying committee determines. If such Options are not exercised prior to the consummation of the corporate transaction, they shall terminate at such time as determined by our Board or an underlying committee.
- 60 -
Terms of Exercise
The Plan provides that the options granted thereunder shall be exercisable from time to time in whole or in part, unless otherwise specified by our Board or an underlying committee.
Exercise Price
The purchase price for shares subject to options is determined by our Board or an underlying committee and may be below fair market value on the day of grant. If the purchase price is paid with consideration other than cash, our Board or an underlying committee shall determine the fair value of such consideration to us in monetary terms.
The per share purchase price of shares issuable upon exercise of a plan option may be adjusted in the event of certain changes in our capitalization, but no such adjustment shall change the total purchase price payable upon the exercise in full of options granted under the Plan.
Manner of Exercise
Plan options are exercisable by delivery of written notice to us stating the number of shares with respect to which the option is being exercised, together with full payment of the purchase price therefor. Payment shall be in cash, checks, certified or bank cashier’s checks, promissory notes secured by the shares issued through exercise of the related options, shares of common stock or in such other form or combination of forms which shall be acceptable to our Board or an underlying committee.
Option Period
The term of each non-qualified stock option is determined and fixed by our Board or an underlying committee.
Termination
Except as otherwise expressly provided in the option agreement, all Plan options are nonassignable and nontransferable, except by will or by the laws of descent and distribution, and during the lifetime of the optionee, may be exercised only by such optionee. If an optionee shall die while our employee or within three months after termination of employment by us because of disability, or retirement or otherwise, such options may be exercised, to the extent that the optionee shall have been entitled to do so on the date of death or termination of employment, by the person or persons to whom the optionee’s right under the option pass by will or applicable law, or if no such person has such right, by his executors or administrators.
In the event of termination of employment because of death while an employee or because of disability, an optionee’s options may be exercised not later than the expiration date specified in the option or one year after the optionee’s death, whichever date is earlier, or in the event of termination of employment because of retirement or otherwise, not later than the expiration date specified in the option or three months after the optionee’s retirement, whichever date is earlier.
If an optionee’s employment by us terminates because of disability and such optionee has not died within the following three months, the options may be exercised, to the extent that the optionee shall have been entitled to do so at the date of the termination of employment, at any time, or from time to time, but not later than the expiration date specified in the option or one year after termination of employment, whichever date is earlier.
If an optionee’s employment shall terminate for any reason other than death or disability, such optionee may exercise the options to the same extent that the options were exercisable on the date of termination, for up to three months following such termination, or on or before the expiration date of the options, whichever occurs first. In the event that the optionee was not entitled to exercise the options at the date of termination or if the optionee does not exercise such options (which were then exercisable) within the time specified herein, the options shall terminate.
If an optionee’s employment with us is terminated for any reason whatsoever, and within three months after the date thereof the optionee either (i) accepts employment with any competitor of, or otherwise engages in competition with us, or (ii) discloses to anyone outside our company or uses any confidential information or material of our company in violation of our policies or any agreement between the optionee and our company, the committee, in its sole discretion, may terminate any outstanding stock option and may require the optionee to return to us the economic value of any award that was realized or obtained by the optionee at any time during the period beginning on that date that is six months prior to the date the optionee’s employment with us is terminated.
- 61 -
Our Board or an underlying committee may, if an optionee’s employment with us is terminated for cause, annul any award granted under the Plan to such employee and, in such event, our Board or an underlying committee, in its sole discretion, may require the optionee to return to us the economic value of any award that was realized or obtained by an optionee at any time during the period beginning on that date that is six months prior to the date the optionee’s employment with us is terminated.
Modification and Termination of Plan
Our Board or an underlying committee may amend, suspend or terminate the Plan at any time. However, no such action may prejudice the rights of any holder of a stock grant or an optionee who has prior thereto been granted options under the Plan. Any such termination of the Plan shall not affect the validity of any stock grants or options previously granted thereunder. Unless terminated by our Board, the Plan shall continue to remain effective until such time as no further awards may be granted and all awards granted under the Plan are no longer outstanding.
Compensation of Directors
We established compensation arrangements for our directors for each individual’s service and expense on our Board in March 2007. Directors’ fees are paid on a quarterly basis. As of December 31, 2009, we did not pay fees to directors for their attendance at Board meetings. As an austerity measure, the Board agreed to reduce their respective directors’ fees by 50% in and from the fourth quarter ended December 31, 2008.
The following table sets forth information relating to the compensation paid to our directors for the fiscal year ended December 31, 2009:
DIRECTOR COMPENSATION
|
NAME |
FEES |
STOCK |
OPTION |
NON-EQUITY |
NON-QUALIFIED |
ALL OTHER |
TOTAL |
|
|
|
|
|
|
|
|
|
|
James Longshore |
5,282 |
0 |
0 |
0 |
0 |
0 |
5,282 |
|
|
|
|
|
|
|
|
|
|
Richard Grayston |
5,282 |
0 |
0 |
0 |
0 |
0 |
5,282 |
|
|
|
|
|
|
|
|
|
|
Peter Minuk |
3,962 |
0 |
0 |
0 |
0 |
0 |
3,962 |
|
|
|
|
|
|
|
|
|
|
Robert Montgomery |
3,962 |
0 |
0 |
0 |
0 |
0 |
3,962 |
|
Item 12. |
SECURITY OWNERSHIP OF CERTAIN BENEFICIAL OWNERS AND MANAGEMENT AND RELATED STOCKHOLDER MATTERS |
At March 29, 2010, we had 33,400,586 shares of common stock issued and outstanding. The following table sets forth information known to us as of March 29, 2010 relating to the beneficial ownership of shares of our common stock by:
|
|
● |
each person who is known by us to be the beneficial owner of more than 5% of our outstanding common stock; |
|
|
● |
each director; |
|
|
● |
each named executive officer; and |
|
|
● |
all named executive officers and directors as a group. |
- 62 -
Unless otherwise indicated, the business address of each person listed is in care of our Field Camp located at 2 Masalakye Street, Kwabeng, Ghana. The percentages in the table have been calculated on the basis of treating as outstanding for a particular person, all shares of our common stock outstanding on that date and all shares of our common stock issuable to that holder in the event of exercise of outstanding options, warrants, rights or conversion privileges owned by that person at that date which are exercisable within 60 days of that date. Except as otherwise indicated, the persons listed below have sole voting and investment power with respect to all shares of our common stock owned by them, except to the extent that power may be shared with a spouse.
|
NAME OF BENEFICIAL OWNER |
AMOUNT AND NATURE |
PERCENTAGE |
|
James Longshore |
2,662,000 shares (1) |
7.97% |
|
Richard W. Grayston |
187,000 shares (2) |
0.56% |
|
Robert H. Montgomery |
108,000 shares (3) |
0.32% |
|
Peter Minuk |
110,000 shares (4) |
0.33% |
|
Paul Zyla |
279,500 shares (5) |
0.86% |
|
Yves P. Clement |
324,000 shares (6) |
0.97% |
|
Alhaji N. Abudulai |
108,000 shares (7) |
0.32% |
|
Officers and Directors as a Group (7 persons) |
3,786,000 shares (1) to (7) |
11.34% |
|
5% Stockholders |
|
|
|
Brokton International Ltd. |
2,162,000 shares (1) |
6.47% |
|
Mark T. McGinnis |
2,519,442 shares (8) |
7.54% |
|
(1) |
Consists of (a) 2,000,000 shares which are owned by Brokton International Ltd. (“Brokton”); (b) 500,000 shares which are owned by Sausilito Ltd.; and (c) 162,000 shares which can be acquired upon the exercise of options to purchase shares that have vested and are currently exercisable within 60 days of the date of this Report. Brokton is a Turks & Caicos Islands corporation, whose sole beneficial owner is James Longshore. Sausilito Ltd. is a Turks & Caicos Islands corporation, whose sole beneficial owner is James Longshore. Mr. Longshore exercises sole investment, voting and disposition powers over the shares included in the above table. |
|
(2) |
Consists of (a) 25,000 shares of common stock; and (b) 162,000 shares which can be acquired upon the exercise of options to purchase shares that have vested and are currently exercisable within 60 days of the date of this Report. |
|
(3) |
Consists of 108,000 shares which can be acquired upon the exercise of options to purchase shares that have vested and are currently exercisable within 60 days of the date of this Report. |
|
(4) |
Consists of (a) 2,000 shares of common stock; and (b) 108,000 shares which can be acquired upon the exercise of options to purchase shares that have vested and are currently exercisable within 60 days of the date of this Report. |
|
(5) |
Consists of (a) 267,500 shares of common stock; (b) 6,000 shares which cam be acquired upon the exercise of options to purchase shares that have vested and are currently exercisable; (c) 7,500 warrants which are exercisable into common stock within 60 days following the date of this Report; and (d) 6,000 shares which shall become issuable upon options that shall vest and be exercisable within 60 days following the date of this Report; namely April 1 and May 1, 2010. Does not include 96,000 shares issuable upon the exercise of options that have not yet vested and will vest monthly as to 3,000 in each month. |
|
(6) |
Consists of 324,000 shares which can be acquired upon the exercise of options to purchase shares that have vested and are currently exercisable within 60 days of the date of this Report. |
|
(7) |
Consists of 108,000 shares which can be acquired upon the exercise of options to purchase shares that have vested and are currently exercisable within 60 days of the date of this Report. |
|
(8) |
Consists of (a) 1,918,725 shares of common stock held by Mark McGinnis; and (b) 16,250 warrants which are exercisable into common stock within 60 days from the date of this Report; and (c) 584,467 shares of common stock held by his spouse of which an aggregate of 70,000 shares of common stock is held in trust for her children. |
- 63 -
|
Item 13. |
CERTAIN RELATIONSHIPS AND RELATED TRANSACTIONS, AND DIRECTOR INDEPENDENCE |
Consulting Agreement with Principal Shareholder
From February 1, 2004 through February 1, 2006, we were a party to a consulting agreement with Brokton, a company which, as of the date of this Report, owns 6.47% of our common stock and one of only two shareholders that owns more than 5% of our issued and outstanding shares of common stock. Under the terms of this agreement, we engaged Brokton as a consultant to advise our Management with respect to hiring additional qualified management, providing support with respect to operational matters and government compliance in Ghana, mergers and acquisitions and financial advisory. James Longshore, our President and one of the directors of our company, is the President of Brokton and exercises sole investment, voting and disposition powers over the shares of Brokton. Mr. Longshore is also a director of our wholly-owned subsidiaries, XGEL and XOG Ghana (since April 2006) and Chief Operating Officer (since February 2007) and General Manager (since June 2006) and a director of XG Mining (since June 2006) and Chief Operating Officer (since February 2007) and General Manager (since June 2006) and a director and officer of Xtra Energy (since March 2007). From February 2004 to February 2006, we paid Brokton an aggregate of $53,176 for its consulting services and reimbursed Brokton for expenses incurred by Brokton on behalf of our company.
On January 3, 2009, we were a party to a consulting agreement with Brokton, whereby we engaged Brokton as a consultant to provide the consulting services of Mr. Longshore as General Manager of our subsidiaries, XG Mining and XGEL, for a one year term ending on December 31, 2009. We paid Brokton an aggregate of $60,000, during the period covered by this Report, for its consulting services and reimbursed Brokton for expenses incurred by Brokton on behalf of our company and our subsidiaries.
A Principal Shareholder Manages our Investment Portfolio
We currently, and since approximately six years ago, maintain our brokerage account with Haywood Securities Inc. (“Haywood”) in connection with our investment accounts. Haywood provides us with investment recommendations and custodial services. Haywood is a member of the Toronto Stock Exchange, the TSXV, the Montreal Exchange, the Canadian Trading and Quotation System, the Canadian Investor Protection Fund, and the Investment Dealers Association of Canada. In addition, Haywood Securities (USA) Inc., a wholly owned subsidiary is a broker-dealer registered to transact securities business in the United States and a member of the National Association of Securities Dealers. We pay Haywood ordinary brokerage commissions on trade transactions and our accounts with Haywood can be terminated at any time. Mark McGinnis, a shareholder who, as at the date of this Report, owns 7.54% of our common stock and one of only two shareholders that owns more than 5% of our issued and outstanding shares of common stock, is an investment advisor with Haywood and is the manager of our accounts with Haywood.
Director Independence
As our common stock is currently traded on the OTCBB, we are not subject to the rules of any national securities exchange which requires that a majority of a listed company’s directors and specified committees of its board of directors meet independence standards prescribed by such rules. For the purpose of preparing the disclosures in this Report on Form 10-K with respect to director independence, we have used the definition of “independent director” set forth in the Marketplace Rules of the NASDAQ, which defines an “independent director” generally as being a person, other than an executive officer or employee of the company or any other individual having a relationship which, in the opinion of the company’s board of directors, would interfere with the exercise of independent judgment in carrying out the responsibilities of a director.
Consistent with these standards, our Board has determined that Richard W, Grayston, Robert H. Montgomery and Paul Zyla are “independent” within the meaning of Marketplace Rule 5605(a)(2) of the NASDAQ.
- 64 -
|
Item 14. |
PRINCIPAL ACCOUNTING FEES AND SERVICES |
Davidson & Company LLP is our principal accountant for our audit of annual financial statements and review of the financial statements included in this Report and served as our independent registered public accounting firm for 2009 and 2008. The following table shows the fees that were billed for the audit and other services provided by such firm for 2009 and 2008.
|
|
|
2009 |
|
2008 |
| ||
|
Audit Fees |
|
$ |
60,000 |
|
$ |
55,000 |
|
|
Audit-Related Fees |
|
|
15,485 |
|
|
18,000 |
|
|
Tax Fees |
|
|
0 |
|
|
0 |
|
|
All Other Fees |
|
|
0 |
|
|
0 |
|
|
Total |
|
$ |
75,485 |
|
$ |
73,000 |
|
Audit Fees
This category includes the audit of our annual financial statements, review of financial statements included in this Report and services that are normally provided by the independent auditors in connection with their engagements for those fiscal years. This category also includes advice on audit and accounting matters that arose during, or as a result of, the audit or the review of our interim financial statements.
Audit-Related Fees
This category consists of assurance and related services by the independent auditors that are reasonably related to the performance of the audit or review of our financial statements and are not reported above under “Audit Fees.” The services for the fees disclosed under this category include consultation regarding our correspondence with the SEC and other accounting consulting.
Tax Fees
This category consists of professional services rendered by our independent auditors for tax compliance and tax advice. The services for the fees disclosed under this category include tax return preparation and technical tax advice.
All Other Fees
This category consists of fees for other miscellaneous items.
Our Audit Committee has adopted a procedure for pre-approval of all fees charged by our independent auditors. Under the procedure, the Audit Committee approves the engagement letter with respect to audit, tax and review services. Other fees are subject to pre-approval by the Audit Committee. The audit and tax fees paid to the auditors with respect to 2009 were pre-approved by the Audit Committee.
PART IV
|
Item 15. |
EXHIBITS, FINANCIAL STATEMENT SCHEDULES |
|
Exhibit No. |
Description of Document |
|
2.1 |
Stock Exchange Agreement dated October 31, 2003, by and between Xtra-Gold Resources Corp. and the former shareholders of Xtra Energy Corp. (formerly Xtra-Gold Resources, Inc.) (1) |
|
3.1 |
Articles of Incorporation of Silverwing Systems Corporation filed on September 1, 1998 (1) |
|
3.2 |
Articles of Amendment filed on August 19, 1999 to change our name to Advertain On-Line Inc. (1) |
|
3.3 |
Articles of Amendment filed June 18, 2001 to change our name to RetinaPharma International, Inc. (1) |
- 65 -
|
Exhibit No. |
Description of Document |
|
3.4 |
Articles of Amendment filed on October 8, 2001 to increase our capital stock from 25,000,000 to 100,000,000 shares (1) |
|
3.5 |
Articles of Amendment filed December 16, 2003 to change our name to Xtra-Gold Resources Corp. and to increase our capital stock from 100,000,000 to 250,000,000 shares (1) |
|
3.6 |
By-laws (1) |
|
Form of common stock purchase warrant * | |
|
4.2 |
Form of convertible debenture (1) |
|
10.1 |
2005 Equity Compensation Plan (1) |
|
10.2 |
Memorandum of Agreement dated October 28, 2003, by and between Xtra Energy Corp. (formerly Xtra-Gold Resources, Inc.) and Ranger Canyon Energy Inc. (formerly CaribGold Minerals, Inc.) (1) |
|
10.3 |
Agreement dated February 16, 2004 by and between Xtra-Gold Resources Corp. and Akrokeri-Ashanti Gold Mines Inc. (1) |
|
10.4 |
Share Purchase Agreement dated December 22, 2004 between Xtra-Gold Resources Corp. and 2058168 Ontario Inc., the trustee for the former note holders of Akrokeri-Ashanti Gold Mines Inc. (1) |
|
10.5 |
Share Purchase Agreement dated December 22, 2004 among Xtra-Gold Resources Corp., 2058168 Ontario Inc., the trustee for the former debenture holders of Akrokeri-Ashanti Gold Mines Inc. and 2060768 Ontario Corp. (1) |
|
10.6 |
Stock option agreement dated April 21, 2006 with Kiomi Mori, as optionee (1) |
|
10.7 |
Stock option agreement dated May 1, 2006 with Yves Clement, as optionee (1) |
|
10.8 |
Stock option agreement dated May 1, 2006 with Alhaji Abudulai, as optionee (1) |
|
10.9 |
Stock option agreement dated August 1, 2006 with John Douglas Mills, as optionee (1) |
|
10.10 |
Management consulting agreement dated May 1, 2006 with Yves Clement (1) |
|
10.11 |
Management consulting agreement dated July 1, 2006 with Rebecca Kiomi Mori (1) |
|
10.12 |
Management consulting agreement dated November 1, 2006 with Alhaji Nantogma Abudulai (1) |
|
10.13 |
Mining lease with respect to the Kwabeng concession (1) |
|
10.14 |
Mining lease with respect to the Pameng concession (1) |
|
10.15 |
Prospecting license with respect to the Banso and Muoso concessions (1) |
|
10.16 |
Prospecting license with respect to the Apapam concession (1) |
|
10.17 |
Prospecting license with respect to the Edum Banso concession (1) |
|
10.18 |
Option Agreement dated October 17, 2005 between Xtra-Gold Exploration Limited and Adom Mining Limited (1) |
|
10.19 |
Consulting agreement dated January 17, 2006 between Xtra-Gold Mining Limited and Bio Consult Limited (1) |
|
10.20 |
Purchase and Sale Agreement dated September 1, 2006 between Xtra Oil & Gas Ltd. and TriStar Oil & Gas Partnership (1) |
|
10.21 |
Amending Agreement dated October 19, 2006 between Xtra-Gold Exploration and Adom Mining Limited (1) |
|
10.22 |
Stock option agreement dated March 5, 2007 with Richard W. Grayston, as optionee (1) |
|
10.23 |
Stock option agreement dated March 5, 2007 with Peter Minuk, as optionee (1) |
|
10.24 |
Stock option agreement dated March 12, 2007 with Robert H. Montgomery, as optionee (1) |
|
10.25 |
Stock option agreement dated March 12, 2007 with Brokton International Ltd., as optionee (1) |
|
10.26 |
Stock option agreement dated March 12, 2007 with John Douglas Mills, as optionee (1) |
|
10.27 |
Consulting agreement dated March 20, 2007 with JD Mining Ltd. (1) |
|
10.28 |
Lease with 360 Bay Street Limited dated March 29, 2007 (1) |
|
10.29 |
Termination agreement dated January 31, 2008 with JD Mining Ltd. and John Douglas Mills (1) |
|
10.30 |
Mining lease with respect to the Apapam Concession (2) |
|
Management consulting agreement dated January 3, 2009 with Brokton International Ltd. * | |
|
Code of Ethics * | |
|
Rule 13a-14(a)/15d-14(a) Certifications of Principal Executive Officer * | |
|
Rule 13a-14(a)/15d-14(a) Certifications of Principal Financial and Accounting Officer * | |
|
Section 1350 Certifications of Principal Executive Officer and Principal Financial and Accounting Officer * |
|
* |
Filed herewith |
|
(1) |
Incorporated by reference to the registration statement on Form SB-2 on Form S-1, SEC File No. 333-139037 |
|
(2) |
Incorporated by reference to the company’s 10-K annual report filed on March 27, 2009, SEC File No. 333-139037 |
- 66 -
SIGNATURES
(General Instruction D)
Pursuant to the requirements of Section 13 or 15(d) of the Securities Exchange Act of 1934, we have duly caused this Report to be signed on our behalf by the undersigned, thereunto duly authorized.
|
Date: |
March 30, 2010 |
XTRA-GOLD RESOURCES CORP. |
|
|
(Registrant) |
|
|
/s/ James Werth Longshore |
|
|
By |
_________________________ |
|
|
James Werth Longshore |
|
|
President, Chief Executive Officer and |
|
|
Chief Financial Officer |
Pursuant to the requirements of the Securities Exchange Act of 1934, this Report has been signed below by the following persons on our behalf and in the capacities and on the dates indicated.
|
Signature |
Title |
Date |
|
|
|
|
|
/s/ James Werth Longshore _________________________ James Werth Longshore
|
President, Chief Executive Officer (principal executive officer), Chief Financial Officer (principal financial and accounting officer) and Director |
March 30, 2010 |
|
|
|
|
|
/s/ Richard W. Grayston _________________________ Richard W. Grayston
|
Chairman and Director |
March 30, 2010 |
|
|
|
|
|
/s/ Peter Minuk _________________________ Peter Minuk
|
Director |
March 30, 2010 |
|
|
|
|
|
/s/ Robert H. Montgomery _________________________ Robert H. Montgomery
|
Director |
March 30, 2010 |
|
|
|
|
|
/s/ Paul Zyla _________________________ Paul Zyla |
Director |
March 30, 2010 |
- 67 -
XTRA-GOLD RESOURCES CORP.
(An Exploration Stage Company)
CONSOLIDATED FINANCIAL STATEMENTS
(Expressed in U.S. Dollars)
DECEMBER 31, 2009

REPORT OF INDEPENDENT REGISTERED
PUBLIC ACCOUNTING FIRM
To the Stockholders and the Board of Directors of
Xtra-Gold Resources Corp. and subsidiaries
(an Exploration Stage Company)
We have audited the accompanying consolidated balance sheets of Xtra-Gold Resources Corp. and subsidiaries (an Exploration Stage Company) as at December 31, 2009 and 2008 and the related consolidated statements of operations, stockholders’ equity and cash flows for the years then ended and for the period from the beginning of the exploration stage on January 1, 2003 to December 31, 2009. These consolidated financial statements are the responsibility of the Company’s management. Our responsibility is to express an opinion on these financial statements based on our audits.
We conducted our audits in accordance with the standards of the Public Company Accounting Oversight Board (United States). Those standards require that we plan and perform the audit to obtain reasonable assurance about whether the financial statements are free of material misstatement. An audit includes examining, on a test basis, evidence supporting the amounts and disclosures in the financial statements. An audit also includes assessing the accounting principles used and significant estimates made by management, as well as evaluating the overall financial statement presentation. We believe that our audits provide a reasonable basis for our opinion.
In our opinion, the consolidated financial statements referred to above present fairly, in all material respects, the financial position of the Company as at December 31, 2009 and 2008 and the results of its operations and its cash flows for the years then ended and for the period from the beginning of the exploration stage on January 1, 2003 to December 31, 2009 in conformity with generally accepted accounting principles in the United States of America.
The accompanying consolidated financial statements have been prepared assuming that the Company will continue as a going concern. As discussed in Note 2 to the consolidated financial statements, the Company has suffered recurring losses from operations. These matters raise substantial doubt about the Company’s ability to continue as a going concern. Management’s plans in regards to these matters are discussed in Note 2. The consolidated financial statements do not include any adjustments that might result from the outcome of this uncertainty.
“DAVIDSON & COMPANY LLP”
|
Vancouver, Canada |
Chartered Accountants |
|
|
|
|
March 30, 2010 |
|
XTRA-GOLD RESOURCES CORP.
(An Exploration Stage Company)
CONSOLIDATED BALANCE SHEETS
(Expressed in U.S. Dollars)
AS AT DECEMBER 31
|
|
|
2009 |
|
2008 |
| ||
|
|
|
|
|
|
|
|
|
|
ASSETS |
|
|
|
|
|
|
|
|
|
|
|
|
|
|
|
|
|
Current |
|
|
|
|
|
|
|
|
Cash and cash equivalents |
|
$ |
622,670 |
|
$ |
271,573 |
|
|
Investment in trading securities, at fair value |
|
|
1,781,594 |
|
|
1,470,382 |
|
|
Receivables and other |
|
|
46,462 |
|
|
92,942 |
|
|
Deposit for equipment (Note 5) |
|
|
151,506 |
|
|
— |
|
|
|
|
|
|
|
|
|
|
|
Total current assets |
|
|
2,602,232 |
|
|
1,834,897 |
|
|
|
|
|
|
|
|
|
|
|
Equipment (Note 5) |
|
|
244,508 |
|
|
312,300 |
|
|
Deferred financing costs (Note 6) |
|
|
1,283 |
|
|
3,850 |
|
|
Oil and gas investment (Note 7) |
|
|
40,000 |
|
|
40,000 |
|
|
Mineral properties (Note 8) |
|
|
1,662,564 |
|
|
1,662,564 |
|
|
|
|
|
|
|
|
|
|
|
TOTAL ASSETS |
|
$ |
4,550,587 |
|
$ |
3,853,611 |
|
|
|
|
|
|
|
|
|
|
|
LIABILITIES AND STOCKHOLDERS’ EQUITY |
|
|
|
|
|
|
|
|
|
|
|
|
|
|
|
|
|
Current |
|
|
|
|
|
|
|
|
Accounts payable and accrued liabilities |
|
$ |
233,073 |
|
$ |
535,272 |
|
|
Convertible debentures (Note 9, 17) |
|
|
250,000 |
|
|
— |
|
|
|
|
|
|
|
|
|
|
|
Total current liabilities |
|
|
483,073 |
|
|
535,272 |
|
|
|
|
|
|
|
|
|
|
|
Convertible debentures (Note 9, 17) |
|
|
— |
|
|
250,000 |
|
|
Asset retirement obligation (Note 10) |
|
|
71,906 |
|
|
65,369 |
|
|
|
|
|
|
|
|
|
|
|
Total liabilities |
|
|
554,979 |
|
|
850,641 |
|
|
|
|
|
|
|
|
|
|
|
Stockholders’ equity |
|
|
|
|
|
|
|
|
Capital stock (Note 11) |
|
|
|
|
|
|
|
|
Authorized |
|
|
|
|
|
|
|
|
250,000,000 common shares with a par value of $0.001 |
|
|
|
|
|
|
|
|
Issued and outstanding |
|
|
|
|
|
|
|
|
33,231,477 common shares ( 2008 – 31,330,602 common shares) |
|
|
33,231 |
|
|
31,331 |
|
|
Additional paid in capital |
|
|
14,771,222 |
|
|
12,742,360 |
|
|
Deficit |
|
|
(1,427,764 |
) |
|
(1,427,764 |
) |
|
Deficit accumulated during the exploration stage |
|
|
(9,304,452 |
) |
|
(8,342,957 |
) |
|
|
|
|
|
|
|
|
|
|
Total Xtra-Gold Resources Corp. stockholders’ equity |
|
|
4,072,237 |
|
|
3,002,970 |
|
|
Non-controlling interest |
|
|
(76,629 |
) |
|
— |
|
|
|
|
|
|
|
|
|
|
|
Total stockholders’ equity |
|
|
3,995,608 |
|
|
3,002,970 |
|
|
|
|
|
|
|
|
|
|
|
TOTAL LIABILITIES AND STOCKHOLDERS’ EQUITY |
|
$ |
4,550,587 |
|
$ |
3,853,611 |
|
History and organization of the Company (Note 1)
Contingency and commitments (Note 16)
Subsequent events (Note 17)
The accompanying notes are an integral part of these consolidated financial statements.
XTRA-GOLD RESOURCES CORP.
(An Exploration Stage Company)
CONSOLIDATED STATEMENTS OF OPERATIONS
(Expressed in U.S. Dollars)
|
|
|
Cumulative |
|
Year |
|
Year |
| |||
|
|
|
|
|
|
|
|
|
|
|
|
|
EXPENSES |
|
|
|
|
|
|
|
|
|
|
|
Amortization |
|
$ |
185,645 |
|
$ |
67,792 |
|
$ |
63,674 |
|
|
Exploration |
|
|
12,034,212 |
|
|
1,080,488 |
|
|
5,140,679 |
|
|
General and administrative |
|
|
4,975,034 |
|
|
957,332 |
|
|
1,035,369 |
|
|
Write-off of mineral property |
|
|
26,000 |
|
|
— |
|
|
— |
|
|
|
|
|
|
|
|
|
|
|
|
|
|
LOSS BEFORE OTHER ITEMS |
|
|
(17,231,090 |
) |
|
(2,105,612 |
) |
|
(6,239,722 |
) |
|
|
|
|
|
|
|
|
|
|
|
|
|
OTHER ITEMS |
|
|
|
|
|
|
|
|
|
|
|
Foreign exchange gain (loss) |
|
|
370,528 |
|
|
303,243 |
|
|
(424,559 |
) |
|
Interest expense |
|
|
(240,653 |
) |
|
(2,567 |
) |
|
(49,113 |
) |
|
Realized gains (losses) on sales of trading securities |
|
|
23,580 |
|
|
(172,638 |
) |
|
2,585 |
|
|
Net unrealized gain (loss) on trading securities |
|
|
(66,573 |
) |
|
789,934 |
|
|
(857,980 |
) |
|
Other income |
|
|
822,732 |
|
|
138,558 |
|
|
196,621 |
|
|
Recovery of gold |
|
|
6,843,965 |
|
|
10,958 |
|
|
4,140,765 |
|
|
Gain (loss) on disposal of property |
|
|
96,430 |
|
|
— |
|
|
— |
|
|
|
|
|
|
|
|
|
|
|
|
|
|
|
|
|
7,850,009 |
|
|
1,067,488 |
|
|
3,008,319 |
|
|
|
|
|
|
|
|
|
|
|
|
|
|
Consolidated loss for the period |
|
|
(9,381,081 |
) |
|
(1,038,124 |
) |
|
(3,231,403 |
) |
|
|
|
|
|
|
|
|
|
|
|
|
|
Net loss attributable to non-controlling interest |
|
|
76,629 |
|
|
76,629 |
|
|
— |
|
|
|
|
|
|
|
|
|
|
|
|
|
|
Net loss attributable to Xtra-Gold Resources Corp. |
|
$ |
(9,304,452 |
) |
$ |
(961,495 |
) |
$ |
(3,231,403 |
) |
|
|
|
|
|
|
|
|
|
|
|
|
|
Basic and diluted loss attributable to common shareholders per common share |
|
|
|
|
$ |
(0.03 |
) |
$ |
(0.11 |
) |
|
|
|
|
|
|
|
| ||||
|
Basic and diluted weighted average number of common shares outstanding |
|
32,101,330 |
|
|
30,389,400 |
| ||||
The accompanying notes are an integral part of these consolidated financial statements.
XTRA-GOLD RESOURCES CORP.
(An Exploration Stage Company)
CONSOLIDATED STATEMENTS OF CASH FLOWS
(Expressed in U.S. Dollars)
|
|
|
Cumulative |
|
Year |
|
Year |
| |||
|
|
|
|
|
|
|
|
|
|
|
|
|
CASH FLOWS FROM OPERATING ACTIVITIES |
|
|
|
|
|
|
|
|
|
|
|
Loss for the period |
|
$ |
(9,381,081 |
) |
$ |
(1,038,124 |
) |
$ |
(3,231,403 |
) |
|
Items not affecting cash: |
|
|
|
|
|
|
|
|
|
|
|
Amortization |
|
|
185,645 |
|
|
67,792 |
|
|
63,674 |
|
|
Amortization of deferred financing costs |
|
|
44,919 |
|
|
2,567 |
|
|
19,251 |
|
|
Accretion of asset retirement obligation |
|
|
17,071 |
|
|
6,537 |
|
|
— |
|
|
Shares issued for services |
|
|
202,365 |
|
|
— |
|
|
196,865 |
|
|
Stock-based compensation |
|
|
1,067,182 |
|
|
468,052 |
|
|
156,444 |
|
|
Unrealized foreign exchange (gain) loss |
|
|
(429,789 |
) |
|
(247,155 |
) |
|
385,947 |
|
|
Realized (gain) losses on sale of trading securities |
|
|
(23,580 |
) |
|
172,638 |
|
|
(2,585 |
) |
|
Purchase of trading securities |
|
|
(11,564,690 |
) |
|
(778,387 |
) |
|
(2,088,467 |
) |
|
Proceeds on sale of trading securities |
|
|
10,169,892 |
|
|
1,331,626 |
|
|
1,544,484 |
|
|
Unrealized (gain) loss on trading securities |
|
|
66,573 |
|
|
(789,934 |
) |
|
857,980 |
|
|
Gain on disposal of property |
|
|
(95,342 |
) |
|
— |
|
|
— |
|
|
Write-off of mineral property |
|
|
26,000 |
|
|
— |
|
|
— |
|
|
Expenses paid by stockholders |
|
|
2,700 |
|
|
— |
|
|
— |
|
|
|
|
|
|
|
|
|
|
|
|
|
|
Changes in non-cash working capital items: |
|
|
|
|
|
|
|
|
|
|
|
(Increase) decrease in receivables and other |
|
|
(38,087 |
) |
|
46,480 |
|
|
(38,433 |
) |
|
Increase (decrease) in accounts payable and accrued liabilities |
|
|
222,381 |
|
|
(302,199 |
) |
|
(259,959 |
) |
|
Increase in due to related party |
|
|
50,000 |
|
|
— |
|
|
— |
|
|
|
|
|
|
|
|
|
|
|
|
|
|
Net cash used in operating activities |
|
|
(9,477,841 |
) |
|
(1,060,107 |
) |
|
(2,396,202 |
) |
|
|
|
|
|
|
|
|
|
|
|
|
|
CASH FLOWS FROM FINANCING ACTIVITIES |
|
|
|
|
|
|
|
|
|
|
|
Proceeds from issuance of convertible debentures |
|
|
900,000 |
|
|
— |
|
|
— |
|
|
Deferred financing costs |
|
|
(46,202 |
) |
|
— |
|
|
— |
|
|
Repurchase of capital stock |
|
|
(57,000 |
) |
|
(50,000 |
) |
|
— |
|
|
Issuance of capital stock, net of financing costs |
|
|
9,842,432 |
|
|
1,612,710 |
|
|
2,489,460 |
|
|
|
|
|
|
|
|
|
|
|
|
|
|
Net cash provided by financing activities |
|
|
10,639,230 |
|
|
1,562,710 |
|
|
2,489,460 |
|
- continued -
The accompanying notes are an integral part of these consolidated financial statements.
XTRA-GOLD RESOURCES CORP.
(An Exploration Stage Company)
CONSOLIDATED STATEMENTS OF CASH FLOWS
(Expressed in U.S. Dollars)
|
|
|
Cumulative |
|
Year |
|
Year |
| |||
|
|
|
|
|
|
|
|
|
|
|
|
|
Continued ... |
|
|
|
|
|
|
|
|
|
|
|
|
|
|
|
|
|
|
|
|
|
|
|
CASH FLOWS FROM INVESTING ACTIVITIES |
|
|
|
|
|
|
|
|
|
|
|
Acquisition of equipment |
|
|
(433,976 |
) |
|
— |
|
|
(115,950 |
) |
|
Deposit on equipment |
|
|
(151,506 |
) |
|
(151,506 |
) |
|
— |
|
|
Oil and gas property expenditures |
|
|
(250,137 |
) |
|
— |
|
|
(40,000 |
) |
|
Acquisition of cash on purchase of subsidiary |
|
|
11,510 |
|
|
— |
|
|
— |
|
|
Acquisition of subsidiary |
|
|
(25,000 |
) |
|
— |
|
|
— |
|
|
Proceeds on disposal of assets |
|
|
310,390 |
|
|
— |
|
|
— |
|
|
Net cash used in investing activities |
|
|
(538,719 |
) |
|
(151,506 |
) |
|
(155,950 |
) |
|
|
|
|
|
|
|
|
|
|
|
|
|
Change in cash and cash equivalents during the period |
|
|
622,670 |
|
|
351,097 |
|
|
(62,692 |
) |
|
|
|
|
|
|
|
|
|
|
|
|
|
Cash and cash equivalents, beginning of the period |
|
|
— |
|
|
271,573 |
|
|
334,265 |
|
|
|
|
|
|
|
|
|
|
|
|
|
|
Cash and cash equivalents, end of the period |
|
$ |
622,670 |
|
$ |
622,670 |
|
$ |
271,573 |
|
Supplemental disclosure with respect to cash flows (Note 13)
The accompanying notes are an integral part of these consolidated financial statements.
XTRA-GOLD RESOURCES CORP.
(An Exploration Stage Company)
CONSOLIDATED STATEMENTS OF STOCKHOLDERS’ EQUITY
(Expressed in U.S. Dollars)
|
|
|
Common Stock |
|
|
|
|
|
|
|
Deficit |
|
|
| ||||||||
|
|
|
Number |
|
Amount |
|
Additional |
|
Deficit |
|
Non- |
|
Accumulated |
|
Total |
| ||||||
|
|
|
|
|
|
|
|
|
|
|
|
|
|
|
|
|
|
|
|
|
|
|
|
Balance, December 31, 2002 |
|
12,364,085 |
|
$ |
12,364 |
|
$ |
1,412,842 |
|
$ |
(1,427,764 |
) |
$ |
— |
|
$ |
— |
|
$ |
(2,558 |
) |
|
|
|
|
|
|
|
|
|
|
|
|
|
|
|
|
|
|
|
|
|
|
|
|
Paid on behalf of the Company |
|
— |
|
|
— |
|
|
5,258 |
|
|
— |
|
|
— |
|
|
— |
|
|
5,258 |
|
|
|
|
|
|
|
|
|
|
|
|
|
|
|
|
|
|
|
|
|
|
|
|
|
October 31, 2003, issuance of stock for acquisition of subsidiary |
|
50,350,000 |
|
|
50,350 |
|
|
(50,350 |
) |
|
— |
|
|
— |
|
|
— |
|
|
— |
|
|
|
|
|
|
|
|
|
|
|
|
|
|
|
|
|
|
|
|
|
|
|
|
|
Loss for the year |
|
— |
|
|
— |
|
|
— |
|
|
— |
|
|
— |
|
|
(2,700 |
) |
|
(2,700 |
) |
|
|
|
|
|
|
|
|
|
|
|
|
|
|
|
|
|
|
|
|
|
|
|
|
Balance, December 31, 2003 |
|
62,714,085 |
|
|
62,714 |
|
|
1,367,750 |
|
|
(1,427,764 |
) |
|
— |
|
|
(2,700 |
) |
|
— |
|
|
|
|
|
|
|
|
|
|
|
|
|
|
|
|
|
|
|
|
|
|
|
|
|
March, 2004 - private placement at $0.35 per share |
|
2,000,000 |
|
|
2,000 |
|
|
698,000 |
|
|
— |
|
|
— |
|
|
— |
|
|
700,000 |
|
|
|
|
|
|
|
|
|
|
|
|
|
|
|
|
|
|
|
|
|
|
|
|
|
May, 2004 - private placement at $0.35 per share |
|
2,129,400 |
|
|
2,129 |
|
|
743,161 |
|
|
— |
|
|
— |
|
|
— |
|
|
745,290 |
|
|
|
|
|
|
|
|
|
|
|
|
|
|
|
|
|
|
|
|
|
|
|
|
|
December, 2004 - acquisition of subsidiary via issuance of common stock |
|
2,698,350 |
|
|
2,699 |
|
|
1,616,311 |
|
|
— |
|
|
— |
|
|
— |
|
|
1,619,010 |
|
- continued -
The accompanying notes are an integral part of these consolidated financial statements.
F-7
XTRA-GOLD RESOURCES CORP.
(An Exploration Stage Company)
CONSOLIDATED STATEMENTS OF STOCKHOLDERS’ EQUITY
(Expressed in U.S. Dollars)
|
|
|
Common Stock |
|
|
|
|
|
|
|
Deficit |
|
|
| ||||||||||||||||||||||||
|
|
|
Number |
|
Amount |
|
Additional |
|
Deficit |
|
Non- |
|
Accumulated |
|
Total |
| ||||||||||||||||||||||
|
|
|
|
|
|
|
|
|
|
|
|
|
|
|
|
|
|
|
|
|
|
| ||||||||||||||||
|
Continued ... |
|
|
|
|
|
|
|
|
|
|
|
|
|
|
|
|
|
|
|
|
| ||||||||||||||||
|
|
|
|
|
|
|
|
|
|
|
|
|
|
|
|
|
|
|
|
|
|
| ||||||||||||||||
|
Share issuance costs |
|
— |
|
|
— |
|
|
(76,298 |
) |
|
— |
|
|
— |
|
|
— |
|
|
(76,298 |
) | ||||||||||||||||
|
|
|
|
|
|
|
|
|
|
|
|
|
|
|
|
|
|
|
|
|
|
| ||||||||||||||||
|
Loss for the year |
|
— |
|
|
— |
|
|
— |
|
|
— |
|
|
— |
|
|
(398,533 |
) |
|
(398,533 |
) | ||||||||||||||||
|
|
|
|
|
|
|
|
|
|
|
|
|
|
|
|
|
|
|
|
|
|
| ||||||||||||||||
|
Balance, December 31, 2004 |
|
69,541,835 |
|
|
69,542 |
|
|
4,348,924 |
|
|
(1,427,764 |
) |
|
— |
|
|
(401,233 |
) |
|
2,589,469 |
| ||||||||||||||||
|
|
|
|
|
|
|
|
|
|
|
|
|
|
|
|
|
|
|
|
|
|
| ||||||||||||||||
|
May, 2005 – cancellation of shares |
|
(47,000,000 |
) |
|
(47,000 |
) |
|
47,000 |
|
|
— |
|
|
— |
|
|
— |
|
|
— |
| ||||||||||||||||
|
|
|
|
|
|
|
|
|
|
|
|
|
|
|
|
|
|
|
|
|
|
| ||||||||||||||||
|
June 2005 – for services |
|
10,000 |
|
|
10 |
|
|
5,490 |
|
|
— |
|
|
— |
|
|
— |
|
|
5,500 |
| ||||||||||||||||
|
|
|
|
|
|
|
|
|
|
|
|
|
|
|
|
|
|
|
|
|
|
| ||||||||||||||||
|
June, 2005 – private placement at $0.55 per share |
|
536,218 |
|
|
536 |
|
|
294,384 |
|
|
— |
|
|
— |
|
|
— |
|
|
294,920 |
| ||||||||||||||||
|
|
|
|
|
|
|
|
|
|
|
|
|
|
|
|
|
|
|
|
|
|
| ||||||||||||||||
|
August, 2005 – private placement at $0.55 per share |
|
300,000 |
|
|
300 |
|
|
164,700 |
|
|
— |
|
|
— |
|
|
— |
|
|
165,000 |
| ||||||||||||||||
|
|
|
|
|
|
|
|
|
|
|
|
|
|
|
|
|
|
|
|
|
|
| ||||||||||||||||
|
November, 2005 – private placement at $0.55 per share |
|
1,549,354 |
|
|
1,550 |
|
|
850,595 |
|
|
— |
|
|
— |
|
|
— |
|
|
852,145 |
| ||||||||||||||||
- continued -
The accompanying notes are an integral part of these consolidated financial statements.
F-8
XTRA-GOLD RESOURCES CORP.
(An Exploration Stage Company)
CONSOLIDATED STATEMENTS OF STOCKHOLDERS’ EQUITY
(Expressed in U.S. Dollars)
|
|
|
Common Stock |
|
|
|
|
|
|
|
Deficit |
|
|
| ||||||||||||||||||||||||
|
|
|
Number |
|
Amount |
|
Additional |
|
Deficit |
|
Non- |
|
Accumulated |
|
Total |
| ||||||||||||||||||||||
|
|
|
|
|
|
|
|
|
|
|
|
|
|
|
|
|
|
|
|
|
|
| ||||||||||||||||
|
Continued ... |
|
|
|
|
|
|
|
|
|
|
|
|
|
|
|
|
|
|
|
|
| ||||||||||||||||
|
|
|
|
|
|
|
|
|
|
|
|
|
|
|
|
|
|
|
|
|
|
| ||||||||||||||||
|
Share issuance costs |
|
— |
|
|
— |
|
|
(130,714 |
) |
|
— |
|
|
— |
|
|
— |
|
|
(130,714 |
) | ||||||||||||||||
|
|
|
|
|
|
|
|
|
|
|
|
|
|
|
|
|
|
|
|
|
|
| ||||||||||||||||
|
Stock-based compensation |
|
— |
|
|
— |
|
|
41,022 |
|
|
— |
|
|
— |
|
|
— |
|
|
41,022 |
| ||||||||||||||||
|
|
|
|
|
|
|
|
|
|
|
|
|
|
|
|
|
|
|
|
|
|
| ||||||||||||||||
|
Loss for the year |
|
— |
|
|
— |
|
|
— |
|
|
— |
|
|
— |
|
|
(272,572 |
) |
|
(272,572 |
) | ||||||||||||||||
|
|
|
|
|
|
|
|
|
|
|
|
|
|
|
|
|
|
|
|
|
|
| ||||||||||||||||
|
Balance, December 31, 2005 |
|
24,937,407 |
|
|
24,938 |
|
|
5,621,401 |
|
|
(1,427,764 |
) |
|
— |
|
|
(673,805 |
) |
|
3,544,770 |
| ||||||||||||||||
|
|
|
|
|
|
|
|
|
|
|
|
|
|
|
|
|
|
|
|
|
|
| ||||||||||||||||
|
February, 2006 – conversion of promissory note at $0.55 per share |
|
90,909 |
|
|
91 |
|
|
49,909 |
|
|
— |
|
|
— |
|
|
— |
|
|
50,000 |
| ||||||||||||||||
|
|
|
|
|
|
|
|
|
|
|
|
|
|
|
|
|
|
|
|
|
|
| ||||||||||||||||
|
March, 2006 – exercise of warrants at $0.75 per share |
|
108,500 |
|
|
108 |
|
|
81,267 |
|
|
— |
|
|
— |
|
|
— |
|
|
81,375 |
| ||||||||||||||||
|
|
|
|
|
|
|
|
|
|
|
|
|
|
|
|
|
|
|
|
|
|
| ||||||||||||||||
|
March, 2006 - private placement at $0.70 per share |
|
792,029 |
|
|
792 |
|
|
553,628 |
|
|
— |
|
|
— |
|
|
— |
|
|
554,420 |
| ||||||||||||||||
|
|
|
|
|
|
|
|
|
|
|
|
|
|
|
|
|
|
|
|
|
|
| ||||||||||||||||
|
April, 2006 – exercise of warrants at $0.75 per share |
|
177,200 |
|
|
177 |
|
|
132,723 |
|
|
— |
|
|
— |
|
|
— |
|
|
132,900 |
| ||||||||||||||||
- continued -
The accompanying notes are an integral part of these consolidated financial statements.
F-9
XTRA-GOLD RESOURCES CORP.
(An Exploration Stage Company)
CONSOLIDATED STATEMENTS OF STOCKHOLDERS’ EQUITY
(Expressed in U.S. Dollars)
|
|
|
Common Stock |
|
|
|
|
|
|
|
Deficit |
|
|
| ||||||||||||||||||||||||
|
|
|
Number |
|
Amount |
|
Additional |
|
Deficit |
|
Non- |
|
Accumulated |
|
Total |
| ||||||||||||||||||||||
|
|
|
|
|
|
|
|
|
|
|
|
|
|
|
|
|
|
|
|
|
|
| ||||||||||||||||
|
Continued ... |
|
|
|
|
|
|
|
|
|
|
|
|
|
|
|
|
|
|
|
|
| ||||||||||||||||
|
|
|
|
|
|
|
|
|
|
|
|
|
|
|
|
|
|
|
|
|
|
| ||||||||||||||||
|
June, 2006 – cancellation of shares |
|
(10,000 |
) |
|
(10 |
) |
|
(6,990 |
) |
|
— |
|
|
— |
|
|
— |
|
|
(7,000 |
) | ||||||||||||||||
|
|
|
|
|
|
|
|
|
|
|
|
|
|
|
|
|
|
|
|
|
|
| ||||||||||||||||
|
June, 2006 – private placement at $0.90 per share |
|
578,112 |
|
|
578 |
|
|
519,722 |
|
|
— |
|
|
— |
|
|
— |
|
|
520,300 |
| ||||||||||||||||
|
|
|
|
|
|
|
|
|
|
|
|
|
|
|
|
|
|
|
|
|
|
| ||||||||||||||||
|
July, 2006 – private placement at $0.90 per share |
|
1,132,000 |
|
|
1,132 |
|
|
1,017,668 |
|
|
— |
|
|
— |
|
|
— |
|
|
1,018,800 |
| ||||||||||||||||
|
|
|
|
|
|
|
|
|
|
|
|
|
|
|
|
|
|
|
|
|
|
| ||||||||||||||||
|
October, 2006 – private placement at $1.10 per share |
|
282,000 |
|
|
282 |
|
|
309,918 |
|
|
— |
|
|
— |
|
|
— |
|
|
310,200 |
| ||||||||||||||||
|
|
|
|
|
|
|
|
|
|
|
|
|
|
|
|
|
|
|
|
|
|
| ||||||||||||||||
|
Share issuance costs |
|
— |
|
|
— |
|
|
(240,616 |
) |
|
— |
|
|
— |
|
|
— |
|
|
(240,616 |
) | ||||||||||||||||
|
|
|
|
|
|
|
|
|
|
|
|
|
|
|
|
|
|
|
|
|
|
| ||||||||||||||||
|
Stock-based compensation |
|
— |
|
|
— |
|
|
206,041 |
|
|
— |
|
|
— |
|
|
— |
|
|
206,041 |
| ||||||||||||||||
|
|
|
|
|
|
|
|
|
|
|
|
|
|
|
|
|
|
|
|
|
|
| ||||||||||||||||
|
Loss for the year |
|
— |
|
|
— |
|
|
— |
|
|
— |
|
|
— |
|
|
(2,562,992 |
) |
|
(2,562,992 |
) | ||||||||||||||||
|
|
|
|
|
|
|
|
|
|
|
|
|
|
|
|
|
|
|
|
|
|
| ||||||||||||||||
|
Balance, December 31, 2006 |
|
28,088,157 |
|
|
28,088 |
|
|
8,244,671 |
|
|
(1,427,764 |
) |
|
— |
|
|
(3,236,797 |
) |
|
3,608,198 |
| ||||||||||||||||
- continued -
The accompanying notes are an integral part of these consolidated financial statements.
F-10
XTRA-GOLD RESOURCES CORP.
(An Exploration Stage Company)
CONSOLIDATED STATEMENTS OF STOCKHOLDERS’ EQUITY
(Expressed in U.S. Dollars)
|
|
|
Common Stock |
|
|
|
|
|
|
|
Deficit |
|
|
| ||||||||||||||||||||||||
|
|
|
Number |
|
Amount |
|
Additional |
|
Deficit |
|
Non- |
|
Accumulated |
|
Total |
| ||||||||||||||||||||||
|
|
|
|
|
|
|
|
|
|
|
|
|
|
|
|
|
|
|
|
|
|
| ||||||||||||||||
|
Continued ... |
|
|
|
|
|
|
|
|
|
|
|
|
|
|
|
|
|
|
|
|
| ||||||||||||||||
|
|
|
|
|
|
|
|
|
|
|
|
|
|
|
|
|
|
|
|
|
|
| ||||||||||||||||
|
October, 2007 – Private placement at $1.35 per unit |
|
668,202 |
|
|
668 |
|
|
901,405 |
|
|
— |
|
|
— |
|
|
— |
|
|
902,073 |
| ||||||||||||||||
|
|
|
|
|
|
|
|
|
|
|
|
|
|
|
|
|
|
|
|
|
|
| ||||||||||||||||
|
Share issuance costs |
|
— |
|
|
— |
|
|
(89,533 |
) |
|
— |
|
|
— |
|
|
— |
|
|
(89,533 |
) | ||||||||||||||||
|
|
|
|
|
|
|
|
|
|
|
|
|
|
|
|
|
|
|
|
|
|
| ||||||||||||||||
|
Stock-based compensation |
|
— |
|
|
— |
|
|
195,623 |
|
|
— |
|
|
— |
|
|
— |
|
|
195,623 |
| ||||||||||||||||
|
|
|
|
|
|
|
|
|
|
|
|
|
|
|
|
|
|
|
|
|
|
| ||||||||||||||||
|
Loss for the year |
|
— |
|
|
— |
|
|
— |
|
|
— |
|
|
— |
|
|
(1,874,757 |
) |
|
(1,874,757 |
) | ||||||||||||||||
|
|
|
|
|
|
|
|
|
|
|
|
|
|
|
|
|
|
|
|
|
|
| ||||||||||||||||
|
Balance, December 31, 2007 |
|
28,756,359 |
|
|
28,756 |
|
|
9,252,166 |
|
|
(1,427,764 |
) |
|
— |
|
|
(5,111,554 |
) |
|
2,741,604 |
| ||||||||||||||||
|
|
|
|
|
|
|
|
|
|
|
|
|
|
|
|
|
|
|
|
|
|
| ||||||||||||||||
|
February, 2008 – Private placement at $1.50 per unit |
|
1,062,000 |
|
|
1,062 |
|
|
1,591,938 |
|
|
— |
|
|
— |
|
|
— |
|
|
1,593,000 |
| ||||||||||||||||
|
|
|
|
|
|
|
|
|
|
|
|
|
|
|
|
|
|
|
|
|
|
| ||||||||||||||||
|
May, 2008 – Exercise of options at $0.75 per share |
|
100,000 |
|
|
100 |
|
|
74,900 |
|
|
— |
|
|
— |
|
|
— |
|
|
75,000 |
| ||||||||||||||||
|
|
|
|
|
|
|
|
|
|
|
|
|
|
|
|
|
|
|
|
|
|
| ||||||||||||||||
|
June, 2008 – Conversion of debentures at $1.00 per share |
|
650,000 |
|
|
650 |
|
|
649,350 |
|
|
— |
|
|
— |
|
|
— |
|
|
650,000 |
| ||||||||||||||||
- continued -
The accompanying notes are an integral part of these consolidated financial statements.
F-11
XTRA-GOLD RESOURCES CORP.
(An Exploration Stage Company)
CONSOLIDATED STATEMENTS OF STOCKHOLDERS’ EQUITY
(Expressed in U.S. Dollars)
|
|
|
Common Stock |
|
|
|
|
|
|
|
Deficit |
|
|
| ||||||||||||||||||||||||
|
|
|
Number |
|
Amount |
|
Additional |
|
Deficit |
|
Non- |
|
Accumulated |
|
Total |
| ||||||||||||||||||||||
|
|
|
|
|
|
|
|
|
|
|
|
|
|
|
|
|
|
|
|
|
|
| ||||||||||||||||
|
Continued ... |
|
|
|
|
|
|
|
|
|
|
|
|
|
|
|
|
|
|
|
|
| ||||||||||||||||
|
|
|
|
|
|
|
|
|
|
|
|
|
|
|
|
|
|
|
|
|
|
| ||||||||||||||||
|
July, 2008 – Exercise of warrants at $1.50 per share |
|
631,000 |
|
|
631 |
|
|
945,869 |
|
|
— |
|
|
— |
|
|
— |
|
|
946,500 |
| ||||||||||||||||
|
|
|
|
|
|
|
|
|
|
|
|
|
|
|
|
|
|
|
|
|
|
| ||||||||||||||||
|
December, 2008 – For services at $1.50 per share |
|
131,243 |
|
|
132 |
|
|
196,733 |
|
|
— |
|
|
— |
|
|
— |
|
|
196,865 |
| ||||||||||||||||
|
|
|
|
|
|
|
|
|
|
|
|
|
|
|
|
|
|
|
|
|
|
| ||||||||||||||||
|
Share issuance costs |
|
— |
|
|
— |
|
|
(125,040 |
) |
|
— |
|
|
— |
|
|
— |
|
|
(125,040 |
) | ||||||||||||||||
|
|
|
|
|
|
|
|
|
|
|
|
|
|
|
|
|
|
|
|
|
|
| ||||||||||||||||
|
Stock-based compensation |
|
— |
|
|
— |
|
|
156,444 |
|
|
— |
|
|
— |
|
|
— |
|
|
156,444 |
| ||||||||||||||||
|
|
|
|
|
|
|
|
|
|
|
|
|
|
|
|
|
|
|
|
|
|
| ||||||||||||||||
|
Loss for the year |
|
— |
|
|
— |
|
|
— |
|
|
— |
|
|
— |
|
|
(3,231,403 |
) |
|
(3,231,403 |
) | ||||||||||||||||
|
|
|
|
|
|
|
|
|
|
|
|
|
|
|
|
|
|
|
|
|
|
| ||||||||||||||||
|
Balance, December 31, 2008 |
|
31,330,602 |
|
|
31,331 |
|
|
12,742,360 |
|
|
(1,427,764 |
) |
|
— |
|
|
(8,342,957 |
) |
|
3,002,970 |
| ||||||||||||||||
|
|
|
|
|
|
|
|
|
|
|
|
|
|
|
|
|
|
|
|
|
|
| ||||||||||||||||
|
April, 2009 – Private placement at $0.70 per unit |
|
710,000 |
|
|
710 |
|
|
496,290 |
|
|
— |
|
|
— |
|
|
— |
|
|
497,000 |
| ||||||||||||||||
|
|
|
|
|
|
|
|
|
|
|
|
|
|
|
|
|
|
|
|
|
|
| ||||||||||||||||
|
May, 2009 – Private placement at $0.70 per unit |
|
308,000 |
|
|
308 |
|
|
215,292 |
|
|
— |
|
|
— |
|
|
— |
|
|
215,600 |
| ||||||||||||||||
- continued -
The accompanying notes are an integral part of these consolidated financial statements.
F-12
XTRA-GOLD RESOURCES CORP.
(An Exploration Stage Company)
CONSOLIDATED STATEMENTS OF STOCKHOLDERS’ EQUITY
(Expressed in U.S. Dollars)
|
|
|
Common Stock |
|
|
|
|
|
|
|
Deficit |
|
|
| ||||||||||||||||||||||||
|
|
|
Number |
|
Amount |
|
Additional |
|
Deficit |
|
Non- |
|
Accumulated |
|
Total |
| ||||||||||||||||||||||
|
|
|
|
|
|
|
|
|
|
|
|
|
|
|
|
|
|
|
|
|
|
| ||||||||||||||||
|
Continued ... |
|
|
|
|
|
|
|
|
|
|
|
|
|
|
|
|
|
|
|
|
| ||||||||||||||||
|
|
|
|
|
|
|
|
|
|
|
|
|
|
|
|
|
|
|
|
|
|
| ||||||||||||||||
|
May, 2009 – Repurchase and cancellation of shares at $0.25 per share |
|
(200,000 |
) |
|
(200 |
) |
|
(49,800 |
) |
|
— |
|
|
— |
|
|
— |
|
|
(50,000 |
) | ||||||||||||||||
|
|
|
|
|
|
|
|
|
|
|
|
|
|
|
|
|
|
|
|
|
|
| ||||||||||||||||
|
August, 2009 – Private placement at $0.80 per unit |
|
376,875 |
|
|
376 |
|
|
301,124 |
|
|
— |
|
|
— |
|
|
— |
|
|
301,500 |
| ||||||||||||||||
|
|
|
|
|
|
|
|
|
|
|
|
|
|
|
|
|
|
|
|
|
|
| ||||||||||||||||
|
December, 2009 – Private placement at $1.00 per unit |
|
706,000 |
|
|
706 |
|
|
705,294 |
|
|
— |
|
|
— |
|
|
— |
|
|
706,000 |
| ||||||||||||||||
|
|
|
|
|
|
|
|
|
|
|
|
|
|
|
|
|
|
|
|
|
|
| ||||||||||||||||
|
Share issuance costs |
|
— |
|
|
— |
|
|
(107,390 |
) |
|
— |
|
|
— |
|
|
— |
|
|
(107,390 |
) | ||||||||||||||||
|
|
|
|
|
|
|
|
|
|
|
|
|
|
|
|
|
|
|
|
|
|
| ||||||||||||||||
|
Stock-based compensation |
|
— |
|
|
— |
|
|
468,052 |
|
|
— |
|
|
— |
|
|
— |
|
|
468,052 |
| ||||||||||||||||
|
|
|
|
|
|
|
|
|
|
|
|
|
|
|
|
|
|
|
|
|
|
| ||||||||||||||||
|
Loss for the year |
|
— |
|
|
— |
|
|
— |
|
|
— |
|
|
(76,629 |
) |
|
(961,495 |
) |
|
(1,038,124 |
) | ||||||||||||||||
|
|
|
|
|
|
|
|
|
|
|
|
|
|
|
|
|
|
|
|
|
|
| ||||||||||||||||
|
Balance, December 31, 2009 |
|
33,231,477 |
|
$ |
33,231 |
|
$ |
14,771,222 |
|
$ |
(1,427,764 |
) |
$ |
(76,629 |
) |
$ |
(9,304,452 |
) |
$ |
3,995,608 |
| ||||||||||||||||
The accompanying notes are an integral part of these consolidated financial statements.
F-13
XTRA-GOLD RESOURCES CORP.
(An Exploration Stage Company)
NOTES TO THE CONSOLIDATED FINANCIAL STATEMENTS
(Expressed in U.S. Dollars)
DECEMBER 31, 2009
|
1. |
HISTORY AND ORGANIZATION OF THE COMPANY |
Silverwing Systems Corporation (the “Company”), a Nevada corporation, was incorporated on September 1, 1998. On June 23, 1999, the Company completed the acquisition of Advertain On-Line Canada Inc. (“Advertain Canada”), a Canadian company operating in Vancouver, British Columbia, Canada. The Company changed its name to Advertain On-Line Inc. (“Advertain”) on August 19, 1999. Advertain Canada’s business was the operation of a web site, “Advertain.com”, whose primary purpose was to distribute entertainment advertising on the Internet.
In May 2001, the Company, being unable to continue its funding of Advertain Canada’s operations, decided to abandon its interest in Advertain Canada. On June 15, 2001, the Company sold its investment in Advertain Canada back to Advertain Canada’s original shareholder. On June 18, 2001, the Company changed its name from Advertain to RetinaPharma International, Inc. (“RetinaPharma”) and became inactive.
In 2003, the Company became a resource exploration company. On October 31, 2003, the Company acquired 100% of the issued and outstanding common stock of Xtra-Gold Resources, Inc. (“XGRI”). XGRI was incorporated in Florida on October 24, 2003. On December 19, 2003, the Company changed its name from RetinaPharma to Xtra-Gold Resources Corp.
In 2004, the Company acquired 100% of the issued and outstanding capital stock of Canadiana Gold Resources Limited (“Canadiana”) and 90% of the issued and outstanding capital stock of Goldenrae Mining Company Limited (“Goldenrae”). Both companies are incorporated in Ghana and the remaining 10% of the issued and outstanding capital stock of Goldenrae is held by the Government of Ghana.
On October 20, 2005, XGRI changed its name to Xtra Energy Corp. (“Xtra Energy”).
On October 20, 2005, the Company incorporated Xtra Oil & Gas Ltd. (“XOG”) in Alberta, Canada.
On December 21, 2005, Canadiana changed its name to Xtra-Gold Exploration Limited (“XG Exploration”).
On January 13, 2006, Goldenrae changed its name to Xtra-Gold Mining Limited (“XG Mining”).
On March 2, 2006, the Company incorporated Xtra Oil & Gas (Ghana) Limited (“XOGG”) in Ghana.
|
2. |
GOING CONCERN |
The Company is in the exploration stage with respect to its resource properties, incurred a loss of $1,038,124 for the year ended December 31, 2009 and has accumulated a deficit during the exploration stage of $9,381,081. This raises substantial doubt about its ability to continue as a going concern. The ability of the Company to continue as a going concern is dependent on the Company’s ability to raise additional capital and implement its business plan. The financial statements do not include any adjustments that might be necessary if the Company is unable to continue as a going concern.
Management of the Company (“Management”) is of the opinion that sufficient financing will be obtained from external financing and further share issuances to meet the Company’s obligations. At December 31, 2009, the Company has working capital of $2,119,159.
|
3. |
SIGNIFICANT ACCOUNTING POLICIES |
Generally accepted accounting principles
These consolidated financial statements have been prepared in conformity with generally accepted accounting principles of the United States of America (“US GAAP”).
XTRA-GOLD RESOURCES CORP.
(An Exploration Stage Company)
NOTES TO THE CONSOLIDATED FINANCIAL STATEMENTS
(Expressed in U.S. Dollars)
DECEMBER 31, 2009
|
3. |
SIGNIFICANT ACCOUNTING POLICIES (cont’d...) |
Principles of consolidation
These consolidated financial statements include the accounts of the Company, its wholly owned subsidiaries, Xtra Energy (from October 31, 2003), XG Exploration (from February 16, 2004), XOG (from October 20, 2005) and XOGG (from March 2, 2006) and its 90% owned subsidiary, XG Mining (from December 22, 2004). All significant intercompany accounts and transactions have been eliminated on consolidation.
Use of estimates
The preparation of consolidated financial statements in conformity with US GAAP requires management to make estimates and assumptions that affect the reported amounts of assets and liabilities and disclosure of contingent assets and liabilities at the date of the financial statements and the reported amounts of revenues and expenses during the reporting period. Actual results could differ from those estimates.
Cash and cash equivalents
The Company considers highly liquid investments with original maturities of three months or less to be cash equivalents. At December 31, 2009 and 2008, cash and cash equivalents consisted of cash held at financial institutions.
Receivables
No allowance for doubtful accounts has been provided. Management has evaluated all receivables and believes they are all collectible.
Recovery of gold
Recovery of gold and other income is recognized when title and the risks and rewards of ownership to delivered bullion and commodities pass to the buyer and collection is reasonably assured.
Trading securities
The Company’s trading securities are reported at fair value, with unrealized gains and losses included in earnings.
|
|
Non-Controlling Interest |
The consolidated financial statements include the accounts of XG Mining (from December 22, 2004). All intercompany accounts and transactions have been eliminated upon consolidation. The Company records a non-controlling interest which reflects the 10% portion of the earnings (loss) of XG Mining allocable to the holders of the minority interest.
Oil and natural gas properties
The Company follows the full cost method of accounting for oil and natural gas operations. Under this method, all costs associated with the acquisition of, exploration for and development of oil and gas reserves are capitalized in cost centers on a country-by-country basis. Such costs include property acquisition costs, geological and geophysical studies, carrying charges on non-producing properties, costs of drilling productive wells, and overhead expenses directly related to these activities.
XTRA-GOLD RESOURCES CORP.
(An Exploration Stage Company)
NOTES TO THE CONSOLIDATED FINANCIAL STATEMENTS
(Expressed in U.S. Dollars)
DECEMBER 31, 2009
|
3. |
SIGNIFICANT ACCOUNTING POLICIES (cont’d...) |
Oil and natural gas properties (cont’d...)
Depletion is calculated for producing properties by using the unit-of-production method based on estimated proved reserves, before royalties, as determined by management of the Company or independent consultants. Sales or dispositions of oil and gas properties are credited to the respective cost centers and a gain or loss is recognized when all properties in a cost center have been disposed of, unless such sale or disposition significantly alters the relationship between capitalized costs and proved reserves of oil and gas attributable to the cost center. Costs of abandoned properties are accounted for as adjustments of capitalized costs and written off to expense.
Undeveloped properties are excluded from the depletion calculation until the quantities of proved reserves can be determined.
A ceiling test is applied to the proven properties for each cost center and for the aggregate of all cost centers by comparing the net capitalized costs to the estimated future net revenues from production of estimated proved reserves without discount, plus the costs of unproved properties net of impairment. Any excess capitalized costs are written off to expense. Further, the ceiling test for the aggregate of all cost centers is required to include the effects of future removal and site restoration costs, general and administrative expenses, financing costs and income taxes. The calculation of future net revenues is based upon prices, costs and regulations in effect at each year end.
Unproved properties are assessed for impairment on an annual basis by applying factors that rely on historical experience. In general, the Company may write off any unproved property under one or more of the following conditions:
|
|
(a) |
there are no firm plans for further drilling on the unproved property; |
|
|
(b) |
negative results were obtained from studies of the unproved properties; |
|
|
(c) |
negative results were obtained from studies conducted in the vicinity of the unproved property; or |
|
|
(d) |
the remaining term of the unproved property does not allow sufficient time for further studies or drilling. |
Equipment
Equipment is recorded at cost and is being amortized over its estimated useful lives using the declining balance method at the following annual rates:
|
|
Furniture and equipment |
20% |
|
|
Computer equipment |
30% |
|
|
Vehicles |
30% |
|
|
Mining equipment |
20% |
Deferred financing costs
Deferred financing costs consist of expenses incurred to obtain funds pursuant to the issuance of the convertible debentures and are being amortized straight-line over the term of the debentures.
XTRA-GOLD RESOURCES CORP.
(An Exploration Stage Company)
NOTES TO THE CONSOLIDATED FINANCIAL STATEMENTS
(Expressed in U.S. Dollars)
DECEMBER 31, 2009
|
3. |
SIGNIFICANT ACCOUNTING POLICIES (cont’d...) |
Mineral properties and exploration and development costs
The costs of acquiring mineral rights are capitalized at the date of acquisition. After acquisition, various factors can affect the recoverability of the capitalized costs. If, after review, management concludes that the carrying amount of a mineral property is impaired, it will be written down to estimated fair value. Exploration costs incurred on mineral properties are expensed as incurred. Development costs incurred on proven and probable reserves will be capitalized. Upon commencement of production, capitalized costs will be amortized using the unit-of-production method over the estimated life of the ore body based on proven and probable reserves (which exclude non-recoverable reserves and anticipated processing losses).
Long-lived assets
Long-lived assets held and used by the Company are reviewed for impairment whenever events or changes in circumstances indicate that the carrying amount of an asset may not be recoverable. For purposes of evaluating the recoverability of long-lived assets, the recoverability test is performed using undiscounted net cash flows related to the long-lived assets. If such assets are considered to be impaired, the impairment recognized is measured by the amount by which the carrying amount of the assets exceeds the fair value of the assets. Assets to be disposed of are reported at the lower of the carrying amount or fair value less costs to sell.
Asset retirement obligations
The Company records the fair value of an asset retirement obligation as a liability in the period in which it incurs a legal obligation associated with the retirement of tangible long-lived assets that result from the acquisition, construction, development, and/or normal use of the long-lived assets. The Company also records a corresponding asset which is amortized over the life of the asset. Subsequent to the initial measurement of the asset retirement obligation, the obligation is adjusted at the end of each period to reflect the passage of time (accretion expense) and changes in the estimated future cash flows underlying the obligation (asset retirement cost).
Stock-based compensation
The Company accounts for share-based compensation under the provisions of ASC 718, “Compensation-Stock Compensation”. Under the fair value recognition provisions, stock-based compensation expense is measured at the grant date for all stock-based awards to employees and directors and is recognized as an expense over the requisite service period, which is generally the vesting period. The Black-Scholes option valuation model is used to calculate fair value.
The Company accounts for stock compensation arrangements with non-employees in accordance with ASC 718 which require that such equity instruments are recorded at their fair value on the measurement date. The measurement of stock-based compensation is subject to periodic adjustment as the underlying equity instruments vest. Nonemployee stock-based compensation charges are amortized over the vesting period on a straight-line basis. For stock options granted to non-employees, the fair value of the stock options is estimated using a Black-Scholes valuation model.
Income taxes
The Company accounts for income taxes under the asset and liability method, deferred tax assets and liabilities are recognized for the future tax consequences attributable to differences between the financial statement carrying amounts of existing assets and liabilities and their respective tax bases. Deferred tax assets and liabilities are measured using enacted tax rates expected to apply to taxable income in the years in which those temporary differences are expected to be recovered or settled. Under the asset and liability method the effect on deferred tax assets and liabilities of a change in tax rates is recognized in income in the period that includes the enactment date. A valuation allowance is recognized if it is more likely than not that some portion or all of the deferred tax asset will not be recognized.
XTRA-GOLD RESOURCES CORP.
(An Exploration Stage Company)
NOTES TO THE CONSOLIDATED FINANCIAL STATEMENTS
(Expressed in U.S. Dollars)
DECEMBER 31, 2009
|
3. |
SIGNIFICANT ACCOUNTING POLICIES (cont’d...) |
Loss per share
Basic loss per common share is computed using the weighted average number of common shares outstanding during the year. To calculate diluted loss per share, the Company uses the treasury stock method and the if converted method. As of December 31, 2009, there were 1,610,038 warrants (2008 – 1,514,471); 972,000 stock options (2008 – 1,080,000) and convertible debentures exercisable into 250,000 common shares (2008 – 250,000) outstanding which have not been included in the weighted average number of common shares outstanding as these were anti-dilutive.
Foreign exchange
The Company’s functional currency is the U.S. dollar. The Company does not have any significant non-monetary assets and liabilities that are in a currency other than the U.S. dollar. Any monetary assets and liabilities that are in a currency other than the U.S. dollar are translated at the rate prevailing at year end. Revenue and expenses in a foreign currency are translated at rates that approximate those in effect at the time of translation. Gains and losses from translation of foreign currency transactions into U.S. dollars are included in current results of operations.
Financial instruments
The Company’s financial instruments consist of cash and cash equivalents, trading securities, receivables, accounts payable and accrued liabilities and convertible debentures. It is management’s opinion that the Company is not exposed to significant interest, currency or credit risks arising from its financial instruments. The fair values of these financial instruments approximate their carrying values unless otherwise noted. The Company has its cash primarily in one commercial bank in Toronto, Ontario, Canada.
Fair value of financial assets and liabilities
The Company measures the fair value of financial assets and liabilities based on GAAP guidance which defines fair value, establishes a framework for measuring fair value, and expands disclosures about fair value measurements. Effective January 1, 2008, the Company adopted the provisions for financial assets and liabilities, as well as for any other assets and liabilities that are carried at fair value on a recurring basis. Effective January 1, 2009, the Company adopted the provisions for non-financial assets and liabilities that are required to be measured at fair value.
The Company classifies financial assets and liabilities as held-for-trading, available-for-sale, held-to-maturity, loans and receivables or other financial liabilities depending on their nature. Financial assets and financial liabilities are recognized at fair value on their initial recognition, except for those arising from certain related party transactions which are accounted for at the transferor’s carrying amount or exchange amount.
Financial assets and liabilities classified as held-for-trading are measured at fair value, with gains and losses recognized in net income. Financial assets classified as held-to-maturity, loans and receivables, and financial liabilities other than those classified as held-for-trading are measured at amortized cost, using the effective interest method of amortization. Financial assets classified as available-for-sale are measured at fair value, with unrealized gains and losses being recognized as other comprehensive income until realized, or if an unrealized loss is considered other than temporary, the unrealized loss is recorded in income.
Financial instruments, including cash and cash equivalents, accounts payable and accrued liabilities are carried at cost, which management believes approximates fair value due to the short term nature of these instruments. Investments in trading securities are classified as held for trading, with unrealized gains and losses being recognized in income.
XTRA-GOLD RESOURCES CORP.
(An Exploration Stage Company)
NOTES TO THE CONSOLIDATED FINANCIAL STATEMENTS
(Expressed in U.S. Dollars)
DECEMBER 31, 2009
|
3. |
SIGNIFICANT ACCOUNTING POLICIES (cont’d...) |
Fair value of financial assets and liabilities (cont’d...)
The following table presents information about the assets that are measured at fair value on a recurring basis as of December 31, 2009, and indicates the fair value hierarchy of the valuation techniques the Company utilized to determine such fair value. In general, fair values determined by Level 1 inputs utilize quoted prices (unadjusted) in active markets for identical assets. Fair values determined by Level 2 inputs utilize data points that are observable such as quoted prices, interest rates and yield curves. Fair values determined by Level 3 inputs are unobservable data points for the asset or liability, and included situations where there is little, if any, market activity for the asset:
|
|
|
December 31, |
|
Quoted Prices |
|
Significant |
|
Significant |
| ||||
|
Assets: |
|
|
|
|
|
|
|
|
|
|
|
|
|
|
Cash and cash equivalents |
|
$ |
622,670 |
|
$ |
622,670 |
|
$ |
— |
|
$ |
— |
|
|
Marketable securities |
|
$ |
1,781,594 |
|
$ |
1,781,594 |
|
$ |
— |
|
$ |
— |
|
|
Total |
|
$ |
2,404,264 |
|
$ |
2,404,264 |
|
$ |
— |
|
$ |
— |
|
The fair values of cash and cash equivalents and marketable securities are determined through market, observable and corroborated sources.
Concentration of credit risk
The financial instrument which potentially subjects the Company to concentration of credit risk is cash. The Company maintains cash in bank accounts that, at times, may exceed federally insured limits. As of December 31, 2009 and 2008, the Company has exceeded the federally insured limit. The Company has not experienced any losses in such accounts and believes it is not exposed to any significant risks on its cash in bank accounts.
Recent accounting pronouncements
During the third quarter of 2009, the Company adopted the FASB Accounting Standards Codification and the Hierarchy of Generally Accepted Accounting Principles in accordance with FASB ASC Topic 105,”Generally Accepted Accounting Principles”(the Codification). The Codification has become the source of authoritative U.S. generally accepted accounting principles (GAAP) recognized by the FASB to be applied by nongovernmental entities. Rules and interpretive releases of the Securities and Exchange Commission (SEC) under authority of federal securities laws are also sources of authoritative GAAP for SEC registrants. Effective with the Company’s adoption on July 1, 2009, the Codification has superseded all prior non-SEC accounting and reporting standards. All other non-grandfathered non-SEC accounting literature not included in the Codification has become non-authoritative. As the adoption of the Codification only affected how specific references to GAAP literature have been disclosed in the notes to our condensed consolidated financial statements, it did not result in any impact on the Company’s results of operations, financial condition, or cash flows.
In December 2007, the FASB issued authoritative guidance related to non-controlling interests in consolidated financial statements, which was an amendment of ARB No. 51. This guidance is set forth in ASC 810, Consolidation. ASC 810 establishes accounting and reporting standards for the non-controlling interest in a subsidiary and for the deconsolidation of a subsidiary. This accounting standard is effective for fiscal years beginning on or after December 15, 2008, which for the Company was the fiscal year beginning January 1, 2009. The Company adopted ASC 810 at January 1, 2009, which resulted in $76,629 allocated to the non-controlling interest.
XTRA-GOLD RESOURCES CORP.
(An Exploration Stage Company)
NOTES TO THE CONSOLIDATED FINANCIAL STATEMENTS
(Expressed in U.S. Dollars)
DECEMBER 31, 2009
|
3. |
SIGNIFICANT ACCOUNTING POLICIES (cont’d...) |
Recent accounting pronouncements (cont’d...)
In September 2009, the FASB issued authoritative guidance regarding multiple-deliverable revenue arrangements. This guidance addresses how to separate deliverables and how to measure and allocate consideration to one or more units of accounting. Specifically, the guidance requires that consideration be allocated among multiple deliverables based on relative selling prices. The guidance establishes a selling price hierarchy of (1) vendor-specific objective evidence, (2) third-party evidence and (3) estimated selling price. This guidance is effective for annual periods beginning after June 15, 2010 but may be early adopted as of the beginning of an annual period. The Company is currently evaluating the effect that this guidance will have on consolidated financial position and results of operations.
ASC 855-10-20, “Subsequent Events” establishes accounting and reporting standards for events that occur after the balance sheet date but before financial statements are issued or are available to be issued and requires the disclosure of the date through which a company has evaluated subsequent events. This statement is effective for our third quarter ended September 30, 2009 and the adoption did not have an impact on the condensed consolidated financial statements. See Note 17 for the required disclosures.
In April 2009, the FASB issued ASC 820-10-65 formerly FASB Staff Position FAS 157-4, “Determining Fair Value When the Volume and Level of Activity for the Asset or Liability Have Significantly Decreased and Identifying Transactions That Are Not Orderly” (“FSP 157-4”). This provides significant guidance for determining when a market has become inactive as well as guidance for determining whether transactions are not orderly. It also provides guidance on the use of valuation techniques and the use of broker quotes and pricing services. It reiterates that fair value is based on an exit price and also that fair value is market-driven and not entity-specific. The accounting standard of codification applies to all assets and liabilities within the scope of ASC 820 and is effective for all interim and annual periods ending after June 15, 2009. The adoption of ASC 820-10-65 did not have a material effect on the Company’s results of operations, financial position, and cash flows.
In April 2009, the FASB issued ASC 320-10-65, formerly FASB Staff Position FAS 115-2, FAS 124-2 and EITF 99-20-2, “Recognition and Presentation of Other-Than-Temporary Impairments” (“FSP 115-2”). This accounting standard provides guidance related to determining the amount of an other-than-temporary impairment (OTTI) of debt securities and prescribes the method to be used to present information about an OTTI in the financial statements. It is effective for all interim and annual periods ending after June 15, 2009. The adoption of FSP 115-2 did not have a material effect on the Company’s results of operations, financial position, and cash flows.
In April 2009, the FASB issued ASC 825-10-65, formerly FASB Staff Position FAS 107-1 and APB 28-1, “Interim Disclosures about Fair Value of Financial Instruments” (“FSP 107-1”), which increases the frequency of fair value disclosures to a quarterly basis instead of an annual basis. The guidance relates to fair value disclosures for any financial instruments that are not currently reflected on the balance sheet at fair value. This ASC is effective for interim and annual periods ending after June 15, 2009. The adoption did not have a material effect on the Company’s results of operations, financial position, and cash flows.
|
4. |
INVESTMENTS IN TRADING SECURITIES |
At December 31, 2009, the Company held investments classified as trading securities, which consisted of various equity securities. All trading securities are carried at fair value. As of December 31, 2009, the fair value of trading securities was $1,781,594 (2008 – $1,470,382).
XTRA-GOLD RESOURCES CORP.
(An Exploration Stage Company)
NOTES TO THE CONSOLIDATED FINANCIAL STATEMENTS
(Expressed in U.S. Dollars)
DECEMBER 31, 2009
|
5. |
EQUIPMENT |
|
|
|
December 31, 2009 |
|
December 31, 2008 |
| ||||||||||||||
|
|
|
Cost |
|
Accumulated Amortization |
|
Net Book Value |
|
Cost |
|
Accumulated Amortization |
|
Net Book Value |
| ||||||
|
|
|
|
|
|
|
|
|
|
|
|
|
|
|
|
|
|
|
|
|
|
Furniture and equipment |
|
$ |
12,416 |
|
$ |
4,171 |
|
$ |
8,245 |
|
$ |
12,416 |
|
$ |
2,110 |
|
$ |
10,306 |
|
|
Computer equipment |
|
|
24,864 |
|
|
17,800 |
|
|
7,064 |
|
|
24,864 |
|
|
14,772 |
|
|
10,092 |
|
|
Mining equipment |
|
|
304,083 |
|
|
86,352 |
|
|
217,731 |
|
|
316,791 |
|
|
55,456 |
|
|
261,335 |
|
|
Vehicles |
|
|
76,398 |
|
|
64,930 |
|
|
11,468 |
|
|
76,398 |
|
|
45,831 |
|
|
30,567 |
|
|
|
|
$ |
417,761 |
|
$ |
173,253 |
|
$ |
244,508 |
|
$ |
430,469 |
|
$ |
118,169 |
|
$ |
312,300 |
|
As of December 31, 2009 the Company also had made a deposit of $151,506 to acquire mining equipment, which was delivered subsequent to year end.
|
6. |
DEFERRED FINANCING COSTS |
|
|
|
December 31, 2009 |
|
December 31, 2008 |
| ||
|
|
|
|
|
|
|
|
|
|
Balance, beginning of year |
|
|
$ 3,850 |
|
|
$ 23,101 |
|
|
Costs incurred |
|
|
— |
|
|
— |
|
|
Amortization |
|
|
(2,567 |
) |
|
(19,251 |
) |
|
Balance, end of year |
|
|
$ 1,283 |
|
|
$ 3,850 |
|
During the year ended December 31, 2005, the Company paid a finder’s fee of $45,000 and other expenses of $1,202 relating to a convertible debenture financing (Note 9).
|
7. |
OIL AND GAS INVESTMENT |
In April 2008, XOG purchased an 18.9% participating interest in a petroleum and natural gas lease at an Alberta Crown Land sale. The lease has a five year term, but may be held by continuous production of petroleum and natural gas commencing prior to the expiry of the five year term.
|
8. |
MINERAL PROPERTIES |
|
|
|
December 31, 2009 |
|
December 31, 2008 |
| ||
|
|
|
|
|
|
|
|
|
|
Acquisition costs |
|
|
$ 1,607,729 |
|
|
$ 1,607,729 |
|
|
Asset retirement obligation (Note 10) |
|
|
54,835 |
|
|
54,835 |
|
|
Total |
|
|
$ 1,662,564 |
|
|
$ 1,662,564 |
|
XTRA-GOLD RESOURCES CORP.
(An Exploration Stage Company)
NOTES TO THE CONSOLIDATED FINANCIAL STATEMENTS
(Expressed in U.S. Dollars)
DECEMBER 31, 2009
|
8. |
MINERAL PROPERTIES (cont’d...) |
Kwabeng, Pameng and Apapam Projects
The Company holds three mining leases in Ghana. These mining leases grant the Company mining rights to produce gold in the leased areas until July 26, 2019 with respect to the Kwabeng and Pameng Projects and until December 17, 2015 with respect to the Apapam Project, the latter of which can be renewed for a further 30 year term on application and payment of applicable fees to the Minerals Commission. All gold production will be subject to a 3% production royalty of the net smelter returns (“NSR”).
Banso and Muoso Project
The Company holds a prospecting license on its Banso and Muoso Project in Ghana. This license grants the Company the right to conduct exploratory work to determine whether there are mineable reserves of gold or diamonds in the licensed areas, and currently has been renewed for a further one year term (to December 21, 2010) and is further renewable on application and payment of applicable renewal fees to the Minerals Commission. If mineable reserves of gold or diamonds are discovered, the Company will have the option to acquire a mining lease.
Option agreement on Edum Banso Project
In October, 2005, XG Exploration entered into an option agreement (the “Option Agreement”) with Adom Mining Limited (“Adom”) to acquire 100% of Adom’s right, title and interest in and to a prospecting license on the Edum Banso concession (the “Edum Banso Project”) located in Ghana. Adom further granted XG Exploration the right to explore, develop, mine and sell mineral products from this concession. The renewal date was July 14, 2009 and the Company has been granted an extension by the Minerals Commission to December 1, 2010.
The consideration paid was $15,000 with additional payments of $5,000 to be paid on the anniversary date of the Option Agreement in each year during the term. Upon the commencement of gold production, an additional $200,000 is to be paid, unless proven and probable reserves are less than 2,000,000 ounces, in which case the payment shall be reduced to $100,000.
Upon successful transfer of title from Adom to XG Exploration, a production royalty (the “Royalty”) of 2% of the net smelter returns shall be paid to Adom; provided, however that in the event that less than 2,000,000 ounces of proven and probable reserves are discovered, then the Royalty shall be 1%. The Royalty can be purchased by XG Exploration for $2,000,000; which will be reduced to $1,000,000 if proven and probable reserves are less than 2,000,000 ounces.
Mining lease and prospecting license commitments
The Company is committed to expend, from time to time to the Minerals Commission for an extension of an expiry date of a prospecting license (currently $15,000 for each occurrence) or a mining lease and the Environmental Protection Agency (“EPA”) (of Ghana) for processing and certificate fees with respect to EPA permits, an aggregate of less than $500 in connection with annual or ground rent and mining permits to enter upon and gain access to the areas covered by the Company’s mining leases and prospecting licenses.
|
9. |
CONVERTIBLE DEBENTURES |
During the year ended December 31, 2005, the Company completed a convertible debenture financing for gross proceeds of $900,000. The debentures bear interest at 7% per annum, payable quarterly, and the principal balance is repayable by June 30, 2010. Debenture holders have the option to convert any portion of the outstanding principal into common shares at the conversion rate of $1 per share. During the year ended December 31, 2008, convertible debentures totalling $650,000 were converted into 650,000 common shares. Subsequent to the year ended December 31, 2009, the convertible debenture of $250,000 was converted into 250,000 common shares (Note 17).
XTRA-GOLD RESOURCES CORP.
(An Exploration Stage Company)
NOTES TO THE CONSOLIDATED FINANCIAL STATEMENTS
(Expressed in U.S. Dollars)
DECEMBER 31, 2009
|
10. |
ASSET RETIREMENT OBLIGATION |
|
|
|
December 31, 2009 |
|
December 31, 2008 |
| ||
|
|
|
|
|
|
|
|
|
|
Balance, beginning of year |
|
|
$ 65,369 |
|
|
$ 28,399 |
|
|
Change in obligation |
|
|
— |
|
|
36,970 |
|
|
Accretion expense |
|
|
6,537 |
|
|
— |
|
|
Balance, end of year |
|
|
$ 71,906 |
|
|
$ 65,369 |
|
The Company has a legal obligation associated with its mineral properties for clean up costs when work programs are completed.
The undiscounted amount of cash flows, required over the estimated reserve life of the underlying assets, to settle the obligation, adjusted for inflation, is estimated at $150,000 (2008 - $150,000). The obligation was calculated using a credit-adjusted risk free discount rate of 10% and an inflation rate of 2%. It is expected that this obligation will be funded from general Company resources at the time the costs are incurred.
|
11. |
CAPITAL STOCK |
Cancellation of shares
In May 2005, 47,000,000 common shares owned by two former directors were returned to treasury and cancelled.
In June 2006, 10,000 common shares were returned to the Company in settlement of a dispute and cancelled.
In May 2009, 200,000 common shares were repurchased for $50,000 and cancelled.
Issuance of shares for services
In December 2008, an aggregate of 131,243 common shares were issued to three vendors of the Company’s subsidiary, XG Mining to settle outstanding accounts for services at a value of $1.50 per share.
Private placements
In December 2009, the Company issued 706,000 units at $1.00 per unit for gross proceeds of $706,000. Each unit consisted of one common share and one half of one share purchase warrant. One whole warrant enables the holder to acquire an additional common share at a price of $1.50 expiring eighteen months from the date of issue. The Company also issued finder’s warrants enabling the holders to acquire up to 50,600 common shares at the same terms as the unit warrants. The fair value of finder’s warrants was $20,098 calculated using the Black-Scholes valuation method. The assumptions used were 1.5 years of expected life, risk free interest rate of 2.05%, volatility of 109% and a dividend rate of 0%
In August 2009, the Company issued 376,875 units at $0.80 per unit for gross proceeds of $301,500. Each unit consisted of one common share and one half of one share purchase warrant. One whole warrant enables the holder to acquire an additional common share at a price of $1.00 expiring two year from the date of issue.
In April and May 2009, the Company issued 1,018,000 units at $0.70 per unit for gross proceeds of $712,600. Each unit consisted of one common share and one share purchase warrant enabling the holder to acquire an additional common share at a price of $1.00 expiring two years from the date of issue.
XTRA-GOLD RESOURCES CORP.
(An Exploration Stage Company)
NOTES TO THE CONSOLIDATED FINANCIAL STATEMENTS
(Expressed in U.S. Dollars)
DECEMBER 31, 2009
|
11. |
CAPITAL STOCK (cont’d...) |
Private placements (cont’d...)
In February 2008, the Company issued 1,062,000 units at $1.50 per unit for gross proceeds of $1,593,000. Each unit consisted of one common share and one share purchase warrant enabling the holder to acquire an additional common share at a price of $2.25 per share expiring on July 7, 2009. The Company also issued finder’s warrants enabling the holder to acquire up to 84,960 common shares at the same terms as the unit warrants. The fair value of the finder’s warrants was $15,136 and calculated using the Black-Scholes valuation method. The assumptions used were 1.5 years of expected life, risk free interest rate of 4.88%, volatility of 33% and a dividend rate of 0%.
In October 2007, the Company issued 668,202 units at $1.35 per unit for gross proceeds of $902,073. Each unit consisted of one common share and one half of one share purchase warrant. One whole warrant enables the holder to acquire an additional common share at a price of $1.75 for one year which expiry date was extended to January 13, 2009 (expired). The Company also issued finder’s warrants enabling the holder to acquire up to 33,410 common shares at the same terms as the unit warrants (expired). The fair value of the finder’s warrants was $2,015 and calculated using the Black-Scholes valuation method. The assumptions used were 1 year of expected life, risk free interest rate of 4.50%, volatility of 36% and a dividend rate of 0%.
In October 2006, the Company issued 282,000 common shares at $1.10 per share for gross proceeds of $310,200. For each two shares subscribed for, the purchaser received one share purchase warrant which enables the holder to acquire an additional common share at a price of $1.50 to April 23, 2008 which expiry date was extended to July 13, 2008 (65,000 exercised; 76,000 expired).
In July 2006, the Company issued 1,132,000 common shares at $0.90 per share for gross proceeds of $1,018,800. For each two shares subscribed for, the purchaser received one share purchase warrant which enables the holder to acquire an additional common share at a price of $1.50 to July 31, 2007 which expiry date was extended to July 13, 2008 (566,000 exercised).
In June 2006, the Company issued 578,112 common shares at $0.90 per share for gross proceeds of $520,300. For each two shares subscribed for, the purchaser received one share purchase warrant which enables the holder to acquire an additional common share at a price of $1.50 to June 16, 2007 (expired).
In March 2006, the Company issued 792,029 common shares at $0.70 per share for gross proceeds of $554,420.
In November 2005, the Company issued 1,549,354 common shares at $0.55 per share for gross proceeds of $852,145.
In August 2005, the Company issued 300,000 common shares at $0.55 per share for gross proceeds of $165,000. For each two shares subscribed for, the purchaser received one share purchase warrant which enables the holder to acquire an additional common share at a price of $0.75 to August 31, 2006 (expired).
In June 2005, the Company issued 536,218 common shares at $0.55 per share for gross proceeds of $294,920. For each two shares subscribed for, the purchaser received one share purchase warrant which enables the holder to acquire an additional common share at a price of $0.75 to April 30, 2006 (177,200 exercised; 90,910 expired).
Acquisition of subsidiary
Effective December 22, 2004, the Company acquired 90% of the outstanding shares of XG Mining in exchange for 2,698,350 shares of common stock. In connection with this acquisition, 47,000,000 shares owned by two former officers and directors of the Company were returned to treasury and cancelled.
XTRA-GOLD RESOURCES CORP.
(An Exploration Stage Company)
NOTES TO THE CONSOLIDATED FINANCIAL STATEMENTS
(Expressed in U.S. Dollars)
DECEMBER 31, 2009
|
11. |
CAPITAL STOCK (cont’d...) |
Stock options
The number of shares reserved for issuance under the Company’s equity compensation option plan is 3,000,000. The terms and conditions of any options granted, including the number and type of options, the exercise period, the exercise price and vesting provisions, are determined by the board of directors.
At December 31, 2009, the following stock options were outstanding:
|
|
Number of Options |
Exercise Price |
Expiry Date |
|
|
|
|
|
|
|
432,000 |
$0.70 |
May 1, 2013 |
|
|
270,000 |
$0.75 |
May 1, 2013 |
|
|
270,000 |
$0.75 |
May 1, 2013 |
Stock option transactions and the number of stock options outstanding are summarized as follows:
|
|
|
2009 |
|
|
2008 |
| ||||||
|
|
|
Number of |
|
Weighted Average |
|
|
Number of |
|
Weighted Average |
| ||
|
|
|
|
|
|
|
|
|
|
|
|
|
|
|
Outstanding, beginning of year |
|
1,080,000 |
|
|
$ 0.72 |
|
|
1,480,000 |
|
|
$ 0.75 |
|
|
Granted |
|
— |
|
|
— |
|
|
— |
|
|
— |
|
|
Exercised |
|
— |
|
|
— |
|
|
(100,000 |
) |
|
0.75 |
|
|
Cancelled/Expired |
|
(108,000 |
) |
|
0.70 |
|
|
(300,000 |
) |
|
0.80 |
|
|
|
|
|
|
|
|
|
|
|
|
|
|
|
|
Outstanding, end of year |
|
972,000 |
|
|
$ 0.73 |
|
|
1,080,000 |
|
|
$ 0.73 |
|
|
|
|
|
|
|
|
|
|
|
|
|
|
|
|
Exercisable, end of year |
|
972,000 |
|
|
$ 0.73 |
|
|
783,000 |
|
|
$ 0.72 |
|
The aggregate intrinsic value for options vested as of December 31, 2009 is approximately $272,000 (2008 - $Nil) and for total options outstanding is approximately $284,000 (2008 - $Nil).
Stock-based compensation
The fair value of stock options granted during the year ended December 31, 2009 totalled $Nil (2008 - $Nil). During the year ended December 31, 2009, the Company extended the life of the options to May 1, 2013 which resulted in an expense of $468,052 (2008 - $156,444) which was included in general and administrative expenses. The remaining $Nil (2008 - $83,870) will be expensed in future periods.
The following assumptions were used for the Black-Scholes valuation of stock options granted or extended during the years ended December 31, 2009 and 2008:
|
|
2009 |
2008 |
|
|
|
|
|
Risk-free interest rate |
2% |
— |
|
Expected life |
4 years |
— |
|
Annualized volatility |
108.16 |
— |
|
Dividend rate |
— |
— |
The weighted average fair value of options granted was $Nil (2008 - $Nil).
XTRA-GOLD RESOURCES CORP.
(An Exploration Stage Company)
NOTES TO THE CONSOLIDATED FINANCIAL STATEMENTS
(Expressed in U.S. Dollars)
DECEMBER 31, 2009
|
11. |
CAPITAL STOCK (cont’d...) |
Warrants
At December 31, 2009, the following warrants were outstanding:
|
|
Number of Warrants |
Exercise Price |
Expiry Date |
|
|
|
|
|
|
|
350,000 |
$1.00 |
April 1, 2011 |
|
|
360,000 |
$1.00 |
April 16, 2011 |
|
|
308,000 |
$1.00 |
May 19, 2011 |
|
|
188,438 |
$1.00 |
August 5, 2011 |
|
|
403,600 |
$1.50 |
June 16, 2011 |
Warrant transactions and the number of warrants outstanding are summarized as follows:
|
|
|
2009 |
|
2008 |
|
|
|
|
|
|
|
|
|
Balance, beginning of year |
|
1,514,471 |
|
1,074,511 |
|
|
Issued |
|
1,610,038 |
|
1,146,960 |
|
|
Exercised |
|
— |
|
(631,000 |
) |
|
Expired |
|
(1,514,471 |
) |
(76,000 |
) |
|
Balance, end of year |
|
1,610,038 |
|
1,514,471 |
|
|
12. |
RELATED PARTY TRANSACTIONS |
During the years ended December 31, 2009 and 2008, the Company entered into the following transactions with related parties:
|
|
(a) |
Paid or accrued consulting fees of $160,927 (2008 - $169,957) to officers of the Company or companies controlled by such officers. |
|
|
(b) |
Paid or accrued directors’ fees of CAD$21,000 (USD$18,486) (2008 – CAD30,335 (USD$28,639)) to directors of the Company or companies controlled by directors. |
The amounts charged to the Company for the services provided have been determined by negotiation among the parties. These transactions were in the normal course of operations and were measured at the exchange value, which represented the amount of consideration established and agreed to by the related parties.
XTRA-GOLD RESOURCES CORP.
(An Exploration Stage Company)
NOTES TO THE CONSOLIDATED FINANCIAL STATEMENTS
(Expressed in U.S. Dollars)
DECEMBER 31, 2009
|
13. |
SUPPLEMENTAL DISCLOSURE WITH RESPECT TO CASH FLOWS |
|
|
|
Cumulative amounts |
|
2009 |
|
2008 |
| |||
|
|
|
|
|
|
|
|
|
|
|
|
|
Cash paid during the period for: |
|
|
|
|
|
|
|
|
|
|
|
Interest |
|
$ |
187,362 |
|
$ |
— |
|
$ |
29,862 |
|
|
Income taxes |
|
$ |
— |
|
$ |
— |
|
$ |
— |
|
The significant non-cash transaction during the year ended December 31, 2009 was the issuance of 50,600 finder’s warrants with a value of $20,098 in connection with a private placement (Note 11).
The significant non-cash transactions during the year ended December 31, 2008 were the issuance of 84,960 finder’s warrants with a value of $15,136 in connection to a private placement, the conversion of $650,000 of convertible debentures into 650,000 common shares and the issuance of 131,243 common shares for services rendered with a value of $196,865.
|
14. |
DEFERRED INCOME TAXES |
Income tax benefits attributable to losses from United States of America operations was $Nil for the years ended December 31, 2009 and 2008, and differed from the amounts computed by applying the United States of America federal income tax rate of 34% to pretax losses from operations as a result of the following:
|
|
|
2009 |
|
2008 |
| ||
|
|
|
|
|
|
|
|
|
|
Loss for the year |
|
$ |
(1,038,124 |
) |
$ |
(3,231,403 |
) |
|
|
|
|
|
|
|
|
|
|
Computed “expected” tax (benefit) expense |
|
$ |
(352,962 |
) |
$ |
(1,098,677 |
) |
|
Non deductible (taxable) items |
|
|
(130,796 |
) |
|
487,376 |
|
|
Lower effective income tax rate on loss of foreign subsidiaries |
|
|
68,966 |
|
|
55,690 |
|
|
Valuation allowance |
|
|
414,792 |
|
|
555,611 |
|
|
|
|
|
|
|
|
|
|
|
Net expected tax (benefit) expense |
|
$ |
— |
|
$ |
— |
|
The tax effects of temporary differences that give rise to significant deferred tax assets and deferred tax liabilities are presented below:
|
|
|
2009 |
|
2008 |
| ||
|
|
|
|
|
|
|
|
|
|
Deferred tax assets (liabilities): |
|
|
|
|
|
|
|
|
Net operating loss carryforwards - US |
|
$ |
1,278,492 |
|
$ |
1,279,002 |
|
|
Trading securities |
|
|
(49,288 |
) |
|
250,917 |
|
|
Net operating loss carryforwards - Ghana |
|
|
1,038,366 |
|
|
898,094 |
|
|
|
|
|
|
|
|
|
|
|
Valuation allowance |
|
|
(2,267,570 |
) |
|
(2,428,013 |
) |
|
|
|
|
|
|
|
|
|
|
Total deferred tax assets |
|
$ |
— |
|
$ |
— |
|
XTRA-GOLD RESOURCES CORP.
(An Exploration Stage Company)
NOTES TO THE CONSOLIDATED FINANCIAL STATEMENTS
(Expressed in U.S. Dollars)
DECEMBER 31, 2009
|
14. |
DEFERRED INCOME TAXES (cont’d...) |
The valuation allowance for deferred tax assets as of December 31, 2009 and 2008 was $(2,267,570) and $(2,428,013) respectively. In assessing the realizability of deferred tax assets, management considers whether it is more likely than not that some portion or all of the deferred tax assets will not be realized. The ultimate realization of deferred tax assets is dependent upon the generation of future taxable income during the periods in which those temporary differences become deductible.
Management considers the scheduled reversal of deferred tax liabilities, projected future taxable income, and tax planning strategies in assessing the realizability of deferred tax assets. In order to fully realize the deferred tax asset attributable to net operating loss carryforwards, the Company will need to generate future taxable income of approximately $7,620,000 prior to the expiration of the net operating loss carryforwards. Of the $7,620,000 of operating loss carryforwards, $4,566,000 is attributable to the US, and expires between 2020 and 2029, and the balance of $3,054,000 is attributable to Ghana and expires between 2010 and 2013.
|
15. |
SEGMENTED INFORMATION |
The Company has one reportable segment, being the exploration and development of resource properties.
Geographic information is as follows:
|
|
|
2009 |
|
2008 |
| ||
|
|
|
|
|
|
|
|
|
|
Capital assets: |
|
|
|
|
|
|
|
|
Canada |
|
$ |
94,751 |
|
$ |
61,307 |
|
|
Ghana |
|
|
1,852,321 |
|
|
1,953,557 |
|
|
|
|
|
|
|
|
|
|
|
Total capital assets |
|
$ |
1,947,072 |
|
$ |
2,014,864 |
|
|
16. |
CONTINGENCY AND COMMITMENTS |
|
|
a) |
Effective May 1, 2006, the Company entered into a management consulting agreement with the Vice President, Exploration whereby the Company will pay $5,000 per month for three years for providing 50% of his time in consulting services to the Company (renewed to May 1, 2010 at a rate of CAD$10,000 (USD$8,804) per month effective September 1, 2009 for providing the majority of his time in consulting services to the Company). In the event of termination, without cause, 18 months of fees will be payable. |
|
|
b) |
The Company has entered into a temporary consulting agreement with Brokton International Ltd. (“Brokton”), a company controlled by its President, James Longshore. Brokton is to be paid $5,000 per monthfor fiscal 2009. |
|
|
c) |
The Company leases 1,163 square feet for its corporate office located at Suite 301, 360 Bay Street, Toronto, Ontario. The lease has a 66 month term commencing May 1, 2007, at approximately CAD$3,868 (USD$3,405) per month. |
|
|
d) |
The Company was party to a lawsuit for the sum of $121,336 filed in the Ghanaian courts pertaining to payment for excavation services provided by a subcontractor. No further liability had been recorded in connection with the lawsuit because the Company believed the debt had previously been discharged through the transfer of shares to the subcontractor in 2008. Subsequent to year end, the lawsuit was settled and the Company agreed to pay $108,000 in return for the shares previously issued. Upon payment by the Company of $108,000, the 80,891shares were returned to the Company and cancelled. |
XTRA-GOLD RESOURCES CORP.
(An Exploration Stage Company)
NOTES TO THE CONSOLIDATED FINANCIAL STATEMENTS
(Expressed in U.S. Dollars)
DECEMBER 31, 2009
|
17. |
SUBSEQUENT EVENTS |
|
|
a) |
On January 31, 2010, the Company granted 216,000 stock options to consultants and 108,000 to a director. The options are exercisable at a price of $1.00 per share for 36 months and will vest as to 3,000 options per month respectively. |
|
|
b) |
On February 14, 2010 the Company granted 110,000 stock options to a consultant. The options are exercisable at a price of $1.00 per share for 13 months and will vest as to 20,000 options per month for the first five months and the balance of 10,000 options will vest in the sixth month. |
|
|
c) |
On February 16, 2010, the $250,000 convertible debenture was converted into 250,000 common shares. |
|
|
d) |
On February 18, 2010, the Company settled a lawsuit for a total sum of $108,000 (Note 16). |