Attached files
| file | filename |
|---|---|
| EX-32.2 - SECTION 906 CERT - CAMERON WAY - ONVIA INC | way906cert.htm |
| EX-31.2 - SECTION 302 CERT - CAMERON WAY - ONVIA INC | way302cert.htm |
| EX-23.1 - CONSENT OF INDEPENDENT REGISTERED PUBLIC ACCTG FIRM - ONVIA INC | consent2009.htm |
| EX-31.1 - SECTION 302 CERT - MIKE PICKETT - ONVIA INC | pickett302cert.htm |
| EX-32.1 - SECTION 906 CERT - MIKE PICKETT - ONVIA INC | pickett906cert.htm |
| EX-10.11 - SEPARATION AGREEMENT - MIKE TANNOURJI - ONVIA INC | miketseparation.htm |
| EX-10.12 - 2010 VARIABLE COMP PLAN - IRV ALPERT - ONVIA INC | alpert2010incentive.htm |
| EX-10.13 - 2010 VARIABLE COMP PLAN - MICHAEL BALSAM - ONVIA INC | balsam2010incentive.htm |
| EX-10.10 - 2010 MANAGEMENT INCENTIVE PLAN - ONVIA INC | mip2010.htm |
SECURITIES AND EXCHANGE COMMISSION
Washington, D.C. 20549
FORM 10-K
|
x
|
ANNUAL REPORT PURSUANT TO SECTION 13 OR 15(d) OF THE SECURITIES EXCHANGE ACT OF 1934
|
For the fiscal year ended December 31, 2009
OR
|
¨
|
TRANSITION REPORT PURSUANT TO SECTION 13 OR 15(d) OF THE SECURITIES EXCHANGE ACT OF 1934
|
For the transition period from to
Commission File Number 000-29609
ONVIA, INC.
(Exact Name of Registrant as Specified in its Charter)
|
Delaware
|
91-1859172
|
|
(State or Other Jurisdiction
of Incorporation or Organization)
|
(I.R.S. Employer
Identification No.)
|
509 Olive Way, Suite 400, Seattle, Washington 98101
(Address of Principal Executive Offices)
(206) 282-5170
(Registrant’s Telephone Number, Including Area Code)
Securities Registered Pursuant to Section 12(b) of the Act:
|
Title of each class
|
Name of exchange on which registered
|
|
|
Common Stock, $.0001 par value per share
|
The NASDAQ Capital Market
|
Securities Registered Pursuant to Section 12(g) of the Act:
None
Indicate by check mark if the registrant is a well-known seasoned issuer, as defined in Rule 405 of the Securities Act. Yes ¨ No x
Indicate by check mark if the registrant is not required to file reports pursuant to Section 13 or Section 15(d) of the Act. Yes ¨ No x
Indicate by check mark whether the registrant: (1) has filed all reports required to be filed by Section 13 or 15(d) of the Securities Exchange Act of 1934 during the preceding twelve months (or for such shorter period that the registrant was required to file such reports), and (2) has been subject to such filing requirements for the past 90 days. Yes x No ¨
Indicate by check mark whether the registrant has submitted electronically and posted on its corporate Web site, if any, every Interactive Data File required to be submitted and posted pursuant to Rule 405 of Regulation S-T (§232.405 of this chapter) during the preceding 12 months (or for such shorter period that the registrant was required to submit and post such files). Yes x No ¨
Indicate by check mark if disclosure of delinquent filers pursuant to Item 405 of Regulation S-K is not contained herein, and will not be contained, to the best of the registrant’s knowledge, in definitive proxy or information statements incorporated by reference in Part III of this Form 10-K or any amendment to this Form 10-K. x
Indicate by check mark whether the registrant is a large accelerated filer, an accelerated filer, a non-accelerated filer, or a smaller reporting company. See the definitions of “large accelerated filer,” “accelerated filer” and “smaller reporting company” in Rule 12b-2 of the Exchange Act.
Large accelerated filer ¨ Accelerated filer ¨ Non-accelerated filer ¨ Smaller reporting company x
Indicate by check mark whether the registrant is a shell company (as defined in Rule 12b-2 of the Exchange Act). Yes ¨ No x
The aggregate market value of the voting and non-voting common stock held by non-affiliates of the registrant, based on the closing price on June 30, 2009, as reported on the NASDAQ Capital Market, was $29,514,978.
The number of shares of the registrant’s common stock outstanding at March 1, 2010 was 8,283,270.
DOCUMENTS INCORPORATED BY REFERENCE
Portions of the registrant’s proxy statement related to its 2010 annual stockholders’ meeting to be filed subsequently are incorporated by reference into Part III of this Form 10-K
ONVIA, INC.
FORM 10-K
For the Year Ended December 31, 2009
INDEX
|
PAGE
|
||
|
PART 1.
|
||
|
ITEM 1.
|
BUSINESS
|
1
|
|
ITEM 1A.
|
RISK FACTORS
|
8
|
|
ITEM 1B.
|
UNRESOLVED STAFF COMMENTS
|
13
|
|
ITEM 2.
|
PROPERTIES
|
13
|
|
ITEM 3.
|
LEGAL PROCEEDINGS
|
14
|
|
ITEM.4.
|
REMOVED AND RESERVED
|
|
|
PART II.
|
||
|
ITEM 5.
|
MARKET FOR THE REGISTRANT'S COMMON EQUITY, RELATED STOCKHOLDER MATTERS AND ISSUER PURCHASES OF EQUITY SECURITIES
|
16
|
|
ITEM 6.
|
SELECTED CONSOLIDATED FINANCIAL DATA
|
19
|
|
ITEM 7.
|
MANAGEMENT'S DISCUSSION AND ANALYSIS OF FINANCIAL CONDITION AND RESULTS OF OPERATIONS
|
20
|
|
ITEM 7A.
|
QUANTITIVE AND QUALITATIVE DISCLOSURES ABOUT MARKET RISK
|
28
|
|
ITEM 8.
|
CONSOLIDATED FINANCIAL STATEMENTS AND SUPPLEMENTARY DATA
|
30
|
|
CONSOLIDATED BALANCE SHEETS
|
30
|
|
|
CONSOLIDATED STATEMENTS OF OPERATIONS AND COMPREHENSIVE (LOSS) / INCOME
|
31
|
|
|
CONSOLIDATED STATEMENTS OF CASH FLOWS
|
32
|
|
|
CONSOLIDATED STATEMENTS OF STOCKHOLDERS' EQUITY
|
33
|
|
|
NOTES TO CONSOLIDATED FINANCIAL STATEMENTS
|
34
|
|
|
ITEM 9.
|
CHANGES IN AND DISAGREEMENTS WITH ACCOUNTANTS ON ACCOUNTING AND FINANCIAL DISCLOSURE
|
47
|
|
ITEM 9A(T).
|
CONTROLS AND PROCEDURES
|
47
|
|
ITEM 9B.
|
OTHER INFORMATION
|
48
|
|
PART III.
|
||
|
ITEM 10.
|
DIRECTORS, EXECUTIVE OFFICERS AND CORPORATE GOVERNANCE
|
49
|
|
ITEM 11.
|
EXECUTIVE COMPENSATION
|
49
|
|
ITEM 12.
|
SECURITY OWNERSHIP OF CERTAIN BENEFICIAL OWNERS AND MANAGEMENT AND RELATED STOCKHOLDER MATTERS
|
49
|
|
ITEM 13.
|
CERTAIN RELATIONSHIPS AND RELATED TRANSACTIONS, AND DIRECTOR INDEPENDENCE
|
49
|
|
ITEM 14.
|
PRINCIPAL ACCOUNTANT FEES AND SERVICES
|
49
|
|
PART IV.
|
||
|
ITEM 15.
|
EXHIBITS AND FINANCIAL STATEMENT SCHEDULES
|
50
|
|
SIGNATURES
|
52
|
PART I
CAUTIONARY STATEMENT
In addition to the historical information contained herein, the discussion and analysis in this report contains forward-looking statements. When used in this discussion, the words “believes,” “anticipates,” “may,” “will,” “should,” “expects,” “plans,” “estimates,” “predicts,” “potential,” “continue,” “intends” or the negative of these and similar expressions are intended to identify forward-looking statements, but the absence of these words does not necessarily mean that a statement is not forward-looking. Forward-looking statements include, but are not limited to, statements about our plans, objectives, expectations and intentions and are subject to risks and uncertainties that could cause actual results to differ materially from those expected or implied by these forward-looking statements. Readers are cautioned not to place undue reliance on these forward-looking statements, which speak only as of the date of this report. Our actual results could differ materially from those anticipated in these forward-looking statements for many reasons, including the factors described under “Risk Factors” and elsewhere in this report. Onvia undertakes no obligation to publicly release any revisions to these forward-looking statements that may be made to reflect events or circumstances after the date hereof or to reflect the occurrence of anticipated events. Readers are urged, however, to review the factors and risks described in reports Onvia files from time to time with the Securities and Exchange Commission.
In this report, we rely on and refer to information and statistics regarding the markets for various products. We obtained this information from third-party sources, discussions with our customers and our own estimates. We believe that these third-party sources are reliable, but we have not independently verified them and there can be no assurance that they are accurate.
|
ITEM 1.
|
BUSINESS
|
In this report, the words “we,” “our,” “us,” “Onvia,” or the “Company” refer to Onvia, Inc. and its wholly owned subsidiary.
Company Overview
We are a leading provider of gBusiness information products and research tools that help companies plan, market and sell to targeted markets throughout the United States, or U.S. The gBusiness market is defined as the market funded by federal, state and local government spending. Our products and research tools focus on federal, state, local and educational purchasing entities, and on early stage commercial and residential infrastructure projects. Our information helps clients proactively track what government agencies plan to purchase, what they actually purchase, and who they purchase from. This allows our clients to identify new market opportunities, analyze market trends, and obtain useful information about their competitors. Historically, comprehensive market intelligence was only available to large companies with the resources to perform the research and store the data themselves, or companies that could afford to hire outside firms to perform the research for them. Our processes, which collect and organize transactional information into actionable market intelligence, have enabled us to make the same high-value sales intelligence affordable to businesses of all sizes. We believe our business solutions provide our clients with a distinct competitive advantage.
Our information products and research tools leverage our database, which has been compiled over the last ten years, and includes comprehensive, historical and real-time information on public and private infrastructure activities unavailable elsewhere in the marketplace. Our database provides information on approximately 5 million procurement related records connected to over 275,000 companies from across approximately 89,000 government agencies and purchasing offices nationwide. Thousands of records are added, formatted and classified within our database each day.
Transparency and open government initiatives continue to be a key topic for federal, state and local officials. In response to this market demand, we launched Recovery.org to provide visibility into how federal funds distributed under the American Recovery and Reinvestment Act (“the Recovery Act”) are flowing into local communities. By the end of December 2009, Recovery.org was tracking more than 57,000 projects and an aggregate of $181 billion in government stimulus spending. Recovery.org also attracted the attention of major business media during the year, including National Public Radio, CNN, BusinessWeek, Bloomberg and USA Today. Our Recovery.org website and the recognition of major business media outlets have enhanced our position as an authoritative source for government spending analytics.
1
Most of our revenues are currently generated from three main business channels: subscriptions, content licenses, and management reports. Subscription-based services are typically prepaid, have a minimum term of one year and revenues are recognized ratably over the term of the subscription. Subscriptions are priced based upon the geographic range, nature of content purchased and, with respect to certain products, the number of users or number of records purchased.
Revenue from content licenses is generated from clients who resell our business content data to their customers. Content license contracts are generally multi-year arrangements that are invoiced on a monthly or quarterly basis, and these agreements typically have a higher annual contract value, or ACV, than our subscription-based services. ACV represents the aggregate annual contract value of our client base. Revenue from content license agreements is recognized ratably over the term of the agreement.
Revenue from the sale of management information reports is recognized upon delivery of the report to the client, or, if report refreshes are included, ratably over the service period. Pricing for management information reports is generally based on one, or a combination of, the following: the number of records included in the report; the geographic range of the report; or a flat fee based on the type of report. We also generate revenue from document download services and list rental services, and these fees are recognized upon delivery of the document or list.
Onvia was incorporated in January 2000 in the state of Delaware. Our principal corporate office is located in Seattle, Washington. On April 30, 2009, we transferred our securities from The NASDAQ Global Market to The NASDAQ Capital Market. Our securities continue to trade under the symbol ONVI.
Industry Background
Since early 2009, government spending on goods and services has accelerated dramatically and now represents over 40% of the GDP of the United States. Government spending on goods and services, or gBusiness, is one area of the economy that continues to see growth, and we believe this growth will continue for the foreseeable future. Government is increasingly involved in business through spending, legislation, regulation, and public-private partnerships. The gBusiness marketplace exceeds $5 trillion in government expenditures annually, and continues to grow as the federal government becomes more involved in industries like energy, manufacturing, financial services and healthcare, among others. Traditional government-sponsored job creation methods rely on investment in infrastructure to stem the unemployment rate, and state budget shortfalls will require tax increases in the coming years, resulting in even more government spending. Progressive enterprises are recognizing the substantial opportunity and the significant challenges presented by this market and are developing their own gBusiness strategies to take advantage of this new revenue opportunity. Businesses are finding that they are competitively disadvantaged if they are not actively pursuing a gBusiness strategy.
Over 3.4 million businesses compete for opportunities within this highly competitive gBusiness marketplace and identifying qualified business partners and prospects is essential to a company’s success. Identifying relevant projects and partners can be difficult and companies spend a substantial amount of time and effort to locate and research new partners and opportunities to grow their gBusiness segments. The Internet provides short-term visibility into government and private sector contracting information for both government agencies and businesses alike, but does not provide the on-demand intelligence required to guide strategic decisions.
Often, revenue opportunities are included within the specification documents behind the request for proposal, or RFP, and request for quote, or RFQ, documents. Without tools to quickly identify the pertinent information, businesses must read the entire RFP or RFQ to determine if it offers opportunities relevant to their business. Even after a new business opportunity is identified, many companies do not have enough information about the project to prequalify the opportunity, such as decision maker information, the purchasing history of the government agency or project owner, and who competes for similar projects. This information is useful not only for companies contracting directly with the project owner, but also for subcontractors that would like to compete for work on awarded contracts. This information is rarely available from one source, and may not be available at all for historical projects.
Our comprehensive database contains much of this relevant decision making information on both a historical and real-time basis and thousands of records are added to our database each day. Much of the information in our database is linked, so clients can quickly research information relevant to a particular project in one centralized location. Clients can also perform customized searches on both the public record and within the project specification documents to identify relevant opportunities using any number of variables, such as publication date, geographic location and contract value, among others. Using our database and tools, our clients spend less time on research and more time preparing winning proposals, establishing relationships, and executing contracts.
2
Products and Services
Our products and services provide access to our proprietary Onvia Online Database of project specific information and provide clients specialized tools for analyzing information relevant to their businesses. We expect to continue to expand our content and develop new database analysis tools to meet the needs of existing clients as well as potential new categories of clients.
We leverage technology, tools and business processes to research, classify and publish actionable public and private sector opportunities from public and private sources. Through an automated process, we link related records within our database, prequalify business opportunities for clients based upon the client’s profile, and provide access to information in a timely manner, generally within 24 hours of public release. Our database contains information on the largest industry verticals, with a focus on the infrastructure verticals, which include:
|
·
|
Architecture and Engineering
|
|
·
|
Construction and Building Supplies
|
|
·
|
IT / Telecommunications
|
|
·
|
Professional Services
|
|
·
|
Operations and Maintenance Services
|
|
·
|
Transportation
|
|
·
|
Healthcare
|
|
·
|
Water and Energy / Alternative Energy
|
Within these verticals we provide hard-to-find content, presented with a comprehensive view of a project throughout the most critical phases of the procurement lifecycle. These transactional records include:
|
·
|
Advance Notices – alerts businesses of projects in the early stages of the development process, before the bid or RFP is released in its final form, or before final zoning and planning board approval;
|
|
·
|
RFPs, RFQs, and related amendments;
|
|
·
|
Planholders and Bidders Lists – provides competitive intelligence by presenting a list of competitors that have acquired plans, specifications, bidding documents and/or proposals for specific projects in the active bid or proposal stage, and a list of competitors who submit bids for prime contracts with the owner of the project;
|
|
·
|
Bid Results and Awards Information – notifies businesses of awarded bids, providing information for use in their own sales and marketing activities; and
|
|
·
|
Grants – supplies federal grant information critical to businesses tracking or applying for publicly-funded projects.
|
Our business solutions are comprised of the following products:
Onvia Online Database
Onvia Online Database is our flagship gBusiness product and is intended to enable businesses of all sizes to effectively compete in the government procurement marketplace. This product provides rich search functionality on our proprietary database of local, state and federal government agency purchasing information. Users of the database can research project histories, agency purchasing trends, agency buyer contact information, agency relationships with existing vendors, contract awardees, and evaluate pricing for goods and services. Subscribers to Onvia Online Database also receive customized daily email notifications about relevant business opportunities based upon their subscription profile. Onvia Online Database provides information necessary to qualify opportunities, improve decision making, prepare tailored bids, and manage agency relationships, all of which should improve the success rates of our clients in obtaining new procurement awards.
In February 2008, we expanded our business solutions to include information on the commercial and residential development market. Initially, we separately marketed this offering as Onvia Planning and Construction to provide early stage project information on commercial and residential development projects. After the launch of our new technology platform in late 2009, the integration of this information with our Onvia Online Database was simplified and, as a result, we now include this information as part of the Onvia Online Database offering. We believe inclusion of this information in our flagship product will improve client satisfaction and should improve retention rates. This market intelligence information is comprehensive, covering the most populous 85 metropolitan areas within the United States. Our database of over 160,000 commercial and residential records provides a detailed overview of the commercial and residential marketplace. This market intelligence can be leveraged to identify business expansion opportunities and growth markets, evaluate overall market conditions, forecast demand for specific products and services, and align personnel and resources with future opportunities. At the tactical level, this information helps companies identify upcoming projects and sales opportunities by monitoring land use planning and zoning information. New and updated land use activities can be tracked with daily customized alerts delivered directly to our clients’ inbox. Clients can research projects and the companies associated with each project, and track permit approval and project status as the engagement progresses. The company and project information can be used to build relationships with corporate decision makers and planning officials to be in a good position to act upon future opportunities.
3
The Onvia Guide
Onvia Guide subscribers receive the same customized daily email notifications about relevant business opportunities that subscribers to the Onvia Online Database product receive, without the user interface to research information in our database. This product is an affordable entry level option for our clients.
Management Reports
In addition to subscription services, we also offer a number of custom management information reports. These reports are generally one-time deliverables and revenue is recognized upon delivery, or, if report refreshes are included, ratably over the service period.
|
·
|
Term Contracts – Provide clients actionable sales information on term or continuing service contracts pending renewal at public agencies. These reports identify what contracts exist, when they are coming up for renewal, who the incumbent is and who the buyers are. With this report, our clients are able to perform an early evaluation of the opportunity so they can be more competitive with their proposals to increase their public sector business.
|
|
·
|
Contact Lists – Provide clients a comprehensive list of decision makers, agency procurement officers and zoning officials that can be used to develop relationships and identify potential business partners.
|
|
·
|
Market Opportunity Reports – Provide clients market intelligence needed for strategic planning and marketing, such as:
|
|
o
|
Year-over-year growth rates by market or category to help understand buying trends;
|
|
o
|
Market growth rates to assist in business planning;
|
|
o
|
Distribution of state and local opportunities by sales territory to help allocate resources;
|
|
o
|
Competitive analysis; and
|
|
o
|
Seasonality and buying trends.
|
|
·
|
Winning Proposals Library – Compare and contrast winning proposals submitted by competing firms in order to gain competitive insights. Provides insight into how other companies position their qualifications and personnel, structure and format persuasive proposals, incorporate supporting materials, price goods and services, and differentiate themselves from their competitors.
|
Strategy
Our mission is to be the competitive advantage that powers sales and marketing results through actionable information and insight. Key elements of our strategy include:
|
·
|
Expand the valuable content included in the database: Historically, we have collected hard to find information types to increase the value of content to clients such as planholders lists, bidder lists, and agency decision maker lists. In 2008 we introduced private sector commercial and residential development information dating back to January 2007. By expanding the coverage of current and historical information, we believe our content will be applicable to broader market segments, and should improve retention of our existing client base.
|
|
·
|
Enhance our existing information products and research tools: Over the last several years, we have introduced new tools to enhance the access to information contained in our database and tools to improve the relevance of the information returned from searches against our database. Since 2005, we have offered Onvia Online Database; we continue to develop new core technologies, including a comprehensive new user interface which combines access to public and private sector data. In 2010, we plan to enhance our product offering through the introduction of new tools and content that further improves our clients’ ability to tailor the information to the needs of their business, and simplify the process of doing business in the gBusiness marketplace. We expect that this will increase the satisfaction of our existing clients, thereby increasing retention rates, and broaden the appeal of our products to potential new categories of clients.
|
|
·
|
Understand client needs: We are committed to intimately understanding the needs of our clients and the gBusiness marketplace. We will continually solicit feedback from our clients to understand their needs, specifically as they relate to new information requirements in the ever-changing gBusiness marketplace and the current economic landscape. We will leverage this feedback to guide the development of innovative new tools and content.
|
|
·
|
Target prospects with high lifetime value: We intend to focus our marketing efforts toward reaching the prospects that fit a high value profile which ultimately leads to higher lifetime value. Our history also shows that organizations with certain firmographic characteristics tend to subscribe to the most valuable products and services, and have higher client satisfaction. If we are effective in targeting these companies, we expect that retention rates and the long-term profitability of our clients will improve.
|
4
Clients
We service our clients through two separate business channels: client subscriptions and content licenses. Client subscriptions are sold directly to the end user of the business intelligence. At December 31, 2009, we had approximately 8,100 subscribing clients. Client subscriptions contributed approximately 86% of our revenue in 2009 and 2008 and 85% in 2007. The annual contract value of client subscribers was approximately $24.1 million, $19.8 million and $17.6 million at December 31, 2009, 2008 and 2007, respectively.
Our second business channel, content licenses, represents clients who resell our business intelligence to their customers. These clients represented approximately 10%, 11% and 12% of our revenue in 2009, 2008 and 2007, respectively. The annual contract value of our content license clients was approximately $1.9 million, $2.2 million and $2.4 million at December 31, 2009, 2008 and 2007, respectively.
We also generate revenue from fees charged for one-time management reports, document download services, and list rental services; these fees represented 4% of revenue in 2009 and 3% of revenue in both 2008 and 2007.
Sales Strategy
The primary objectives of our sales strategy for 2010 are to increase annual contract value, client retention and new client acquisition. To achieve these objectives we intend to:
|
|
·
|
Introduce new products that supplement our existing offering and appeal to potential new prospects;
|
|
|
·
|
Implement a higher touch contact strategy, particularly for our first year clients, to understand each client’s specific needs and to ensure that they are properly trained on how to best leverage our services to meet those needs;
|
|
|
·
|
Increase the specialization of account management resources (by vertical and segment) and reduce the number of accounts each representative manages to deliver greater client service and increase client satisfaction; and
|
|
|
·
|
Implement a new lead qualifying and routing process to identify ideal prospects and route them to the acquisition resources with the most knowledge of each prospect’s industry and demography.
|
Our 2010 sales strategy also has strong emphasis on performance management processes around forecasting, managing activities, and prioritizing activity around at risk clients.
Marketing Strategy
We deploy an integrated approach to marketing by incorporating email direct marketing, collateral, online search engine marketing, event marketing, public relations, and by supporting sales tools.
Client retention and upgrade marketing are an integral part of our marketing strategy. Marketing programs are intended to keep our name and solutions in front of our clients and prospective clients in a relevant and meaningful way, through newsletters, new product updates, gBusiness best practices, webinars, blogs, and personalized renewal reminders, among others.
5
In 2009, we focused our marketing efforts on generating high quality sales leads at the lowest cost, while providing the sales tools to support high-value sales. We accomplished this by leveraging publicity generated around the Recovery Act and through the development of the website www.Recovery.org. We refined our online marketing programs and website to drive more qualified leads from people using search engines to identify revenue opportunities.
In 2010, lead generation efforts will focus on increasing efficiency through driving more highly qualified, targeted companies as leads. We will continue to supplement this effort with more sophisticated client relationship management, relationship marketing communications, analytics, tracking and reporting as we did in 2009. The 2010 marketing strategy will center on the growth in the gBusiness market as more companies seek revenue from government agencies, and as companies that do not have a government business strategy will find themselves at a distinct disadvantage against their competitors in the market.
Agency Relationships
Agency partners bring value through source contributed content and by providing referrals of their business suppliers. As of December 31, 2009, we had approximately 400 active partner agencies in key metropolitan areas nationwide. We continue to sign a variety of government agencies including cities, counties, housing authorities, transportation authorities and school districts.
Technology
We support our operations and business solutions using an advanced technology platform designed to serve a large and rapidly increasing volume of web traffic in a reliable and efficient manner without critical failures. Our systems are designed to:
|
|
•
|
Provide fast, secure and highly available visitor access to our web site;
|
|
|
•
|
Validate and process client requests promptly and accurately;
|
|
|
•
|
Provide timely, comprehensive and accurate management-reporting capabilities;
|
|
|
•
|
Accommodate upgrades to features on our websites;
|
|
|
•
|
Scale to accommodate growth in our operations; and
|
|
|
•
|
Provide redundancy in case of component system failures.
|
Our systems use a combination of proprietary technologies and commercially available licensed technologies. The backbone of our technology infrastructure consists of database servers running Microsoft SQL Server on HP/Proliant class server hardware. The front end consists of multiple, redundant web servers that are expandable as operations grow.
Our web servers, database servers, transaction-processing servers and other core systems that conduct essential business operations are housed at a third-party offsite co-location facility. Our co-location vendor provides 24x7 monitoring and engineering support in a climate-controlled and physically secure environment and our on-call operations personnel have 24x7 access to the facility. Our data center has redundant communication lines from multiple Internet service providers and has its own emergency power and backup systems. We house most non-critical systems such as development servers, quality assurance servers, and internal application servers at our headquarters in Seattle.
In addition to maintaining responsibility for the technical architecture, security and uptime of our business solutions, our technology department works closely with the sales and marketing departments to ensure that client feedback for new features is incorporated into new products and services.
Competition
The market for comprehensive intelligence on the infrastructure marketplace is underserved. Competitors include, to a limited extent, bid aggregators, industry analysts and government e-procurement platforms.
6
Our current and potential competitors include, but are not limited to, the following:
|
|
•
|
Information companies that target specific verticals also covered by our services, such as McGraw-Hill, Contractors Register and Input; and
|
|
|
•
|
Lead generation and bid matching companies such as FedMarket.com, BidNet and GovernmentBids.com.
|
We may face additional competition in the future as well-funded companies pursue new government procurement and private sector database products and services. We must differentiate ourselves by expanding our database, developing products and services with high switching costs, and maintaining a loyal base of repeat clients. To achieve this we must continually enhance our content and sources, and provide our clients with relevant, customized views of our database to achieve these objectives.
We believe that the principal competitive factors affecting our market include, but are not limited to, breadth, depth and timeliness of content, content quality, base of existing clients, and client service. In order to excel at these principal competitive factors, we strive to achieve a superior understanding of our clients, offer greater value in content and services and sustain a more efficient operating model. We also mitigate some potential competitive pressures by selling our content to some competitors for redistribution to their clients. We believe that our current database offering compares favorably to select offerings available in the marketplace today based on the depth and history of our information, breadth of content types, and daily updates.
Seasonality
New client acquisition is subject to some modest seasonal fluctuations. The third quarter has historically been our slowest quarter for new client acquisition. The construction industry is our single largest market and historically these prospects are fulfilling contracts during the summer months and not prospecting for new work, which causes acquisition of new clients to be slower in these months. For this reason, it may not be possible to compare the performance of our business by consecutive quarters, and our quarterly results should be considered on the basis of results for the whole year or by comparing results in a quarter with the results in the same quarter for the previous year.
Intellectual Property Rights
Our future success depends in part on intellectual property rights, proprietary rights, and technology. We rely on a combination of copyright, trademark and trade secret laws, employee and third-party nondisclosure agreements and other methods to protect our proprietary rights. We seek to protect our internally developed products, documentation, and other written materials under trade secret and copyright laws, which afford only limited protection. We cannot ensure that any of our proprietary rights will be viable or of value in the future since the validity, enforceability and type of protection of proprietary rights in Internet-related industries is uncertain and still evolving.
We license and will continue to license certain products integral to services from third parties, including products that are integrated with internally developed products and used jointly to provide key content and services. These third-party product licenses may not continue to be available on commercially reasonable terms and we may not be able to successfully integrate such third-party products into our solutions.
We presently have no issued U.S. patents. It is possible that we may not develop future proprietary products or technologies that are patentable and that the patents of others will seriously harm our ability to do business.
We own the following registered trademarks in the U.S. Patent and Trademark Office: ONVIA, ONVIA and Design (current logo with orange circular design), ONVIA DOMINION, DEMANDSTAR, DEMANDSTAR.COM, QUOTEWIRE, BIDWIRE, and E-JOURNAL OF COMMERCE. We also own the following registered trademarks in Canada: ONVIA, ONVIA.COM, and ONVIA.COM and Design.
Employees
As of March 1, 2010, we had 174 employees working in the following departments: 98 in sales and marketing, 39 in research, which are included in cost of sales, 20 in technology and development and 17 in general and administrative.
None of our employees are represented by a union or collective bargaining agreement. We have never had a work stoppage and consider relations with our employees to be good.
7
Geographic Financial Information
During the years ended December 31, 2009, 2008 and 2007, all of our revenues were generated from clients located in the United States. All of our long lived assets are located in the United States.
Available Information
We file with and furnish to the Securities and Exchange Commission, or SEC, periodic reports, including annual reports on Form 10-K, quarterly reports on Form 10-Q, current reports on Form 8-K, proxy and information statements, and other information, along with amendments to such reports. Our SEC filings are posted on the SEC’s Web site at http://www.sec.gov, which contains reports, proxy and information statements and other information regarding issuers that file electronically with the SEC. Materials that we file with the SEC are also available at the SEC’s Public Reference Room at 100 F Street, NE, Room 1580, Washington, DC 20549. Information regarding the operation of the Public Reference Room may be obtained by calling the SEC at 1-800-SEC-0330. Our annual report on Form 10-K, all other reports and amendments filed with or furnished to the SEC, and our Code of Business Ethics and Conduct are available on the “About Onvia” section of our website at www.onvia.com as soon as reasonably practicable after we have filed them with, or furnish them to, the SEC.
|
ITEM 1A.
|
RISK FACTORS
|
In addition to other information in this Report, the following risk factors should be carefully considered in evaluating our business because such factors may have a significant impact on our business, results of operations and financial condition and could cause our stock price to decline. As a result of the risk factors set forth below and elsewhere in this Report, and the risks discussed in our other Securities and Exchange Commission filings, actual results could differ materially from historical results or those projected in any forward-looking statements.
Risks related to our growth strategy
Increased sales to clients who are new to the public sector may impact our first year retention rates.
The collapse of the commercial development sector and the increase in government spending under the Recovery Act, have increased interest in public sector projects. Companies who have never participated in the public sector are investing in resources, such as Onvia’s services, to help them compete in this marketplace. If or when the private sector recovers, or if companies new to the public sector do not have success in this marketplace, companies new to the public sector may not continue their investment in Onvia’s services and our retention rates may suffer.
Weakness in the U.S. economy, and in the commercial-residential housing market specifically, could drive reduced spending by our clients and prospective clients on business intelligence services.
The majority of our clients are small to medium sized businesses operating within the infrastructure verticals, which include industries that are negatively impacted by a slowdown in the commercial and residential development market, such as building & construction and architecture & engineering. Broad economic downturns typically have a greater impact on small and medium sized businesses than on larger entities. The economic downturn in these industries could cause our clients and prospective clients to reduce their spending on market intelligence, which would slow our revenue growth.
Continued weakness in the U.S. economy may negatively impact our client retention rates.
The current economic slowdown is far-reaching and is having severe adverse impacts on businesses of all sizes. Many smaller, less capitalized businesses have already failed. If the downturn persists, it is possible that this will extend to larger, better capitalized businesses as well. If a significant number of our existing clients were to fail, or to cut back on operating expenses by eliminating services perceived as non-essential, our client retention rates would be adversely impacted, which would slow our revenue growth.
We may not be able to meet projected renewal rates.
Our ability to continually enhance our products and services to provide relevant information to our clients, appropriately classify and distribute information, provide excellent client service, maintain competitive pricing and meet our clients’ expectations for source coverage and new content will significantly impact their satisfaction with our products and services and will impact their decision to renew. If we are unable to meet our clients’ expectations, renewal rates and projected growth and profitability will suffer.
8
We may be required to increase sales and marketing expenses in order to achieve revenue goals.
If existing or planned marketing initiatives do not drive sufficient sales leads, we may be required to increase spending on new and untested marketing initiatives to deliver adequate leads to our sales team in order to achieve revenue goals, and our operating results may suffer.
Achieving our sales goals also depends in part on increasing the number of new clients generated by our acquisition sales team. We plan to increase new client acquisition by improving the productivity of each of our sales representatives through performance management and by delivering more highly qualified leads through our marketing efforts. We have hired new sales leadership and have invested in new sales tools to increase productivity; however, if we do not achieve the desired productivity increases, we may be required to increase headcount to a greater extent than planned, which would increase operating expenses and may adversely impact operating results.
We may not be able to increase subscribership to high value products.
We expect that a significant portion of future growth will come from increasing annual contract value per client, and we expect this to be driven by increased adoption of our high value products. Subscribers to our high value products have higher annual contract value, higher renewal rates and provide greater lifetime value to us. Failure to increase subscribership to these products would limit our future growth and adversely affect our results of operations.
We may fail to attract, hire and retain sales associates who can effectively communicate the benefits of our products to our clients and prospects, and they may be unable to achieve expected sales targets.
In order to achieve projected revenue growth rates, our sales teams must be able to effectively communicate the benefits of our products to existing and potential clients. We expect to see increases in client retention rates and in new client acquisition revenue and our sales goals are aggressive. If we are unable to retain current sales associates and attract and hire new sales associates with the appropriate skills, we may not be able to achieve projected sales targets and revenue growth rates.
If we cannot effectively satisfy clients across all targeted industry verticals, we may decide to target fewer industries, and as a result, may lose clients.
If we find that retention and acquisition rates in any of our focused verticals are not meeting expectations due to lack of bid-flow or for other reasons, we may choose to specialize in fewer industry verticals to improve client satisfaction and retention in the remaining verticals. As a result, we may lose clients in the non-core verticals. A more targeted focus on these core verticals may not generate the expected level of increased retention and acquisition.
Our competitors may develop similar technologies that are more broadly accepted in the marketplace.
The functionality in the Onvia Online Database is robust, and we expect that if adoption of this product is in line with our expectations that competitors may introduce products with similar functionality. If competitors introduce products with similar functionality or are able to more effectively market and price their products for broad customer acceptance, new client acquisition and existing client retention would be adversely impacted. If we are unable to enhance functionality or increase marketing efforts to offset challenges from competitors, we may lose market share.
Rapid advances in technology and new mediums for distributing information may diminish the value of our service offerings.
Our business model is predicated on providing low cost access and analysis of hard to find public and private sector information. Information in general is quickly becoming more accessible at a low cost as new distribution mediums, such as blogs, and new search technologies are developed. We may be unable to keep up with the rapid advances in information collection, and new technologies and mediums may be developed that commoditize the value of our services. If this were to occur, our revenues would suffer.
9
Risks related to our new product strategy
We may fail to introduce new content and products that are broadly accepted by clients, and there may be delays in the introduction of these tools and products.
We expect to introduce new content in 2010. If client acceptance and adoption of these new products is below our expectations, projected growth rates and client acquisition and retention goals may not be achieved, and financial results would be harmed. We expect to utilize internally developed technology and technology licensed from third parties for the development of new tools and content. If we are unable to develop or acquire the required technology on time, or at all, or if the launch of these new products is delayed for any other reason beyond our anticipated launch dates, projected growth rates may not be achieved.
We may be unable to control the cost of ongoing content collection or the cost of collecting new content types to support new product offerings.
We will need to identify cost effective sources and develop efficient collection processes for new content types required to support new product development plans. If we are unable to find new ways to collect content efficiently, and aggregate new content types in a cost effective manner, gross margins may decline.
We may improperly price new product offerings for broad client acceptance.
We may implement price increases with respect to some of our existing products in 2010. We have developed pricing strategies for our existing products, and will be required to develop new pricing strategies for planned new product launches. If existing clients do not perceive that the pricing of our products is commensurate with the value they receive from the products, or if our sales staff is unable to communicate the value of the products, particularly in light of the current economic climate, new client adoption and existing client retention would be adversely impacted.
We may overestimate the value of sales intelligence to companies in the infrastructure marketplace.
We believe there is a large unmet market need for robust public and private sector sales and marketing information. Our business model assumes that clients will pay an annual fee for this information and we expect increases in the annual value of these contracts in the near-term and long-term. If we have overestimated the value of this information, we will not achieve our forecasted revenue goals.
Financial, economic and market risks
We may be required to withhold common shares to cover tax withholding upon exercise of certain executive stock options and settle the obligations with the Internal Revenue Service, which would negatively impact our cash flow in the future.
On March 7, 2001, our board of directors granted an executive stock option for 302,979 shares at $2.662 per share. This option includes a feature that allows the executive, at his election, to surrender shares subject to the option to satisfy any tax withholding obligations resulting from the exercise of his options. This option expires on March 6, 2011. If the executive exercises this right, a cash outlay by our company would be required to settle the executive's tax withholding obligation and our cash flow would be negatively impacted. The timing and amount of this potential cash outlay for taxes cannot be reasonably estimated until the transaction date, if and when it occurs.
We may not be able to generate positive cash flows from operations.
We have not yet demonstrated that we are able to generate positive cash flow from operations on a consistent year over year and quarter over quarter basis, and our business is subject to some seasonal fluctuations. Due to these seasonal fluctuations and limited performance history on client adoption of new products, we may not be able to achieve positive cash flow from operations in the near-term.
Our quarterly financial results are subject to fluctuations that may make it difficult to forecast future performance.
We have experienced some seasonal fluctuations in our business, reflecting a combination of seasonal trends for the services and products we offer, as well as seasonal trends in the buying habits of target business clients and government agencies. Operating results may continue to vary significantly from quarter to quarter, making it difficult to formulate meaningful comparisons of results between quarters. Our limited operating history and evolving business model further contribute to the difficulty of making meaningful quarterly comparisons. A significant portion of our subscription revenue for a particular quarter is derived from transactions that are initiated in previous quarters, because revenue is recognized ratably over the subscription term.
10
Our current and future levels of operating expenses and capital expenditures are based largely on our growth plans and estimates of future revenue. These expenditure levels are, to a large extent, fixed in the short term. We may not be able to adjust spending in a timely manner to compensate for any unexpected revenue shortfall, and any significant shortfall in revenue relative to planned expenditures could harm our business and results of operations.
We implemented anti-takeover provisions that may discourage takeover attempts and depress the market price of our stock.
Provisions of our certificate of incorporation and bylaws, as well as provisions of Delaware law, the state of our incorporation, can have the effect of making it difficult for a third-party to acquire us, even if doing so would be beneficial to our stockholders. These provisions include:
|
|
•
|
the classification of our Board of Directors into three classes so that the directors serve staggered three-year terms, which may make it difficult for a potential acquirer to gain control of our Board;
|
|
|
•
|
authorizing the issuance of shares of undesignated preferred stock without a vote of stockholders; and
|
|
|
•
|
non-cumulative voting for the election of directors.
|
In addition, in 2002, our Board of Directors adopted a Stockholders’ Rights Agreement, designed to protect stockholder interests in the event of an unsolicited takeover attempt by distributing one preferred stock purchase right for each outstanding share of common stock. The Stockholders’ Rights Agreement may make it more difficult for a third-party to acquire us.
Operational risks
We may not effectively implement new technologies and new product functionality could fail to perform as designed.
We periodically release products that employ new search technologies and complex database architecture in new and innovative ways. These technologies are usually built in house, or purchased from third party vendors and reengineered to meet our operational needs. If the creative application of these technologies does not work as planned or if we implement these new technologies poorly or in incompatible ways, our new products and services may not function properly, delivery of our products could be disrupted or delayed and our client retention and new client acquisition may suffer.
System failures could cause an interruption in the services of our network and impact our ability to compile information and deliver our products to clients.
Any system failure that causes an interruption in the service of our suite of products, disrupts our ability to aggregate, organize and publish new content, or reduces timely access to and delivery of our content could result in client dissatisfaction, which would impact client acquisition and retention rates. Further, prolonged or ongoing performance problems on our web sites or our application servers, which support bid creation and distribution, could damage our reputation and result in the permanent loss of clients. In the past, system interruptions have made our web sites and application servers totally unavailable, slowed their response time or prevented us from making service available to clients. These problems may occur again in the future.
We may not have sufficient business interruption insurance to cover losses from major interruptions. We deployed our primary business application servers to a secure offsite facility with backup utility power and redundant Internet connectivity in 2008. Our current disaster recovery systems are designed to ensure that a portion of our Information Technology and Research department functions will be operational in the event of a local building disaster so that delivery of our products will not be significantly interrupted. Our disaster recovery plan is not yet finalized to include automated failover of product distribution-related systems, requiring some manual intervention to complete the failover process which could result in prolonged service interruptions and ultimately lower client satisfaction.
11
Our current technology infrastructure and network software systems may be unable to accommodate our anticipated growth, and we may require a significant investment in these systems to accommodate performance and storage requirements of new and planned products.
Expansion of the historical content contained in our Onvia Online Database and future product offerings have and will place significant additional demands on the network and on our database. We add thousands of records to our database each day, which has required us to expand the storage capacity of the database. If new content types or product introductions change current network and database requirements or if growth in client base exceeds our expectations, we may be required to make significant investments to upgrade our systems to accommodate such changes, which could negatively impact our cash flows and results of operations. We may not be successful in our efforts to upgrade our systems, or if we do successfully upgrade our systems, we may not do so on time and within budget. Failure to achieve a stable technological platform in time to handle increasing network traffic may discourage potential clients from using our network.
We may not be able to retain the services of our executive officers, directors, senior managers and other key employees, which would harm our business.
Our business and operations are substantially dependent on the performance of senior management, directors and key employees. The loss and inability to replace any of these employees or directors would likely harm our business.
Political, social or environmental conditions in off-shore locations may impact the collection and delivery of our content and/or development of new products.
Portions of our content are aggregated and/or formatted by off-shore vendors. Delivery of that content may be impacted by local political, social or environmental conditions, which may result in delayed delivery to clients resulting in client dissatisfaction.
We also outsource portions of the development of new products to off-shore vendors. Political, social or environmental conditions in those locations may result in delays of new product introductions.
We may be unable to effectively monitor and prevent unauthorized redistribution of our published information.
In the past we have identified a number of entities that have redistributed proprietary information without authorization and against our terms of use. We have been and will continue to be aggressive about monitoring and combating such unauthorized use, and are considering technological avenues for blocking such users from our database. However, if we fail to effectively combat such unauthorized use, our business could be harmed.
Our services and products depend upon the continued availability of licensed technology from third parties, and we may not be able to obtain those licenses on commercially reasonable terms, or at all.
We license, and will continue to license, technology integral to our services and products from third parties. If we are unable to acquire or retain key third-party product licenses or integrate the related third-party products into our network services, our service and product development may be delayed. We also expect to acquire new licenses in the future as our business grows and technology evolves. We may not be able to obtain these licenses on commercially reasonable terms, or at all.
Increased blocking of our emails could negatively impact client satisfaction with our products and could inhibit the effectiveness of our marketing efforts.
Portions of our content are currently delivered in the form of an attached file via email. Some network administrators could flag and block emails from us due to increased filtering of email attachments as a result of the threat of email borne viruses or unwanted “spam” or for other reasons. We also conduct marketing campaigns to our customer base and occasionally these campaigns are done via email. Excessive filtering of our emails could negatively impact client satisfaction and could inhibit our marketing efforts.
Regulatory, judicial or legislative risks
Any settlement or claim awarded against us in our ongoing litigation matters could negatively impact operating results.
We are defending against the litigation matters as detailed in the legal proceedings section in Item 3 of Part I of this Report. We have directors and officers insurance of $30 million that would cover defense costs and any award or settlement, less a deductible of $250,000, in the securities class action suit. While we believe we have a strong defense in this case, we cannot be certain that the outcome of the case will be favorable to us. A settlement or award in this or other potential suits could negatively impact our operating results. It is also possible that defense of this and future claims may result in a significant diversion of management attention.
12
Future regulations could be enacted that either directly restrict our business or indirectly impact our business by limiting the growth of e-commerce.
We are subject to laws and regulations governing the Internet and e-commerce. These laws and regulations may cover privacy, content, taxation, data protection, copyrights, electronic contracts and other communications, consumer protection, unencumbered Internet access to our services, the design and operations of websites, and the characteristics and quality of products and services. If enacted, unfavorable laws and regulations could limit the market for our services and offerings. Although many regulations might not apply to the business directly, we expect that laws regulating the collection or processing of personal or consumer information could indirectly affect our business. It is possible that legislation could expose companies involved in e-commerce to restrictions or liability, which could limit the growth of e-commerce generally. Legislation could hinder the growth in Internet use and decrease our acceptance as a medium for communication and commerce. If laws were enacted that made our products taxable at the state level, we may be required to pass those additional taxes along to our customers, which would increase the overall cost of our product to our end users and could impact the buying decisions of existing and potential new clients.
Our access to new content from governmental entities and other third parties may be restricted if bid aggregation on the Internet is restricted by law or regulations.
We aggregate new information from various public data sources and do not have exclusive access to this content. We cannot ensure that these data sources will continue to be available in the future. Moreover, public disclosure laws, which require governmental entities to produce bid information directly to members of the public, may negatively impact our business and reduce the value of our services to clients. The loss or the unavailability of data sources in the future, or the loss of right to distribute some of the data sources, would harm our business.
Our proprietary bid aggregation technology is integral to our success. If the process of bid aggregation becomes regulated in the future and our process for acquiring government bids is no longer cost-effective, our business will be significantly harmed. If new regulations restricting our ability to charge a fee for public bid information are enacted, our business will be significantly harmed.
Utilization of our net operating loss, or NOL, carryforwards may be subject to annual limitations provided by the Internal Revenue Service code.
We have substantial net operating loss carryforwards that could be used to offset future tax liabilities once we begin to generate taxable income. Utilization of these NOLs may be subject to a substantial limitation due to ownership change limitations provided by Section 382 of the Internal Revenue Code of 1986, which may limit the amount of NOL carryforwards that can be utilized annually to offset future taxable income and tax, respectively. Limitations on the utilization of these NOLs could adversely impact future operating results and cash flows.
|
ITEM 1B.
|
UNRESOLVED STAFF COMMENTS
|
None.
|
ITEM 2.
|
PROPERTIES
|
Our headquarters are located in Seattle, Washington. In January, 2008, we relocated our corporate headquarters and we now lease approximately 35,000 square feet in two floors of a sixteen-story office complex located at 509 Olive Way, Seattle, Washington. Prior to this, we leased 29,785 square feet in two floors of a four-story office complex in our former corporate headquarters building. We believe the new space is adequate to meet current and near term capacity requirements. The lease on our current office space expires in October 2015.
13
|
ITEM 3.
|
LEGAL PROCEEDINGS
|
For a discussion regarding our legal proceedings, please refer to the “Legal Proceedings” section of Note 11, “Commitments and Contingencies”, in the Notes to Consolidated Financial Statements in this Report, which is incorporated herein by reference.
EXECUTIVE OFFICERS OF THE REGISTRANT
The executive officers of the Company are as follows:
|
Name
|
Age
|
Position
|
|
Irvine N. Alpert
|
58
|
Executive Vice President
|
|
Michael S. Balsam
|
41
|
Chief Strategy Officer
|
|
Eric T. Gillespie
|
41
|
Senior Vice President
|
|
Michael D. Pickett
|
62
|
Chief Executive Officer, President and Chairman of the Board
|
|
Michael J. Tannourji
|
42
|
Former Senior Vice President, Sales and Marketing
|
|
Cameron S. Way
|
38
|
Chief Financial Officer
|
Irvine N. Alpert has served as Executive Vice President of the Company since July 2001. From February 1995 to July 2001, Mr. Alpert was the founder and Chief Executive Officer of ProjectGuides, Inc., an architecture, engineering, and construction market information service, which was acquired by Onvia in June 2001. From 1993 to 1995, Mr. Alpert served as President of RCI Environmental, Inc., a regional construction company.
Michael S. Balsam has served as Chief Strategy Officer of the Company since January 2010. Prior to becoming Chief Strategy Officer, Mr. Balsam served as Chief Solutions Officer of the Company from November 2008 to December 2009, Vice President of Products and Services from January 2005 to November 2008, Director of Product Management from November 2002 to December 2004, and Product Marketing Manager from June 2001 to November 2002.
Eric T. Gillespie has served as Senior Vice President of the Company since July 2008. Prior to becoming Senior Vice President, Mr. Gillespie served as Chief Information Officer of the Company from May 2007 to June 2008. From October 2004 to May 2007 Mr. Gillespie served as Executive Vice President and Chief Operating Officer of The Patent Board, a provider of best practices research tools and metrics for patent analysis and intellectual property investment. From October 1999 to October 2004, Mr. Gillespie served as Vice President, Managing Director of SBI Group, formerly Scient, a technology strategy and services firm.
Michael D. Pickett has served as director of the Company since February 1999, as Chief Executive Officer and Chief Executive Officer and Chairman of the Board of the Company from February 1999 to August 2000 and since April 2001, and as President since September 2004. Mr. Pickett also served as President and Chief Operating Officer of the Company from August 2000 to April 2001. From July 1999 to August 2000, Mr. Pickett served as Chief Executive Officer of Hardware.com, Inc., an online source for total home improvement solutions, which was acquired by the Company in September 2000. From July 1997 to March 1999, Mr. Pickett was Chairman and Chief Executive Office of Technology Solutions Network, LLC, a provider of turnkey technology solutions for small businesses. From October 1983 to February 1996, Mr. Pickett served in a variety of positions and most recently as Chairman, Chief Executive Officer, and President of Merisel, Inc., a wholesale distributor of computer hardware and software products and a provider of logistics services.
Michael J. Tannourji served as Senior Vice President, Sales of the Company from November 2007 to February 2010. We ended our employment relationship with Mr. Tannourji in February 2010. Mr. Tannourji’s departure was not due to any disagreements with the Company’s management or the Board. From May 2005 to September 2007, Mr. Tannourji served as Vice President National Sales & Service BIS of Experian, Inc., a global information services company. From January 2004 to December 2004, Mr. Tannourji served as Vice President/Leader Vertical Markets, and from September 1999 to December 2003, Mr. Tannourji served as Assistant Vice President Global & Major Customers, of Dun & Bradstreet, a global information services company.
14
Cameron S. Way has served as Chief Financial Officer of the Company since April 2008. Mr. Way served as Chief Accounting Officer of the Company from June 2005 to April 2008, Controller from September 2001 to June 2005, Assistant Controller from December 2000 to September 2001, and finance manager from August 1999 to December 2000. Mr. Way was an audit manager with PricewaterhouseCoopers LLP from January 1999 to August 1999 prior to joining the Company.
There are no family relationships between any directors or executive officers of the Company.
15
PART II
|
ITEM 5.
|
MARKET FOR THE REGISTRANT’S COMMON EQUITY, RELATED STOCKHOLDER MATTERS AND ISSUER PURCHASES OF EQUITY SECURITIES
|
Market Information
Our common stock currently trades on the NASDAQ Capital Market under the symbol “ONVI.” The table below lists the high and low closing prices per share of our common stock for each quarterly period during the past two fiscal years as reported on the NASDAQ Global Market and, since April 2009, on the NASDAQ Capital Market.
|
Closing Price Range
|
||||||||
|
of Common Stock
|
||||||||
|
High
|
Low
|
|||||||
|
Year ended December 31, 2008
|
||||||||
|
First Quarter
|
$ | 8.42 | $ | 6.43 | ||||
|
Second Quarter
|
6.68 | 5.03 | ||||||
|
Third Quarter
|
5.00 | 4.15 | ||||||
|
Fourth Quarter
|
4.50 | 3.14 | ||||||
|
Year ended December 31, 2009
|
||||||||
|
First Quarter
|
$ | 4.50 | $ | 2.90 | ||||
|
Second Quarter
|
5.89 | 3.31 | ||||||
|
Third Quarter
|
6.17 | 5.20 | ||||||
|
Fourth Quarter
|
8.00 | 5.50 | ||||||
Holders
As of March 1, 2010, there were approximately 465 holders of record of Onvia common stock. The number of recordholders was determined from the records of the Company’s transfer agent and does not include the number of persons whose stock is held in nominee or “street name” accounts through brokers.
Dividends
No cash dividends were declared for the years ended December 31, 2009 and 2008 nor does Onvia have the intention to pay cash dividends in the foreseeable future.
Securities Authorized for Issuance under Equity Compensation Plans
We currently maintain two active compensation plans that provide for the issuance of our common stock to officers, directors, employees, and consultants. The two active compensation plans consist of the Onvia, Inc. 2008 Equity Incentive Plan, or the 2008 Plan, and the 2000 Employee Stock Purchase Plan, or ESPP, both of which have been approved by stockholders.
We also have outstanding options under the stockholder approved 2000 Directors’ Stock Option Plan, or Directors’ Plan, which expired on February 28, 2010 and under the Amended and Restated 1999 Stock Option Plan, or the 1999 Plan, which was amended and restated in September 2008 as the 2008 Plan. Options outstanding under both the Directors’ Plan and the 1999 Plan will continue to vest and become exercisable according to the original terms of the grant. However, any options that are forfeited from the Directors’ Plan subsequent to the expiration date will not be available for reissuance. Any grants forfeited from the 1999 Plan will be returned to the 2008 Plan and will be available for future issuance.
In August 2009, 49,941 warrants with an exercise price of $9.00 that were originally issued in 1999 for subordinated debt financing expired unexercised.
16
The following table sets forth information regarding outstanding options and shares reserved for future issuance under the 2008 Plan, the 1999 Plan, the Directors’ Plan, and the ESPP as of December 31, 2009.
|
Plan category
|
Number of securities to be issued upon exercise of outstanding options and warrants
|
Weighted average exercise price of outstanding options and warrants
|
Number of securities remaining available for future issuance
|
|||||||||
|
Equity compensation plans approved by security holders
|
||||||||||||
|
Onvia, Inc. 2008 Equity Incentive Plan
|
69,350 | $ | 4.56 | 406,734 | ||||||||
|
Amended and Restated 1999 Stock Option Plan
|
1,765,007 | 7.37 | - | |||||||||
|
2000 Directors' Stock Option Plan
|
53,000 | 50.65 | - | |||||||||
|
Employee Stock Purchase Plan
|
- | N/A | 521,282 | |||||||||
|
Total
|
1,887,357 | $ | 8.48 | 928,016 | ||||||||
Recent Sales of Unregistered Securities
None.
Issuer Purchases of Equity Securities
None.
17
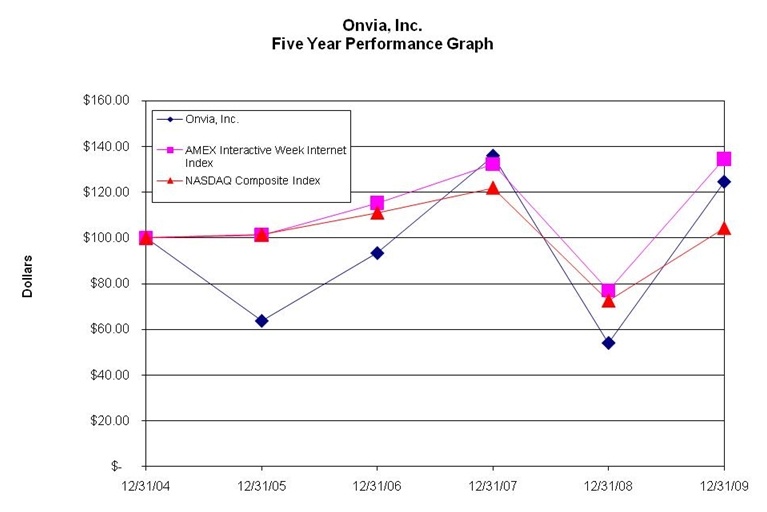
Stock Price Performance Graph
The following graph compares the cumulative total return to stockholders on Onvia’s common stock during the five years ended December 31, 2009 to the cumulative total returns on the NASDAQ Composite Index and the AMEX Interactive Week Internet Index. The comparison assumes $100 was invested on December 31, 2004 in shares of Onvia’s common stock and in each of the indices shown. The stock price performance shown on the following graph is not necessarily indicative of future performance of Onvia’s common stock.
18
ITEM 6. SELECTED CONSOLIDATED FINANCIAL DATA
The following selected consolidated financial data for the fiscal years ended December 31 should be read in conjunction with the consolidated financial statements and related notes of Onvia and its subsidiary included in this and previous Annual Reports on Form 10-K, as well as the section of this and previous Reports entitled “Management’s Discussion and Analysis of Financial Condition and Results of Operations.” Historical results are not necessarily indicative of future results.
|
Year Ended December 31,
|
||||||||||||||||||||
|
2009
|
2008
|
2007
|
2006
|
2005
|
||||||||||||||||
|
(in thousands, except per share data)
|
||||||||||||||||||||
|
Consolidated Statements of Operations Data:
|
||||||||||||||||||||
|
Revenue
|
$ | 25,637 | $ | 21,142 | $ | 20,928 | $ | 16,739 | $ | 14,714 | ||||||||||
|
Gross margin
|
20,959 | 16,816 | 17,197 | 13,344 | 11,433 | |||||||||||||||
|
Noncash stock-based compensation (1)
|
449 | 718 | 927 | 1,258 | 84 | |||||||||||||||
|
Idle lease accrual and restructuring charges (2)
|
- | - | (2,653 | ) | (67 | ) | 1,228 | |||||||||||||
|
Total operating expenses
|
21,558 | 20,623 | 17,685 | 19,840 | 19,095 | |||||||||||||||
|
Loss from operations
|
(599 | ) | (3,807 | ) | (488 | ) | (6,496 | ) | (7,662 | ) | ||||||||||
|
Net (loss) / income
|
$ | (547 | ) | $ | (3,374 | ) | $ | 494 | $ | (5,544 | ) | $ | (6,920 | ) | ||||||
|
Unrealized (loss) / gain on available-for-sale securities
|
(4 | ) | - | 6 | 17 | 8 | ||||||||||||||
|
Comprehensive (loss) / income
|
$ | (551 | ) | $ | (3,374 | ) | $ | 500 | $ | (5,527 | ) | $ | (6,912 | ) | ||||||
|
Basic net (loss) / income per common share
|
$ | (0.07 | ) | $ | (0.41 | ) | $ | 0.06 | $ | (0.70 | ) | $ | (0.89 | ) | ||||||
|
Diluted net (loss) / income per common share
|
$ | (0.07 | ) | $ | (0.41 | ) | $ | 0.06 | $ | (0.70 | ) | $ | (0.89 | ) | ||||||
|
Basic weighted average shares outstanding
|
8,266 | 8,230 | 8,087 | 7,888 | 7,814 | |||||||||||||||
|
Diluted weighted average shares outstanding
|
8,266 | 8,230 | 8,606 | 7,888 | 7,814 | |||||||||||||||
|
(1)
|
Non-cash stock-based compensation increased in 2006 as a result of the adoption of SFAS 123R on January 1, 2006.
|
|
(2)
|
The net annual reduction in idle lease charges in 2007 represents the elimination of the idle lease accrual as a result of the lease termination agreement executed by the Company in July 2007. The impact of restructuring charges is also included in Total operating expenses. Refer to the discussion under Note 10 of the “Notes to the Consolidated Financial Statements” for further information on this lease termination.
|
|
As of December 31,
|
||||||||||||||||||||
|
2009
|
2008
|
2007
|
2006
|
2005
|
||||||||||||||||
|
(in thousands)
|
||||||||||||||||||||
|
Consolidated Balance Sheet Data:
|
||||||||||||||||||||
|
Cash, cash equivalents and short-term investments
|
$ | 14,279 | $ | 13,043 | $ | 14,301 | $ | 14,435 | $ | 20,540 | ||||||||||
|
Long-term investments, net of currrent portion
|
- | - | - | 1,478 | - | |||||||||||||||
|
Total assets
|
25,094 | 22,323 | 25,741 | 23,991 | 28,635 | |||||||||||||||
|
Idle lease accrual, current and long term (1)
|
- | - | - | 3,779 | 6,538 | |||||||||||||||
|
Unearned revenue, current and long term
|
11,545 | 9,118 | 9,438 | 8,840 | 6,261 | |||||||||||||||
|
Total liabilities
|
15,324 | 12,529 | 13,477 | 14,396 | 15,001 | |||||||||||||||
|
Total stockholders' equity
|
9,770 | 9,793 | 12,264 | 9,595 | 13,634 | |||||||||||||||
|
|
|
|
(1)
|
The reduction in the idle lease accrual from 2006 to 2007 is the result of the lease termination agreement executed by the Company in July 2007. Refer to the discussion under Note 10 of the “Notes to the Consolidated Financial Statements” for further information on this lease termination.
|
19
ITEM 7. MANAGEMENT’S DISCUSSION AND ANALYSIS OF FINANCIAL CONDITION AND RESULTS OF OPERATIONS
CAUTIONARY STATEMENT
The information set forth in “Management’s Discussion and Analysis of Financial Condition and Results of Operations” below includes “forward-looking statements” within the meaning of Section 27A of the Securities Act of 1933, as amended, and Section 21E of the Exchange Act, and is subject to the safe harbor created by those Sections. Factors that could cause results to differ materially from those projected in the forward-looking statements are set forth in this section and earlier in this report under Item 1A. “Risk Factors,” beginning on page 8. The following discussion should also be read in conjunction with the Consolidated Financial Statements and accompanying Notes thereto.
Introduction
We are a leading provider of government business market information products and planning tools that focus on federal, state, local and educational purchasing entities, and on early stage commercial and residential infrastructure projects. Contributing to our 2009 success is the growth of this government business market, or gBusiness market. Government is more involved in business than ever before through spending, legislation, regulation, and public-private partnerships, and has taken on a giant role in the U.S. economy over the past year, penetrating further into the private sector than any time since the 1930s.
Our gBusiness information and research tools help clients better understand this growing marketplace by providing insight into what government agencies plan to purchase, what they actually purchase, and who they purchase from. Historically, comprehensive market intelligence was only available to large companies with the resources to perform the research and store the data themselves, or companies that could afford to hire outside firms to perform the research for them. Our unique processes, which collect and organize transactional information into actionable market intelligence, have enabled us to make the same high-value sales intelligence affordable to businesses of all sizes. We believe our business solutions provide our clients with a distinct competitive advantage.
Our information products and research tools leverage our proprietary database, which has been compiled over the last ten years, and includes comprehensive, historical and real-time information on public and private infrastructure activities unavailable elsewhere in the marketplace. Our database provides information on approximately 5 million procurement related records connected to over 275,000 companies from across approximately 89,000 government agencies and purchasing offices nationwide. Thousands of records are added to our database each day. Information in our database has been collected, formatted and classified by an in-house team of researchers and third-party providers so clients are able to quickly find and analyze information relevant to their businesses.
Most of our revenues are currently generated from three main business channels: subscriptions, content licenses, and management reports. Subscription-based services are typically prepaid, have a minimum term of one year and revenues are recognized ratably over the term of the subscription. Subscriptions are priced based upon the geographic range, nature of content purchased and, with respect to certain products, the number of users or number of records purchased.
Revenue from content licenses is generated from clients who resell our business content data to their customers. Content license contracts are generally multi-year arrangements that are invoiced on a monthly or quarterly basis, and these agreements typically have a higher annual contract value, or ACV, than our subscription-based services. ACV represents the aggregate annual contract value of our client base. Revenue from content license agreements is recognized ratably over the term of the agreement.
Revenue from the sale of management information reports is recognized upon delivery of the report to the client, or, if report refreshes are included, ratably over the service period. Pricing for management information reports is generally based on one, or a combination of, the following: the number of records included in the report; the geographic range of the report; or a flat fee based on the type of report. We also generate revenue from document download services and list rental services, and these fees are recognized upon delivery of the document or list.
Management Overview
Revenues for 2009 were $25.6 million, representing an increase of 21% over 2008. Revenue for the fourth quarter of 2009 increased 26% compared to the fourth quarter of 2008. The improvement in revenue was due primarily to growth in ACV. ACV represents the aggregate annual revenue value of the company’s subscription contracts. ACV increased 22% to $24.1 million at December 31, 2009 from $19.8 million at December 31, 2008. ACV increased as a result of increased adoption of our database product and planned price increases for renewing clients that are currently below our established list prices.
20
The other significant driver of ACV is annual contract value per client, or ACVC, which grew to $2,974, up 26% compared to the fourth quarter of 2008. ACVC improved in 2009, in part by targeting higher value clients and emphasizing higher value database products. Approximately 56% of our clients at December 31, 2009 subscribed to our higher value database products, an increase of 8% from 52% in the same year-ago period.
Annual net loss was $547,000 for 2009, compared to a net loss of $3.4 million for 2008. The improvement in net loss was primarily attributable to the increase in revenue discussed above, which more than offset the increases in cost of revenue and operating expenses during the year. Cost of revenue increased as a result of an increase in the amount of new content we are capturing and the increases in operating expenses are discussed in more detail in the “Consolidated Results of Operations” section below.
At December 31, 2009, we had 8,100 clients, a decrease of 4% compared to 8,400 at December 31, 2008. We experienced lower retention rates toward the end of 2009, and we believe this slowing is attributable, in part, to clients new to the public sector who underestimated the commitment required to successfully bid on government contracts, and the challenges faced by small businesses in the current economic climate. Recognizing these factors, our 2010 plans include the launch of new products and an increasing focus on large corporate enterprises.
In 2009 we invested $3.0 million in internal and offshore development resources and capital expenditures to develop and implement new products and technologies. During the fourth quarter we launched our new application and database platform. The new platform creates a flexible and scalable product development environment, improves our database search and indexing capabilities, and enhances the user experience and usability of our information services. The new search and indexing capabilities will dramatically improve the relevance of our information to the specific needs of our clients. The new user interface has an entirely different look and feel, and integrates the commercial and government products into one robust database, which provides the opportunity to analyze a full set of data. The new platform is expected to serve as the basis for product development and growth in the coming years. In addition, we launched a new content management system, or CMS, in February 2010. Our new CMS was developed to effectively capture new types of valuable content, to improve the productivity of our research organization, to improve data accuracy, and ultimately improve client retention. We expect capital investments to be consistent with 2009 during 2010 as we continue to develop new products and tools to create a significant competitive advantage for Onvia well into the future.
Application of Critical Accounting Policies and Management Estimates
Our discussion and analysis of financial condition and results of operations are based upon our consolidated financial statements, which have been prepared in accordance with accounting principles generally accepted in the United States. The preparation of these financial statements requires us to make estimates and judgments that affect the reported amounts of assets, liabilities, revenues and expenses, and related disclosure of commitments and contingencies. We base our estimates on historical experience and on various other assumptions that we believe to be reasonable under the circumstances, the results of which form the basis for making judgments about the carrying values of assets and liabilities that are not readily apparent from other sources. Actual results may differ significantly from our estimates. In addition, any significant unanticipated changes in any of our assumptions could have a material adverse effect on our business, financial condition, and results of operations. We believe the following are our most significant accounting policies and estimates:
Revenue Recognition
Our revenues are primarily generated from subscriptions, content licenses and management reports. Our subscriptions are generally annual contracts; however, we also offer, on a limited basis, extended multi-year contracts to our subscription clients, and content licenses are generally multi-year agreements. Subscription and content licenses are recognized ratably over the term of the agreement. We also generate revenue from fees charged for management reports, document download services, and list rental services, and revenue from these types of services is recognized upon delivery, or, if report refreshes are included, ratably over the service period.
Our subscription services and management information reports are also sold together as a bundled offering. Pursuant to the provisions of Accounting Standard Codification, or ASC, 605-25 Revenue Recognition (previously Emerging Issues Task Force No. 00-21, Revenue Arrangements with Multiple Deliverables, or EITF 00-21), we allocate revenue from these bundled sales ratably between the subscription services and the management reports based on their relative fair values, which are consistent with established list prices for those offerings.
21
Unearned revenue consists of payments received for prepaid subscriptions from our non-enterprise clients whose terms extend into periods beyond the balance sheet date, as well as the invoiced portion of enterprise contracts and content licenses whose terms extend into periods beyond the balance sheet date.
Internal Use Software
We account for the costs to develop or obtain software for internal use in accordance with ASC 350-40 Intangibles – Goodwill and Other subtopic Internal-Use Software (previously Statement of Position No. 98-1, Accounting for the Costs of Computer Software Developed or Obtained for Internal Use). As a result, we capitalize qualifying computer software costs incurred during the “application development stage.” Amortization of these costs begins once the product is ready for its intended use. These capitalized software costs are amortized on a straight-line basis over the estimated useful life of the product, typically 3 to 5 years. The amount of costs capitalized within any period is dependent on the nature of software development activities and projects in each period.
During 2009, 2008 and 2007, we abandoned $5,000, $97,000 and $45,000, respectively, related to internal use software. The abandoned assets relate to internal use code that was initially developed to enhance the functionality of existing products and internal workflow. We no longer believe that the code will be compatible with our new technology platform and we believe these costs have no future value. The $5,000, $97,000 and $45,000 in abandonments represent the full unamortized value of these assets and is included in operating expenses under the general and administrative category in the years ended December 31, 2009, 2008 and 2007, respectively.
Non-cash Stock-Based Compensation
We account for stock-based compensation according to the provisions of ASC 718 Compensation – Stock Compensation (previously SFAS No. 123R, Share-Based Payment), which requires measurement of compensation cost for all stock-based awards at fair value on the date of grant and recognition of stock-based compensation cost over the requisite service period for awards expected to vest. The fair value of our stock options is determined using the Black-Scholes valuation model. Such value is recognized as expense over the service period, net of estimated forfeitures. The estimation of stock awards that will ultimately vest requires judgment, and to the extent actual results or updated estimates differ from our current estimates, such amounts will be recorded as a cumulative adjustment in the period estimates are revised. We consider many factors when estimating expected forfeitures, including employee class and historical experience. There is also significant judgment required in the estimation of the valuation assumptions used to determine the fair value of options granted. Please refer to the discussion of valuation assumptions in Note 2 of the “Notes to Consolidated Financial Statements” of this Report for additional information on the estimation of these variables. Actual results, and future changes in estimates, may differ substantially from our current estimates.
Accounts Receivable and Allowance for Doubtful Accounts
We record accounts receivable for the invoiced or earned but not invoiced portion of our enterprise contracts and content licenses once we have a signed agreement and amounts are billable pursuant to the contract terms. We do not record a receivable for the unbilled and unearned portion of our enterprise contracts or content licenses. As of December 31, 2009 and 2008, the unbilled portion of enterprise contracts and content licenses was approximately $2.9 million and $2.6 million, respectively. Accounts receivable are recorded at their net realizable value, after deducting an allowance for doubtful accounts. Such allowances are determined based on a review of an aging of accounts and reflect either specific accounts or estimates based on historical incurred losses.
22
Contractual Obligations
Future required payments under contracts, excluding operating expenses for our lease obligations, as of December 31, 2009 are as follows for the periods specified:
|
Payments due by period
|
||||||||||||||||||||
|
Total
|
Less than 1 year
|
1 - 3 years
|
3 - 5 years
|
More than 5 years
|
||||||||||||||||
|
Real estate operating lease obligations
|
$ | 5,810,613 | $ | 926,034 | $ | 1,936,245 | $ | 2,054,163 | $ | 894,171 | ||||||||||
|
Purchase obligations (1)
|
1,276,989 | 1,190,322 | 86,667 | - | - | |||||||||||||||
|
Capital lease obligations (2)
|
6,371 | 6,371 | - | - | - | |||||||||||||||
|
Other operating lease obligations (3)
|
83,653 | 18,251 | 36,502 | 28,900 | - | |||||||||||||||
|
Total
|
$ | 7,177,626 | $ | 2,140,978 | $ | 2,059,414 | $ | 2,083,063 | $ | 894,171 | ||||||||||
|
(1)
|
Purchase obligations relate to software development and license agreements, co-location hosting arrangements, telecom agreements, marketing agreements and third-party content agreements.
|
|
(2)
|
Capital lease obligations relate to server equipment and related maintenance agreements.
|
|
(3)
|
Other operating lease obligations relate to office equipment leases.
|
Consolidated Results of Operations
The following table provides our selected consolidated results of operations for the indicated periods (in thousands of dollars and as a percentage of total revenue):
|
Years Ended December 31,
|
||||||||||||||||||||||||
|
2009
|
2008
|
2007
|
||||||||||||||||||||||
|
Revenue:
|
||||||||||||||||||||||||
|
Subscription
|
$ | 22,063 | 86.1 | % | $ | 18,090 | 85.6 | % | $ | 17,802 | 85.1 | % | ||||||||||||
|
Content license
|
2,460 | 9.6 | % | 2,239 | 10.6 | % | 2,442 | 11.7 | % | |||||||||||||||
|
Management information reports
|
863 | 3.4 | % | 568 | 2.7 | % | 454 | 2.2 | % | |||||||||||||||
|
Other
|
251 | 0.9 | % | 245 | 1.1 | % | 230 | 1.0 | % | |||||||||||||||
|
Total revenue
|
25,637 | 100.0 | % | 21,142 | 100.0 | % | 20,928 | 100.0 | % | |||||||||||||||
|
Cost of revenue
|
4,679 | 18.3 | % | 4,326 | 20.5 | % | 3,731 | 17.8 | % | |||||||||||||||
|
Gross margin
|
20,958 | 81.7 | % | 16,816 | 79.5 | % | 17,197 | 82.2 | % | |||||||||||||||
|
Sales and marketing expenses
|
13,909 | 54.2 | % | 12,300 | 58.2 | % | 11,729 | 56.0 | % | |||||||||||||||
|
Technology and development expenses
|
3,096 | 12.1 | % | 3,818 | 18.1 | % | 4,411 | 21.1 | % | |||||||||||||||
|
General and administrative expenses
|
4,552 | 17.8 | % | 4,505 | 21.3 | % | 4,198 | 20.1 | % | |||||||||||||||
|
Idle lease accrual
|
- | 0.0 | % | - | 0.0 | % | (2,653 | ) | (12.7 | %) | ||||||||||||||
|
Total operating expenses
|
21,557 | 84.1 | % | 20,623 | 97.6 | % | 17,685 | 84.5 | % | |||||||||||||||
|
Loss from operations
|
(599 | ) | (2.3 | %) | (3,807 | ) | (18.0 | %) | (488 | ) | (2.3 | %) | ||||||||||||
|
Interest and other income, net
|
52 | 0.2 | % | 433 | 2.0 | % | 982 | 4.7 | % | |||||||||||||||
|
Net (loss) / income
|
$ | (547 | ) | (2.1 | %) | $ | (3,374 | ) | (16.0 | %) | $ | 494 | 2.4 | % | ||||||||||
Comparison of Years Ended December 31, 2009, 2008 and 2007
Revenue
Revenue increased 21% to $25.6 million for the year ended December 31, 2009, compared to $21.1 million for the year ended December 31, 2008. Revenue growth was driven by an increase in new client acquisition as a result of activities stemming from the passage of the Recovery Act, and due to increased interest in public sector opportunities from the stalled commercial sector. We experienced some erosion in renewal rates in the fourth quarter of 2009, which we believe is attributable to clients new to the public sector who underestimated the commitment required to successfully bid on government contracts, as well as the challenges small businesses continue to face in the current economy. We plan to implement a more rigorous account management plan to better serve our clients and we expect this to improve retention rates.
Revenue increased 1% to $21.1 million for the year ended December 31, 2008, compared to $20.9 million for the year ended December 31, 2007. 2008 revenue was negatively impacted by a decline in bookings growth in the fourth quarter of 2007 and the first half of 2008 resulting from a smaller acquisition sales force and lack of any significant new product introductions. In the second half of 2008, the economic stimulus activity, the passage of recovery legislation, and the stalled commercial sector increased interest in public sector opportunities and revenue growth accelerated in the latter half of 2008.
23
Cost of Revenue
Cost of revenue increased 8% to $4.7 million for the year ended December 31, 2009, compared to $4.3 million for the year ended December 31, 2008. Our cost of revenue consists primarily of employee costs associated with collecting, categorizing and publishing our content, and also includes third-party content fees and credit card processing fees. The increase in cost of revenue was primarily due to an increase of $233,000 in third-party content costs related to increased content collection and an increase of $181,000 in credit card fees as a result of increased bookings during 2009. These increases were partially offset by a decrease in payroll related costs because of a decline in weighted average headcount on our content team. Weighted average headcount on our content team was 45 during 2009, compared to 56 during 2008.
For the year ended December 31, 2008, cost of revenue increased 16% to $4.3 million compared to $3.7 million for the year ended December 31, 2007. The increase in cost of revenue was due primarily to an increase of $593,000 in third party content costs for new content collection associated with private sector information.
Sales and Marketing
Sales and marketing expenses were $13.9 million and $12.3 million for the years ended December 31, 2009 and 2008, respectively, representing an aggregate increase of $1.6 million, or 13%. Employee costs increased by $700,000 due to an increase in weighted average headcount on our sales and marketing teams to 100 during 2009, compared to 89 during 2008. Allocated expenses were $671,000 higher in 2009 because of an increase in amortization of capitalized internal use software costs due to the launch of our new technology platform, and an increase in headcount on our sales and marketing teams. Employee costs consist of payroll, benefits and travel related expenses. Allocated expenses consist of depreciation and amortization and other facilities related expenses and are allocated based on headcount in the respective departments.
Sales and marketing expenses were $12.3 million and $11.7 million for the years ended December 31, 2008 and 2007. Employee costs increased by $1.2 million due to an increase in weighted average headcount on our sales and marketing teams to 89 during 2008, compared to 79 during 2007. Allocated expenses were $422,000 higher in 2008 because of accelerated depreciation on leasehold improvements as a result of our office relocation. These increases were offset by a decrease of $112,000 in stock compensation because of forfeitures and a decrease of $136,000 in recruiting fees.
Technology and Development
Technology and development expenses were $3.1 million and $3.8 million for the years ended December 31, 2009 and 2008, respectively, representing a decrease of $722,000, or 19%. The decrease is primarily attributable to decreases of $1.1 million in employee costs as a result of a decrease in weighted average headcount on our technology and development teams to 18 in 2009, compared to 26 in 2008. We have been able to decrease headcount on our technology and development team by leveraging offshore development resources. The majority of the cost of these offshore resources is capitalized because they are focused almost exclusively on development efforts for new internal use software. In addition, allocated costs decreased $156,000 because of the decrease in weighted average headcount. These decreases were offset by an increase of $133,000 in contract labor for the non-capitalizable portion of our offshore technology team and capitalization of internal onshore development costs decreased $347,000 because of the decrease in weighted average headcount.
Technology and development expenses were $3.8 million and $4.4 million for the years ended December 31, 2008 and 2007, respectively, representing a decrease of $593,000, or 13%. The decrease is primarily attributable to decreases of $247,000 in allocated costs and $196,000 in recruiting fees. These decreases were offset by increases of $285,000 in employee costs and $181,000 in co-location expenses. In addition, $595,000 more of internal onshore development costs were capitalized in 2008 because of the development of our new technology platform. Weighted average headcount on our technology and development teams decreased to 26 in 2008, compared to 29 in 2007, but employee costs increased mostly due to a $234,000 increase in bonus incentives related to new product development milestones. The increase in allocated expenses was due to amortization of new software and maintenance agreements to maintain our systems and to develop our new technology platform.
General and Administrative
General and administrative expenses were $4.6 million and $4.5 million for the years ended December 31, 2009 and 2008, respectively, representing an increase of $47,000, or 1%. Although total expenses were flat compared to the prior year, we had the following fluctuations in 2009 expenses compared to 2008: Travel and consulting expenses increased $671,000 as a result of our efforts to gather information on government’s stimulus activities and the Recovery Act to assist with information requirements for our Recovery.org website. Bad debt expense increased $242,000 as a result of the current difficult economic conditions, which have been particularly challenging for small businesses. We are now being more stringent with our practices of extending terms to clients to address this increase in bad debts. Allocated expenses increased $93,000 due to an overall increase in amortization as discussed above. These increases were offset by decreases of $314,000 in business taxes, $198,000 in non-cash stock based compensation, $166,000 in recruiting expenses, $163,000 in office relocation expenses, and $91,000 in asset abandonment expenses. Business taxes were higher in 2008 because of a sales tax assessment for past due sales taxes in the state of Texas. Stock compensation was lower in 2009 because the majority of outstanding options for our CEO became fully vested during the year. Recruiting fees were higher in 2008 primarily due to fees associated with the hire of our former Vice President of Marketing. Office relocation expenses were lower because we did not incur any of these expenses during 2009. Finally, asset abandonment expenses were lower because we didn’t have any significant abandonments during 2009.
24
General and administrative expenses were $4.5 million and $4.2 million for the years ended December 31, 2008 and 2007, respectively, representing an increase of $307,000, or 7%. The increase was primarily associated with the following: Business taxes increased by $191,000 as discussed above; recruiting fees increased by $101,000 as discussed above; employee costs increased $91,000 primarily due to accrued severance for our former Vice President of Human Resources; office relocation fees were $63,000 higher than 2007 as a result of our move to a new corporate headquarters building in January 2008; and finally, we experienced increases of $56,000 and $51,000 in bad debt expense and expense for abandoned assets, respectively. The increase in bad debt expense was attributable to the weakening economy and the resultant increase in the number of subscriptions sold with terms. Abandoned asset expense increased because we abandoned internally developed code that we no longer believe will be compatible with our new technology platform. These increases were partially offset by a decrease of $131,000 in consulting fees and $101,000 in non-cash stock compensation expense. Consulting fees were higher in 2007 because of consulting services associated with our office relocation and non-cash stock compensation expense decreased because of a revision in our estimated forfeiture rate based on historical information.
Idle Lease Charges
Onvia recorded a reduction in expenses of $2.7 million for the year ended December 31, 2007 related to our idle lease accrual. The decrease was to eliminate the remaining balance in our idle lease accrual as a result of the termination of our lease on our former corporate headquarters building.
The following table displays rollforwards of the idle lease accrual which was reduced to $0 at December 31, 2007:
|
Amounts
|
||||||||||||||||
|
Accruals at
|
Paid, Net
|
Accruals at
|
||||||||||||||
|
December 31,
|
2007
|
of Sublease
|
December 31,
|
|||||||||||||
|
2006
|
Reduction
|
Income
|
2007
|
|||||||||||||
|
Idle lease charges
|
$ | 3,779,215 | $ | (2,652,550 | ) | $ | (1,126,665 | ) | $ | - | ||||||
Other Income, Net
Other income, net consists of interest earned on our investment accounts, interest expense associated with operating leases and other miscellaneous income or expense. Other income, net was $52,000, $433,000, and $982,000 for the years ended December 31, 2009, 2008 and 2007, respectively. The year over year decreases in 2009 and 2008 is primarily attributable to a decrease in short term interest rates as compared to the prior year. In addition, at the end of 2008, we reallocated all of our investments into a US Treasury cash reserve fund to mitigate our credit risk associated with our investment portfolio in light of the downturn in the financial services industry, which have a significantly lower rate of return than our previous investments, but greater investment security. During 2009, we moved a portion of our investments into FDIC insured or U.S. government backed short-term securities, which carry a slightly higher return than the money market funds. Interest expense was $9,000, $20,000 and $16,000 for the years ended December 31, 2009, 2008 and 2007, respectively. Interest expense relates to capital leases for server equipment.
Provision for Income Taxes
We have incurred net operating losses, or NOL, from our inception through December 31, 2009, with the exception of the third quarter of 2007 and the third and fourth quarters of 2009. Because of this history of net operating losses, and until we can demonstrate consistent quarterly net income, we do not currently believe that the future realization of the tax benefit associated with these net loss carryforwards is more likely than not; therefore, we have recorded a valuation allowance for the full amount of our net deferred tax assets. We will continue to evaluate the likelihood that these tax benefits may be realized, and may reverse all or a portion of our valuation allowance in the future if it is determined that realization of these benefits is more likely than not.
25
Utilization of the NOL carryforwards may be subject to a substantial annual limitation due to ownership change limitations that may have occurred previously or that could occur in the future provided by Section 382 of the Internal Revenue Code of 1986, as amended (the “Code”). These ownership changes may limit the amount of NOL carryforwards that can be utilized annually to offset future taxable income and tax, respectively. In general, an ownership change, as defined by Section 382 of the Code, results from transactions increasing the ownership of certain stockholders or public groups in the stock of a corporation by more than 50 percentage points over a three-year period.
In the future, the Company plans to complete a Section 382 analysis regarding ownership changes that may have occurred, but at this time the Company cannot reasonably estimate whether such a change has occurred. Any carryforwards that will expire prior to utilization as a result of such limitations will be removed from deferred tax assets with a corresponding reduction of the valuation allowance.
We currently have a full valuation allowance for our deferred tax assets as the future realization or the tax benefit is not more likely than not.
Liquidity and Capital Resources
Our principal sources of liquidity are cash, cash equivalents and short-term investments. Our combined cash, cash equivalents and short-term investments were $14.3 million at December 31, 2009, and our working capital was $2.7 million. From December 31, 2008 to December 31, 2009, our cash, cash equivalents and short-term investments increased $1.2 million. This increase was driven by higher sales during 2009, which resulted in an increase of $2.4 million in deferred revenue for prepaid subscription services. Vendor and employee payments also decreased because 2008 included payments for our office relocation and severance payments for two senior executives. These changes were partially offset by payments of $2.7 million for additions to internally developed software for our new technology platform and other new products.
We were able to generate positive cash flow from operations in 2009, primarily because of the increase in sales during the year, which was driven in part by the increase in our acquisition sales force and increased interest in our services from the federal government’s economic stimulus activity. We will seek to generate positive cash flows from operations in the future via our efforts to increase client acquisition, retention and increasing our ACV. Until such time as we begin generating recurring positive cash flows from operations, we will utilize our current cash and cash equivalents and current revenues to fund operations. We expect to increase revenue from current operations by increasing our ACV through a combination of expansion of our product offering and scheduled price increases.
We have established more stringent policies for granting extended payment terms for our clients in light of increasing default rates on subscriptions with these types of terms. The continuingly difficult economy has triggered an increase in requests for delayed payment terms, such as quarterly payment terms. If we reduce the availability of credit to our clients, they may refuse to purchase and our operating cash flow may be adversely impacted in the near term; however, we believe that our current cash and cash equivalents are sufficient to fund current operations for the near–term foreseeable future.
If we engage in merger or acquisition transactions or our overall operating plans change, we may require additional equity or debt financing to meet future working capital needs, which may have a dilutive effect on existing stockholders or may include securities that have rights, preferences or privileges senior to those of the rights of our common stock. We cannot make assurances that if additional financing is required, it will be available, or that such financing can be obtained on satisfactory terms.
Operating Activities
Net cash provided by operating activities was $4.1 million for the year ended December 31, 2009, compared to net cash used in operating activities of $2.3 million and net cash provided by operating activities of $2.1 million for the years ended December 31, 2008 and 2007, respectively. The change from net cash used to net cash provided by operating activities was primarily due to an increase in sales during 2009, which resulted in an increase in cash collected for prepaid subscriptions.
Investing Activities
Net cash used in investing activities was $15.5 million for the year ended December 31, 2009, compared to net cash provided by investing activities of $1.0 million and $2.6 million for the years ended December 31, 2008 and 2007, respectively.
Purchases of investments, net of sales and maturities increased by $12.6 million in 2009 compared to 2008, because we moved a portion of our investment portfolio from money market funds, which are considered cash equivalents, into FDIC insured and U.S. government backed funds during 2009. In addition, cash provided by investing activities in 2008 included $6.0 million from the return of a security deposit on our old corporate headquarters and reimbursements for tenant improvements on our new building and we did not receive such payments in 2009.
26
The decrease in cash provided by investing activities in 2008 compared to 2007 is primarily due to a decrease in net sales and maturity of investments, offset by the return of reimbursable tenant improvements during 2008.
Financing Activities
Net cash used in financing activities was $1,000 for the year ended December 31, 2009 compared to net cash provided by financing activities of $13,000 and $1.2 million for the years ended December 31, 2008 and 2007, respectively. Net cash provided by financing activities in 2008 and 2007 was principally related to the exercise of stock options and purchases of stock under our employee stock purchase plan, or ESPP, and was offset by principal payments on capital leases. In 2009, cash provided by option exercises and ESPP purchases was entirely offset by principal payments on capital leases. Decreases in our stock price during 2009 and 2008 resulted in a decrease in the number of option exercises compared to prior years.
New Accounting Pronouncements
In June, 2009, the Financial Accounting Standards Board, or FASB, issued Statement of Financial Accounting Standard, or SFAS, No. 168, The FASB Accounting Standards Codification and the Hierarchy of Generally Accepted Accounting Principles, also known as FASB Accounting Standards Codification, or ASC 105, Generally Accepted Accounting Principles. ASC 105 establishes the exclusive authoritative reference for U.S. GAAP for use in financial statements, except for Securities and Exchange Commission rules and interpretive releases, which are also authoritative GAAP for Securities and Exchange Commission, or SEC, registrants. The Codification supersedes all existing non-SEC accounting and reporting standards. Going forward, the FASB will not issue new standards in the form of Statements, FASB Staff Positions or Emerging Issues Task Force Abstracts. Instead, it will issue Accounting Standards Updates, or ASU, which will serve to update the Codification, provide background information about the guidance and provide the basis for conclusions on the changes to the Codification. This Statement was effective for interim and annual periods ending after September 15, 2009. We adopted the provisions of this Statement in the third quarter of 2009 and have included references to the Codification, as appropriate, in these financial statements. Adoption of this Statement did not have a material impact on our financial position, cash flows, or results of operations.
In February 2010, the FASB issued ASU No. 2010-09, Subsequent Events (Topic 855) – Amendments to Certain Recognition and Disclosure Requirements. This ASU amends Topic 855, Subsequent Events, to eliminate the requirement for SEC filers to disclose the date through which subsequent events have been evaluated. This amendment addresses concerns that the guidance in Topic 855 potentially conflicts with some of the SEC’s guidance. This update is effective for all entities and was effective upon issuance. Adoption of this ASU did not have a material impact on our financial position, cash flows, or results of operations.
In January 2010, the FASB issued ASU No. 2010-06, Improving Disclosures About Fair Value Measurements, which requires reporting entities to make new disclosures about recurring or nonrecurring fair-value measurements including significant transfers into and out of Level 1 and Level 2 fair-value measurements and information on purchases, sales, issuances, and settlements on a gross basis in the reconciliation of Level 3 fair-value measurements. ASU 2010-06 is effective for annual reporting periods beginning after December 15, 2009, except for Level 3 reconciliation disclosures which are effective for annual periods beginning after December 15, 2010. We adopted the provisions related to Level 1 and Level 2 fair-value measurements in the fourth quarter of 2009. Adoption of ASU 2010-06 did not have a material impact on our results of operations or financial position and we do not expect adoption of the Level 3 provisions to have a material impact on our financial position, cash flows, or results of operations.
In October 2009, the FASB issued ASU No. 2009-13, Multiple-Deliverable Revenue Arrangements. This ASU establishes the accounting and reporting guidance for arrangements including multiple revenue-generating activities. This ASU provides amendments to the criteria for separating deliverables, measuring and allocating arrangement consideration to one or more units of accounting. The amendments in this ASU also establish a selling price hierarchy for determining the selling price of a deliverable. Significantly enhanced disclosures are also required to provide information about a vendor’s multiple-deliverable revenue arrangements, including information about the nature and terms, significant deliverables, and its performance within arrangements. The amendments also require providing information about the significant judgments made and changes to those judgments and about how the application of the relative selling-price method affects the timing or amount of revenue recognition. The amendments in this ASU are effective prospectively for revenue arrangements entered into or materially modified in the fiscal years beginning on or after June 15, 2010. Early application is permitted. The Company is currently evaluating this new ASU.
27
In May 2009, the FASB issued ASC 855 Subsequent Events (previously FAS 165, Subsequent Events). This Statement establishes general standards of accounting for and disclosure of events that occur after the balance sheet date, but before financial statements are issued or are available to be issued. ASC 855 sets forth the period after the balance sheet date during which management shall evaluate events or transactions that may occur for potential recognition or disclosure in the financial statements, the circumstances under which we shall recognize such events or transactions in Onvia’s financial statements, and the disclosures required about such events or transactions. ASC 855 was amended in February 2010 by ASU 2010-09 (discussed above) to eliminate the requirement to disclose the date through which subsequent events have been evaluated. ASC 855 is effective for interim or annual financial periods ending after June 15, 2009 and Onvia adopted the provisions of this standard in the second quarter of 2009. Adoption of this ASC did not have a material impact on Onvia’s financial position, cash flows, or results of operations.
In April 2009, the FASB issued ASC 820, Fair Value Measurements and Disclosures (previously FSP 157-4, Determining Fair Value When the Volume and Level of Activity for the Asset or Liability Have Significantly Decreased and Identifying Transactions That Are Not Orderly). ASC 820 provides additional guidance for estimating fair value when the volume and level of activity for the asset or liability have significantly decreased, and includes guidance on identifying circumstances that indicate a transaction is not orderly. In addition, ASC 820 requires disclosure in interim and annual periods of the inputs and valuation techniques used to measure fair value and a discussion of changes in valuation techniques. This ASC is effective for interim and annual reporting periods ending after June 15, 2009. The adoption of this ASC did not have a material impact on Onvia’s financial position, cash flows, or results of operations.
In April 2009, the FASB issued ASC 320, Investments – Debt and Equity Securities (previously FSP 115-2, Recognition and Presentation of other-Than-Temporary Impairments). ASC 320 amends the other-than-temporary impairment guidance in U.S. GAAP for debt securities to make the guidance more operational and to improve the presentation and disclosure of other-than-temporary impairments on debt and equity securities in the financial statements and is effective for interim and annual reporting periods ending after June 15, 2009. This ASC does not amend existing recognition and measurement guidance related to other-than-temporary impairments of equity securities. Onvia has evaluated the debt securities held at December 31, 2009 and the Company does not believe that the securities are impaired. Adoption of this ASC did not have a significant impact on the Company’s financial position, cash flows, or results of operations.
In April 2009, the FASB issued ASC 825, Financial Instruments (previously FSP 107-1, Interim Disclosures about Fair Value of Financial Instruments), to require disclosure about fair value of financial instruments for interim reporting periods of publicly traded companies as well as in annual financial statements. ASC 825 also amends ASC 270, Interim Reporting (previously APB Opinion No. 28, Interim Financial Reporting) to require those disclosures in summarized financial information at interim reporting periods. This ASC is effective for interim reporting periods ending after June 15, 2009. Adoption of this ASC did not have a material impact on the Company’s financial position, cash flows, or results of operations. See Note 3 for disclosure about the fair value of financial instruments held at December 31, 2009.
ITEM 7A. QUANTITATIVE AND QUALITATIVE DISCLOSURES ABOUT MARKET RISK
The registrant is a Smaller Reporting Company and, therefore, is not required to provide the information under this item.
28
REPORT OF INDEPENDENT REGISTERED PUBLIC ACCOUNTING FIRM
To the Board of Directors and Stockholders of
Onvia, Inc.
Seattle, Washington
We have audited the accompanying consolidated balance sheets of Onvia, Inc. and subsidiary (the "Company") as of December 31, 2009 and 2008, and the related consolidated statements of operations and other comprehensive (loss) / income, stockholders' equity, and cash flows for each of the three years in the period ended December 31, 2009. Our audits also included the financial statement schedule listed in the Index at Item 15. These financial statements and the financial statement schedule are the responsibility of the Company's management. Our responsibility is to express an opinion on the financial statements and the financial statement schedule based on our audits.
We conducted our audits in accordance with the standards of the Public Company Accounting Oversight Board (United States). Those standards require that we plan and perform the audit to obtain reasonable assurance about whether the financial statements are free of material misstatement. The Company is not required to have, nor were we engaged to perform, an audit of its internal control over financial reporting. Our audits included consideration of internal control over financial reporting as a basis for designing audit procedures that are appropriate in the circumstances, but not for the purpose of expressing an opinion on the effectiveness of the Company's internal control over financial reporting. Accordingly, we express no such opinion. An audit also includes examining, on a test basis, evidence supporting the amounts and disclosures in the financial statements, assessing the accounting principles used and significant estimates made by management, as well as evaluating the overall financial statement presentation. We believe that our audits provide a reasonable basis for our opinion.
In our opinion, such consolidated financial statements present fairly, in all material respects, the financial position of the Company as of December 31, 2009 and 2008, and the results of their operations and their cash flows for each of the three years in the period ended December 31, 2009, in conformity with accounting principles generally accepted in the United States of America. Also, in our opinion, such financial statement schedule, when considered in relation to the basic consolidated financial statements taken as a whole, presents fairly in all material respects the information set forth therein.
/s/ DELOITTE & TOUCHE LLP
Seattle, Washington
March 31, 2010
29
|
ITEM 8.
|
CONSOLIDATED FINANCIAL STATEMENTS AND SUPPLEMENTARY DATA
|
ONVIA, INC.
CONSOLIDATED BALANCE SHEETS
DECEMBER 31, 2009 AND 2008
|
December 31, 2009
|
December 31, 2008
|
|||||||
|
ASSETS
|
||||||||
|
CURRENT ASSETS:
|
||||||||
|
Cash and cash equivalents
|
$ | 1,646,543 | $ | 13,042,556 | ||||
|
Short-term investments, available-for-sale
|
12,632,263 | - | ||||||
|
Accounts receivable, net of allowance for doubtful accounts of $119,005 and $31,960
|
1,687,664 | 1,644,904 | ||||||
|
Prepaid expenses and other current assets
|
716,219 | 785,917 | ||||||
|
Reimbursable tenant improvements
|
147,260 | 147,260 | ||||||
|
Security deposits, current portion
|
134,517 | 134,517 | ||||||
|
Total current assets
|
16,964,466 | 15,755,154 | ||||||
|
LONG TERM ASSETS:
|
||||||||
|
Property and equipment, net of accumulated depreciation
|
1,225,836 | 1,710,146 | ||||||
|
Security deposits, net of current portion
|
269,035 | 403,552 | ||||||
|
Internal use software, net of accumulated amortization
|
6,614,443 | 4,446,984 | ||||||
|
Prepaid expenses and other assets, net of current portion
|
20,419 | 6,688 | ||||||
|
Total long term assets
|
8,129,733 | 6,567,370 | ||||||
|
TOTAL ASSETS
|
$ | 25,094,199 | $ | 22,322,524 | ||||
|
LIABILITIES AND STOCKHOLDERS’ EQUITY
|
||||||||
|
CURRENT LIABILITIES:
|
||||||||
|
Accounts payable
|
$ | 1,584,905 | $ | 852,701 | ||||
|
Accrued expenses
|
1,268,278 | 1,490,666 | ||||||
|
Idle lease accrual, current portion
|
- | - | ||||||
|
Obligations under capital leases, current portion
|
6,174 | 82,472 | ||||||
|
Unearned revenue, current portion
|
11,275,368 | 8,979,103 | ||||||
|
Deferred rent, current portion
|
87,510 | 60,538 | ||||||
|
Total current liabilities
|
14,222,235 | 11,465,480 | ||||||
|
LONG TERM LIABILITIES:
|
||||||||
|
Idle lease accrual, net of current portion
|
||||||||
|
Obligations under capital leases, net of current portion
|
- | 6,174 | ||||||
|
Unearned revenue, net of current portion
|
269,953 | 138,578 | ||||||
|
Deferred rent, net of current portion
|
831,704 | 919,213 | ||||||
|
Total long term liabilities
|
1,101,657 | 1,063,965 | ||||||
|
TOTAL LIABILITIES
|
15,323,892 | 12,529,445 | ||||||
|
COMMITMENTS AND CONTINGENCIES (Note 11)
|
||||||||
|
STOCKHOLDERS’ EQUITY:
|
||||||||
|
Preferred stock; $.0001 par value: 2,000,000 shares authorized; no shares issued or outstanding
|
- | - | ||||||
|
Common stock; $.0001 par value: 11,000,000 shares authorized; 8,283,296 and 8,254,909 shares issued; and 8,283,270 and 8,246,828 shares outstanding
|
828 | 825 | ||||||
|
Treasury stock, at cost: 26 and 8,081 shares
|
(129 | ) | (39,677 | ) | ||||
|
Additional paid in capital
|
352,615,627 | 352,127,344 | ||||||
|
Accumulated other comprehensive loss
|
(3,135 | ) | - | |||||
|
Accumulated deficit
|
(342,842,884 | ) | (342,295,413 | ) | ||||
|
Total stockholders’ equity
|
9,770,307 | 9,793,079 | ||||||
|
TOTAL LIABILITIES AND STOCKHOLDERS' EQUITY
|
$ | 25,094,199 | $ | 22,322,524 | ||||
30
ONVIA, INC.
CONSOLIDATED STATEMENTS OF OPERATIONS AND COMPREHENSIVE (LOSS) / INCOME
YEARS ENDED DECEMBER 31, 2009, 2008 AND 2007
|
2009
|
2008
|
2007
|
||||||||||
|
Revenue
|
||||||||||||
|
Subscription
|
$ | 22,063,033 | $ | 18,089,617 | $ | 17,801,522 | ||||||
|
Content license
|
2,460,055 | 2,239,075 | 2,441,753 | |||||||||
|
Management reports
|
863,037 | 568,491 | 453,993 | |||||||||
|
Other
|
251,060 | 244,831 | 230,660 | |||||||||
|
Total revenue
|
25,637,185 | 21,142,014 | 20,927,928 | |||||||||
|
Cost of revenue
|
4,678,630 | 4,326,139 | 3,731,224 | |||||||||
|
Gross margin
|
20,958,555 | 16,815,875 | 17,196,704 | |||||||||
|
Operating expenses:
|
||||||||||||
|
Sales and marketing
|
13,910,131 | 12,299,976 | 11,728,127 | |||||||||
|
Technology and development
|
3,095,738 | 3,817,885 | 4,411,205 | |||||||||
|
General and administrative
|
4,551,918 | 4,504,982 | 4,197,837 | |||||||||
|
Idle lease expense
|
- | - | (2,652,550 | ) | ||||||||
|
Total operating expenses
|
21,557,787 | 20,622,843 | 17,684,619 | |||||||||
|
Loss from operations
|
(599,232 | ) | (3,806,968 | ) | (487,915 | ) | ||||||
|
Other income, net
|
51,761 | 433,153 | 982,281 | |||||||||
|
Net (loss) / income
|
$ | (547,471 | ) | $ | (3,373,815 | ) | $ | 494,366 | ||||
|
Unrealized (loss) / gain on available-for-sale securities
|
(3,135 | ) | - | 5,604 | ||||||||
|
Comprehensive (loss) / income
|
$ | (550,606 | ) | $ | (3,373,815 | ) | $ | 499,970 | ||||
|
Basic net (loss) / income per common share
|
$ | (0.07 | ) | $ | (0.41 | ) | $ | 0.06 | ||||
|
Diluted net (loss) / income per common share
|
$ | (0.07 | ) | $ | (0.41 | ) | $ | 0.06 | ||||
|
Basic weighted average shares outstanding
|
8,265,727 | 8,230,355 | 8,086,622 | |||||||||
|
|
||||||||||||
|
Diluted weighted average shares outstanding
|
8,265,727 | 8,230,355 | 8,605,968 | |||||||||
See notes to consolidated financial statements.
31
ONVIA, INC.
CONSOLIDATED STATEMENTS OF CASH FLOWS
YEARS ENDED DECEMBER 31, 2009, 2008 AND 2007
|
2009
|
2008
|
2007
|
||||||||||
|
CASH FLOWS FROM OPERATING ACTIVITIES:
|
||||||||||||
|
Net (loss) / income
|
$ | (547,471 | ) | $ | (3,373,815 | ) | $ | 494,366 | ||||
|
Adjustments to reconcile net (loss) / income to net cash provided by / (used in) operating activities:
|
||||||||||||
|
Depreciation and amortization
|
1,816,699 | 1,530,310 | 2,014,105 | |||||||||
|
Loss on abandoned assets
|
- | 96,585 | 45,271 | |||||||||
|
(Gain) / Loss on sale of property and equipment
|
- | (217 | ) | 7,310 | ||||||||
|
Stock-based compensation
|
448,635 | 718,125 | 927,302 | |||||||||
|
Change in operating assets and liabilities:
|
||||||||||||
|
Accounts receivable
|
(42,761 | ) | (252,120 | ) | (578,156 | ) | ||||||
|
Prepaid expenses and other assets
|
55,967 | (201,945 | ) | 277,362 | ||||||||
|
Accounts payable
|
223,790 | (1,367,895 | ) | 1,765,367 | ||||||||
|
Accrued expenses
|
(260,319 | ) | 174,621 | 251,807 | ||||||||
|
Idle lease accrual
|
- | - | (3,779,215 | ) | ||||||||
|
Unearned revenue
|
2,427,640 | (320,647 | ) | 597,891 | ||||||||
|
Deferred rent
|
(60,537 | ) | 697,655 | 67,816 | ||||||||
|
Net cash provided by / (used in) operating activities
|
4,061,643 | (2,299,343 | ) | 2,091,226 | ||||||||
|
CASH FLOWS FROM INVESTING ACTIVITIES:
|
||||||||||||
|
Additions to property and equipment
|
(221,942 | ) | (1,577,928 | ) | (345,010 | ) | ||||||
|
Proceeds from sales of property and equipment
|
- | 2,981 | - | |||||||||
|
Additions to internal use software
|
(2,734,214 | ) | (3,413,462 | ) | (1,320,540 | ) | ||||||
|
Purchases of investments
|
(15,777,061 | ) | - | (9,044,369 | ) | |||||||
|
Sales of investments
|
1,000,000 | - | 8,270,000 | |||||||||
|
Maturities of investments
|
2,141,663 | - | 8,263,300 | |||||||||
|
Reimbursable tenant improvements
|
- | 2,515,800 | (2,663,060 | ) | ||||||||
|
Additions to security deposits
|
- | - | (538,070 | ) | ||||||||
|
Return of security deposits
|
134,517 | 3,500,000 | - | |||||||||
|
Net cash (used in) / provided by investing activities
|
(15,457,037 | ) | 1,027,391 | 2,622,251 | ||||||||
|
CASH FLOWS FROM FINANCING ACTIVITIES:
|
||||||||||||
|
Principal payments on capital lease obligations
|
(82,472 | ) | (112,821 | ) | (48,993 | ) | ||||||
|
Proceeds from exercise of stock options and purchases under employee stock purchase plan
|
81,853 | 126,180 | 1,206,487 | |||||||||
|
Net cash (used in) / provided by financing activities
|
(619 | ) | 13,359 | 1,157,494 | ||||||||
|
Net (decrease) / increase in cash and cash equivalents
|
(11,396,013 | ) | (1,258,593 | ) | 5,870,971 | |||||||
|
Cash and cash equivalents, beginning of period
|
13,042,556 | 14,301,149 | 8,430,178 | |||||||||
|
Cash and cash equivalents, end of period
|
$ | 1,646,543 | $ | 13,042,556 | $ | 14,301,149 | ||||||
|
SUPPLEMENTAL SCHEDULE OF NON-CASH INVESTING AND FINANCING ACTIVITIES:
|
||||||||||||
|
Unrealized loss on available-for-sale investments
|
$ | (3,135 | ) | $ | - | $ | (5,604 | ) | ||||
|
Issuance of treasury stock for 401K matching contribution
|
(43,740 | ) | (69,634 | ) | (83,281 | ) | ||||||
|
Purchases under capital lease obligations
|
- | - | (250,460 | ) | ||||||||
|
Property and equipment additions in accounts payable
|
(9,460 | ) | ||||||||||
|
Internal use software additions in accounts payable
|
(498,954 | ) | ||||||||||
See notes to consolidated financial statements.
32
ONVIA, INC.
CONSOLIDATED STATEMENTS OF STOCKHOLDERS’ EQUITY
YEARS ENDED DECEMBER 31, 2009, 2008 AND 2007
|
Common stock
|
Treasury stock
|
Additional
|
Accumulated other
|
Accumulated
|
||||||||||||||||||||||||||||
|
Shares
|
Amount
|
Shares
|
Amount
|
paid in capital
|
comprehensive loss
|
deficit
|
Total
|
|||||||||||||||||||||||||
|
BALANCE, January 1, 2007
|
7,929,153 | 793 | 32,369 | (158,932 | ) | 349,174,289 | (5,604 | ) | (339,415,964 | ) | 9,594,582 | |||||||||||||||||||||
|
Exercise of stock options
|
244,482 | 24 | 1,110,523 | 1,110,547 | ||||||||||||||||||||||||||||
|
Purchases under Employee Stock Purchase Plan
|
18,379 | 2 | 95,938 | 95,940 | ||||||||||||||||||||||||||||
|
Treasury stock issued for matching retirement plan contributions
|
15,451 | 2 | (15,451 | ) | 75,865 | 7,414 | 83,281 | |||||||||||||||||||||||||
|
Stock-based compensation
|
879,866 | 879,866 | ||||||||||||||||||||||||||||||
|
Unrealized gain on available-for-sale investments
|
5,604 | 5,604 | ||||||||||||||||||||||||||||||
|
Net income
|
- | - | - | - | - | - | 494,366 | 494,366 | ||||||||||||||||||||||||
|
BALANCE, December 31, 2007
|
8,207,465 | 821 | 16,918 | (83,067 | ) | 351,268,030 | - | (338,921,598 | ) | 12,264,186 | ||||||||||||||||||||||
|
Exercise of stock options
|
3,613 | 0 | 12,834 | 12,834 | ||||||||||||||||||||||||||||
|
Purchases under Employee Stock Purchase Plan
|
26,913 | 3 | 113,343 | 113,346 | ||||||||||||||||||||||||||||
|
Treasury stock issued for matching retirement plan contributions
|
8,837 | 1 | (8,837 | ) | 43,390 | 26,244 | 69,635 | |||||||||||||||||||||||||
|
Stock-based compensation
|
706,893 | 706,893 | ||||||||||||||||||||||||||||||
|
Net loss
|
- | - | - | - | - | - | (3,373,815 | ) | (3,373,815 | ) | ||||||||||||||||||||||
|
BALANCE, December 31, 2008
|
8,246,828 | $ | 825 | 8,081 | $ | (39,677 | ) | $ | 352,127,344 | $ | - | $ | (342,295,413 | ) | $ | 9,793,079 | ||||||||||||||||
|
Exercise of stock options
|
10,284 | 1 | 25,693 | 25,694 | ||||||||||||||||||||||||||||
|
Purchases under Employee Stock Purchase Plan
|
18,103 | 2 | 56,157 | 56,159 | ||||||||||||||||||||||||||||
|
Treasury stock issued for matching retirement plan contributions
|
8,055 | - | (8,055 | ) | 39,548 | 4,189 | 43,737 | |||||||||||||||||||||||||
|
Stock-based compensation
|
402,244 | 402,244 | ||||||||||||||||||||||||||||||
|
Unrealized gain on available-for-sale investments
|
(3,135 | ) | (3,135 | ) | ||||||||||||||||||||||||||||
|
Net loss
|
- | - | - | - | - | - | (547,471 | ) | (547,471 | ) | ||||||||||||||||||||||
|
BALANCE, December 31, 2009
|
8,283,270 | $ | 828 | 26 | $ | (129 | ) | $ | 352,615,627 | $ | (3,135 | ) | $ | (342,842,884 | ) | $ | 9,770,307 | |||||||||||||||
See notes to consolidated financial statements.
33
ONVIA, INC.
NOTES TO CONSOLIDATED FINANCIAL STATEMENTS
YEARS ENDED DECEMBER 31, 2009, 2008 AND 2007
|
Note 1:
|
Summary of Significant Accounting Policies
|
Description of Business
Onvia (together with its subsidiary, “Onvia” or the “Company”) is a provider of business solutions that help companies plan, market and sell to targeted markets throughout the United States, or U.S. Compiled over the last ten years, the Onvia Online Database, Onvia’s proprietary database of comprehensive, historical and real-time information provides businesses with insight and intelligence on relevant public sector revenue opportunities and commercial and residential development projects. This information is classified and linked within four key hubs of data: project history, agency research, buyer research and competitive intelligence. Information in Onvia’s database has been collected, formatted and classified to help its clients quickly find and analyze opportunities relevant to their businesses.
Basis of consolidation
Onvia has a wholly-owned subsidiary in Canada; however, there was no business activity in this subsidiary in any of the fiscal years ended December 31, 2009, 2008 or 2007.
Use of estimates
The preparation of financial statements in conformity with accounting principles generally accepted in the United States of America, or GAAP, requires the Company’s management to make estimates and judgments that affect the reported amounts of assets and liabilities, the disclosure of contingent assets and liabilities at the date of the financial statements, and the reported amounts of revenues and expenses during the reporting period. Significant estimates include the fair value of stock-based compensation, allowance for doubtful accounts, recoverability of long-lived assets, and the valuation allowance for Onvia’s net operating losses. The Company bases its estimates on historical experience and on various other assumptions that it believes to be reasonable under the circumstances. Actual results may differ significantly from the Company’s estimates. In addition, any significant unanticipated changes in any of the Company’s assumptions could have a material adverse effect on its business, financial condition, and results of operations.
Revenue recognition
Onvia’s revenues are primarily generated from client subscriptions, content licenses and management reports. Our subscriptions are generally annual contracts; however, we also offer, on a limited basis, extended multi-year contracts to our subscription clients, and content licenses are generally multi-year agreements. Subscription fees and content licenses are recognized ratably over the term of the agreement. Onvia also generates revenue from fees charged for management reports, document download services, and list rental services; revenue from these types of services is recognized upon delivery, or, if report refreshes are included, ratably over the service period.
Our subscription services and management reports are also sold together as a bundled offering. Pursuant to the provisions of Accounting Standard Codification, or ASC, 605-25 Revenue Recognition (previously Emerging Issues Task Force No. 00-21, Revenue Arrangements with Multiple Deliverables, or EITF 00-21), we allocate revenue from these bundled sales ratably between the subscription services and the management reports based on established list prices for those offerings.
Unearned revenue consists of payments received for prepaid subscriptions from our non-enterprise clients whose terms extend into periods beyond the balance sheet date, as well as the invoiced but not yet earned portion of enterprise contracts and content licenses whose terms extend into periods beyond the balance sheet date.
Fair value of financial instruments
Onvia’s financial instruments consist of cash and cash equivalents, short-term investments, accounts receivable, security deposits, accounts payable, and accrued liabilities. The carrying amounts of the current portion of the financial instruments approximate fair value due to their short maturities. The carrying value of the long-term portion of security deposits approximates fair value as the interest rate is at market value. All investments, when held, are classified as available-for-sale and are reported at fair value based on market quotes, and unrealized gains or losses on these investments are recorded in stockholders’ equity and reported in comprehensive income.
34
Cash, cash equivalents and investments
Onvia considers all highly liquid instruments with remaining maturities at purchase of 90 days or less to be cash equivalents. Investments with remaining maturities at purchase of greater than 90 days and less than 365 days are classified as short-term, and investments with remaining maturities at purchase of 365 days or greater are classified as long-term. All investments are classified as available-for-sale with any gain/loss recorded in comprehensive income.
Management of credit risk
Onvia is subject to concentration of credit risk, primarily from its investments. Onvia manages its credit risk for investments by purchasing investment-grade securities and diversifying its investment portfolio among issuers and maturities. To mitigate its credit risk associated with its investment portfolio in light of the recent downturn in the financial services industry, the Company reallocated all of its investments into FDIC insured or U.S government backed funds as of December 31, 2009.
Property and equipment
Equipment and leasehold improvements are stated at cost, net of accumulated depreciation. Depreciation expense on software, furniture, and equipment is recorded using the straight-line method over estimated useful lives of three to five years. Leasehold improvements are depreciated over the shorter of their useful lives or the remaining term of the underlying lease.
Concurrent with the execution of a termination agreement on the lease for Onvia’s former corporate headquarters building in the third quarter of 2007, the Company adjusted the estimated useful lives of existing leasehold improvements such that their remaining useful lives coincided with the revised termination date of the Company’s lease. As a result, depreciation on these leasehold improvements was accelerated such that they were fully depreciated as of December 31, 2007. Onvia recorded $776,000 in accelerated depreciation expense in 2007 as a result of this change.
The Company periodically evaluates its long-lived assets for impairment in accordance with ASC 360 Property, Plant, and Equipment (previously Statement of Financial Accounting Standards, or SFAS, No. 144, Accounting for the Impairment or Disposal of Long-Lived Assets, or FAS 144). FAS 144 requires that an impairment loss be recognized for assets to be disposed of or held-for-use when the carrying amount of an asset is deemed to not be recoverable. If events or circumstances indicate that any of the Company’s long-lived assets might be impaired, the Company analyzes the estimated undiscounted future cash flows to be generated from the applicable asset. In addition, the Company records an impairment loss to the extent that the carrying value of the asset exceeds the fair value of the asset. Fair value is generally determined using an estimate of discounted future net cash flows from operating activities or upon disposal of the asset. No assets were impaired during the years ended December 31, 2009, 2008 or 2007.
Internal Use Software
ASC 350-40 Intangibles – Goodwill and Other subtopic Internal-Use Software (previously Statement of Position, or SOP, No. 98-1, Accounting for the Costs of Computer Software Developed or Obtained for Internal Use), requires all costs related to the development of internal use software other than those incurred during the application development stage to be expensed as incurred. Costs incurred during the application development stage are required to be capitalized and amortized over the estimated useful life of the software. Capitalized software costs are amortized on a straight-line basis over their expected economic lives, typically 3 to 5 years. Pursuant to ASC 360 Property, Plant, and Equipment, Onvia periodically evaluates the remaining useful lives of internal use software and will record an abandonment if management determines that all or a portion of the asset will no longer be used or will adjust the remaining useful life to reflect revised estimates for impairment in accordance with ASC 360 as described above under “Property and equipment.”
Income taxes
Onvia accounts for income taxes using the asset and liability method. Under this method, deferred tax assets and liabilities are recognized for the estimated future tax consequences attributable to differences between the financial statement carrying amounts of existing assets and liabilities and their respective tax basis, and for net operating loss, or NOL, carryforwards. Deferred tax assets and liabilities are measured using enacted tax rates expected to apply to taxable income in
the years in which those temporary differences are expected to be recovered or settled. A valuation allowance has been established for the full amount of the net deferred tax assets as the Company has determined that the recognition criteria for realization have not been met.
Utilization of the NOL carryforwards may be subject to a substantial annual limitation due to ownership change limitations that may have occurred previously or that could occur in the future provided by Section 382 of the Internal Revenue Code of 1986, as amended (the “Code”). These ownership changes may limit the amount of NOL carryforwards that can be utilized annually to offset future taxable income and tax, respectively. In general, an ownership change, as defined by Section 382 of the Code, results from transactions increasing the ownership of certain stockholders or public groups in the stock of a corporation by more than 50 percentage points over a three-year period.
35
Onvia plans to complete a Section 382 analysis regarding ownership changes that may have occurred, but at this time the Company cannot reasonably estimate whether such a change has occurred. Any carryforwards that will expire prior to utilization as a result of such limitations will be removed from deferred tax assets with a corresponding reduction of the valuation allowance.
Onvia currently has a full valuation allowance for its deferred tax assets as the future realization of the tax benefit is not more likely than not. Based on information currently available, Onvia does not reasonably believe that the unrecognized tax benefit will change significantly within the next twelve months.
Treasury stock
Onvia accounts for treasury stock using the cost method. As of December 31, 2009, the Company held 26 shares of treasury stock with a cost basis of $129. The Company holds the treasury shares to fund matching contributions to its 401K retirement plan for employee contributions. As discussed in Note 12, no treasury shares were used to fund matching contributions for 2009 employee contributions. In March 2009, the Company issued 8,055 treasury shares to fund matching contributions for 2008 employee contributions.
Other comprehensive income or loss
Comprehensive income or loss is the change in equity from transactions and other events and circumstances other than those resulting from investments by and distributions to owners. Other comprehensive loss for Onvia consists of unrealized gains and losses on available-for-sale investments.
Net income or loss per share
Basic earnings per share is calculated by dividing net income or loss for the period by the weighted average shares of common stock outstanding for the period. Diluted earnings per share is calculated by dividing net income per share by the weighted average common stock outstanding for the period plus dilutive potential common shares using the treasury stock method. In periods with a net loss, basic and diluted earnings per share are identical because inclusion of potentially dilutive common shares would be antidilutive.
The following table sets forth the computation of basic and diluted net loss or income per share for the years ended December 31:
|
2009
|
2008
|
2007
|
||||||||||
|
Numerator:
|
||||||||||||
|
Net (loss) / income
|
$ | (547,471 | ) | $ | (3,373,815 | ) | $ | 494,366 | ||||
|
Denominator:
|
||||||||||||
|
Shares used to compute basic net (loss) / income per share
|
8,265,727 | 8,230,355 | 8,086,622 | |||||||||
|
Dilution associated with the Company's stock-based compensation plans
|
- | - | 519,346 | |||||||||
|
Shares used to compute diluted net (loss) / income per share
|
8,265,727 | 8,230,355 | 8,605,968 | |||||||||
|
Basic net (loss) / income per share
|
$ | (0.07 | ) | $ | (0.41 | ) | $ | 0.06 | ||||
|
Diluted net (loss) / income per share
|
$ | (0.07 | ) | $ | (0.41 | ) | $ | 0.06 | ||||
For the years ended December 31, 2009 and 2008, options and warrants to purchase 1,887,357 and 1,966,323 shares of common stock, respectively, are excluded from the calculation because they would have been anti-dilutive since Onvia was in a net loss position. Comparatively, for the year ended December 31, 2007, options and warrants to purchase 835,860 shares of common stock with exercise prices greater than the twelve month average fair market value of our stock of $7.88 were not included in the calculation because the effect would have been anti-dilutive.
New accounting pronouncements
In June, 2009, the Financial Accounting Standards Board, or FASB, issued Statement of Financial Accounting Standard, or SFAS, No. 168, The FASB Accounting Standards Codification and the Hierarchy of Generally Accepted Accounting Principles, also known as FASB Accounting Standards Codification, or ASC 105, Generally Accepted Accounting Principles. ASC 105 establishes the exclusive authoritative reference for U.S. GAAP for use in financial statements, except for Securities and Exchange Commission rules and interpretive releases, which are also authoritative GAAP for Securities and Exchange Commission, or SEC, registrants. The Codification supersedes all existing non-SEC accounting and reporting standards. Going forward, the FASB will not issue new standards in the form of Statements, FASB Staff Positions or Emerging Issues Task Force Abstracts. Instead, it will issue Accounting Standards Updates, or ASU, which will serve to update the Codification, provide background information about the guidance and provide the basis for conclusions on the changes to the Codification. This Statement was effective for interim and annual periods ending after September 15, 2009. We adopted the provisions of this Statement in the third quarter of 2009 and have included references to the Codification, as appropriate, in these financial statements. Adoption of this Statement did not have a material impact on our financial position, cash flows, or results of operations.
36
In February 2010, the FASB issued ASU No. 2010-09, Subsequent Events (Topic 855) – Amendments to Certain Recognition and Disclosure Requirements. This ASU amends Topic 855, Subsequent Events, to eliminate the requirement for SEC filers to disclose the date through which subsequent events have been evaluated. This amendment addresses concerns that the guidance in Topic 855 potentially conflicts with some of the SEC’s guidance. This update is effective for all entities and was effective upon issuance. Adoption of this ASU did not have a material impact on our financial position, cash flows, or results of operations.
In January 2010, the FASB issued ASU No. 2010-06, Improving Disclosures About Fair Value Measurements, which requires reporting entities to make new disclosures about recurring or nonrecurring fair-value measurements including significant transfers into and out of Level 1 and Level 2 fair-value measurements and information on purchases, sales, issuances, and settlements on a gross basis in the reconciliation of Level 3 fair-value measurements. ASU 2010-06 is effective for annual reporting periods beginning after December 15, 2009, except for Level 3 reconciliation disclosures which are effective for annual periods beginning after December 15, 2010. We adopted the provisions related to Level 1 and Level 2 fair-value measurements in the fourth quarter of 2009. Adoption of ASU 2010-06 did not have a material impact on our results of operations or financial position and we do not expect adoption of the Level 3 provisions to have a material impact on our financial position, cash flows, or results of operations.
In October 2009, the FASB issued ASU No. 2009-13, Multiple-Deliverable Revenue Arrangements. This ASU establishes the accounting and reporting guidance for arrangements including multiple revenue-generating activities. This ASU provides amendments to the criteria for separating deliverables, measuring and allocating arrangement consideration to one or more units of accounting. The amendments in this ASU also establish a selling price hierarchy for determining the selling price of a deliverable. Significantly enhanced disclosures are also required to provide information about a vendor’s multiple-deliverable revenue arrangements, including information about the nature and terms, significant deliverables, and its performance within arrangements. The amendments also require providing information about the significant judgments made and changes to those judgments and about how the application of the relative selling-price method affects the timing or amount of revenue recognition. The amendments in this ASU are effective prospectively for revenue arrangements entered into or materially modified in the fiscal years beginning on or after June 15, 2010. Early application is permitted. The Company is currently evaluating this new ASU.
In May 2009, the FASB issued ASC 855 Subsequent Events (previously FAS 165, Subsequent Events). This Statement establishes general standards of accounting for and disclosure of events that occur after the balance sheet date, but before financial statements are issued or are available to be issued. ASC 855 sets forth the period after the balance sheet date during which management shall evaluate events or transactions that may occur for potential recognition or disclosure in the financial statements, the circumstances under which we shall recognize such events or transactions in Onvia’s financial statements, and the disclosures required about such events or transactions. ASC 855 was amended in February 2010 by ASU 2010-09 (discussed above) to eliminate the requirement to disclose the date through which subsequent events have been evaluated. ASC 855 is effective for interim or annual financial periods ending after June 15, 2009 and Onvia adopted the provisions of this standard in the second quarter of 2009. Adoption of this ASC did not have a material impact on Onvia’s financial position, cash flows, or results of operations.
In April 2009, the FASB issued ASC 820, Fair Value Measurements and Disclosures (previously FSP 157-4, Determining Fair Value When the Volume and Level of Activity for the Asset or Liability Have Significantly Decreased and Identifying Transactions That Are Not Orderly). ASC 820 provides additional guidance for estimating fair value when the volume and level of activity for the asset or liability have significantly decreased, and includes guidance on identifying circumstances that indicate a transaction is not orderly. In addition, ASC 820 requires disclosure in interim and annual periods of the inputs and valuation techniques used to measure fair value and a discussion of changes in valuation techniques. This ASC is effective for interim and annual reporting periods ending after June 15, 2009. The adoption of this ASC did not have a material impact on Onvia’s financial position, cash flows, or results of operations.
37
In April 2009, the FASB issued ASC 320, Investments – Debt and Equity Securities (previously FSP 115-2, Recognition and Presentation of other-Than-Temporary Impairments). ASC 320 amends the other-than-temporary impairment guidance in U.S. GAAP for debt securities to make the guidance more operational and to improve the presentation and disclosure of other-than-temporary impairments on debt and equity securities in the financial statements and is effective for interim and annual reporting periods ending after June 15, 2009. This ASC does not amend existing recognition and measurement guidance related to other-than-temporary impairments of equity securities. Onvia has evaluated the debt securities held at December 31, 2009 and the Company does not believe that the securities are impaired. Adoption of this ASC did not have a significant impact on the Company’s financial position, cash flows, or results of operations.
In April 2009, the FASB issued ASC 825, Financial Instruments (previously FSP 107-1, Interim Disclosures about Fair Value of Financial Instruments), to require disclosure about fair value of financial instruments for interim reporting periods of publicly traded companies as well as in annual financial statements. ASC 825 also amends ASC 270, Interim Reporting (previously APB Opinion No. 28, Interim Financial Reporting) to require those disclosures in summarized financial information at interim reporting periods. This ASC is effective for interim reporting periods ending after June 15, 2009. Adoption of this ASC did not have a material impact on the Company’s financial position, cash flows, or results of operations. See Note 3 for disclosure about the fair value of financial instruments held at December 31, 2009.
|
Note 2:
|
Stock-Based Compensation and Stock Option Activity
|
Pursuant to the provisions of ASC 718 Compensation – Stock Compensation (previously SFAS No. 123R, Share-Based Payment), or ASC 718, Onvia measures compensation cost for all stock-based awards at fair value on the date of grant. The fair value of stock options is determined using the Black-Scholes valuation model. Such value is recognized as expense over the service period, net of estimated forfeitures. The estimation of stock awards that will ultimately vest requires judgment, and to the extent actual results or updated estimates differ from the Company’s current estimates, such amounts will be recorded as a cumulative adjustment in the period estimates are revised. Management considers many factors when estimating expected forfeitures, including employee class, historical experience and expected future activity. Actual results, and future changes in estimates, may differ substantially from management’s current estimates.
Stock-Based Benefit Plans
Onvia, Inc. 2008 Equity Incentive Plan
The Onvia, Inc. 2008 Equity Incentive Plan, or the 2008 Plan, was adopted in September 2008 and it amended and restated the previous 1999 Stock Option Plan, or the 1999 Plan. Shares that were outstanding from the 1999 Plan are now considered outstanding under the 2008 Plan. The 2008 Plan provides for the issuance of incentive and nonqualified common stock options, stock awards, restricted stock, restricted stock units and stock appreciation rights. Awards under this plan can be granted for ten years after the adoption date. The 2008 Plan requires that the exercise price for all options to be at least 100% of the fair market value of the underlying shares on the date of grant. The 2008 Plan contains specific provisions that govern awards in the event of a change in control and provides for compliance with the requirements of Section 409A of the Internal Revenue Code to the extent that awards are treated as deferred compensation. All employees, officers, directors and consultants of Onvia are eligible to participate in the 2008 Plan, although it is not anticipated that every eligible employee or consultant will receive awards. Options under this plan vest in increments over time, but typically have either a four or five year vesting schedule, normally with 25% or 20%, respectively, vesting one year from the grant date and ratable monthly vesting thereafter. The total number of options outstanding and the number of shares available for issuance under the 2008 Plan as of December 31, 2009 were 1,834,357 and 406,734, respectively.
2000 Directors’ Stock Option Plan
In March 2000, Onvia adopted a Directors’ Stock Option Plan or the Directors’ Plan. This plan expired on February 28, 2010. Options granted under this plan will remain active and will continue to vest according to the original grant provisions. Grants were made under this plan to each eligible board member on the date such person was first elected or appointed as a board member. At each annual stockholders’ meeting, each non-employee director was granted an additional option to purchase 1,000 shares of common stock under the Directors’ Plan, provided such person had been a board member of Onvia for at least the prior six months. The initial option grants under the Directors’ Plan vested 25% each year for four years on the anniversary of the date of grant, had a term of ten years, and an exercise price equal to the closing price of Onvia’s stock on the grant date. The annual grants vest in full one year from the date of grant, have a ten year life, and an exercise price equal to the closing price on the date of grant. As of December 31, 2008, all shares available for issuance under the Directors’ Plan had been granted. Accordingly, on October 23, 2008, the Board of Directors approved the stock option grants with the same terms described above (historically made under our Directors’ Plan) under the Company’s 2008 Equity Incentive Plan.
38
Employee Stock Purchase Plan
In May 2000, Onvia adopted the 2000 Employee Stock Purchase Plan, or ESPP, and initially authorized 60,000 shares of common stock for issuance under the ESPP. Each year, the number of shares authorized for issuance under the ESPP is increased by the lesser of: 1% of the total number of shares of common stock then outstanding; 60,000 shares; or a lesser number of shares as determined by the Board of Directors. Under the ESPP, an eligible employee may purchase shares of Onvia common stock, based on certain limitations, at a price equal to the lesser of 85% of the fair market value of the common stock at the beginning or end of the respective offering period. This plan is compensatory under the provisions of ASC 718 and the fair value of purchases under the ESPP is recognized as compensation expense over the term of the awards. The ESPP purchases shares on a semi-annual basis. The total number of shares authorized for future issuance under the ESPP as of December 31, 2009 was 521,282 shares.
Impact on Results of Operations
The impact on Onvia’s results of operations of recording stock-based compensation for the years ended December 31 was as follows:
|
2009
|
2008
|
2007
|
||||||||||
|
Cost of sales
|
$ | 16,772 | $ | 9,687 | $ | 14,013 | ||||||
|
Sales and marketing
|
173,290 | 199,042 | 311,256 | |||||||||
|
Technology and development
|
80,805 | 133,498 | 125,660 | |||||||||
|
General and administrative
|
177,769 | 375,898 | 476,373 | |||||||||
|
Total stock-based compensation
|
$ | 448,635 | $ | 718,125 | $ | 927,302 | ||||||
Valuation Assumptions
Onvia calculated the fair value of each option award on the date of grant using the Black-Scholes valuation model. The following weighted average assumptions were used for options granted in the years ending December 31:
|
2009
|
2008
|
2007
|
||||||||||
|
Average risk free rate
|
2.25 | % | 2.55 | % | 4.15 | % | ||||||
|
Estimated volatility
|
48 | % | 40 | % | 44 | % | ||||||
|
Expected dividends
|
0 | % | 0 | % | 0 | % | ||||||
|
Expected life (in years)
|
4.9 | 4.8 | 4.7 | |||||||||
The fair value of each employee purchase under the ESPP is estimated on the first day of each purchase period using the Black-Scholes valuation model. Purchase periods begin on May 1 and November 1 of each year. The following weighted average assumptions were used for purchase periods beginning during the years ended December 31 under the ESPP:
|
2009
|
2008
|
2007
|
||||||||||
|
Average risk free rate
|
0.24 | % | 1.32 | % | 4.03 | % | ||||||
|
Estimated volatility
|
85 | % | 47 | % | 25 | % | ||||||
|
Expected dividends
|
0 | % | 0 | % | 0 | % | ||||||
|
Expected life (in years)
|
0.5 | 0.5 | 0.5 | |||||||||
Risk-Free Interest Rate
The average risk free interest rate was determined based on the market yield for U.S. Treasury securities for the expected term of the grant at the time of grant.
Expected Volatility
FAS 123R requires companies to estimate expected volatility over the expected term of the options granted.
Management used the historical volatility of Onvia’s common stock to estimate the future volatility of its common stock for purposes of estimating the fair value of options granted during 2009.
39
Dividends
Management does not currently intend to pay dividends; therefore, this assumption is set at 0%.
Expected Life
Onvia’s computation of expected life was determined based on historical experience of similar awards, giving consideration to the contractual terms of the awards, vesting schedules and expectations of future employee behavior. Onvia’s historical experience is limited, because the Company does not have complete life-cycle information on any of its options; therefore, management was required to estimate future exercise and cancellation behavior, generally by assuming that remaining shares would be exercised or cancelled ratably over their remaining contractual term, adjusted for certain expectations of future employee behavior. Management examined the behavior patterns separately for distinct groups of employees that have similar historical experience.
Stock Option Activity
The following table summarizes activity under Onvia’s equity incentive plans for the year ended December 31, 2009:
|
Options Outstanding
|
Weighted Average Exercise Price
|
Weighted Average Remaining Contractual Term (in years)
|
Aggregate Intrinsic Value (1)
|
|||||||||||||
|
Total options outstanding at December 31, 2008
|
1,916,382 | $ | 8.48 | |||||||||||||
|
Options granted
|
48,000 | 4.94 | ||||||||||||||
|
Options exercised
|
(10,284 | ) | 2.50 | |||||||||||||
|
Options forfeited and cancelled
|
(66,741 | ) | 6.82 | |||||||||||||
|
Total options outstanding at December 31, 2009
|
1,887,357 | $ | 8.48 | 4.86 | $ | 3,348,291 | ||||||||||
|
Options exercisable at December 31, 2009
|
1,631,134 | $ | 8.56 | 4.34 | $ | 3,041,811 | ||||||||||
|
Options vested and expected to vest at December 31, 2009
|
1,862,227 | $ | 8.49 | 4.81 | $ | 3,318,405 | ||||||||||
|
|
(1) Aggregate intrinsic value is calculated as the difference between the exercise price of the underlying awards and the quoted price of Onvia’s common stock of $7.87 at December 31, 2009 for options that were in-the-money at December 31, 2009. The number of in-the-money options outstanding and exercisable at December 31, 2009 was 962,201 and 845,141, respectively.
The weighted average grant date fair value of options granted during the years ended December 31, 2009, 2008 and 2007 was $2.16, $2.13 and $2.85 per share, respectively. The total intrinsic value of options exercised during the years ended December 31, 2009, 2008 and 2007 was $27,988, $25,102 and $740,269, respectively.
As of December 31, 2009, there was approximately $269,740 of unrecognized compensation cost related to unvested stock options and estimated purchases under the ESPP. That cost is expected to be recognized over a weighted average period of 1.38 years.
During the year ended December 31, 2009, approximately $82,000 was received for exercises of stock options and purchases under Onvia’s ESPP.
40
|
Note 3:
|
Short-Term Investments
|
In accordance with ASC 320, Investments – Debt and Equity Securities (previously SFAS 115, Accounting for Certain Investments in Debt and Equity Securities), Onvia classifies short-term investments in debt securities as available-for-sale at December 31, 2009, stated at fair value as summarized in the following table:
|
Amortized Cost
|
Gross Unrealized Gains
|
Gross Unrealized Losses
|
Fair Value
|
|||||||||||||
|
U.S. Government backed securities
|
$ | 10,416,263 | $ | 1,008 | $ | (4,165 | ) | $ | 10,413,106 | |||||||
|
Certificate of deposit
|
2,216,000 | - | - | 2,216,000 | ||||||||||||
| $ | 12,632,263 | $ | 1,008 | $ | (4,165 | ) | $ | 12,629,106 | ||||||||
Onvia accounts for short-term investments in accordance with ASC 820, Fair Value Measurements and Disclosures (previously SFAS No. 157, Fair Value Measurements), as amended by ASU No. 2010-06, Fair Value Measurements and Disclosures (Topic 820) – Improving Disclosures about Fair Value Measurements, which defines fair value as the exchange price that would be received for an asset, or paid to transfer a liability (an exit price), in the principal or most advantageous market for the asset or liability in an orderly transaction between market participants on the measurement date. ASC 820 also establishes a fair value hierarchy, which requires an entity to maximize the use of observable inputs and minimize the use of unobservable inputs when measuring fair value. The standard describes three levels of inputs that may be used to measure fair value:
Level 1 – Quoted prices in active markets for identical assets or liabilities;
Level 2 – Observable inputs other than Level 1 prices such as quoted prices for similar assets or liabilities; quoted prices in markets that are not active; or other inputs that are observable or can be corroborated by observable market data for substantially the full term of the assets or liabilities; and
Level 3 – Unobservable inputs that are supported by little or no market activity and that are significant to the fair value of the assets or liabilities.
Onvia uses the market approach to measure fair value for its financial assets and liabilities. The market approach uses prices and other relevant information generated by market transactions involving identical or comparable assets or liabilities. The following table summarizes, by major security type, short-term investments classified as available-for-sale at December 31, 2009, stated at fair value:
|
Level 1
|
Level 2
|
Level 3
|
Balance as of December 31, 2009
|
|||||||||||||
|
Description
|
||||||||||||||||
|
U.S. Government backed securities
|
$ | - | $ | 10,413,106 | $ | - | $ | 10,413,106 | ||||||||
|
Certificate of Deposit
|
- | 2,216,000 | - | 2,216,000 | ||||||||||||
| $ | - | $ | 12,629,106 | $ | - | $ | 12,629,106 | |||||||||
There were no transfers in or out of Level 1 or Level 2 investments during the fourth quarter of 2009, and there was no activity in Level 3 fair value measurements during that period.
41
|
Note 4:
|
Prepaid Expenses and Other Current Assets
|
Prepaid expenses and other current assets consist of the following at December 31:
|
2009
|
2008
|
|||||||
|
Prepaid expenses
|
$ | 673,119 | $ | 775,281 | ||||
|
Interest and other receivable
|
43,100 | 4,556 | ||||||
|
Other
|
- | 6,080 | ||||||
| $ | 716,219 | $ | 785,917 | |||||
|
Note 5:
|
Security Deposits
|
Pursuant to the lease obligation for Onvia’s former corporate headquarters building the Company was required to maintain a deposit in the amount of $3.5 million through the remaining term of the lease, which originally expired in April 2010; however, in July 2007 the Company executed an agreement with its landlord to terminate the lease obligation on that building effective January 11, 2008. The $3.5 million security deposit was returned to the Company in March 2008 as a result of this termination.
Pursuant to Onvia’s current lease for corporate office space, Onvia provided a security deposit of $538,000, which is reduced annually on a straight line basis over a four year period beginning with the first anniversary of the commencement date. In March 2008 and 2009, $135,000 was returned to the Company, representing the first and second of the four annual reductions.
|
Note 6:
|
Property and Equipment
|
Property and equipment consists of the following at December 31:
|
2009
|
2008
|
|||||||
|
Computer equipment
|
$ | 2,786,604 | $ | 2,629,459 | ||||
|
Software
|
1,089,334 | 1,058,671 | ||||||
|
Furniture and fixtures
|
98,528 | 97,873 | ||||||
|
Leasehold improvements
|
709,921 | 706,088 | ||||||
|
|
||||||||
|
Total cost basis
|
4,684,387 | 4,492,091 | ||||||
|
Less accumulated depreciation and amortization
|
(3,458,551 | ) | (2,781,945 | ) | ||||
|
Net book value
|
$ | 1,225,836 | $ | 1,710,146 | ||||
|
Note 7:
|
Accrued Expenses
|
Accrued expenses consist of the following at December 31:
|
2009
|
2008
|
|||||||
|
Payroll and related liabilities
|
$ | 1,102,174 | $ | 1,172,038 | ||||
|
Accrued professional fees
|
15,118 | 49,370 | ||||||
|
State income and other taxes payable
|
150,986 | 269,258 | ||||||
| $ | 1,268,278 | $ | 1,490,666 | |||||
42
|
Note 8:
|
Interest and Other Income, net
|
Net interest and other income consisted of the following for the years ended December 31:
|
2009
|
2008
|
2007
|
||||||||||
|
Interest income
|
$ | 41,347 | $ | 447,493 | $ | 1,008,733 | ||||||
|
Interest expense
|
(8,940 | ) | (20,468 | ) | (15,561 | ) | ||||||
|
Other (expense) / income
|
19,354 | 6,128 | (10,891 | ) | ||||||||
| $ | 51,761 | $ | 433,153 | $ | 982,281 | |||||||
Interest income in 2009 is significantly lower than prior years, because the majority of the Company’s investments were in US Treasury funds, FDIC insured funds, or U.S. government backed funds, which have a lower rate of return than corporate debt securities and commercial paper, which comprised the majority of the investments during 2008 and 2007, but present a lower risk of default given the current economic climate.
|
Note 9:
|
Income Taxes
|
At December 31, 2009, 2008 and 2007, Onvia had tax net operating loss carryforwards of $252,288,270, $250,015,430 and $247,081,988, respectively, which may be used to offset future taxable income. The remaining carryforwards expire at various dates beginning in 2018 through 2029. The utilization of the net operating loss may be subject to annual limitations due to ownership changes of stock in prior years.
The provision for income taxes is different from that which would be obtained by applying the statutory federal income tax rate as follows:
|
Year ended
|
Year ended
|
Year ended
|
Year ended
|
|||||||||||||
|
December 31,
|
December 31,
|
December 31,
|
December 31,
|
|||||||||||||
|
2009
|
2008
|
2007
|
2006
|
|||||||||||||
|
Tax (benefit) / expense at statutory rate
|
(34.0 | %) | (34.0 | %) | 34.0 | % | (34.0 | %) | ||||||||
|
Stock-based compensation
|
9.4 | % | 3.1 | % | (15.1 | %) | 2.7 | % | ||||||||
|
Amortization of Goodwill
|
(3.1 | %) | (0.5 | %) | (3.4 | %) | (0.2 | %) | ||||||||
|
Other
|
3.9 | % | 1.2 | % | 6.9 | % | 0.4 | % | ||||||||
|
Increase / (decrease) in Valuation Allowance
|
23.8 | % | 30.2 | % | (22.4 | %) | 31.1 | % | ||||||||
| 0.0 | % | 0.0 | % | 0.0 | % | 0.0 | % | |||||||||
Onvia’s net deferred tax assets, calculated by applying the U.S. federal statutory income tax rate of 34% to total deferrals, consist of the following at December 31:
|
December 31,
|
December 31,
|
December 31,
|
||||||||||
|
2009
|
2008
|
2007
|
||||||||||
|
Net operating loss carryforward
|
85,778,013 | 85,005,247 | 84,007,877 | |||||||||
|
Prepaid expenses and other assets currently deductible
|
(230,270 | ) | (225,570 | ) | (128,249 | ) | ||||||
|
Accrued expenses not currently deductible
|
1,299,088 | 1,300,279 | 815,507 | |||||||||
|
Depreciation different for tax purposes
|
(850,967 | ) | (214,436 | ) | 1,397,935 | |||||||
|
Net deferred tax asset
|
85,995,864 | 85,865,520 | 86,093,070 | |||||||||
|
Less: Valuation allowance
|
(85,995,864 | ) | (85,865,520 | ) | (86,093,070 | ) | ||||||
|
Net deferred tax asset
|
0 | 0 | 0 | |||||||||
Onvia has recorded a full valuation allowance equal to the net deferred tax asset balance based upon management’s determination that the realization is not more likely than not.
|
Note 10:
|
Idle Lease Accrual
|
In July 2007, Onvia entered into a Tri-Party Agreement with its landlord and a third-party to terminate Onvia’s obligations under its former office lease. The termination was effective January 11, 2008. As a result of the lease termination, Onvia reversed approximately $2.7 million of its idle lease accrual during the third quarter of 2007. The reversal represented the remaining idle lease obligation from the January 2008 termination date through the April 2010 expiration date of the original lease, and was recorded as a reduction to operating expenses.
43
There was no activity in this accrual in the years ended December 31, 2009 and December 31, 2008. The following table displays a rollforward of the idle lease accrual for the year ended December 31, 2007:
|
Accruals at
|
Paid, Net
|
Accruals at
|
||||||||||||||
|
December 31,
|
2007
|
of Sublease
|
December 31,
|
|||||||||||||
|
2006
|
Reduction
|
Income
|
2007
|
|||||||||||||
|
Real estate and other exit costs
|
$ | 3,779,215 | $ | (2,652,550 | ) | $ | (1,126,665 | ) | $ | - | ||||||
|
Note 11:
|
Commitments and Contingencies
|
Operating leases
Total rent expense was $846,976, $835,057 and $1,027,664 for the years ended December 31, 2009, 2008 and 2007, respectively, excluding idle lease charges.
Onvia also has a non-cancellable operating lease for office equipment, which expires in July 2014.
Future minimum lease payments required on noncancellable operating leases are as follows for the years ending December 31:
|
Real Estate
|
Office Equipment
|
Total
|
||||||||||
|
Operating Leases
|
Operating Lease
|
Operating Leases
|
||||||||||
|
2010
|
$ | 926,034 | $ | 18,251 | $ | 944,285 | ||||||
|
2011
|
953,815 | 18,251 | 972,066 | |||||||||
|
2012
|
982,430 | 18,251 | 1,000,681 | |||||||||
|
2013
|
1,011,903 | 18,251 | 1,030,154 | |||||||||
|
2014
|
1,042,260 | 10,649 | 1,052,909 | |||||||||
|
Thereafter
|
894,171 | - | 894,171 | |||||||||
| $ | 5,810,613 | $ | 83,653 | $ | 5,894,266 | |||||||
Capital Leases
In June 2007, Onvia entered into non-cancellable capital leases for server equipment and maintenance related to this equipment. Remaining future minimum lease payments required on these capital leases are as follows for the years ending December 31:
|
Principal
|
Interest
|
Total
|
||||||||||
|
2010
|
$ | 6,174 | $ | 197 | $ | 6,371 | ||||||
|
Thereafter
|
- | - | - | |||||||||
| $ | 6,174 | $ | 197 | $ | 6,371 | |||||||
Purchase Obligations
Onvia has noncancellable purchase obligations for software development and license agreements, co-location hosting arrangements, telecom agreements, marketing agreements and third-party content agreements. The agreements expire in dates ranging from 2010 to 2012. Future required payments under these non-cancellable agreements are as follows for the years ending December 31:
|
Purchase
|
||||
|
Obligations
|
||||
|
2010
|
$ | 1,190,322 | ||
|
2011
|
80,000 | |||
|
Thereafter
|
6,667 | |||
| $ | 1,276,989 | |||
44
Legal Proceedings
Class Action Securities Litigation
In 2001, five securities class action suits were filed against Onvia, certain former executive officers, and the lead underwriter of Onvia’s Initial Public Offering, or IPO, Credit Suisse First Boston, or CSFB. The suits were filed in the U.S. District Court for the Southern District of New York on behalf of all persons who acquired securities of Onvia between March 1, 2000 and December 6, 2000. In 2002, a consolidated complaint was filed. The complaint charged defendants with violations of Sections 10(b) and 20(a) of the Securities Exchange Act of 1934 (and Rule 10b-5 promulgated thereunder) and Sections 11 and 15 of the Securities Act of 1933, for issuing a Registration Statement and Prospectus that failed to disclose and contained false and misleading statements regarding certain commissions purported to have been received by the underwriters, and other purported underwriter practices in connection with their allocation of shares in the offering. The complaint sought an undisclosed amount of damages, as well as attorneys’ fees. This action is being coordinated with approximately 300 other nearly identical actions filed against other companies. At the Court’s request, plaintiffs selected six “focus” cases, which do not include Onvia. The Court indicated that its decisions in the six focus cases are intended to provide guidance for the parties in the remaining cases.
The parties in the coordinated cases, including Onvia’s case, reached a settlement. The insurers for the issuer defendants in the coordinated cases will make the settlement payment on behalf of the issuers, including Onvia. On October 5, 2009, the Court granted final approval of the settlement. A group of three objectors to the settlement filed a petition to the Second Circuit seeking permission to appeal the District Court’s final approval order. Plaintiffs filed an opposition to the petition. Six notices of appeal to the Second Circuit have also been filed by different groups of objectors, including the objectors that filed the petition. The time to file additional notices of appeal has ended. The briefing schedule for the appeals has not been set.
Due to the inherent uncertainties of litigation, we cannot accurately predict the ultimate outcome of this matter. If the settlement does not survive appeal and Onvia is found liable, we are unable to estimate or predict the potential damages that might be awarded, whether such damages would be greater than Onvia’s insurance coverage, and whether such damages would have a material impact on our results of operations or financial condition in any future period.
On October 2, 2007, Vanessa Simmonds, a purported stockholder of Onvia, filed suit in the U.S. District Court for the Western District of Washington against Credit Suisse Group, JPMorgan Chase & Co. and Bank of America Corporation, the lead underwriters of Onvia’s IPO in March 2000, alleging violations of Section 16(b) of the Securities Exchange Act of 1934. The complaint alleges that the combined number of shares of Onvia's common stock beneficially owned by the lead underwriters and certain unnamed officers, directors, and principal stockholders exceeded ten percent of its outstanding common stock from the date of Onvia’s IPO on March 2, 2000, through at least February 28, 2001. It further alleges that those entities and individuals were thus subject to the reporting requirements of Section 16(a) and the short-swing trading prohibition of Section 16(b), and failed to comply with those provisions. The complaint seeks to recover from the lead underwriters any "short-swing profits" obtained by them in violation of Section 16(b). Onvia was named as a nominal defendant in the action, but has no liability for the asserted claims. No directors or officers of Onvia are named as defendants in this action. On October 29, 2007, the case was reassigned to Judge James L. Robart along with fifty-four other Section 16(b) cases seeking recovery of short-swing profits from underwriters in connection with various initial public offerings. On February 25, 2008, Ms. Simmonds filed an Amended Complaint asserting substantially similar claims as those set forth in the initial complaint. Onvia waived service. On July 25, 2008, Onvia joined with 29 other issuers to file the Issuer Defendants' Joint Motion to Dismiss. Underwriter Defendants also filed a Joint Motion to Dismiss on July 25, 2008. Plaintiff filed oppositions to both motions on September 8, 2008. All replies in support of the motions to dismiss were filed on October 23, 2008. Oral argument on the motions to dismiss was held on January 16, 2009. On March 12, 2009, the Court granted the Issuer Defendants' Joint Motion to Dismiss, dismissing the complaint without prejudice on the grounds that Ms. Simmonds had failed to make an adequate demand on Onvia prior to filing her complaint. In its order, the Court stated it would not permit Plaintiff to amend her demand letters while pursuing her claims in the litigation. Because the Court dismissed the case on the ground that it lacked subject matter jurisdiction, it did not specifically reach the issue of whether Plaintiff's claims were barred by the applicable statute of limitations. However, the Court also granted the Underwriters' Joint Motion to Dismiss with respect to cases involving non-moving issuers, holding that the cases were barred by the applicable statute of limitations because the issuers' shareholders had notice of the potential claims more than five years prior to filing suit.
45
Ms. Simmonds filed a Notice of Appeal on March 31, 2009, and an Amended Notice of Appeal on April 10, 2009. The underwriters subsequently filed a Notice of Cross-Appeal, arguing that the dismissal of the claims involving the moving issuers should have been with prejudice because the claims were untimely under the applicable statute of limitations. Ms. Simmonds' opening brief in the appeal was filed on August 26, 2009; Onvia and the underwriters’ responses and the underwriters' brief in support of their cross-appeal were filed on October 2, 2009; Ms. Simmonds' reply brief and opposition to the cross-appeal was filed on November 2, 2009; and the underwriters' reply brief in support of their cross-appeals was filed on November 17, 2009. Onvia does not currently believe that the outcome of this litigation will have a material adverse impact on its consolidated financial position and results of operations.
Potential Future Litigation
In addition to the above matters, from time to time Onvia is subject to various other legal proceedings that arise in the ordinary course of business. While management does not believe that the disposition of any or all of these other matters will have a material adverse effect on Onvia’s financial position, results of operations, or cash flows, the ultimate outcomes are inherently uncertain.
|
Note 12:
|
Employee Retirement Plan
|
In March 2000, Onvia adopted a Savings and Retirement Plan (the “Retirement Plan”) which is a defined contribution plan. The Retirement Plan is a qualified salary reduction plan in which all eligible employees may elect to have a percentage of their pre-tax compensation contributed to the Retirement Plan, subject to certain guidelines issued by the Internal Revenue Service.
In January 2006, the Retirement Plan was amended to add a discretionary matching contribution, made in Onvia common stock, up to 25% of every dollar up to 6% of all eligible employee contributions. The matching contributions are subject to a four year vesting schedule, with vesting measured from the employee’s date of hire. The Company’s Board of Directors have the sole discretion to make matching contributions in the first quarter following each Plan year, and employees must be employed on the last day of the Plan year to be eligible to receive the matching contribution. As of December 31, 2009, only 26 shares were available in treasury. The timing of Onvia’s fourth quarter earnings release coincided with a voluntary black-out period for insider trading of Onvia stock. As a result, the Company did not purchase additional shares to fund the match for 2009 employee contributions. Since the 26 treasury shares held were insufficient to fund the match, the company transferred approximately $64,000 in cash in lieu of shares to fund the matching contribution. In March 2009, Onvia transferred 8,055 shares from treasury stock into the Retirement Plan to match 2008 employee contributions. The Company recorded $82,000 and $51,000 in non-cash stock-based compensation in 2009 and 2008, respectively, related to this match.
|
Note 13:
|
Stockholders’ Equity
|
Authorized shares
At December 31, 2009, the number of authorized shares is 13,000,000 with a par value of $0.0001 per share. Authorized shares are comprised of 11,000,000 shares of common stock and 2,000,000 shares of undesignated preferred stock.
|
Note 14:
|
Supplemental Cash Flow Information
|
Onvia paid approximately $9,000, $20,000 and $16,000 in interest expense on capital leases during the years ended December 31, 2009, 2008 and 2007, respectively.
|
Note 15:
|
Subsequent Event
|
In February 2010, Onvia ended its employment relationship with Michael Tannourji, it’s former Vice President of Sales. Mr. Tannourji’s departure was not due to any disagreements with the Company’s management or the Board. Pursuant to Mr. Tannourji’s original employment agreement, his separation agreement stipulates that Onvia will make severance payments totaling $112,500, benefit payments of $7,069, and $12,260 for accrued but unused vacation. These payments were made in March 2010.
46
Selected Quarterly Financial Information (Unaudited)
The following tables summarize the quarterly financial data for the years ended December 31, 2009 and 2008:
|
Three Months Ended
|
||||||||||||||||
|
March 31,
|
June 30,
|
September 30,
|
December 31,
|
|||||||||||||
|
2009
|
2009
|
2009
|
2009
|
|||||||||||||
|
(in thousands, except per share amounts)
|
||||||||||||||||
|
Historical Consolidated Statements of Operations and Comprehensive Loss Data:
|
||||||||||||||||
|
Revenue
|
$ | 5,887 | $ | 6,216 | $ | 6,612 | $ | 6,922 | ||||||||
|
Gross margin
|
4,662 | 4,988 | 5,452 | 5,857 | ||||||||||||
|
Stock-based compensation
|
115 | 102 | 67 | 165 | ||||||||||||
|
Total operating expenses
|
5,295 | 5,193 | 5,300 | 5,770 | ||||||||||||
|
(Loss) / income from operations
|
(633 | ) | (205 | ) | 152 | 87 | ||||||||||
|
Net (loss) / income
|
$ | (631 | ) | $ | (197 | ) | $ | 167 | $ | 114 | ||||||
|
Unrealized (loss)/gain on available-for-sale investments
|
- | (1 | ) | 2 | (4 | ) | ||||||||||
|
Comprehensive (loss) / income
|
(631 | ) | (198 | ) | 169 | 109 | ||||||||||
|
Basic net (loss) / income per common share
|
$ | (0.08 | ) | $ | (0.02 | ) | $ | 0.02 | $ | 0.01 | ||||||
|
Diluted net (loss) / income per common share
|
$ | (0.08 | ) | $ | (0.02 | ) | $ | 0.02 | $ | 0.01 | ||||||
|
Basic weighted average shares outstanding
|
8,248 | 8,262 | 8,271 | 8,280 | ||||||||||||
|
Diluted weighted average shares outstanding
|
8,248 | 8,262 | 8,570 | 8,580 | ||||||||||||
|
Three Months Ended
|
||||||||||||||||
|
March 31,
|
June 30,
|
September 30,
|
December 31,
|
|||||||||||||
|
2008
|
2008
|
2008
|
2008
|
|||||||||||||
|
(in thousands, except per share amounts)
|
||||||||||||||||
|
Historical Consolidated Statements of Operations and Comprehensive Loss Data:
|
||||||||||||||||
|
Revenue
|
$ | 5,347 | $ | 5,118 | $ | 5,166 | $ | 5,511 | ||||||||
|
Gross margin
|
4,311 | 3,993 | 4,100 | 4,412 | ||||||||||||
|
Stock-based compensation
|
216 | 214 | 130 | 158 | ||||||||||||
|
Total operating expenses
|
4,931 | 5,381 | 5,030 | 5,281 | ||||||||||||
|
Loss from operations
|
(620 | ) | (1,388 | ) | (930 | ) | (869 | ) | ||||||||
|
Net loss
|
$ | (445 | ) | $ | (1,252 | ) | $ | (831 | ) | $ | (846 | ) | ||||
|
Comprehensive loss
|
(445 | ) | (1,252 | ) | (831 | ) | (846 | ) | ||||||||
|
Basic net loss per common share
|
$ | (0.05 | ) | $ | (0.15 | ) | $ | (0.10 | ) | $ | (0.11 | ) | ||||
|
Diluted net loss per common share
|
$ | (0.05 | ) | $ | (0.15 | ) | $ | (0.10 | ) | $ | (0.11 | ) | ||||
|
Basic weighted average shares outstanding
|
8,208 | 8,230 | 8,236 | 8,243 | ||||||||||||
|
Diluted weighted average shares outstanding
|
8,208 | 8,230 | 8,236 | 8,243 | ||||||||||||
|
ITEM 9.
|
CHANGES IN AND DISAGREEMENTS WITH ACCOUNTANTS ON ACCOUNTING AND FINANCIAL DISCLOSURE
|
None.
|
ITEM 9A(T).
|
CONTROLS AND PROCEDURES
|
Disclosure Controls and Procedures
The Company maintains disclosure controls and procedures that are designed to ensure that material information required to be disclosed in the Company’s periodic reports filed or submitted under the Securities Exchange Act of 1934, as amended, or the Exchange Act, is recorded, processed, summarized and reported within the time periods specified in the Securities Exchange Commission’s, or SEC, rules and forms. Onvia’s disclosure controls and procedures are also designed to ensure that information required to be disclosed in the reports the Company files or submits under the Exchange Act is accumulated and communicated to the Company’s management, including its principal executive officer and principal financial officer as appropriate, to allow timely decisions regarding required disclosure.
Based on management’s evaluation as of the end of the period covered by this Report, the Company’s Chief Executive Officer and Chief Financial Officer have concluded that the Company’s disclosure controls and procedures, as defined in Rule 13a-15(e) and 15d-15(e) promulgated under the Exchange Act, were effective as of the end of the period covered by this Report.
47
Report of Management on Internal Control over Financial Reporting
Onvia’s management is responsible for establishing and maintaining adequate internal control over financial reporting for the Company, as such term is defined in Rule 13a-15(f) and 15d-15(f) promulgated under the Exchange Act. Internal control over financial reporting is a process designed to provide reasonable assurance regarding the reliability of financial reporting and the preparation of financial statements for external purposes in accordance with generally accepted accounting principles. Internal control over financial reporting includes those policies and procedures that (i) pertain to the maintenance of records that, in reasonable detail, accurately and fairly reflect the transactions and dispositions of the Company’s assets; (ii) provide reasonable assurance that transactions are recorded as necessary to permit preparation of the financial statements in accordance with generally accepted accounting principles, and that receipts and expenditures are being made only with proper authorizations; and (iii) provide reasonable assurance regarding prevention or timely detection of unauthorized acquisition, use or disposition of the Company’s assets that could have a material effect on the financial statements.
Because of its inherent limitations, internal control over financial reporting may not prevent or detect misstatements. Also, projections of any evaluation of effectiveness to future periods are subject to the risk that controls may become inadequate because of changes in conditions, or that the degree of compliance with the policies or procedures may deteriorate.
The Company’s management, under the supervision of and with the participation of the Chief Executive Officer and the Chief Financial Officer, assessed the effectiveness of the Company’s internal control over financial reporting as of December 31, 2009 based on the framework and criteria established in Internal Control – Integrated Framework, issued by the Committee of Sponsoring Organizations of the Treadway Commission, or COSO. This evaluation included review of the documentation of controls, evaluation of the design effectiveness of controls, testing of the operating effectiveness of controls and a conclusion on this evaluation. Based on this evaluation, management concluded that the Company’s internal control over financial reporting was effective as of December 31, 2009.
This Report does not include an attestation report of the Company’s registered public accounting firm regarding internal control over financial reporting. Management’s report was not subject to attestation by the Company’s registered public accounting firm pursuant to temporary rules of the SEC that permit the Company to provide only management’s report in this Report.
Changes in Internal Control over Financial Reporting
There were no changes in the Company’s internal control over financial reporting during the quarter ended December 31, 2009 that materially affected, or are reasonably likely to materially affect, the Company’s internal control over financial reporting.
ITEM 9B. OTHER INFORMATION
None.
48
PART III
Certain information required by Part III is omitted from this Annual Report on Form 10-K because Onvia intends to file a definitive Proxy Statement for its Annual Meeting of Stockholders (the “Proxy Statement”) not later than 120 days after the end of the fiscal year covered by this Form 10-K, and certain information to be included therein is incorporated herein by reference.
|
ITEM 10.
|
DIRECTORS, EXECUTIVE OFFICERS AND CORPORATE GOVERNANCE
|
The information required by this item regarding the Company’s directors is incorporated herein by reference to the sections entitled “Proposal No. 1: Election of Directors” and “Section 16(a) Beneficial Ownership Reporting Compliance” in the Proxy Statement for the Annual Meeting of Stockholders to be held on May 7, 2010. Information regarding the Company’s executive officers is set forth under the caption “Executive Officers of the Registrant” in Part 1 of this Annual Report and is incorporated by reference into this Item 10.
The Company adopted a code of ethics applicable to its Chief Executive Officer, Chief Financial Officer, Controller and other finance leaders, which is a “code of ethics” as defined by applicable rules of the Securities and Exchange Commission. This code is publicly available on the Company’s website at www.onvia.com. If the Company makes any amendments to this code other than technical, administrative or other non-substantive amendments, or grants any waivers, including implicit waivers, from a provision of this code to the Company’s Chief Executive Officer, Chief Accounting Officer or Controller, the Company will disclose the nature of the amendment or waiver, its effective date and to whom it applies on its website or in a report on Form 8-K filed with the Securities and Exchange Commission.
|
ITEM 11.
|
EXECUTIVE COMPENSATION
|
The information required by this item is incorporated by reference to the sections entitled “Executive Compensation,” “Director Compensation,” “Compensation Committee Interlocks and Insider Participation” and “Compensation Committee Report” in the Proxy Statement.
|
ITEM 12.
|
SECURITY OWNERSHIP OF CERTAIN BENEFICIAL OWNERS AND MANAGEMENT AND RELATED STOCKHOLDER MATTERS
|
The information required by Item 201(d) of Regulation S-K under this item is contained in Item 5 of this Report, which is incorporated by reference herein, under the caption “Securities Authorized for Issuance under Equity Compensation Plans.”
The information required by Item 403 of Regulation S-K under this item is incorporated by reference to the section entitled “Common Stock Ownership of Certain Beneficial Owners and Management” in the Proxy Statement.
|
ITEM 13.
|
CERTAIN RELATIONSHIPS AND RELATED TRANSACTIONS, AND DIRECTOR INDEPENDENCE
|
The information required by this item is incorporated by reference to the sections entitled “Certain Relationships and Related Person Transactions” and “Board of Director and Committee Information” in the Proxy Statement.
|
ITEM 14.
|
PRINCIPAL ACCOUNTANT FEES AND SERVICES
|
The information required by this item is incorporated by reference to the sections entitled “Independent Registered Public Accounting Firm’s Fees and Services” in the Proxy Statement.
49
PART IV
|
ITEM 15.
|
EXHIBITS AND FINANCIAL STATEMENT SCHEDULES
|
Index to Consolidated Financial Statements and Financial Statement Schedule:
|
|
1.
|
INDEX TO CONSOLIDATED FINANCIAL STATEMENTS
|
|
Page
|
|
|
Report of Deloitte & Touche LLP, Independent Registered Public Accounting Firm
|
29
|
|
Consolidated Financial Statements:
|
|
|
Balance Sheets
|
30
|
|
Statements of Operations and Comprehensive (Loss) / Income
|
31
|
|
Statements of Cash Flows
|
32
|
|
Statements of Stockholders’ Equity
|
33
|
|
Notes to Consolidated Financial Statements
|
34
|
|
|
2.
|
FINANCIAL STATEMENT SCHEDULES
|
SCHEDULE II – VALUATION AND QUALIFYING ACCOUNTS
|
Description
|
Balances at Beginning of Period
|
Charged to Costs and Expenses
|
Deductions(1)
|
Balances at End of Period
|
||||||||||||
|
Allowance for doubtful accounts
|
||||||||||||||||
|
Year Ended December 31, 2007
|
48,157 | 38,501 | (34,515 | ) | 52,143 | |||||||||||
|
Year Ended December 31, 2008
|
52,143 | 74,962 | (95,145 | ) | 31,960 | |||||||||||
|
Year Ended December 31, 2009
|
31,960 | 434,739 | (347,694 | ) | 119,005 | |||||||||||
(1) Uncollectible accounts written off, net of recoveries.
Schedules not listed above have been omitted because they are not applicable, are not required or the information required to be set forth in the schedules is included in the consolidated financial statements or related notes.
50
3. EXHIBITS
Certain of the agreements filed as exhibits to this Form 10-K contain representations and warranties by the parties to the agreements that have been made solely for the benefit of the parties to the agreement. These representations and warranties:
|
·
|
May have been qualified by disclosure that were made to the other parties in connection with the negotiation of the agreements, which disclosures are not necessarily reflected in the agreements;
|
|
·
|
May apply standards of materiality that differ from those of a reasonable investor; and
|
|
·
|
Were made only as of specified dates contained in the agreements and are subject to later developments.
|
Accordingly, these representations and warranties may not describe the actual state of affairs as of the date they were made or at any other time, and investors should not rely on them as statements of fact.
|
Number
|
Description
|
|
3.1
|
Amended and Restated Certificate of Incorporation (incorporated by reference to Exhibit 3(i).1 to the Form 10-Q for the quarter ended June 30, 2004, filed on August 12, 2004)
|
|
3.2
|
Bylaws of Onvia (incorporated by reference to Exhibit 3.2 to the Form 10-K for the year ended December 31, 2000, filed on April 2, 2001)
|
|
4.1
|
Form of Onvia’s Common Stock Certificate (incorporated by reference to the Registration Statement on Form S-1 dated December 21, 1999, as amended (File No. 333-93273))
|
|
4.2
|
Form of Rights Agreement between the Company and U.S. Stock Transfer Corp. as a Rights Agent (including as Exhibit A the form of Certificate of Designation, Preferences and Rights of the Terms of the Series RP Preferred Stock, as Exhibit B the form of the Right Certificate, and as Exhibit C the Summary of Terms of Rights Agreement) (incorporated by reference to Exhibit 4.1 from the Form 8-K, filed on November 25, 2002)
|
|
10.1*
|
Onvia, Inc. 2008 Equity Incentive Plan (incorporated by Reference to the 2008 Proxy Statement dated August 6, 2008)
|
|
10.2*
|
Amended Onvia, Inc. Savings and Retirement Plan (incorporated by reference to Exhibit 10.1 from the Form 10-K for the year ended December 31, 2004, filed on March 25, 2005)
|
|
10.3*
|
Form of Indemnification Agreement between Onvia and each of its officers and directors (incorporated by reference to the Registration Statement on Form S-1 dated December 21, 1999, as amended (File No. 333-93273))
|
|
10.4*
|
Amended 2000 Employee Stock Purchase Plan (incorporated by Reference to Exhibit 10.4 to the Report on Form 10-Q for the quarter ended September 30, 2008, filed on November 14, 2008)
|
|
10.5*
|
2000 Directors’ Stock Option Plan (incorporated by reference to the Registration Statement on Form S-1 dated December 21, 1999, as amended (File No. 333-93273))
|
|
10.6*
|
Third Amendment to Employment and Noncompetition Agreement with Michael D. Pickett dated September 27, 2002 (incorporated by reference to Exhibit 10.2 to the Report on Form 10-Q for the quarter ended September 30, 2002, filed on November 6, 2002)
|
|
10.7*
|
Employment Agreement with Irvine N. Alpert dated February 22, 2002 and Commission and Bonus Plan with Irvine N. Alpert dated September 11, 2001 (incorporated by reference to Exhibit 10.4 to the Report on Form 10-K for the year ended December 31, 2001, filed on March 29, 2002)
|
|
10.8*
|
Medical Dental Building Lease Agreement between Onvia and GRE 509 Olive LLC, dated July 31, 2007 (incorporated by reference to Exhibit 10.12 to the Report on Form 10-Q for the period ended September 30, 2007, filed on November 14, 2007)
|
|
10.9*
|
2009 Executive Compensation Plan for Irvine Alpert, Executive Vice President (incorporated by reference to Exhibit 10.11 to the Report on Form 10-K for the period ended December 31, 2008, filed on March 31, 2009)
|
|
10.10*++
|
2010 Management Incentive Plan
|
|
10.11*++
|
Separation and Release Agreement with Michael J. Tannourji, dated February 5, 2010
|
|
10.12*++
|
2010 Variable Compensation Plan for Irvine N. Alpert
|
|
10.13*++
|
2010 Variable Compensation Plan for Michael S. Balsam
|
|
23.1++
|
Consent of Deloitte & Touche LLP
|
|
31.1++
|
Certification of Michael D. Pickett, Chairman of the Board, Chief Executive Officer and President of Onvia, Inc., Pursuant to Rule 13a-14(a)/15d-14(a), as Adopted Pursuant to Section 302 of the Sarbanes-Oxley Act of 2002
|
|
31.2++
|
Certification of Cameron S. Way, Chief Financial Officer of Onvia, Inc., Pursuant to Rule 13a-14(a)/15d-14(a), as Adopted Pursuant to Section 302 of the Sarbanes-Oxley Act of 2002
|
|
32.1++
|
Certification of Michael D. Pickett, Chairman of the Board, Chief Executive Officer and President of Onvia, Inc., Pursuant to 18 U.S.C. Section 1350, as Adopted Pursuant to Section 906 of the Sarbanes-Oxley Act of 2002
|
|
32.2++
|
Certification of Cameron S. Way, Chief Financial Officer of Onvia, Inc., Pursuant to 18 U.S.C. Section 1350, as Adopted Pursuant to Section 906 of the Sarbanes-Oxley Act of 2002
|
|
|
* Executive Compensation Plan or Agreement
++ Filed Herewith
51
SIGNATURES
Pursuant to the requirements of Section 13 or 15(d) of the Securities Exchange Act of 1934, as amended, the registrant has duly caused this Report to be signed on its behalf by the undersigned, thereunto duly authorized, in the City of Seattle, State of Washington, on March 31, 2010.
|
ONVIA, INC.
|
|
|
By:
|
/s/ Michael D. Pickett
|
|
Michael D. Pickett
|
|
|
Chairman of the Board, Chief Executive Officer and President
|
|
|
By:
|
/s/ Cameron S. Way
|
|
Cameron S. Way
|
|
|
Chief Financial Officer
|
|
POWER OF ATTORNEY
KNOW ALL MEN BY THESE PRESENTS, that each of the undersigned, being a director or officer of Onvia, Inc., a Delaware corporation (the “Company”), hereby constitutes and appoints Michael D. Pickett and Cameron S. Way, and each of them, his true and lawful attorney-in-fact and agent, with full power of substitution and re-substitution, for him and in his name, place and stead in any and all capacities, to sign one or more Annual Reports for the Company’s fiscal year ended December 31, 2009, on Form 10-K under the Securities Exchange Act of 1934, as amended, any amendments thereto, and all additional amendments thereto, each in such form as they or any one of them may approve, and to file the same with all exhibits thereto and other documents in connection therewith with the Securities and Exchange Commission, granting unto said attorneys-in-fact and agents, and each of them, full power and authority to do and perform each and every act and thing requisite and necessary to be done so that such Annual Report shall comply with the Securities Exchange Act of 1934, as amended, and the applicable Rules and Regulations adopted or issued pursuant thereto, as fully and to all intents and purposes as he might or could do in person, hereby ratifying and confirming all that said attorneys-in-fact and agents, or any of them or their substitute or re-substitute, may lawfully do or cause to be done by virtue hereof.
Pursuant to the requirements of the Securities Act of 1934, this Report has been signed below by the following persons, on behalf of the Registrant and in the capacities and on the dates indicated.
|
Signature
|
Title
|
Date
|
|
|
/S/ MICHAEL D. PICKETT
Michael D. Pickett
|
Chairman of the Board, Chief Executive Officer and President
|
March 31, 2010
|
|
|
/S/ CAMERON S. WAY
Cameron S. Way
|
Chief Financial Officer
|
March 31, 2010
|
|
|
/S/ JEFFREY C. BALLOWE
Jeffrey C. Ballowe
|
Director
|
March 31, 2010
|
|
|
/S/ JAMES L. BRILL
James L. Brill
|
Director
|
March 31, 2010
|
|
|
/S/ ROBERT G. BROWN
Robert G. Brown
|
Director
|
March 31, 2010
|
|
|
/S/ ROGER L. FELDMAN
Roger L. Feldman
|
Director
|
March 31, 2010
|
|
|
/S/ D. VAN SKILLING
D. Van Skilling
|
Director
|
March 31, 2010
|
|
|
/S/ STEVEN D. SMITH
Steven D. Smith
|
Director
|
March 31, 2010
|
|
52