Attached files
Table of Contents
UNITED STATES
SECURITIES AND EXCHANGE COMMISSION
Washington, D.C. 20549
FORM 10-K
(Mark One)
| x | ANNUAL REPORT PURSUANT TO SECTION 13 OR 15(d) OF THE SECURITIES EXCHANGE ACT OF 1934 |
For the fiscal year ended December 31, 2009
OR
| ¨ | TRANSITION REPORT PURSUANT TO SECTION 13 OR 15(d) OF THE SECURITIES EXCHANGE ACT OF 1934 |
For the transition period from to
Commission file number: 001-33793
ICx Technologies, Inc.
(Exact name of registrant as specified in its charter)
| Delaware | #77-0619113 | |
| (State or other jurisdiction of incorporation or organization) |
(IRS Employer Identification No.) | |
| 2100 Crystal Drive, Suite 650 Arlington, VA |
22202 | |
| (Address of principal executive offices) | (Zip Code) | |
(703) 678-2111
(Registrant’s telephone number, including area code)
Securities registered pursuant to Section 12(b) of the Act:
Common Stock, $0.001 par value
(Title of Class)
NASDAQ
(Name of each exchange on which registered)
Securities registered pursuant to Section 12(g) of the Act:
None
Indicate by check mark if the registrant is a well-known seasoned issuer, as defined in Rule 405 of the Securities Act. Yes ¨ No x
Indicate by check mark if the registrant is not required to file reports pursuant to Section 13 or Section 15(d) of the Act. Yes ¨ No x
Indicate by check mark whether the registrant (1) has filed all reports required to be filed by Section 13 or 15(d) of the Securities Exchange Act of 1934 during the preceding 12 months (or for such shorter period that the registrant was required to file such reports), and (2) has been subject to such filing requirements for the past 90 days. Yes x No ¨
Indicate by check mark whether the registrant has submitted electronically and posted on its corporate Web site, if any, every Interactive Data File required to be submitted and posted pursuant to Rule 405 of Regulation S-T during the preceding 12 months (or for such shorter period that the registrant was required to submit and post such files). Yes ¨ No ¨
Indicate by check mark if disclosure of delinquent filers pursuant to Item 405 of Regulation S-K is not contained herein, and will not be contained, to the best of registrant’s knowledge, in definitive proxy or information statements incorporated by reference in Part III of this Form 10-K or any amendment to this Form 10-K. ¨
Indicate by check mark whether the registrant is a large accelerated filer, an accelerated filer, a non-accelerated filer, or a smaller reporting company. See definitions of “large accelerated filer,” “accelerated filer” and “smaller reporting company” in Rule 12b-2 of the Exchange Act (Check one):
Large accelerated filer ¨ Accelerated filer ¨ Non-accelerated filer ¨ Smaller reporting company x
Indicate by check mark whether the registrant is a shell company (as defined in Rule 12b-2 of the Exchange Act). Yes ¨ No x
The aggregate market value of the voting and non-voting common stock held by non-affiliates of the registrant as of June 30, 2009 was approximately $61,642,000 based on the last reported sales price of the common stock on the Nadsaq National Market on such date.
As of February 28, 2010, the registrant had 34,757,919 shares of Common Stock outstanding.
DOCUMENTS INCORPORATED BY REFERENCE
The registrant has incorporated by reference into Part III of this Form 10-K, portions of its Proxy Statement for its 2010 Annual Meeting of Stockholders.
Table of Contents
Table of Contents
SPECIAL NOTE REGARDING FORWARD-LOOKING STATEMENTS
In this Annual Report on Form 10-K, ICx Technologies, Inc. and its consolidated subsidiaries are referred to as “ICx”, “we,” “us,” or “our.” This report on Form 10-K includes forward-looking statements. All statements other than statements of historical facts contained in this Form 10-K, including statements regarding our future results of operations and financial position, business strategy and plans and our objectives for future operations, are forward-looking statements. We attempt, whenever possible, to identify these forward-looking statements by words such as “may,” “will,” “could,” “should,” “expect,” “intend,” “plan,” “anticipate,” “believe,” “estimate,” “predict,” “potential” or “continue,” and similar expressions. We have based these forward-looking statements largely on our current expectations and projections about future events and financial trends that we believe may affect our financial condition, results of operations, business strategy, short-term and long-term business operations and objectives, and financial needs. These forward-looking statements are subject to a number of risks, uncertainties and assumptions, including those described in “Risk Factors.” In light of these risks, uncertainties and assumptions, the forward- looking events and circumstances discussed in this Form 10-K may not occur and actual results could differ materially and adversely from those anticipated or implied in the forward-looking statements.
You should not rely upon forward-looking statements as predictions of future events. Although we believe that the expectations reflected in the forward-looking statements are reasonable, we cannot guarantee that the future results, levels of activity, performance or events and circumstances reflected in the forward-looking statements will be achieved or occur. Moreover, neither we nor any other person assumes responsibility for the accuracy and completeness of the forward-looking statements. We undertake no obligation to update publicly any forward-looking statements for any reason after the date of this Form 10-K to conform these statements to actual results or to changes in our expectations.
You should read this Form 10-K and the documents that we reference in this Form 10-K and have filed with the SEC with the understanding that our actual future results, levels of activity, performance and events and circumstances may be materially different from what we expect.
1
Table of Contents
PART I
| Item 1. | BUSINESS |
ICx Technologies, Inc. and Subsidiaries (“ICx” or “Company”) was incorporated in the State of Delaware in 2003 to acquire, develop, and coordinate the operations of security technology companies. Our business was primarily formed through the acquisition of 18 companies beginning in 2003. Our business is organized into three divisions—Detection, Surveillance and Solutions—through which we develop, manufacture and market complete solutions that proactively address some of the most sophisticated and severe security threats facing the world today.
Company Overview
ICx is a leader in the development and integration of advanced sensor technologies for homeland security, force protection and commercial applications. Our proprietary sensors detect and identify chemical, biological, radiological, nuclear and explosive threats and deliver superior awareness and actionable intelligence for wide area surveillance, intrusion detection and facility security. By leveraging our technical expertise, ICx pioneers the integration of these advanced sensors into effective force protection, homeland security and commercial solutions. Through our proven ability to develop and convert next-generation technologies into unique, commercially successful products, we are able to offer a wide range of high quality, compact detection and surveillance products that we believe are more sensitive, more accurate and more cost-effective than conventional products.
We believe our ability to understand the nature of sophisticated security threats, the technological potential of security solutions and the complex procurement processes of government customers, differentiates us from most other companies in the market. We have developed what we believe is the most comprehensive line of products and integration capabilities for the security industry available from a single company.
We intend to expand our leadership position in the homeland security market by continuing to develop innovative technologies and solutions. We have successfully commercialized and marketed a portfolio of products and solutions that we believe are more sensitive, accurate, compact and affordable than those of our competitors. We manufacture and market the leading portable explosive detector, the smallest spectroscopic radiation detector, and the most accurate mobile solutions for perimeter surveillance available in the market today.
We sell our products and services directly through a global sales force, with regional offices in the Middle East, Asia Pacific and Europe. We also have built a significant distribution channel of leading international distributors and strategic partners. Due to the breadth and diverse nature of our product offerings and technology portfolio, as well as our ability to deliver solutions for a comprehensive range of critical security applications, the future success of our business is not dependent upon a single product, technology, customer or government program.
Our direct customers include federal agencies, such as the U.S. Department of Homeland Security, U.S. Customs and Border Protection (Border Patrol) and the Transportation Security Administration. We also serve various state and local governments and agencies, including the New York Police Department and the Port of Long Beach. Our products, components and sub-systems are the choice of leading integrators in the security and defense industries who resell our products, or integrate them into comprehensive security installations for their customers. The major value-added resellers and system integrators that we sell to include The Boeing Company, Honeywell International, Inc., Northrop Grumman Corp., Raytheon Company, SAIC, Inc. and Thermo Fisher Scientific, Inc. We also sell to military customers such as the U.S. Department of Defense (“DoD”), the U.S. Air Force, the U.S. Marines and the U.S. Army. We also sell to private sector customers such as Federal Express Corporation, The Walt Disney Company and two international airports serving the city of Houston,
2
Table of Contents
Texas and surrounding communities. In 2009, we added Chevron, Dow Chemical Company, Solvay Chemicals, Dallas Water Utilities, Pantex, Magal/Senstar, Johnson Controls, the Civil Police of Rio de Janeiro and Perth Airport to our portfolio of blue-chip customers.
Industry Overview
The proliferation of global security threats has reached unprecedented levels. The attempted bombing of a Delta Airlines flight from Amsterdam on Christmas Day 2009 underscores that the specter of terrorism is part of modern society. These threats not only jeopardize innocent lives, but also have the potential to inflict severe damage upon the global economy. Both the government and private sectors are continuing to find new ways to address increasingly sophisticated types of terrorist attacks, including chemical, biological, radiological, nuclear and explosive threats, as well as other major security risks and natural disasters. Because of the importance of security to the global economy, we believe the DoD and homeland security markets were less exposed to the economic downturns experienced in 2009, and will continue to grow substantially over the next decade.
In addition, we believe our technologies have utility in a wide range of applications outside the homeland security and military markets. Historically, advanced technologies developed for security and military applications have later been found to have applications in other commercial markets, such as biological research and energy, and have led to the creation of entirely new markets. We believe our technologies may in the future be used in products and solutions for markets that surpass the size of the markets we currently serve.
Market Opportunity
Advanced security products typically are not portable, not sensitive enough or generate too many false positives, are difficult to network, or are too expensive for many users to buy and operate. In addition, due to the fragmented nature of the market, many market participants have either focused on manufacturing specific products or operate as system integrators who network the products of other companies without having a detailed understanding of the capabilities of these products. As a result, customers are demanding single-source providers in order to allow them to streamline their procurement processes and isolate accountability with fewer vendors.
We provide an expansive portfolio of technology products and solutions that address many of the specific demands of our customers. Our products not only address the shortcomings of conventional products, such as portability and false-alarms rates, but many are designed to work in concert, facilitating the interchange of critical security information between systems. We believe that our ability to integrate our advanced sensors and third-party products into highly effective solutions has enabled us to continue to capture market share and deliver our customers high-value solutions that warrant premium pricing. We believe our ability to understand the nature of sophisticated security threats, the technological potential of security solutions, and the complex procurement processes of both government and private sector customers, differentiates us from other companies in the market. By leveraging our unique technical expertise, we design, develop, manufacture and market what we believe are the most advanced sensors and surveillance products available in the homeland security market today.
Our Competitive Strengths
ICx Technologies develops, manufactures, markets and integrates products and solutions that detect, identify and prevent a broad range of critical security threats. We believe our competitive strengths will continue to enhance our leadership position in the homeland security market and the broader security industry.
Leading proprietary technologies. We are a leading innovator developing highly advanced, proprietary security technologies that are more accurate, compact and less susceptible to false positives than most conventional technologies. More than half of our approximately 820 employees are highly skilled technologists. From the beginning of 2004 through the end of 2009, we have invested approximately $79 million in research and development and have received approximately $164 million under contract research and development
3
Table of Contents
programs we believe will advance our technology and products and strengthen our leadership position in the homeland security market. Our emphasis on innovation has resulted in numerous issued, pending and licensed patents. We also have strong connections with leading research laboratories and universities which foster innovation and advance our technology leadership.
Proven ability to develop, market and commercialize products. We have been successful in utilizing our advanced technologies to develop commercially viable products and solutions. We have received and expect to continue to receive substantial government funding to carry out our research and product development. Since 2005, our product line has grown significantly. In addition to adding numerous new products through proprietary development and the acquisition process, we have also made considerable advancements to several of our existing brands. In addition, we continue to integrate our varied products into single source, cohesive solutions. We also understand and are able to successfully navigate the complex security procurement processes of our customers. The growth in sales of our products demonstrates our commercial success.
Broad and diversified product portfolio. Leveraging our unique technical expertise, we develop, produce and market what we believe are the most advanced products and solutions that detect, identify and prevent a broad range of critical security threats. We believe that our solutions are more sensitive, accurate, compact and affordable than those of our competitors. Due to our diverse product portfolio and our ability to provide solutions for a wide range of critical security applications, the future success of our business is not dependent on a single product, technology, customer or government program.
Ability to deliver comprehensive integrated solutions to key customers. Our ability to integrate our technology and products into comprehensive, reliable and affordable solutions provides our customers a single source to help address a broad range of critical security threats. We have developed our products in a manner that facilitates interoperability and functional efficiency and also accommodates third-party hardware and software. Our ability to understand the nature of complex security threats, our breadth of product offerings and broad integration capabilities allows us to deliver and implement effective solutions to meet our customers’ needs.
Proven government programs award capability. ICx has a leading team of professional, business development, program management and technical employees capable of winning highly complex and strategic government programs. We are continuing work on the Joint Nuclear, Biological, Chemical Reconnaissance System Increment II (JNBCRS 2 or J2) program, a U.S. Army Research and Development Engineering Command Acquisition Center award which has an estimated value of up to $711 million over seven years which began in the 2009 government fiscal year. In 2009, we also completed the first testing phase of the software platform developed as lead integrator for the Joint Force Protection Advanced Security System (JFPASS) Joint Capability Technology Demonstration. (JCTD).
Experienced management team. Our management team and advisory board has a mix of government and private sector experience across different geographies, industries and functions. Our team promotes entrepreneurial creativity and emphasizes the importance of attracting, developing and retaining the most highly qualified personnel in our industry. Since our inception, our management team has acquired and integrated 18 diverse companies that have enhanced our capabilities and technology leadership.
Our Growth Strategy
Our objective is to strengthen our position as a leading provider of technologies, products and solutions that detect, identify and prevent a broad range of critical security threats for the homeland security and military markets and to expand on that leadership position by developing products for other markets. As part of our growth strategy, we seek to:
Strengthen our technological leadership. We intend to continue to develop and acquire next generation technologies to strengthen our technological leadership position. We will continue to work closely with our customers and partners and will seek further government development funding. We will also invest a substantial amount of our own funds in research and development to further enhance our technology leadership position.
4
Table of Contents
Enhance and extend our product line. We continue to introduce new models of our current products with enhancements to the capabilities of those products in order to address our customers’ evolving needs. These efforts are on-going especially in relation to our Fido and identiFINDER product lines to maintain their position as market-leading products. We also continue to convert the innovative technologies in our research and development pipeline into new products and platforms to pursue new market opportunities. In 2009, we introduced the Fido Verdict, a palm-sized identifier of unknown threats based on a breakthrough in the miniaturization in Raman-based spectroscopy technologies.
Provide integrated solutions. We intend to continue to provide integrated, single-source solutions that prevent a broad range of critical security threats. We believe that significant opportunities exist for companies that understand the nature of complex security threats and meet customers’ needs by developing and delivering effective solutions that respond to those threats and make it easier to capture data from advance, multifunctional products through integrated networked command platforms. In 2009, we expanded our integrated software platform as part of JFPASS. As part of this program, we developed sensor fusion and command-and-control logic-based algorithms to automate and speed up the link between the sensor information that comes in and the resulting emergency- and incident-response capabilities.
Scale our distribution channels. We continue to build and strengthen our direct sales force and expand our indirect channels to extend our geographic reach and market penetration. In 2009, we opened a regional Middle East office in the Dubai Free Trade Zone to expand our reach within the region and provide additional customer service capabilities. We also increased the size and focus of our integrated surveillance systems team to further penetrate the perimeter intrusion detection market.
Expand into non-security markets. While in the near-term we intend to continue to focus primarily on products and solutions for the homeland security and military markets, we have developed technologies that are being used in non-security applications, such as chemical sensors for pesticide detection and thermal cameras used to inspect brakes on commercial trucks. We believe our technologies have utility in a wide variety of non-security applications and we intend to continue to explore applications for our technologies in markets that are not related to security. We believe this will allow us to leverage our existing intellectual property and infrastructure to expand our addressable markets and further accelerate our growth.
Products
ICx understands that an effective security solution is more than the sum of its parts. By leveraging our technical expertise, ICx has developed leading security technologies that are exceptionally sensitive, accurate, compact and affordable. The components of our solutions have been designed to work together in order to provide comprehensive, integrated solutions for critical infrastructure, facilities, perimeters, borders and other areas of vital security interest. Our integrated security platforms are designed to meet the needs inherent in today’s security environment.
Integrated Products
ThreatSenseTM. ThreatSense is a comprehensive chemical, biological, radiation and nuclear (CBRN) security solutions designed to improve time-to-detection, lower deployment costs and reduce false alarms. ThreatSense incorporates significant technical advancements made by our science and engineering teams to help counter aerosolized chemical and biological threats as well as monitoring the movement of radioactive sources. ThreatSense is designed to mitigate the effect of CBRN threats to critical infrastructure.
CommandSpace®. CommandSpace is a comprehensive layered approach to integrated perimeter security. Our CommandSpace fixed and mobile solutions incorporate state-of-the-art ICx radars, imagers and mobile towers, as well as third-party technologies and a common operating picture to provide advanced warning of a potential threat before it crosses a perimeter.
5
Table of Contents
Cerberus. Cerberus takes the CommandSpace concept on mobile surveillance system (“MSS”) and transportable platforms, integrating the world’s most advanced infrared/CCTV cameras and perimeter security radars into turn key integrated solutions. In both the transportable as well as the vehicle-mounted platform, our Cerberus solution provides superior perimeter awareness for military, border and commercial security installations. Covering a range from 13 to 30 km, we integrate both our own as well as third-party sensors reliably.
CBRNE Threat Detection Products
By incorporating detection instruments that sense and identify chemical, biological, radiological, nuclear and explosive (“CBRNE”) threats, ICx provides security personnel with advanced awareness and actionable intelligence. The CBRNE detection devices from ICx are compact, portable, more rugged, more affordable and simple to use as compared to laboratory instruments that perform similar functions.
Chemical Detection. ICx develops and manufactures specific detection technologies for chemical warfare agents as well as toxic industrial chemicals and materials. Our chemical sensors and instruments are used by the DoD for facility protection and first-responders, who need reliable answers in the field.
Chemical Detection Products
(representative list)
| cheMSense 600 |
• Direct air sampling mass spectrometer
• 24/7 indoor air monitoring and detection for infrastructure protection
• Near real-time detection of aerosol-released chemical agents
• User-definable library of aerosolized threats | |
| Agentase CAD-Kit |
• Chemical agent point detection kit
• Surface, solid and liquid interrogation of chemical warfare agents and other hazardous materials
• Laboratory-level sensitivity | |
| Agentase Disclosure Spray |
• Proprietary spray-based formula to pinpoint location of chemical agents
• Sub-microgram (trace) detection levels (below that of a contact hazard)
• Immediate knowledge of decontamination efficacy | |
| Griffin 450 |
• Mobile GC/MS for laboratory analysis in the field
• Identifies chemical warfare agents, toxic industrial chemicals and toxic industrial materials
• Analytical flexibility with air sampling capability | |
| Griffin X-Sorber |
• Handheld air sampler with thermal desorption capabilities
• Flexible sampling option for chemical analysis in a “hot zone”
• For use with the Griffin 450 | |
Biological Detection. Biological detection is one of the hardest challenges to address in any security environment due to the evolving nature of the threat. Our continuous indoor and outdoor biological air monitors are used by the DoD, airport authorities and other agencies, as well as by the National Park Service, for layered security at facilities and events. In addition to our product line, we are continuing development of advanced pathogen identification systems.
6
Table of Contents
Biological Detection Products
(representative list)
| AirSentinel |
• Continuously operating facility air monitor for bio-terror agents
• Integrates into building HVAC systems
• Triggers networked sampling devices | |
| IBAC |
• Continuously operating outdoor air monitor for biological threats
• Government validated in relevant environments
• Alert algorithms validated for both indoor and outdoor environments | |
| BioXC |
• Continuous or triggered bio-threat sampling
• Cost-effective management of threat risks | |
| BioCapture |
• Most widely deployed portable air sampler for biowarfare agents
• Fully decontaminable air sampling device | |
Radiation and Nuclear Detection. ICx develops leading edge radiation detection and identification devices. Our handheld and integrated systems have been or are being used by the U.S. Department of Energy’s Nuclear Emergency Search Team, the New York Police Department, the International Atomic Energy Agency, the U.S. Coast Guard and the United Kingdom’s Home Office Border and Immigration Agency. In addition, our systems were used at the Summer Olympic Games in Beijing to provide additional security for the athletes and spectators.
Radiation Detection Products
(representative list)
| Stride Systems |
• Radionuclide detection units and systems
• Openly or covertly detect and classify radioactive sources
• Fully integratable into facility infrastructure or modular components, such as stanchions | |
| identiFINDER |
• Handheld radionuclide detection and identification device
• Rapid, precise response
• Digital gamma spectrometer and dose rate measurement | |
| Raider |
• State-of-the-art palmheld instrument
• Rapid identification and verification of radioactive sources
• Built-in GPS and reach-back capabilities | |
| radHUNTER |
• Extremely sensitive and accurate radionuclide identification device
• Detects, locates, measures and identifies gamma radiation signatures | |
Explosives Detection. ICx offers a suite of handheld, portable and integrated explosives detectors for military-grade explosives as well as for those liquids used in making homemade explosive devices. Our detectors are in use by the U.S. military in Afghanistan and Iraq in the fight against improvised explosive devices (IEDs). In addition, these products are in use by the U.S. Park Service Police for special event security and at national monuments such as the Statue of Liberty, Ellis Island and Hoover Dam.
7
Table of Contents
Explosives Detection Products
(representative list)
| Fido XT |
• Lightweight, portable and field-tested
• True vapor sensing capability
• 1,000+ times more sensitive than conventional trace detection products (detects femtogram-level concentrations)
• We believe sensitivity to be comparable to the capabilities of canines | |
| Fido OnBoard | • Robot-mountable trace explosives vapor detector
• Only “sniffer” capable of being mounted on the end of a robotic arm
• Same sensitivity as the Fido XT | |
| Fido PaxPoint | • Handheld, portable liquid screening system
• Detects liquids used to make homemade explosives | |
| Fido Verdict | • Palm-sized explosives and narcotics identifier
• Uses well-established Raman spectroscopy to identify unknown materials directly through sealed containers | |
Non-Security Sensor. Through our pursuit of new and significant technologies for homeland security and force protection our technologists are also making discoveries and products for other industries. We have developed several sensor products for laboratory instrumentation, advanced vehicle warning systems, concrete maturity and drug discovery.
Non-Security Sensor Products
(representative list)
| Concrete Sensors |
||
| IntelliRock |
• Measures and records the conditions of in-place concrete
• Unalterable, secure data files to ensure data integrity
• Streamlines workflow, ensures standards compliance | |
| Bioinstrumentation |
||
| SensiQ |
• High-performance biomolecular interaction analysis instrument
• Semi-automated high throughput system
• Cost-effective SPR analysis | |
| SensiQ Pioneer |
• High-throughput, automated biomolecular interaction analysis instrument
• Real-time, label-free analysis | |
| Gas Sensing |
||
| SensorChip 4P |
• Micro-electro-mechanical system (MEMS) photonic crystal that emits and absorbs with extreme efficiency in narrow infrared (IR) wave bands used for gas sensing
• Industry-first wafer-level packaging, hermetically sealed, sensor-on-a-chip
• Wearable, compact and highly reliable
• Less than one-tenth of the power consumption of standard IR detectors | |
8
Table of Contents
Border & Perimeter Surveillance Products
Advanced surveillance technologies allow fewer people to detect many more threats over wider areas and to respond faster and more effectively. ICx focuses on flexible, layered technologies to detect and identify potential threats before they cross a perimeter.
Radar Systems. Today’s radars provide the missing link necessary for optimal wide-area surveillance. ICx provides high-resolution millimeter wave (MMW) and frequency-modulated continuous wave (FMCW) radars for perimeter surveillance and detection scanning. ICx radars have been deployed along the U.S.-Mexico border, at airports, sea ports and national monuments, as well as abroad in critical facility infrastructure troubled areas such as the Middle East Gaza Strip.
Our fixed and portable solutions are capable of detecting moving and stationary vehicles and personnel including persons walking, crawling or even swimming. When networked with perimeter surveillance cameras, our radars provide a slew-to-cue capability.
Radar Products
(representative list)
| STS-350 |
• High-performance radar with unparalleled resolution and accuracy
• Detects people walking at distances of up to 350 meters
• Camera slew-to-cue capability
• Tangential and slow-movement tracking capability
• Rapid deployable, battery-operated versions | |
| STS-1400 | • High-performance radar with unparalleled resolution and accuracy
• Detects people walking at distances of up to 1400 meters
• Camera slew-to-cue capability
• Tangential and slow-movement tracking capability
• 360° field of view, one revolution per second and few false-positive readings
• Easy to integrate with Ethernet/XML interface | |
| STS-2800 |
• High-performance radar with unparalleled resolution and accuracy
• Detects people walking at distances of up to 2800 meters
• Camera slew-to-cue capability
• Tangential and slow-movement tracking capability
• 360° field of view, one revolution per second and few false-positive readings
• Easy to integrate with Ethernet/XML interface | |
| STS-4400 | • High-performance radar with unparalleled resolution and accuracy
• Detects people walking at distances of up to 4400 meters (mortar range)
• Camera slew-to-cue capability
• Tangential and slow-movement tracking capability
• 360° field of view, one revolution per second and few false-positive readings
• Easy to integrate with Ethernet/XML interface | |
9
Table of Contents
| STS-12000 | • High-performance radar with unparalleled resolution and accuracy
• Camera slew-to-cue capability
• Tangential and slow movement tracking capability
• Detects moving vehicles up to twelve kilometers or people up to ten kilometers away |
Imaging Systems. ICx offers a suite of fixed and pan, tilt and zoom (PTZ) imaging systems. Our innovative VisionSenseTM technology allows operators to overlay thermal and CCTV charge-coupled device (CCD) images in real time in order to see objects in complete darkness while also penetrating glare, glass, fog and water. ICx imagers have been deployed at nuclear plants, on cruise ships, at national monuments and at numerous sea ports.
Imaging Products
(representative list)
| DefendIR | • Dual-sensor (visible light and thermal) pan and tilt thermal imager
• VisionSense technology combines the visible and thermal image into one output
• Multiple configurations utilizing various lenses and detectors to optimize the field of view for the desired use
• Continuous zoom option is the first-of-its-kind uncooled thermal imager with true optical zoom | |
| Orion | • Long range 5.5x continuous zoom lens
• Cryogenically cooled detector
• Precision pan/tilt mount with control and pointing accuracy | |
| Illuminator | • Low-light camera with high-powered spotlight triggered on detection
• Non-lethal deterrence | |
Tactical Platforms. ICx develops and manufactures mobile platforms for surveillance, assessment and response. These tactical platforms are completely adaptable to suit diverse security and protection needs. Our manned and unmanned mobile towers are networkable and can be deployed in almost any environment. The towers are used all along the U.S.-Mexico border, at theme parks, at national monuments, by the military at home and abroad, by numerous police forces across the United States and to secure high-profile events such as Mardi Gras, the Super Bowl, the Independence Day celebrations on the National Mall and even the inauguration ceremonies.
Tactical Platform Products
(representative list)
| Cerberus | • Unmanned, self-powered, integrated perimeter surveillance platform
• Integrated sensor suite can include infrared or visible light cameras, ground surveillance radar, video motion detection and unattended ground sensors
• Wireless local area network
• Multiple towers can be networked to central location for complete perimeter coverage
• Short, medium, long and ultra-long range configurations for coverage of full spectrum |
10
Table of Contents
| Cerberus MSS |
• Vehicle-mounted mobile integrated perimeter surveillance platform
• Integrated sensor suite can include infrared or visible light cameras, ground surveillance radar, video motion detection and unattended ground sensors
• Short, medium, long and ultra-long range configurations for coverage of full spectrum
• Multiple vehicle options | |
| SkyWatch |
• Manned surveillance and deterrence platform
• Options include thermal camera, radar, spotlights, ballistic resistance and ground sensors
• Lifts line-of-sight to above a second story roof line
• Generator or solar power options | |
Solutions
We design, develop and deploy security operating systems and video networking systems. In addition to providing platforms for our sensors and surveillance technologies, we offer open-source software systems that are scalable and specifically designed to support or integrate with our advanced sensors and hundreds of third-party devices.
StarWatch software security operating system aggregates inputs from widely dispersed sensors, detectors, portals and imaging systems, providing integrated networking, supervision, control and critical data management, including sophisticated access control. StarWatch was selected to protect the Pentagon and has become a standard for many DoD applications. In 2009, StarWatch was also selected as one of the software platforms for the updated Integrated Commercial Intrusion Detection System (ICIDS IV) for military base security.
Our Cameleon video integration and Cameleon Tactical command & control software networks, integrates and controls both analog and digital video cameras. The Cameleon software can interface with over 200 different devices and sensors, is used by state government agencies and is installed at military and classified facilities.
CohesionIF™ is a uniquely flexible and adaptable sensors integration framework that allows the breadth of ICx CBRNE sensors to be integrated into standard command and control software systems. By integrating CBRNE sensor alarms, security officials are able to see all threats to their facility detected by our CBRNE sensors through a common operating picture.
We also incorporate the technology used in our security operating systems into non-security solutions, such as supervisory and control systems used to monitor electric utility networks. Government transportation agencies also use our video networking software to monitor and control intelligent traffic systems. For example, our advanced fog warning and detection system along a thirteen mile stretch on Highway 99 near Fresno, California relies on ICx sensor fusion software and will leverage solar and green power technologies to support the system. ICx also designs, implements, operates and maintains enhanced regional traveler information systems. These systems utilize advanced software communications to tie together a multitude of varied sensor and device outputs. Furthermore, by utilizing so-called green technologies in intelligent transportation systems, ICx has been able to decrease the cost of ownership for these systems while maintaining effectiveness. Some components of these systems include light sources that require less power, maximizing communications pathways and installing solar panels for clean power generation. Our technologies are also being used in advanced signal processing and in telecommunications, including turnable filters and other components for optical signal processing.
11
Table of Contents
Border & Surveillance Products
(representative list)
| Software |
||
| Cameleon Tactical |
• Operating system to fully integrate video command centers
• Interfaces with cameras, monitors, video recorders and other types of devices
• Interfaces with both analog and digital video
• Allows easy, incremental migration from analog to digital formats
• Scalable, distributed architecture allows video feeds to be collected from a large number of points and distributed to multiple users
• Vendor agnostic
• Supports over 550 types of equipment sold by mainstream vendors | |
| StarWatch |
• Suite of security system options for intelligent sensor network and access control
• Scalable from small stand-alone through fully-integrated, wide-area PC-based networked systems
• Supports composite access and alarm monitoring with full workstation performance
• Supports closed circuit television, video badging and video verification options and biometric access controls
• Supports all major communications systems
• Compatible with a wide range of cameras, radars and chemical, biological, radiological and nuclear sensors | |
| CohesionIF |
• Integration of ICx and third-party sensors with existing security infrastructure and GUIs
• Data from wide range of device types collected under single interface
• Built-in understanding and processing of data
• Software engine based on Microsoft®.NET technology | |
| Transportation Safety & Management | ||
| Professional Design Services |
• Develop and implement turnkey solutions for a full range of ITS and transportation applications
• Traffic engineering
• Transportation planning
• Development and implementation
• Project and program management | |
12
Table of Contents
| Cameleon ITS |
• Command and control software for intelligent transportation systems
• Scalable and flexible for large video-sharing projects
• Customizable off-the-shelf software for lane control, event management, signage, congestion warning, parking management, bridge and tunnel security, incident detection and management and vehicle access systems
• XML data transfer engine for integration with third-party traffic management systems and advanced traveler information systems |
Customers
We sell our products, systems and services to a broad base of federal, state and local government customers, to all branches of the U.S. military, foreign militaries and to private sector businesses both in the United States and internationally. We sell directly through our internal sales force to agencies of the U.S. government, such as the U.S. Department of Homeland Security (DHS), the U.S. Department of Defense (DoD), the U.S. Department of Energy (DoE), U.S. Customs & Border Protection (Border Patrol), the U.S. Transportation Security Administration (TSA), Federal Bureau of Investigation (FBI), National Aeronautics and Space Administration (NASA), U.S. Secret Service, U.S. Coast Guard, as well as agencies of various state and local governments in the United States, such as the New York Police Department (NYPD), California Department of Transportation (CALTRANS) and Orange County Transportation Authority (OCTA). We are also beginning to sell our products directly to private sector customers such as Federal Express Corporation, The Walt Disney Company and the international airports serving the city of Houston, Texas and its surrounding communities. In 2009, we added the following blue-chip customers to our portfolio: Chevron, Dow Chemical Company, Solvay Chemicals, Dallas Water Utilities, Pantex, the Civil Police of Rio de Janeiro and Perth Airport. For the years ended December 31, 2009 and 2008, no single customer other than the U.S. government accounted for over 10% of our revenue.
We also provide products, components and sub-systems to value-added resellers and system integrators in the security and defense industries who either resell our products or integrate them into comprehensive security installations for their customers. These companies include The Boeing Company, DRS Technologies, Inc., General Dynamics, Inc., General Electric Company, Honeywell International, Inc., Johnson Controls, Inc., Motorola, Inc., Northrop Grumman Corp., Raytheon Company, SAIC, Inc., Magal/Senstar and Thermo Fisher Scientific Inc. xcore technologies are also being incorporated into non-security products for industrial, environmental, medical and other applications.
Sales and Marketing
We sell our products worldwide through our direct sales force, sales representatives, value-added resellers and system integrators. We sell many of our products and services to a broad range of customers in both the government and commercial sectors through our internal sales force. We have hired sales and marketing personnel from companies in the security industry, including General Electric Company, Johnson Controls, Inc., Smiths Detection and Thermo Fisher Scientific Inc. In the years ended December 31, 2009 and 2008, our direct sales represented approximately 70% and 71%, respectively, of our revenue.
Some of our products are designed as components or sub-systems that are sold to value-added resellers or system integrators for incorporation into their products and systems. For example, we provide firmware and electronics for thermal cameras, video-integration software for security command centers, access control software and firmware for building-wide military security systems, bio-samplers for first-responder bio-alarms, multi-channel analyzers for radiation portals, radionuclide localization and identification detection units for fixed or mobile radiation detection systems, and laser diodes for medical lasers. The value-addedresellers and system integrators that we sell products to include The Boeing Company, DRS Technologies, Inc., General Dynamics, Inc., General Electric Company, Honeywell International, Inc., Johnson Controls, Inc., Motorola, Inc., Northrop Grumman Corp., Raytheon Company, SAIC, Inc. and Thermo Fisher Scientific Inc. In the years ended December 31, 2009 and 2008, our sales through value-added resellers and system integrators represented approximately 30% and 29%, respectively, of our revenue.
13
Table of Contents
While some of our customers purchase products from more than one operating unit, we have centralized our sales activities and created specialized sales teams to address specific markets. For example, our Integrated Surveillance Systems team focuses on marketing integrated platforms that combine two or more surveillance products, such as mobile surveillance towers integrated with thermal cameras, millimeter wave band radar and other products supplied by our various operating units networked together through our software solution.
We also sell our products internationally. In the years ended December 31, 2009 and 2008, sales to customers located outside of the United States accounted for approximately 13% of our revenue. In 2009, we expanded our international direct sales team and opened a regional office in the Dubai Free Trade Zone in order to provide more direct access and additional service to our Middle East region customers. Additionally, we opened our Asia Pacific regional office in Singapore. Many security technologies require export licenses before they can be exported from the United States. Obtaining those licenses can be time consuming and expensive. We intend to continue to seek export licenses for appropriate technologies and to develop additional expertise in obtaining these licenses expeditiously and efficiently. We cannot assure you, however, that we will be successful in obtaining export licenses for key technologies because the U.S. Department of State and the U.S. Department of Commerce have broad discretion to delay or prevent the exportation of security technologies. See “Business—Regulatory” and “Risk Factors—Risks Associated with Government Contracts and Regulation.”
Backlog
At December 31, 2009 and 2008, we had total funded backlog of $53 million and $94 million, respectively. Funded backlog represents orders that have been received for products, contract research and development, or other services for which a contractual agreement is in place and an order has been executed. Substantially all funded backlog is expected to be recognized within twelve months. In addition to funded backlog, we also had unfunded backlog of approximately $339 million and $508 million at December 31, 2009 and 2008, respectively. Unfunded backlog primarily represents contracts with indefinite quantities, contracts that are subject to renewal options and contracts for which government agencies have not yet executed an order, such as our $711 million J2 program for which we have made assumptions as to the unfunded backlog that could reasonably be expected. The timing of firm orders, if any, from unfunded backlog may vary according to the life of the contracts. Such contracts generally have lives that range from one to five years.
Technology
Our key technological strengths fall into four principal categories:
| • | developing, purifying and assembling new sensing materials; |
| • | developing technologies to enable compact design of analytic instruments; |
| • | developing technologies to facilitate the sensing and projection of power at different electromagnetic wavelengths; and |
| • | developing software technologies for devices and networks. |
Sensing materials
Our sensors use new materials with novel characteristics, such as innovative semiconductors, crystals, polymers, reagents and other recently developed materials. These new materials are extraordinarily sensitive. Some of the materials respond to trace exposures of specific chemical compounds, such as explosives, nerve agents, or biological proteins. Other new materials respond to low-intensity radioactive emissions or particular types of electromagnetic energy, such as specific bands of infrared light. Many of these materials did not exist a few years ago or could not be sufficiently purified or economically assembled into functional structures. These new materials are now the key starting point in our development of extremely compact sensors, imagers and detectors.
14
Table of Contents
In order to transform these materials into sensors, imagers and detectors, we must ensure that these materials are precisely powered. We have sought technologies that incorporate innovative, compact and high-speed electrical circuits, amplifiers, power supplies, communications interfaces and embedded operating systems. Many of the emerging security threats are so diffuse, or move so quickly, that even the best conventional sensors often give off signals with significant static that can be difficult to interpret. We embed sophisticated software into our products that helps separate static from the signal.
Our core radiation sensing technology combines advanced sensors (sodium iodide, cadmium-zinc-telluride, lithium-6-fiber and helium) with sophisticated analytical engines powered by multichannel spectrum analyzers and high-speed digital signal processors. We have developed some unique approaches to the design and assembly of the basic sensing materials that improves the ability of our units to accurately distinguish between man-made and natural sources of radioactivity. One of our handheld units, for example, provides simultaneous gamma and neutron radiation detection at very low emission rates (1 microrem/hour).
Our chemical detectors incorporate advanced technologies to enable accurate and sensitive detection in the field in real time. Our Fido explosive detector incorporates a unique amplifying fluorescent polymer, which we use under an exclusive license from the Massachusetts Institute of Technology. This unique material dramatically increases the signal strength of the molecules of interest, allowing Fido to achieve detection sensitivities as low as 100 parts per quadrillion. Besides the amplifying fluorescent polymer technology, our other chemical detectors incorporate enzyme-based detection, gamma spectroscopy and a number of other different technologies.
Our photonic crystal technology allows precise tuning of the wavelength of infrared light emitted or absorbed by a silicon surface. Our SensorChip product implements this technology in a micro-electro-mechanical system (MEMS). The SensorChip enables the single-chip gas sensors that are used to detect potentially dangerous gases, such as methane.
Compact design
Our products perform sophisticated, laboratory-quality analyses yet offer these capabilities in rugged, compact packages suitable for use in extreme field conditions. These achievements are made possible by implementing advanced design concepts. Our various biosensors incorporate a small and efficient air sampler that serves as the front end for our ultraviolet fluorescence interrogation and amplifying fluorescent polymer technologies. Our AirSentinel uses deep-ultraviolet light-emitting diodes (LEDs) to interrogate samples. Biological proteins fluoresce under this form of deep-ultraviolet illumination, essentially creating a “biological smoke alarm”. This unique light source is extremely compact, can be powered by a battery, and allows broad economical deployment of this highly efficient detector.
Our enzyme-in-polymer technology enables us to turn laboratory test protocols and agents into field test kits for a wide range of chemical materials. We are currently completing development of a spray-on formulation using this technology that can indicate the exact location of any contamination, or confirm that decontamination efforts have succeeded.
Mass spectrometry is uniquely sensitive and accurate, and is the standard laboratory technology for detecting, differentiating and identifying trace levels of chemical compounds in complex chemical environments. All conventionally designed units, however, are much too large and cumbersome to be deployed outside of a laboratory. By contrast, our miniaturized units incorporate unique cylindrical ion trap technology developed at Purdue University, which we use under exclusive license. This technology has allowed us to build the first truly miniaturized, portable mass spectrometer capable of multiple stages of analysis. The cylindrical ion trap design requires smaller vacuum systems and lower power electronics than those used in conventional systems. Software incorporated into the product provides instrument control and data analysis and allows end-users to customize operation to address specific applications.
15
Table of Contents
Sensing and projecting power at different electromagnetic wavelengths
Our surveillance products sense power across a range of electromagnetic wavelengths to enable more detailed surveillance and quicker response. We are a world leader in developing devices and surfaces that allow the tuning of infrared emission, absorption and transmission.
We believe that we have developed the first commercial ground-level surveillance radar to operate in the very high frequency millimeter wave bands. Conventional radar systems operate at much lower frequencies, and are less able to discern small, slow and soft targets. Millimeter wave band radar poses substantial technical challenges, requiring fundamentally different signal processing and data analysis, and optimal design of all key components, such as antennas, electrical circuitry, firmware and software. We combine these proprietary circuits with real-time operational and signal processing software. Our millimeter wave band radar technology improves image resolution by fourfold or more over conventional microwave radar, and penetrates light rain, fog and smoke—conditions that often interfere with infrared technologies. Advanced software algorithms provide object recognition and can control and direct visible and infrared cameras to point toward radar-identified targets.
Our infrared technology consists of the key image processing electronics and software to rapidly transform the latest infrared detectors into functioning products. Our pan-and-tilt, forward-looking units operate in wavelengths that readily pass through fog and dust and in the eight to twelve micron spectral range—the infrared band in which humans and animals radiate much of their heat. Our versatile software is incorporated on a modular, scalable, flexible and fully programmable electronics card set that can be used with many detectors. This card set can be readily adapted to interface with new and higher resolution detectors as they are developed by third-party vendors. Our cameras can be easily customized to customer specifications.
Flexible software, open interfaces, and scalable systems.
We favor open interfaces and scalability in all of our products, systems and software. We use standard communication and control protocols. We make it easy for system integrators and end-users to incorporate our products in larger systems, and easy for us to link other vendors’ products with our own. We view this as essential because many new security products are being added to legacy systems.
Our security operating systems and video network software, which collect data from large, distributed arrays of sensors and imagers, are extremely robust and stable—a core requirement of all security-related software. At the same time, these are scalable, open-architecture systems that can control and communicate with a very broad range of security hardware, wired and wireless communications networks, and support hardware (such as camera platforms, floodlights, generators, batteries, solar panels, and fuel tanks). Our objective is to make our software the industry-standard security operating system.
The software in our surveillance towers, for example, can monitor, control and integrate distributed arrays of cameras, sensors, high-intensity spotlights, fuel levels in power generators, battery levels, backup solar panels and communication systems. We integrate our infrared cameras with radar, acoustic and other sensors provided by other manufacturers. These cameras can easily link to large, integrated security systems through our Internet Protocol control and video interface. In addition, our AirSentinel product is easily connected to existing control and alarm networks in buildings. The modular architecture of the AirSentinel also makes it easy to network with chemical, radiological and explosive detectors supplied by us or other vendors.
We also embed a great deal of software directly in our products. Highly sensitive sensors and imagers require advanced algorithms and high-speed processors to separate signal from noise, and to transform large streams of raw data into readily accessible information. Our infrared cameras, for example, produce a high- resolution picture from the signal generated by a focal plane array. The software that does this incorporates a deep understanding of how focal plane arrays actually operate in thermally noisy environments. Our software skills are tied to our understanding of high-tech sensing and imaging products, on the one hand, and the practical imperatives of supervision and control on the other.
16
Table of Contents
Intellectual Property
We rely on our patents, trade secret laws, contractual provisions, licenses, copyrights, trademarks and other proprietary rights to protect our intellectual property. We currently have numerous issued or pending patents. We cannot guarantee that our pending patent applications will be approved. We focus our patent efforts in the United States and, when justified by cost and strategic importance, we file corresponding foreign patent applications in foreign jurisdictions.
Much of our intellectual property resides in software, firmware, trade secrets and the technical know-how of our employees. The design of compact, efficient radars, for example, is a specialized craft, and we owe the success of our radar products in large part to the skills of our design engineers. The same principle is true for our networking and software systems.
We cannot assure you that the measures we have implemented to prevent misappropriation of our intellectual property are sufficient or will be successful. Competitors may copy our technologies or products, or obtain and use information that we consider proprietary, without our permission. Competitors may also recruit our employees who have access to our proprietary technologies. Intellectual property litigation is often extremely expensive, and the cost of enforcing our patents and other intellectual property may be burdensome or prohibitive.
Many companies and inventors in the technology markets in which we operate file patents. In addition, these companies and inventors may assert other types of intellectual property rights. In the future, others may allege that we are infringing on their intellectual property. Lawsuits stemming from such allegations could limit our sales, expose us to significant liability for damages, force us to shoulder significant litigation costs and consume management time and other resources.
Research and Development
In 2009, 2008 and 2007, we invested approximately $15.3 million, $21.4 million and $20.5 million, respectively, for internally funded research and development activities and have recognized revenue of approximately $54.2 million, $40.9 million and $30.7 million, respectively, under contracts which provide external funding to conduct research and development, respectively.
We conduct research and development for programs we believe will advance our technology and products and strengthen our leadership position in the security market.
We have received funding support from a wide variety of federal agencies including the Defense Threat Reduction Agency (chemical agent detection), National Institute of Standards and Technology and the National Science Foundation (photonic crystals), DARPA and DHS (biohazard and explosive sensors), DHS and the Air Force Research Labs (high-power lasers), the Army Night Vision Labs (surveillance towers) and the Naval Air Warfare Center (millimeter-wave radar). Our participation in these and other development programs has culminated in the development of a significant number of commercial products. In general, our U.S. government contracts permit us to retain all rights in patents emerging from the funded research and development, subject to the U.S. government’s non-exclusive, non-transferable, irrevocable paid-up license to practice, or to have practiced on its behalf, throughout the world, any technology developed in the performance of such contracts. In addition, the government possesses the right to allow others to use such technology if, among other things, we fail expeditiously to bring products to market or commercialize products based on such technology.
A number of our technologies and key employees came out of the science and engineering departments of leading universities. We have maintained significant connections with leading academic personnel working in fields relevant to our technology and research and development efforts and often hire these academic personnel as consultants. We maintain offices in close proximity to these universities and contract to use their laboratory instruments and tools. We participate with these universities in major government-funded development programs.
17
Table of Contents
We plan to continue to seek government research and development funding for the development of core enabling technologies. We plan to focus our own research and development spending on turning technologies into commercial products, improving product performance and integrating our technologies into multi-function products.
Manufacturing
We manufacture components and products at 16 facilities in the United States and at our facilities in Canada and Germany. We generally conduct the specialized manufacturing that is specific to our technology and core expertise, such as polymer and chemical synthesis, and perform final assembly and quality assurance testing at our own facilities. We seek to avoid any single-supplier dependence, and have identified, or are in the process of identifying, qualified alternative suppliers of critical components. We typically outsource to unaffiliated third parties mold fabrication and plastics injection molding, most circuit board manufacturing and assembly, antenna manufacturing, optics manufacturing, wiring of certain electronic systems and other more routine operations. Unaffiliated third parties also supply specific components of some of our products, such as electrical components and detectors for infrared cameras. While our customers define the performance criteria or characteristics of our products, we have established internal procedures for final test and calibration of key devices and components, and in some cases the calibration process itself is a core, proprietary technology.
Although we have sufficient manufacturing capacity for our existing operations, we expect that we will need to expand some of our manufacturing capacity as our sales increase. Our operating units plan to share manufacturing expertise and resources in the future, and consolidate some of their outsourcing contracts. We believe this will increase our manufacturing efficiency and reduce costs.
Competition
Our diverse product portfolio places us in competition with a wide variety of companies in the homeland security, defense and industrial sectors. Our markets are highly competitive and dynamic. Our many competitors include both a wide variety of small companies with single-point solutions or products and a number of very large and well-established enterprises, including divisions and subsidiaries of Axis AB, BAE Systems, plc, Canberra Industries, Inc., DRS Technologies, Inc., FLIR Systems Inc., General Electric Company, Goodrich Corporation, Honeywell International, Inc., L-1 Identity Solutions Inc., L-3 Communications CE Holdings, Inc., Nice Systems Ltd., RAE Systems, Inc., SAIC, Inc., Smiths Detection and United Technologies Corporation. We do not compete with any one large competitor across the full range of our product portfolio. Many of our competitors have much greater research and development, sales and marketing, manufacturing and financial resources than we have. We expect that competition will increase as other established and emerging companies enter our markets and as new products and technologies are introduced.
We expect our markets to remain highly competitive and dynamic and to reflect rapid technological evolution and continuously evolving customer requirements. Our ability to compete successfully will depend on a number of factors including our ability to:
| • | develop, adapt and apply new technologies to meet customer needs; |
| • | develop products that reduce costs, that are easy to deploy and that can be integrated into larger systems and networks; |
| • | establish and maintain relationships with key government customers, including government agencies and prime contractors on government projects; and |
| • | recruit and retain qualified personnel, particularly technical personnel. |
Employees
As of December 31, 2009, we had 817 employees, of which 653 were located in the United States, 99 were located in Canada, 64 were located in Germany and 1 was located in Dubai. As of December 31, 2009,
18
Table of Contents
approximately 564 of our employees were primarily engaged in engineering, research and development and production, approximately 105 of our employees were primarily engaged in sales and marketing, and approximately 148 of our employees were primarily engaged in operations, general and administration, quality assurance and customer service.
Regulatory
A number of our advanced technology products are subject to U.S. export control laws and regulations, which have certain registration, licensing and recordkeeping requirements for sales and transfers to foreign persons. These regulations include the U.S. Department of State’s International Traffic in Arms Regulations (ITAR), the U.S. Department of Commerce’s Export Administration Regulations (EAR), the U.S. Department of Treasury’s sanctions regulations, and other U.S. export control laws and regulations. Another key law in this regulatory field is the Foreign Corrupt Practices Act (FCPA). We have a compliance system to identify those products and technologies subject to certain export control regulatory restrictions and, where required, we obtain authorization from the relevant federal agency for sales to foreign buyers or for disclosures and/or technology transfers to foreign consultants, companies, universities, investment partners or foreign national employees.
Our products are utilized by all branches of the U.S. military and by some foreign armed forces, and much of our research is funded by DoD agencies such as DARPA and DTRA. Many of the products we develop through our research and development program are characterized as “defense articles” on the ITAR’s U.S. Munitions List, and we are registered with the U.S. Department of State as both a manufacturer and exporter of such munitions items. Other products and technologies with dual-use military and commercial application, such as chemical detectors for environmental safety purposes, are controlled under the EAR’s Commerce Control List, and we have export compliance systems for determining the proper export licensing requirements for such products and technologies and for obtaining all necessary licenses. Under U.S. sanctions laws, we are prohibited from exporting our products, technology or services to embargoed countries such as Cuba, Iran, Syria or Sudan, or to terrorist-supporting entities, and our compliance system is structured to address these restrictions as well. Federal law prohibits the payment of bribes or other corrupt payments to get or retain business, and we are mindful of such prohibitions on corrupt payments. Our overseas subsidiaries must abide by the applicable provisions of U.S. export control law and the related export control laws of the countries in which they are located. The U.S. export control laws and regulations place licensing restrictions on transfers of technology to our foreign subsidiaries and certain personnel within the foreign subsidiaries, and export licenses or other appropriate authorizations are obtained, as appropriate, from the U.S. Department of State or the U.S. Department of Commerce, when required by law.
Compliance with U.S. export control laws and regulations is a challenge for any high technology company involved in export activities. An effective compliance program includes periodic internal auditing and monitoring of export transactions. In any acquisition, the successor company must ensure that the acquired firm is complying with the requirements of U.S. export control regulations and must see that deficiencies are promptly identified and corrected. We have such a practice and establish export compliance standards for all of our subsidiaries, while recognizing the special compliance demands necessitated by certain sensitive technologies or workforce makeup. Violations of any of the various U.S. export control laws can result in significant civil or criminal penalties, or even a denial of export privileges. We recognize that an effective compliance program can help protect the reputation and relationship of a regulated company with the federal agencies administering these laws. Each of the regulatory agencies administering these laws has a voluntary disclosure program that offers the possibility of significantly reduced penalties, if any are applicable, and we have utilized these agency disclosure procedures as part of our overall compliance policy and system of internal controls.
Under the “SAFETY Act” provisions of The Homeland Security Act of 2002, and its implementing regulations, the federal government provides certain liability limitations and a presumption that the “government contractor” defense applies if the Department of Homeland Security “designates” or “certifies” technologies or products as “qualified anti-terrorism technologies,” and if certain other conditions apply. We may seek to qualify
19
Table of Contents
some or all of our products and technologies under the SAFETY Act’s provisions in order to obtain such liability protections, but there is no guarantee that the Department of Homeland Security will designate or certify our products and technologies as a qualified anti-terrorism technology. To date, our Fido Portable Explosives Detector has been designated as a qualified anti-terrorism technology, but our other products have been sold without such qualification, and we may continue to sell our products and technologies without such qualification. To the extent we do so, we will not be entitled to the benefit of the SAFETY Act’s limitations on tort liability, or to any U.S. government indemnification.
Additional Information
We file registration statements, periodic and current reports, proxy statements, and other materials with the Securities and Exchange Commission (SEC). You may read and copy any materials we file with the SEC at the SEC’s Office of Public Reference at 100 F Street, NE, Washington, D.C. 20549. You may obtain information on the operation of the Public Reference Room by calling the SEC at 1-800-SEC-0330. The SEC maintains a web site at www.sec.gov that contains reports, proxy and information statements and other information regarding issuers that file electronically with the SEC, including our filings. Other than the information expressly set forth in this Form 10-K, the information contained or referred to on our website is not part of this annual report. We make available, free of charge, through the investor relations section of our website (www.icxt.com), our annual reports on Form 10-K, quarterly reports on Form 10-Q and current reports on Form 8-K, and any amendments to those reports filed pursuant to Section 13(a) or 15(d) of the Securities Exchange Act of 1934, as amended, as soon as reasonably practicable after they are electronically filed with or furnished to the SEC.
| Item 1A. | RISK FACTORS |
Risks Related to Our Operations and Corporate Structure
Our future performance may be difficult to predict due to the nature of our business.
Most of our business is based on acquisitions that we have completed since June 2005. We may encounter new or unexpected difficulties in our future operations or fail to achieve expected benefits from these acquisitions. We may also have difficulty forecasting our future results because our business is affected by fluctuations in demand for our products, including fluctuations caused by new security threats, new products introduced by our competitors, delays, cancellations or variations in orders from U.S. governmental customers due to the change in Presidential Administration, a change in governmental policy or a shift in governmental priorities and other customer order variations or cancellations. If we underestimate demand and build too little inventory, we could lose sales opportunities and disappoint customers. If we overestimate demand and build too much inventory, we could consume working capital unnecessarily and experience inventory write-offs.
Our business depends on the development of markets for detection and surveillance products and solutions.
Our products and services are designed to address the markets for detection, surveillance and integrated solutions. Our products and services are targeted to both governmental and private sector markets. These markets and the types of products and services sold in these markets are emerging. Our ability to grow will depend in part on the rate at which markets for our products develop and on our ability to adapt to emerging demands in these markets. In particular, our business depends on our ability to offer a broader range of products and services to meet demand for integrated solutions. In addition, geopolitical developments, terrorist attacks and government mandates may cause sharp fluctuations in the demand for our products.
A substantial portion of our future sales will depend on the success of products that we have introduced recently. It is too early to predict how commercially successful these products may be. Some of them define new market categories with no historical record of demand and in which demand may develop slowly. Some of our new products are still undergoing trials, or have too short of a history of operation in the field to establish
20
Table of Contents
evidence that they meet long-term customer needs. This may slow the adoption of these products by security conscious customers that demand proof of long term reliability. Some of our products could encounter unanticipated problems in deployment and use, or when attempts are made to integrate them into existing systems and operations. Our ability to maintain or grow our revenues will be significantly limited if our new products fail to gain market acceptance.
A substantial portion of our revenues depends on sales to the U.S. government and could be affected by changes in federal funding levels.
Agencies and departments of the U.S. government account for a substantial portion of our revenues from product sales and substantially all of our revenues from research and development contracts. We and other U.S. defense contractors have benefited from an upward trend in overall U.S. defense spending in the last few years and are counting on significant revenues from U.S. government contracts for the foreseeable future. This trend continued with the former President’s budget request for fiscal year 2009, which reflected the continued commitment to modernize the Armed Forces and sustain current capabilities while prosecuting the war on terrorism. However, U.S. government programs are limited by budgetary constraints and are subject to uncertain future funding levels that could result in the termination of programs. Future defense budgets and appropriations for our programs and contracts may be affected by differing priorities of the new Administration, including budgeting constraints stemming from the economic recovery and stimulus plans. A decline in security-related government spending, or a shift away from our offerings or programs that we address, could hurt our sales, put pressure on our prices and reduce our revenues and margins.
We rely in part on original equipment manufacturers (OEMs) and distribution partners to sell some of our products, and we may be adversely affected if those parties do not actively promote our products or pursue installations that use our products.
A significant portion of our revenue comes from sales to partners, including OEMs, systems integrators, distributors and resellers. Some of these relationships have not been formalized in a detailed contract and may be subject to termination at any time. Even where these relationships are formalized in a detailed contract, the agreements can often be terminated with little or no notice and are subject to periodic amendment. We cannot control the amount and timing of resources that our partners devote to activities on their behalf. We intend to continue to seek strategic relationships to distribute, license and sell certain of our products. However, we may not be able to negotiate acceptable relationships in the future and cannot predict whether current or future relationships will be successful.
A substantial portion of our revenues depends on sales to prime contractors and system integrators.
We rely on a substantial portion of our revenues on contracts in which we act as a subcontractor to other contractors, typically prime contractors and system integrators who sell directly to government agencies or private customers. For the fiscal years ended December 31, 2009, 2008 and 2007, we derived approximately 30%, 29% and 38%, respectively, of our revenues from these contracts. We expect to continue to depend on these relationships for a significant portion of our revenues in the foreseeable future. Our sales will suffer if these contractors and system integrators fail to compete successfully against their competitors, if government agencies cut relevant spending, or if these contractors and system integrators purchase products from our competitors, or develop competing products of their own, or reduce their purchases from us for other reasons. Our ability to sell to customers who prefer to work with large system integrators will depend on our ability to develop and maintain strong relationships with the large system integrators.
If we do not successfully expand our direct sales and service organizations and partnering arrangements, we may not be able to increase our sales or adequately support our customers.
We sell substantially all of our services and license substantially all of our products through our direct sales organization. Our future success depends on substantially increasing the size and scope of our direct sales force
21
Table of Contents
and partnering arrangements, both domestically and internationally. We expect to face intense competition for personnel and we cannot guarantee that we will be able to attract, assimilate or retain additional qualified sales personnel on a timely basis. Moreover, given the large-scale deployment required by some of our customers, we anticipate the need to hire and retain a number of highly trained customer service and support personnel. We cannot guarantee that we will be able to increase the size of our customer service and support organization on a timely basis to provide the high quality of support required by our customers. Failure to add additional sales and customer service representatives could result in our inability to increase sales and support our customers.
The lengthy sales cycles of our products may cause our revenues to fluctuate substantially.
Customers evaluating our products must often make very difficult choices about product capabilities and costs. Many of our customers buy our products to implement or enhance large security projects. Our larger customers take longer to evaluate our products and place new orders. For these and other reasons, our products typically have long sales cycles. Sales are often delayed or cancelled for reasons that we cannot control. Delays and cancellations could significantly affect revenues reported for any given financial quarter.
We compete against companies that have longer operating histories, more established products and greater resources.
We face substantial competition in the advanced security technology industry. Many companies are actively developing and marketing detection, surveillance and systems and software products that compete against our products, or may soon do so. Our competitors include very large and experienced enterprises, including BAE Systems, plc, Canberra Industries, Inc., DRS Technologies, Inc., FLIR Systems Inc., General Electric Company, Goodrich Corporation, Honeywell International, Inc., L-3 Communications CE Holdings, Inc., RAE Systems, Inc., SAIC, Inc., Smiths Industries, Ltd. and United Technologies Corporation. Our competitors also include many smaller companies, including companies established to pursue new and emerging technologies.
Our competitors may successfully develop technologies that outperform our technologies, respond better to customer requirements, cost less or otherwise gain greater market acceptance. Many of our competitors have longer operating histories, greater financial, engineering, manufacturing, sales and marketing resources, greater name recognition, larger customer bases and longer standing customer relationships than we have. Our larger competitors may be able to better manage large or complex contracts, maintain a broader geographic presence, compete more effectively on price, or provide a greater level of customer support. Our smaller competitors typically focus on fewer products than we do, and they are often well entrenched in their chosen markets. Any of these competitors may be able to respond more quickly to new technology, market developments or pursue new sales opportunities more effectively that we can.
Our ability to compete depends on our ability to innovate successfully and quickly.
We may lose our competitive position if we fail to innovate and develop new products quickly. Advanced security technologies are evolving rapidly, product life cycles are short and technologies can become obsolete. Our ability to compete will depend on our ability to design, develop, manufacture, assemble, test, market, sell and support new products and enhancements quickly and cost effectively. Our business will depend on how well we respond to evolving government and industry standards, and changing customer requirements. The lack of standardization in our industry may impede market acceptance of innovative products that we successfully develop. If, for any of these or other reasons, any of our technologies fail to gain acceptance in the market, we will not recoup our development costs, and we will have to attempt to develop new technologies and products. We cannot assure that we can do so successfully, cost effectively or quickly enough.
22
Table of Contents
Some of our customers and operations are located outside of the United States, which subjects us to additional international risks.
We conduct some of our business with and through companies located outside the United States. We also have manufacturing facilities in Germany and Canada. As a result of our international operations and sales, we face a number of challenges, including:
| • | increased complexity and costs of managing and staffing international operations; |
| • | compliance with foreign technical standards; |
| • | compliance with domestic and foreign laws and regulations, including import and export control laws, tariffs and other barriers; |
| • | timing and availability of import and export licenses; |
| • | longer and more difficult collection of receivables; |
| • | limited protection of our intellectual property and limited ability to enforce legal rights and remedies; |
| • | unanticipated changes in foreign and domestic legal and regulatory requirements, including tax regulations; and |
| • | foreign currency exchange fluctuations relating to our international operating activities. |
Because we anticipate that we will continue to depend on companies operating in various countries around the world for a significant part of our revenues and growth, these risks and issues that we cannot anticipate could adversely affect our ability to conduct business outside of the United States and our results of operations.
Our business has inherent operational risks that cannot be adequately covered by insurance or indemnity, and our products and technologies may not qualify for protection under the SAFETY Act.
We may face unanticipated risks of legal liability for damages caused by the actual or alleged failure of technologies or services that we supply. Our products may be deployed in response to an emergency or terrorist attack, which may increase our exposure to third-party claims. Many of our technologies are unproven, or have yet to be deployed for actual end-user activities. We may face liabilities related to these products. While we have attempted to secure appropriate insurance coverage at appropriate cost, it is impossible to insure against all risks that inhere in our industry, nor can we assure you that our insurers will pay a particular claim, or that we will be able to maintain coverage at reasonable rates in the future. Substantial claims resulting from an accident in excess or not otherwise covered by indemnity or insurance could harm our financial condition and operating results. Our insurance policies also contain deductibles, limitations and exclusions which increase our costs in the event of a claim.
Under the “SAFETY Act” provisions of The Homeland Security Act of 2002, the federal government provides liability limitations and the “government contractor” defense applies if the Department of Homeland Security “designates” or “certifies” technologies or products as “qualified anti-terrorism technologies,” and if certain other conditions apply. We may seek to qualify some or all of our products and technologies under the SAFETY Act’s provisions in order to obtain such liability protections, but there is no guarantee that the U.S. Department of Homeland Security will designate or certify our products and technologies as a qualified anti-terrorism technology. Our Fido Portable Explosives Detector has been designated as a qualified anti-terrorism technology, but our other products have been sold without such qualification, and we may continue to sell our products and technologies without such qualification. To the extent we do so, we will not be entitled to the benefit of the SAFETY Act’s cap on tort liability or U.S. government indemnification. Any indemnification that the U.S. government may provide may not cover certain potential claims.
We have incurred operating losses since our inception and as a result we may not achieve or sustain profitability.
We have incurred significant operating losses since our inception. We had consolidated operating losses of approximately $7.6 million in 2009, $25.4 million in 2008 and $36.1 million in 2007. As of December 31, 2009,
23
Table of Contents
we had an accumulated deficit of $215.1 million. While our operating expenses declined in 2009 as compared to 2008 and 2007 due to efficiencies in the overall integration of our business units and emphasis on cost control, we cannot provide assurance that operating expenses will continue to decline.
Because of the numerous risks and uncertainties associated with our business, we are unable to guarantee whether or when we will achieve profitability. If our revenues do not increase, or if our expenses increase at a greater rate than our revenues, we will not become profitable. Even if we do become profitable, we may not be able to sustain or increase our profitability on a quarterly or annual basis.
A number of other factors may cause our consolidated operating results to fluctuate on a quarterly or annual basis, which may make it difficult to predict our future operating results.
We expect our consolidated revenues and expenses to fluctuate, making it difficult to predict our future operating results. Factors that could cause our operating results to fluctuate include:
| • | demand in the markets that we serve; |
| • | our ability to define, design and release new products that meet customer needs, and to do so quickly and cost effectively; |
| • | market acceptance of new and enhanced versions of our products; |
| • | the forecasting, scheduling, rescheduling or cancellation of orders by our customers; |
| • | the timing, performance and pricing of new product introductions by our competitors; |
| • | variations in the performance of our businesses; |
| • | the timing and availability of adequate manufacturing capacity from our manufacturing suppliers; |
| • | our ability to forecast demand in the markets that we serve; |
| • | the mix of products that we sell; |
| • | the length of our sales cycles; |
| • | the lack of backlog of orders for our products; |
| • | liquidity and cash flow of our distributors and end-market customers; |
| • | the timing of our acquisitions; |
| • | general economic conditions in the countries where we operate or our products are used; and |
| • | changes in accounting principles or practices, exchange rates, interest rates, tax rates and tax withholding. |
Any of the above factors, many of which are beyond our control, could significantly harm our business and results of operations. The results of a prior quarter or annual period should not be relied upon as an indicator of future operating performance.
We may have difficulty scaling production to large volumes. If we are unable to meet demand or efficiently increase production, customers may turn to products offered by competitors and our operating results could be harmed.
We could have substantial difficulty dealing with rapid growth. If demand for our products increases rapidly, we will need to expand internal production capacity or implement additional outsourcing. Success in developing, manufacturing and supporting products manufactured in small volumes does not guarantee comparable success in operations conducted on a larger scale. Modifying our facilities to increase production capacity may delay delivery of our products. Manufacturing efficiencies, yields and product quality may decline
24
Table of Contents
as production volumes increase. In addition, component costs, overhead and other production costs may rise. If we are unable to meet the demand of our customers and deliver products quickly and cost effectively, customers may turn to our competitors. The costs associated with implementing new manufacturing technologies, methods and processes, including the purchase of new equipment, and any resulting delays, inefficiencies and loss of sales, could harm our results of operations.
We purchase certain component parts from a limited number of third-party suppliers, and are therefore subject to limitations in supply which could result in delays of product shipments and could damage our business and operating results.
We currently purchase component parts used in the manufacture of our products from a limited number of third-party suppliers and currently rely on a single source of supply in some cases, including for certain semiconductor components. We depend on these suppliers to meet our needs. Moreover, we depend on the quality of the products supplied to us over which we have limited control. From time to time in the future, we may encounter shortages and delays or transportation problems in obtaining components, or defects in the components we purchase. There may be interruptions in the manufacture of our products and we might not be able to supply products in a timely manner or with the quality required by our customers, and our revenues and customer relationships could be harmed.
Our ability to operate and grow our business effectively will depend on retaining key employees and management, and hiring skilled and experienced personnel. If we lose the services of any key personnel or are unable to hire additional personnel, our business could be harmed.
Our success has been highly dependent on the experience, relationships and technical knowledge of our key senior management and technical employees. Our future will depend on our ability to retain their services. The loss of key employees could harm development and sales of our products, slow our growth and otherwise harm our business.
Our ability to operate and grow our business also depends on our ability to attract, retain and motivate highly skilled scientists, engineers and other technical personnel. We face intense competition for the services of such employees. The nature of our business also makes it difficult for us to hire employees who are not citizens or permanent residents of the United States.
If we fail to retain and motivate our current employees, or fail to attract new employees with comparable skills, we will be unable to enhance existing products and develop new ones, and our business will suffer. Hiring difficulties may also force us to incur higher than anticipated costs in recruiting, relocating and compensating employees who have the skills we need, and these increased costs may hurt our margins and limit our ability to make necessary hires.
Several of our officers and directors may have divided responsibilities which could divert management time and create potential conflicts of interest.
Our executive chairman, Hans Kobler, serves on the investment advisory committee of Digital Power Capital, LLC, which is indirectly our largest stockholder and an affiliate of Wexford VI Advisors LLC, and has an interest in the profits earned on certain Wexford investments, including Wexford’s investment in us. Some of our other executives may serve on outside boards from time to time, as well. These divided responsibilities divert management time from our business and could create potential conflicts of interest.
Wexford Capital, LLC and its affiliates, our principal stockholders, beneficially own and control a significant amount of our common stock, giving them substantial influence over our corporate transactions and other matters. Their interests may conflict with yours, and the concentration of ownership of our common stock will limit your influence and the influence of our other stockholders.
Wexford and its affiliates beneficially own and control approximately 62% of our outstanding common stock as of the date of this Annual Report. Wexford is able to exercise control over matters requiring stockholder
25
Table of Contents
approval, including the election of directors, changes to our charter documents, mergers, corporate control contests and other significant corporate transactions. As long as this concentration of ownership persists, it is unlikely that any other holder or group of holders of our common stock will be able to affect the way we are managed or the direction of our business. The interests of Wexford could conflict with the interests of our other stockholders. This concentration of ownership could also discourage a potential acquirer from making a tender offer or otherwise attempting to obtain control of us, or could otherwise delay or prevent a change in control transaction or other business combination, which could in turn have an adverse effect on the market price of our common stock.
We may divest assets to reflect changes in our strategy.
From time to time, we have divested businesses and assets which we have determined no longer fit our strategy. We may undertake divestiture transactions when we believe there is a financial or strategic benefit to us in doing so. Such divestitures, should they occur, may result in losses. There may also be risks, costs and liabilities that we incur or retain in connection with these divestitures. We may be unable to successfully divest non-strategic assets and, if we incorrectly evaluate the strategic fit and valuation of divested businesses or assets, we may forego opportunities that would otherwise have benefited our business.
Our strategy for future acquisitions may be costly to implement and difficult to manage.
We intend to continue to grow our business through acquisitions of additional companies. Successful execution of our acquisition strategy will depend on many factors including locating suitable companies, negotiating acceptable terms, successfully consummating the acquisitions and obtaining required financing on acceptable terms. We may incorrectly assess new businesses or technologies that we do acquire, fail to realize anticipated benefits from these acquisitions or fail to exploit anticipated opportunities. In addition, we may face difficulties retaining qualified personnel, managing relationships with customers and integrating newly acquired businesses and operations into our existing infrastructure. We also may enter markets in which we have limited or no prior experience or incur future impairment charges and other charges which could adversely affect our results of operations.
As part of our acquisition strategy, we intend to evaluate transactions that are large in relation to our current size. One or more such transactions, should it occur, may entail risks that are currently unforeseen. A large acquisition or similar transaction could entail fundamental changes to the nature of our business and assets, and could result in changes in our strategic direction that may ultimately prove unsuccessful.
Our acquisition strategy may require more capital and result in more expenses than we anticipate, including greater than anticipated acquisition purchase prices and operating and other acquisition-related expenses. Our acquisition strategy depends in part on negotiating appropriate acquisition contracts, and we may fail to anticipate or provide for unknown or unanticipated events and incur costs arising from litigation of acquisition-related disputes. There also may be costs and liabilities that we fail or are unable to discover in the course of performing due diligence investigations on each company or business that we have already acquired or may acquire in the future. If acquisition purchase prices, liabilities and transaction costs exceed our estimates, we may need to raise more capital by incurring debt or issuing more stock, which may significantly reduce the equity interests of our stockholders.
If we fail to maintain an accurate system of internal controls, we may not be able to accurately report our financial results, which could adversely affect our stock price.
Compliance with the Sarbanes-Oxley Act of 2002 and related requirements is costly and places a burden on our management. During the years ended December 31, 2009 and 2008, we documented, reviewed, tested and where appropriate improved our internal controls and procedures in conjunction with the requirements of Section 404 of the Sarbanes-Oxley Act of 2002, which requires a management assessment and overall conclusion of the effectiveness of our internal control over financial reporting. We are required to conduct an annual
26
Table of Contents
evaluation of our internal control over financial reporting and include a management report on our internal control over financial reporting. Beginning with our Annual Report on Form 10-K for the year ended December 31, 2010, we are also required to include a report by our independent registered public accounting firm addressing the effectiveness of our internal controls over financial reporting. Any failure to maintain an effective system of internal controls and comply with Section 404 of the Sarbanes-Oxley Act of 2002, or any other problems with our financial systems or internal controls, could result in delays or inaccuracies in reporting financial information or failure to comply with SEC reporting and other regulatory requirements, any of which could adversely affect our business and stock price.
Our ability to use net operating losses to offset future taxable income may be subject to certain limitations.
In general, under Section 382 of the Internal Revenue Code, a corporation that undergoes an “ownership change” is subject to limitations on its ability to utilize its pre-change net operating losses (NOLs) to offset future taxable income. We may have undergone an ownership change in the past in connection with issuances of our stock in financings and acquisitions. The existing NOLs of some of our subsidiaries currently will be subject to limitations arising from ownership changes prior to their acquisition by us. Furthermore, our ability to utilize NOLs of companies that we may acquire in the future may be subject to limitations. If we undergo an ownership change in the future, our ability to utilize NOLs could be further limited by Section 382 of the Internal Revenue Code.
We may not realize the full amount of revenues reflected in our backlog, which could harm our operations and significantly reduce our future revenues.
There can be no assurances that our backlog estimates will result in actual revenues in any particular fiscal period because our clients may modify or terminate projects and contracts and may decide not to exercise contract options. Our backlog represents sales value of firm orders for products and services not yet delivered and, for long term executed contractual arrangements (contracts, subcontracts, and customer commitments), the estimated future sales value of estimated product shipments, transactions processed and services to be provided over the term of the contractual arrangements, including renewal options expected to be exercised. For contracts with indefinite quantities backlog reflects estimated quantities based on current activity levels. Our backlog includes estimates of revenues the receipt of which require future government appropriation, option exercise by our clients and/or is subject to contract modification or termination. At December 31, 2009, our funded backlog approximated $53 million, the majority of which is estimated to be realized in the following twelve months.
These estimates are based on our experience under such contracts and similar contracts, and we believe such estimates to be reasonable. If we do not realize a substantial amount of our backlog, our operations could be harmed and our future revenues could be significantly reduced.
Our success and competitive position depend significantly on our ability to obtain and protect intellectual property. Failure to protect our intellectual property rights would impair our ability to compete effectively and defend ourselves from any third party claims that we are infringing others’ intellectual property rights.
We rely on a combination of patents, copyrights, trademarks, service marks, trade secrets, confidentiality provisions and licensing arrangements to establish and protect our intellectual property. For example, we have entered into confidentiality agreements with our employees, consultants and business partners and have controlled access to, and distribution of, our documentation and other proprietary information. We intend to continue filing patent applications to protect most of the new processes and technologies that we develop. However, we anticipate that patent protection will not be available for some of these processes or technologies. Failure to protect our intellectual property could affect our ability to secure additional contracts or preserve market advantages when we commercialize our products.
Our efforts to protect our intellectual property rights may not:
| • | prevent challenges to, or the invalidation or circumvention of, our existing intellectual property rights; |
27
Table of Contents
| • | prevent our competitors from independently developing similar products, duplicating our products or designing around any patents that may be issued to us; |
| • | provide adequate protection for our intellectual property rights; |
| • | prevent disputes with third parties regarding ownership of our intellectual property rights; |
| • | prevent disclosure of our trade secrets and know-how to third parties or their release into the public domain; or |
| • | result in valid patents, including international patents, from any of our pending applications. |
Others may attempt to copy or otherwise obtain and use our proprietary technologies without our consent. Monitoring the unauthorized use of our technologies is difficult. There is a significant risk that our customers or their end-user customers may attempt to copy or otherwise obtain and use our proprietary technologies without our consent.
We may find it necessary to litigate against others, including our customers, to protect our intellectual property and to challenge the validity and scope of the proprietary rights asserted by others, and we could face counterclaims. Legal disputes with customers could substantially harm our relationships and sales. Litigation is inherently uncertain, and an adverse outcome could subject us to significant liability for damages or invalidate our proprietary rights. The complexity of the technology involved and inherent uncertainty and cost of intellectual property litigation increases our risks.
Third parties may claim that we are infringing on their intellectual property rights, and we may already be infringing without knowing it. We may face additional liability when we agree to indemnify our customers against third party infringement. If a third party establishes that we are infringing its intellectual property rights, or that our intellectual property rights are invalid, we may be forced to change our products, services, or manufacturing processes, and such changes may be expensive or impractical. We may then be forced to seek royalty or license agreements. If we are unable to agree on acceptable terms we may be required to discontinue products or halt other aspects of our operations. We may also be liable for significant damages. Even if intellectual property claims brought against us are without merit, the litigation may be costly and time consuming, and may divert our management and key personnel from operating our business.
The U.S. government’s right to use technology developed by us limits our intellectual property rights.
We seek to protect the competitive benefits we derive from our patents, proprietary information and other intellectual property. However, we do not have the right to prohibit the U.S. government from using certain technologies developed by us or to prohibit third party companies, including our competitors, from using those technologies in providing products and services to the U.S. government. The U.S. government has the right to royalty-free use of certain technologies that we have developed under U.S. government contracts. We are free to commercially exploit those government-funded technologies and may assert our intellectual property rights to seek to block other non-government users thereof, but we cannot assure you that we could successfully do so.
Our efforts to protect our intellectual property may be less effective in some foreign countries where intellectual property rights are not as well protected as in the United States.
Our subsidiaries have not consistently sought patent protection or registered our trademarks outside the United States, which may impair our ability to use or protect our technology and brand in foreign jurisdictions. The laws of some foreign countries, including countries in which we have sold and will continue to sell our products, protect proprietary rights less broadly than do the laws of the United States. Many U.S. companies have encountered substantial problems in protecting their proprietary rights in such countries, and there is a risk that we will encounter similar problems. If our competitors in these countries copy our technology without our permission, our sales and operations will be harmed.
28
Table of Contents
Our business is subject to environmental regulation that could result in compliance costs. Any violations or liability under environmental laws could harm our business.
We are subject to environmental and safety laws and regulations governing the use, storage and disposal of hazardous substances or wastes and imposing liability for the cleanup of contamination from these substances. We cannot completely eliminate the risk of contamination or injury from these substances or wastes, and, in the event of such an incident, we could be held liable for any damages that result. In addition, we may be required to incur significant additional costs to comply with environmental laws and regulations in the future.
The nature of our business may subject us to the risk of litigation.
The markets for our products and services are competitive and may be subject to significant litigation. This includes litigation relating to patent and other intellectual property rights, product liability claims, contract claims and other types of litigation. Litigation can be expensive, lengthy and disruptive to normal business operations. Moreover, the results of litigation are inherently uncertain and may result in adverse rulings or decisions. We may enter into settlements or be subject to judgments that may, individually or in the aggregate, have a material adverse effect on our business, financial condition or results of operations. See Item 3 “Legal Proceedings” for a description of our significant litigation.
Our plans for financing are subject to the uncertain condition of financial markets.
Our ability to obtain additional financing on commercially favorable terms, or at all, is subject to the changing conditions of the financial markets, some of which have been negatively impacted by the ongoing global economic contraction and the reduced ability to obtain debt and equity financing. The potential inability to obtain financing at all may limit our ability to pursue further acquisitions, to fund operating losses and investments in research and product development, production facilities and sales infrastructure, and to provide additional working capital for our businesses.
A portion of our business depends on the availability of performance and payment bonds.
In some markets, our customers may require us to obtain performance and payment bonds. Our ability to enter into performance or payment bonds is subject to uncertain conditions in insurance markets, some of which have been negatively impacted by the ongoing global economic contraction. The potential inability to obtain bonding on commercially reasonable terms or at all may limit our ability to pursue business where bonding is a customer requirement. In some cases it may be necessary to pledge cash or other collateral in connection with obtaining a bond. Pledged cash or collateral may become temporarily or permanently unavailable, resulting in a loss.
Recent economic developments may adversely affect our business, financial condition and results of operations
Current uncertainty in global economic conditions poses a risk to the overall economy and could result in changes in the priorities and timing of spending by our government and commercial customers that are difficult to anticipate. If demand for our products and services decreases due to such changing priorities, we may be required to record an impairment on our long-lived assets, which are primarily comprised of intangible assets, which would increase our expenses. Changes in demand for our products, and changes in our customers’ product needs, could have a variety of negative effects on our competitive position and our financial results, and, in certain cases, may reduce our revenue, increase our costs, lower our gross margin percentage, or require us to recognize impairments of our assets.
Climate change and government laws and regulations related to climate change could negatively impact our financial condition.
In addition to other climate-related risks set forth in this “Risk Factors” section, we are and will be, directly and indirectly, subject to the effects of climate change and may, directly or indirectly, be affected by government
29
Table of Contents
laws and regulations related to climate change. We cannot predict with any degree of certainty what effect, if any, possible climate change and government laws and regulations related to climate change will have on our operations, whether directly or indirectly. While we believe that it is difficult to assess the timing and effect of climate change and pending legislation and regulation related to climate change on our business, we believe that climate change and government laws and regulations related to climate change may affect, directly or indirectly, (i) the cost of the equipment and services we purchase, (ii) our ability to continue to manufacture or operate as we have in the past, (iii) the timeliness of delivery of the materials and services we need and the cost of transportation paid by us and our vendors and other providers of goods or services, (iv) insurance premiums, deductibles and the availability of coverage, and (v) the cost of utility services, particularly electricity, in connection with our operations. In addition, climate change may increase the likelihood of property damage and the disruption of our operations, especially in coastal states. As a result, our financial condition could be negatively impacted by significant climate change and related governmental regulation, and that impact could be material.
Risks Associated with Government Contracts and Regulation
The U.S. government may terminate or modify its existing contracts with us or with government contractors for which we are a subcontractor.
We must comply with and are affected by laws and regulations relating to the formation, administration and performance of U.S. government contracts and subcontracts thereunder, which affect how we do business as a contractor or subcontractor to U.S. government customers and which may impose additional expenses on our business.
There are inherent risks in contracting with the U.S. government. The U.S. government can typically terminate, reduce orders under or otherwise modify any of its contracts with us for its convenience (i.e. without cause) whether or not we have failed to perform under the terms of the applicable contract. In such case, the government would not be required to pay us for the lost profits for the unperformed work. A termination arising out of our default could expose us to liability and harm our ability to compete for future contracts and orders. In addition to unfavorable termination provisions, our U.S. government contracts and related regulations contain provisions that allow the U.S. government to unilaterally suspend us from receiving new contracts pending resolution of alleged violations of procurement laws or regulations, reduce the value of existing contracts, issue modifications to a contract and control and potentially prohibit the export of our services and associated materials. U.S. government contracts may also be terminated if Congress fails to provide funds for the contract.
Our business is subject to laws and regulations that are more restrictive because we are a contractor and subcontractor to the U.S. government.
As a contractor and subcontractor to the U.S. government, we are subject to various laws and regulations that are more restrictive than those applicable to non-government contractors, including the Federal Acquisition Regulation and its supplements, which comprehensively regulate the formation, administration and performance of U.S. government contracts, and the Truth in Negotiations Act and various other laws, which require certain certifications and disclosures. These laws and regulations, among other things:
| • | require that we obtain and maintain material governmental authorizations and approvals to conduct our business as it is currently conducted; |
| • | require certification and disclosure of cost and pricing data in connection with certain contract negotiations; |
| • | impose rules that define allowable and unallowable costs and otherwise govern our right to reimbursement under certain cost-based U.S. government contracts; |
30
Table of Contents
| • | restrict the use and dissemination of information classified for national security purposes and the export of certain products and technical data; and |
| • | impose requirements relating to ethics, business practices, and certain mandatory disclosure requirements which carry penalties for noncompliance ranging from monetary fines and damages to loss of the ability to do business with the U.S. government as a prime contractor or subcontractor. |
In addition, we are subject to industrial security regulations of the U.S. Department of Defense and other federal agencies that are designed to safeguard against unauthorized access by foreigners and others to classified and other sensitive information. If we were to come under foreign ownership, control or influence, our U.S. government customers could terminate, or decide not to renew, our contracts, and such a situation could also impair our ability to obtain new contracts and subcontracts. The government may also change its procurement practices or adopt new contracting rules and regulations that could be costly to satisfy or that could impair our ability to obtain new contracts.
We may not be able to receive or retain the necessary licenses or authorizations required for us to export our products and we may incur regulatory penalties for past compliance failings of our acquired companies.
We must obtain a license from the U.S. government before we may export certain products or technologies from the United States. We cannot be certain that we will obtain any licenses required to export our products to foreign customers or receive authorization from the U.S. government for sales to foreign governments. Failure to receive required licenses or authorizations in a timely manner or at all will limit our ability to export our products and could reduce our revenues.
Any seizure or delay in shipment of our products for failure to obtain a required export license could harm our financial condition and results of operations. Export control laws may also inhibit the free interchange of technical discussions among our employees. Absent license authorization from the appropriate agency, technologies related to our military or dual-use products cannot be discussed with our foreign national employees who are not permanent residents, nor with our foreign subsidiaries. Licensing requirements may delay product development and other engineering or sales activities. In addition, many of our subsidiaries had not adopted formal export compliance programs prior to being acquired by us. For example, two of our subsidiaries engaged in research and development activities that involved the sharing of technical information with foreign national employees related to the development of explosives detectors and nerve gas sensors. This early development work occurred without license approvals and prior to our acquisition of these companies. These subsidiaries have now identified possible gaps in compliance, have made voluntary disclosures to the U.S. Department of State, and have adopted compliance measures to address compliance deficiencies.
Export control agencies are authorized to impose monetary penalties or even to suspend export privileges. While such actions have not been taken against our company to date, such risks exist in this highly regulated field, and we cannot entirely eliminate the possibility that such agency action may occur in the future.
We are subject to audits by the U.S. government which could adversely affect our business.
U.S. government agencies routinely audit and investigate government contractors to monitor performance, cost allocations, cost accounting and compliance with applicable laws, regulations and standards. Since some of our contracts are cost plus a fixed fee, the U.S. government has the right to audit our costs even after job completion and after we have booked the corresponding revenue. The U.S. government also may review the adequacy of, and a contractor’s compliance with, its internal control systems and policies, including the contractor’s purchasing, property, estimating, compensation and management information systems. Any costs found to be improperly allowed or improperly allocated to a specific contract will not be reimbursed, and any such costs that have already been reimbursed must be refunded. While we intend to implement uniform procurement and compliance programs for all of our business, we may be subject to more risks from these audits until we are able to implement such a program effectively. Notwithstanding current compliance, we may be responsible for the lack of compliance, if any, in the past by the companies we have acquired or acquire in the future.
31
Table of Contents
Responding to governmental audits, inquiries, or investigations may involve significant expense and divert the attention of our management. If a government review or investigation uncovers improper or illegal activities, we may be subject to civil and criminal penalties and administrative sanctions, including termination of contracts, forfeiture of profits, suspension of payments, damages, fines and suspension or debarment from doing business with U.S. government agencies. In addition, our reputation could be seriously harmed by allegations of impropriety, even if unfounded.
Our business may increasingly depend upon obtaining and maintaining required security clearances.
We may bid for U.S. government contracts that require our employees to maintain various levels of security clearances and require us or our subsidiaries to maintain certain facility security clearances in compliance with DoD and other government requirements. Obtaining and maintaining security clearances for employees involves a lengthy process, and it is difficult to identify, recruit and retain employees who already hold security clearances. If our employees are unable to obtain or retain security clearances, or if our employees who hold security clearances stop working for us, we may face delays in fulfilling contracts, or be unable to fulfill or secure new contracts, with any customer involved in classified work. Any breach of security for which we are responsible could seriously harm our business, damage our reputation and make us ineligible to work on any classified programs.
Cost over-runs on our contracts could subject us to losses or adversely affect our future business.
Certain of our contracts with the U.S. government are subject to fixed prices, in which we receive a fixed price irrespective of the actual costs we incur. Consequently, any costs in excess of the fixed price are ordinarily absorbed by us. Under time-and-materials contracts, we are paid for labor at negotiated hourly billing rates and for certain expenses. Under cost reimbursement contracts, which are subject to a contract-ceiling amount, we are reimbursed for allowable and allocable costs and ordinarily paid a fee, which may be fixed or performance based. We may not be able to obtain reimbursement for any costs that exceed the contract limits or are not allowable or allocable under the provisions of the contract or applicable regulations. Under each type of contract our financial condition and operating results could be affected materially and adversely if we fail to anticipate technical problems, estimate costs accurately or control costs we incur in performing under the contract. Cost over-runs also may adversely affect our ability to sustain existing programs and obtain future contract awards.
Risks Related to Our Common Stock
The price of our common stock may be volatile and we cannot assure you that the price of our shares will not decline.
The market price of our common stock may fluctuate substantially due to a variety of factors, many of which are beyond our control, including:
| • | political, military and security developments in the United States and worldwide; |
| • | the development of fundamentally new detection, surveillance, active denial and systems and software technologies; |
| • | general and industry-specific economic conditions; |
| • | changes in financial estimates or recommendations by securities analysts; |
| • | sales of our common stock or other actions by investors with significant shareholdings; and |
| • | general market conditions, including the economic contraction and widespread deleveraging. |
The stock markets in general have experienced substantial volatility that has often been unrelated to the operating performance of particular companies. These broad market fluctuations may adversely affect the market price of our common stock.
32
Table of Contents
In the past, stockholders have sometimes instituted securities class action litigation against companies following periods of volatility in the market price of their securities. Any similar litigation against us could result in substantial costs, divert management’s attention and resources and harm our business.
Future sales of our common stock by our stockholders could depress the price of our common stock.
Sales of a large number of shares of our common stock in the public market, or the availability of a large number of shares for sale, could adversely affect the market price of our common stock and could impair our ability to raise funds in subsequent stock offerings. As of December 31, 2009, we had 34,915,021 shares of common stock outstanding and our amended and restated certificate of incorporation authorizes us to issue 250,000,000 shares of common stock. Substantially all of our outstanding shares of common stock are now freely tradable subject to volume and other limitations under Rule 144 of the Securities Act in the case of stockholders who are our “affiliates”. As of December 31, 2009, we had options to purchase a total of 2,449,859 shares outstanding, of which 1,836,940 were vested. In addition, as of December 31, 2009, we had a total of 490,512 shares of unvested restricted stock awards and restricted stock units, and warrants to purchase 127,250 shares of our common stock outstanding. At December 31, 2009, we had an additional 33,297,635 shares available for share-based awards under our stock-based compensation plans. The price of our common stock could decline if there are substantial sales of our common stock or if a large number of shares of our common stock are available for sale.
We currently do not intend to pay dividends on our common stock, and as a result, the only opportunity to achieve a return on an investment in our common stock is if the price appreciates.
We do not expect to pay any cash dividends on our common stock in the foreseeable future. As a result, the only opportunity to achieve a return on an investment in us will be if the market price of our common stock appreciates and shares are sold at a profit.
Our organizational documents and Delaware law have anti-takeover provisions that could delay or prevent a change in control of our company.
In addition to Wexford Capital LLC’s and its affiliates’ ownership of a majority of our common stock, our certificate of incorporation and by-laws and Delaware law contain provisions that could delay or prevent a change in control of our company that stockholders may consider favorable. These provisions include the following:
| • | the ability of our Board of Directors to issue, without stockholder approval, up to 15,000,000 shares of preferred stock with terms set by the Board of Directors, commonly referred to as “blank check” preferred stock, with rights senior to those of our common stock; |
| • | the prohibition of cumulative voting in the election of directors, which would otherwise allow less than a majority of stockholders to elect director candidates; and |
| • | requirements for advance notice of nominations for election to the Board of Directors or for proposing matters that can be acted on by stockholders at stockholder meetings. |
These provisions in our organizational documents and under Delaware law could allow our Board of Directors to affect your rights as a stockholder by making it more difficult for stockholders to replace board members and could discourage takeover attempts. Because our Board of Directors is responsible for appointing members of our management team, these provisions could in turn affect any attempt to replace the current management team. In addition, these provisions could deprive our stockholders of opportunities to realize a premium on their shares of common stock.
| Item 1B. | UNRESOLVED STAFF COMMENTS |
None.
33
Table of Contents
| Item 2. | PROPERTIES |
Our corporate headquarters comprises approximately 7,692 square feet of space located in Arlington, Virginia, approximately 3,545 square feet of which was subleased in 2009. We use this property for corporate, administrative, business development, and other general business needs. We also lease the following facilities:
| Location |
Ownership |
Facilities |
Segment | |||
| 2240 William Pitt Way, Pittsburgh, PA |
Leased | Approximately 10,531 square feet of office and laboratory space | Detection | |||
| U-PARC Building A11 William Pitt Way, Pittsburgh, PA |
Leased | Approximately 600 square feet of manufacturing space | Detection | |||
| 262 B Old New Brunswick Road, Piscataway, NJ |
Leased | Approximately 31,345 square feet of office and manufacturing space | Solutions | |||
| 515 Cooper Commerce Drive, Apopka, FL |
Leased | Approximately 15,200 square feet of office, research and manufacturing space | Surveillance | |||
| 505 Coast Blvd South, La Jolla, CA |
Leased | Approximately 17,703 square feet of office and research space | Detection | |||
| 3000 Kent Avenue, West Lafayette, IN |
Leased | Approximately 12,362 square feet of office and research space | Detection | |||
| 4 Federal Street, Billerica, MA |
Leased | Approximately 20,000 square feet of office and manufacturing space | Detection | |||
| 6610 Amberton Drive, Elkridge, MD |
Leased | Approximately 33,852 square feet of office and manufacturing space | Detection | |||
| 4343 Pan American Freeway, NE, Suite 234 Albuquerque, NM | Leased | Approximately 11,884 square feet of office and manufacturing space | Detection | |||
| 105 Forest Parkway, Suite 400, Forest Park, GA |
Leased | Approximately 9,897 square feet of office space | Surveillance | |||
| 5324 Georgia Highway 85, Suite 300, Forest Park, GA |
Leased | Approximately 27,000 square feet of office and manufacturing space | Surveillance | |||
| US Highway 19 South, Route 2, Box 57, Ellaville, GA |
Leased | Approximately 34,000 square feet of office, manufacturing and storage space | Surveillance | |||
| 1024 S Innovation Way, Building 1, Stillwater, OK |
Leased | Approximately 8,000 square feet of research space | Detection | |||
| 1024 S Innovation Way, Building 2, Stillwater, OK |
Leased | Approximately 20,000 square feet of research space | Detection | |||
| 1110 S Innovation Way, Stillwater, OK |
Leased | Approximately 7,834 square feet of office and manufacturing space | Detection | |||
| 712 Eastgate, Stillwater, OK |
Leased | Approximately 4,416 square feet of office, manufacturing and storage space | Detection | |||
| 215 First Street, Cambridge, MA |
Leased | Approximately 15,471 square feet of laboratory space | Detection | |||
| 800 Research Parkway, Oklahoma City, OK |
Leased | Approximately 12,674 square feet of research space | Detection | |||
34
Table of Contents
| Location |
Ownership |
Facilities |
Segment | |||
| 2075 W Pinnacle Peak Road, Phoenix, AZ |
Leased | Approximately 2,642 square feet of office space | Solutions | |||
| 2400 Belmar Blvd, Wall, NJ |
Leased | Approximately 3,600 square feet of office space | Solutions | |||
| 1505 N Hayden Road, Suite 105, Scottsdale, AZ |
Leased | Approximately 8,543 square feet of office and research space | Surveillance | |||
| 100 Midland Road, Oak Ridge, TN |
Leased | Approximately 10,500 square feet of office and research space | Detection | |||
| 102 Midland Road, Oak Ridge, TN |
Leased | Approximately 17,500 square feet of research and manufacturing space | Detection | |||
| 208 Business Center Drive, Reisterstown, MD |
Leased | Approximately 2,700 square feet of research and office space | Detection | |||
| 401 E Sonterra Blvd, Suite 163, San Antonio, TX |
Leased | Approximately 1,378 square feet of office space | Solutions | |||
| 101 East Main Street, Suite 209, Monroe, WA |
Leased | Approximately 1,200 square feet of office space | Solutions | |||
| 1003 Bishop Street, Suite 720 Honolulu, HI |
Leased | Approximately 938 square feet of office space | Solutions | |||
| 14 East 33 rd Street, Unit 3N, New York, NY |
Leased | Approximately 3,000 square feet of office space | Solutions | |||
| 300 4th Street, Oakland, CA |
Leased | Approximately 1,365 square feet of office space | Solutions | |||
| 500 N. State College Blvd, Suite 1100, Orange, CA |
Leased | Approximately 1,000 square feet of office space | Solutions | |||
| 1720 Clay Street, Suite 14, San Francisco, CA |
Leased | Approximately 1,000 square feet of office space | Solutions | |||
| 3440 Francis-Hughes, Laval, Quebec, Canada |
Leased | Approximately 9,357 square feet of research, manufacturing and office space | Surveillance | |||
| 4218 Commerce Circle, Victoria, British Columbia, Canada |
Leased | Approximately 10,112 square feet of office space | Solutions | |||
| 131 Water Street, Vancouver, British Columbia, Canada |
Leased | Approximately 2,577 square feet of office space | Solutions | |||
| Piepersberg 12, Solingen, Germany |
Leased | Approximately 27,476 square feet of office space | Detection | |||
| Am Brauhaus 1, 01099 Dresden, Germany |
Leased | Approximately 320 square feet of office space | Detection | |||
| Dubai Airport Free Zone, Building 6EA, Office 111 Dubai, UAE |
Leased | Approximately 538 square feet of office space | All | |||
35
Table of Contents
While we believe that these facilities are adequate to meet our immediate needs, it may become necessary to secure additional space in the future to accommodate any future growth. We believe that such additional space will be available as needed in the future on commercially reasonable terms.
| Item 3. | LEGAL PROCEEDINGS |
From time to time, we are involved in various routine legal proceedings and claims. We cannot predict the outcome of these lawsuits, legal proceedings and claims with certainty. Nevertheless, we believe that the outcome of these proceedings, even if determined adversely, would not have a material adverse effect on our business, financial condition and results of operations. On or about February 24, 2010, Research International, Inc. filed a complaint against ICx Technologies, Inc. and its wholly owned subsidiary, MesoSystems Technology, Inc., in the United States District Court, Western District of Washington at Seattle, alleging infringement of Research International’s United States Patent Nos. 6,484,594 and 7,261,008. We plan to vigorously defend the companies against these allegations. It is not possible to predict the outcome of this case with certainty, but if determined adversely, it is possible it could have a material adverse effect on our business, financial condition and results of operations.
| Item 4. | [REMOVED AND RESERVED] |
36
Table of Contents
PART II
| Item 5. | MARKET FOR REGISTRANT’S COMMON EQUITY, RELATED STOCKHOLDER MATTERS AND ISSUER PURCHASES OF EQUITY SECURITIES |
Market Information
Our common stock is traded on The NASDAQ Global Market (NASDAQ) under the symbol “ICXT.”
The quarterly high and low sales prices of our common stock on NASDAQ from January 1, 2008 through December 31, 2009 were as follows:
| High | Low | |||||
| 2008: |
||||||
| First quarter |
$ | 9.69 | $ | 3.81 | ||
| Second quarter |
$ | 7.89 | $ | 4.42 | ||
| Third quarter |
$ | 8.75 | $ | 6.72 | ||
| Fourth quarter |
$ | 9.24 | $ | 5.53 | ||
| 2009: |
||||||
| First quarter |
$ | 8.00 | $ | 3.67 | ||
| Second quarter |
$ | 6.20 | $ | 3.60 | ||
| Third quarter |
$ | 6.25 | $ | 4.53 | ||
| Fourth quarter |
$ | 10.49 | $ | 4.65 | ||
The closing market price of our common stock on March 26, 2010 was $7.09 per share.
See “Risks Related to Our Common Stock” in Item 1A.
Holders
As of February 28, 2010, we had approximately 570 stockholders of record.
Dividends
We have never declared nor paid any cash dividends on our capital stock and we do not currently intend to pay any cash dividends on our common stock. We expect to retain future earnings, if any, to fund the development and growth of our business. Any future determination to pay dividends on our common stock will be at the discretion of our Board of Directors and will depend upon, among other factors, our results of operations, financial condition, capital requirements and contractual restrictions.
Equity Compensation Plan Information
The following table provides information as of December 31, 2009 with respect to the shares of our common stock that may be issued under our existing equity compensation plans. All numbers representing shares, options and per share amounts have been adjusted to reflect a two-for-one reverse stock split as of November 7, 2007.
| Plan category |
Number of Securities to be Issued Upon Exercise of Outstanding Options, Warrants and Rights |
Weighted-Average Exercise Price of Outstanding Options, Warrants and Rights |
Number of Securities Remaining Available for Future Issuance Under Equity Compensation Plans(2) | ||||
| Equity Compensation Plans Approved by Shareholders(1) |
2,577,109 | $ | 5.16 | 33,297,635 | |||
| Equity Compensation Plans Not Approved by Shareholders |
— | — | — | ||||
| Total |
2,577,109 | $ | 5.16 | 33,297,635 | |||
37
Table of Contents
| (1) | We issue restricted stock, restricted stock units, options and warrants to employees and non-employees under the 2007 Equity Incentive Plan. The 2007 Equity Incentive Plan is described in Note 8 to our Consolidated Financial Statements included in the report. |
| (2) | Securities remaining available for future issuance under the 2007 Equity Incentive Plan include 490,512 shares to be issued as participants vest in restricted stock and restricted stock units granted prior to December 31, 2009. |
Performance Graph
The graph below shows a comparison of cumulative shareholder return for the Company’s common stock with the cumulative total returns on the Russell 2000 index and the Nasdaq composite since the date our initial public offering was completed. The Russell 2000 index is a published index which measures the performance of small-cap companies. The data used for this graph assumes that $100 was invested in the Company and in each index on November 7, 2007, and that all dividends were reinvested.
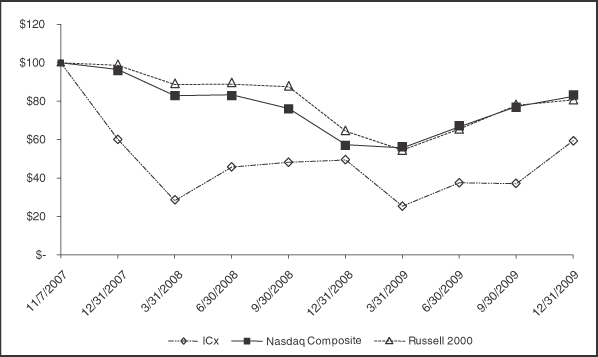
The stock performance graph was plotted using the following data:
| Nov 7, 2007 |
Dec 31, 2007 |
Mar 31, 2008 |
June 30, 2008 |
Sept 30, 2008 |
Dec 31, 2008 |
Mar 31, 2009 |
June 30, 2009 |
Sept 30, 2009 |
Dec 31, 2009 | |||||||||||
| ICx Technologies, |
100.00 | 60.13 | 28.13 | 45.63 | 48.19 | 49.44 | 25.31 | 37.50 | 37.00 | 59.50 | ||||||||||
| Russell 2000 Index |
100.00 | 98.72 | 88.66 | 88.88 | 87.58 | 64.37 | 54.48 | 65.50 | 77.88 | 80.60 | ||||||||||
| Nasdaq Composite |
100.00 | 96.49 | 82.91 | 83.42 | 76.10 | 57.37 | 55.61 | 66.76 | 77.21 | 82.55 |
38
Table of Contents
Use of Proceeds from Public Offering of Common Stock
In November 2007, we completed our initial public offering (IPO) pursuant to a registration statement on Form S-1 (Registration No. 333-145135) which the U.S. Securities and Exchange Commission declared effective on November 7, 2007. Under the registration statement, we registered the offering and sale of an aggregate of 5 million shares of our common stock. The offering did not terminate until after the sale of all of the shares registered on the registration statement. All of the shares of common stock issued pursuant to the registration statement were sold at a price to the public of $16.00 per share. The managing underwriter was Lehman Brothers Inc.
As a result of our IPO, we raised a total of $72.7 million in net proceeds after deducting underwriting discounts and commissions of $5.6 million and offering expenses of $1.7 million from the effective date of the IPO. On November 14, 2007, we used $7.1 million of our proceeds to repay a note payable and accrued interest to DP1, LLC. Also, following our IPO we paid off subsidiary debt totaling approximately $1.5 million. In 2008, we used approximately $3.0 million of our proceeds to acquire S3I, LLC and approximately $13.5 million for working capital purposes. In 2009, we used $1.8 million of our proceeds to pay contingent consideration related to our 2008 acquisition of S3I, LLC. At December 31, 2009, $8.5 million of IPO proceeds were held in escrow as collateral under a performance bond. No payments for such expenses were made directly or indirectly to (i) any of our officers or directors or their associates, (ii) any persons owning 10% or more of any class of our equity securities, or (iii) any of our affiliates. We anticipate that we will use the remaining net proceeds from our IPO for working capital and other general corporate purposes, including to finance our growth, develop new products, fund capital expenditures, or to expand our existing business through acquisitions of other businesses, products or technologies that are complementary to our business. At this time, we do not have agreements or commitments for acquisitions. At December 31, 2009, we had approximately $25.9 million of remaining net proceeds from the IPO invested in funds that invest in government securities. There has been no material change in the planned use of proceeds from our IPO as described in the final prospectus filed with the Securities and Exchange Commission pursuant to Rule 424(b).
Issuer Purchases of Equity Securities
During the period October 1, 2009 to December 31, 2009, we purchased the following shares:
| Period |
Total Number of Shares Purchased |
Average Price Paid per Share |
Total Number of Shares Purchased as Part of Publicly Announced Plans or Programs |
Maximum Number of Shares that May Yet Be Purchased Under the Plans or Programs | ||||||
| October 1-31 |
2,223 | (1) | $ | 5.81 | N/A | N/A | ||||
| November 1-30 |
16,777 | (1) | $ | 5.43 | N/A | N/A | ||||
| December 1-31 |
8 | (1) | $ | 5.15 | N/A | N/A | ||||
| (1) | As part of our restricted stock plan, we offer employees the opportunity to make required tax payments with cash or through a net share settlement. For employees choosing net share settlement, we make required tax payments on behalf of employees as their stock awards vest and then withhold a number of vested shares having a value on the date of vesting equal to the tax obligation. The shares withheld were recorded as treasury shares. |
39
Table of Contents
| Item 6. | SELECTED CONSOLIDATED FINANCIAL DATA |
You should read the following selected consolidated financial data in conjunction with our consolidated financial statements and related notes and “Management’s Discussion and Analysis of Financial Condition and Results of Operations” appearing elsewhere in this Annual Report on Form 10-K.
We derived the consolidated statement of operations data for the years ended December 31, 2009, 2008 and 2007, and the consolidated balance sheet data as of December 31, 2009 and 2008 from our audited consolidated financial statements and related notes, which are included elsewhere in this Annual Report on Form 10-K. We derived the consolidated statement of operations data for the years ended December 31, 2006 and 2005 and the consolidated balance sheet data as of December 31, 2007, 2006 and 2005 from our audited consolidated financial statements and related notes which are not included in this Annual Report. We have completed a number of acquisitions over the last five fiscal years, each of which was accounted for as a purchase transaction, which may affect year-over-year comparisons of our consolidated summary financial data. See a description of such acquisitions fully described in Note 3, “Business Combinations and Related Intangibles” in the notes to our consolidated financial statements.
| ICx | ||||||||||||||||||||
| Year Ended December 31, | ||||||||||||||||||||
| 2009 | 2008 | 2007 | 2006 | 2005 | ||||||||||||||||
| (in thousands, except per share data) | ||||||||||||||||||||
| Consolidated Statement of Operations Data: |
||||||||||||||||||||
| Consolidated |
||||||||||||||||||||
| Revenue |
$ | 183,428 | $ | 170,194 | $ | 135,507 | $ | 90,160 | $ | 31,400 | ||||||||||
| Cost of revenue |
112,947 | 99,789 | 73,960 | 50,012 | 17,591 | |||||||||||||||
| Gross profit |
70,481 | 70,405 | 61,547 | 40,148 | 13,809 | |||||||||||||||
| Products |
||||||||||||||||||||
| Revenue |
$ | 81,565 | $ | 89,720 | $ | 90,349 | $ | 59,341 | $ | 20,439 | ||||||||||
| Cost of revenue |
37,580 | 42,974 | 42,757 | 31,329 | 11,203 | |||||||||||||||
| Gross profit |
43,985 | 46,746 | 47,592 | 28,012 | 9,236 | |||||||||||||||
| Contract research and development and services |
||||||||||||||||||||
| Revenue |
54,187 | 40,887 | 30,698 | 25,694 | 10,436 | |||||||||||||||
| Cost of revenue |
40,950 | 29,339 | 20,640 | 15,840 | 6,135 | |||||||||||||||
| Gross profit |
13,237 | 11,548 | 10,058 | 9,854 | 4,301 | |||||||||||||||
| Service and other |
||||||||||||||||||||
| Revenue |
47,676 | 39,587 | 14,460 | 5,125 | 525 | |||||||||||||||
| Cost of revenue |
34,417 | 27,476 | 10,563 | 2,843 | 253 | |||||||||||||||
| Gross profit |
13,259 | 12,111 | 3,897 | 2,282 | 272 | |||||||||||||||
| Operating expenses |
||||||||||||||||||||
| Research and development |
15,295 | 21,366 | 20,466 | 14,501 | 4,957 | |||||||||||||||
| % of total revenue |
8.3 | % | 12.6 | % | 15.1 | % | 16.1 | % | 15.8 | % | ||||||||||
| Sales and marketing |
24,408 | 29,365 | 23,928 | 17,679 | 3,524 | |||||||||||||||
| % of total revenue |
13.3 | % | 17.3 | % | 17.7 | % | 19.6 | % | 11.2 | % | ||||||||||
| General and administrative |
27,014 | 31,994 | 39,599 | 37,745 | 11,265 | |||||||||||||||
| % of total revenue |
14.7 | % | 18.8 | % | 29.2 | % | 41.9 | % | 35.9 | % | ||||||||||
| Goodwill impairment loss |
— | — | — | 66,043 | — | |||||||||||||||
| Depreciation and amortization |
11,320 | 13,088 | 13,699 | 17,236 | 5,289 | |||||||||||||||
| Acquired in-process R&D |
— | — | — | — | 2,300 | |||||||||||||||
| Other |
— | — | — | — | 839 | |||||||||||||||
| Total operating expenses |
78,037 | 95,813 | 97,692 | 153,204 | 28,174 | |||||||||||||||
40
Table of Contents
| ICx | ||||||||||||||||||||
| Year Ended December 31, | ||||||||||||||||||||
| 2009 | 2008 | 2007 | 2006 | 2005 | ||||||||||||||||
| (in thousands, except per share data) | ||||||||||||||||||||
| Loss from operations |
(7,556 | ) | (25,408 | ) | (36,145 | ) | (113,056 | ) | (14,365 | ) | ||||||||||
| Interest income |
161 | 999 | 833 | 371 | 126 | |||||||||||||||
| Interest expense |
(103 | ) | (66 | ) | (639 | ) | (372 | ) | (145 | ) | ||||||||||
| Other, net |
912 | (92 | ) | (382 | ) | 1,039 | 541 | |||||||||||||
| Loss before income taxes |
(6,586 | ) | (24,567 | ) | (36,333 | ) | (112,018 | ) | (13,843 | ) | ||||||||||
| Provision for (benefit from) income taxes |
1,127 | (15 | ) | (1,108 | ) | (296 | ) | (1,943 | ) | |||||||||||
| Loss from continuing operations |
(7,713 | ) | (24,552 | ) | (35,225 | ) | (111,722 | ) | (11,900 | ) | ||||||||||
| Discontinued operations, net (1) |
(2,941 | ) | (2,389 | ) | 5,313 | (15,766 | ) | (2,852 | ) | |||||||||||
| Net loss |
(10,654 | ) | (26,941 | ) | (29,912 | ) | (127,488 | ) | (14,752 | ) | ||||||||||
| Accretion on redeemable convertible preferred stock |
— | — | 8,402 | 9,480 | 5,562 | |||||||||||||||
| Net income attributable to common stockholders |
$ | (10,654 | ) | $ | (26,941 | ) | $ | (38,314 | ) | $ | (136,968 | ) | $ | (20,314 | ) | |||||
| Basic and diluted earnings per share |
$ | (0.31 | ) | $ | (0.79 | ) | $ | (2.85 | ) | $ | (14.94 | ) | $ | (6.63 | ) | |||||
| Basic and diluted weighted average shares outstanding |
34,726,590 | 34,096,488 | 13,425,549 | 9,166,761 | 3,064,756 | |||||||||||||||
| Pro forma basic and diluted loss per share attributable to common stockholders (unaudited) (2) |
(1.03 | ) | (4.99 | ) | ||||||||||||||||
| Pro forma basic and diluted weighted average shares outstanding (unaudited) (2) |
29,150,986 | 25,526,458 | ||||||||||||||||||
| Consolidated Balance Sheet Data: |
||||||||||||||||||||
| Cash and cash equivalents |
$ | 30,735 | $ | 38,782 | $ | 64,636 | $ | 7,236 | $ | 23,354 | ||||||||||
| Working capital (excluding discontinued operations) |
77,293 | 76,324 | 95,097 | 27,312 | 24,072 | |||||||||||||||
| Total assets |
198,424 | 219,298 | 231,830 | 184,248 | 267,469 | |||||||||||||||
| Long-term debt, net of current portion |
118 | 176 | 246 | 449 | 508 | |||||||||||||||
| Redeemable convertible preferred stock |
— | — | — | 197,732 | 151,831 | |||||||||||||||
| Stockholders’ equity (deficit) |
$ | 170,437 | $ | 177,807 | $ | 198,404 | $ | (51,507 | ) | $ | 77,811 | |||||||||
| (1) | In 2009, we adopted a plan of sale and put the assets of PureTech Systems, Inc. (PureTech), a unit in the Solutions segment, up for sale. We recognized a loss on discontinued operations of $2.9 million, $1.5 million and $0.2 million in 2009, 2008 and 2007, respectively, related to this unit. The 2009 loss includes a $2.2 million impairment loss to write-down the carrying value of the unit to its estimated fair value. In 2007 and 2006, we realized a $2.2 million gain and a $3.1 million gain, respectively, on the sale of substantially all of the assets of a non-strategic operation owned by Nomadics, Inc., that was acquired in August 2005. In December 2006, we adopted a plan for the sale of three companies that did not align with our overall strategic plans. In February, March and April 2007, we sold Nuvonyx Europe, Harbinger Technologies Group, Inc. and Nuvonyx, Inc., respectively, pursuant to this plan. Loss from discontinued operations was $0.9 million, $1.3 million and $18.9 million in 2008, 2007 and 2006, respectively, which, in 2006, includes a $13.1 million impairment loss to write-down the carrying amounts of two of the discontinued companies to their estimated fair values less costs associated with the sale of the companies. Gain on the sale of discontinued operations was $4.6 million in 2007 related to these three units. |
| (2) | Gives effect to the conversion of our outstanding preferred stock to common stock on a one-for-one basis. |
41
Table of Contents
| Item 7. | MANAGEMENT’S DISCUSSION AND ANALYSIS OF FINANCIAL CONDITION AND RESULTS OF OPERATIONS |
The following discussion and analysis of our financial condition and results of operations should be read in conjunction with the consolidated financial statements and related notes included elsewhere in this report. This discussion contains forward-looking statements that involve risk and uncertainties. Our actual results could differ materially from those discussed below. Factors that could cause or contribute to these differences include, but are not limited to those identified below, and those discussed in the section entitled “Risk Factors” included elsewhere in this report.
Overview
We are a leader in the development and integration of advanced sensor technologies for homeland security, force protection and commercial applications. Our proprietary sensors detect and identify chemical, biological, radiological, nuclear and explosive threats, and deliver superior awareness and actionable intelligence for wide-area surveillance, intrusion detection and facility security. By leveraging our technical expertise, ICx pioneers the integration of these advanced sensors into effective security and commercial solutions. We were incorporated in 2003, and our business was primarily formed through the acquisition of 18 companies. On October 1, 2007, we acquired PureTech Systems, Inc. (PureTech) for $3.25 million in cash in a business combination accounted for as a purchase. During the third quarter of 2009, our Board of Directors adopted a plan of sale of the assets of PureTech. The results of operations of PureTech are included in discontinued operations beginning on October 1, 2007 and for all periods presented thereafter. On May 31, 2008, we acquired S3I, LLC (S3I) for $3.5 million in cash and $2.3 million of assumed liabilities in a business combination accounted for as a purchase. The results of operations of S3I were consolidated into our results beginning June 1, 2008.
We operate our business in three reportable segments: Detection, Surveillance and Solutions. Our Detection segment develops products and conducts research and development in the areas of chemical, biological, radiation, nuclear and explosives detection. Our Surveillance segment provides products and services for perimeter security and wide area surveillance. Our Solutions segment integrates our technologies and products to provide single source solutions that address a broad range of customer specific security and surveillance needs.
Our direct customers include federal agencies such as the U.S. Department of Homeland Security, U.S. Customs & Border Protection (Border Patrol) and the U.S. Transportation Security Administration, as well as various state and local governments and agencies, including the New York Police Department and the Port of Long Beach. We also provide products, components and sub-systems to leading integrators in the security and defense industries who either resell our products or integrate them into comprehensive security installations for their end customers. The value-added resellers and system integrators that we sell products to include The Boeing Company, Honeywell International, Inc., Northrop Grumman Corp., Raytheon Company, SAIC, Inc. and Thermo Fisher Scientific Inc. We also sell to military customers such as the U.S. Department of Defense, the U.S. Air Force, the U.S. Marines and the U.S. Army. We also sell to private sector customers such as Federal Express Corporation, The Walt Disney Company and two international airports serving the city of Houston, Texas and surrounding communities. In 2009, we added Chevron, Dow Chemical Company, Solvay Chemicals, Dallas Water Utilities, Pantex, Magal/Senstar, Johnson Controls, the Civil Police of Rio de Janeiro and Perth Airport to our portfolio of customers. Due to the breadth and diverse nature of our product and technology portfolio and our ability to deliver solutions for a comprehensive range of critical security applications, the future success of our business is not dependent upon a single product, technology, customer or government program.
Our objective is to grow our business organically and through the acquisition of complementary companies. To achieve this objective, we plan to:
| • | continue to develop and acquire next generation technologies to strengthen our technological leadership position; |
| • | continue converting our innovative technologies in our research and development pipeline into new products and platforms to pursue new market opportunities; |
42
Table of Contents
| • | continue to provide integrated, single-source solutions that prevent a broad range of critical security threats; |
| • | continue to extend our geographic reach and market penetration; |
| • | leverage our existing intellectual property and infrastructure to expand our addressable markets and further accelerate our growth; and |
| • | grow our business, relationships and product offerings by acquiring select companies and assets that enhance our technology leadership, broaden our product offerings or expand our customer relationships. |
Key Business Metrics
We monitor a number of key metrics to help forecast growth, establish budgets, measure the effectiveness of our sales and marketing efforts, accelerate product development and measure operational effectiveness.
Product Revenue. We were incorporated in 2003, and our business was formed through a series of complementary acquisitions in 2005. Many of these businesses were in the early stages of transitioning advanced technologies into products, integrating solutions and developing marketing and sales strategies. Beginning in 2005, we began to develop a more comprehensive sales and marketing structure to support our business segments. A key measure of our success is product revenue growth. Because our financial statements present the results of operations of acquired businesses from the date of acquisition, during periods in which we have significant acquisitions, we monitor revenue growth by comparing current periods against pro forma results of operations as if we had acquired the businesses as of the beginning of the prior comparable periods.
Product Gross Profit. Our goal is to grow product gross profit to increase the profitability of our business. Because of the emerging stage of many of our products, gross profit has been inconsistent and unpredictable. Key factors affecting our gross profit are volume pricing, warranty costs, product mix, economies of scale and the ability to absorb fixed costs. Our ability to effectively monitor and manage these factors is important in attaining business profitability.
Research and Development. Our primary source of research and development funds is through direct contracts with the U.S. government and subcontracts with other commercial entities that contract with the U.S. government. We refer to this externally funded research and development as contract research and development. We also invest in research and development activities using our own internal funds in an effort to accelerate new and enhanced product offerings and to expand our technological leadership. We refer to this internally funded research and development as internal research and development. One of our key objectives is to expand our market share by continuing to convert advanced technologies into products and single source integrated solutions. Accordingly, we intend to continue our research and development activities through both contract research and development and internal research and development programs to advance our technologies and release new products and provide integrated solutions.
Description of Certain Factors Affecting our Revenue, Gross Profit and Operating Expenses
Product Revenue and Gross Profit. In our Detection segment, we primarily derive product revenue through the sale of a variety of chemical, biological, radiological, nuclear and explosive sensor products. In our Surveillance segment, we primarily derive product revenue from the sale of our integrated towers, our thermal imaging cameras, and radar products. In our Solutions segment, we primarily derive product revenue from the sale of our command and control advanced software products.
Our gross profit on product sales is primarily impacted by the relative mix of higher and lower margin products, the efficiency and scale of our manufacturing operations, the relative mix of direct sales to end customers and sales through original equipment manufacturers and other resellers, and the relative mix of
43
Table of Contents
products that are manufactured by us and those that are manufactured by third parties. We typically earn a higher gross profit on products that we sell directly to end customers and on products that we manufacture ourselves. Because of the emerging stage of many of our products and our plans for new product introductions, we anticipate that our gross profit may continue to be impacted in the future by fixed overhead costs related to the expansion of our manufacturing capacity. As a result of these factors, our product gross profit has been inconsistent and may continue to be inconsistent for the foreseeable future.
Contract Research and Development Revenue and Gross Profit. We earn contract research and development revenue by performing research and development primarily under contracts that we enter into directly with the U.S. government or as subcontractors to other commercial entities that contract with the U.S. government. Most of our research and development contracts are either based on our cost plus a fixed fee which is subject to a dollar cap, or are fixed price. We account for earnings under long-term contracts using the percentage-of-completion method of accounting. See “Critical Accounting Policies—Revenue Recognition—Contract Research and Development and Services.”
Gross profit on contract research and development revenue is primarily impacted by the mix of contract type and the estimates inherent in recognizing revenue using the percentage-of-completion method of accounting. Our fee, or profit, under cost plus fixed fee contracts is based on a percentage of contract spending and is subject to a cap. On a fixed price contract, we are generally only required to incur the costs necessary to complete the contract. The degree of accuracy in determining the costs to complete our deliverables may impact gross profit under both contract types.
Service and Other Revenue and Gross Profit. We derive service and other revenue from three sources: (i) custom product design and development services, (ii) project management and technology integration services and (iii) training, installation and warranty contracts. Revenue from custom product design and development services and project management and technology integration services is derived from our Surveillance and Solutions segments, while training, installation and warranty contract revenues are derived from all three of our segments. A significant portion of our revenue from project management and technology integration services is derived from customers in the transportation industry. Most of our custom product design and development service contracts and project management and integration service contracts are for a fixed price and revenue is recognized under the percentage-of-completion method. Revenue from training and installation contracts is recognized upon completion of services. Revenue under product maintenance and extended warranty contracts is generally recognized over the requisite service period. See “Critical Accounting Policies and Estimates—Revenue Recognition—Service and Other.”
Gross profit under fixed price custom product design and development service contracts and project management and integration service contracts is primarily impacted by the degree of accuracy in estimating the costs to complete our deliverables under those contracts. Because our product training, installation, maintenance and warranty contracts are generally based on standard services, we have historically recognized higher margins on those services than on our project management and integration services.
General and Administrative Expenses. General and administrative expenses represent the costs and expenses of managing and supporting our operations. We increased our general administrative expenses in 2007 and 2006 through the use of consultants and other professionals to complete certain accounting and legal functions. We also increased general and administrative expenses by hiring additional executive officers and advisors and in connection with our overall expansion of the business. In 2008, our general and administrative expenses began to decline as a result of our focused effort to eliminate redundancies in our operations, primarily through reductions in personnel. In 2009, our general and administrative expenses decreased compared to previous years as we continued to gain efficiencies in the overall integration of our business units and continued our efforts to control costs. In 2010, we expect that our general and administrative expenses will stabilize or grow slightly compared to 2009.
44
Table of Contents
Selling and Marketing Expenses. Beginning in 2006 through the end of 2008, we increased our spending on sales, marketing and other related business development matters to support our early stage products and emerging technologies and to support anticipated future growth in our business. With the downturn of the economy in late 2008 and the continued uncertainty in 2009, we took steps to scale back certain aspects of our commercial sales and marketing activities. Accordingly, during 2009 our sales and marketing expense decreased compared to previous years and we expect that in 2010 our sales and marketing costs will stabilize or grow slightly compared to 2009.
Research and Development. In addition to external funding we receive and record as revenue from the U.S. government and other commercial entities for contract research and development activities, we also invest in research and development activities using our own internal funds in an effort to provide additional means for accelerating the development of new and enhanced product offerings and to expand our technological leadership. The costs of our internally funded research and development are included in our operating expenses. Beginning in 2006 and throughout most of 2008, we increased our spending on internally funded research and development activities and the integration of products and technologies among our reportable segments. One of our key objectives is to expand our market share by continuing to convert advanced technologies into products and single source integrated solutions. In 2008, we significantly increased our externally funded research and development and continued to secure additional funding in 2009. Accordingly, our internal research and development expense declined in 2009 as we utilized our technical resources on externally funded research and development activities, and we expect that in 2010 internal research and development expenses will stabilize or grow slightly compared to 2009.
Results of Operations—Comparison of December 31, 2009 and 2008
As noted above, during the third quarter of 2009, our Board of Directors adopted a plan to sell the assets of PureTech. The 2008 balances included in the following tables have been reclassified to conform to the 2009 presentation of discontinued operations. Additionally, the 2008 balances have been reclassified to conform to the 2009 presentation, as the Company began allocating all general and administrative expenses to reportable segments.
Total Company Comparison
| Year Ended December 31, | ||||||||
| 2009 | 2008 | |||||||
| (dollars in thousands) | ||||||||
| Product revenue |
$ | 81,565 | $ | 89,720 | ||||
| Gross profit % |
53.9 | % | 52.1 | % | ||||
| Contract research and development revenue |
54,187 | 40,887 | ||||||
| Gross profit % |
24.4 | % | 28.2 | % | ||||
| Service and other revenues |
47,676 | 39,587 | ||||||
| Gross profit % |
27.8 | % | 30.6 | % | ||||
| Total revenue |
$ | 183,428 | $ | 170,194 | ||||
| Gross profit % |
38.4 | % | 41.4 | % | ||||
| Operating income (loss) excluding depreciation and amortization |
$ | 3,764 | $ | (12,320 | ) | |||
| Depreciation and amortization |
11,320 | 13,088 | ||||||
| Operating loss |
$ | (7,556 | ) | $ | (25,408 | ) | ||
| Loss from continuing operations |
$ | (7,713 | ) | $ | (24,551 | ) | ||
| Loss from discontinued operations, net |
(2,941 | ) | (1,487 | ) | ||||
| (Loss) gain on sale of discontinued operations, net |
— | (903 | ) | |||||
| Net loss |
$ | (10,654 | ) | $ | (26,941 | ) | ||
45
Table of Contents
Product Revenue and Gross Profit. Product revenue decreased $8.1 million, or 9%, to $81.6 million in 2009 from $89.7 million in 2008. The decrease primarily resulted from reduced sales of products in our Detection segment which was partially offset by increased product sales in our Surveillance segment, as discussed below in “Detection Segment—Comparison of the Years Ended December 31, 2009 and 2008” and in “Surveillance Segment—Comparison of the Years Ended December 31, 2009 and 2008.” Gross profit as a percentage of product revenue was 53.9% in 2009 and 52.1% in 2008.
Contract Research and Development Revenue and Gross Profit. Contract research and development revenue increased $13.3 million, or 33%, to $54.2 million in 2009 from $40.9 million in 2008. In our Detection segment, contract research and development revenue increased $19.5 million in 2009 compared to 2008, primarily due to a significant long-term contract award for the development of a nuclear and chemical reconnaissance system. The increased revenue in Detection was offset by a $5.5 million reduction in contract research and development revenue in our Surveillance segment in 2009 compared to 2008. The decrease in Surveillance revenue resulted from the delivery of prototype platforms under a contract that ended in 2008. Gross profit as a percentage of contract research and development revenue was 24.4% and 28.2% in 2009 and 2008, respectively. The decrease in gross profit is due to the mix of contract types and the estimates inherent in recognizing revenue and costs under the percentage of completion method of accounting.
Service and Other Revenue and Gross Profit. Service and other revenue increased $8.1 million, or 20%, to $47.7 million in 2009 from $39.6 million in 2008. Service and other revenue in our Solutions segment accounted for approximately $7.4 million of the increase, the majority of which was related to performance under project management and integration contracts for intelligent transportation systems and video networking and surveillance. Gross profit as a percentage of service and other revenue decreased to 27.8% in 2009 from 30.6% in 2008, primarily due to the mix of contract types and the estimates inherent in recognizing revenue and costs under the percentage of completion method of accounting.
Depreciation and Amortization. Depreciation and amortization decreased $1.8 million, or 14%, to $11.3 million in 2009 compared to $13.1 million in 2008. The decrease is primarily due to certain intangible assets that are associated with our business acquisitions becoming fully amortized in 2009.
Operating Loss. Operating loss decreased $17.8 million, or 70%, to $7.6 million in 2009 from a loss of $25.4 million in 2008. The decrease in operating loss primarily resulted from a reduction in operating expenses. The reduction in operating expenses resulted from reduced spending on internal research and development because more of our technical resources were dedicated to externally funded contract research and development projects and reduced sales, marketing, and general and administrative expenses primarily from reductions in personnel as we continued to make progress towards integrating our business units and eliminating redundancies in our operations.
Operating income (loss) excluding depreciation and amortization is a non-GAAP financial measure that is derived by reducing our operating loss by depreciation and amortization. Amortization primarily represents costs associated with our business acquisitions that do not correspond to an outlay of current and future cash flow. Accordingly, we believe operating income (loss) excluding depreciation and amortization is a more meaningful measure of our recurring operations and an indicator of our working capital requirements. Operating loss excluding depreciation and amortization decreased $16.1 million, or 131%, to income of $3.8 million in 2009 from a loss of $12.3 million in 2008 due to reduced operating expenses as explained earlier in this section.
Loss from Continuing Operations. Our loss from continuing operations decreased $16.9 million, or 69%, to $7.7 million in 2009 from $24.6 million in 2008 primarily due to reduced operating expenses as explained under “Operating Loss” above.
Loss from Discontinued Operations. In the third quarter of 2009, our Board of Directors adopted a plan of sale and put the assets of PureTech Systems, Inc. (PureTech), a unit in the Solutions segment, up for sale, as the business model of this unit no longer aligned with our strategic plans. In connection with this plan, we recognized a loss on discontinued operations of $2.9 million, which included a goodwill impairment charge of
46
Table of Contents
$1.3 million, a $0.8 million impairment charge to write down PureTech’s intangible assets and a $0.2 million impairment charge to write down PureTech’s long-lived assets. In 2008, we realized a loss on discontinued operations of $1.5 million related to the planned sale of PureTech and a loss on sale of discontinued operations of $0.9 million related to the settlement of escrow accounts and contingent purchase consideration.
Net Loss. Net loss decreased $16.2 million, or 60%, to $10.7 million in 2009 from $26.9 million in 2008 primarily due to reduced operating expenses as explained in the “Operating Loss” section above.
Reportable Segments
We operate our business in three reportable segments: Detection, Surveillance and Solutions. Our Detection segment develops products and conducts research and development in the areas of chemical, biological, radiation, nuclear and explosives detection. Our Surveillance segment provides products and services for perimeter security and wide area surveillance. Our Solutions segment integrates our technologies and products to provide single source solutions that address a broad range of customer specific security and surveillance needs.
Detection Segment—Comparison of the Years Ended December 31, 2009 and 2008
| Years Ended December 31, | ||||||||
| 2009 | 2008 | |||||||
| (dollars in thousands) | ||||||||
| Revenue and gross profit % |
||||||||
| Product revenue |
$ | 45,380 | $ | 55,352 | ||||
| Contract research and development revenue |
53,221 | 33,702 | ||||||
| Service and other revenue |
4,212 | 2,079 | ||||||
| Total revenue |
$ | 102,813 | $ | 91,133 | ||||
| Gross profit % |
40.6 | % | 46.9 | % | ||||
| Operating loss |
$ | (3,527 | ) | $ | (11,160 | ) | ||
Product Revenue. Product revenue decreased $10.0 million, or 18%, to $45.4 million in 2009 from $55.4 million in 2008. The majority of the decrease resulted from fewer sales of our explosive and radiation detection products. We sell our detector products primarily to the federal government, from which we have recently experienced a trend toward higher volume purchases on a less frequent basis. In 2008, purchases of detector products were lower in volume and occurred on a more frequent basis. We believe this trend has caused variability in our detection product revenue, and we believe this trend might continue in the future. Additionally, the Department of Defense delayed the passage of their fiscal year 2010 budget during the second half of 2009, which we believe resulted in fewer sales of our products during 2009.
Contract Research and Development Revenue. Contract research and development revenue increased $19.5 million, or 58%, to $53.2 million in 2009 from $33.7 million in 2008. The increase is primarily due to continued progress on the development of a nuclear and chemical reconnaissance system from a significant contract that was awarded to us in the fourth quarter of 2008. Despite the delay in the passage of the 2010 budget, we continue to see increased overall government spending on defense and security-related programs that are pertinent to our business.
Service and Other Revenue. Service and other revenue increased $2.1 million, or 100%, to $4.2 million in 2009 from $2.1 million in 2008. The increase was primarily the result of additional training and extended warranty contracts for our detection products.
Gross Profit. Gross profit as a percentage of revenue decreased to 40.6% in 2009 from 46.9% in 2008 primarily due to a higher percentage of revenue from contract research and development projects which carry lower gross margins than revenue from product sales.
47
Table of Contents
Operating Loss. Operating loss decreased $7.7 million, or 69%, to $3.5 million in 2009 from $11.2 million in 2008. A $8.7 million decrease in operating expenses was offset by a decrease in gross profit of $1.0 million from the prior year. The decrease in gross profit is due to a higher percentage of revenue from contract research and development projects which carry lower gross margins than revenue from product sales. The decrease in operating expenses resulted from reduced spending on internal research and development because more of our technical resources were dedicated to externally funded contract research and development projects, and reduced selling, general and administrative expenses primarily from reductions in personnel as we continued to make progress towards integrating our business units and eliminating redundancies in our operations.
Surveillance Segment—Comparison of the Years Ended December 31, 2009 and 2008
| Years Ended December 31, | ||||||||
| 2009 | 2008 | |||||||
| (dollars in thousands) | ||||||||
| Revenue and gross profit % |
||||||||
| Product revenue |
$ | 28,445 | $ | 26,226 | ||||
| Contract research and development revenue |
1,008 | 6,523 | ||||||
| Service and other revenue |
17,494 | 18,301 | ||||||
| Total revenue |
$ | 46,947 | $ | 51,050 | ||||
| Gross profit % |
37.6 | % | 35.4 | % | ||||
| Operating loss |
$ | (4,035 | ) | $ | (7,369 | ) | ||
Product Revenue. Product revenue increased $2.2 million, or 8%, to $28.4 million in 2009 from $26.2 million in 2008. The increase is primarily due to increased sales of our imaging equipment and integrated platforms.
Contract Research and Development Revenue. Contract research and development revenue decreased $5.5 million, or 85%, to $1.0 million in 2009 from $6.5 million in 2008 primarily due to the delivery of prototype platforms under a research and development contract that ended in the second quarter of 2008.
Service and Other Revenue. Service and other revenue decreased $0.8 million, or 4%, to $17.5 million in 2009 from $18.3 million in 2008. In the first half of 2008, we began delivering customized platforms under a single contract and the final deliveries under that contract ended in the third quarter of 2009. The overall decrease in revenue is due to the timing of customized platform deliveries under the aforementioned contract.
Gross Profit. Gross profit as a percentage of revenue was 37.6% and 35.4% in 2009 and 2008, respectively. The increase in gross profit in 2009 resulted from a higher percentage of revenue from product sales which carry higher gross margins than revenue from custom development contracts and research and development contracts.
Operating Loss. Operating loss decreased $3.4 million, or 46%, to $4.0 million in 2009 from $7.4 million in 2008. The improvement primarily resulted from a $3.7 million decrease in operating expenses primarily due to reductions in personnel as we continued to make progress towards integrating our business units and eliminating redundancies in our operations.
48
Table of Contents
Solutions Segment—Comparison of the Years Ended December 31, 2009 and 2008
| Years Ended December 31, | ||||||||
| 2009 | 2008 | |||||||
| (dollars in thousands) | ||||||||
| Revenue and gross profit % |
||||||||
| Product revenue |
$ | 7,917 | $ | 8,142 | ||||
| Contract research and development revenue |
303 | 662 | ||||||
| Service and other revenue |
26,565 | 19,206 | ||||||
| Total revenue |
$ | 34,785 | $ | 28,010 | ||||
| Gross profit % |
32.0 | % | 34.2 | % | ||||
| Operating income (loss) |
$ | 743 | $ | (6,210 | ) | |||
Product Revenue. Product revenue decreased $0.2 million, or 2%, to $7.9 million in 2009 from $8.1 million in 2008.
Service and Other Revenue. Service and other revenue increased $7.4 million, or 39%, to $26.6 million in 2009 from $19.2 million in 2008. The increase was primarily attributable to contracts for project management and the integration of technologies for intelligent transportation systems.
Gross Profit. Gross profit as a percentage of revenue was 32.0% and 34.2% in 2009 and 2008, respectively. Gross profit as a percentage of revenue decreased in 2009 because more revenue was derived from long-term project management and integration service contracts which generally carry lower gross margins than product sales.
Operating Income (Loss). Operating loss decreased $6.9 million, or 111%, to income of $0.7 million in 2009 from a loss of $6.2 million in 2008. The improvement in our operations resulted primarily from a $1.5 million increase in gross profit due to revenue growth, and a $5.4 million decrease in operating expenses primarily from reductions in personnel as we continued to make progress towards integrating our business units and eliminating redundancies in our operations.
Total 2009 revenues included in the preceding tables include $1.1 million of intersegment revenues. Refer to Note 10 to our Consolidated Financial Statements in Part IV—Item 15—Exhibits and Financial Statement Schedules for a reconciliation of total revenue to revenues from external customers.
Results of Operations—Comparison of December 31, 2008 and 2007
As noted above, during the third quarter of 2009, our Board of Directors adopted a plan to sell the assets of PureTech. The 2008 and 2007 balances included in the following tables have been reclassified to conform to the 2009 presentation of discontinued operations. Additionally, the 2008 and 2007 balances have been reclassified to conform to the 2009 presentation, as the Company began allocating all general and administrative expenses to reportable segments.
49
Table of Contents
Total Company Comparison
| Year Ended December 31, | ||||||||
| 2008 | 2007 | |||||||
| (dollars in thousands) | ||||||||
| Product revenue |
$ | 89,720 | $ | 90,349 | ||||
| Gross profit % |
52.1 | % | 52.7 | % | ||||
| Contract research and development revenue |
40,887 | 30,698 | ||||||
| Gross profit % |
28.2 | % | 32.8 | % | ||||
| Service and other revenue |
39,587 | 14,460 | ||||||
| Gross profit % |
30.6 | % | 27.1 | % | ||||
| Total revenue |
$ | 170,194 | $ | 135,507 | ||||
| Gross profit % |
41.4 | % | 45.4 | % | ||||
| Operating loss excluding depreciation and amortization |
$ | (12,320 | ) | $ | (22,447 | ) | ||
| Depreciation and amortization |
13,088 | 13,699 | ||||||
| Operating loss |
$ | (25,408 | ) | $ | (36,146 | ) | ||
| Loss from continuing operations |
$ | (24,551 | ) | $ | (35,219 | ) | ||
| Loss from discontinued operations, net |
(1,487 | ) | (1,514 | ) | ||||
| (Loss) gain on sale of discontinued operations, net |
(903 | ) | 6,821 | |||||
| Net loss |
$ | (26,941 | ) | $ | (29,912 | ) | ||
Product Revenue and Gross Profit. Product revenue decreased $0.6 million, or 1%, to $89.7 million in 2008 from $90.3 million in 2008. Gross profit remained stable at 52.1% and 52.7% in 2009 and 2008, respectively.
Contract Research and Development Revenue and Gross Profit. Contract research and development revenue increased $10.2 million, or 33%, to $40.9 million in 2008 from $30.7 million in 2007. Approximately $3.4 million of this increase is attributable to delivery of prototype platforms under research and development contracts by one of our Surveillance operating units. The remainder of the increase is primarily due to increased government spending on defense and security related programs in our Detection segment. Gross profit as a percentage of contract research and development revenue was 28.2% and 32.8% in 2008 and 2007, respectively. The decrease in gross profit is due to the mix of contract types and the estimates inherent in recognizing revenue and costs under the percentage of completion method of accounting.
Service and Other Revenue and Gross Profit. Service and other revenue increased $25.1 million, or 173%, to $39.6 million in 2008 from $14.5 million in 2007. Service and other revenue in our Solutions segment accounted for approximately $8.3 million of the increase, the majority of which was for new project management and integration services for intelligent transportation systems. In our Surveillance segment, service and other revenue accounted for approximately $15.9 million of the revenue increase, the majority of which relates to the delivery of custom platforms. The remaining $0.9 million of the increase came from our Detection segment. Gross profit as a percentage of service and other revenue increased to 30.6% in 2008 from 27.1% in 2007, primarily due to the mix of contract types and the estimates inherent in recognizing revenue and costs under the percentage of completion method of accounting.
Depreciation and Amortization. Depreciation and amortization decreased $0.6 million, or 4%, to $13.1 million in 2008 compared to $13.7 million in 2007 primarily due to certain customer relationships and firm contracts becoming fully amortized in 2007.
Operating Loss. Operating loss decreased $10.7 million, or 30%, to $25.4 million in 2008 from $36.1 million in 2007. The decrease in operating losses is primarily due to increased gross margins from our revenue growth. Operating loss excluding depreciation and amortization is a non-GAAP financial measure that is derived
50
Table of Contents
by reducing our operating loss by depreciation and amortization. The depreciation and amortization primarily represent costs associated with our business acquisitions that do not correspond to an outlay of current and future cash flow. Accordingly, we believe operating loss excluding depreciation and amortization is a more meaningful measure of our recurring operations and an indicator of our working capital requirements. Operating loss excluding depreciation and amortization decreased $10.1 million, or 45%, to $12.3 million in 2008 from $22.4 million in 2007.
Loss from Continuing Operations. Our loss from continuing operations decreased $10.6 million, or 30%, to $24.6 million in 2008 from $35.2 million in 2007 due primarily to increased gross margins from revenue growth.
Discontinued Operations. In December 2006, we adopted a plan for the sale of three companies that did not align with our overall strategic plans. We completed two of the sales in the first quarter of 2007 and the third sale during the second quarter of 2007. In September 2009, we adopted a plan for the sale of the assets of PureTech Systems, Inc. In 2008 and 2007, our loss from discontinued operations was $1.5 million and included the loss from PureTech. In 2008, we realized a loss on discontinued operations of $0.9 million related to the settlement of escrow accounts and contingent purchase consideration. In 2007, we realized a gain on the sale of discontinued operations of $6.8 million.
Net Loss. Net loss decreased $3.0 million, or 10%, to $26.9 million in 2008 from $29.9 million in 2007. The decrease in net loss was primarily due to a $9.2 million increase in gross margins due to higher revenue growth. In 2007, net loss included a $6.8 million gain on sale of discontinued operations. In 2008 discontinued operations resulted in a $0.9 million loss related to the settlement of escrow accounts and contingent purchase consideration.
Reportable Segments
We operate our business in three reportable segments: Detection, Surveillance and Solutions. Our Detection segment develops products and conducts research and development in the areas of chemical, biological, radiation, nuclear and explosives detection. Our Surveillance segment provides products and services for perimeter security and wide area surveillance. Our Solutions segment integrates our technologies and products to provide single source solutions that address a broad range of customer specific security and surveillance needs.
Detection Segment—Comparison of the Years Ended December 31, 2008 and 2007
| Years Ended December 31, | ||||||||
| 2008 | 2007 | |||||||
| (dollars in thousands) | ||||||||
| Revenue and gross profit % |
||||||||
| Product revenue |
$ | 55,352 | $ | 49,905 | ||||
| Contract research and development revenue |
33,702 | 27,915 | ||||||
| Custom, service, maintenance and other revenue |
2,079 | 1,215 | ||||||
| Total revenue |
$ | 91,133 | $ | 79,035 | ||||
| Gross profit % |
46.9 | % | 45.6 | % | ||||
| Operating loss |
$ | (11,160 | ) | $ | (15,165 | ) | ||
Product Revenue. Product revenue increased $5.5 million, or 11%, to $55.4 million in 2008 from $49.9 million in 2007 primarily resulting from increased sales of our detectors, bio sensors and the introduction of our cheMSense 600 product.
Contract Research and Development Revenue. Contract research and development revenue increased $5.8 million, or 21%, to $33.7 million in 2008 from $27.9 million in 2007. A business that we acquired in May 2008 accounted for an increase of $0.9 million in contract research and development revenue during 2008. The remaining increase is primarily related to increased government spending on defense and security related programs that are pertinent to our business.
51
Table of Contents
Gross Profit. Gross profit as a percentage of revenue increased to 46.9% in 2008 from 45.6% in 2007 primarily because of increased product sales.
Operating Loss. Operating loss decreased $4.0 million, or 26%, to $11.1 million in 2008 from $15.2 million in 2007. An increase in gross profit of $6.7 million in 2008 as compared to 2007 was offset by $2.9 million in increased operating expenses. The increase in operating expenses in 2008 related to additional spending on internal research and development projects directed at the development and expansion of chemical, biological, radiation and explosive detection products and technologies and increased sales and marketing expense due to an investment in our sales and marketing platform in order to support bids and proposals for major programs and to expand our distribution channels.
Surveillance Segment—Comparison of the Years Ended December 31, 2008 and 2007
| Years Ended December 31, | ||||||||
| 2008 | 2007 | |||||||
| (dollars in thousands) | ||||||||
| Revenue and gross profit % |
||||||||
| Product revenue |
$ | 26,226 | $ | 33,253 | ||||
| Contract research and development revenue |
6,523 | 2,783 | ||||||
| Custom, service, maintenance and other revenue |
18,301 | 2,406 | ||||||
| Total revenue |
$ | 51,050 | $ | 38,442 | ||||
| Gross profit % |
35.4 | % | 48.6 | % | ||||
| Operating loss |
$ | (7,369 | ) | $ | (10,885 | ) | ||
Product Revenue. Product revenue decreased $7.1 million, or 21%, to $26.2 million in 2008 from $33.3 million in 2007. The decrease is due to a shift from platform product sales to the delivery of platform prototypes under contract research and development contracts and custom platforms under custom development contracts. Additionally, we had a significant delivery of radar equipment to one customer in 2007 that was not duplicated in 2008 and late in the second half of the year we experienced indefinite delays in imaging product orders which we believe is related to the overall downturn in the economy and delays resulting from the change in Presidential Administration.
Contract Research and Development Revenue. Contract research and development revenue increased $3.7 million, or 132%, to $6.5 million in 2008 from $2.8 million in 2007 primarily due to the delivery of prototype platforms under research and development contracts.
Service and Other Revenue. Service and other revenue increased $15.9 million, or 663%, to $18.3 million in 2008 from $2.4 million in 2007 primarily due to a new custom development contract for the delivery of customized platforms under a single contract.
Gross Profit. Gross profit as a percentage of revenue was 35.4% and 48.6% in 2008 and 2007, respectively. Our gross profit was impacted by a shift from product sales to the delivery of platform prototypes and customized platforms under lower margin contract research and development and custom service contracts.
Operating Loss. Operating loss decreased $3.5 million, or 32%, to $7.4 million in 2008 from $10.9 million in 2007. Reduced operating losses were primarily the result of decreases in general and administrative and research and development costs due to our focus on cost control and eliminating redundancies in our operations.
52
Table of Contents
Solutions Segment—Comparison of the Years Ended December 31, 2008 and 2007
| Years Ended December 31, | ||||||||
| 2008 | 2007 | |||||||
| (dollars in thousands) | ||||||||
| Revenue and gross profit % |
||||||||
| Product revenue |
$ | 8,142 | $ | 7,190 | ||||
| Contract research and development revenue |
662 | — | ||||||
| Custom, service, maintenance and other revenue |
19,207 | 10,839 | ||||||
| Total revenue |
$ | 28,011 | $ | 18,029 | ||||
| Gross profit % |
34.2 | % | 37.8 | % | ||||
| Operating loss |
$ | (6,210 | ) | $ | (9,866 | ) | ||
Product Revenue. Product revenue increased $0.9 million, or 13%, to $8.1 million in 2008 from $7.2 million in 2007 primarily due to more funding under phase 3 of the ICIDS program in 2008 than in 2007.
Service and Other Revenue. Service and other revenue increased $8.4 million, or 78%, to $19.2 million in 2008 from $10.8 million in 2007. The increase in revenue is primarily related to new contracts for project management and integration of technologies for intelligent transportation systems.
Gross Profit. Gross profit as a percentage of revenue was 34.2% and 37.8% in 2008 and 2007, respectively. Gross profit as a percentage of revenue decreased in 2008 because more revenue was derived from long-term project management and integration service contracts which generally have lower gross margins than product sales.
Operating Loss. Operating loss decreased $3.7 million, or 37%, to $6.2 million in 2008 from $9.9 million in 2007. Reduced losses are primarily the result of gross margin expansion from revenue growth.
Reconciliation of Reportable Segment Operating Losses to the Consolidated Loss from Continuing Operations
The following tables provide a reconciliation of operating losses from reportable segments to our consolidated net loss from continuing operations for the years ended December 31, 2009, 2008, and 2007.
| Year Ended December 31, | ||||||||||||
| 2009 | 2008 | 2007 | ||||||||||
| (dollars in thousands) | ||||||||||||
| Reconciliation of segment operating losses to consolidated loss from continuing operations |
||||||||||||
| Segment operating losses |
$ | (6,819 | ) | $ | (24,739 | ) | $ | (35,915 | ) | |||
| Unallocated depreciation and amortization expenses |
(737 | ) | (669 | ) | (231 | ) | ||||||
| Interest expense |
(103 | ) | (66 | ) | (639 | ) | ||||||
| Interest income |
161 | 999 | 833 | |||||||||
| Other nonoperating gains (losses), net |
912 | (92 | ) | (382 | ) | |||||||
| Income tax (expense) benefit |
(1,127 | ) | 15 | 1,114 | ||||||||
| Consolidated loss from continuing operations |
$ | (7,713 | ) | $ | (24,552 | ) | $ | (35,220 | ) | |||
Liquidity and Capital Resources
As of December 31, 2009, our principal sources of liquidity were cash and cash equivalents (including restricted cash) of $30.7 million and accounts receivable of $36.8 million. At December 31, 2009, approximately $8.5 million of the Company’s cash was restricted to serve as collateral under a performance bond. The contract requiring this collateral ended in 2010 and we expect the cash to be released from restriction in 2010. Our cash
53
Table of Contents
flows from operating activities significantly improved in 2009 compared to prior years because of the reduction in our net losses through a variety of means, including but not limited to, additional reductions in sales and marketing expenses and general and administrative expenses, prioritizing internal research and development spending and increasing revenue through organic growth. Due to our continued focus on reducing operating expenses, our operating losses excluding depreciation and amortization have been steadily decreasing, and we achieved positive operating income excluding depreciation and amortization of $3.8 million for the year ended December 31, 2009, an improvement of $16.1 million over the operating loss excluding depreciation and amortization of $12.3 million for the year ended December 31, 2008. At December 31, 2009, we had firm backlog of approximately $53 million and unfunded backlog of approximately $339 million. We believe our backlog and recent bookings combined with an ongoing emphasis on controlling our expenses will be sufficient to sustain our liquidity and cash flows in 2010 and for the foreseeable future.
Our primary sources of cash historically have been our initial public offering in November 2007, customer payments for our products and services, lines of credit and short term loans and proceeds from the sale of businesses. We were incorporated in 2003 and have primarily grown our business organically and through a series of complementary acquisitions in 2005. Many of the acquired businesses have early stage products and/or emerging products and engage in research and development activities that are funded both through external government contracts and internal resources.
During 2007 and into 2008, we increased our investment in sales, marketing and other related business development structures to support our early stage products and emerging technologies. Additionally, we increased our investment in internally funded research and development activities and the integration of products and technologies among our operating units. We also increased our general and administrative expenses in 2008 and 2007 through the use of consultants and other professionals to complete certain accounting and legal functions. Consequently, our cumulative net losses, which amounted to approximately $215.1 million at December 31, 2009, were expected based on the nature of our business, the early stage of our products and technologies and our ongoing research and development activities.
In the future we may enter into acquisition agreements for complementary businesses that would require us to seek additional equity or debt financing. Additional funds may not be available on terms favorable to us or at all.
The following table shows our cash and cash equivalents (including restricted cash) and working capital as of December 31, 2009, 2008 and 2007:
| Year Ended December 31, | |||||||||
| 2009 | 2008 | 2007 | |||||||
| (dollars in thousands) | |||||||||
| Cash and cash equivalents |
$ | 30,735 | $ | 38,782 | $ | 64,636 | |||
| Working capital (excluding discontinued operations) |
$ | 77,293 | $ | 76,324 | $ | 95,097 | |||
The following table shows our cash flows from operating, investing and financing activities for the years ended December 31, 2009, 2008, and 2007.
| Year Ended December 31, | ||||||||||||
| 2009 | 2008 | 2007 | ||||||||||
| (dollars in thousands) | ||||||||||||
| Summary of cash flow: |
||||||||||||
| Cash flows used in operating activities |
$ | (3,522 | ) | $ | (14,721 | ) | $ | (29,277 | ) | |||
| Cash flows provided by (used in) investing activities |
(3,987 | ) | (18,545 | ) | 15,505 | |||||||
| Cash flows provided by (used in) financing activities |
(576 | ) | (1,129 | ) | 71,161 | |||||||
| Effect of foreign exchange rate on cash |
2 | 113 | 11 | |||||||||
| Consolidated net change in cash and cash equivalents |
$ | (8,083 | ) | $ | (34,282 | ) | $ | 57,400 | ||||
54
Table of Contents
Cash Flows from Operating Activities. Our cash flows from operating activities are significantly influenced by spending required to support the growth of our business in areas such as research and development, sales and marketing, facilities expansion and certain general and administrative costs. Our operating cash flows are also influenced by our working capital needs to support growth and fluctuations in inventory, accounts receivable, accounts payable and other current assets and liabilities. The concentration of business with the U.S. and state and local governments also impacts operating cash flow, particularly for fixed price contracts in which revenue recognition under the percentage of completion method may not coincide with billing. Cash flow used in operating activities decreased $11.2 million, or 76%, to $3.5 million for 2009 from $14.7 million for 2008, primarily due to reduced net losses. Cash flow used in operating activities decreased $14.6 million, or 50%, to $14.7 million for 2008 from $29.3 million for 2007. The decrease is primarily the result of reduced losses from continuing operations, efforts to reduce inventory expenditures, and increased focus on collecting customer receivables in 2009. We expect our cash flows from operating activities to improve as we continue to reduce our net losses through a continued emphasis on controlling expenses and through revenue growth. At December 31, 2009, we had firm backlog of approximately $53 million and unfunded backlog of approximately $339 million. We believe our backlog and recent bookings combined with operating expense reductions will be sufficient to sustain our liquidity and cash flows in 2010 and for the foreseeable future.
Cash Flows from Investing Activities. Cash flows from investing activities primarily relate to business acquisitions and dispositions and capital expenditures. In 2009, cash flows from investing activities included $1.9 million of capital expenditures and $2.1 million of cash paid related to prior year business acquisitions. In 2008, cash flows from investing activities included $7.6 million of cash paid related to business acquisitions, $8.4 million of cash that was restricted under a performance bond, and $4.3 million of capital expenditures offset by $1.8 million of proceeds related to the sale of discontinued operations. In 2007, cash flows from investing activities included $23.9 million of cash proceeds from the sale of these businesses offset by $5.2 million in capital expenditures. Capital expenditures for all periods presented primarily pertain to the expansion of facilities, computer equipment, manufacturing and lab equipment, and costs associated with the implementation of an enterprise software system throughout the Company.
Cash Flows from Financing Activities. In 2009 and 2008, cash flows from financing activities primarily included $0.6 million and $1.1 million, respectively, of cash used to purchase treasury stock from employees who elected to make required tax payments on stock-based compensation through net share settlement. In 2007, cash flows from financing activities included $71.9 million of net proceeds from our initial public offering, proceeds from issuance of our Series A Preferred Stock, and proceeds from the issuance and repayment of our lines of credit, notes payable and long-term debt. In 2007, we issued $3.5 million of Series A Preferred Stock, which was used for working capital purposes and business acquisitions. Debt issuances, net of repayments, in 2007 were $2.6 million. In the first quarter of 2007, our debt proceeds included a $3.0 million bridge loan from Wexford to be used for working capital purposes. The $3.0 million bridge loan from Wexford was repaid during the second quarter of 2007. In the third quarter of 2007, our debt proceeds included a $7.0 million bridge loan from an affiliate of Wexford to be used for working capital purposes and for our acquisition of PureTech in October 2007. The $7.0 million bridge loan from Wexford was repaid during the fourth quarter of 2007, along with $0.1 million of accrued interest. Additionally, we paid subsidiary debt totaling approximately $1.5 million in full following the IPO.
55
Table of Contents
Contractual Obligations
The following table is a summary of our contractual obligations as of December 31, 2009:
| Payments Due by Period | |||||||||||||||
| Total | Less than 1 Year |
1-3 Years |
3-5 Years |
More than 5 years | |||||||||||
| (dollars in thousands) | |||||||||||||||
| Contractual obligations |
|||||||||||||||
| Operating lease obligations |
18,844 | 4,893 | 5,281 | 2,749 | 5,921 | ||||||||||
| Payments due for prior business combinations |
900 | 900 | — | — | — | ||||||||||
| Total contractual obligations |
$ | 19,744 | $ | 5,793 | $ | 5,281 | $ | 2,749 | $ | 5,921 | |||||
Payments due for prior business combinations represent cash amounts payable related to our 2008 business combination.
Lines of Credit. One of our business units has an operating line of credit with a bank in which borrowing is collateralized by and based on a percentage of certain eligible accounts receivable, inventory and property and equipment. Interest is based on prime, but the agreement includes a floor. The aggregate maximum borrowing amount under this agreement is $2.5 million. At December 31, 2009, we had no amounts outstanding under this agreement.
Critical Accounting Policies and Estimates
The discussion and analysis of our financial condition and results of operations are based upon our consolidated financial statements which have been prepared in accordance with accounting principles generally accepted in the United States of America. The preparation of our financial statements requires us to make assumptions and prepare estimates that affect the reported amounts of assets and liabilities, the disclosure of contingent assets and liabilities and revenues and expenses. We base our estimates on historical experience and various other assumptions that we believe are reasonable; however, actual results may differ. See note 1 to our consolidated financial statements contained elsewhere in this report for a discussion of our significant accounting policies.
Revenue Recognition—Products. A significant portion of our revenue is derived from the sale of our products. We recognize revenue from product sales when all of the following criteria are met: persuasive evidence of an arrangement exists, delivery has occurred, the price is fixed or determinable, title and risk have passed to the customer and collection from the customer is reasonably assured, which typically occurs at the time the product is shipped.
Revenue Recognition—Contract Research and Development and Services. For our contract research and development and contract service revenue, we account for sales and earnings under long-term contracts using the percentage-of-completion method of accounting. Under the percentage-of-completion method, we recognize revenue as the work progresses—either as the products are produced and delivered or as services are rendered, as applicable. We estimate profit as the difference between total estimated revenue and total estimated cost of a contract and recognize that profit over the remaining life of the contract based on either input (e.g., costs incurred) or output (e.g., units delivered) measures, as appropriate. If a revised estimate of contract profitability reveals an anticipated loss on the contract, we recognize the loss in the period it is identified.
The percentage-of-completion method of accounting involves the use of various estimating techniques to project costs at completion, and in some cases includes estimates of recoveries asserted against the customer for changes in specifications. Contract estimates involve various assumptions and projections relative to the outcome of future events over a period of several months or years, including future labor productivity and availability, the
56
Table of Contents
nature and complexity of the work to be performed, the cost and availability of materials, the impact of delayed performance, the availability and timing of funding from the customer and the timing of product deliveries. These estimates are based on our best judgment. A significant change in one or more of these estimates could affect the profitability of one or more of our contracts. We principally use hours of work and contract milestones to measure the progress of contract completeness. Certain contracts provide for billings and/or payments that may not coincide with revenue recognition. To the extent that customer billings or payments are in excess of revenues, we record the excess as deferred revenue. To the extent that we recognize revenue under the percentage of completion method prior to billings as defined in the contracts, we record such amounts as unbilled revenue, and we expect them to be collected within one year of recognition.
We review our contract estimates monthly to assess revisions in contract values and estimated costs at completion and reflect changes in estimates in the current and future periods under the reallocation method.
Revenue Recognition—Service and Other. Service and other revenue is primarily derived from custom product design and development services, sales of custom designed products and project management and technology integration services using the percentage-of-completion method described above. We recognize revenue from product training and installation services when the services are provided. We generally recognize revenue for software maintenance and extended warranty contracts on a straight-line basis over the life of the contract. Under U.S. GAAP, companies are required to defer all revenue from multiple-element software arrangements if sufficient vendor specific objective evidence does not exist for the allocation of revenue to the various elements of the arrangement. As a result, we recognize any revenue on multi-year software license agreements ratably over the life of the arrangement.
Goodwill and Identifiable Intangible Assets. We allocate the cost of business acquisitions to the assets acquired and liabilities assumed based on their estimated fair values at the date of acquisition (commonly referred to as the purchase price allocation). As part of the purchase price allocations for our business acquisitions, identifiable intangible assets are recognized as assets apart from goodwill if they arise from contractual or other legal rights, or if they are capable of being separated or divided from the acquired business and sold, transferred, licensed, rented or exchanged. However, we do not recognize any intangible assets apart from goodwill for the assembled workforces of our business acquisitions.
A significant component of the businesses we have acquired historically is the presence of advanced security products and technologies that the business has developed. The most significant identifiable intangible asset that we have separately recognized is core technologies. Our intellectual property and proprietary rights for these core technologies are typically protected through a combination of patents, copyrights, trademarks, service marks, trade secrets, confidentiality provisions and licensing arrangements. The fair value for core technologies is determined, as of the date of acquisition, using the “Relief from Royalty Method,” an approach commonly used in valuing intangible assets. The basic tenet of the “Relief from Royalty Method” is that without ownership of the subject intangible asset, the user of that intangible asset would have to make a stream of payments to the owner of the asset in return for the rights to use that asset. By acquiring the intangible asset, the user avoids these payments. The valuation of the core technologies takes into consideration the percentage of forecasted revenues directly attributable to the underlying core/developed technologies. The royalty rate was selected based on consideration of several factors including external research, industry practices and margin considerations. Also factoring into the valuations of core technologies are the estimated technological useful lives of the products that use the technologies and the present value of future cash flows. The discount rates used to determine the present value of future cash flows is based on consideration of the weighted average cost of capital and internal rates of return as well as the risk and return characteristics of the core technologies.
Customer contractual relationships also constitute a significant portion of identifiable intangible assets recognized by us. All of our contractual relationships are established through written customer contracts (revenue arrangements). The fair value for customer contractual relationships is determined, as of the date of acquisition, based on estimates and judgments regarding expectations for the estimated future after-tax earnings and cash
57
Table of Contents
flows (including cash flows from working capital) arising from the follow-on sales on contract (revenue arrangement) renewals expected from customer contractual relationships over their estimated lives, including the probability of expected future contract renewals and sales, less a contributory asset charge, all of which is discounted to present value.
The value assigned to goodwill equals the amount of the purchase price of the business acquired in excess of the sum of the amounts assigned to identifiable acquired assets, both tangible and intangible, less liabilities assumed. At December 31, 2009, we had goodwill of $70.3 million and identifiable intangible assets, net of accumulated amortization, of $9.9 million.
Intangible assets are amortized over their respective estimated useful lives ranging from one to ten years. The useful life of an intangible asset is the period over which the asset is expected to contribute directly or indirectly to our future cash flows rather than the period of time that it would take us to internally develop an intangible asset that would provide similar benefits. The estimate of the useful lives of our intangible asset is based on an analysis of all pertinent factors, in particular:
| • | the expected use of the asset by the entity; |
| • | the expected useful life of another asset or group of assets to which the useful life of the intangible asset may relate; |
| • | any legal, regulatory or contractual provisions that may limit the useful life; |
| • | any legal, regulatory, or contractual provisions that enable renewal or extension of the asset’s legal or contractual life without substantial cost (provided there is evidence to support renewal or extension and renewal or extension can be accomplished without material modifications of the existing terms and conditions); |
| • | the effects of obsolescence, demand, competition and other economic factors (such as the stability of the industry, known technological advances, legislative action that results in an uncertain or changing regulatory environment, and expected changes in distribution channels); and |
| • | the level of regular maintenance expenditures (but not enhancements) required to obtain the expected future cash flows from the asset (for example, a material level of required maintenance in relation to the carrying amount of the asset may suggest a limited useful life). |
If no legal, regulatory, contractual, competitive, economic, or other factors limit the useful life of an intangible asset, the useful life of the asset is considered to be indefinite. The term indefinite does not mean infinite. An intangible asset with a finite useful life is amortized over that useful life; an intangible asset with an indefinite useful life is not amortized. We have no intangible assets with indefinite useful lives. Under U.S. GAAP, goodwill is not amortized.
We review goodwill and intangible assets for impairment whenever events or changes in circumstances indicate that the carrying amount of these assets may not be recoverable, and also review goodwill annually. U.S. GAAP requires that goodwill be tested, at a minimum, annually for each reporting unit using a two-step process. A reporting unit is an operating segment or a component of an operating segment. A component of an operating segment is a reporting unit if the component constitutes a business for which discrete financial information is available and is reviewed. Two or more components of an operating segment may be aggregated and deemed a single reporting unit for goodwill impairment testing purposes if the components have similar economic characteristics. The first step is to identify any potential impairment by comparing the carrying value of the reporting unit to its fair value. If a potential impairment is identified, the second step is to measure the impairment loss by comparing the implied fair value of goodwill with the carrying value of goodwill of the reporting unit. The fair value of a reporting unit is estimated using the following methods: discounted cash flow, similar transactions and guideline company. Indications of value from all three methods are used to derive the reporting unit’s ultimate fair value by calculating a weighted average value based on these three methods. Values
58
Table of Contents
resulting from the three methods are weighted based on factors and assumptions related to the inputs used in each of the methods, giving more weight to inputs believed to be more reliable based on characteristics of the individual reporting units, market conditions and the current business environment. We receive and utilize quoted market prices in active markets to validate results produced by these three methods, including aggregating the values of the reporting units and comparing this value to the market capitalization of the consolidated company. The discounted cash flow valuation approach dependent on estimates for future sales, operating income, depreciation and amortization, income tax payments, working capital changes and capital expenditures as well as expected growth rates for cash flows and long-term interest rates, all of which are affected by economic conditions related to the industries in which we operate as well as conditions in the U.S. capital markets.
The most significant assumptions used in a discounted cash flow valuation regarding the estimated fair values of our reporting units in connection with goodwill valuation assessments are:
| • | detailed long-range (approximating 10 years) cash flow projections for each of our reporting units; |
| • | a risk adjusted discount rate including the estimated risk-free rate of return; and |
| • | the expected long-term growth rate of our business, which approximates the expected long-term growth rate for the U.S. economy and the industries in which we operate. |
The risk adjusted discount rate represents the estimated weighted average cost of capital. The weighted average cost of capital focuses on rates of return for equity and debt, and a corresponding capital structure.
A decline in the estimated fair value of a reporting unit could result in goodwill impairment and a related non-cash impairment charge against earnings, if the estimated fair value for the reporting unit is less than the carrying value of the net assets of the reporting unit, including its goodwill. During the year ended December 31, 2009, we recognized a goodwill impairment loss of $1.3 million associated with discontinued operations.
We now have several years of operating history from which to forecast future cash flows of our reporting units. Based on consistent revenue growth, reductions in general and administrative costs, improved operating results and increased funded and unfunded backlog, the estimated fair value of our reporting units exceeded the book value of those units in 2007, 2008 and 2009, resulting in no goodwill impairment charge for the years then ended related to continuing operations.
Stock-based Compensation. U.S. GAAP requires equity-classified, share-based payments to employees, including grants of employee stock options, to be valued at fair value on the date of grant and to be expensed over the applicable vesting period. Share-based awards granted or modified are recognized in compensation expense over the applicable vesting period. We recognize this expense on a straight-line basis over the options’ expected terms.
We granted options to purchase 1,299,436 and 102,369 shares of our common stock in 2009 and 2008, respectively, under the 2007 Equity Incentive Plan. We recorded stock-based compensation expense of $850,098 and $1,610,072 during the years ended December 31, 2009 and 2008, respectively, in connection with the option grants. During the year ended December 31, 2009, we granted 236,494 shares of restricted stock and restricted stock units pursuant to the 2007 Equity Incentive Plan, compared to 617,302 shares granted in 2008. We recorded stock-based compensation expense of $2,868,223 and $4,131,386 during the years ended December 31, 2009 and 2008, respectively, in connection with the restricted stock and restricted stock unit grants. Grants of restricted stock and restricted stock units are valued using the closing market price of our common stock on the date of grant.
We estimate the grant date fair value of stock option awards using the Black-Scholes option valuation model, which requires, among other inputs, an estimate of the fair value of the underlying common stock on the date of grant and the expected term of the options. Separate values were determined for options having exercise
59
Table of Contents
prices ranging from $4.09 to $14.00. We applied the resulting fair values for one share of common stock as of each of the valuation dates to our Black-Scholes option valuation model to arrive at the fair value of the related options granted during the valuation period.
For options granted, we calculated expected option terms based on the “simplified” method for “plain vanilla” options, due to the Company’s limited historical trading and exercise information. The “simplified method” calculates the expected term as the average of the vesting term and the original contractual term of the options. The expected term affects the assumed rate of forfeitures. If the actual number of forfeitures differs from that estimated by management, we may be required to record adjustments to stock-based compensation expense in future periods. As additional information becomes available to allow us to estimate expected term, we will discontinue use of the simplified method. We calculated volatility using the annualized daily volatilities of similar publicly-traded entities.
For the years ended December 31, 2009, 2008, and 2007 we recognized stock-based compensation expense of $3.7 million, $5.7 million and $6.9 million, respectively. In future periods, stock-based compensation expense may increase as we issue additional equity-based awards to continue to attract and retain key employees. Additionally, U.S. GAAP requires that we recognize compensation expense only for the portion of stock options that are expected to vest.
As of December 31, 2009, our total unrecognized compensation expense related to stock-based awards granted to employees and non-employee directors was approximately $2.8 million.
Income Taxes. We use an asset and liability approach for accounting for income taxes. Deferred income taxes are recognized for the tax consequences of temporary differences and carryforwards by applying enacted tax rates applicable to future years to differences between the financial statement amounts and the tax bases of existing assets and liabilities. We establish a valuation allowance if it is probable that some portion of the deferred tax asset will not be realized. Our determination of whether a valuation allowance is appropriate requires the exercise of judgment. At December 31, 2009, we had net operating loss carryforwards available for U.S. federal and state income taxes of $107.0 million which begin to expire in 2017. The net operating loss carryforwards that we acquired in connection with our business acquisitions may also be limited by provision of the Internal Revenue Code regarding changes in ownership. We have provided a valuation allowance against net U.S. deferred tax assets and operating loss carryforwards in certain non-U.S. jurisdictions. We have recorded a valuation allowance because of the emerging nature of our business and our history of losses. We will continue to evaluate income generated in future periods in determining the reasonableness of our position. If we determine that future income is sufficient or insufficient to cause the realization of the net operating loss carryforwards within the required time, the valuation allowance will be adjusted as necessary.
Liabilities for Pending and Threatened Litigation. We are subject to litigation, investigations, proceedings, claims or assessments and various contingent liabilities incidental to our business or assumed in connection with certain business acquisitions. We accrue a charge for a loss contingency when we believe it is both probable that a liability has been incurred and the amount of the loss can be reasonably estimated. If the loss is within a range of specified amounts, the most likely amount is accrued, and if no amount within the range represents a better estimate we accrue the minimum amount in the range. Generally, we record the loss contingency at the amount we expect to pay to resolve the contingency and the amount is generally not discounted to the present value. Amounts recoverable under insurance contracts are recorded as assets when recovery is deemed probable. Contingencies that might result in a gain are not recognized until realized. Changes to the amount of the estimated loss, or resolution of one or more contingencies could have a material impact on our results of operations, financial position and cash flows.
Recent Accounting Pronouncements
For a discussion of recent accounting pronouncements, refer to Note 1 of the Notes to the Consolidated Financial Statements in Part IV—Item 15—Exhibits and Financial Statement Schedules.
60
Table of Contents
Off-Balance Sheet Arrangements
During the periods presented, we did not have, nor do we currently have, any off-balance sheet arrangements.
| Item 7A. | QUANTITATIVE AND QUALITATIVE DISCLOSURES ABOUT MARKET RISK |
Foreign Currency Risk. Our international businesses generate revenue and incur expenses that are denominated in foreign currencies. Historically, our foreign currency translation adjustments have not been material to our financial position or consolidated results of operations. However, changes in economic conditions impacting foreign currency exchange rates could materially increase our exposure to foreign currency fluctuations and adversely affect our consolidated results of operations or financial position, specifically with changes in the United States dollar relative to the Canadian dollar and the European Euro. Our Canadian and German subsidiaries are consolidated into our financial results and under U.S. GAAP, we are required to translate the financial condition and results of operations of these subsidiaries into United States dollars, with any corresponding translation gains or losses being recorded in other comprehensive income in our consolidated financial statements. For the years ended December 31, 2009, 2008 and 2007, this translation adjustment, net of tax, was a gain of $0.03 million, a loss of $0.1 million and a gain of $1.9 million, respectively. We also maintain cash balances denominated in foreign currencies. At December 31, 2009, we had $3.5 million of cash in foreign accounts. We have not hedged our exposure to changes in foreign currency rates and, as a result, could incur unanticipated translation gains and losses.
Interest Rate Risk. We had cash and cash equivalents (including restricted cash) of $30.7 million at December 31, 2009. We do not enter into investments for trading or speculative purposes. We do not believe that we have any material exposure to changes in the fair value of these investments as a result of changes in interest rates. Declines in interest rates, however, will reduce future income.
We have a line of credit agreement that bears interest at variable rate adjusted based on the prime rate. At December 31, 2009, no amounts were outstanding under this agreement. Based on the amount outstanding and the maximum amount available for borrowing, we do not believe that changes in interest rates create material exposure to our business. Increases in interest rates, however, will increase future interest expense.
| Item 8. | FINANCIAL STATEMENTS AND SUPPLEMENTARY DATA |
Our consolidated financial statements, together with the report thereon of Grant Thornton LLP dated March 31, 2010, are set forth on pages F-1 through F-35 hereof. See Item 15 for an index to our consolidated financial statements.
| Item 9. | CHANGES IN AND DISAGREEMENTS WITH ACCOUNTANTS ON ACCOUNTING AND FINANCIAL DISCLOSURE |
None.
| Item 9A(T). | CONTROLS AND PROCEDURES |
Evaluation of Disclosure Controls and Procedures
As of December 31, 2009, we completed our annual evaluation, under the supervision and with the participation of our management, including our Chief Executive Officer and our Chief Financial Officer, of the effectiveness of the design and operation of our disclosure controls and procedures. Based on the evaluation, our Chief Executive Officer and Chief Financial Officer have concluded that our disclosure controls and procedures are effective to ensure that information required to be disclosed by us in the reports we file or submit under the Securities Exchange Act of 1934, as amended, is recorded, processed, summarized and reported within the time
61
Table of Contents
periods specified in Securities and Exchange Commission rules and forms and that such information is accumulated and communicated to management as appropriate to allow for timely decisions regarding required disclosure.
Management’s Report on Internal Control Over Financial Reporting
Management of the Company is responsible for establishing and maintaining adequate internal control over financial reporting, as such term is defined in Exchange Act Rule 13a-15(f). The internal control system was designed to provide reasonable assurance to the Company’s management and board of directors regarding the preparation and fair presentation of published financial statements.
Our internal control system was designed to provide reasonable assurance to our management and board of directors regarding the preparation and fair presentation of published financial statements in accordance with U.S. GAAP. However, all internal control systems, no matter how well designed, have inherent limitations. Therefore, even those systems determined to be effective can provide only reasonable assurance with respect to financial statement preparation and presentation.
The Company’s management assessed the effectiveness of the Company’s internal control over financial reporting as of December 31, 2009. In making this assessment, the Company used the criteria for effective internal control over financial reporting set forth in Internal Control—Integrated Framework issued by the Committee of Sponsoring Organizations of the Treadway Commission (COSO). Based on management’s assessment, management has concluded that, as of December 31, 2009, the Company’s internal control over financial reporting was effective based on those criteria.
This annual report does not include an attestation report of the Company’s registered public accounting firm regarding internal control over financial reporting. Management’s report was not subject to attestation by the Company’s registered public accounting firm pursuant to temporary rules of the Securities and Exchange Commission that permit the Company to provide only management’s report in this annual report.
Changes in Internal Control Over Financial Reporting
There were no changes in our internal control over financial reporting that occurred during the fourth fiscal quarter of 2009 that have materially affected, or are reasonably likely to materially affect, our internal control over financial reporting.
| Item 9B. | OTHER INFORMATION |
None.
62
Table of Contents
PART III
| ITEM 10. | DIRECTORS, EXECUTIVE OFFICERS AND CORPORATE GOVERNANCE |
The information required by this item will be set forth in our definitive Proxy Statement to be filed on or before April 30, 2010. The Proxy Statement relates to a meeting of stockholders involving the election of directors and the portions therefrom required to be set forth in this Form 10-K by this item are incorporated herein by reference pursuant to General Instruction G(3) to Form 10-K.
We have adopted a Code of Ethics that applies to our Chief Executive Officer, Chief Financial Officer, Controller and persons performing similar duties. A copy of the Code of Ethics is publicly available on our website (www.icxt.com) in the Corporate Governance area of the Investor Relations segment of the website. None of the material on our website is part of this Annual Report. If there is any waiver from any provision of the Code of Ethics for our Chief Executive Officer, Chief Financial Officer, Controller and persons performing similar duties, we will disclose the nature of such waiver on our website.
| ITEM 11. | EXECUTIVE COMPENSATION |
The information required by this item will be set forth in our definitive Proxy Statement to be filed on or before April 30, 2010. The Proxy Statement relates to a meeting of stockholders involving the election of directors and the portions therefrom required to be set forth in this Form 10-K by this item are incorporated herein by reference pursuant to General Instruction G(3) to Form 10-K.
| ITEM 12. | SECURITY OWNERSHIP OF CERTAIN BENEFICIAL OWNERS AND MANAGEMENT AND RELATED STOCKHOLDER MATTERS |
The information required by this item will be set forth in our definitive Proxy Statement to be filed on or before April 30, 2010. The Proxy Statement relates to a meeting of stockholders involving the election of directors and the portions therefrom required to be set forth in this Form 10-K by this item are incorporated herein by reference pursuant to General Instruction G(3) to Form 10-K.
| ITEM 13. | CERTAIN RELATIONSHIPS AND RELATED TRANSACTIONS, AND DIRECTOR INDEPENDENCE |
The information required by this item will be set forth in our definitive Proxy Statement to be filed on or before April 30, 2010. The Proxy Statement relates to a meeting of stockholders involving the election of directors and the portions therefrom required to be set forth in this Form 10-K by this item are incorporated herein by reference pursuant to General Instruction G(3) to Form 10-K.
| ITEM 14. | PRINCIPAL ACCOUNTANT FEES AND SERVICES |
The information required by this item will be set forth in our definitive Proxy Statement to be filed on or before April 30, 2010. The Proxy Statement relates to a meeting of stockholders involving the election of directors and the portions therefrom required to be set forth in this Form 10-K by this item are incorporated herein by reference pursuant to General Instruction G(3) to Form 10-K.
63
Table of Contents
PART IV
| ITEM 15. | EXHIBITS AND FINANCIAL STATEMENT SCHEDULES |
(a) The following documents are filed as part of this Annual Report on Form 10-K:
| (1) | Financial Statements. Consolidated Financial Statements for the Three Years Ended December 31, 2009: |
| F-2 | ||
| F-3 | ||
| F-4 | ||
| F-5 | ||
| Consolidated Statements of Cash Flows for the Years Ended December 31, 2009, 2008 and 2007 |
F-7 | |
| F-8 | ||
| (2) | Financial Statement Schedules. All financial statement schedules are omitted because they are not applicable or the information is shown in the Consolidated Financial Statements or notes thereto. |
| (3) | Exhibits. The exhibits filed as part of this report are listed under “Exhibits” at subsection (b) of this Item 15. |
64
Table of Contents
| Exhibit |
Exhibit Title | |
| 3.1* | Third Amended and Restated Certificate of Incorporation of ICx Technologies, Inc., filed as Exhibit 3.5 with ICx’s Registration Statement on Form S-1, as amended, Registration No. 333-145135, which became effective November 7, 2007 | |
| 3.2* | Amended and Restated Bylaws of ICx Technologies, Inc., filed as Exhibit 3.7 with ICx’s Registration Statement on Form S-1, as amended, Registration No. 333-145135, which became effective November 7, 2007 | |
| 4.1* | Specimen certificate for common stock of ICx Technologies, Inc., filed as the same numbered exhibit with ICx’s Registration Statement on Form S-1, as amended, Registration No. 333-145135, which became effective November 7, 2007 | |
| 4.2** | Warrant to Purchase Common Stock of ICx Technologies, Inc., issued February 3, 2006, as amended on September 8, 2009 | |
| 10.1* | Investors’ Rights Agreement, dated July 26, 2005, filed as the same numbered exhibit with ICx’s Registration Statement on Form S-1, as amended, Registration No. 333-145135, which became effective November 7, 2007 | |
| 10.2*† | Amended and Restated 2005 Stock Plan, filed as the same numbered exhibit with ICx’s Registration Statement on Form S-1, as amended, Registration No. 333-145135, which became effective November 7, 2007 | |
| 10.3*† | 2007 Equity Incentive Plan, filed as the same numbered exhibit with ICx’s Registration Statement on Form S-1, as amended, Registration No. 333-145135, which became effective November 7, 2007 | |
| 10.4* | 2007 Employee Stock Purchase Plan, filed as the same numbered exhibit with ICx’s Registration Statement on Form S-1, as amended, Registration No. 333-145135, which became effective November 7, 2007 | |
| 10.5*† | Employment Agreement between ICx Technologies, Inc. and Hans Kobler dated October 1, 2005, as amended by that First Amendment, dated April 26, 2007, filed as the same numbered exhibit with ICx’s Registration Statement on Form S-1, as amended, Registration No. 333-145135, which became effective November 7, 2007 | |
| 10.6*† | Employment Extension Agreement between ICx Technologies, Inc. and Hans Kobler, effective October 1, 2007, filed as the same numbered exhibit with ICx’s Registration Statement on Form S-1, as amended, Registration No. 333-145135, which became effective November 7, 2007 | |
| 10.8*† | Employment Agreement between Nomadics, Inc. and Colin J. Cumming, dated August 24, 2005, filed as the same numbered exhibit with ICx’s Registration Statement on Form S-1, as amended, Registration No. 333-145135, which became effective November 7, 2007 | |
| 10.10*† | Offer Letter Agreement With Douglas A. Knight, dated May 24, 2007, filed as the same numbered exhibit with ICx’s Registration Statement on Form S-1, as amended, Registration No. 333-145135, which became effective November 7, 2007 | |
| 10.13* | Form of Indemnification Agreement, filed as the same numbered exhibit with ICx’s Registration Statement on Form S-1, as amended, Registration No. 333-145135, which became effective November 7, 2007 | |
| 10.14* | Administrative Services Agreement between ICx Technologies, Inc. and Wexford Capital LLC, dated October 1, 2005, as amended by that First Amendment, dated October 1, 2006, filed as the same numbered exhibit with ICx’s Registration Statement on Form S-1, as amended, Registration No. 333-145135, which became effective November 7, 2007 | |
65
Table of Contents
| Exhibit |
Exhibit Title | |
| 10.15*† | Employment Agreement between ICx Technologies, Inc. and Colin J. Cumming, effective April 17, 2009, filed as the same numbered exhibit with ICx’s Form 8-K, filed April 20, 2009 | |
| 10.16*† | Employment Agreement between ICx Technologies, Inc. and Hans Kobler, effective April 17, 2009, filed as the same numbered exhibit with ICx’s Form 8-K, filed April 20, 2009 | |
| 10.17*† | Employment Agreement between ICx Technologies, Inc. and Deborah Mosier, effective April 20, 2009, filed as the same numbered exhibit with ICx’s Form 8-K, filed April 20, 2009 | |
| 10.18* | Termination Agreement between ICx Technologies, Inc. and Douglas A. Knight, dated March 25, 2009, filed as the same numbered exhibit with ICx’s Form 10-K/A, filed April 30, 2009 | |
| 21.1** | List of Subsidiaries | |
| 23.1** | Consent of Grant Thornton LLP | |
| 24.1** | Power of Attorney | |
| 31.1** | Certification by the Chief Executive Officer Pursuant to Section 302 of the Sarbanes-Oxley Act of 2002 | |
| 31.2** | Certification by the Chief Financial Officer Pursuant to Section 302 of the Sarbanes-Oxley Act of 2002 | |
| 32.1** | Certification by the Chief Executive Officer and Chief Financial Officer Pursuant to Section 906 of the Sarbanes-Oxley Act of 2002 | |
| * | Incorporated by reference |
| ** | Filed herewith |
| † | Management contract or compensatory plan or arrangement |
66
Table of Contents
Pursuant to the requirements of Section 13 or 15(d) of the Securities Exchange Act of 1934, the Registrant has duly caused this report to be signed on its behalf by the undersigned, thereunto duly authorized.
Dated: March 31, 2010
| ICX TECHNOLOGIES, INC. | ||
| By: |
/s/ COLIN J. CUMMING | |
| Colin J. Cumming Chief Executive Officer | ||
Pursuant to the requirements of the Securities Exchange Act of 1934, this report has been signed below by the following persons on behalf of the registrant and in the capacities and on the dates indicated.
| Signature |
Title |
Date | ||||
| /s/ COLIN J. CUMMING Colin J. Cumming |
Chief Executive Officer and Director (Principal Executive Officer) |
March 31, 2010 | ||||
| /s/ DEBORAH D. MOSIER Deborah D. Mosier |
Chief Financial Officer (Principal Financial and Accounting Officer) |
March 31, 2010 | ||||
| /s/ * Hans Kobler |
Executive Chairman of the Board | March 31, 2010 | ||||
| /s/ * E. Spencer Abraham |
Director | March 31, 2010 | ||||
| /s/ * Joseph M. Jacobs |
Director | March 31, 2010 | ||||
| /s/ * Robert A. Maginn, Jr. |
Director | March 31, 2010 | ||||
| /s/ * Mark L. Plaumann |
Director | March 31, 2010 | ||||
| /s/ * Rodney E. Slater |
Director | March 31, 2010 | ||||
| *By: | /s/ JIM LUBY Jim Luby, pursuant to power of attorney |
|||||
67
Table of Contents
ICx TECHNOLOGIES, INC. AND SUBSIDIARIES
Audited Consolidated Financial Statements
For the Years Ended December 31, 2009, 2008 and 2007
F-1
Table of Contents
Report of Independent Registered Public Accounting Firm
The Board of Directors
ICx Technologies, Inc. and Subsidiaries
We have audited the accompanying consolidated balance sheets of ICx Technologies, Inc. (a Delaware corporation) and Subsidiaries (the “Company”) as of December 31, 2009 and 2008, and the related consolidated statements of operations and comprehensive loss, convertible redeemable preferred stock and stockholders’ equity, and cash flows for each of the three years in the period ended December 31, 2009. These financial statements are the responsibility of the Company’s management. Our responsibility is to express an opinion on these financial statements based on our audits.
We conducted our audits in accordance with the standards of the Public Company Accounting Oversight Board (United States). Those standards require that we plan and perform the audit to obtain reasonable assurance about whether the financial statements are free of material misstatement. The Company is not required to have, nor were we engaged to perform an audit of its internal control over financial reporting. Our audit included consideration of internal control over financial reporting as a basis for designing audit procedures that are appropriate in the circumstances, but not for the purpose of expressing an opinion on the effectiveness of the Company’s internal control over financial reporting. Accordingly, we express no such opinion. An audit also includes examining, on a test basis, evidence supporting the amounts and disclosures in the financial statements, assessing the accounting principles used and significant estimates made by management, as well as evaluating the overall financial statement presentation. We believe that our audits provide a reasonable basis for our opinion.
In our opinion, the consolidated financial statements referred to above present fairly, in all material respects, the financial position of the Company at December 31, 2009 and 2008, and the results of its operations and its cash flows for each of the three years in the period ended December 31, 2009, in conformity with accounting principles generally accepted in the United States of America.
/s/ GRANT THORNTON LLP
March 31, 2010
Oklahoma City, Oklahoma
F-2
Table of Contents
ICx TECHNOLOGIES, INC. AND SUBSIDIARIES
Consolidated Balance Sheets
| December 31, | ||||||||
| 2009 | 2008 | |||||||
| Assets | ||||||||
| Current assets: |
||||||||
| Cash and cash equivalents |
$ | 22,270,262 | $ | 30,353,728 | ||||
| Restricted cash |
8,464,545 | 8,428,375 | ||||||
| Trade accounts receivable, net |
36,751,209 | 36,547,022 | ||||||
| Unbilled revenue |
8,957,090 | 10,996,971 | ||||||
| Inventories |
22,490,819 | 26,174,426 | ||||||
| Deferred income taxes |
346,721 | 19,935 | ||||||
| Prepaid expenses and other current assets |
4,205,956 | 2,630,995 | ||||||
| Current assets of discontinued operations |
1,051,997 | 618,687 | ||||||
| Total current assets |
104,538,599 | 115,770,139 | ||||||
| Property, plant and equipment, net |
9,672,581 | 10,850,293 | ||||||
| Intangible assets, net |
9,901,567 | 18,018,082 | ||||||
| Goodwill |
70,274,490 | 69,557,440 | ||||||
| Other assets |
3,671,016 | 2,343,794 | ||||||
| Noncurrent assets of discontinued operations |
365,639 | 2,758,704 | ||||||
| Total assets |
$ | 198,423,892 | $ | 219,298,452 | ||||
| Liabilities and Stockholders’ Equity | ||||||||
| Current liabilities: |
||||||||
| Lines of credit |
$ | — | $ | — | ||||
| Current portion of long-term debt |
63,233 | 58,920 | ||||||
| Accounts payable |
6,609,983 | 16,868,514 | ||||||
| Accrued payroll expenses |
8,469,733 | 5,906,904 | ||||||
| Accrued expenses and other current liabilities |
6,106,986 | 7,131,284 | ||||||
| Deferred revenue |
4,943,348 | 8,861,965 | ||||||
| Current liabilities of discontinued operations |
827,954 | 198,036 | ||||||
| Total current liabilities |
27,021,237 | 39,025,623 | ||||||
| Long-term debt |
117,935 | 175,519 | ||||||
| Deferred income taxes |
464,890 | 947,600 | ||||||
| Other liabilities |
383,318 | 1,342,342 | ||||||
| Total liabilities |
27,987,380 | 41,491,084 | ||||||
| Commitments and Contingencies |
||||||||
| Series A Convertible Redeemable Preferred Stock, par value $.001 per share—authorized 15,000,000 shares in 2009 and 2008; issued and outstanding 0 shares in 2009 and 2008; liquidation preference $0 at December 31, 2009 and 2008 |
— | — | ||||||
| Stockholders’ Equity: |
||||||||
| Common stock, par value $.001 per share, authorized 250,000,000 shares in 2009 and 2008; issued 34,915,021 and 34,422,765 shares in 2009 and 2008, respectively, outstanding 34,551,357 and 34,182,100 in 2009 and 2008, respectively |
34,915 | 34,423 | ||||||
| Additional paid-in capital |
385,552,404 | 381,701,973 | ||||||
| Treasury stock, at cost; 363,664 and 240,665 shares at December 31, 2009 and 2008, respectively |
(2,815,743 | ) | (2,214,912 | ) | ||||
| Accumulated deficit |
(215,131,852 | ) | (204,478,210 | ) | ||||
| Accumulated other comprehensive income |
2,796,788 | 2,764,094 | ||||||
| Total stockholders’ equity |
170,436,512 | 177,807,368 | ||||||
| Total liabilities and stockholders’ equity |
$ | 198,423,892 | $ | 219,298,452 | ||||
The accompanying notes are an integral part of these consolidated financial statements.
F-3
Table of Contents
ICx TECHNOLOGIES, INC. AND SUBSIDIARIES
Consolidated Statements of Operations and Comprehensive Loss
| Year Ended December 31, | ||||||||||||
| 2009 | 2008 | 2007 | ||||||||||
| Revenues: |
||||||||||||
| Product revenues |
$ | 81,564,834 | $ | 89,720,370 | $ | 90,348,596 | ||||||
| Contract research and development revenues |
54,187,357 | 40,887,099 | 30,698,399 | |||||||||
| Service and other revenues |
47,675,406 | 39,586,492 | 14,460,156 | |||||||||
| Total revenues |
183,427,597 | 170,193,961 | 135,507,151 | |||||||||
| Cost of revenues: |
||||||||||||
| Cost of product revenues |
37,580,258 | 42,974,040 | 42,756,970 | |||||||||
| Cost of contract research and development revenues |
40,949,767 | 29,339,246 | 20,640,431 | |||||||||
| Cost of service and other revenues |
34,416,766 | 27,475,785 | 10,562,464 | |||||||||
| Total cost of revenue |
112,946,791 | 99,789,071 | 73,959,865 | |||||||||
| Gross profit |
70,480,806 | 70,404,890 | 61,547,286 | |||||||||
| Operating expenses: |
||||||||||||
| General and administrative |
27,013,556 | 31,993,894 | 39,599,448 | |||||||||
| Sales and marketing |
24,408,088 | 29,364,811 | 23,928,028 | |||||||||
| Research and development |
15,294,614 | 21,365,834 | 20,466,113 | |||||||||
| Depreciation and amortization |
11,320,337 | 13,087,851 | 13,699,198 | |||||||||
| Total operating expenses |
78,036,595 | 95,812,390 | 97,692,787 | |||||||||
| Operating loss |
(7,555,789 | ) | (25,407,500 | ) | (36,145,501 | ) | ||||||
| Other income (expense): |
||||||||||||
| Interest income |
160,980 | 998,924 | 833,067 | |||||||||
| Interest expense |
(103,396 | ) | (65,710 | ) | (639,360 | ) | ||||||
| Other, net |
911,867 | (92,070 | ) | (381,532 | ) | |||||||
| Total other income (expense) |
969,451 | 841,144 | (187,825 | ) | ||||||||
| Loss before income taxes |
(6,586,338 | ) | (24,566,356 | ) | (36,333,326 | ) | ||||||
| Income tax expense (benefit) |
1,126,501 | (15,335 | ) | (1,108,054 | ) | |||||||
| Loss from continuing operations |
$ | (7,712,839 | ) | $ | (24,551,021 | ) | $ | (35,225,272 | ) | |||
| Loss on discontinued operations, net of tax |
(2,940,803 | ) | (1,486,582 | ) | (1,507,695 | ) | ||||||
| Gain (loss) on sale of discontinued operations, net of tax |
— | (902,885 | ) | 6,821,061 | ||||||||
| Net loss |
$ | (10,653,642 | ) | $ | (26,940,488 | ) | $ | (29,911,906 | ) | |||
| Other comprehensive income |
||||||||||||
| Foreign currency translation adjustment, net of tax of $(66,372) for 2009, ($107,359) for 2008 and $255,106 for 2007 |
32,694 | (139,630 | ) | 1,862,829 | ||||||||
| Comprehensive loss |
$ | (10,620,948 | ) | $ | (27,080,118 | ) | $ | (28,049,077 | ) | |||
| Net loss |
$ | (10,653,642 | ) | $ | (26,940,488 | ) | $ | (29,911,906 | ) | |||
| Less: Preferred stock dividends including accretion |
— | — | 8,402,221 | |||||||||
| Net loss attributable to common stockholders |
$ | (10,653,642 | ) | $ | (26,940,488 | ) | $ | (38,314,127 | ) | |||
| Net loss per common share: |
||||||||||||
| Basic and diluted |
$ | (0.31 | ) | $ | (0.79 | ) | $ | (2.85 | ) | |||
| Pro forma loss per common share (unaudited): |
||||||||||||
| Basic and diluted |
$ | (1.03 | ) | |||||||||
| Basic and diluted weighted average shares outstanding |
34,726,590 | 34,096,488 | 13,425,549 | |||||||||
The accompanying notes are an integral part of these consolidated financial statements.
F-4
Table of Contents
ICx TECHNOLOGIES, INC. AND SUBSIDIARIES
Consolidated Statements of Convertible Redeemable Preferred Stock and Stockholders’ Equity
| Stockholders’ Equity | ||||||||||||||||||||||||||||||||
| Series A Convertible Redeemable Preferred Stock |
Common Stock | Additional Paid-in Capital |
Accumulated Deficit |
Accumulated Other Comprehensive Income |
Treasury Stock |
Total Stockholders’ Equity |
||||||||||||||||||||||||||
| Shares | Amount | Shares | Amount | |||||||||||||||||||||||||||||
| Balances at January 1, 2007 |
18,175,595 | $ | 197,732,187 | 9,758,101 | $ | 9,758 | $ | 95,068,322 | $ | (147,625,816 | ) | $ | 1,040,895 | $ | — | $ | (51,506,841 | ) | ||||||||||||||
| Comprehensive income (loss): |
||||||||||||||||||||||||||||||||
| Net loss |
— | — | — | — | — | (29,911,906 | ) | — | — | (29,911,906 | ) | |||||||||||||||||||||
| Foreign currency translation, net of tax |
— | — | — | — | — | — | 1,862,829 | — | 1,862,829 | |||||||||||||||||||||||
| Total comprehensive loss |
— | — | — | — | — | (29,911,906 | ) | 1,862,829 | — | (28,049,077 | ) | |||||||||||||||||||||
| Issuances of convertible preferred stock: |
||||||||||||||||||||||||||||||||
| Stock purchase agreements |
350,000 | 4,207,000 | — | — | (707,000 | ) | — | — | — | (707,000 | ) | |||||||||||||||||||||
| Accretion to redemption value |
— | 8,402,221 | — | — | (8,402,221 | ) | — | — | — | (8,402,221 | ) | |||||||||||||||||||||
| Issuances of common stock: |
||||||||||||||||||||||||||||||||
| Stock offering, net of $9.2 million in offering costs |
— | — | 5,000,000 | 5,000 | 70,805,014 | — | — | — | 70,810,014 | |||||||||||||||||||||||
| Stock options, warrants and restricted stock |
— | — | 397,196 | 397 | 418,011 | — | — | — | 418,408 | |||||||||||||||||||||||
| Stock-based compensation |
— | — | — | — | 6,621,182 | — | — | — | 6,621,182 | |||||||||||||||||||||||
| Conversion of preferred stock to common |
(18,525,595 | ) | (210,341,408 | ) | 18,525,595 | 18,526 | 210,322,882 | — | — | — | 210,341,408 | |||||||||||||||||||||
| Purchases of treasury stock |
— | — | — | — | — | — | — | (1,121,525 | ) | (1,121,525 | ) | |||||||||||||||||||||
| Balances at December 31, 2007 |
— | — | 33,680,892 | 33,681 | 374,126,190 | (177,537,722 | ) | 2,903,724 | (1,121,525 | ) | 198,404,348 | |||||||||||||||||||||
| Comprehensive income (loss): |
||||||||||||||||||||||||||||||||
| Net loss |
— | — | — | — | — | (26,940,488 | ) | — | — | (26,940,488 | ) | |||||||||||||||||||||
| Foreign currency translation, net of tax |
— | — | — | — | — | — | (139,630 | ) | — | (139,630 | ) | |||||||||||||||||||||
| Total comprehensive loss |
— | — | — | — | — | (26,940,488 | ) | (139,630 | ) | — | (27,080,118 | ) | ||||||||||||||||||||
| Issuances of common stock: |
||||||||||||||||||||||||||||||||
| Business combinations |
— | — | 189,797 | 190 | 887,970 | — | — | 888,160 | ||||||||||||||||||||||||
| Stock options, warrants and restricted stock |
— | — | 552,076 | 552 | 251,827 | — | — | 252,379 | ||||||||||||||||||||||||
| Stock based compensation |
— | — | — | — | 6,463,827 | — | — | — | 6,463,827 | |||||||||||||||||||||||
| Stock offering costs |
— | — | — | — | (27,841 | ) | — | — | — | (27,841 | ) | |||||||||||||||||||||
| Purchases of treasury stock |
— | — | — | — | — | — | — | (1,093,387 | ) | (1,093,387 | ) | |||||||||||||||||||||
| Balances at December 31, 2008 |
— | — | 34,422,765 | 34,423 | 381,701,973 | (204,478,210 | ) | 2,764,094 | (2,214,912 | ) | 177,807,368 | |||||||||||||||||||||
The accompanying notes are an integral part of these consolidated financial statements.
F-5
Table of Contents
ICx TECHNOLOGIES, INC. AND SUBSIDIARIES
Consolidated Statements of Convertible Redeemable Preferred Stock and Stockholders’ Equity—(Continued)
| Stockholders’ Equity | ||||||||||||||||||||||||||||
| Series A Convertible Redeemable Preferred Stock |
Common Stock | Additional Paid- in Capital |
Accumulated Deficit |
Accumulated Other Comprehensive Income |
Treasury Stock |
Total Stockholders’ Equity |
||||||||||||||||||||||
| Shares | Amount | Shares | Amount | |||||||||||||||||||||||||
| Balances at December 31, 2008 |
— | $ | — | 34,422,765 | $ | 34,423 | $ | 381,701,973 | $ | (204,478,210 | ) | $ | 2,764,094 | $ | (2,214,912 | ) | $ | 177,807,368 | ||||||||||
| Comprehensive income (loss): |
||||||||||||||||||||||||||||
| Net loss |
— | — | — | — | — | (10,653,642 | ) | — | — | (10,653,642 | ) | |||||||||||||||||
| Foreign currency translation, net of tax |
— | — | — | — | — | — | 32,694 | — | 32,694 | |||||||||||||||||||
| Total comprehensive loss |
— | — | — | — | — | (10,653,642 | ) | 32,694 | — | (10,620,948 | ) | |||||||||||||||||
| Issuances of common stock: |
||||||||||||||||||||||||||||
| Stock options, warrants and restricted stock |
— | — | 492,256 | 492 | 132,110 | — | — | — | 132,602 | |||||||||||||||||||
| Stock based compensation |
— | — | — | — | 3,718,321 | — | — | — | 3,718,321 | |||||||||||||||||||
| Purchases of treasury stock |
— | — | — | — | — | — | (600,831 | ) | (600,831 | ) | ||||||||||||||||||
| Balances at December 31, 2009 |
— | $ | — | 34,915,021 | $ | 34,915 | $ | 385,552,404 | $ | (215,131,852 | ) | $ | 2,796,788 | $ | (2,815,743 | ) | $ | 170,436,512 | ||||||||||
The accompanying notes are an integral part of these consolidated financial statements.
F-6
Table of Contents
ICx TECHNOLOGIES, INC. AND SUBSIDIARIES
Consolidated Statements of Cash Flows
| Year Ended December 31, | ||||||||||||
| 2009 | 2008 | 2007 | ||||||||||
| Operating activities: |
||||||||||||
| Net loss |
$ | (10,653,642 | ) | $ | (26,940,488 | ) | $ | (29,911,906 | ) | |||
| (Gain) loss on sale of discontinued operations, net of tax |
— | 902,885 | (6,821,061 | ) | ||||||||
| Loss on discontinued operations, net of tax |
2,940,803 | 1,486,582 | 1,513,238 | |||||||||
| Loss from continuing operations, net of tax |
(7,712,839 | ) | (24,551,021 | ) | (35,219,729 | ) | ||||||
| Adjustments to reconcile net loss to net cash used in operating activities: |
||||||||||||
| Stock based compensation |
3,684,617 | 5,683,069 | 6,871,712 | |||||||||
| Depreciation and amortization |
11,320,337 | 13,087,851 | 13,699,198 | |||||||||
| Deferred income taxes |
(799,997 | ) | (559,015 | ) | (1,752,849 | ) | ||||||
| Loss on disposal of property and equipment |
— | — | 43,689 | |||||||||
| Increase in restricted cash |
(36,170 | ) | — | — | ||||||||
| Changes in operating assets and liabilities: |
||||||||||||
| Trade accounts receivable, net |
184,092 | (6,240,185 | ) | (7,098,341 | ) | |||||||
| Unbilled revenue |
2,136,064 | (5,290,401 | ) | (3,634,750 | ) | |||||||
| Inventories |
3,822,633 | (8,002,325 | ) | (4,265,908 | ) | |||||||
| Prepaid expenses and other assets |
(2,690,382 | ) | 1,041,834 | (1,438,309 | ) | |||||||
| Accounts payable |
(10,269,770 | ) | 7,666,204 | 1,124,791 | ||||||||
| Accrued expenses and other liabilities |
1,344,837 | (1,389,040 | ) | 2,096,581 | ||||||||
| Deferred revenue |
(4,188,183 | ) | 5,089,211 | 411,529 | ||||||||
| Net cash used in continuing operating activities |
(3,204,761 | ) | (13,463,818 | ) | (29,162,386 | ) | ||||||
| Cash provided by (used in) operation of discontinued operations |
(317,425 | ) | (1,257,687 | ) | (115,064 | ) | ||||||
| Net cash used in operating activities |
(3,522,186 | ) | (14,721,505 | ) | (29,277,450 | ) | ||||||
| Investing activities: |
||||||||||||
| Purchases of property, plant and equipment |
(1,937,327 | ) | (4,301,461 | ) | (5,154,774 | ) | ||||||
| Business combinations, net of cash acquired |
(2,050,000 | ) | (7,612,576 | ) | (3,250,000 | ) | ||||||
| Increase in restricted cash |
— | (8,428,375 | ) | — | ||||||||
| Net cash used in continuing investing activities |
(3,987,327 | ) | (20,342,412 | ) | (8,404,774 | ) | ||||||
| Proceeds from the sale of discontinued operations |
— | 1,797,115 | 23,909,441 | |||||||||
| Net cash provided by (used in) investing activities |
(3,987,327 | ) | (18,545,297 | ) | 15,504,667 | |||||||
| Financing activities: |
||||||||||||
| Proceeds from issuance of preferred stock |
— | — | 3,500,000 | |||||||||
| Proceeds from issuance of common stock |
132,602 | 252,379 | 71,855,416 | |||||||||
| Borrowings under lines of credit |
11,849,578 | 4,762,806 | 33,243,609 | |||||||||
| Repayments under lines of credit |
(11,849,578 | ) | (4,887,582 | ) | (35,305,418 | ) | ||||||
| Proceeds from notes payable and long-term debt |
— | — | 10,116,893 | |||||||||
| Repayments of notes payable and long-term debt |
(107,409 | ) | (128,288 | ) | (11,011,703 | ) | ||||||
| Purchase of treasury shares |
(600,831 | ) | (1,093,387 | ) | (1,121,525 | ) | ||||||
| Other, net |
— | (34,580 | ) | (116,483 | ) | |||||||
| Net cash provided by (used in) financing activities |
(575,638 | ) | (1,128,652 | ) | 71,160,789 | |||||||
| Effect of foreign exchange rate on cash |
1,685 | 113,242 | 11,929 | |||||||||
| Net change in cash and cash equivalents |
(8,083,466 | ) | (34,282,212 | ) | 57,399,935 | |||||||
| Cash and cash equivalents at beginning of year |
30,353,728 | 64,635,940 | 7,236,005 | |||||||||
| Cash and cash equivalents at end of year |
$ | 22,270,262 | $ | 30,353,728 | $ | 64,635,940 | ||||||
The accompanying notes are an integral part of these consolidated financial statements.
F-7
Table of Contents
ICx TECHNOLOGIES, INC. AND SUBSIDIARIES
Notes to Consolidated Financial Statements
December 31, 2009, 2008 and 2007
| 1. | Description of the Business and Summary of Significant Accounting Policies |
| (a) | General |
ICx Technologies, Inc. and Subsidiaries (“ICx” or “Company”) was incorporated in the State of Delaware in 2003 to acquire, develop, and coordinate the operations of security technology companies. ICx develops and integrates advanced sensor technologies for homeland security, force protection and commercial applications. The Company’s proprietary sensors detect and identify chemical, biological, radiological, nuclear and explosive threats, and deliver superior awareness and actionable intelligence for wide-area surveillance, intrusion detection and facility security. These technologies are used in nuclear power plants, military installations, natural gas storage systems and pipelines, shopping malls, public transportation systems and port facilities.
The holders of a majority of ICx’ capital stock, DP1, LLC (“DP1”) and Valentis SB, L.P. (“Valentis”), are under the common control of Wexford Capital, LLC (“Wexford”), which is an SEC registered investment advisor. As more fully described in Note 3, ICx acquired one company in 2008, one company in 2007, two companies in 2006, eleven companies in 2005, and completed the acquisition of five other companies in 2005.
On May 31, 2008, the Company acquired the assets of S3I, L.L.C. (“S3I”) for $3.5 million in cash and $2.3 million in assumed liabilities in a business combination accounted for as a purchase. The results of operations of S3I are included in the Company’s consolidated results of operations beginning June 1, 2008.
On October 1, 2007, the Company acquired PureTech Systems, Inc. (“PureTech”) for $3.25 million in cash in a business combination accounted for as a purchase. As more fully described in Note 9, the Company’s Board of Directors approved a plan in 2009 to sell PureTech. As a result, the results of operations of PureTech subsequent to acquisition and the assets and liabilities of PureTech are included as discontinued operations in the accompanying consolidated financial statements.
As more fully described in Note 9, the Company’s Board of Directors approved a plan in 2006 for the sale of three companies. The sales of the three companies were completed in 2007. Accordingly, the operating results of those three companies are included as discontinued operations for the year ended December 31, 2007 in the Company’s consolidated results of operations.
| (b) | Initial Public Offering |
In November 2007, the Company completed its initial public offering (“IPO”) of common stock in which it sold and issued 5 million shares of its common stock at an issue price of $16.00 per share. The Company raised a total of $80 million in gross proceeds from its IPO, or $70.8 million in net proceeds after deducting underwriting discounts and commissions of $5.6 million and other offering costs of $3.6 million. Upon the closing of the IPO, all shares of convertible preferred stock outstanding automatically converted into 18,525,595 shares of common stock. On November 14, 2007, we used $7.1 million of our proceeds to repay a note payable and accrued interest to DP1. Also, following the IPO we paid off subsidiary debt totaling approximately $1.5 million.
| (c) | Reverse Stock Split |
On October 23, 2007, the Company’s Board of Directors approved a one-for-two reverse stock split of the Company’s outstanding common stock that became effective immediately prior to the effectiveness of the registration statement for the Company’s initial public offering. All common shares and per share amounts in the accompanying consolidated financial statements and notes to the consolidated financial statements have been
F-8
Table of Contents
retroactively adjusted for all periods presented to give effect to the reverse stock split. The effects of the reverse split of the Company’s common stock described have also been reflected retroactively in the presentation of all preferred shares and per share amounts in the accompanying consolidated financial statements and notes to the consolidated financial statements based on the preferred conversation ratio described in Note 7.
| (d) | Principles of Consolidation |
The accompanying consolidated financial statements include the accounts of ICx and its wholly-owned subsidiaries: Agentase, LLC; Amphitech Systems, Inc.; DAQ Electronics, Inc.; Security 2000, Inc.; GHC Technologies, Inc.; Griffin Analytical Technologies, Inc.; ICx Imaging Systems (f/k/a Digital Imaging Infrared); ICx Radiation, Inc.; ICx Radiation Gmbh; 360 Surveillance, Inc.; PBA Engineering, Ltd.; ICx Tactical Platforms (f/k/a New Heights Manufacturing, Inc.); ICx Transportation Group, Inc.; MesoSystems Technology, Inc.; Nomadics, Inc.; PureTech Systems, Inc.; and Sensor Technologies and Systems, Inc. In 2009, the operations of ICx Cryogenics, Inc., ICx Photonics (f/k/a Ion Optics, Inc.) and S3I Acquisition Corporation were merged into ICx Imaging Systems, Nomadics, Inc., and MesoSystems Technology, Inc., respectively, and these entities were dissolved. All intercompany transactions and accounts have been eliminated in consolidation.
| (e) | Use of Estimates and Assumptions |
The preparation of financial statements in conformity with accounting principles generally accepted in the United States of America requires management to make estimates and assumptions that affect the amounts reported in the financial statements and accompanying notes. Actual results could differ from those estimates in the near term.
| (f) | Cash and Cash Equivalents |
Cash and cash equivalents include all highly liquid investments with an original maturity of three months or less when purchased. The Company maintains its cash in bank deposit accounts which, at times, may exceed federally insured limits. The Company has not experienced any losses in such accounts. The Company believes it is not exposed to any significant credit risk on cash and cash equivalents.
At December 31, 2009, $8,464,545 of the Company’s cash was restricted to serve as collateral under a performance bond. This cash will be held in an escrow account for a period not to exceed three years, or May 2011. The contract requiring this collateral ended in 2010. As such, we expect the cash to be released from restriction in 2010.
| (g) | Allowance for Trade Accounts and Notes Receivable |
The Company extends credit to customers in accordance with normal industry standards and terms. The Company establishes an allowance for doubtful accounts based on known factors surrounding the credit risk of specific customers, historical trends and other information. Changes in the allowance for doubtful accounts are the result of write-offs of uncollectible receivables and provisions for bad debts. Trade accounts receivable balances are not collateralized, and the Company generally does not charge interest on past due receivables. At December 31, 2009 and 2008, trade accounts receivable, net was comprised of the following:
| At December 31, | ||||||||
| 2009 | 2008 | |||||||
| U.S. government |
$ | 12,471,620 | $ | 16,389,174 | ||||
| Commercial and other |
24,775,531 | 20,540,427 | ||||||
| $ | 37,247,151 | $ | 36,929,601 | |||||
| Allowance for doubtful accounts |
(495,942 | ) | (382,579 | ) | ||||
| Trade accounts receivable, net |
$ | 36,751,209 | $ | 36,547,022 | ||||
F-9
Table of Contents
At December 31, 2009, no customer other than the U.S. government accounted for 10% or greater of the net trade accounts receivable balance. At December 31, 2008, one commercial customer and the U.S. government accounted for 10% or greater of the net trade accounts receivable balance.
| (h) | Inventories |
Inventory primarily consists of raw material, work in process, and finished goods related to advanced surveillance and monitoring systems and detection systems that detect chemical, biological, radiological, nuclear, and explosive materials. Inventories are stated at the lower of cost (first-in, first-out basis) or market. The Company writes down inventories for obsolescence equal to the difference between the cost of the inventory and the estimated market value based upon assumptions about future demand and market conditions. Any write-downs are charged to operations as incurred. Manufacturing overhead is allocated to inventory and cost of revenues based on a variable of direct labor.
At December 31, 2009 and 2008, inventories were comprised of the following:
| At December 31, | ||||||||
| 2009 | 2008 | |||||||
| Raw materials |
$ | 11,696,878 | $ | 16,488,914 | ||||
| Work in progress |
3,662,442 | 3,090,484 | ||||||
| Finished goods |
8,302,707 | 7,274,370 | ||||||
| $ | 23,662,027 | $ | 26,853,768 | |||||
| Reserve for obsolescence |
(1,171,208 | ) | (679,342 | ) | ||||
| $ | 22,490,819 | $ | 26,174,426 | |||||
| (i) | Fair Value Measurements |
In accordance with U.S. GAAP, fair value is defined as the exchange price that would be received for an asset or paid to transfer a liability (an exit price) in the principal or most advantageous market for the asset or liability in an orderly transaction between market participants on the measurement date. U.S. GAAP describes a fair value hierarchy based on three levels of inputs, of which the first two are considered observable and the last unobservable, that may be used to measure fair value:
| • | Level 1—Quoted prices in active markets for identical assets or liabilities. |
| • | Level 2—Inputs other than Level 1 that are observable, either directly or indirectly, such as quoted prices for similar assets or liabilities, quoted prices in markets that are not active or other inputs that are observable or can be corroborated by observable market data for substantially the full term of the assets or liabilities. |
| • | Level 3—Unobservable inputs that are supported by little or no market activity and that are significant to the fair value of the assets or liabilities. |
The Company maximizes the use of observable inputs and minimizes the use of unobservable inputs by requiring that the observable inputs be used when available. Fair value is based upon quoted market prices when available. If listed price or quotes are not available, the Company employs internally-developed models that primarily use market-based inputs including yield curves and interest rates, among others.
The Company considers cash and cash equivalents, trade accounts receivable, accounts payable, and accrued expenses to be financial instruments in which the carrying amounts represent fair value because of the short-term nature of the accounts. The Company also considers notes payable, lines of credit, and long-term debt to be financial instruments in which the carrying amounts approximate fair value because of their short-term nature, variable interest rates or rates that approximate market.
F-10
Table of Contents
Nonfinancial nonrecurring assets and liabilities included in the Company’s consolidated balance sheet include long-lived assets such as property, plant and equipment, intangibles and goodwill, which are measured at fair value to test for and measure an impairment charge, when necessary. These assets fall within Level 3 of the fair value hierarchy, as significant unobservable inputs such as the Company’s projected operating results are used to estimate the fair value of these assets. During 2009, $1,260,790 of goodwill, $828,000 of intangible assets and $150,334 of other long-term assets were written off in connection with discontinued operations to remeasure these nonfinancial assets and liabilities to fair value (Note 9).
| (j) | Property, Plant, and Equipment |
Property, plant, and equipment acquired in business combinations are stated at acquisition date fair values pursuant to various business combinations as more fully described in Note 3. Purchased property, plant, and equipment are stated at historical cost. Expenditures which materially increase values, change capacities, or extend useful lives are capitalized. Expenditures for maintenance and repairs are expensed when incurred. Depreciation is calculated using straight line and accelerated methods once the assets are placed in service. The Company provides for depreciation over the following estimated useful lives: building and improvements—10 to 30 years; furniture and equipment—3 to 7 years; computer equipment and software—1 to 5 years. Leasehold improvements are amortized over the lesser of the life of the asset or the lease term.
At December 31, 2009 and 2008, property, plant, and equipment consisted of the following:
| At December 31, | ||||||||
| 2009 | 2008 | |||||||
| Land |
$ | 49,592 | $ | 49,592 | ||||
| Buildings and improvements |
1,162,916 | 1,139,516 | ||||||
| Furniture and equipment |
9,170,976 | 8,506,945 | ||||||
| Computer equipment and software |
6,258,711 | 5,822,327 | ||||||
| Leasehold improvements |
2,840,684 | 2,363,501 | ||||||
| Assets not yet placed in service |
581,321 | 496,846 | ||||||
| $ | 20,064,200 | $ | 18,378,727 | |||||
| Accumulated depreciation |
(10,391,619 | ) | (7,528,434 | ) | ||||
| $ | 9,672,581 | $ | 10,850,293 | |||||
Depreciation expense was $3,198,985, $2,802,893 and $1,961,996 for the years ended December 31, 2009, 2008, and 2007, respectively.
| (k) | Goodwill and Other Intangible Assets |
Goodwill is not amortized, but instead is tested for impairment at least annually. Intangible assets are amortized over their respective estimated useful lives ranging from one to ten years. The Company has no intangible assets with indefinite useful lives. The Company has not historically incurred significant costs to renew or extend the term of recognized intangible assets.
It is the Company’s policy to evaluate its recorded goodwill for possible impairment on an annual basis, or earlier if an indicator of impairment arises. Management uses a number of different criteria when evaluating an asset for possible impairment. Indicators such as significant decreases in a reporting unit’s book value, cash flows which cannot be resolved or improved within a reasonable amount of time, sustained operating losses, adverse changes in the business climate, legal matters, losses of significant customers, and new technologies which could accelerate obsolescence of business products are used by management when making its evaluations.
In assessing the recoverability of goodwill and intangibles, the Company must make assumptions regarding estimated future cash flows and other factors to determine the fair value of the respective assets. The fair value of
F-11
Table of Contents
an asset could vary, depending upon the estimating method employed, as well as assumptions made. This may result in a possible impairment of the intangible assets and/or goodwill, or alternatively the acceleration of amortization expense.
Goodwill impairment is determined using a two-step process. The first step of the impairment test is used to identify potential impairment by comparing the fair value of a reporting unit to the book value, including goodwill. If the fair value of a reporting unit exceeds its book value, goodwill of the reporting unit is not considered impaired, and the second step of the impairment test is not required. If the book value of a reporting unit exceeds its fair value, the second step of the impairment test is performed to measure the amount of impairment loss, if any. The second step of the impairment test compares the implied fair value of the reporting unit’s goodwill with the book value of that goodwill. If the book value of the reporting unit’s goodwill exceeds the implied fair value of that goodwill, an impairment loss is recognized in an amount equal to that excess. The implied fair value of goodwill is determined in the same manner as the amount of goodwill recognized in a business combination. The annual impairment testing is performed in the fourth quarter on October 1. Based on consistent revenue growth, reductions in general and administrative costs, improved operating results and increased funded and unfunded backlog, the estimated fair value of our reporting units exceeded the book value of those units in 2007, 2008 and 2009, resulting in no goodwill impairment charge to continuing operations for the years then ended. As discussed more fully in Note 9, the Company wrote off $1,260,790 of goodwill and $828,000 of intangible assets in the Solutions segment in 2009 in conjunction with discontinued operations.
| (l) | Impairment of Long-Lived Assets |
Long-lived assets held and used by the Company and intangible assets are reviewed for impairment whenever events or changes in circumstances indicate that the carrying amounts of assets may not be recoverable. The Company evaluates recoverability of assets to be held and used by comparing the carrying amount of an asset to future net undiscounted cash flows to be generated by the assets. If such assets are considered to be impaired, the impairment to be recognized is measured by the amount by which the carrying amount of the assets exceeds the fair value of the assets calculated using a discounted future cash flow analysis. As discussed more fully in Note 9, the Company wrote off $150,334 of long-lived assets in the Solutions segment in 2009 in conjunction with discontinued operations.
| (m) | Revenue Recognition |
The Company recognizes revenue from product sales when all of the following criteria are met: persuasive evidence of an arrangement exists, delivery has occurred, the price is fixed or determinable, and collection from the customer is reasonably assured. Product revenue is generally recognized upon shipment, unless customer acceptance is required, in which case product revenue is recognized when documentation of customer acceptance is received.
The Company earns contract research and development revenue by performing research and development primarily under contracts entered into with the U.S. government or as subcontractors to other commercial entities that contract with the U.S. government. The Company earns the majority of its service and other revenue from custom development services and project management and technology integration services under contracts entered into with various U.S., state or local government agencies or other commercial entities that contract with these agencies. Most of these contracts are either based on costs incurred plus a fixed fee or are based on a fixed price. The Company recognizes revenue from these contracts using the percentage of completion method. The Company principally uses labor efforts expended and estimated gross profit as a percentage of total estimated costs and contract value or contract milestones to measure the progress of contract completeness. Revisions in cost and contract value estimates during the progress of work have the effect of adjusting earnings in the current period for work that may have been performed in prior periods. When estimates of current costs indicate a loss, provision is made for the total anticipated loss in the current period. Under cost plus fixed fee contracts, the Company may bill and be reimbursed for costs incurred in advance of revenue recognition if the percentage of contract completeness does not coincide with costs incurred. Additionally, certain fixed price contracts provide for billings and/or payments that may not coincide with revenue recognition. To the extent that customer billings
F-12
Table of Contents
or payments are in excess of revenues, the excess is recorded as deferred revenue and contract costs in excess of expected earnings under the contract are deferred. At December 31, 2009 and 2008, the Company had included in deferred revenue $2,685,423 and $7,215,063 of excess billings or customer payments, respectively, related to percentage of completion timing differences. At December 31, 2008, this amount included $4,976,523 in advanced payments received from a customer for a custom platform development project, which was delivered in 2009. Deferred contract costs at December 31, 2009 and 2008 were not material. In certain circumstances, revenue is recognized and costs are accrued under the percentage of completion method under cost plus and fixed fee contracts. Additionally, revenue may be recognized prior to billings on these contracts. Such amounts are recorded as unbilled revenue and are expected to be collected within one year of recognition, and if contract costs incurred are below the earnings that are expected to be realized upon contract completion, they are accrued until the costs are incurred. At December 31, 2009 and 2008, the Company had unbilled revenue of $8,957,090 and $10,996,971, respectively, substantially all of which is expected to be collected within one year. At December 31, 2009, this amount included $1,501,147 of unbilled revenue related to an engineering and integration project, which was billed in January 2010. At December 31, 2008, this amount included $4,889,824 of unbilled revenue related to a custom platform development project, which was delivered in 2009. Accrued contract costs at December 31, 2009 and 2008, were not material. The Company had no material claims outstanding under its research and development contracts at December 31, 2009.
Warranty income under separate agreements is recognized ratably over the life of the warranty. The Company recognizes revenue from services at the time the related services are performed. Deferred revenue includes $1,798,918 and $1,432,184 in the years 2009 and 2008, respectively, of warranty agreements and prepayments on service contracts.
In order to recognize software revenue, the Company is required to allocate revenue to multiple elements in software arrangements based on vendor specific objective evidence of fair value for each element. The Company generally has two elements to its software arrangements: (1) a software license fee and (2) post contract customer maintenance and support. Revenue from software license fees are recognized when persuasive evidence of an arrangement exists, delivery has occurred, the price is fixed or determinable, and collection from the customer is reasonably assured. Revenue from post contract customer maintenance and support is deferred and recognized ratably over the life of the post contract customer maintenance and support agreement. Deferred revenue includes $459,007 and $405,737 at December 31, 2009 and 2008, respectively, of revenue deferred under multiple-element software arrangements for post contract customer support.
| (n) | Research and Development |
Research and development costs are expensed as incurred.
| (o) | Advertising Costs |
Advertising costs are expensed as incurred and were not significant for any period presented.
| (p) | Warranty Provision |
The Company records a warranty provision at the time products are shipped for warranty costs expected to be incurred. The Company’s warranty period is typically one year from the time of shipment. The estimated accrual is based on the Company’s history with warranty claims.
| (q) | Accounting for Stock-Based Compensation |
The Company records equity-classified, share-based payments to employees, including grants of employee stock options, at fair value on the date of grant and expenses the value of these share-based payments in compensation expense over the applicable vesting period. Additionally, the cash inflows resulting from tax deductions in excess of the compensation expense recognized for those stock options (“excess tax benefits”) are classified as financing cash inflows. Due to NOL carryforwards, the Company has recognized no excess tax benefits in 2009, 2008 or 2007.
F-13
Table of Contents
The Company’s stock plans and board-discretionary options are more fully described at Note 8.
| (r) | Foreign Currency Translation |
For foreign operations, assets and liabilities are translated at the year-end exchange rate, and income statement items are translated at the average exchange rate for the year. The opening balance sheets of business combinations involving foreign entities are translated at the exchange rates in effect on the applicable acquisition dates. Resulting translation adjustments are recorded within accumulated other comprehensive income (loss). Assets and liabilities denominated in foreign currencies are re-measured at the balance sheet date. Resulting transaction gains or losses are included as a component of current period earnings.
| (s) | Loss Per Share |
Basic loss per common share is calculated by dividing net loss attributable to common stockholders by the weighted-average number of common shares outstanding during each reporting period. Diluted loss per common share is calculated by dividing net loss attributable to common stockholders by the weighted average number of common shares outstanding during each period adjusted for the effect of dilutive potential common shares calculated using the treasury stock method. However, the computation of diluted loss per share shall not assume the conversion or exercise of options that would have an anti-dilutive effect (a decrease in loss per share) on loss per share. For the year ended December 31, 2009, the Company had 34,726,590 weighted average shares outstanding and all of the Company’s potential common shares were anti-dilutive as the Company was in a net loss position. Those potential common shares consisted of 770,256 weighted average shares of stock options and restricted stock units. For the year ended December 31, 2008, the Company had 34,096,488 weighted average shares outstanding and all of the Company’s potential common shares were anti-dilutive as the Company was in a net loss position. Those potential common shares consisted of 600,459 weighted average shares of stock options and restricted stock units. For the year ended December 31, 2007, the Company had 13,425,549 weighted average shares outstanding and all of the Company’s potential common shares were anti-dilutive as the Company was in a net loss position. Those potential common shares consisted of 786,728 weighted average shares of stock options and restricted stock units.
| (t) | Pro Forma Net Loss Per Share |
Pro forma net loss per share for the year ended December 31, 2007 has been computed using the weighted average number of shares of common stock outstanding. In addition, for purposes of pro forma net loss per share, all shares of convertible redeemable preferred stock, which were converted to common stock upon closing of the IPO, have been treated as though they had been converted to common stock in all periods in which such shares were outstanding. For the year ended December 31, 2007, the Company had 29,150,986 pro forma weighted average common shares outstanding.
| (u) | Comprehensive Loss |
Comprehensive loss consists of net loss and other comprehensive income. Other comprehensive income for the years ended December 31, 2009, 2008, and 2007, included certain changes in equity that are excluded from net loss. Specifically, cumulative foreign currency translation adjustments are included in accumulated other comprehensive income.
| (v) | Income Taxes |
Current income tax expense is the amount of income taxes expected to be payable for the current year. Deferred income tax assets and liabilities are computed annually for the differences between the financial statement and income tax bases of assets and liabilities. Such deferred income tax asset and liability computations are based on enacted tax laws and rates applicable to periods in which the differences are expected to reverse. If necessary, a valuation allowance is established to reduce deferred income tax assets to the amount expected to be realized.
F-14
Table of Contents
As of December 31, 2009 and 2008, the Company had unrecognized tax benefits of $1.4 million. If recognized in future periods, $1.4 million would reduce the Company’s effective income tax rate. No interest or penalties have been accrued. The Company does not expect the unrecognized tax benefits to significantly change within the next 12 months.
The reconciliation of the beginning and ending amount of unrecognized tax benefits is as follows:
| Balance at January 1, 2008 |
$ | 1,353,034 | |
| Additions based on tax positions related to the current year |
— | ||
| Additions for tax positions of prior years |
— | ||
| Reductions for tax positions of prior years |
— | ||
| Settlements |
— | ||
| Balance at December 31, 2008 |
$ | 1,353,034 | |
| Additions based on tax positions related to the current year |
— | ||
| Additions for tax positions of prior years |
— | ||
| Reductions for tax positions of prior years |
— | ||
| Settlements |
— | ||
| Balance at December 31, 2009 |
$ | 1,353,034 | |
At December 31, 2009, the Company’s tax returns open for review by taxing authorities were 2005 to 2008 for federal, state and foreign. The Company has elected to report interest and penalties as a component of income tax expense.
| (w) | Reclassifications |
The 2007 and 2008 balances in the accompanying consolidated financial statements and notes to consolidated financial statements have been reclassified to conform to the 2009 presentation of restricted cash and discontinued operations (Note 9). Additionally, certain 2008 and 2007 balances in Note 10 to the consolidated financial statements have been reclassified to conform to the 2009 presentation, as the Company began allocating all general and administrative expenses to reportable segments. These reclassifications had no impact on reported net income or earnings per share.
| (x) | Recent Accounting Pronouncements |
The Financial Accounting Standards Board (“FASB”) periodically issues new accounting standards in a continuing effort to improve standards of financial accounting and reporting. The Company has reviewed the recently issued pronouncements and concluded that the following new accounting standards are applicable to the Company.
During the third quarter of 2009, the Company adopted FASB Accounting Standards Codification (ASC). The FASB ASC is the single official source of authoritative, nongovernmental U.S. GAAP. Rules and interpretive releases issued by the SEC are also sources of authoritative GAAP for SEC registrants. Adoption of the FASB ASC did not impact the Company’s consolidated financial position or results of operations, as the ASC did not change U.S. GAAP.
In April 2009, the FASB issued guidance related to FASB ASC Topic 825, Financial Instruments, that requires an entity to provide disclosures about fair value of financial instruments in interim financial statements. This guidance was effective for interim and annual periods ending after June 15, 2009, with early adoption permitted for periods ending after March 15, 2009. The Company adopted this guidance for its quarter ending June 30, 2009. Adoption did not have a material impact on the Company’s consolidated financial position or results of operations.
F-15
Table of Contents
In May 2009, the FASB issued guidance related to FASB ASC Topic 855, Subsequent Events, which establishes general standards of accounting for and disclosures of events that occur after the balance sheet date but before financial statements are issued or are available to be issued. In particular, the guidance sets forth (a) the period after the balance sheet date during which management of a reporting entity shall
evaluate events or transactions that may occur for potential recognition or disclosure in the financial statements, (b) the circumstances under which an entity shall recognize events or transactions occurring after the balance sheet date in its financial statements, and (c) the disclosures that an entity shall make about events or transactions that occurred after the balance sheet date. The guidance also requires disclosure of the date through which an entity has evaluated subsequent events and the basis for that date, and was effective for interim and annual periods ending after June 15, 2009. The Company adopted these provisions for its quarter ending June 30, 2009. Adoption did not have a material impact on the Company’s consolidated financial position or results of operations. In February 2010, the FASB issued ASU 2010-09, Subsequent Events (Topic 855)—Amendments to Certain Recognition and Disclosure Requirements, which removes the requirement for SEC filers to disclosure the date through which subsequent events have been evaluated.
In October 2009, the FASB issued ASU 2009-13, Revenue Recognition (Topic 605)—Multiple-Deliverable Revenue Arrangements—a consensus of the FASB Emerging Issues Task Force , which addresses how to separate deliverables and how to measure and allocate arrangement consideration to one or more units of accounting. This guidance establishes a selling price hierarchy for determining the selling price of a deliverable. The selling price should be based on vendor-specific objective evidence if available, third-party evidence if vendor-specific objective evidence is not available, or estimated selling price if neither of these types of evidence is available. The residual method of allocation is eliminated by this guidance. Additionally, this guidance expands disclosures related to multiple-deliverable revenue arrangements. These provisions are effective prospectively for revenue arrangements entered into or materially modified in fiscal years beginning on or after June 15, 2010. Early adoption is permitted. The Company early adopted this guidance on January 1, 2010. Adoption did not have a material impact on the Company’s consolidated financial position or results of operations, as the Company’s processes surrounding multiple-element arrangements conform to the requirements of this guidance.
In October 2009, the FASB issued ASU 2009-14, Software (Topic 985)—Certain Revenue Arrangements That Include Software Elements—a consensus of the FASB Emerging Issues Task Force, that provides guidance on determining whether tangible products contain software that works together with the nonsoftware components of the tangible product to deliver the tangible product’s essential functionality (and therefore, is excluded from the scope of the software revenue guidance) and also provides guidance on how a vendor should allocate arrangement consideration to deliverables in an arrangement that includes both tangible products and software. These provisions are effective prospectively for revenue arrangements entered into or materially modified in fiscal years beginning on or after June 15, 2010. Early adoption is permitted, as long as the vendor adopts this guidance in the same period using the same transition method used to adopt ASU 2009-13. The Company early adopted this guidance on January 1, 2010. Adoption did not have a material impact on the Company’s consolidated financial position or results of operations, as the Company’s processes surrounding multiple-element arrangements that include software elements conform to the requirements of this guidance.
In January 2010, the FASB issued ASU 2010-06, Fair Value Measurements and Disclosures (Topic 820)—Improving Disclosures about Fair Value Measurements, which requires new disclosures related to instruments measured at fair value and the fair value hierarchy. For example, ASU 2010-06 requires companies to disclose transfers in and out of Levels 1 and 2 of the fair value hierarchy and the reasons for those transfers and requires disclosure of details related to activity in Level 3 fair value measurements (e.g. purchases, sales, issuances and settlements) on a gross basis ASU 2010-06 also clarifies the level of disaggregation required in fair value disclosures and that disclosures about the valuation techniques and inputs used to measure fair value of Level 2 and Level 3 measurements are required. These provisions are effective for interim and annual reporting periods beginning after December 15, 2009, except for the disclosures about purchases, sales, issuances and settlements in the rollforward of activity in Level 3 fair value measurements, which is effective for fiscal years beginning after December 15, 2010. The Company adopted this guidance effective January 1, 2010, as required, except for
F-16
Table of Contents
the Level 3 rollforward disclosure requirements, which will be adopted effective January 1, 2011, as required. Adoption of this guidance did not and is not expected to have a material impact on the Company’s consolidated financial position or results of operations, as the guidance relates to additional disclosure requirements.
| 2. | Related Party Transactions |
Administrative Services Agreement with Wexford
The Company entered into an Administrative Services Agreement with Wexford under which the Company may request certain legal, accounting, back office, and other services. The Company is obligated to reimburse Wexford for all of its direct and indirect costs allocated to the performance of such services. The Company incurred general and administrative expenses of $117,390, $90,454 and $402,360 in 2009, 2008 and 2007, respectively, pursuant to the agreement. Either party may terminate specific services or cancel the agreement upon written notice to the other party.
Leases
Juergen Stein, CEO and President of Radiation GmbH, a subsidiary of the Company, leased facilities to the Company under a lease agreement dated January 1, 2005. The monthly lease payment was $9,000 in 2009. Rent expense of $108,000, $108,000 and $97,500 was incurred in 2009, 2008 and 2007, respectively. The lease term ends on December 31, 2020, and can be renewed for one year terms thereafter.
Strange Family Holdings, LLP, leases facilities to the Company under a lease agreement dated June 15, 2005. The monthly lease payment was $5,691 throughout most of 2009 and increased to $5,862 in November 2009. Rent expense of $68,634, $67,342 and $64,858 was incurred in 2009, 2008 and 2007, respectively. Effective September 1, 2009, the lease was renewed with similar terms for a one-year period ending on September 15, 2010, and can be renewed for five additional one-year terms thereafter. Certain family members of the Strange family hold senior management positions in the Company’s subsidiary, New Heights, Inc. (d/b/a ICx Tactical Platforms).
Debt Obligations
On March 8, 2007, the Company borrowed $3.0 million from DP1 through a convertible promissory note due April 9, 2007. The note bore interest in the form of a $60,000 origination fee deducted from the proceeds. The note was convertible into Series A shares at $10.00 per share and was repaid on April 9, 2007.
On September 28, 2007, the Company entered into a $7.0 million promissory note payable to DP1 and due December 27, 2007. The note bore interest at 2% every 30 days payable in advance. The note was repaid in full with the net proceeds from the IPO. Net proceeds from the note totaled $6,860,000.
| 3. | Business Combinations and Related Intangibles |
Acquisition in 2008
On May 31, 2008, the Company acquired the assets of S3I for $3,500,000 in cash and $2,337,572 million in assumed liabilities in a business combination accounted for as a purchase. S3I is a developer of biological sensors. S3I’s sensors have been integrated into and are used with the Company’s other biological-detection products, thereby complementing the Company’s existing products. Acquired intangibles primarily resulted from S3I’s core technology while goodwill resulted from the excess of the purchase price over S3I’s net assets at the date of acquisition. S3I is included in the Detection business segment.
F-17
Table of Contents
The following table summarizes the estimated fair values of the net assets acquired as of the date of the acquisition:
| 2008 Acquisition |
Tangible Net Assets |
Acquired Intangible Assets |
Acquired In-Process Research & Development |
Goodwill | Total | |||||||||||
| S3I |
$ | (1,573,405 | ) | $ | 1,950,000 | $ | — | $ | 3,123,405 | $ | 3,500,000 | |||||
Intangible assets acquired in the business combination during 2008 are comprised of the following:
| 2008 Acquisition |
Core Technology |
Customer Relationships |
Firm and Non-firm Contracts |
Non-compete | Total | ||||||||||
| S3I |
$ | 1,250,000 | $ | — | $ | 700,000 | $ | — | $ | 1,950,000 | |||||
| Weighted average life in years |
8.0 | — | Less than 2.0 | — | |||||||||||
The purchase agreement with S3I contains contingent consideration provisions based on earnings and future revenues in an amount not to exceed $24.7 million. Any contingent consideration paid under the agreement based on earnings will be recorded as an additional cost of the acquisition and therefore will increase goodwill associated with the acquisition. Any contingent consideration paid under the agreement to provide compensation for services, use of property or profit sharing will be recorded as an expense when incurred. For the years ended December 31, 2009 and 2008, goodwill was increased by $161,955 and $2,013,045, respectively, related to these provisions. In 2009, $1,275,000 of this contingent consideration was paid to the seller. The remaining $900,000 is payable on or before April 30, 2010. Additionally, in accordance with the terms of the purchase agreement, the Company held back $525,000 of the purchase price at the date of acquisition. This amount was paid to the seller in 2009.
Acquisition in 2007
On October 1, 2007, the Company acquired PureTech for $3,250,000 in cash in a business combination accounted for as a purchase. PureTech is a video analytics technology company. Management believed PureTech would add capability to the Company’s charge-coupled devices (CCD) and thermal cameras, thereby complementing the Company’s existing products and services. Acquired intangibles primarily resulted from PureTech’s core software while goodwill resulted from the excess of the purchase price over PureTech’s net assets at the date of acquisition. PureTech is included in the Solutions business segment.
The following table summarizes the estimated fair values of the net assets acquired as of the date of the acquisition:
| 2007 Acquisition |
Tangible Net Assets |
Acquired Intangible Assets |
Acquired In-Process Research & Development |
Goodwill | Total | ||||||||||
| PureTech |
$ | 361,610 | $ | 1,650,000 | $ | — | $ | 1,238,390 | $ | 3,250,000 | |||||
Intangible assets acquired in the business combinations during 2007 are comprised of the following:
| 2007 Acquisition |
Core Technology |
Customer Relationships |
Firm and Non-firm Contracts |
Non-compete | Total | ||||||||||
| PureTech |
$ | 1,380,000 | $ | — | $ | 270,000 | $ | — | $ | 1,650,000 | |||||
| Weighted average life in years |
5.0 | — | 1.0 | — | |||||||||||
As discussed more fully in Note 9, in 2009, the Company’s board of directors adopted a plan of sale and put the assets of PureTech up for sale.
F-18
Table of Contents
Effect of Acquisitions prior to 2007
In June 2008, the Company paid $1,649,191 of holdback funds related to the Company’s 2006 acquisition of GHC Technologies, Inc. (“GHC”). Such funds included cash and 189,797 shares of common stock. Additionally, the Company issued a $250,000 note payable upon acquisition of Security 2000, Inc. (“S2K”) in 2006, as partial consideration for the acquisition. The note bore interest at an annual rate of 8% and was paid in 2007. The Company paid an additional $250,000 of contingent consideration related to the S2K acquisition in 2009. This amount was recorded as an additional cost of the acquisition and therefore, increased goodwill associated with the acquisition. In July 2008, the Company paid $1,844,468 related to certain 2005 business combinations resulting from earnout agreements.
Intangible Assets
Amortizable intangible assets at December 31 consisted of the following:
| 2009 | 2008 | |||||||||||||||||||
| Gross Carrying Value |
Accumulated Amortization |
Net Carrying Value |
Gross Carrying Value |
Accumulated Amortization |
Net Carrying Value | |||||||||||||||
| Core technology |
$ | 30,430,564 | $ | (21,633,129 | ) | $ | 8,797,435 | $ | 30,018,069 | $ | (17,148,426 | ) | $ | 12,869,643 | ||||||
| Customer relationships |
27,567,463 | (26,468,331 | ) | 1,099,132 | 27,387,176 | (22,267,309 | ) | 5,119,867 | ||||||||||||
| Firm contracts |
3,127,058 | (3,127,058 | ) | — | 3,049,018 | (3,030,446 | ) | 18,572 | ||||||||||||
| Non-compete |
238,940 | (233,940 | ) | 5,000 | 238,940 | (228,940 | ) | 10,000 | ||||||||||||
| $ | 61,364,025 | $ | (51,462,458 | ) | $ | 9,901,567 | $ | 60,693,203 | $ | (42,675,121 | ) | $ | 18,018,082 | |||||||
Amortization expense on intangible assets for the years ended December 31, 2009, 2008 and 2007, was $8,121,352, $10,763,458 and $11,873,701, respectively.
Amortization expense on intangible assets for the years ended December 31, 2010, 2011, 2012, 2013 and 2014 is estimated to be $4,300,799, $2,897,754, $873,256, $586,250 and $586,250, respectively.
The carrying value of intangible assets held for sale at December 31, 2009, 2008 and 2007 was $0, $1,035,000 and $1,513,500, respectively. Loss on discontinued operations included amortization expense of $207,000, $478,500 and $136,500 in 2009, 2008 and 2007, respectively, and an impairment loss of $828,000 in 2009. See Note 9 for discussion regarding discontinued operations.
Goodwill
The changes in goodwill by segment as of December 31, 2009 and 2008 are as follows:
| Detection | Surveillance | Solutions | Total | |||||||||||
| Balance as of December 31, 2007 |
$ | 46,154,294 | $ | 12,736,716 | $ | 5,959,264 | $ | 64,850,274 | ||||||
| Goodwill of acquired businesses |
3,123,405 | — | — | 3,123,405 | ||||||||||
| Additional purchase price for 2008 acquisition |
2,038,575 | — | — | 2,038,575 | ||||||||||
| Impact of foreign exchange |
— | — | (454,814 | ) | (454,814 | ) | ||||||||
| Balance as of December 31, 2008 |
$ | 51,316,274 | $ | 12,736,716 | $ | 5,504,450 | $ | 69,557,440 | ||||||
| Additional purchase price for 2006 acquisition |
— | — | 250,000 | 250,000 | ||||||||||
| Additional purchase price for 2008 acquisition |
161,955 | — | — | 161,955 | ||||||||||
| Impact of foreign exchange |
— | — | 305,095 | 305,095 | ||||||||||
| Balance as of December 31, 2009 |
$ | 51,478,229 | $ | 12,736,716 | $ | 6,059,545 | $ | 70,274,490 | ||||||
F-19
Table of Contents
Pursuant to the Company’s policies for assessing impairment of goodwill and long-lived assets, $1,260,790 of goodwill was written off in the third quarter of 2009 related to a reporting unit that is included in discontinued operations. See Note 9 for discussion regarding discontinued operations.
| 4. | Commitments and Contingencies |
Leases
ICx and its subsidiaries are lessees of office space, transportation and other equipment under operating lease agreements that expire at various dates through the year 2023. Two of these leases are with related parties as described in Note 2.
Some of the operating leases include options that allow the lease term to be extended beyond the initial base period, subject to terms agreed upon at lease inception; some also include early termination options, which can be exercised upon specific conditions. For operating leases that contain predetermined fixed escalations of the minimum rentals, the Company recognizes the related rental expense on a straight-line basis and records the difference between the recognized rental expense and amounts payable under the leases as deferred lease credits, the impact of which is not material to the consolidated financial statements. Total lease expense incurred in connection with these operating leases was approximately $5,689,000, $4,920,000 and $4,508,000, after a reduction for sublease income of $189,000, $263,000 and $211,000, for the years ended December 31, 2009, 2008, and 2007, respectively.
At December 31, 2009, the future minimum lease payments under noncancelable operating leases that have initial or remaining lease terms in excess of one year are as follows:
| Year ended December 31, |
Operating leases | ||
| 2010 |
$ | 4,893,336 | |
| 2011 |
3,357,712 | ||
| 2012 |
1,923,413 | ||
| 2013 |
1,563,216 | ||
| 2014 |
1,186,169 | ||
| Thereafter |
5,920,687 | ||
| $ | 18,844,533 | ||
Other
The Company is routinely involved in various legal matters arising from the normal course of business. Management believes that losses, if any, arising from such actions will not have a material adverse effect on the financial position or results of operations of the Company.
| 5. | Income Taxes |
Components of loss before income taxes are as follows:
| For the years ended December 31, | ||||||||||||
| 2009 | 2008 | 2007 | ||||||||||
| United States |
$ | (9,122,584 | ) | $ | (23,387,989 | ) | $ | (35,286,329 | ) | |||
| Foreign |
2,536,246 | (1,178,367 | ) | (1,046,997 | ) | |||||||
| $ | (6,586,338 | ) | $ | (24,566,356 | ) | $ | (36,333,326 | ) | ||||
F-20
Table of Contents
Components of income tax expense (benefit) are as follows:
| For the years ended December 31, | ||||||||||||
| 2009 | 2008 | 2007 | ||||||||||
| Federal |
$ | — | $ | (20,234 | ) | $ | 112,063 | |||||
| State |
373,747 | 81,427 | 275,950 | |||||||||
| Foreign |
1,493,503 | 347,602 | 512,019 | |||||||||
| Current income tax expense (benefit) |
$ | 1,867,250 | $ | 408,795 | $ | 900,032 | ||||||
| Federal |
$ | 99,287 | $ | 238,563 | $ | — | ||||||
| State |
(22,311 | ) | (65,675 | ) | — | |||||||
| Foreign |
(817,725 | ) | (597,018 | ) | (2,008,086 | ) | ||||||
| Deferred income tax expense (benefit) |
$ | (740,749 | ) | $ | (424,130 | ) | $ | (2,008,086 | ) | |||
Deferred income taxes reflect the net tax effects of temporary differences between the carrying amounts of assets and liabilities for financial reporting purposes and the amounts used for income tax purposes, as well as operating loss and tax credit carryforwards. The tax effects of the Company’s temporary differences and carryforwards are as follows:
| At December 31, | ||||||||
| 2009 | 2008 | |||||||
| Deferred tax assets: |
||||||||
| Reserves |
$ | 772,406 | $ | 682,495 | ||||
| Accrued expenses |
139,395 | 59,870 | ||||||
| Accrued compensation |
736,693 | 602,976 | ||||||
| Stock compensation |
2,886,200 | 2,841,182 | ||||||
| Investment in partnership/basis differences |
34,169 | 20,061 | ||||||
| Research and development expense |
293,623 | 246,818 | ||||||
| Credit carryforwards |
699,290 | 477,163 | ||||||
| Charitable contributions |
55,139 | 51,547 | ||||||
| Net operating losses |
39,632,716 | 40,302,163 | ||||||
| Fixed assets and other |
59,873 | 74,965 | ||||||
| Deferred revenue |
157,199 | 192,981 | ||||||
| Total deferred tax assets |
$ | 45,466,703 | $ | 45,552,221 | ||||
| Valuation allowance |
(41,434,565 | ) | (39,879,635 | ) | ||||
| Deferred tax assets, net |
$ | 4,032,138 | $ | 5,672,586 | ||||
| Deferred tax liabilities: |
||||||||
| Fixed assets and other |
$ | (62,249 | ) | $ | (165,030 | ) | ||
| Unbilled receivables |
(605,766 | ) | (203,274 | ) | ||||
| Intangibles |
(3,482,292 | ) | (6,231,947 | ) | ||||
| Total deferred tax liabilities |
(4,150,307 | ) | $ | (6,600,251 | ) | |||
| $ | (118,169 | ) | $ | (927,665 | ) | |||
The Company records a valuation allowance when it is more likely than not that some portion or all of the deferred tax assets will not be realized. The ultimate realization of the deferred tax assets depends on the ability to generate sufficient taxable income of the appropriate character in the future and in the appropriate taxing jurisdictions. The Company has provided a valuation allowance against net U.S. deferred tax assets and operating loss carryforwards in certain non-U.S. jurisdictions.
At December 31, 2009, 2008 and 2007, the Company’s federal and state net operating loss (“NOL”) carryforwards for income tax purposes were approximately $107.0 million, $105.0 million and $89.6 million,
F-21
Table of Contents
respectively. The amount of the federal NOL carryforward related to stock-based compensation expense is not recognized until the stock-based compensation tax deductions reduce income taxes payable. Accordingly, the 2009, 2008 and 2007 NOL’s reported in the gross deferred tax asset do not include the excess tax deductions related to stock based compensation of $0.8 million, $0.8 million and $0.8 million, respectively. When income taxes payable is reduced for the excess stock-based compensation expense the amounts will subsequently be allocated to additional paid-in capital. Federal net operating losses will begin to expire in 2017. Federal, foreign, and state tax credit carryforwards for 2009, 2008 and 2007 were $0.7 million, $0.5 million and $0.8 million, respectively. Federal tax credits will begin to expire in 2020.
The timing and manner in which the Company will utilize the U.S. net operating loss carryforwards and research and development tax credit carryforwards in any year, or in total, may be limited by provisions of the Internal Revenue Code regarding changes in ownership of the Company.
The reconciliation of the income tax provision computed at the federal statutory rate to the Company’s effective tax rate is as follows:
| For the years ended December 31, | |||||||||
| 2009 | 2008 | 2007 | |||||||
| Federal statutory rate |
35.00 | % | 35.00 | % | 35.00 | % | |||
| State taxes, net of federal tax benefit |
(2.13 | ) | (0.10 | ) | (0.50 | ) | |||
| Meals and entertainment and other |
(4.98 | ) | (1.21 | ) | (0.80 | ) | |||
| Foreign source income and rate differential |
4.86 | 1.74 | 1.00 | ||||||
| Research and development tax credits |
0.00 | (0.44 | ) | 3.28 | |||||
| Valuation allowance |
(34.90 | ) | (30.48 | ) | (33.58 | ) | |||
| Stock compensation |
(8.77 | ) | (3.63 | ) | (2.15 | ) | |||
| Return to provision |
(6.18 | ) | (0.82 | ) | 0.80 | ||||
| Effective income tax rate |
(17.10 | )% | 0.06 | % | 3.05 | % | |||
| 6. | Lines of Credit and Long-term Debt |
Lines of Credit
One of the Company’s subsidiaries has an operating line of credit with a bank in which borrowing is generally collateralized by and based on a percentage of certain eligible accounts receivable, inventory, and property and equipment. Interest is based on prime, but the agreement contains an interest rate floor of 5.50%. Maximum borrowings under the line are $2.5 million. The line matures on April 26, 2011. At December 31, 2009 and 2008, no amounts were outstanding under the line of credit.
| 7. | Stockholders’ Equity |
The Company is authorized to issue 250,000,000 shares of common stock, $0.001 par value, and 15,000,000 shares of undesignated preferred stock, $0.001 par value. The following is a summary description of our capital stock.
Common Stock
Holders of common stock are entitled to one vote per share on all matters to be voted upon by the stockholders. Holders of common stock are entitled to receive their proportionate share of dividends, if any, declared from time to time by the Board of Directors out of funds legally available for that purpose, subject to any preferential dividend rights of any preferred stock then outstanding. In the event of the Company’s liquidation, dissolution or winding up, holders of common stock are entitled to their proportionate share of all
F-22
Table of Contents
assets remaining after payment of liabilities, after taking into consideration the prior distribution rights of any preferred stock then outstanding. Common stock has no preemptive or conversion rights or other subscription rights. No redemption or sinking fund provisions apply to the common stock.
Preferred Stock
Upon the closing of the IPO in 2007, all shares of Series A convertible preferred stock outstanding automatically converted into 18,525,595 shares of common stock on a one-for-one basis (post one-for-two reverse stock split).
The Board of Directors is authorized, without stockholder approval, from time to time to issue up to 15,000,000 shares of preferred stock in one or more series, each of the series to have whatever rights and preferences, including voting rights, dividend rights, conversion rights, redemption privileges and liquidation preferences, that the Board of Directors may determine. The Company has no current plans to issue any shares of preferred stock.
Prior to their conversion into common stock upon completion of the IPO, Series A shares were redeemable at the option of the majority of the holders on or after April 22, 2010, if the Company did not consummate a qualifying underwritten public offering or a reorganization event by that date. The redemption distribution amount would have been equal to an amount that would provide for a 6% compounded annual return from the date of issuance of the shares. Because the redemption feature was outside the control of the Company, the Series A was excluded from stockholders’ (deficit) equity in the accompanying balance sheets. The Company adjusted additional paid-in capital for periodic accretion of the change in redemption value from initial carrying value through the IPO date.
Treasury Stock
As part of the Company’s stock plans, the Company offers employees the opportunity to make required tax payments with cash or through a net share settlement. For employees choosing net share settlement, the Company makes required tax payments on behalf of employees as their stock awards vest and then withhold a number of vested shares having a value on the date of vesting equal to the tax obligation. The shares withheld were recorded as treasury shares. During the year ended December 31, 2009, the Company repurchased 122,999 shares in settlement of employees’ tax obligations for a total of $600,831 or an average of $4.88 per share. During the year ended December 31, 2008, the Company repurchased 161,042 shares in settlement of employees’ tax obligations for a total of $1,093,387 or an average of $6.79 per share. The Company accounts for treasury stock using the cost method.
| 8. | Stock-Based Compensation |
2007 Employee Stock Purchase Plan
The Board of Directors and stockholders adopted the 2007 Employee Stock Purchase Plan prior to the completion of the IPO. Offerings under the 2007 Employee Stock Purchase Plan will commence at a future date, if at all, selected by the Executive Committee of our Board of Directors in its discretion. A total of 5,000,000 shares of Company common stock will be made available for sale under the 2007 Employee Stock Purchase Plan.
2007 Equity Incentive Plan
The Board of Directors and stockholders adopted the 2007 Equity Incentive Plan, which became effective November 7, 2007, the effective date of the Company’s IPO. The 2007 Plan provides for the grant of incentive stock options, within the meaning of Section 422 of the Internal Revenue Code (the “Code”), to Company
F-23
Table of Contents
employees and Company parent and subsidiary corporations’ employees, and for the grant of non-statutory stock options, restricted stock (“RS”), restricted stock units (“RSUs”), stock appreciation rights, performance units and performance shares to Company employees, directors and consultants and Company parent and subsidiary corporations’ employees and consultants.
The Company’s policy is to issue shares of remaining authorized common stock to satisfy option exercises and restricted stock and restricted stock unit grants under the 2007 Equity Incentive Plan. A total of 8,000,000 shares of Company common stock is reserved for issuance pursuant to the 2007 Plan plus (a) any shares that have been reserved but not issued under the 2005 Stock Plan as of November 7, 2007, and (b) any shares that otherwise would have been returned to the 2005 Stock Plan on or after November 7, 2007, as a result of termination of options or the repurchase of shares issued under the 2005 Stock Plan. As of December 31, 2009, we had options to purchase a total of 2,449,859 shares outstanding, of which 1,836,940 were exercisable. In addition, as of December 31, 2009, we had a total of 490,512 shares of unvested restricted stock awards and restricted stock units, and warrants to purchase 127,250 shares of our common stock outstanding. At December 31, 2009, we had an additional 33,297,635 shares available for share-based awards under our stock based compensation plans.
The Executive Committee of our Board of Directors administers the 2007 Plan. The administrator determines the exercise price of options granted under the 2007 Plan. However, with respect to all stock options, the exercise price may not be less than the fair market value of the Company’s common stock on the date of grant. The term of an incentive stock option may not exceed ten years, except that with respect to any participant, who owns 10% of the voting power of all classes of Company outstanding stock, the term must not exceed five years and the exercise price may not be less than 110% of the fair market value on the grant date. The administrator determines the term of all other options.
After termination of an employee, director or consultant, he or she may exercise his or her option for the period of time stated in the option agreement, to the extent that the option is vested on the date of termination. Generally, if termination is due to death or disability, the option will remain exercisable for 12 months. In all other cases, the option will generally remain exercisable for three months. However, an option generally may not be exercised later than the expiration of its term.
Stock appreciation rights may be granted under the 2007 Plan. Stock appreciation rights allow the recipient to receive the appreciation in the fair market value of our common stock between the date of grant and the exercise date. The administrator determines the terms of stock appreciation rights, including when such rights become exercisable and whether to pay the appreciation in cash or with shares of our common stock, or a combination thereof; however, stock appreciation rights expire under the same rules that apply to stock options.
RS may be granted under the 2007 Plan. Restricted stock awards are shares of our common stock that vest in accordance with terms and conditions established by the administrator. The administrator will determine the number of shares of restricted stock granted to any employee. The administrator may impose whatever conditions to vesting it determines to be appropriate. For example, the administrator may set restrictions based on the achievement of specific performance goals. Shares of restricted stock that do not vest are subject to our right of repurchase or forfeiture.
RSUs may be granted under the 2007 Plan. Restricted stock units are awards that will be granted to a participant based on the achievement of Company-wide, business unit, or individual goals. The administrator will set the vesting criteria in its discretion, which, depending on the extent to which the criteria are met, will determine the number of restricted stock that will be paid out to participants. Restricted stock units may be settled in cash, shares, or a combination of both.
Grants of restricted stock and restricted stock units under the 2007 Plan will be valued using the closing market price of the Company’s common stock on the date of grant.
F-24
Table of Contents
Performance units and performance shares may be granted under the 2007 Plan. Performance units and performance shares are awards that will result in a payment to a participant only if performance goals established by the administrator are achieved or the awards otherwise vest. The administrator will establish organizational or individual performance goals in its discretion, which, depending on the extent to which they are met, will determine the number and/or the value of performance units and performance shares to be paid out to participants. Performance units will have an initial dollar value established by the administrator prior to the grant date. Performance shares will have an initial value equal to the fair market value of Company common stock on the grant date. Payment for performance units and performance shares may be made in cash or in shares of common stock with equivalent value, or in some combination, as determined by the administrator.
Unless the administrator provides otherwise, the 2007 Plan does not allow for the transfer of awards and only the recipient of an award may exercise an award during his or her lifetime. The administrator has the discretion and authority to implement an awards transfer program, which would permit participants the opportunity to transfer any outstanding awards to a financial institution or other person or entity approved by the committee.
The 2007 Plan will automatically terminate in 2017, unless the Company terminates it sooner. In addition, the Board of Directors has the authority to amend, suspend or terminate the 2007 Plan provided such action does not impair the rights of any participant. Shares granted under the Company’s stock-based compensation plans come from new shares reserved for issuance under the plans.
2005 Stock Plan
The 2005 Stock Plan was originally adopted by the Board of Directors and approved by stockholders on April 22, 2005. The 2005 Stock Plan was amended and restated effective June 12, 2007, to enable the Company to grant restricted stock and restricted stock units under the plan.
The 2005 Stock Plan provides for the grant of incentive stock options, within the meaning of Section 422 of the Code, to Company employees and Company parent and subsidiary corporations’ employees, and for the grant of non-statutory stock options, restricted stock, restricted stock units and stock purchase rights to our employees, directors and consultants and Company parent and subsidiary corporations’ employees and consultants. Stock options granted under the 2005 Stock Plan have a maximum term of ten years. The Company will not grant any additional awards under the 2005 Stock Plan subsequent to November 7, 2007. Instead, it will grant options and other equity-based awards under the 2007 Plan.
The 2005 Stock Plan will automatically terminate in 2015, unless the Company terminates it sooner. In addition, the Board of Directors has the authority to amend, suspend or terminate the 2005 Stock Plan provided such action does not impair the rights of any participant. The Board of Directors chose to suspend the 2005 Stock Plan as of the completion of the Company’s IPO.
During the year ended December 31, 2009, the Company granted 236,494 shares of restricted stock and restricted stock units (“RSUs”) pursuant to the 2007 Equity Incentive Plan and 85,640 shares were forfeited. The Company recorded stock-based compensation expense of $2,868,223, $4,131,386 and $2,936,199 during the years ended December 31, 2009, 2008 and 2007, respectively, in connection with the restricted stock and RSU grants. Prior to November 7, 2007, the Company accounted for the fair value of the restricted stock and RSUs using estimates of the fair value of an underlying share of common stock at the time of the grants as there was no market for the Company’s common stock. Our common stock valuations used the probability weighted expected return method. Grants of restricted stock and RSUs after November 7, 2007, are valued using the closing market price of our common stock on the date of grant. The shares vest based on varying service conditions. Upon completion of the IPO, 75,718 shares became immediately vested.
F-25
Table of Contents
The following table summarizes activity for nonvested RS and RSUs granted under the 2007 Equity Incentive Plan and the 2005 Stock Plan for the years ended December 31, 2008 and 2009:
| Restricted Stock Units |
Weighted Average Fair Value | |||||
| Nonvested RS and RSUs outstanding at January 1, 2008 |
591,459 | $ | 12.04 | |||
| RS and RSUs granted |
617,302 | 6.86 | ||||
| RS and RSUs vested |
(429,241 | ) | 9.86 | |||
| RS and RSUs forfeited |
(69,050 | ) | 8.94 | |||
| Nonvested RS and RSUs outstanding at December 31, 2008 |
710,470 | 9.17 | ||||
| RS and RSUs granted |
236,494 | 4.16 | ||||
| RS and RSUs vested |
(370,812 | ) | 9.06 | |||
| RS and RSUs forfeited |
(85,640 | ) | 10.42 | |||
| Nonvested RS and RSUs outstanding at December 31, 2009 |
490,512 | $ | 6.64 | |||
The aggregate intrinsic value of outstanding restricted stock and RSUs at December 31, 2009 was $4,669,674. Also at December 31, 2009, total compensation cost related to nonvested restricted stock and RSU awards that had not yet been recognized totaled $1,939,986. The weighted average period over which this amount will be recognized is estimated to be 2.2 years.
On August 11, 2009, the Company issued an offer to exchange options to purchase up to an aggregate of 2,201,849 shares of the Company’s common stock, whether vested or unvested, with an exercise price per share equal to the greater of $5.00 or the closing price of the Company’s common stock on the date on which the New Options were granted, which was September 8, 2009. Pursuant to the exchange offer, 1,684,138 eligible stock options, including warrants to purchase 375,000 shares of common stock, were tendered and 716,403 new stock options, including warrants to purchase 127,250 shares of common stock, were granted with an exercise price of $5.36, the closing price of the Company’s common stock on the date of grant. The incremental compensation cost associated with this exchange did not have a material impact on the Company’s financial position or results of operations.
Stock-based compensation expense pertaining to stock options totaled $850,098, $1,610,072 and $3,120,430 for the years ended December 31, 2009, 2008 and 2007, respectively. Cash received from the exercise of stock options totaled $132,602, $252,382 and $418,408 for the years ended December 31, 2009, 2008 and 2007, respectively.
Existing stock options in nine of our acquired companies were assumed by the Company and were included in the 2005 Stock Plan. Vesting schedules in these companies ranged from zero to five years. Stock options issued by the Company have vesting schedules ranging from four to five years.
The Company granted 1,299,436 options in 2009, 102,369 options in 2008 and did not grant any options in 2007. The fair value of options granted in 2009 and 2008 was estimated at the grant date using the Black-Scholes option pricing model with the following weighted average assumptions:
| Year ended December 31, 2009 |
Year ended December 31, 2008 |
|||||
| Grant date fair value |
$4.09 – $5.05 | $3.13 | ||||
| Risk-free interest rate |
2.01% – 2.26 | % | 3.72 | % | ||
| Dividend yield |
— | % | — | % | ||
| Expected life (years) |
5.15 – 6.50 | 5.0 – 6.25 | ||||
| Expected volatility |
47.0% – 47.3 | % | 41.5% – 42.7 | % |
F-26
Table of Contents
For options granted in the September 2009 option exchange, the fair value of options was estimated at the grant date using the Black-Scholes option pricing model with the following weighted average assumptions:
| Grant date fair value |
$0.33 – $1.81 | ||
| Risk-free interest rate |
0.10 – 1.49 | % | |
| Dividend yield |
— | % | |
| Expected life (years) |
0.12 – 2.69 | ||
| Expected volatility |
44.6% – 70.2 | % |
No dividend yield assumption was included because the Company does not plan to pay dividends. The expected life of options granted in 2009 and 2008 was calculated based on the “simplified” method for “plain vanilla” options contained in SEC Staff Accounting Bulletin No. 107, Valuation of Share-Based Payment Arrangements for Public Companies, due to the Company’s limited historical trading and exercise information. The “simplified method” calculates the expected term as the average of the vesting term and the original contractual term of the options. As the Company’s common stock has not been publicly traded for a period equal to the expected term of the options and had no market in 2006, expected volatility was calculated using the median historical annualized daily volatilities of similar publicly traded entities. These assumptions are used in calculating the fair value of shares vested and the intrinsic value of exercised options as shown below.
| For the year ended December 31, | |||||||||
| 2009 | 2008 | 2007 | |||||||
| Fair value of shares vested |
$ | 4,286,540 | $ | 5,965,637 | $ | 29,171,717 | |||
| Aggregate intrinsic value of exercised shares |
499,671 | 938,120 | 838,172 | ||||||
Stock option activity for options issued under the 2007 Equity Incentive Plan and 2005 Stock Plan was as follows as of December 31, 2009 and 2008, and for the years then ended:
| Shares Subject to Options |
Weighted Average Exercise Price |
Weighted Average Fair Value |
Weighted Average Remaining Contractual Term (in yrs.) | ||||||||
| Options outstanding at January 1, 2008 |
3,098,641 | $ | 9.22 | $ | 4.60 | ||||||
| Options granted |
102,369 | 9.12 | 3.13 | ||||||||
| Options exercised |
(156,823 | ) | 1.49 | 8.60 | |||||||
| Options terminated, cancelled or expired |
(253,660 | ) | 10.50 | 3.69 | |||||||
| Options outstanding at December 31, 2008 |
2,790,527 | $ | 9.56 | $ | 4.38 | 6.16 | |||||
| Options granted |
1,299,436 | 5.16 | 1.03 | ||||||||
| Options exercised |
(70,965 | ) | 1.75 | 8.36 | |||||||
| Options terminated, cancelled or expired |
(1,678,339 | ) | 11.70 | 0.93 | |||||||
| Options outstanding at December 31, 2009 |
2,340,659 | $ | 5.84 | $ | 4.87 | 6.16 | |||||
| Options exercisable at December 31, 2009 |
1,727,740 | $ | 6.10 | $ | 3.50 | 5.05 | |||||
| Options exercisable at December 31, 2008 |
2,577,527 | $ | 9.60 | $ | 4.41 | 6.07 | |||||
The Company periodically grants stock option awards to selected executives and other key employees at the discretion of the Company’s Board of Directors. These board-discretionary stock options are generally granted at-the-money, have varying vesting schedules, and have contractual lives of ten years.
The fair value of each board-discretionary option grant was estimated on the date of grant using the same option valuation model used for options granted under the 2007 Equity Incentive Plan and the 2005 Stock Plan.
F-27
Table of Contents
The inputs for expected volatility, expected dividends, and risk-free rate used in estimating the fair value of those options are the same as those noted in the table related to options shown above.
A summary of the board-discretionary stock option activity as of December 31, 2008 and 2009, and changes during the years then ended is presented below:
| Shares Subject to Options |
Weighted Average Exercise Price |
Weighted Average Fair Value |
Weighted Average Remaining Contractual Term (in yrs.) | ||||||||
| Options outstanding at January 1, 2008 |
173,525 | 0.64 | 9.42 | ||||||||
| Options exercised |
(13,925 | ) | 1.32 | 9.42 | |||||||
| Options outstanding at December 31, 2008 |
159,600 | $ | 0.16 | $ | 9.42 | 6.52 | |||||
| Options exercised |
(50,400 | ) | 0.16 | 9.42 | |||||||
| Options outstanding at December 31, 2009 |
109,200 | $ | 0.16 | $ | 9.42 | 5.53 | |||||
| Options exercisable at December 31, 2009 |
109,200 | $ | 0.16 | $ | 9.42 | 5.53 | |||||
| Options exercisable at December 31, 2008 |
159,600 | $ | 0.16 | $ | 9.42 | 6.52 | |||||
The following table summarizes information about stock options outstanding as of December 31, 2009:
| Options Outstanding | Options Exercisable | |||||||||||
| Exercise price range |
Number of options |
Weighted Average Exercise Price |
Wtd. Avg. Remaining contractual term (in yrs.) |
Number of options |
Weighted Average Exercise Price | |||||||
| $0.16 – $2.00 | 312,164 | $ | 1.19 | 4.04 | 312,164 | $ | 1.19 | |||||
| $2.52 – $4.09 | 215,572 | 3.22 | 4.75 | 209,072 | 3.19 | |||||||
| $5.00 – $5.44 | 1,276,551 | 5.17 | 7.35 | 692,294 | 5.31 | |||||||
| $6.14 – $9.04 | 141,418 | 6.71 | 2.36 | 120,704 | 6.58 | |||||||
| $10.00 – $15.00 | 504,154 | 10.05 | 5.94 | 502,706 | 10.05 | |||||||
| 2,449,859 | $ | 5.58 | 6.13 | 1,836,940 | $ | 5.75 | ||||||
The aggregate intrinsic value of outstanding options at December 31, 2009 and 2008 was $9,934,508 and $4,520,236, respectively. Also at December 31, 2009, total compensation cost related to nonvested awards that had not yet been recognized totaled $851,444. The weighted average period over which this amount will be recognized is estimated to be 3.4 years.
| 9. | Discontinued Operations |
In the third quarter of 2009, the Company’s Board of Directors adopted a plan of sale and put the assets of PureTech Systems, Inc. (PureTech), a unit in the Solutions segment, up for sale, as the business model of this unit no longer aligned with the strategic plans of the Company. In conjunction with this plan, the Company recognized a loss on discontinued operations of $2,940,803 in 2009. This loss included a goodwill impairment charge of $1,260,790, a $828,000 impairment charge to write down PureTech’s intangible assets, and a $150,334 impairment charge to write down PureTech’s non-current assets. Prior year financial statements for 2008 and 2007 have been restated to present the operations of PureTech as discontinued operations.
On December 14, 2006, the Company’s Board of Directors adopted a plan of sale and put the assets and businesses up for sale for its Laser segment (consisting of Nuvonyx, Inc. and Nuvonyx Europe), manufacturers of laser diode components, arrays and industrial laser systems and Harbinger Technologies, a provider of homeland
F-28
Table of Contents
defense and security consulting and technology. The Company decided to sell these units primarily because the business models did not align with the strategic plans of the Company. The disposal dates of the units were February 2, 2007, March 15, 2007, and April 24, 2007, for Nuvonyx Europe, Harbinger Technologies, and Nuvonyx, Inc., respectively.
The units’ sales and pretax losses, reported in discontinued operations, for each of the three years ended December 31, 2009, are shown below. In 2009, 2008 and 2007, the Company realized a loss on discontinued operations of $2,940,803, $1,486,582 and $1,507,695, respectively, related to the sale of these companies. In 2008, the Company realized a loss on sale of discontinued operations of $902,885 related to the settlement of escrow accounts and contingent purchase consideration. The income tax expense (benefit) for discontinued operations was $0, $850 and ($5,543) in 2009, 2008 and 2007, respectively. In 2007, the Company recorded a gain on sale of discontinued operations of $4,581,423, net of taxes, related to the sale of these companies.
In 2007, the Company recorded a gain on sale of discontinued operations of $2,239,638 associated with the sale of substantially all of the assets of a non-strategic operation owned by Nomadics, Inc., that was acquired in 2005 and sold in 2006.
Revenues and net loss before income taxes reported in discontinued operations were are follows:
| For the years ended December 31, | ||||||||||||
| 2009 | 2008 | 2007 | ||||||||||
| Sales |
||||||||||||
| Nuvonyx, Inc. |
$ | — | $ | — | $ | 2,475,378 | ||||||
| Harbinger Technologies |
— | — | 686,228 | |||||||||
| PureTech |
1,994,027 | 1,545,142 | 654,463 | |||||||||
| $ | 1,994,027 | $ | 1,545,142 | $ | 3,816,069 | |||||||
| Net loss before income taxes |
||||||||||||
| Nuvonyx, Inc. |
$ | — | $ | — | $ | (399,517 | ) | |||||
| Harbinger Technologies |
— | — | (902,027 | ) | ||||||||
| PureTech |
(2,940,803 | ) | (1,485,732 | ) | (211,694 | ) | ||||||
| $ | (2,940,803 | ) | $ | (1,485,732 | ) | $ | (1,513,238 | ) | ||||
| Net loss per share |
$ | (0.08 | ) | $ | (0.04 | ) | $ | (0.11 | ) | |||
F-29
Table of Contents
The assets and liabilities of the discontinued operations of PureTech are presented separately in the consolidated balance sheets under the captions “Current assets of discontinued operations”, “Noncurrent assets of discontinued operations”, and “Current liabilities of discontinued operations” and consist of the following:
| December 31, 2009 |
December 31, 2008 | |||||
| Assets of discontinued operations: |
||||||
| Accounts receivable, net |
$ | 1,016,692 | $ | 553,981 | ||
| Inventories |
25,805 | 55,206 | ||||
| Property, plant and equipment, net |
26,845 | 63,653 | ||||
| Intangibles, net |
— | 1,035,000 | ||||
| Goodwill |
— | 1,260,790 | ||||
| Other assets |
348,294 | 408,761 | ||||
| Total assets |
$ | 1,417,636 | $ | 3,377,391 | ||
| Liabilities of discontinued operations: |
||||||
| Accounts payable |
$ | 3,211 | $ | 7,017 | ||
| Deferred revenue |
824,743 | 191,019 | ||||
| Total liabilities |
$ | 827,954 | $ | 198,036 | ||
In connection with the sale of discontinued operations in 2006, the Company received warrants to purchase 125,000 shares of the purchaser’s Series G Preferred Stock at $5.40 per share. At the time of the sale, management assigned a fair value of zero due to lack of marketability, primarily due to the purchaser’s status as a privately-held company and uncertainty as to the successful completion of the purchaser’s IPO. During 2007, the purchaser’s stock began trading following a public offering and the warrants converted to common stock on a one-for-one basis. The Company exercised the warrants, in a net share settlement, received 91,756 shares of the purchaser’s common stock, and recognized a gain on discontinued operations of $1,339,638 upon receipt of the underlying shares. At December 31, 2007, the investment was carried in the consolidated balance sheet at $1,157,410, and was included in other current assets. Since the purchaser’s market price decreased from the date of exercise of the warrants to year end, the Company recognized a loss of $182,227, included in other income (expense) in the accompanying 2007 consolidated statement of operations. This investment was sold in July 2008 and the resulting gain of $175,944 is recorded in other income (expense) in the 2008 consolidated statement of operations.
| 10. | Segment Information |
Segment information has been prepared in accordance with SFAS No. 131, Disclosure about Segments of an Enterprise and Related Information. The Company has three reportable segments: detection, surveillance, and solutions. The detection segment provides chemical, biological, radiological, nuclear, and radiation detection activities. The surveillance segment provides perimeter security and monitoring. The solutions segment designs, creates, and deploys security operating systems and video networking systems. The Company’s reportable segments are strategic business units that offer different types of products and services. They are managed separately because each unit requires different technology and marketing strategies.
Segment performance is evaluated based upon operating income or loss before income taxes and interest expense. The accounting policies of the segments are the same as those described in the summary of significant accounting policies. Intersegment sales and transfers are accounted for at the same prices as if the sales and transfers were made to third parties.
Due to a change in internal reporting structure and the economics of the business of one subsidiary during 2008, the Company determined one subsidiary should be removed from the Surveillance segment and included in the Detection segment. Additionally, due to changes in the Company’s internal structure, additional general and
F-30
Table of Contents
administrative and sales and marketing expenses have been allocated to the Company’s reportable segments. Segment information disclosed below for the years ended December 31, 2008 and 2007 has been reclassified to conform to the 2009 presentation.
The following is a summary of information for the Company’s reportable segments:
| For the year ended December 31, 2009 | ||||||||||||||||
| Detection | Surveillance | Solutions | Segments Combined |
|||||||||||||
| Total revenues |
$ | 102,813,058 | $ | 46,946,579 | $ | 34,785,656 | $ | 184,545,293 | ||||||||
| Intersegment revenues |
— | (119,096 | ) | (998,600 | ) | (1,117,696 | ) | |||||||||
| Revenues from external customers |
102,813,058 | 46,827,483 | 33,787,056 | 183,427,597 | ||||||||||||
| Segment operating income (loss) |
(3,527,225 | ) | (4,035,084 | ) | 743,483 | (6,818,826 | ) | |||||||||
| Depreciation and amortization |
7,839,761 | 2,272,312 | 471,301 | 10,583,374 | ||||||||||||
| Segment total assets |
$ | 105,712,857 | $ | 37,555,241 | $ | 23,552,341 | $ | 166,820,439 | ||||||||
| Segment property, plant and equipment additions |
$ | 1,844,052 | $ | 19,983 | $ | 33,698 | $ | 1,897,733 | ||||||||
| For the year ended December 31, 2008 | ||||||||||||||||
| Detection | Surveillance | Solutions | Segments Combined |
|||||||||||||
| Revenues from external customers |
$ | 91,133,551 | $ | 51,049,801 | $ | 28,010,609 | $ | 170,193,961 | ||||||||
| Segment operating losses |
(11,159,297 | ) | (7,369,470 | ) | (6,209,691 | ) | (24,738,458 | ) | ||||||||
| Depreciation and amortization |
7,845,894 | 2,999,886 | 1,573,029 | 12,418,809 | ||||||||||||
| Segment total assets |
$ | 106,180,659 | $ | 52,108,392 | $ | 22,192,250 | $ | 180,481,301 | ||||||||
| Segment property, plant and equipment additions |
$ | 2,083,901 | $ | 942,153 | $ | 207,818 | $ | 3,233,872 | ||||||||
| For the year ended December 31, 2007 | ||||||||||||||||
| Detection | Surveillance | Solutions | Segments Combined |
|||||||||||||
| Revenues from external customers |
$ | 79,035,724 | $ | 38,441,821 | $ | 18,029,606 | $ | 135,507,151 | ||||||||
| Segment operating losses |
(15,164,916 | ) | (10,884,281 | ) | (9,865,032 | ) | (35,914,229 | ) | ||||||||
| Depreciation and amortization |
8,007,513 | 3,515,019 | 1,945,394 | 13,467,926 | ||||||||||||
| Segment property, plant and equipment additions |
$ | 2,535,631 | $ | 521,527 | $ | 177,220 | $ | 3,234,378 | ||||||||
Following is a reconciliation of the Company’s operating losses from reportable segments to the total Company loss before income taxes:
| For the year ended December 31, | ||||||||||||
| 2009 | 2008 | 2007 | ||||||||||
| Operating losses from reportable segments |
$ | (6,818,826 | ) | $ | (24,738,458 | ) | $ | (35,914,229 | ) | |||
| Unallocated depreciation and amortization expense |
(736,963 | ) | (669,042 | ) | (231,272 | ) | ||||||
| Interest income |
160,980 | 998,924 | 833,067 | |||||||||
| Interest expense |
(103,396 | ) | (65,710 | ) | (639,360 | ) | ||||||
| Other non-operating gains (losses), net |
911,867 | (92,070 | ) | (381,532 | ) | |||||||
| Loss before income taxes |
$ | (6,586,338 | ) | $ | (24,566,356 | ) | $ | (36,333,326 | ) | |||
F-31
Table of Contents
Following is a reconciliation of the total assets from the Company’s reportable segments to the total assets of the Company:
| As of December 31, | ||||||
| 2009 | 2008 | |||||
| Total assets from reportable segments |
$ | 166,820,439 | $ | 180,481,301 | ||
| Cash and cash equivalents |
26,105,559 | 31,640,943 | ||||
| Prepaid expenses and other assets |
3,733,537 | 3,778,882 | ||||
| Deferred income taxes |
346,721 | 19,935 | ||||
| Current and noncurrent assets of discontinued operations (Note 9) |
1,417,636 | 3,377,391 | ||||
| Total assets |
$ | 198,423,892 | $ | 219,298,452 | ||
| For the year ended December 31, | |||||||||
| 2009 | 2008 | 2007 | |||||||
| Total property, plant and equipment additions from reportable segments |
$ | 1,897,733 | $ | 3,233,872 | $ | 3,234,378 | |||
| Unallocated property, plant and equipment additions |
42,369 | 1,067,589 | 1,920,396 | ||||||
| Property, plant and equipment additions related to discontinued operations (Note 9) |
— | — | — | ||||||
| $ | 1,940,102 | $ | 4,301,461 | $ | 5,154,774 | ||||
Following is a summary of the Company’s revenue attributable to the geographic locations in which the Company operates, based on the physical location of our subsidiaries:
| For the years ended December 31, | |||||||||
| 2009 | 2008 | 2007 | |||||||
| United States |
$ | 165,851,388 | $ | 152,460,509 | $ | 117,118,298 | |||
| Canada |
12,672,055 | 10,588,900 | 13,497,402 | ||||||
| Europe |
4,904,154 | 7,144,552 | 4,891,451 | ||||||
| Total revenue |
$ | 183,427,597 | $ | 170,193,961 | $ | 135,507,151 | |||
Following is a summary of the Company’s tangible long-lived assets attributable to the geographic locations in which the Company operates:
| For the years ended December 31, | ||||||
| 2009 | 2008 | |||||
| United States |
$ | 11,609,116 | $ | 11,777,772 | ||
| Canada |
1,181,786 | 688,961 | ||||
| Europe |
552,695 | 727,354 | ||||
| Total tangible long-lived assets |
$ | 13,343,597 | $ | 13,194,087 | ||
F-32
Table of Contents
Following is a summary of revenue from customers by geographic locations:
| For the years ended December 31, | |||||||||
| 2009 | 2008 | 2007 | |||||||
| United States |
$ | 159,130,614 | $ | 147,896,524 | $ | 118,536,758 | |||
| Europe |
5,864,240 | 8,321,904 | 3,218,426 | ||||||
| Asia |
4,490,729 | 3,783,360 | 4,228,749 | ||||||
| Canada |
9,163,667 | 5,220,625 | 4,959,548 | ||||||
| Middle East |
4,386,303 | 4,764,686 | 4,062,112 | ||||||
| Other |
392,044 | 206,862 | 501,558 | ||||||
| Total revenue |
$ | 183,427,597 | $ | 170,193,961 | $ | 135,507,151 | |||
In 2009, 2008 and 2007, the Company earned 56%, 40% and 37%, respectively, of its total revenue from product, contracts and other service sales to the U.S. government. Such revenue was earned across all the Company’s reportable segments.
No one non-U.S. government customer accounted for more than 10% of the Company’s total revenue in 2009, 2008 or 2007.
| 11. | Employee Benefit Plans |
The Company sponsors a 401(k) retirement plan (“Plan”) to provide retirement and incidental benefits for its employees. Employees may contribute a percentage of their annual compensation to the Plan, limited to a maximum annual amount as set periodically by the Internal Revenue Service. Prior to April 1, 2009, the Company matched employee contributions dollar for dollar up to a maximum of 3% per year per employee. Persons employed prior to December 31, 2006 are 100% vested in matching contributions. Persons employed after December 31, 2006 vest evenly over a 4 year vesting period at 25% per year. In addition, the Plan provides for discretionary contributions as determined by the Board of Directors. Such contributions to the Plan are allocated among eligible participants in the proportion of their salaries to the total salaries of all participants. Effective April 1, 2009, the Company suspended matching contributions to the Plan. In March 2010, the Company’s Board of Directors approved the reinstatement of company matching contributions of $0.33 for each $1.00 contributed, on up to 3% of the employee’s compensation, effective April 1, 2010.
Company matching contributions to the Plan totaled $348,910, $1,373,333 and $1,107,767 for the years ended December 31, 2009, 2008 and 2007, respectively. The Company did not make any discretionary contributions in 2009, 2008 or 2007.
| 12. | Statements of Cash Flows |
Supplemental cash flow and non-cash investing and financing information includes the following:
| At December 31, | ||||||
| 2009 | 2008 | 2007 | ||||
| Business combination consideration included in accrued expenses |
900,000 | 1,006,523 | — | |||
| Business combination consideration included in other liabilities |
— | 1,006,522 | — | |||
| Escrow funds from business combinations included in accrued expenses and other current liabilities |
— | 525,000 | 1,844,468 | |||
| Cash paid for interest |
46,386 | 88,850 | 619,859 | |||
| Cash paid for income taxes |
799,631 | 796,954 | — | |||
F-33
Table of Contents
| 13. | Selected Quarterly Financial Data (Unaudited) |
A summary of the quarterly operating results during 2009 and 2008 follows:
| For the Year Ended December 31, 2009 |
First Quarter | Second Quarter | Third Quarter | Fourth Quarter | ||||||||||||
| Revenues |
$ | 47,390,969 | $ | 44,987,572 | $ | 42,820,461 | $ | 48,228,595 | ||||||||
| Gross profit |
16,782,825 | 17,250,435 | 17,569,751 | 18,877,795 | ||||||||||||
| Loss from continuing operations |
(3,321,567 | ) | (1,183,816 | ) | (1,328,950 | ) | (1,878,506 | ) | ||||||||
| Net loss |
(3,475,076 | ) | (1,270,790 | ) | (3,856,727 | ) | (2,051,049 | ) | ||||||||
| Loss from continuing operations per share |
$ | (0.10 | ) | $ | (0.03 | ) | $ | (0.04 | ) | $ | (0.05 | ) | ||||
| Net loss per common share: |
||||||||||||||||
| Basic and diluted |
$ | (0.10 | ) | $ | (0.04 | ) | $ | (0.11 | ) | $ | (0.06 | ) | ||||
| For the Year Ended December 31, 2008 |
First Quarter | Second Quarter | Third Quarter | Fourth Quarter | ||||||||||||
| Revenues |
$ | 35,825,848 | $ | 37,338,919 | $ | 44,337,850 | $ | 52,691,344 | ||||||||
| Gross profit |
15,605,432 | 17,132,263 | 19,753,878 | 17,913,317 | ||||||||||||
| Loss from continuing operations |
(10,870,582 | ) | (8,356,678 | ) | (3,511,100 | ) | (1,812,661 | ) | ||||||||
| Net loss |
(12,137,518 | ) | (8,957,483 | ) | (3,816,820 | ) | (2,028,667 | ) | ||||||||
| Loss from continuing operations per share |
$ | (0.32 | ) | $ | (0.25 | ) | $ | (0.11 | ) | $ | (0.06 | ) | ||||
| Net loss per common share: |
||||||||||||||||
| Basic and diluted |
$ | (0.36 | ) | $ | (0.26 | ) | $ | (0.11 | ) | $ | (0.06 | ) | ||||
Quarterly net loss differs from loss from continuing operations due to losses recognized on discontinued operations. As discussed more fully in Note 9, in the third quarter of 2009, the Company’s Board of Directors adopted a plan of sale and put the assets of PureTech Systems, Inc. (PureTech) up for sale, as the business model of this unit no longer aligned with the strategic plans of the Company. In conjunction with this plan, the Company recognized a loss on discontinued operations of $2,940,803 in 2009, with $2,527,777 of this loss being recognized in the third quarter. This loss included a goodwill impairment charge of $1,260,790, a $828,000 impairment charge to write down PureTech’s intangible assets, and a $150,334 impairment charge to write down PureTech’s non-current assets.
F-34