Attached files
Table of Contents
UNITED STATES
SECURITIES AND EXCHANGE COMMISSION
Washington, D.C. 20549
FORM 10-K
| x | ANNUAL REPORT PURSUANT TO SECTION 13 OR 15(d) OF THE SECURITIES AND EXCHANGE ACT OF 1934 |
For the fiscal year ended December 31, 2009
Or
| ¨ | TRANSITION REPORT PURSUANT TO SECTION 13 OR 15(d) OF THE SECURITIES AND EXCHANGE ACT OF 1934 |
Commission file number 0-23881
COWLITZ BANCORPORATION
(Exact name of registrant as specified in its charter)
| Washington | 91-1529841 | |
| (State or other jurisdiction of incorporation or organization) |
(I.R.S. Employer Identification No.) |
927 Commerce Ave., Longview, Washington 98632
(Address of principal executive offices) (Zip Code)
(360) 423-9800
(Registrant’s telephone number, including area code)
Securities registered pursuant to Section 12(b) of the Act: None
Securities registered pursuant to Section 12(g) of the Act: Common Stock, No par value
(Title of Class)
Indicate by check mark if the registrant is a well-known seasoned issuer, as defined in Rule 405 of the Securities Act.
¨ Yes x No
Indicate by check mark if the registrant is not required to file reports pursuant to Section 13 or Section 15(d) of the Act.
¨ Yes x No
Indicate by check mark whether the registrant (1) has filed all reports required to be filed by Section 13 or 15(d) of the Securities Exchange Act of 1934 during the preceding 12 months (or for such shorter period that the registrant was required to file such reports) and (2) has been subject to such filing requirements for the past 90 days.
x Yes ¨ No
Indicate by check mark whether the registrant has submitted electronically and posted on its corporate Web site, if any, every Interactive Data File required to be submitted and posted pursuant to Rule 405 of Regulation S-T (§232.405 of this chapter) during the preceding 12 months (or for such sorter period that the registrant was required to submit and post such files).
¨ Yes ¨ No
Indicate by check mark if disclosure of delinquent filers pursuant to Item 405 of Regulation S-K is not contained herein, and will not be contained, to the best of registrant’s knowledge, in definitive proxy or information statements incorporated by reference in Part III of this Form 10-K or any amendment to this Form 10-K. ¨
Indicate by check mark whether the registrant is a large accelerated filer, an accelerated filer, a non-accelerated filer, or a smaller reporting company. See the definitions of “large accelerated filer,” “accelerated filer” and “smaller reporting company” in Rule 12b-2 of the Exchange Act (check one):
¨ Large accelerated filer ¨ Accelerated filer ¨ Non-accelerated filer x Smaller reporting company
Indicate by check mark whether the registrant is a shell company (as defined in Rule 12b-2 of the Act).
¨ Yes x No
The aggregate market value of Registrant’s Common Stock held by non-affiliates of the Registrant on June 30, 2009, was $6,415,142.
Common Stock, no par value, outstanding as of March 1, 2010: 514,638
DOCUMENTS INCORPORATED BY REFERENCE
None.
Table of Contents
| Page | ||||
| PART I | ||||
| Item 1. |
1 | |||
| Item 1A. |
11 | |||
| Item 1B. |
21 | |||
| Item 2. |
21 | |||
| Item 3. |
21 | |||
| Item 4. |
21 | |||
| PART II | ||||
| Item 5. |
22 | |||
| Item 6. |
24 | |||
| Item 7. |
Management’s Discussion and Analysis of Financial Condition and Results of Operation |
25 | ||
| Item 7A. |
54 | |||
| Item 8. |
58 | |||
| Item 9. |
Changes in and Disagreements with Accountants on Accounting and Financial Disclosure |
94 | ||
| Item 9A(T). |
94 | |||
| Item 9B. |
95 | |||
| PART III | ||||
| Item 10. |
97 | |||
| Item 11. |
100 | |||
| Item 12. |
Security Ownership of Certain Beneficial Owners and Management and Related Stockholder Matters |
105 | ||
| Item 13. |
Certain Relationships and Related Transactions, and Director Independence |
106 | ||
| Item 14. |
106 | |||
| PART IV | ||||
| Item 15. |
108 | |||
Note: This document has not been reviewed, or confirmed for accuracy or relevancy, by the Federal Deposit Insurance Corporation.
Forward-Looking Statements
This discussion and information in this document, particularly in Item 7 “Management’s Discussion and Analysis of Financial Condition and Results of Operation” and the accompanying financial statements, contain certain forward-looking statements, within the meaning of the Private Securities Litigation Reform Act of 1995. Forward-looking statements, which are based on certain assumptions and describe future plans, strategies and expectations of the Company, are all statements other than statements of historical fact and are generally identifiable by words such as “expect”, “believe”, “intend”, “anticipate”, “estimate” or similar expressions. Forward-looking statements are subject to risks and uncertainties that could cause actual results to differ materially from those stated. Examples of such risks and uncertainties that could have a material adverse affect on the operations and future prospects of the Company, and could render actual results different from those expressed in the forward-looking statement, include, without limitation: the factors described in Item 1A of this report, changes in general economic conditions, competition for financial services in the market area of the Company, the level of demand for loans, quality of the loan and investment portfolio, deposit flows, legislative and regulatory initiatives, ability to comply with regulatory agreements and monetary and fiscal policies of the U.S. Government affecting interest rates. The reader is advised that this list of risks is not exhaustive and should not be construed as any prediction by the Company as to which risks would cause actual results to differ materially from those indicated by the forward-looking statements. Readers are cautioned not to place undue reliance on these forward-looking statements. In this Annual Report on Form 10-K we make forward-looking statements about the adequacy of our allowance for credit losses, the necessity of provisions for loan losses, our belief regarding the economic prospects of our market area and the related impact on loan growth, the quality of our loan portfolio, regulatory status and compliance with regulatory agreements, and the adequacy of our liquidity. The Company undertakes no obligation to publicly revise these forward-looking statements to reflect subsequent events or circumstances. This statement is included for the express purpose of protecting the Company under PSLRA’s safe harbor provisions.
Table of Contents
| Item 1. | Business |
Introduction
Cowlitz Bancorporation (the “Company”) was organized in 1991 under Washington law to become the holding company for Cowlitz Bank (the “Bank”), a Washington state chartered bank that commenced operations in 1978. The principal executive offices of the Company are located in Longview, Washington. The Bank operates four branches in Cowlitz County in southwest Washington. Outside of Cowlitz County, the Bank does business under the name Bay Bank with branches in Bellevue, Seattle, and Vancouver, Washington, and Portland, Oregon and a limited service branch in a retirement center in Wilsonville, Oregon. The Bank also provides mortgage banking services through its Bay Mortgage division with offices in Longview and Vancouver, Washington.
The Company offers or makes available a broad range of financial services to its customers, primarily small and medium-sized businesses, professionals, and retail customers. The Company’s goals are to offer exceptional customer service and to invest in the markets it serves through its business practices and community service. The Bank’s commercial and personal banking services include commercial and real estate lending, consumer lending, international banking services, internet banking, mortgage banking and trust services. The Company’s customers have access to the Bank’s products and services through a variety of convenient channels such as 24 hour—7 days a week automated phone and internet access and ATMs, as well as through branch locations. Beginning in the first quarter of 2008, the Bank began offering its business customers remote deposit capture. This service allows customers to make deposits electronically without leaving their office.
As reported in the Company’s Form 8-K dated February 2, 2010, the Bank stipulated to the issuance of a Consent Order (the “Order”) with the Federal Deposit Insurance Corporation (the “FDIC”) and the Washington Department of Financial Institutions (the “DFI”), based on certain findings from an examination of the Bank concluded in August 2009. In entering into the stipulation and consenting to entry of the Order, the Bank did not concede the findings or admit to any of the assertions therein. For a detailed discussion of the Order and management’s plans to comply with its provisions, see “Management’s Discussion and Analysis of Financial Condition and Results of Operations—Recent Developments” in Item 7 of this report.
The results reported in this Annual Report on Form 10-K revises the results for the fourth quarter and year-ended December 31, 2009, previously reported on February 2, 2010. The loss for the fourth quarter of 2009 was $13.4 million, compared with the previously reported loss of $10.1 million. For all of 2009, the Company reported a net loss of approximately $34.8 million, compared with the previously reported loss of $31.5 million. The increase in loss for both the quarter and year-to-date was primarily due to accounting rules that apply when material subsequent events take place before the publication of audited financial statements. These events included the receipt of updated appraisals and evidence of other material information related to nonperforming loans and other real estate owned and resulted in an increase to charge-offs and the provision for credit losses of approximately $2.8 million, and additional other real estate owned expenses of $0.5 million for the fourth quarter of 2009.
At December 31, 2009, the Company had total assets of $ 552.4 million with loans of $343.3 million. Liabilities totaled $540.4 million with deposits of $523.8 million. Shareholders’ equity was $12.1 million, and the Company’s book value per share was $23.42 at year-end 2009. All per share amounts reflect the impact of the Company’s common stock one-for-ten reverse stock split affected March 1, 2010. At December 31, 2009, loans were approximately 62 percent of total assets. For more information regarding the Company’s operating results and financial condition, see “Management’s Discussion and Analysis of Financial Condition and Results of Operations” in Item 7 of this report and “Financial Statements and Supplementary Data,” in Item 8 of this report.
On October 31, 2005, the Company acquired all of the outstanding shares of common stock of AEA Bancshares, Inc. (AEA), the parent company of Asia-Europe-Americas Bank, in an acquisition accounted for as a
1
Table of Contents
purchase. The acquisition was consistent at the time with the Company’s business banking expansion strategy in King County, Washington. The former Asia-Europe-Americas Bank office in Seattle operates as a Bay Bank branch. Also based in the Seattle office, in the second quarter of 2006 the Company established its international banking department.
Products and Services
The Company offers a broad portfolio of products and services tailored to meet the financial needs of individuals and small business customers in its market areas. The Company believes this portfolio is generally competitive with the products and services of its competitors, including community banks, major regional and national banks, thrifts and credit unions.
Deposit Products. The Company offers noninterest-bearing and interest-bearing checking accounts, savings accounts, money market accounts, individual retirement accounts, and certificates of deposit. Interest-bearing accounts generally earn interest at rates established by management based on competitive market factors and management’s desire to increase certain types or alter maturities of deposit liabilities. During times of asset growth, or as liquidity needs arise, the Company has utilized brokered and internet listing sourced certificates of deposit as a source of funding. Under the terms of the Order, the Bank has not been able to accept or renew any brokered deposits since mid-2009. For a detailed discussion of the Order and management’s plans to comply with its provisions, see “Management’s Discussion and Analysis of Financial Condition and Results of Operations—Recent Developments” in Item 7 of this report. The Company strives to establish customer relationships to attract core deposits in noninterest-bearing transactional accounts to reduce its cost of funds.
Loan Products. The Company offers a broad range of loan products to retail and business customers. The Company maintains loan underwriting standards with written loan policies and individual lending limits. All new loans and renewals are reported monthly to the Company’s Board of Directors. The Board of Directors’ Loan Committee approves particularly large loan commitments. Underwriting standards are designed to achieve a high-quality loan portfolio, compliance with lending regulations and an appropriate mix of loan maturities and industry concentrations. Management seeks to minimize credit losses by closely monitoring the financial condition of its borrowers and the value of collateral. Under the terms of the order, the Bank must reduce the amount of construction, development and commercial real estate loans and strictly limit new acquisition, development and construction lending. For a detailed discussion of the Order and management’s plans to comply with its provisions, see “Management’s Discussion and Analysis of Financial Condition and Results of Operations—Recent Developments” in Item 7 of this report.
Commercial Loans. Commercial lending is a focus of the Company’s lending activities, and a significant portion of its loan portfolio consists of commercial loans. The Company offers specialized loans for its business and commercial customers. These include operating lines of credit that support accounts receivables and inventory, as well as secured term loans to finance machinery and equipment. The Company has historically reported loans in accordance with Bank regulatory guidelines. As a result, a substantial portion of the Company’s commercial loans are designated as real estate loans, as the loans are secured by mortgages or trust deeds on real property, although some of these loans were not made to finance real estate nor does the repayment depend on the sale of or income from the real estate. Lending decisions are based on careful evaluation of the financial strength, management and credit history of the borrower, and the quality of the collateral securing the loan. A second category of commercial lending involves construction or term loans on commercial income producing properties and acquisition and development loans for single family residential development. These loans are secured by real property and are generally limited to 80 percent of the value of collateral. In most cases, the Company requires personal guarantees and secondary sources of repayment. In competing with major regional and national banks, the Company is limited by lower single borrower lending limits imposed by law.
Real Estate Loans. This category supports single family residential lending. The loans are available for construction, purchase, or refinancing of residential properties. Borrowers can choose from a variety of fixed and
2
Table of Contents
adjustable rate options and terms. The Company provides customers access to long-term residential real estate loans through Bay Mortgage and its branch network, focusing on all facets of residential lending from single family homes to small multiplexes, including FHA and VA loans, construction and bridge loans. Real estate loans reflected in the loan portfolio also include loans made to commercial customers that are secured by real property.
Consumer Loans. The Company provides loans to individual borrowers for a variety of purposes, including secured and unsecured personal loans, home equity, personal lines of credit and motor vehicle loans. Consumer loans can carry significantly greater risks than other loan products, even if secured, if the collateral consists of rapidly depreciating assets such as automobiles or recreational equipment. Repossessed collateral securing a defaulted consumer loan may not provide an adequate source of repayment of the loan. Consumer loan collections are dependent on borrowers’ continuing financial stability, and are sensitive to job loss, illness and other personal factors. The Company attempts to manage the risks inherent in consumer lending by following conservative credit guidelines and underwriting practices. The Company also offers Visa credit cards to its customers.
Trust Services. Cowlitz Bank is the only bank headquartered in Cowlitz County to offer complete in-house trust services. The trust department, located in the offices of the main branch in Longview and Vancouver, Washington provide trust services to individuals, partnerships, corporations and institutions and acts as fiduciary of living trusts, estates, conservatorships and other plans. The Company believes these services add to the value of the Bank as a community bank by providing local access to services that are offered by out of the area financial institutions.
International Banking. Through its Seattle branch, the Company offers a variety of international banking services. To assist customers with import, export and other trade related needs, the Company provides commercial and standby letters of credit, foreign exchange and foreign collection services, international funds transfer capabilities, accounts receivable financing and foreign denominated accounts (euro, pounds, yen).
Internet Banking. Internet banking and cash management systems are available to both business and individual customers, providing secure access to information and services from the Company’s website. Business clients can avail themselves of a comprehensive cash management program which allows them to easily and securely move money between accounts, wire funds, receive funds, pay bills, and generally manage their financial resources. Retail customers have the ability to access account information, pay bills, and manage their accounts by way of the internet. The Company’s website address is www.cowlitzbancorporation.com and the Bank’s websites are www.cowlitzbank.com, www.bay-bank.com and www.bay-loans.com. The content of these websites is not incorporated into this document or into the Company’s other filings with the SEC.
Other Banking Products and Services. In support of its focus on personalized service, the Company offers additional products and services for the convenience of its customers. These services include a debit card program, automated teller machines at six branches, merchant services and an automated telephone banking service with 24-hour access to accounts that also allows customers to speak directly with a customer service representative during normal banking hours. The Company provides drive-through facilities at three of its branches.
Market Areas and Competition
The Company’s primary market areas in which it accepts deposits and makes loans are Cowlitz County, in southwest Washington; King County, Washington; the Portland metropolitan area in Oregon; and the surrounding counties in Washington and northwest Oregon. As a community bank, the Bank has certain competitive advantages due to its local focus, but is also more closely tied to the local community than many of its competitors, which serve a number of geographic markets. Bay Mortgage operations are concentrated in southwestern Washington.
3
Table of Contents
Commercial banking in the state of Washington and northwest Oregon is highly competitive with respect to providing banking services including making loans and attracting deposits. The Company competes with other banks, as well as with savings banks, credit unions, mortgage companies, investment banks, insurance companies, securities brokerages and other financial institutions. Banking in Washington and Oregon is dominated by several significant banking institutions which together account for a majority of the total commercial and savings bank loans and deposits in Washington and Oregon. These competitors have significantly greater financial resources and offer a greater number of branch locations (with statewide branch networks), higher lending limits, and a variety of services not offered by the Bank. The Company has attempted to offset some of the advantages of the large competitors by arranging participations with other banks for loans above its legal lending limits, as well as leveraging technology and third party arrangements to deliver financial products and better compete in targeted customer segments. The Company has positioned itself as a local alternative to larger competitors that may be perceived by customers or potential customers to be impersonal, out-of-touch with the community, or simply not interested in providing banking services to some of the target customers, by offering excellent customer service and investing in the markets it services through its business practices and community service.
In addition to larger institutions, other community banks and credit unions have been formed, expanded, or moved into the Company’s market areas and have developed a similar focus to the Company. This growing number of similar financial institutions and an increased focus by larger institutions on the Company’s market segments has led to intensified competition in all aspects of the Company’s business. Increased competitive pressure and changing customer deposit behaviors could adversely affect the Bank’s market share of deposits.
The adoption of the Gramm-Leach-Bliley Act of 1999 (the “GLB Act”) led to further competition in the financial services industry. The GLB Act eliminated many of the barriers to affiliation among providers of various types of financial services and permitted business combinations among financial service providers such as banks, insurance companies, securities or brokerage firms and other financial service providers. Additionally, the rapid adoption of financial services through the internet has reduced or even eliminated many barriers to entry by financial services providers physically located outside our market areas. For example, remote deposit services allow depository companies physically located in other geographical markets to service local businesses with minimal cost of entry. Although the Company has been able to compete effectively in the financial services business in its markets to date, there can be no assurance that it will be able to continue to do so in the future.
The financial services industry has experienced widespread consolidation over the last decade. The Company anticipates that consolidation among financial institutions in its market areas will continue and perhaps may accelerate as a result of the severe financial distress in the industry. As noted, the Company may seek acquisition opportunities in markets of strategic importance to it from time to time, if its financial condition permits. However, other financial institutions aggressively compete against the Company in the acquisition market. Some of these institutions may have greater access to capital markets, larger cash reserves and stock for use in acquisitions that is more liquid and more highly valued by the market.
Employees
As of December 31, 2009, the Company employed a total of 111 full-time equivalent employees. None of the employees are subject to a collective bargaining agreement, and the Company considers its relationships with its employees to be favorable.
Regulation and Supervision
The Company and the Bank are subject to extensive federal and state regulations that significantly affect the respective activities of the Company and the Bank and the competitive environment in which they operate. These laws and regulations are intended primarily to protect depositors and the deposit insurance fund, rather than shareholders. Proposals to change the laws and regulations governing the banking industry are frequently
4
Table of Contents
introduced in Congress, in the state legislatures and before the various bank regulatory agencies. In the current economic climate and regulatory environment, the likelihood of enactment of new banking legislation and promulgation of new banking regulations is greater than it has been in recent years. The potential impact of new laws and regulations on the Company and its bank subsidiary cannot be determined, but any such laws and regulations may materially affect the business and prospects of the Company and its subsidiary. Violation of the laws and regulations applicable to the Company and its subsidiary may result in assessment of substantial civil monetary penalties, the imposition of a consent order, and other regulatory sanctions or restrictions.
The description of the laws and regulations applicable to the Company and the Bank is not a complete description of the laws and regulations mentioned herein or of all such laws and regulations. Any change in applicable laws or regulations may have a material effect on the business and prospects of the Company and the Bank.
The Bank is a state chartered commercial bank, which is not a member of the Federal Reserve System, and is subject to primary regulation and supervision by the Department of Financial Institutions of the State of Washington (“DFI”) and by the Federal Deposit Insurance Corporation (the “FDIC”), which also insures bank deposits. The Company is subject to regulation and supervision by the Board of Governors of the Federal Reserve System (the “Federal Reserve”).
Bank Holding Company Regulation. The Company is a bank holding company within the meaning of the Bank Holding Company Act of 1956, as amended (“BHCA”) and, as such, is subject to the regulations of the Federal Reserve. Bank holding companies are required to file periodic reports with, and are subject to periodic examination by, the Federal Reserve. The Federal Reserve has issued regulations under the BHCA requiring bank holding companies to serve as a source of financial and managerial strength to their subsidiary banks. It is the policy of the Federal Reserve that, pursuant to this requirement, a bank holding company should stand ready to use its resources to provide adequate capital to fund its subsidiary banks during periods of financial stress or adversity. Additionally, under the Federal Deposit Insurance Corporation Improvement Act of 1991 (“FDICIA”), a bank holding company is required to guarantee the compliance of any insured depository institution subsidiary that may become “under-capitalized” (as defined in the statute) with the terms of any capital restoration plan filed by such subsidiary with its appropriate federal banking agency up to the lesser of (i) an amount equal to 5 percent of the institution’s total assets at the time the institution became undercapitalized, or (ii) the amount that is necessary (or would have been necessary) to bring the institution into compliance with all applicable capital standards as of the time the institution fails to comply with such capital restoration plan. Under the BHCA, the Federal Reserve has the authority to require a bank holding company to terminate any activity or relinquish control of a non-bank subsidiary (other than a non-bank subsidiary of a bank) upon the Federal Reserve’s determination that such activity or control constitutes a serious risk to the financial soundness and stability of any bank subsidiary of the bank holding company.
Subsidiary banks of a bank holding company are subject to certain other restrictions under the Federal Reserve Act and Regulation W covering transactions with affiliates generally and in particular on extensions of credit to the parent holding company or any affiliate, investments in the securities of the parent, and covering the use of such securities as collateral for loans to any borrower. These restrictions that apply may limit the Company’s ability to obtain funds from the Bank for its cash needs, including funds for payment of interest on its trust preferred securities, cash dividends and operational expenses.
Capital Adequacy Guidelines for Bank Holding Companies. The Federal Reserve has adopted capital adequacy guidelines for bank holding companies. These guidelines are similar to, although not identical with, the guidelines applicable to banks. See “FDICIA and Capital Requirements.”
Bank Regulation. The Bank is organized under the laws of the State of Washington and is subject to the supervision of the DFI, whose examiners conduct periodic examinations of state banks. Cowlitz Bank is not a member of the Federal Reserve System, so its principal federal regulator is the FDIC, which also conducts
5
Table of Contents
periodic examinations of the Bank. The Bank’s deposits are insured, to the maximum extent permitted by law, by the Deposit Insurance Fund (“DIF”) administered by the FDIC and are subject to the FDIC’s rules and regulations respecting the insurance of deposits. See “FDIC Insurance Assessments.”
Both federal and state laws extensively regulate various aspects of the banking business such as reserve requirements, truth-in-lending and truth-in-savings disclosures, equal credit opportunity, fair credit reporting, trading in securities and other aspects of banking operations. Current federal law also requires banks, among other things, to make deposited funds available within specified time periods.
Insured state-chartered banks are generally prohibited under FDICIA from engaging as principal in activities that are not permitted for national banks, unless (i) the FDIC determines that the activity would pose no significant risk to the appropriate deposit insurance fund, and (ii) the bank is, and continues to be, in compliance with all applicable capital standards. The Company believes that these restrictions do not have a material adverse effect on its current operations.
FDICIA. FDICIA requires, among other things, federal bank regulatory authorities to take “prompt corrective action” with respect to banks that do not meet minimum capital requirements. For these purposes, FDICIA establishes five capital tiers: well capitalized, adequately capitalized, undercapitalized, significantly undercapitalized, and critically undercapitalized.
The FDIC has adopted regulations to implement the prompt corrective action provisions of FDICIA. Among other things, the regulations define the relevant capital measures for the five capital categories. An institution is deemed to be “well capitalized” if it has a total risk-based capital ratio of 10 percent or greater, a Tier 1 risk-based capital ratio of 6 percent or greater, and a leverage ratio of 5 percent or greater, and is not subject to a regulatory order, agreement or directive to meet and maintain a specific capital level for any capital measure. The Federal Reserve Board classifies a bank holding company as “adequately capitalized” if it has a total risk-based capital ratio of 8 percent or greater and a Tier 1 risk-based capital ratio of 4 percent or greater. The Company and the Bank are both “under-capitalized” at December 31, 2009.
FDICIA created a statutory framework of supervisory actions indexed to the capital level of an individual institution. Institutions that are deemed to be undercapitalized may be subject to mandatory supervisory corrective actions and face restrictions on increasing its average total assets, making acquisitions, establishing branches, engaging in a new line of business, accepting or renewing brokered deposits, paying interest rates on deposits in excess of regulatory limits and making senior executive management changes without prior regulatory approval. Additional broad regulatory authority is granted with respect to the lowest two capital categories—significantly undercapitalized and critically undercapitalized—including forced mergers, ordering new elections for directors, forcing divestiture by its holding company, requiring management changes and prohibiting the payment of bonuses to senior management. Additional mandatory and discretionary regulatory actions apply to significantly undercapitalized and critically undercapitalized banks, the latter being a bank with capital at or less than 2 percent. The primary federal regulatory agency may appoint a receiver or conservator for a critically undercapitalized bank after 90 days, even if the bank is still solvent. Failure of a bank to maintain the required level of capital could result in such bank being declared insolvent and closed.
FDICIA further directs that each federal banking agency prescribe standards for depository institutions and depository institution holding companies relating to internal controls, information systems, internal audit systems, loan documentation, credit underwriting, interest rate exposure, asset growth, management compensation, a maximum ratio of classified assets to capital, minimum earnings sufficient to absorb losses, and such other standards as the agency deems appropriate.
Capital Requirements. The FDIC has adopted risk-based capital ratio guidelines to which the Bank is subject. The guidelines establish a systematic analytical framework that makes regulatory capital requirements
6
Table of Contents
more sensitive to differences in risk profiles among banking organizations. Risk-based capital ratios are determined by allocating assets and specified off-balance sheet commitments to four risk weighted categories, with higher levels of capital being required for the categories perceived as representing greater risk.
These guidelines divide a bank’s capital into two tiers. Tier 1 includes common equity, certain non-cumulative perpetual preferred stock (excluding auction rate issues) and minority interest in equity accounts of consolidated subsidiaries, less goodwill and certain other intangible assets (except mortgage servicing rights and purchased credit card relationships, subject to certain limitations). Supplementary (Tier 2) capital includes, among other items, preferred stock (cumulative perpetual and long-term, limited-life), mandatory convertible securities, certain hybrid capital instruments, term-subordinated debt and the allowance for loan and lease losses, subject to certain limitations, less required deductions. Banks are required to maintain a total risk-based capital ratio of 8 percent, of which 4 percent must be Tier 1 capital. The FDIC may, however, set higher capital requirements when a bank’s particular circumstances warrant. Banks experiencing or anticipating significant growth are expected to maintain capital ratios, including tangible capital positions, well above the minimum levels.
In addition, the FDIC has established guidelines prescribing a minimum Tier 1 leverage ratio (Tier 1 capital to adjusted total assets) of 3 percent for banks that meet certain specified criteria, including that the banks have the highest regulatory rating and are not experiencing or anticipating significant growth. All other banks are required to maintain a Tier 1 leverage ratio of not less than 4 percent. Under the terms of the Order, the Bank must achieve a Tier 1 leverage ratio of 10 percent by April 27, 2010. For a detailed discussion of the Order and management’s plans to comply with its provisions, see “Management’s Discussion and Analysis of Financial Condition and Results of Operations—Recent Developments” in Item 7 of this report.
At December 31, 2009, the Company and the Bank were under-capitalized and the regulatory capital ratios were:
| December 31, 2009 | ||||||
| Company | Bank | |||||
| Total risk-based capital to risk-weighted assets |
7.40 | % | 7.34 | % | ||
| Tier 1 capital to risk-weighted assets |
3.88 | % | 6.07 | % | ||
| Tier 1 leverage capital ratio |
2.50 | % | 3.91 | % | ||
Certain Bank level capital ratios set forth above are substantially higher than the capital ratios at the Consolidated level. This is mainly because regulatory calculations give different treatment to the $12.4 million in Trust Preferred debt proceeds. At the Company level a substantial percentage of Trust Preferred debt is excluded from regulatory capital, while it is fully included at the Bank level.
Dividends. The principal source of the Company’s cash revenues is dividends from the Bank. Under Washington law, a bank may not pay dividends in an amount greater than its retained earnings as determined by generally accepted accounting principles. In addition, DFI has the authority to require a state-chartered bank to suspend the payment of dividends. The FDIC has the authority to prohibit a bank from paying dividends if, in its opinion, the payment of dividends would constitute an unsafe or unsound practice in light of the financial condition of the bank or if it would cause a bank to become undercapitalized. Under the terms of the Order, the Bank cannot declare dividends or make distribution to Cowlitz Bancorporation without the prior written approval of the FDIC and the DFI.
In addition, a bank may not pay cash dividends if that payment could reduce the amount of its capital below that necessary to meet the adequately capitalized level in accordance with regulatory capital requirements. Also, the payment of cash dividends by the Bank must satisfy a net profits test and an undivided profits test or the Bank must obtain prior approval of its regulators before such dividend is paid. The net profits test limits the
7
Table of Contents
dividend declared in any calendar year to the net profits of the current year plus retained net income of the preceding two years. The undivided profits test limits the dividends declared to the undivided profits on hand after deducting bad debts in excess of the allowance for loan and lease losses.
Lending Limits. Under Washington law, the total loans and extensions of credit by a Washington-chartered bank to a borrower outstanding at one time may not exceed 20 percent of the bank’s Tier 1 capital. However, this limitation does not apply to loans or extensions of credit which are fully secured by readily marketable collateral having market value of at least 115 percent of the amount of the loan or the extension of credit at all times.
Branches and Affiliates. Establishment of bank branches is subject to approval of the DFI and FDIC and geographic limits established by state laws. Washington’s branch banking law permits a bank having its principal place of business in the State of Washington to establish branch offices in any county in Washington without geographic restrictions. A bank may also merge with any national or state chartered bank located anywhere in the State of Washington without geographic restrictions.
Under Oregon law, an out-of-state bank or bank holding company may merge with or acquire an Oregon state chartered bank or bank holding company if the Oregon bank, or in the case of a bank holding company, the subsidiary bank, has been in existence for a minimum of three years, and the law of the state in which the acquiring bank is located permits such merger. Branches may not be acquired or opened separately, but once an out-of-state bank has acquired branches in Oregon, either through a merger with or acquisition of substantially all of the assets of an Oregon bank, the bank may open additional branches.
The Bank is subject to provisions of the Federal Reserve Act that restrict financial transactions between banks and affiliated companies. The statute limits credit transactions between a bank and its executive officers and its affiliates, prescribes terms and conditions for bank affiliate transactions deemed to be consistent with safe and sound banking practices, and restricts the types of collateral security permitted in connection with a bank’s extension of credit to an affiliate.
FDIC Insurance Assessments. The FDIC is an independent federal agency established originally to insure the deposits, up to prescribed statutory limits, of federally insured banks and to preserve the safety and soundness of the banking industry. The FDIC has adopted a risk-based assessment system for insured depository institutions that takes into account the risks attributable to different categories and concentrations of assets and liabilities.
The Bank’s deposit accounts are insured by the FDIC to the maximum extent permitted by law. The Bank pays deposit insurance premiums to the FDIC based on a risk-based assessment system established by the FDIC for all insured institutions. Institutions considered well-capitalized and financially sound pay the lowest premiums, while those institutions that are less than adequately capitalized and of substantial supervisory concern pay the highest premiums. During 2008, assessment rates for insured institutions ranged from 5 cents per $100 assessable deposits for well-capitalized institutions with minor supervisory concerns to 43 cents per $100 of assessable deposits for undercapitalized institutions with substantial supervisory concerns. Effective April 1, 2009, assessment rates were increased and ranged from 7 cents per $100 of assessable deposits for well-capitalized institutions with minor supervisory concerns to 77.5 cents per $100 of assessable deposits for undercapitalized institutions with substantial supervisory concerns. The large premium increase was due to the Emergency Economic Stabilization Act of 2008 and the Temporary Liquidity Guarantee Program, both of which increased the deposit insurance coverage available to the Bank’s depositors. Further increases in the assessment rate or special assessments to rebuild the Deposit Insurance Fund could have a material adverse affect on the Company’s earnings, depending on the amount of the rate increase or special assessment.
Emergency Economic Stabilization Act of 2008. In October 2008, the Emergency Economic Stabilization Act of 2008 (EESA) was signed into law. The EESA temporarily revises the federal deposit insurance laws by increasing the basic deposit insurance coverage from $100,000 to $250,000 per depositor. This revision is currently effective through December 31, 2013.
8
Table of Contents
Temporary Liquidity Guarantee Program. In order to promote financial stability in the economy, the FDIC adopted the Temporary Liquidity Guarantee Program (TLGP) on October 13, 2008. Participation in the program was voluntary. However, once participation was elected, it could not be revoked. The Bank chose to participate in the Transaction Account Guarantee Program component of the TLGP. Under the Transaction Account Guarantee (TAG) Program, the FDIC will fully insure funds held in noninterest-bearing transaction accounts. Noninterest-bearing transaction accounts are ones that do not accrue or pay interest and for which the institution does not require an advance notice of withdrawal. Also covered are interest on lawyers’ trust accounts (IOLTA) and negotiable order of withdrawal (NOW) accounts with interest rates lower than 50 basis points. As of the date of this report, the TAG Program is set to expire on June 30, 2010.
Federal Deposit Insurance Reform Act of 2005. In February 2006, the Federal Deposit Insurance Reform Act of 2005 and the Federal Deposit Insurance Reform Conforming Amendments Act of 2005 (collectively, the Reform Act) were signed into law. The Reform Act revised the laws concerning federal deposit insurance by making the following changes: (i) merging the Bank Insurance Fund and the Savings Association Insurance Fund into a new fund, the Deposit Insurance Fund (DIF), effective March 31, 2006; (ii) increasing the deposit insurance coverage for certain retirement accounts to $250,000 effective April 1, 2006; (iii) beginning in 2010, deposit insurance coverage on individual accounts may be indexed for inflation; (iv) the FDIC will have more discretion in managing deposit insurance assessments; and (v) eligible institutions receive a one-time initial assessment credit.
The Reform Act authorized the FDIC to revise the risk-based assessment system. Accordingly, insurance premiums are based on a number of factors, including the risk of loss that insured institutions pose to the DIF. The Reform Act replaced the minimum reserve ratio of 1.25 percent with a range of between 1.15 percent and 1.50 percent for the DIF, depending on projected losses, economic changes and assessment rates at the end of each calendar year. In addition, the FDIC is no longer prohibited from charging banks in the lowest risk category when the reserve ratio premium is greater than 1.25 percent.
In November 2006, the FDIC adopted changes to its risk-based assessment system. Under the new system, the FDIC evaluates an institution’s risk based on supervisory ratings for all insured institutions, financial ratios for most institutions and long-term debt issuer ratings for certain large institutions. In addition to deposit insurance assessments, the FDIC is authorized to collect assessments against insured deposits to be paid to the Finance Corporation (FICO) to service FICO debt incurred during the 1980’s. The FICO assessment rate is adjusted quarterly. The average annual assessment rate in 2009 was 1.04 cents per $100 for insured deposits.
Gramm-Leach-Bliley Act. On November 12, 1999, the Gramm-Leach-Bliley Act (the “GLB Act”) was signed into law, which significantly reformed various aspects of the financial services business. Among other things, the GLB Act:
| • | established a new framework under which bank holding companies and banks can own securities firms, insurance companies and other financial companies; |
| • | provided consumers with new protections regarding the transfer and use of their non-public personal information by financial institutions; and |
| • | changed the Federal Home Loan Bank (“FHLB”) system in numerous ways revising the manner of calculating the Resolution Funding Corporation obligations payable by the FHLB and broadening the purposes for which FHLB advances may be used. |
The GLB Act also includes provisions to protect consumer privacy by prohibiting financial services providers, whether or not affiliated with a bank, from disclosing non-public personal, financial information to unaffiliated parties without the consent of the customer, and by requiring annual disclosure of the provider’s privacy policy.
9
Table of Contents
Community Reinvestment Act. The Community Reinvestment Act (“CRA”) requires financial institutions regulated by the federal financial supervisory agencies to ascertain and help meet the credit needs of their delineated communities, including low-income and moderate-income neighborhoods within those communities, while maintaining safe and sound banking practices. The regulatory agency assigns one of four possible ratings to an institution’s CRA performance and is required to make public an institution’s rating and written evaluation. The four possible ratings are “outstanding,” “satisfactory,” “needs to improve” and “substantial non-compliance.”
Many factors play a role in assessing a financial institution’s CRA performance. The institution’s regulator must consider its financial capacity and size, legal impediments, local economic conditions and demographics and the competitive environment in which it operates. The evaluation does not rely on absolute standards and financial institutions are not required to perform specific activities or to provide specific amounts or types of credit.
The Company’s most recent rating under CRA is “satisfactory.” This rating reflects the Company’s commitment to meeting the credit needs of the communities it serves. Although the Company strives to maintain a satisfactory or higher rating, no assurance can be given that the Company will maintain this rating in the future. If the Company’s CRA rating were to fall below “satisfactory” it may inhibit its ability to obtain regulatory approval for acquisitions or expansion.
Sarbanes-Oxley Act of 2002. The Sarbanes-Oxley Act of 2002 addressed public company corporate governance, auditing, accounting, executive compensation, and enhanced and timely disclosure of corporate information. The Sarbanes-Oxley Act represents significant federal involvement in matters traditionally left to state regulatory systems, such as the regulation of the accounting profession, and to state corporate law, such as the relationship between a board of directors and management and between a board of directors and its committees.
The Sarbanes-Oxley Act and related SEC regulations provide for, among other matters:
| • | a prohibition on personal loans by Cowlitz to its directors and executive officers except loans in the ordinary course of business made by the Bank; |
| • | independence requirements for Board audit committee members and the Company’s auditors; |
| • | certification of Exchange Act reports by the chief executive officer and the chief financial officer; |
| • | disclosure of off-balance sheet transactions; |
| • | expedited reporting of stock transactions by insiders; |
| • | internal and disclosure controls and procedures requirements; and |
| • | increased criminal penalties for violations of securities laws. |
The Sarbanes-Oxley Act also requires:
| • | management to establish, maintain and evaluate disclosure controls and procedures; |
| • | report on its annual assessment of the effectiveness of internal controls over financial reporting; and |
| • | a company’s auditor to attest to management’s assessment of internal controls. |
The SEC has adopted regulations to implement various provisions of the Sarbanes-Oxley Act, including disclosures in periodic filings pursuant to the Exchange Act. Also in response to the Sarbanes-Oxley Act, NASDAQ adopted new standards for listed companies. In 2007, the SEC extended the requirement for a company’s auditor to attest to management’s assessment of internal controls for a small company, as defined by the SEC. For 2008 and 2009, the Company met the definition of a small company and, therefore, did not have its external auditor attest to management’s assessment of internal controls.
10
Table of Contents
Anti-Terrorism Legislation. The Uniting and Strengthening America by Providing Appropriate Tools Required to Intercept and Obstruct Terrorism Act (“USA Patriot Act”), enacted in 2001:
| • | prohibits banks from providing correspondent accounts directly to foreign shell banks; |
| • | imposes due diligence requirements on banks opening or holding accounts for foreign financial institutions or wealthy foreign individuals; |
| • | requires financial institutions to establish an anti-money-laundering (“AML”) compliance program; and |
| • | generally eliminates civil liability for persons who file suspicious activity reports. |
The USA Patriot Act also increases governmental powers to investigate terrorism, including expanded government access to account records. The Department of the Treasury is empowered to administer and make rules to implement the Act, which to some degree, affects the Bank’s record-keeping and reporting expenses. Should the Bank’s AML compliance program be deemed insufficient by federal regulators, the Company would not be able to grow through acquiring other institutions or opening de novo branches.
Additional Matters. The Company and the Bank are subject to additional regulation of their activities, including a variety of consumer protection regulations affecting lending, deposit and collection activities and regulations affecting secondary mortgage market activities. The earnings of financial institutions, including the Company and the Bank, are also affected by general economic conditions and prevailing interest rates, both domestic and foreign and by the monetary and fiscal policies of the U.S. Government and its various agencies, particularly the Federal Reserve.
Additional legislation and administrative actions affecting the banking industry may be considered by the United States Congress, the Washington Legislature and various regulatory agencies, including those referred to above. It cannot be predicted with certainty whether such legislation or administrative action will be enacted or the extent to which the banking industry in general or the Company and the Bank in particular would be affected.
| Item 1A. | Risk Factors |
The Company may not be able to continue to operate as a going concern.
The Company has determined that significant additional sources of capital will likely be required to continue operations in the future. Further, the Company’s and the Bank’s regulators are continually monitoring capital adequacy and liquidity and evaluating the Bank’s ability to continue to operate in a safe and sound manner. The Bank’s regulators could, if deemed warranted, take further actions, including the assumption of control of the Bank, to protect the interests of the deposits insured by the FDIC. There can be no assurance that the Company will be able to raise capital to satisfy regulatory requirements. The uncertainty regarding the Company’s ability to obtain additional capital and to comply with regulatory requirements raises doubt about the Company’s ability to continue as a going concern. The consolidated financial statements included under Part II, Item 8 of this report, however, do not include any adjustments that may result as an outcome of these uncertainties.
Capital necessary to absorb losses and return the Bank to compliance with regulatory standards may not be available.
The Company and the Bank are required by federal regulatory authorities to maintain adequate levels of capital to support operations. The Company is exploring alternatives to raise additional capital to support operations and absorb loan losses, but the Company’s ability to raise additional capital will depend on conditions in the capital markets, which are outside the Company’s control, and on the Company’s financial performance and prospects. Accordingly, the Company cannot be certain of its ability to raise additional capital. The Bank’s
11
Table of Contents
regulatory capital ratios are currently categorized as “under-capitalized.” In addition, we entered into a Consent Order with the FDIC and Washington Department of Financial Institutions that requires the Bank to increase capital ratios above the “well-capitalized” level and if the Company and the Bank cannot raise capital to such levels the Bank could face additional adverse regulatory action. If we cannot raise additional capital when needed, our financial condition and our ability to maintain or improve our capital position to support our operations and to continue as a going concern could be materially impaired.
The Company and the Bank are subject to various additional regulatory requirements due to our current condition that impose significant burdens and costs.
In light of the challenging operating environment over the past eighteen months, along with the Bank’s elevated level of nonperforming assets, delinquencies and adversely classified assets, the Company and the Bank have been subject to increased regulatory requirements and heightened scrutiny by regulators, and the Bank has agreed to the entry of a Consent Order by the FDIC and DFI. Such agreements place limitations on our business and adversely affect our ability to implement our business plans, including our growth strategy. Bank management is required to commit significant time and resources to compliance with the Consent Order. The Bank’s lending activities and the rates the Bank pays to attract retail deposits in its local markets are limited. The Bank is required to reduce levels of nonperforming assets to a level acceptable by the FDIC. Selling loans or other real estate owned at this point in today’s distressed real estate markets might not result in maximizing the price that might otherwise be received for the underlying properties. In addition, if such restrictions are also imposed upon other institutions that operate in the Bank’s markets or the FDIC is disposing of assets acquired from failed institutions, our ability to sell assets at reasonable prices could be further diminished. The FDIC and DFI are also requiring the Bank to reduce the level of classified assets, increase capital, and address other criticisms from our regulatory examination. The added costs of compliance with additional regulatory requirements could have an adverse effect on our financial condition and earnings. Failure to comply with the Consent Order could result in additional regulatory burdens, further restrictions on our operations and significant compliance costs.
Our access to funding to meet our liquidity needs may be limited.
Liquidity is crucial to the operation of the Company and the Bank. Liquidity risk is the potential that we will be unable to fund increases in assets or meet payment obligations, including obligations to depositors, as they become due because of an inability to obtain adequate funding or liquidate assets. For example, funding illiquidity may arise if we are unable to attract core deposits or are unable to renew at acceptable pricing long-term borrowings or short-term borrowings from the overnight inter-bank market, the Federal Home Loan Bank System, brokered deposits, or the Federal Reserve discount window. As a result of the Bank’s regulatory capital falling below the requirements for well-capitalized status as of December 31, 2009, and the Bank’s Consent Order, the Bank is unable to issue, renew or rollover brokered certificates of deposit and faces regulatory limits in the rates it can pay to depositors. At December 31, 2009, the Bank had $163.1 million of brokered deposits maturing through 2014.
Due to decreases in our regulatory capital levels, we have limited access to borrow funds unless we provide additional collateral to secure our repayment obligations. As with many community banks, correspondent banks have withdrawn or reduced unsecured lines of credit or now require collateralization for the purchases of federal funds in a short-term basis due to the current adverse economic environment. At December 31, 2009, the Bank had one $7.3 million collateralized line of credit with a correspondent bank. We may also experience illiquidity due to unexpected cash outflows on committed lines of credit or financial guarantees or due to unexpected events. The increasingly competitive retail deposit environment increases liquidity risk (and increases our cost of funds) as increasingly sophisticated depositors move funds more frequently in search of higher rates or better opportunities. The Bank’s liquidity may be negatively impacted by the Consent Order and public perception of banks. The Bank participates in the FDIC’s Transaction Account Guarantee (TAG) Program, which is set to expire on June 30, 2010. The TAG Program provides unlimited deposit insurance to deposits held in qualifying
12
Table of Contents
noninterest-bearing transaction accounts, and customers whose deposits are insured under the TAG Program may reassess their deposit levels after June 30, 2010. If the Bank is unable to control liquidity risks, replace brokered deposits and maintain current liquidity levels, there may be materially adverse effects on our results of operations and financial condition.
Difficult market conditions have adversely affected the financial services industry.
For more than twenty four months capital and credit markets have experienced unprecedented volatility and disruption. Dramatic declines in the housing market over the past year, with falling home prices and increasing foreclosures and unemployment, have negatively impacted the credit performance of mortgage loans and resulted in significant write-downs of asset values by financial institutions, including government-sponsored entities and major commercial and investment banks. These write-downs have caused many financial institutions to seek additional capital, to merge with larger and stronger institutions and, in some cases, to fail. Reflecting concern about the stability of the financial markets generally and the strength of counterparties, many lenders and institutional investors have reduced or ceased providing funding to borrowers, including to other financial institutions. This market turmoil and tightening of credit have led to an increased level of commercial and consumer loan delinquencies and defaults, lack of consumer confidence, increased market volatility and widespread reduction of business activity generally. The resulting economic pressures on consumers and lack of confidence in the financial markets have adversely affected the Bank’s business, financial condition and results of operations. The Company does not expect that the difficult conditions in the financial markets are likely to improve in the near future. A worsening of these conditions would likely exacerbate the adverse effects of these difficult market conditions on the Bank and others in the financial institutions industry. In particular, the Bank may face the following risks in connection with these events:
| • | Additional legislation and increased regulation; |
| • | Impaired ability to assess the creditworthiness of its customers if the models and approaches the Bank uses to select, manage, and underwrite its loans become less predictive of future behaviors and performance; |
| • | The process the Bank uses to estimate losses inherent in its credit exposure requires difficult, subjective, and complex judgments, including forecasts of economic conditions and how these economic predictions might impair the ability of the Bank’s borrowers to repay their loans, which may no longer be capable of accurate estimation which may, in turn, impact the reliability of the process; |
| • | The Bank’s ability to engage in routine funding transactions could be adversely affected by the actions and commercial soundness of other financial institutions and government sponsored entities; |
| • | Increased competition due to intensified consolidation of the financial services industry; and |
| • | If current levels of market disruption and volatility continue or worsen, there can be no assurance that the Company will not experience an adverse effect, which may be material, on its ability to access capital and on its business, financial condition and results of operations. |
Most of the Bank’s assets are loans, which if not repaid would result in losses to the Bank.
The Bank is subject to credit risk, which is the risk of losing principal or interest due to borrowers’ failure to repay loans in accordance with their terms. Underwriting and documentation controls do not always work effectively. A further downturn in the economy or the real estate market in the market areas or a rapid increase in interest rates could have a negative effect on collateral values and borrowers’ ability to repay. To the extent loans are not paid timely by borrowers, the loans are placed on nonaccrual status, thereby reducing interest income. Further, under these circumstances, an additional provision for loan and lease losses or unfunded commitments may be required.
13
Table of Contents
The Bank has a significant concentration in real estate loans and continued deterioration in the economy of the markets served or the real estate market specifically could significantly harm its business and prospects for growth.
As of December 31, 2009, the loan portfolio consisted of:
| • | 51 percent commercial real estate loans |
| • | 12 percent construction, land development and other land loans |
| • | 11 percent residential real estate loans |
| • | 5 percent multi-family real estate loans |
| • | 20 percent commercial and industrial; and |
| • | 1 percent installment and other loans. |
As of December 31, 2009, approximately 79% of the Bank’s loan portfolio is secured by real estate, the majority of which is commercial real estate. As a result of increased levels of commercial and consumer delinquencies and declining real estate values, the Bank has experienced increasing levels of net charge-offs and allowances for loan and lease reserves. Continued increases in commercial and consumer delinquency levels or continued declines in real estate market values would require increased net charge-offs and increases in the allowance for loan and lease losses, which could have a material adverse effect on the Bank’s business, financial condition and results of operations and prospects.
A substantial amount of the Company’s real property collateral is located in southwest Washington, the Portland, Oregon metropolitan area and the Puget Sound area of Washington, and a further downturn in the real estate markets or prolonged recessionary climate could harm the Company’s business.
The effects of the current economic recession have been particularly severe in the Company’s primary market areas. The States of Washington and Oregon and certain local governments in the market areas presently face fiscal challenges the long term impact of which on State or local economies cannot be predicted. Significant declines in housing prices and property values have been particularly severe. A further downturn in economic conditions or a prolonged delay in recovery could result in the following consequences, any of which could have a material adverse effect on the business: loan delinquencies may increase; problem assets and foreclosures may increase resulting in further price pressures on valuations generally; demand for products and services may decrease; low cost or noninterest-bearing deposits may decrease; and collateral for loans made by the Bank, especially real estate, may decline in value, in turn reducing customers’ borrowing power, and reducing the value of assets and collateral associated with existing loans.
As a financial services company, our business and earnings are significantly affected by general business and economic conditions, particularly in the real estate industry, and accordingly, our business and earnings could be further harmed in the event of a continuation or deepening of the current U.S. recession or further market deterioration or disruption.
Our business and earnings are sensitive to general business, economic and market conditions in the United States. These conditions include changes in short-term and long-term interest rates, inflation, deflation, fluctuation in the real estate and debt capital markets, developments in national and regional economies and changes in government policies and regulations. Our business and earnings are particularly sensitive to economic and market conditions affecting the real estate industry because much of our loan portfolio consists of commercial real estate, construction and residential loans. While generally containing lower risk than unsecured loans, commercial real estate and construction loans generally involve higher credit risk than conventional single-family residential loans. Such loans also generally involve larger individual loan balances. In addition, real estate construction loans may be affected to a greater extent than residential loans by adverse conditions in real
14
Table of Contents
estate markets or the economy because many real estate construction borrowers’ ability to repay their loans is dependent on successful development of their properties, as well as the factors affecting residential real estate borrowers. Risk of loss on a construction loan depends largely upon whether the initial estimate of the property’s value at completion of construction equals or exceeds the cost of property construction (including interest) and the availability of permanent take-out financing. During the construction phase, a number of factors can result in delays and cost overruns. Construction and commercial real estate loans also involve greater risk because they may not be fully amortizing over the loan period, but have a balloon payment due at maturity. A borrower’s ability to make a balloon payment may depend on the borrower being able to refinance the loan, timely sell the underlying property or liquidate other assets. The current U.S. recession has resulted in a reduction in the value of the real estate assets securing a large portion of the loans that we hold. An increasing number of borrowers have become delinquent or defaulted on their loans, thereby adversely affecting our results of operations and financial condition. A further increase in the number of delinquencies or defaults would result in higher levels of nonperforming assets, net charge-offs and provision for loan losses, adversely affecting our results of operations and financial condition.
Negative public opinion could damage our reputation and adversely impact our earnings and liquidity.
Reputational risk, or the risk to our business, earnings, liquidity, and capital from negative public opinion could result from our actual or alleged conduct in a variety of areas, including legal and regulatory compliance, lending practices, corporate governance, litigation, ethical issues, or inadequate protection of customer information. We expend significant resources to comply with regulatory requirements. Failure to comply could result in reputational harm or significant legal or remedial costs. Damage to our reputation could adversely affect our ability to retain and attract new customers, and adversely impact our earnings, liquidity and stock price.
Recent and proposed legislation in response to market and economic conditions may not stabilize the financial services industry or the U.S. economy.
In response to the financial crisis affecting the banking system and financial markets over the past two years, new legislation and regulation affecting the Company and the Bank has been adopted, in particular the Emergency Economic Stabilization Act of 2008 (EESA), the American Recovery and Reinvestment Act of 2009 (ARRA), and their implementing regulations, as well as actions by the FDIC. The long term effect of these actions cannot be predicted at this time. A number of programs have been and are being developed and implemented under EESA and ARRA. The failure of EESA and ARRA to ultimately improve the condition of the U.S. banking system could significantly adversely impact our business, our financial condition, our financial results, our access to funding or capital as well as the trading price of our common stock or other instruments.
We may face increased regulation of our industry.
In addition to EESA, ARRA, related regulations and FDIC actions, we expect Congress, the State of Washington, the FDIC, DFI and Federal Reserve to implement new initiatives that could have a detrimental impact on the Company and the Bank. Compliance with such regulation may increase our costs and limit our ability to pursue business opportunities. Also, participation in specific programs may subject us to additional restrictions. The financial services industry is heavily regulated and additional laws and regulations are often considered at the state and federal level. These laws and regulations are primarily intended to protect customers, depositors and the deposit insurance fund, rather than shareholders. The Bank is a Washington state-chartered commercial bank whose primary regulator is the Washington Department of Financial Institutions. The Bank is also subject to the supervision by and the regulations of the FDIC, which insures bank deposits. The Company is subject to regulation and supervision by the Board of Governors of the Federal Reserve System, the SEC and NASDAQ. Federal and state regulations may place banks at a competitive disadvantage compared to less regulated competitors such as finance companies, credit unions, mortgage banking companies and leasing companies. If we receive less than satisfactory results on regulatory examinations, we could be restricted from
15
Table of Contents
making acquisitions, adding new branches, developing new lines of business or otherwise continuing our growth strategy for a period of time. Future changes in federal and state banking regulations could adversely affect our operating results and ability to continue to compete effectively.
If we are able to raise additional capital, the terms on which we can raise capital may adversely affect existing shareholders.
The Company needs to raise additional capital, and any equity financing, if available at all, is expected to significantly dilute the Company’s existing shareholders. In the event additional capital is unavailable on acceptable terms, we may take steps to preserve capital, including possibly slowing our lending activities and new loan commitments, selling certain assets or increasing loan participations.
The holding company relies on dividends from the Bank to meet its cash obligations.
Dividends paid by the Bank to the Company provide cash flow used to service interest payments on trust preferred securities. Various statutory provisions restrict the amount of dividends the Bank can pay to the Company without regulatory approval. The Bank is currently restricted from paying dividends and we do not expect the Bank to be able to pay dividends in the foreseeable future. If the Bank is unable to pay dividends to the Company, the Company may not be able to service its debt or pay its obligations. The inability to receive dividends from the Bank would adversely affect the business, financial condition, results of operations and prospects.
We are subject to restrictions on our ability to declare or pay dividends on and repurchase shares of our common stock.
We previously announced that we would defer, as permitted under the terms of indentures, interest payments on junior subordinated debentures issued in connection with trust preferred securities. We are permitted to defer such interest payments for up to 20 consecutive quarters, but during a deferral period we are prohibited from making dividend payments on our capital stock. In addition, our ability to pay dividends, and the Bank’s ability to pay dividends to us, is limited by regulatory restrictions and the need to maintain sufficient capital. We are currently restricted from paying dividends unless we receive prior regulatory approval and we are subject to formal regulatory restrictions that will continue to prohibit us from declaring or paying any dividend without prior approval of banking regulators. Although we can seek to obtain a waiver of such prohibition, we would not expect to be granted such waiver or to be released from this obligation until our financial performance improves significantly. Therefore, we may not be able to make payments of dividends in the future.
The value of certain securities in our investment securities portfolio may be negatively affected by disruptions in the market for these securities.
The market for certain investment securities held within our investment portfolio has over the past year become more volatile. The volatile market may detrimentally affect the value of these securities, such as through reduced valuations due to the perception of heightened credit and liquidity risks, in addition to interest rate risk typically associated with these securities. There can be no assurance that the declines in market value associated with these disruptions will not result in other-than-temporary or permanent impairments of these assets, which would lead to accounting charges that could have a material adverse effect on the Company’s net income and capital levels.
Market and other constraints on our construction loan origination volumes are expected to lead to decreases in the Company’s interest and fee income that are not expected to be offset by reductions in our noninterest expenses.
Due to existing conditions in housing markets in the areas where we operate and other factors, management projects our construction loan originations to be materially constrained throughout 2010. This will lower interest
16
Table of Contents
income and fees generated from this part of our business. Unless this revenue decline is offset by other areas of our operations, our total revenues may decline relative to our total noninterest expenses. Management expects that it will be difficult to find new revenue sources in the near term to completely offset expected declines in our interest income.
The Company is extremely sensitive to the economy of the Pacific Northwest.
We operate primarily in Cowlitz County, Washington, the Seattle/Bellevue metropolitan area, and the Vancouver, Washington and Portland, Oregon metropolitan area. Local economic conditions in these areas have a significant impact on:
| • | the ability of our customers to repay loans; |
| • | the value of collateral securing loans; |
| • | the demand for our products and services; and |
| • | the stability of deposits that create liquidity to support lending activities. |
Deteriorating real estate market conditions and an economic downturn in the Pacific Northwest have negatively affected our business. Worsening conditions in the Pacific Northwest real estate markets could continue to adversely affect our borrowers’ ability to repay as well as affect the value of the collateral underlying our loans, resulting in an adverse effect on the Company’s financial condition or results of operations.
The Bank has increased levels of other real estate owned (“OREO”).
Many of our loans are secured by real estate located in Washington and Oregon. A decline in the real estate market could lead to a decrease in the value of our OREO. We foreclose on and take title to the real estate serving as collateral for many of our loans as part of our business. Increased OREO balances lead to greater expenses as we incur costs to manage and dispose of the properties. We expect that our earnings in 2010 will be negatively affected by various expenses associated with OREO, including personnel costs, insurance and taxes, completion and repair costs, and other costs associated with property ownership, as well as by the funding costs associated with assets that are tied up in OREO. Any decrease in market prices may lead to OREO write downs, with a corresponding expense in our income statement.
Interest rates are subject to constant, often unpredictable changes and could have an adverse effect on our earnings.
Interest and fees on loans and securities, net of interest paid on deposits and borrowings, are a large part of the Company’s net income. Interest rates are key drivers of net interest margin and are subject to many factors beyond the control of management. As interest rates change, net interest income is affected. Rapid increases in interest rates in the future could result in interest expense increasing faster than interest income because of mismatches in financial instrument maturities. Rapid decreases in interest rates could result in interest income decreasing faster than interest expense, for example, if management is unable to match decreases in earning assets yields, with reduced rates paid on deposits or borrowings. Periods of low market interest rates, such as exist today, has adversely affected our net interest spread and net interest income because our earning assets yield decreases during a time that our cost of interest-bearing liabilities is already low and cannot be reduced further. Further, substantially higher interest rates generally reduce loan demand and may result in slower loan growth, particularly in construction lending. A rapid rise in interest rates could also reduce debt service coverage ratios of borrowers. Decreases or increases in interest rates could have a negative effect on the spreads between the interest rates earned on assets and the rates of interest paid on liabilities, and therefore decrease net interest income. For more information on this topic see “Quantitative and Qualitative Disclosures about Market Risk.”
17
Table of Contents
Our allowance for loan losses may not be adequate.
We maintain an allowance for estimated loan losses that we believe is adequate for absorbing the inherent losses in our loan portfolio. Management determines the provision for loan losses based on a continual evaluation of lending concentrations, specific credit risks, past loan loss experience, loan portfolio and collateral quality, and relevant economic, political and regulatory conditions. The amount of future losses is susceptible to changes in economic, operating, and other conditions, including changes in interest rates and deteriorating values in underlying collateral (much of which consists of real estate) that may be beyond our control, and such losses may exceed the allowance for estimated loan losses. Although management believes that the allowance for estimated loan losses is adequate to absorb any inherent losses on existing loans that may become uncollectible, there can be no assurance that the allowance will prove sufficient to cover actual loan losses in the future. Significant increases to the provision for loan losses may be necessary if our assumptions are incorrect or material adverse changes in general economic conditions occur or the performance of our loan portfolio deteriorates. An extended recession or further weakening of the economy or a specific industry sector or a rapid change in market rates could adversely affect our borrowers’ ability to repay loans. Additionally, banking regulators, as an integral part of their supervisory function, periodically review the allowance for estimated loan losses. If these regulatory agencies require us to increase the allowance for estimated loan losses, it could have a negative effect on our results of operations and financial condition.
The Company’s common stock may not qualify for listing on the NASDAQ Capital Market.
On March 3, 2010, the Company received notice from NASDAQ that the Company’s stock could be delisted from NASDAQ because of the failure to meet a standard requiring a minimum of 500,000 publicly held shares. If the Company’s shares are subject to delisting from the NASDAQ Capital Market, there is no assurance that a liquid and efficient market for Cowlitz Bancorporation common stock will be available or develop. Although the shares may be eligible for trading on other exchanges, such as the “OTC Bulletin Board,” it is possible that the ability of a selling shareholder to realize the best market price will be impeded as the result of wider bid-ask spreads.
Increases in deposit insurance premiums and special FDIC assessments will reduce the Company’s earnings.
Beginning in late 2008, the economic environment caused higher levels of bank failures, which dramatically increased FDIC resolution costs and led to a significant reduction in the Deposit Insurance Fund. As a result, the FDIC has significantly increased the initial base assessment rates paid by financial institutions for deposit insurance. The base assessment annual rate was increased by seven basis points (seven cents for every $100 of deposits) for the first quarter of 2009. Effective April 1, 2009, initial base assessment rates were changed to range from 12 basis points to 45 basis points across all risk categories with possible adjustments to these rates based on certain debt-related components. These increases in the base assessment rate have increased the Company’s deposit insurance costs and negatively impacted earnings. In addition, in May 2009, the FDIC imposed a special assessment on all insured institutions due to recent bank and savings association failures. The emergency assessment amounted to five basis points on each institution’s assets minus Tier 1 capital as of June 30, 2009, subject to a maximum equal to 10 basis points times the institution’s assessment base. The FDIC may impose additional special assessments in the future. The Company’s FDIC deposit insurance expense for 2009 was $2.0 million compared with $378,000 in 2008 and $103,000 in 2007.
The Bank’s investment in FHLB stock may become impaired.
As of December 31, 2009, the Bank held $1.2 million of FHLB stock as required under certain borrowing agreements. During the first quarter of 2009, the FHLB indicated that its ability to pay future dividends was uncertain due to reduction of its retained earnings resulting from the recognition of investment security impairments. The valuation of the FHLB stock with the Bank may become impaired if the FHLB is unable to pay a cash dividend or continues to experience significant losses for an extended period. During 2009, the Company did not recognize any dividend income from FHLB stock.
18
Table of Contents
We rely on the Federal Home Loan Bank (“FHLB”) of Seattle as a source of liquidity.
The Company is highly dependent on the FHLB of Seattle to provide a source of wholesale funding for immediate liquidity and borrowing needs. Changes or disruptions to the FHLB of Seattle or the FHLB system in general, may materially impair the Company’s ability to meet its growth plans or to meet short and long term liquidity demands. Recently, the FHLB of Seattle announced that it met all minimum regulatory capital requirements as of September 30, 2009. However, the Federal Housing Finance Agency exercised its discretionary authority to reaffirm FHLB of Seattle’s “under-capitalized” classification as it had at the end of the quarters ended March 31, 2009 and June 30, 2009. The Federal Housing Finance Agency action was reportedly taken because of the possibility that modest declines in the values of FHLB of Seattle’s private-label mortgage-backed securities could cause its risk-based capital to fall below the minimum requirements. While the FHLB of Seattle has announced it does not anticipate that additional capital is immediately necessary, and believes that its capital level is adequate to support realized losses in the future, the FHLB of Seattle could require its members, including the Company, to contribute additional capital in order to return the FHLB of Seattle to compliance with capital guidelines. At December 31, 2009, the Company maintained a line of credit with the FHLB of Seattle for 20 percent of the Bank’s total assets, subject to collateral requirements. At December 31, 2009, $55.0 million of the line of credit was available for additional borrowings.
We may be subject to environmental liability risk associated with lending activities.
A significant portion of our loan portfolio is secured by real property. In the ordinary course of business, we may foreclose on and take title to properties securing loans. There is a risk that hazardous or toxic substances will be found on these properties, in which case we may be liable for remediation costs and related personal injury and property damage. Compliance with environmental laws may require the Bank to incur substantial expenses and may materially reduce the affected property’s value or limit our ability to use or sell the affected property. Environmental indemnifications obtained from borrowers and their principals or affiliates may not adequately compensate the Bank for losses related to environmental conditions. The remediation costs and financial liabilities associated with environmental conditions could have a material adverse effect on our financial condition and results of operations.
We rely on our information technology and communications systems to conduct our business.
We rely heavily on communications, electricity, and information systems to conduct our business. In addition, we rely on third parties to provide key components of our infrastructure, including loan, deposit and general ledger processing, internet connections, and network access. Any disruption in service of these key components could adversely affect our ability to deliver products and services to our customers and otherwise to conduct our operations. Furthermore, security breaches of our information systems or data, whether managed by us or by third parties, could harm our reputation or cause a decrease in the number of customers that choose to do business with us. Security breaches could also subject the Bank to additional regulatory scrutiny and expose the Bank to civil litigation and possible financial liability.
The financial services industry is extremely competitive.
The Company competes with well-established, large banks based outside of the region, community banks, credit unions, thrift institutions, investment banking firms, insurance companies, payday loan offices and mortgage lenders for depositors and borrowers. Management believes the most significant competitive factor is customer service, in addition to competitively priced loans and deposits, for structure, branch locations and the range of banking products and services offered.
Offices of the major financial institutions have competitive advantages over the Company in that they have high public visibility, may offer a wider variety of products and are able to maintain advertising and marketing activities on a much larger scale than the Company can economically maintain. Since single borrower lending
19
Table of Contents
limits imposed by law are dependent on the capital of the institution, the branches of larger institutions with substantial capital bases also have an advantage with respect to loan applications that are in excess of the Company’s legal lending limits.
We are currently in a particularly competitive market for low cost deposits, which has led to increase pressure on our deposit balances and net interest margin. In competing for deposits, the Company is subject to certain limitations not applicable to non-bank financial institution competitors. In Cowlitz County, the main source of competition for deposits is the relatively large number of credit unions. Large new entrants into the deposit market, such as GMAC, American Express and Morgan Stanley, have much greater resources than we do and a history of competing aggressively in consumer and business markets.
Federal and State regulations applicable only to banks and bank holding companies also place banks at a competitive disadvantage compared to less regulated competitors such as finance companies, credit unions, mortgage banking companies and leasing companies. Although the Company has been able to compete effectively in its market area in the past, there can be no assurance that it will be able to continue to do so. With significant competition in the Company’s market areas, there can be no assurance that the Company can continue to attract significant loan and deposit customers. The inability to attract these customers could have an adverse effect on the Company’s financial position and results of operations.
We may not be able to attract or retain key banking employees.
We strive to attract and retain key banking professionals, management and staff. Competition to attract the best professionals in the industry can be intense which will limit our ability to hire new professionals. Banking related revenues and net income could be adversely affected in the event of the unexpected loss of key personnel.
Our business may be harmed by adverse events at other financial institutions.
Financial institutions are interrelated as a result of trading, clearing, correspondent banking, counterparty, and other relationships and because of regulatory factors. We enter into transactions with financial services companies, including commercial banks and correspondent banks. Many of these transactions expose the Company and the Bank to credit and bankruptcy risk in the event of a default or bankruptcy by a counterparty. The Bank may also be negatively impacted by the failure of other banks. For example, as a depository of public funds, the Bank will be assessed, and the Bank is statutorily obligated to pay, a pro rata share of the losses of public funds held at a failed public depository in Oregon and Washington. In addition, assessments the Bank pays to the FDIC and others, including deposit insurance premiums, will increase even further in the event of bank failures or other adverse events affecting the banking system generally or the Bank in particular.
Recently, the FHLB of Seattle announced that it did not meet minimum regulatory capital requirements, due to the deterioration in the market value of their mortgage-backed securities portfolio. As a result, the FHLB of Seattle cannot pay a dividend on their common stock and it cannot repurchase or redeem common stock. While the FHLB of Seattle has announced it does not anticipate that additional capital is immediately necessary, nor does it believe that its capital level is inadequate to support realized losses in the future, the FHLB of Seattle could require its members, including Cowlitz Bank, to contribute additional capital in order to return the FHLB of Seattle to compliance with capital guidelines.
We are highly dependent on the FHLB of Seattle to provide the primary source of wholesale funding for immediate liquidity and borrowing needs. The failure of the FHLB of Seattle or the FHLB system in general, may materially impair our ability to meet our growth plans or to meet short and long term liquidity needs. Should the FHLB of Seattle fail, we anticipate that our investment in the FHLB’s common stock would be “other-than-temporarily” impaired and may have no value.
20
Table of Contents
Changes in accounting standards may impact how we report our financial condition and results of operations.
Our accounting policies and methods are fundamental to how we report our financial condition and results of operations. Some of these policies require use of estimates and assumptions that may affect the value of our assets, liabilities and financial results. Periodically, new accounting standards are imposed or existing standards are revised. These changes can be difficult to predict and can materially impact how we record and report our financial condition and results of operations.
| Item 1B. | Unresolved Staff Comments |
None.
| Item 2. | Properties |
The Company owns its main office space in Longview, Washington, occupying approximately 27,500 square feet. The Company owns branches in Kelso and Kalama, Washington. All other facilities are leased. Six of these banking offices have automated teller machines and three provide drive-up services. The following are all of the Company’s locations at December 31, 2009.
| Cowlitz Bancorporation Cowlitz Bank Main Office Bay Mortgage—Longview |
Cowlitz Bank—Kalama |
Bay Bank—Portland | ||
| 927 Commerce Avenue Longview, WA 98632 (360) 423-9800 |
195 N. 1st Street Kalama, WA 98625 (360) 673-2226 |
1001 SW 5th Ave., Suite 250 Portland, OR 97204 (503) 222-9164 | ||
| Cowlitz Bank—Kelso |
Bay Bank—Bellevue |
Bay Bank Retirement Center Branch Springridge at Charbonneau | ||
| 1000 South 13th Kelso, WA 98626 (360) 423-7800 |
10500 NE 8th St., Suite 1750 Bellevue, WA 98004 (425) 452-1543 |
32200 SW French Prarie Rd Wilsonville, OR 97070 (503) 694-6950 | ||
| Cowlitz Bank—Castle Rock |
Bay Mortgage—Vancouver Bay Bank—Vancouver |
Bay Bank—Seattle | ||
| 202 Cowlitz St. W. Castle Rock, WA 98611 (360) 274-6685 |
700 Washington St., Suite 105 Vancouver, WA 98660 (360) 992-6200 |
1505 Westlake Ave N, Suite 125 Seattle, WA 981093050 (206) 282-4000 | ||
| Item 3. | Legal Proceedings |
The Company from time to time enters into routine litigation resulting from the collection of secured and unsecured indebtedness as part of its business of providing financial services. In some cases, such litigation will involve counterclaims or other claims against the Company. Such proceedings against financial institutions sometimes also involve claims for punitive damages in addition to other specific relief. The Company is not a party to any litigation other than in the ordinary course of business. In the opinion of management, the ultimate outcome of all pending legal proceedings will not individually or in the aggregate have a material adverse effect on the financial condition or the results of operations of the Company.
| Item 4. | (Removed and Reserved) |
21
Table of Contents
| Item 5. | Market for Registrant’s Common Equity and Related Stockholder Matters and Issuer Purchases of Equity Securities |
Cowlitz Bancorporation stock currently trades on the NASDAQ Capital Market under the symbol “CWLZD” due to the reverse stock split effective March 1, 2010, after March 30, 2010 the symbol will return to “CWLZ”. The following market prices have been adjusted to reflect the reverse stock split.
| 2009 | 2008 | |||||||||||||||||
| Market Price | Cash Dividend Declared |
Market Price | Cash Dividend Declared | |||||||||||||||
| High | Low | High | Low | |||||||||||||||
| 1st Quarter |
$ | 59.20 | $ | 20.00 | $ | — | $ | 119.40 | $ | 75.10 | $ | — | ||||||
| 2nd Quarter |
43.00 | 22.50 | — | 102.50 | 75.50 | — | ||||||||||||
| 3rd Quarter |
23.80 | 11.80 | — | 76.00 | 56.00 | — | ||||||||||||
| 4th Quarter |
13.50 | 4.70 | — | 67.90 | 57.50 | — | ||||||||||||
During 2009 and 2008, the Company neither declared nor paid any dividends to its stockholders. As of March 1, 2010 there were 514,638 shares of common stock outstanding and 330 shareholders of record, a number that does not include beneficial owners who hold shares in “street name”.
On September 5, 2007, the Company announced a stock repurchase plan program for up to 50,000 shares (adjusted for the reverse stock split). No shares were purchased as of December 31, 2009 and none are expected to be purchased in 2010. The Company is currently restricted from repurchasing its common stock without approval of the Federal Reserve Bank.
As reported in the Company’s Form 8-K dated February 2, 2010, the Bank stipulated to the issuance of a Consent Order with the Federal Deposit Insurance Corporation (“FDIC”) and the Washington Department of Financial Institutions (“DFI”). The Consent Order is discussed in more detail below in “Management’s Discussion and Analysis of Financial Condition and Results of Operations—Recent Developments” in Item 7 of this report. Under the terms of the Consent Order, the Bank cannot declare dividends or make distributions to Cowlitz Bancorporation without the prior written approval of the FDIC and the DFI. Dividends paid by the Bank to the Company provide the Company’s primary source of cash flow. We do not expect the Bank to be able to pay dividends in the foreseeable future.
Under the terms of indentures to our trust preferred securities, we are permitted to defer interest payments on junior subordinated debentures issued in connection with such securities for up to 20 consecutive quarters, but during a deferral period we are prohibited from making dividend payments on our capital stock. We are currently in a deferral period and expect such period to continue for the foreseeable future.
The Federal Reserve has issued a policy statement on the payment of cash dividends by bank holding companies, which expresses the Federal Reserve’s view that a bank holding company should pay cash dividends only to the extent that its net income for the past year is sufficient to cover both the cash dividends and a rate of earnings retention that is consistent with the holding company’s capital needs, asset quality and overall financial condition. The Federal Reserve also indicated that it would be inappropriate for a bank holding company experiencing serious financial problems to borrow funds to pay dividends.
The Company is restricted from paying dividends unless we receive prior regulatory approval from the Federal Reserve. Although we can seek to obtain a waiver of such prohibition, we would not expect to be granted such waiver or to be released from this obligation until our financial performance improves significantly.
Additional general restrictions on dividends are discussed in Item 1—Supervision and Regulation.
22
Table of Contents
Stock Performance Graph
The following chart, which is furnished not filed, compares the annual percentage change in the cumulative total return of Cowlitz Bancorporation common stock during the period commencing December 31, 2004 and through the fiscal years ended December 31, 2009 with the total return index for the NASDAQ Composite Index and the total return index for the NASDAQ Bank Index. This comparison assumes $100.00 was invested on December 31, 2004, in Cowlitz common stock and in the comparison indices, and assumes reinvestment of all cash dividends prior to any tax effect and retention of all stock dividends. Price information for the chart was obtained using the NASDAQ closing price as of that date.
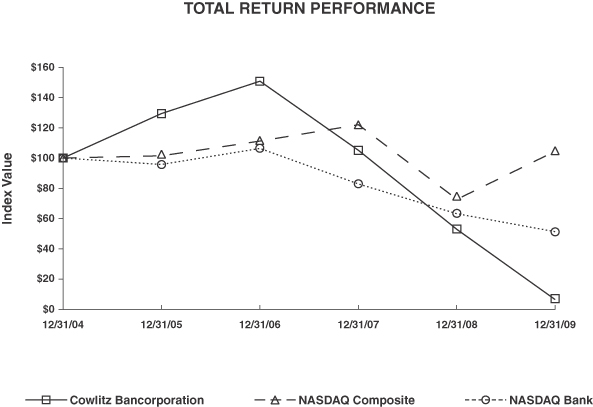
| Period Ending | ||||||||||||
| Index |
12/31/04 | 12/31/05 | 12/31/06 | 12/31/07 | 12/31/08 | 12/31/09 | ||||||
| Cowlitz Bancorporation |
100.00 | 129.26 | 150.63 | 105.03 | 52.60 | 6.28 | ||||||
| NASDAQ Composite |
100.00 | 101.37 | 111.03 | 121.92 | 72.49 | 104.31 | ||||||
| NASDAQ Bank |
100.00 | 95.67 | 106.20 | 82.76 | 62.96 | 51.31 | ||||||
Cowlitz Bancorporation’s total cumulative return was -93.72 percent over the five-year period ending December 31, 2009, compared with 4.31 percent and -48.69 percent for the NASDAQ Composite and NASDAQ Bank indices, respectively.
23
Table of Contents
| Item 6. | Selected Financial Data |
| As of and For the Year Ended December 31, | ||||||||||||||||||||
| (dollars in thousands, except per share amounts) | 2009 | 2008 | 2007 | 2006 | 2005 | |||||||||||||||
| Interest income |
$ | 28,595 | $ | 35,663 | $ | 36,226 | $ | 31,638 | $ | 19,698 | ||||||||||
| Interest expense |
14,210 | 13,768 | 13,871 | 9,263 | 4,902 | |||||||||||||||
| Net interest income |
14,385 | 21,895 | 22,355 | 22,375 | 14,796 | |||||||||||||||
| Provision for credit losses |
22,261 | 17,595 | 7,800 | 2,640 | 870 | |||||||||||||||
| Net interest income after provision for credit losses |
(7,876 | ) | 4,300 | 14,555 | 19,735 | 13,926 | ||||||||||||||
| Noninterest income |
6,246 | 1,683 | 3,462 | 2,825 | 2,194 | |||||||||||||||
| Noninterest expense |
24,224 | 19,413 | 18,721 | 16,099 | 12,304 | |||||||||||||||
| Income (loss) before income taxes |
(25,854 | ) | (13,430 | ) | (704 | ) | 6,461 | 3,816 | ||||||||||||
| Income tax (benefit) provision |
8,921 | (5,332 | ) | (790 | ) | 1,702 | 859 | |||||||||||||
| Net income (loss) |
$ | (34,775 | ) | $ | (8,098 | ) | $ | 86 | $ | 4,759 | $ | 2,957 | ||||||||
| Per share data: |
||||||||||||||||||||
| Diluted earnings (loss) per share |
$ | (67.83 | ) | $ | (15.96 | ) | $ | 0.17 | $ | 9.33 | $ | 6.64 | ||||||||
| Cash dividends per share |
$ | — | $ | — | $ | — | $ | — | $ | — | ||||||||||
| Weighted average diluted shares outstanding |
512,663 | 507,531 | 517,553 | 509,833 | 445,147 | |||||||||||||||
| Balance Sheet Data (at period end) |
||||||||||||||||||||
| Loans, net of deferred fees |
$ | 343,327 | $ | 433,215 | $ | 397,325 | $ | 358,390 | $ | 270,247 | ||||||||||
| Allowance for loan losses |
(10,164 | ) | (13,712 | ) | (5,801 | ) | (4,481 | ) | (4,668 | ) | ||||||||||
| Net loans charged-off during period |
25,899 | 9,591 | 6,635 | 2,483 | 1,649 | |||||||||||||||
| Total non-performing assets (1) |
52,829 | 20,527 | 13,077 | 1,759 | 4,156 | |||||||||||||||
| Total assets |
552,412 | 587,426 | 514,180 | 468,395 | 370,095 | |||||||||||||||
| Total deposits |
523,771 | 521,570 | 441,179 | 399,450 | 309,195 | |||||||||||||||
| Total liabilities |
540,357 | 538,645 | 458,640 | 417,670 | 325,154 | |||||||||||||||
| Total shareholders’ equity |
12,055 | 48,781 | 55,540 | 50,725 | 44,941 | |||||||||||||||
| Balance Sheet Data (average for period) |
||||||||||||||||||||
| Average loans, net of deferred fees |
$ | 399,091 | $ | 428,014 | $ | 383,477 | $ | 319,577 | $ | 219,882 | ||||||||||
| Average interest-earning assets |
546,274 | 495,459 | 446,337 | 384,251 | 284,080 | |||||||||||||||
| Average total assets |
587,757 | 541,519 | 489,141 | 422,133 | 308,542 | |||||||||||||||
| Average shareholders’ equity |
36,310 | 51,917 | 53,932 | 47,642 | 36,483 | |||||||||||||||
| Selected Ratios |
||||||||||||||||||||
| Return on average total assets |
(5.92 | )% | (1.50 | )% | 0.02 | % | 1.13 | % | 0.96 | % | ||||||||||
| Return on average shareholders’ equity |
(95.77 | )% | (15.60 | )% | 0.16 | % | 9.99 | % | 8.11 | % | ||||||||||
| Net interest margin (fully tax-equivalent) |
2.74 | % | 4.55 | % | 5.12 | % | 5.90 | % | 5.28 | % | ||||||||||
| Efficiency ratio (2) |
117.42 | % | 82.34 | % | 72.51 | % | 63.88 | % | 72.42 | % | ||||||||||
| Allowance for loan losses to: |
||||||||||||||||||||
| Ending total loans |
2.96 | % | 3.17 | % | 1.46 | % | 1.25 | % | 1.73 | % | ||||||||||
| Nonperforming loans |
21 | % | 87 | % | 54 | % | 394 | % | 112 | % | ||||||||||
| Nonperforming assets to ending total assets |
9.56 | % | 3.49 | % | 2.54 | % | 0.38 | % | 1.12 | % | ||||||||||
| Net loans charged-off to average loans |
6.49 | % | 2.24 | % | 1.73 | % | 0.78 | % | 0.75 | % | ||||||||||
| Shareholders’ equity to average assets |
2.05 | % | 9.01 | % | 11.35 | % | 12.02 | % | 14.57 | % | ||||||||||
| Tier 1 leverage capital ratio (3) |
2.50 | % | 8.74 | % | 12.51 | % | 13.14 | % | 15.92 | % | ||||||||||
| Tier 1 capital ratio (4) |
3.88 | % | 10.20 | % | 13.56 | % | 14.63 | % | 17.63 | % | ||||||||||
| Total risk-based capital ratio (5) |
7.40 | % | 11.47 | % | 14.82 | % | 15.79 | % | 18.89 | % | ||||||||||
| (1) | Non-performing assets consist of nonaccrual loans and repossessed assets. |
| (2) | Noninterest expense divided by the sum of net interest income plus noninterest income. |
| (3) | Tier 1 capital divided by average assets. |
| (4) | Tier 1 capital divided by risk weighted assets. |
| (5) | Total risk-based capital divided by risk-weighted assets. |
24
Table of Contents
| Item 7. | Management’s Discussion and Analysis of Financial Condition and Results of Operations |
The following Management’s Discussion and Analysis of Financial Condition and Results of Operations includes a discussion of significant business trends and uncertainties as well as certain forward-looking statements and is intended to be read in conjunction with and is qualified in its entirety by reference to the consolidated financial statements of the Company and accompanying notes included elsewhere in this report. For a discussion of important factors that could cause actual results to differ materially from such forward-looking statements, see Item 1A. “Risk Factors” and the discussion of forward-looking statements immediately following the table of contents.
Critical Accounting Policies and Estimates
Allowance for Credit Losses
The allowance for credit losses represents the estimate of probable losses associated with the Bank’s loan portfolio and commitments to extend credit. The Company utilizes both quantitative and qualitative considerations in establishing the allowance for credit losses believed to be appropriate as of each reporting date.
Quantitative factors include:
| • | the volume and severity of nonperforming loans and adversely classified credits, |
| • | the level of net charge-offs experienced on previously classified loans, |
| • | the nature and value of collateral securing the loans, |
| • | the trend in loan growth and the percentage of change, |
| • | the level of geographic and/or industry concentration, |
| • | the relationship and trend over the past several years of recoveries in relation to charge-offs, and |
| • | other known factors regarding specific loans. |
Qualitative factors include:
| • | the effectiveness of credit administration, |
| • | the adequacy of loan review, |
| • | the adequacy of loan operations personnel and processes, |
| • | the effect of competitive issues that impact loan underwriting and structure, |
| • | the impact of economic conditions including interest rate trends, |
| • | the introduction of new loan products or specific marketing efforts, |
| • | large credit exposure and trends, and |
| • | industry segments that are exhibiting stress. |
Changes in the above factors could significantly affect the determination of the adequacy of the allowance for credit losses. Management performs a full analysis, no less often than quarterly, to ensure that changes in estimated loan loss levels are adjusted on a timely basis. For further discussion of this significant management estimate, see “Allowance for Credit Losses.”
Goodwill
Another critical accounting policy of the Company is that related to the carrying value of goodwill. Impairment analysis of the fair value of goodwill involves a substantial amount of judgment. Under ASC Topic 350, “Goodwill and Other Intangibles”, the Company ceased amortization of goodwill on January 1, 2002 and periodically tests goodwill for impairment.
25
Table of Contents
The goodwill impairment analysis requires management to make highly subjective judgments in determining if an indicator of impairment has occurred. Events and factors that may significantly affect the analysis include: a significant decline in the Company’s expected future cash flows, a substantial increase in the discount factor, a sustained, significant decline in the Company’s stock price and market capitalization, a significant adverse change in legal factors or in the business climate. Other factors might include changing competitive forces, customer behaviors and attrition, revenue trends and cost structures, along with specific industry and market conditions.
Goodwill is evaluated for impairment on an annual basis at December 31, or when circumstances indicate an impairment may exist. Quantitative and qualitative factors are used in the Company’s analysis.
The quantitative analysis is a two-step process. The first step is a comparison of the Company’s fair value to its carrying value. Management estimates fair value using a combination of the income approach and market approach with the best information available, including market information and discounted cash flow analysis. The income approach uses a reporting unit’s projection of estimated operating results and cash flows that is discounted using a weighted-average cost of capital that reflects current market conditions. For purposes of the goodwill impairment test, the Company was identified as a single reporting unit. The market approach estimates the fair value of a company by examining the price at which similar companies, or shares of similar companies, are exchanged. If the first step indicates there may be impairment, a second step is performed to measure the amount of impairment loss.
In the second step, the amount of impairment is determined by comparing the implied fair value of reporting unit goodwill to the carrying value of the goodwill in the same manner as if the reporting unit was being acquired in a business combination. Specifically, a company allocates the fair value to all of the assets and liabilities of the reporting unit, including any unrecognized intangible assets, in a hypothetical analysis that would calculate the implied fair value of goodwill. If the implied fair value of goodwill is less than the recorded goodwill, the Company would record an impairment charge for the difference.
Management also considered certain qualitative information in its goodwill impairment analysis. Some of the qualitative factors were: the continued decline in stock values for financial services companies, including Cowlitz Bancorporation, which indicates that the value of goodwill for the industry, particularly for banks with a financial profile similar to ours, has been severely diminished; in 2009 the Company recorded a 100 percent valuation allowance against its deferred tax assets due to there being no assurance that the Company will generate future taxable income to utilize such assets; and the Bank is currently operating under a Consent Order with the FDIC requiring, among other things, increasing capital and profitability of the Bank, as well as restricting the Bank’s access to brokered deposits. After considering both the quantitative and qualitative factors in its impairment analysis, management recorded a 100 percent impairment charge against this asset in the fourth quarter of 2009.
Income Taxes
The Company uses the asset and liability method of accounting for income taxes. Determination of the deferred and current provision requires analysis by management of certain transactions and the related tax laws and regulations. Management exercises significant judgment in evaluating the amount and timing of recognition of the resulting tax liabilities and assets. Those judgments and estimates are re-evaluated on a continual basis as regulatory and business factors change.
The Company periodically reviews the carrying amount of its deferred tax assets to determine if the establishment of a valuation allowance is necessary. If, based on the available evidence in future periods, it is more likely than not that all or a portion of the Company’s deferred tax assets will not be realized, a deferred tax valuation allowance is established. Consideration is given to all positive and negative evidence related to the realization of the deferred tax assets.
26
Table of Contents
In evaluating the available evidence, management considers historical financial performance, expectation of future earnings, the ability to carryback losses to recoup taxes previously paid, length of statutory carryforward periods, experience with operating loss and tax credit carryforwards not expiring unused, tax planning strategies and timing of reversals of temporary differences. Significant judgment is required in assessing future earnings trends and the timing of reversals of temporary differences. The Company’s evaluation is based on current tax laws as well as management’s expectations of future performance based on its strategic initiatives. Changes in existing tax laws and future results that differ from expectations may result in significant changes in the deferred tax asset valuation allowance.
The Company’s deferred tax position has been affected by several significant transactions in the past three years. These transactions included other-than-temporary impairment charges of certain investments and continued elevated levels of provision for credit losses and, as a result, the Company is in a cumulative net loss position since the fourth quarter of 2007. Under the applicable accounting guidance, the Company has concluded that it is not “more likely than not” that the Company will be able to realize its deferred tax assets and, accordingly has established a full valuation allowance totaling $18.0 million against its net deferred tax asset at December 31, 2009. The valuation allowance will be analyzed quarterly for changes affecting the deferred tax assets. If, in the future, the Company generates taxable income on a sustained basis, management’s conclusion regarding the need for a deferred tax asset valuation allowance could change, resulting in the reversal of a portion or all of the deferred tax asset valuation allowance.
Foreclosed Real Estate and Other Foreclosed Assets
As of December 31, 2009, approximately 79 percent of the Company’s loan portfolio was secured by real estate. In the event of customer default, the Company’s principal source of repayment is derived through the foreclosure and ultimate liquidation of real estate collateral. Upon receiving title to a property, the Company transfers the related balance from loans to other real estate owned in an amount equal to the lesser of the carrying value of the loan less estimated selling costs, or the appraised amount of the property less estimated selling costs and market discount. Any loss realized upon the initial transfer to other real estate owned is recognized as a loan charge-off.
The estimated selling costs are based upon current real estate commission rates for comparable properties. Appraised values are discounted if, in the opinion of management, the values do not fully reflect current market conditions. In determining the amount of a market discount, if any, management considers bona fide offers received on the subject or similar properties, the level of supply of similar properties, management’s judgment of other property specific attributes and expectations about future market conditions. Any additional impairment, along with any costs associated with insurance or maintenance, are recognized as a charge to current period earnings.
Recent Developments
As reported in the Company’s Form 8-K dated February 2, 2010, the Bank stipulated to the issuance of a Consent Order (the “Order”) with the Federal Deposit Insurance Corporation (the “FDIC”) and the Washington Department of Financial Institutions (the “DFI”), based on certain findings from an examination of the Bank concluded in August 2009. In entering into the stipulation and consenting to entry of the Order, the Bank did not concede the findings or admit to any of the assertions therein.
Under the terms of the Consent Order, the Bank cannot declare dividends or make distributions to Cowlitz Bancorporation without the prior written approval of the FDIC and the DFI. Other material provisions of the Order require the Bank to:
| • | Recapitalize the Bank. The Order required the Bank to increase the Bank’s Tier 1 leverage capital to 10% of total assets by April 27, 2010 and develop and submit to the FDIC a risk-based capital maintenance plan. Management and its financial advisers are continuing aggressive efforts to enhance the Bank’s regulatory capital ratios primarily through sale of new equity securities to private investors. |
27
Table of Contents
| • | Retain qualified senior executive officers, with written authority from the Board to implement the provisions of the Order. The Bank believes that it has the appropriate management as required by the Order. |
| • | Provide 30 days’ prior notice to the FDIC and DFI in advance of proposed changes in senior management or the Board of Directors. The Bank has not added anyone to the Board of Directors or employed any new senior executive officer since the effective date of the Order. |
| • | Establish a comprehensive policy for determining and documenting the level of the Bank’s allowance for loan and lease loss (ALLL), to include a review of the ALLL at least quarterly and correction of any deficiency in the ALLL indicated by the review. The Board of Directors has reviewed the Bank’s policies and procedures with respect to determining the adequacy of the ALLL and believes that such policies and procedures are adequate and appropriate. The Board of Directors has reviewed the ALLL quarterly and believes that it has been adequate. |
| • | Develop a written plan to reduce the amount of construction, development and commercial real estate loans and strictly limit new acquisition, development and construction lending. As of December 31, 2009, construction, development and commercial real estate loans were reduced $46.6 million since the Report of Visitation (“ROV”) dated April 20, 2009 and $60.2 million since year end 2008. |
| • | Develop a written plan to reduce assets adversely classified “substandard” or “doubtful” in excess of $50,000 to an acceptable level as determined by the FDIC and DFI at subsequent examinations and/or visitations. Since the date of the Order, the amount of adversely classified assets has not changed significantly. |
| • | Refrain from extending credit to or for the benefit of (i) any borrower who has an extension of credit from the Bank that has been charged off or classified, in whole or in part, “Loss,” or (ii) any borrower who has an extension of credit from the Bank that has been classified, in whole or in part, “Doubtful or Substandard,” without prior approval of the Board of Directors or the Bank’s loan committee and collection of all interest due. Since the date of the Order, the Bank has not made any extensions of credit in violation of the limitations. |
| • | Develop a written plan, approved by its Board of Directors, to systematically reduce the Bank’s level of nonperforming and/or watch list assets to a level determined acceptable by the FDIC at subsequent examinations and/or visitations. At its March 24, 2010 meeting, the Board of Directors approved management’s plan to reduce the Bank’s nonperforming and/or watch list assets. |
| • | Formulate and implement a three-year business plan to improve the Bank’s financial performance. Management will be submitting a three-year business plan addressing the improvement of the Bank’s financial performance to the Board of Directors for approval at a meeting in April 2010. |
| • | Eliminate or correct all violations of law and contraventions of policy. The Bank has eliminated or corrected all violations of law and contraventions of policy since the ROV dated April 29, 2009 and has taken appropriate steps to ensure future compliance with all applicable laws, regulations, Interagency Guidelines and Policy Statements. |
| • | Prepare and submit to the FDIC and DFI a written plan to reduce the Bank’s level of brokered deposits, and maintain compliance with deposit interest rate restrictions as defined in Section 337.6 of the FDIC Rules and Regulations. The Bank provided a written plan to the FDIC and DFI on February 26, 2010. The Bank has not accepted or renewed any brokered certificates of deposit since July 2009, and has reduced the level of such deposits from $199.4 million at July 31, 2009 to $163.1 million at December 31, 2009. The Bank is complying with the deposit pricing requirements of Section 337.6 and continues to monitor interest rates to maintain compliance with such requirements. |
| • | Prepare and submit plans and progress reports to the FDIC and DFI on a regular basis. |
The required improvement of capital levels is the most significant provision of the Order. Due to market conditions discussed below and other factors, there is uncertainty about the Company’s ability to satisfy the
28
Table of Contents
requirement to achieve a Tier 1 leverage ratio of 10 percent by April 27, 2010. The Bank believes it has materially complied with many of the other provisions of the Order and expects it will be able to comply with the remaining provisions in the near term.
While there are a number of financial institutions of similar size and condition that have been attempting to raise capital over the past year, there has been a very limited amount of private equity that has been raised. Although the Company has not been successful to date in obtaining private equity, it has engaged in numerous discussions and due diligence with qualified institutional and private investors. The Company will continue to vigorously pursue contacts and discussions with prospective investors and is confident that if the conditions in the capital markets improve over the coming months, the prospects for success in these efforts will substantially increase. The Company also is continuing its strategy to significantly reduce loans, thereby reducing the required level of capital.
There are no assurances that plans to achieve objectives set forth in the Order will successfully improve the Bank’s results of operation or financial condition or result in termination of the Order from the FDIC and the DFI. In addition, failure to increase capital levels consistent with the requirements of the Order could result in further enforcement actions by the FDIC and/or DFI. Full satisfaction of the Order’s requirements will depend almost exclusively on raising a significant amount of additional capital. The Company may also face additional restrictions from the Board of Governors of the Federal Reserve based on the Bank’s and Company’s capitalization and other conditions giving rise to the Order.
Economic Conditions
The Company’s business is closely tied to the economies of western Washington and northwest Oregon. The uncertain depth and duration of the present economic downturn could continue to cause further deterioration of these local economies, resulting in an adverse effect on the Company’s financial condition and results of operations. Real estate values in these areas have declined and may continue to fall. Unemployment rates in these areas have increased significantly and may stay elevated for an extended period. Business activity across a wide range of industries and regions has been impacted and local governments and many businesses are facing serious challenges due to the lack of consumer spending driven by elevated unemployment and uncertainty about future economic conditions.
The Company’s financial performance generally, and in particular the ability of borrowers to pay interest on and repay principal of outstanding loans and the declining value of collateral securing those loans, is reflective of the business environment in the markets where the Company operates. The present significant downturn in economic activity and declining real estate values has had a direct and adverse effect on the condition and results of operations of the Company. This is particularly evident in the residential land development and residential construction segments of the Company’s loan portfolio. Developers or home builders whose cash flows are dependent on the sale of lots or completed residences have reduced ability to service their loan obligations and the market value of underlying collateral has been and continues to be adversely effected. The impact on the Company has been an elevated level of impaired loans, an associated increase in provisioning expense and charge-offs and, in conjunction with a lowered future earnings expectation, the decision to record a 100 percent valuation allowance on the Company’s net deferred tax asset, as well as writing off its goodwill in 2009.
Executive Overview
Results of Operations
For the year ended December 31, 2009, the Company’s net loss was $34.8 million, or ($67.83) per diluted share. This compares with a net loss of $8.1 million, or ($15.96) per diluted share, and net income of $86,000, or $0.17 per diluted share, for the corresponding periods ended December 31, 2008, and 2007, respectively. The per share amounts have been adjusted to reflect the one-for-ten reverse stock split effective for the Company’s common shares as of March 1, 2010.
29
Table of Contents
Significant items affecting the 2009 financial results were:
| • | Provision for credit losses of $22.3 million related to higher charge-offs, an increase in nonperforming loans and continuing decline in the residential construction and development markets. |
| • | Net interest margin decreased 181 basis points over the prior year related mainly to declines in market interest rates, an increase in nonaccrual loans and maintaining significant levels of balance sheet liquidity. |
| • | Noninterest income increased $4.6 million, primarily due to $3.1 million of gains realized on terminated interest rate contracts. Fiduciary income was up $190,000, or 31 percent, service charges were up $88,000, or 11 percent, and mortgage brokerage fees were up $70,000, or 33 percent. International trade and wire fees decreased $741,000, or 81 percent, due to the planned reduction in the number of non-resident relationships serviced by the Bank’s international trade and wire department. |
| • | Noninterest expense increased $4.8 million, or 25 percent, primarily due to: |
| • | Goodwill impairment charge of $1.8 million. |
| • | FDIC insurance increased $1.7 million. |
| • | Professional services increased $791,000, or 66 percent, and loan collection and related expenses increased $507,000, or 141 percent, primarily due to the higher level of nonperforming loans. |
| • | The Company has recorded a 100 percent valuation allowance against its net deferred tax assets as of December 31, 2009. The non-cash charge to establish the valuation allowance increased the 2009 net loss by $18.0 million, or $34.98 per share. |
| • | Loans decreased $89.9 million, or 21 percent, from year-end 2008, reflecting goals to reduce real estate loan concentrations and reduce assets and related capital requirements. |
| • | Nonperforming assets equaled to 9.56 percent of total assets at year-end 2009. |
Significant items affecting the 2008 financial results were:
| • | Provision for credit losses of $17.6 million related to an increase in nonperforming loans and an overall decline in residential construction and development markets. |
| • | Net interest margin fell 57 basis points primarily due to the decline in market interest rates beginning mid-2008 and an increasing level of nonperforming loans. |
| • | Noninterest income decreased $1.8 million, or 51 percent, primarily due to a $1.7 million impairment charge on FNMA preferred stock. |
| • | Noninterest expense increased $692,000, or 4 percent, primarily due to: |
| • | Net foreclosed asset expenses were up $2.0 million. |
| • | A noncash credit of $1.1 million was recognized for the ineffective portion of the change in fair value of the Bank’s cash flow hedges. |
| • | Average loans increased $44.5 million, or 12 percent. |
| • | Nonperforming assets increased to 3.49 percent of assets at year-end 2008. |
Analysis of Net Interest Income
The primary component of the Company’s earnings is net interest income. Net interest income is the difference between interest income, principally from loans and investment securities portfolios, and interest expense, principally on customer deposits and borrowings. Changes in net interest income, net interest spread, and net interest margin result from changes in asset and liability volume and mix, and to rates earned or paid. Net
30
Table of Contents
interest spread refers to the difference between the yield on interest-earning assets and the cost of interest-bearing liabilities. Net interest margin is the ratio of net interest income to total interest-earning assets and is influenced by the volume and relative mix of interest-earning assets and interest-bearing liabilities. Volume refers to the dollar level of interest-earning assets and interest-bearing liabilities.
Interest income from certain of the Company’s earning assets is non-taxable. The following table presents interest income and expense, including adjustments for non-taxable interest income, and the resulting tax-adjusted yields earned, rates paid, interest rate spread, and net interest margin for the periods indicated. Nonaccrual loans have been included in the table as loans carrying a zero yield. Loan fees are amortized to interest income over the life of the loan.
| Year Ended December 31, | ||||||||||||||||||||||||||||||
| 2009 | 2008 | 2007 | ||||||||||||||||||||||||||||
| (dollars in thousands) | Average Outstanding Balance |
Interest Earned/ Paid |
Yield/ Rate |
Average Outstanding Balance |
Interest Earned/ Paid |
Yield/ Rate |
Average Outstanding Balance |
Interest Earned/ Paid |
Yield/ Rate |
|||||||||||||||||||||
| Assets |
||||||||||||||||||||||||||||||
| Interest-Earning Assets: |
||||||||||||||||||||||||||||||
| Loans (1) (2) (3) |
$ | 399,091 | $ | 25,750 | 6.45 | % | $ | 428,014 | $ | 33,081 | 7.73 | % | $ | 383,477 | $ | 33,191 | 8.66 | % | ||||||||||||
| Taxable securities |
34,924 | 1,821 | 5.21 | % | 25,080 | 1,363 | 5.43 | % | 34,010 | 1,865 | 5.48 | % | ||||||||||||||||||
| Non-taxable securities (2) |
22,328 | 1,387 | 6.21 | % | 23,496 | 1,555 | 6.62 | % | 21,747 | 1,383 | 6.36 | % | ||||||||||||||||||
| Federal funds sold |
33,008 | 72 | 0.22 | % | 16,968 | 270 | 1.59 | % | 5,207 | 262 | 5.03 | % | ||||||||||||||||||
| Interest-earning balances due from banks and FHLB stock |
56,923 | 138 | 0.24 | % | 1,901 | 31 | 1.63 | % | 1,896 | 42 | 2.22 | % | ||||||||||||||||||
| Total interest-earning assets (2) |
546,274 | 29,168 | 5.34 | % | 495,459 | 36,300 | 7.33 | % | 446,337 | 36,743 | 8.23 | % | ||||||||||||||||||
| Cash and due from banks |
13,756 | 15,688 | 18,427 | |||||||||||||||||||||||||||
| Allowance for loan losses |
(10,877 | ) | (10,340 | ) | (5,141 | ) | ||||||||||||||||||||||||
| Other assets |
38,604 | 40,712 | 29,518 | |||||||||||||||||||||||||||
| Total assets |
$ | 587,757 | $ | 541,519 | $ | 489,141 | ||||||||||||||||||||||||
| Liabilities and Shareholders Equity |
||||||||||||||||||||||||||||||
| Interest-Bearing Liabilities: |
||||||||||||||||||||||||||||||
| Savings, money market and interest-bearing demand deposits |
$ | 92,099 | $ | 712 | 0.77 | % | $ | 111,458 | $ | 1,696 | 1.52 | % | $ | 104,310 | $ | 2,260 | 2.17 | % | ||||||||||||
| Certificates of deposit |
389,919 | 13,160 | 3.38 | % | 274,065 | 11,420 | 4.17 | % | 210,174 | 10,602 | 5.04 | % | ||||||||||||||||||
| Federal funds purchased |
— | — | — | 1,494 | 41 | 2.74 | % | 2,313 | 121 | 5.23 | % | |||||||||||||||||||
| Junior subordinated debentures |
12,372 | 336 | 2.72 | % | 12,372 | 604 | 4.88 | % | 12,372 | 875 | 7.07 | % | ||||||||||||||||||
| FHLB and other borrowings |
25 | 2 | 8.00 | % | 86 | 7 | 8.14 | % | 175 | 13 | 7.43 | % | ||||||||||||||||||
| Total interest-bearing liabilities |
494,415 | 14,210 | 2.87 | % | 399,475 | 13,768 | 3.45 | % | 329,344 | 13,871 | 4.21 | % | ||||||||||||||||||
| Noninterest-bearing deposits |
52,282 | 85,799 | 100,817 | |||||||||||||||||||||||||||
| Other liabilities |
4,750 | 4,328 | 5,048 | |||||||||||||||||||||||||||
| Total liabilities |
551,447 | 489,602 | 435,209 | |||||||||||||||||||||||||||
| Shareholders’ Equity |
36,310 | 51,917 | 53,932 | |||||||||||||||||||||||||||
| Total liabilities and shareholders’ equity |
$ | 587,757 | $ | 541,519 | $ | 489,141 | ||||||||||||||||||||||||
| Net interest income (2) |
$ | 14,958 | $ | 22,532 | $ | 22,872 | ||||||||||||||||||||||||
| Net interest spread |
2.47 | % | 3.88 | % | 4.02 | % | ||||||||||||||||||||||||
| Yield on average interest-earning assets |
5.34 | % | 7.33 | % | 8.23 | % | ||||||||||||||||||||||||
| Interest expense to average interest-earning assets |
2.60 | % | 2.78 | % | 3.11 | % | ||||||||||||||||||||||||
| Net interest income to average interest- earning assets (net interest margin) |
2.74 | % | 4.55 | % | 5.12 | % | ||||||||||||||||||||||||
| (1) | Loans include loans on which the accrual of interest has been discontinued. |
| (2) | Interest earned on non-taxable securities and loans has been computed on a 34 percent tax-equivalent basis. |
| (3) | Loan interest income includes net loan fee amortization of $1.0 million, $1.5 million, and $1.8 million, for 2009, 2008, and 2007, respectively. |
31
Table of Contents
The net interest margin as a percentage was 2.74 percent for 2009, compared with 4.55 percent and 5.12 percent in 2008 and 2007, respectively. Tax-equivalent net interest income for 2009 was $15 million, down from $22.5 million in 2008 and $22.9 million in 2007. Increases in average interest-earning assets of $50.8 million in 2009 were funded primarily by increases in interest-bearing deposits. The lower net interest margin in 2009 relative to 2008 and 2007 was due to several factors, including significant rate reductions by the Federal Reserve in the second half of 2008, lower loan volumes and fees, higher levels of nonperforming loans, higher levels of low yielding cash-equivalent investments and a lower level of noninterest-bearing demand and low-cost money market deposit accounts.
The following table shows the dollar amount of the increase (decrease) in the Company’s net interest income and expense, on a tax equivalent basis, and attributes such dollar amounts to changes in volume or changes in rates. Rate/volume variances have been allocated to volume changes:
| Year Ended December 31, | ||||||||||||||||||||||||
| 2009 vs. 2008 | 2008 vs. 2007 | |||||||||||||||||||||||
| Increase (Decrease) Due to |
Total Increase (Decrease) |
Increase (Decrease) Due to |
Total Increase (Decrease) |
|||||||||||||||||||||
| Volume | Rate | Volume | Rate | |||||||||||||||||||||
| Interest-earning assets: |
||||||||||||||||||||||||
| Interest-earning balances due from banks |
$ | 133 | $ | (26 | ) | $ | 107 | $ | — | $ | (11 | ) | $ | (11 | ) | |||||||||
| Federal funds sold |
34 | (232 | ) | (198 | ) | 187 | (179 | ) | 8 | |||||||||||||||
| Investment security income: |
||||||||||||||||||||||||
| Taxable securities |
513 | (55 | ) | 458 | (485 | ) | (17 | ) | (502 | ) | ||||||||||||||
| Nontaxable securities |
(72 | ) | (96 | ) | (168 | ) | 116 | 56 | 172 | |||||||||||||||
| Loans |
(1,852 | ) | (5,479 | ) | (7,331 | ) | 3,455 | (3,565 | ) | (110 | ) | |||||||||||||
| Total interest income |
(1,244 | ) | (5,888 | ) | (7,132 | ) | 3,273 | (3,716 | ) | (443 | ) | |||||||||||||
| Interest-bearing liabilities: |
||||||||||||||||||||||||
| Savings, money market and interest-bearing demand deposits |
(148 | ) | (836 | ) | (984 | ) | 109 | (673 | ) | (564 | ) | |||||||||||||
| Certificates of deposit |
3,905 | (2,165 | ) | 1,740 | 2,652 | (1,834 | ) | 818 | ||||||||||||||||
| Federal funds purchased |
— | (41 | ) | (41 | ) | (22 | ) | (58 | ) | (80 | ) | |||||||||||||
| Junior subordinated debentures |
— | (268 | ) | (268 | ) | — | (271 | ) | (271 | ) | ||||||||||||||
| FHLB and other borrowings |
(5 | ) | — | (5 | ) | (7 | ) | 1 | (6 | ) | ||||||||||||||
| Total interest expense |
3,752 | (3,310 | ) | 442 | 2,732 | (2,835 | ) | (103 | ) | |||||||||||||||
| Net Interest Spread |
$ | (4,996 | ) | $ | (2,578 | ) | $ | (7,574 | ) | $ | 541 | $ | (881 | ) | $ | (340 | ) | |||||||
Interest Income. Total average earning assets increased $50.8 million in 2009 to $546.3 million, compared with $495.5 million in 2008. Average loans in 2009 decreased $28.9 million, or 7 percent, while average federal funds sold and interest-earning cash balances increased $71.1 million. The average yield on earning assets in 2009 was 5.34 percent compared with 7.33 percent in 2008. The decrease in average yield was primarily due to the decrease in loan yields. In both 2009 and 2008, the yield on the loan portfolio was negatively affected by the level of nonaccrual loans during the years and related foregone interest income. Interest income in 2009 was positively affected by an increase in volume of taxable securities.
Foregone interest income was $3.4 million, $0.8 million, and $1.0 million for 2009, 2008, and 2007 respectively. The Company estimates that foregone interest income contributed to a decline in the average yield on earning assets of 63 basis points, 16 basis points and 21 basis points for 2009, 2008, and 2007, respectively. Also affecting the average yield in 2009 was the Company’s efforts to maintain significant levels of on-balance sheet liquidity through federal funds sold and interest-earning cash balances for contingency planning which negatively affected the average yield by 48 basis points.
32
Table of Contents
Comparing 2008 to 2007, total average interest earning assets increased $49.1 million. Average loans increased $44.5 million. The average yields earned on loans in 2008 was 7.73 percent compared with 8.66 percent in 2007. The Bank’s prime rate stood at 3.25 percent at year-end 2008, compared with 7.25 percent at year-end 2007. A decrease of 26 percent in average taxable securities decreased interest income approximately by $485,000.
Interest Expense. The average rate paid on interest-bearing liabilities paid in 2009 was 2.87 percent, compared with 3.45 percent in 2008, a decrease of 58 basis points primarily due to the 79 basis point decrease in average rates paid on certificates of deposits in 2009. Average funding costs have improved as deposits issued in 2009 were issued in a lower interest rate environment relative to 2008 and 2007. This decrease in the average cost of interest-bearing liabilities partially offset the decrease in the average yield on interest-earning assets, resulting in a 141 basis point decrease in the net interest spread in 2009 compared with 2008.
In 2008, the average rate paid on interest-bearing liabilities was 3.45 percent compared with 4.21 percent in 2007, a decrease of 76 basis points. The higher interest costs in 2007 reflected the volatility in short-term market rates and the competitive climate for deposits.
Provision for Credit Losses
The amount of the allowance for credit losses is analyzed by management on a regular basis to ensure that it is adequate to absorb losses inherent in the loan portfolio as of the reporting date. When a provision for credit losses is recorded, the amount is based on, among other things, the current volume of loans and commitments to extend credit, industry concentrations, delinquency trends, past charge-off experience, management’s assessment of the risk of loss on current loans, the level of nonperforming and impaired loans, evaluation of future economic trends in the Company’s market area, and other factors relevant to the loan portfolio. An internal loan risk grading system is used to evaluate potential losses of individual loans. The Company does not, as part of its analysis, group loans together by loan type to assign risk. See the “Allowance for Credit Losses” disclosure for a more detailed discussion.
The Company’s provision for credit losses was $22.3 million for the year ended December 31, 2009, compared with $17.6 million and $7.8 million the years ended December 31, 2008 and 2007, respectively. Net charge-offs of $25.9 million, $9.6 million and $6.6 million were recorded for the years ended December 31, 2009, 2008 and 2007, respectively. The higher level of charge-offs in 2009 and 2008 primarily reflected declining appraised values on collateral dependent loans, especially in the residential land development portfolio, which began mid-2008. See “Loans” section below for additional information.
Noninterest Income
Noninterest income consists of the following components:
| For the Year Ended December 31, |
||||||||||||
| 2009 | 2008 | 2007 | ||||||||||
| Service charges on deposit accounts |
$ | 889 | $ | 801 | $ | 683 | ||||||
| Fiduciary income |
799 | 609 | 692 | |||||||||
| Increase in cash surrender value of bank-owned life insurance |
618 | 614 | 570 | |||||||||
| International trade fees |
110 | 580 | 644 | |||||||||
| Wire fees |
63 | 334 | 364 | |||||||||
| Mortgage brokerage fees |
281 | 211 | 289 | |||||||||
| Other income |
470 | 458 | 485 | |||||||||
| 3,230 | 3,607 | 3,727 | ||||||||||
| Gain (loss) on sale of securities |
2 | (200 | ) | (265 | ) | |||||||
| Other-than-temporary impairment charges on securities |
(96 | ) | (1,724 | ) | — | |||||||
| Gains on terminated interest rate contracts |
3,110 | — | — | |||||||||
| Total noninterest income |
$ | 6,246 | $ | 1,683 | $ | 3,462 | ||||||
33
Table of Contents
Total noninterest income was $6.2 million for the year ended December 31, 2009 compared with $1.7 million and $3.5 million for the year ended December 31, 2008 and 2007, respectively. Excluding securities transactions and impairments and the gain on terminated interest rate contracts, noninterest income was $3.2 million, $3.6 million and $3.7 million for 2009, 2008, and 2007, respectively. In 2009, service charges increased $88,000, fiduciary income increased $190,000 and mortgage brokerage fees increased $70,000 compared with 2008. These increases were offset by decreases of $470,000 in international trade fees and $271,000 in wire fees as compared with 2008. Those fee decreases related to the planned reduction in the fourth quarter of 2008 in the number of non-resident relationships serviced by our Seattle-based international trade department and wire room.
Gains or losses on sales of investment securities in 2009, 2008 and 2007 were realized as certain low-yielding securities were sold and proceeds used to purchase additional securities to improve the overall yield of the portfolio or invest in loans.
Other-than-temporary impairment (“OTTI”) charges recorded in 2009 totaled $96,000, of which $86,000 related to one non-agency mortgage-backed security and $10,000 related to an additional OTTI charge on the Company’s investment in FNMA preferred stock. In 2008, the Company recorded a $1.7 million OTTI charge related to its FNMA preferred stock following the federal government’s actions to place FNMA under conservatorship and suspend preferred stock dividends.
In 2006, the Company entered into three interest rate contracts, expiring in 2011, with an aggregate notional value totaling $125 million, to which the Company applied cash flow hedge accounting treatment. One interest rate contract was terminated in the second quarter of 2008 for a pre-tax gain of $482,000 and another interest rate contract was terminated in the first quarter of 2009 for a pre-tax gain of $3.8 million. At the time of the terminations of these contracts, the forecasted transactions at the inception of the hedging relationship remained probable. Therefore, the realized gains were being amortized into earnings over the original term of the interest rate contracts from the date of termination. The Company terminated its remaining interest rate contract in the third quarter of 2009 for a pre-tax gain of $2.6 million. As of the end of the third quarter of 2009, the Company determined that the amount of loans eligible for hedge accounting under the terms of its hedge designation documentation had significantly decreased and that it was not probable that the Company would have $125 million of loans eligible for hedge accounting as established under the terms of its original hedge documentation. At September 30, 2009, approximately $40.1 million of loans were eligible for hedge accounting under the terms of the Company’s hedge designation. Gains recognized on terminated interest rate contracts no longer qualifying for hedge accounting totaled $3.1 million and were recorded in noninterest income in the third quarter of 2009. Gains totaling $0.6 million remained in Accumulated Other Comprehensive Income at September 30, 2009 to be amortized over the remaining term of the original designated hedging relationship.
Noninterest Expense
Noninterest expense consists of the following components:
| For the Year Ended December 31, | ||||||||||
| 2009 | 2008 | 2007 | ||||||||
| Salaries and employee benefits |
$ | 8,305 | $ | 9,202 | $ | 9,488 | ||||
| Net occupancy and equipment |
2,564 | 2,546 | 2,280 | |||||||
| Professional services |
1,993 | 1,202 | 1,579 | |||||||
| Data processing and communications |
1,218 | 1,029 | 959 | |||||||
| Federal deposit insurance |
2,040 | 378 | 103 | |||||||
| Foreclosed asset expense, net |
1,554 | 2,418 | 447 | |||||||
| Loan collection and related expenses |
867 | 360 | 91 | |||||||
| Interest rate contracts adjustments |
395 | (1,134 | ) | 215 | ||||||
| Goodwill impairment |
1,798 | — | — | |||||||
| Other expense |
3,490 | 3,412 | 3,559 | |||||||
| Total noninterest expense |
$ | 24,224 | $ | 19,413 | $ | 18,721 | ||||
34
Table of Contents
Salaries and employee benefits in 2009 were down $897,000, or 10 percent, compared with 2008. Salaries decreased $825,000 primarily related to staff reductions and costs related to stock-based compensation which decreased $303,500 due to the Company’s declining stock price and poor financial performance in 2009. Partially offsetting these decreases was an increase of $370,000 for higher employee medical claims and the generally rising trend in healthcare costs. The number of full-time equivalent employees was 111 at December 31, 2009, compared with 114 at December 31, 2008 and 142 at December 31, 2007. The decrease of 20 percent less employees at December 31, 2008 compared to year-end 2007 reflected management’s efforts to streamline operations and reduce overall employee related costs, while maintaining or improving customer service.
The increase in professional services of $791,000 in 2009 when compared with 2008 reflected higher legal expenses associated with nonperforming loans, costs related to professional assistance with the Company’s capital raising initiative and, to a lesser degree, external assistance with information technology initiatives. In 2008, expenses for professional services decreased $377,000 compared with 2007, primarily due to costs associated with first year implementation Sarbanes-Oxley compliance efforts which decreased by approximately $370,000.
FDIC deposit insurance assessments increased $1.7 million in 2009 when compared to 2008, reflecting the FDIC’s higher base assessment rate for 2009 and expenses related to the FDIC’s industry-wide emergency special assessment in the second quarter of 2009. FDIC premiums have increased due to the rise in financial institution failures in 2008 and 2009, the Company’s voluntary participation in the Temporary Liquidity Guarantee Program and the FDIC’s rates applicable to banks in the Company’s regulatory classification in 2009.
Foreclosed asset expenses were $1.6 million in 2009, compared with $2.4 million in 2008 and $0.4 million in 2007. Included in the 2009 and 2008 expenses were valuation adjustments of $1.1 million and $2.1 million, respectively, on OREO properties to reflect current appraised values. Management considers third-party appraisals, as well as independent fair market value assessments from realtors or persons involved in selling OREO, in determining the estimated fair value of particular properties. All costs incurred from the date of acquisition to maintain the property are expensed as incurred. Included in 2007 expenses was $422,000 of costs related to the Company’s share of a nationally syndicated equipment lease subsequent to its foreclosures. The increase in loan collection and related expenses of $507,000 in 2009, when compared with 2008, and $776,000 when compared with 2007, primarily reflected higher appraisal and collection expenses associated with nonperforming loans.
Included in total noninterest expense were non-cash charges of $395,000 and $215,000 in 2009 and 2007, respectively, and a non-cash credit of $1.1 million in 2008 for the ineffective portion of the change in fair value of its cash flow hedges. The Company began applying cash flow hedge accounting treatment, as prescribed by ASC Topic 815 (formerly SFAS No. 133, as amended), as of December 12, 2006 to all of its interest rate contracts. In a cash flow hedge, the effective portion of the change in the fair value of the hedging derivative is recorded in accumulated other comprehensive income and is subsequently reclassified into earnings during the same period in which the hedged item affects earnings. To the extent the Company’s hedges are ineffective in hedging interest income cash flows from variable rate loans, the ineffectiveness is recognized in the income statement and included in noninterest expenses.
As of December 31, 2009, management performed its annual goodwill impairment evaluation. In addition to the quantitative two-step analysis, management also considered certain qualitative information in its goodwill impairment analysis. Some of the qualitative factors were: the continued decline in stock values for financial services companies, including Cowlitz Bancorporation, which indicates that the value of goodwill for the industry, particularly for banks with a financial profile similar to ours, has been severely diminished; in 2009 the Company recorded a 100 percent valuation allowance against its deferred tax assets due to there being no assurance that the Company will generate future taxable income to utilize such assets; and the Bank is currently operating under a Consent Order with the FDIC requiring, among other things, increasing capital and profitability
35
Table of Contents
of the Bank, as well as restricting the Bank’s access to brokered deposits. After considering both the quantitative and qualitative factors in its impairment analysis, management recorded a 100 percent impairment charge against this asset at December 31, 2009.
Income Taxes
For the year 2009, the Company recorded tax expense of $8.9 million relative to a loss before income taxes of $25.9 million. As discussed in Note 12 “Income Taxes” to the Consolidated Financial Statements in Part II, Item 8, a 100 percent valuation allowance has been established against the Company’s net deferred tax assets as of December 31, 2009. Excluding the goodwill impairment charge and the impact of the deferred tax valuation allowance, the benefit for income taxes would have been 35.1 percent for 2009. This compares with benefit rates of 39.7 percent and 112.2 percent in 2008 and 2007, respectively. The Company’s annual tax benefit or expense is affected by the amounts of non-taxable loan, investment security and bank-owned life insurance income, as well as available tax credits.
At December 31, 2009, the Company had $17.6 million of net deferred tax assets which were comprised of tax-affected cumulative temporary differences, which have resulted, to a large extent, from the significant increase in the provision for credit losses. In evaluating the need for a valuation allowance, the Company considered all of the events and evidence available, including the Company’s three-year cumulative pre-tax loss position, income tax carry-back and carry-forward availability and difficulty in predicting future operating results. Management concluded that it is more likely than not that the majority of the net deferred tax assets will not be utilized in light of uncertainties surrounding the Company’s ability to generate sufficient taxable income. This determination was a result of recent events in the financial and real estate markets and management’s difficulty in forecasting future profit levels on a continuing basis. Therefore, at December 31, 2009, the Company recognized a valuation allowance to fully reserve against the net deferred tax asset. The Company incurred an additional income tax provision of $18.0 million in 2009 as a result of recognizing the valuation allowance against net deferred tax assets.
To the extent that the Company can generate taxable income in the future sufficient to offset the tax deductions represented by the net deferred tax asset, the non-cash valuation allowance that has been established may be partially or entirely reduced. If the valuation allowance is reduced or eliminated, future tax benefits will be recognized that will have a positive non-cash impact on the Company’s net income and stockholders’ equity.
36
Table of Contents
Financial Condition
The following table summarizes the dollar and percentage change from year to year for selected balance sheet items:
| December 31, | Increase (Decrease) | |||||||||||||||||||||||||
| (dollars in thousands) | 2009 | 2008 | 2007 | 12/31/09 - 12/31/08 | 12/31/08 - 12/31/07 | |||||||||||||||||||||
| (dollars) | (percent) | (dollars) | (percent) | |||||||||||||||||||||||
| Assets |
||||||||||||||||||||||||||
| Cash and cash equivalents |
$ | 139,705 | $ | 55,106 | $ | 31,251 | $ | 84,599 | 154 | % | $ | 23,855 | 76 | % | ||||||||||||
| Investment securities |
48,491 | 64,064 | 51,578 | (15,573 | ) | (24 | )% | 12,486 | 24 | % | ||||||||||||||||
| Loans, net of deferred fees |
343,327 | 433,215 | 397,325 | (89,888 | ) | (21 | )% | 35,890 | 9 | % | ||||||||||||||||
| Allowance for loan losses |
(10,164 | ) | (13,712 | ) | (5,801 | ) | 3,548 | (26 | )% | (7,911 | ) | 136 | % | |||||||||||||
| Cash surrender value of bank-owned life insurance |
15,560 | 14,942 | 14,328 | 618 | 4 | % | 614 | 4 | % | |||||||||||||||||
| Goodwill and other intangibles |
— | 1,798 | 1,834 | (1,798 | ) | (100 | )% | (36 | ) | (2 | )% | |||||||||||||||
| Other assets |
15,493 | 32,013 | 23,665 | (16,520 | ) | (52 | )% | 8,348 | 35 | % | ||||||||||||||||
| Total assets |
$ | 552,412 | $ | 587,426 | $ | 514,180 | $ | (35,014 | ) | (6 | )% | $ | 73,246 | 14 | % | |||||||||||
| Liabilities |
||||||||||||||||||||||||||
| Noninterest-bearing deposits |
$ | 46,510 | $ | 70,329 | $ | 91,662 | $ | (23,819 | ) | (34 | )% | $ | (21,333 | ) | (23 | )% | ||||||||||
| Interest-bearing deposits |
477,261 | 451,241 | 349,517 | 26,020 | 6 | % | 101,724 | 29 | % | |||||||||||||||||
| Total deposits |
523,771 | 521,570 | 441,179 | 2,201 | — | 80,391 | 18 | % | ||||||||||||||||||
| Fed funds and other borrowings |
6 | 51 | 1,179 | (45 | ) | (88 | )% | (1,128 | ) | (96 | )% | |||||||||||||||
| Junior subordinated debentures |
12,372 | 12,372 | 12,372 | — | — | — | — | |||||||||||||||||||
| Other liabilities |
4,208 | 4,652 | 3,910 | (444 | ) | (10 | )% | 742 | 19 | % | ||||||||||||||||
| Total liabilities |
540,357 | 538,645 | 458,640 | 1,712 | — | 80,005 | 17 | % | ||||||||||||||||||
| Shareholders’ Equity |
12,055 | 48,781 | 55,540 | (36,726 | ) | (75 | )% | (6,759 | ) | (12 | )% | |||||||||||||||
| Total liabilities and shareholders’ equity |
$ | 552,412 | $ | 587,426 | $ | 514,180 | $ | (35,014 | ) | (6 | )% | $ | 73,246 | 14 | % | |||||||||||
Investment Securities
All of the Bank’s securities are classified as available for sale and carried at fair value. From time to time securities may be sold to reposition the portfolio in response to strategies developed by the Bank’s asset liability committee. At December 31, 2009, 54 percent of the Company’s investment portfolio was mortgage-backed securities, 45 percent municipal bonds and one percent other securities. Except for the non-agency mortgage backed securities, the Company’s mortgage-backed securities are primarily highly rated, investment-grade securities issued by government-sponsored organizations. The Company has not invested in securities backed by sub-prime mortgages and believes its investment portfolio has negligible exposure to such risk at this date.
37
Table of Contents
The composition of the investment securities portfolio reflects management’s strategy regarding maintenance of an appropriate level of liquidity, while providing a relatively stable source of interest income. Management utilizes the securities portfolio to mitigate interest rate risk and credit risk inherent in the loan portfolio. In addition, investment securities provide a vehicle for the investment of available funds, a source of liquidity by pledging as collateral or through repurchase agreements and collateral for certain public funds deposits. The following table presents the composition and carrying value of the Company’s available for sale investment portfolio at December 31, 2009 and 2008.
| December 31, | ||||||||||||
| 2009 | 2008 | |||||||||||
| (dollars in thousands) | Amortized Cost |
Fair Value |
Amortized Cost |
Fair Value | ||||||||
| U.S. Agency mortgage-backed securities |
$ | 21,714 | $ | 22,736 | $ | 39,003 | $ | 39,818 | ||||
| Non-agency mortgage-backed securities |
4,186 | 3,385 | 3,971 | 2,414 | ||||||||
| Municipal bonds |
21,326 | 21,825 | 21,965 | 21,281 | ||||||||
| Other securities |
535 | 545 | 546 | 551 | ||||||||
| Total |
$ | 47,761 | $ | 48,491 | $ | 65,485 | $ | 64,064 | ||||
At December 31, 2009, the Company’s portfolio of investment securities totaled $48.5 million, compared with $64.1 million at December 31, 2008. The decrease in the Company’s total investment portfolio in 2009 was due primarily to paydowns of U.S. Agency mortgage-backed securities of $17.7 million.
At December 31, 2009, the market value of securities available for sale had net unrealized gains of $730,000, compared with net unrealized losses of $1.4 million at December 31, 2008. Gross unrealized gains totaled $1.7 million and unrealized losses totaled $976,000 at December 31, 2009. The majority of unrealized losses at December 31, 2009 related to non-agency mortgage-backed securities (“MBS”), with the balance related to certain municipal bonds. The Company believes the unrealized losses on municipal bonds are due to market conditions, not in estimated cash flows. The Company does not have the intent to sell these securities and does not anticipate that these securities will be required to be sold before anticipated recovery, and expects full principal and interest to be collected. Therefore, the Company does not consider its municipal bonds to be other-than-temporarily impaired (“OTTI”).
As of December 31, 2009, gross unrealized losses related to the Company’s non-agency MBS was $823,000, or 20 percent, of the aggregate cost basis of these securities. The gross unrealized losses associated with these securities were primarily due to extraordinarily high investor yield requirements resulting from an extremely illiquid market, significant uncertainty about the future condition of the mortgage market and economy, and continued deterioration in the credit performance of loan collateral underlying these securities, causing these securities to be valued at significant discounts to their acquisition cost. The Company has three non-agency MBS, two of which have been in a loss position for greater than 12 months. The Company’s analysis on one non-agency MBS rated less than investment grade indicated a shortfall of estimated contractual cash flows to the tranche of this security owned by the Company. The difference between management’s estimate of the present value of the cash flows expected to be collected and the amortized cost basis is considered to be uncollectible. Accordingly, the Company recorded OTTI losses of $86,000 because the losses were credit related and it is probable the Company will not recover the entire cost basis of the security. Management will continue to monitor the credit performance of this security and if the performance deteriorates from current levels, additional OTTI losses may be recognized in the future. The unrealized losses on the two other securities were due to changes in market interest rates or widening of market spreads subsequent to the initial purchase of the securities and not credit quality. The Company does not have the intent to sell these securities and does not anticipate that these securities will be required to be sold before anticipated recovery, and expects full principal and interest to be collected. Therefore, the Company does not consider these investments to be OTTI at December 31, 2009.
38
Table of Contents
The following table summarizes the fair value of the contractual or estimated maturities and average yields of the Company’s investment securities at December 31, 2009.
| (dollars in thousands) | One year or less |
Yield | One through 5 years |
Yield | After 5 through 10 years |
Yield | After 10 years |
Yield | Total | Yield | ||||||||||||||||||||
| U.S. Agency mortgage-backed securities |
$ | 8,297 | 5.85 | % | $ | 14,439 | 5.33 | % | $ | — | — | $ | — | — | $ | 22,736 | 5.52 | % | ||||||||||||
| Non-agency mortgage-backed securities |
— | — | 2,290 | 6.24 | % | 1,095 | 6.15 | % | — | — | 3,385 | 6.22 | % | |||||||||||||||||
| Municipal bonds (1) |
419 | 3.44 | % | 2,234 | 3.87 | % | 11,328 | 4.20 | % | 7,844 | 4.37 | % | 21,825 | 4.21 | % | |||||||||||||||
| Other securities |
— | — | — | — | — | — | 545 | 3.71 | % | 545 | 3.71 | % | ||||||||||||||||||
| Total |
$ | 8,716 | 5.73 | % | $ | 18,963 | 5.31 | % | $ | 12,423 | 4.39 | % | $ | 8,389 | 4.33 | % | $ | 48,491 | 4.98 | % | ||||||||||
| (1) | Interest earned on tax-exempt securities has been computed on a 34 percent tax-equivalent basis. |
For the purposes of the maturity schedule, mortgage-backed securities, which are not due at a single maturity date, have been allocated over maturity groupings based on the expected maturity of the underlying collateral. Mortgage-backed securities may mature earlier than their stated contractual maturities because of accelerated principal repayments of the underlying loans.
Restricted Equity Securities
Restricted equity securities were $1.2 million at December 31, 2009 and 2008, and consisted primarily of the Bank’s investment in the Federal Home Loan Bank of Seattle (“FHLB”). FHLB stock is carried at par and does not have a readily determinable fair value. Ownership of FHLB stock is restricted to the FHLB and member institutions, and can only be purchased and redeemed at par.
Although as of September 30, 2009, the FHLB of Seattle met all of its regulatory requirements (including the risk-based capital requirement), on November 6, 2009, the Finance Agency reaffirmed the FHLB of Seattle capital classification as undercapitalized. In the FHLB’s February 22, 2010 press release regarding its 2009 financial results, the FHLB stated it again met all of its regulatory capital requirements at December 31, 2009, including its risk-based capital requirement. The Finance Agency previously indicated that it would not change the capital classification to adequately capitalized until the Finance Agency believes the FHLB has demonstrated sustained performance in line with an approved capital restoration plan.
Management periodically evaluates FHLB stock for other-than-temporary or permanent impairment. Management’s determination of whether these investments are impaired is based on its assessment of the ultimate recoverability of cost rather than by recognizing temporary declines in value. The determination of whether a decline affects the ultimate recoverability of cost is influenced by criteria such as: (1) the significance of any decline in net assets of the FHLB as compared to the capital stock amount for the FHLB and the length of time this situation has persisted; (2) commitments by the FHLB to make payments required by law or regulation and the level of such payments in relation to the operating performance of the FHLB; (3) the impact of legislative and regulatory changes on institutions and, accordingly, the customer base of the FHLB; and (4) the liquidity position of the FHLB.
Under Federal Housing Finance Agency regulations, a FHLB that fails to meet any regulatory capital requirement may not declare a dividend or redeem or repurchase capital stock in excess of what is required for members’ current loans. Moody’s Investors Service (Moody’s) current assessment of the FHLB’s portfolios indicates that the true economic losses embedded in these securities are significantly less than the accounting impairments would suggest and are manageable given the FHLB’s capital levels. According to Moody’s, the large difference between the expected economic losses and the mark-to-market impairment losses for accounting purposes is attributed to market illiquidity, de-leveraging and stress in the credit market in general. The FHLBs
39
Table of Contents
have access to the U.S. Government-Sponsored Enterprise Credit Facility, a secured lending facility that serves as a liquidity backstop, substantially reducing the likelihood that the FHLBs would need to sell securities to raise liquidity and, thereby, cause the realization of large economic losses. In addition, the Federal Reserve has begun to purchase direct debt obligations of Freddie Mac, Fannie Mae and the FHLBs. Moody’s has stated that their Aaa senior debt rating and Prime-1 short-term debt rating for the FHLB system are likely to remain unchanged based on expectations that the FHLBs have a very high degree of government support. Moody’s rating of the FHLB as Aaa with stable outlook was reaffirmed in May 2009, and Standard and Poors rating of AA+ was reaffirmed in August 2009. Based on the above, the Company has determined there is not an other-than-temporary impairment on the FHLB stock investment as of December 31, 2009.
Loans
Total loans outstanding were $343.3 million and $433.2 million at December 31, 2009 and 2008, respectively. The Company reduced loans $89.9 million, or 21 percent when compared to year-end 2008 balances. This strategic loan reduction reflected the Company’s goals of reducing real estate loan concentrations and decreasing assets to reduce its capital requirements. Loan reductions have been achieved primarily through non-renewal of loans. Loan charge-offs also contributed to reduced loan balances. Unfunded loan commitments were $28.0 million and $60.6 million at December 31, 2009 and 2008, respectively. Management believes that the Bank’s available resources will be sufficient to fund its commitments in the normal course of business.
The following table presents the composition of the Company’s loan portfolio in accordance with bank regulatory classifications and the balance of allowance for loan losses at the dates indicated.
| December 31, | |||||||||||||||||||||||||||||||||||
| 2009 | 2008 | 2007 | 2006 | 2005 | |||||||||||||||||||||||||||||||
| (dollars in thousands) | Amount | Percent | Amount | Percent | Amount | Percent | Amount | Percent | Amount | Percent | |||||||||||||||||||||||||
| Commercial |
$ | 69,726 | 20.3 | % | $ | 113,991 | 26.3 | % | $ | 109,846 | 27.6 | % | $ | 80,411 | 22.4 | % | $ | 75,974 | 28.1 | % | |||||||||||||||
| Real estate: |
|||||||||||||||||||||||||||||||||||
| Construction |
42,058 | 12.2 | % | 93,191 | 21.5 | % | 83,766 | 21.0 | % | 98,736 | 27.5 | % | 46,281 | 17.0 | % | ||||||||||||||||||||
| Residential 1-4 family |
38,792 | 11.3 | % | 36,662 | 8.4 | % | 32,480 | 8.2 | % | 37,190 | 10.3 | % | 25,361 | 9.4 | % | ||||||||||||||||||||
| Multifamily |
15,535 | 4.5 | % | 3,028 | 0.7 | % | 6,298 | 1.5 | % | 11,025 | 3.1 | % | 11,999 | 4.4 | % | ||||||||||||||||||||
| Commercial |
175,105 | 50.9 | % | 184,213 | 42.4 | % | 162,344 | 40.7 | % | 128,655 | 35.7 | % | 108,041 | 39.9 | % | ||||||||||||||||||||
| Installment and other consumer |
2,604 | 0.8 | % | 3,146 | 0.7 | % | 3,785 | 1.0 | % | 3,451 | 1.0 | % | 3,194 | 1.2 | % | ||||||||||||||||||||
| Total loans, gross |
343,820 | 100.0 | % | 434,231 | 100.0 | % | 398,519 | 100.0 | % | 359,468 | 100.0 | % | 270,850 | 100.0 | % | ||||||||||||||||||||
| Deferred loan fees |
(493 | ) | (1,016 | ) | (1,194 | ) | (1,078 | ) | (603 | ) | |||||||||||||||||||||||||
| Loans, net of deferred loan fees |
343,327 | 433,215 | 397,325 | 358,390 | 270,247 | ||||||||||||||||||||||||||||||
| Allowance for loan losses |
(10,164 | ) | (13,712 | ) | (5,801 | ) | (4,481 | ) | (4,668 | ) | |||||||||||||||||||||||||
| Total loans, net |
$ | 333,163 | $ | 419,503 | $ | 391,524 | $ | 353,909 | $ | 265,579 | |||||||||||||||||||||||||
Commercial and Industrial Loans
Commercial and industrial loans totaled $69.7 million, or 20 percent of the total loan portfolio, a decrease of approximately 39 percent over the balance at year-end 2008 reflecting management’s efforts to reduce loans in general, to de-leverage the Bank and reduce capital requirements.
Real Estate Loans
Real estate loans have historically represented a significant portion of the Company’s total loan portfolio and real estate is often a material component of collateral for the Company’s loans. In many cases, loans that are designated real estate secured were granted for consumer and business purposes other than the acquisition of real
40
Table of Contents
estate. Total real estate secured loans were 79 percent of the total loan portfolio at December 31, 2009 compared with 73 percent of year-end 2008. Risks associated with real estate loans include fluctuating land values, demand and prices for housing or commercial properties, national, regional and local economic conditions, changes in tax policy, and concentrations within the Bank’s market area. The Company’s loan origination process requires specialized underwriting, collateral and approval procedures, which mitigates but does not eliminate the risk that loans may not be repaid.
The Company’s construction and land development loans as of December 31, 2009 were 12 percent of the total loan portfolio, compared with 22 percent as of December 31, 2008, and down $51.1 million from December 31, 2008. The decrease primarily related to loan payoffs and the suspension of solicitation of additional business in construction and land development loans, as well as charge-offs. The following table illustrates real estate construction loans by project type.
| December 31, | ||||||
| 2009 | 2008 | |||||
| Residential construction |
||||||
| 1-4 family residential |
$ | 4,601 | $ | 18,386 | ||
| Multi-family/condominiums |
557 | 12,636 | ||||
| Residential land development |
21,253 | 22,621 | ||||
| Commercial construction |
15,647 | 39,548 | ||||
| $ | 42,058 | $ | 93,191 | |||
Residential Construction Loans. Residential construction, which includes 1-4 family residential, multi-family and condominiums, represents financing where the obligor generally intends to own the home upon construction (pre-sold) or builder construction of home for resale (speculative construction). With the recent turmoil in the mortgage markets, no assurance can be made that committed take-out financing will be available at conclusion of construction for pre-sold construction loans. Speculative construction lending finances builders/contractors who rely on sale of completed homes to repay loans. Due to the nationwide downturn in residential real estate, certain builders have been affected by longer marketing periods for their constructed homes, reduced borrower liquidity and falling collateral values.
Residential Land Development Loans. Residential land development loans represent loans to developers for the purpose of acquiring raw land and/or for the subsequent development and sale of residential lots. The primary source of repayment of such loans is generally cash flow from developer sale of lots or improved parcels of land where real estate collateral, secondary sources and personal guarantees may provide an additional measure of security for such loans. The nationwide downturn in residential real estate has affected certain developers by reducing their cash flows due to sluggish sales, lengthening the marketing period for their projects and sharply declining underlying loan collateral values. Weakness in this category of loans contributed significantly to the elevated level of provision for credit losses in 2009.
Commercial Construction Loans. Commercial construction balances represent lending to finance the construction or development of commercial properties. Obligors may be the business owner/occupier of the building who intends to operate its business from the property upon construction, or non-owner (speculative) developers. The expected source of repayment of these loans is typically the sale or refinancing of the project upon completion of the construction phase. In certain circumstances, the Company may provide or commit to take-out financing upon construction. Take-out financing is subject to the project meeting specific underwriting guidelines. While our portfolio of these loans has not experienced the severe credit quality challenges experienced in residential construction projects, there can be no assurance that the credit quality in this portfolio will not be affected should the challenging economic conditions of the present persist.
Residential One-to-Four Family Loans. Residential one-to-four family loans are used by the Bank to collateralize advances from the FHLB. The Company’s underwriting standards require that one-to-four family
41
Table of Contents
portfolio loans generally be owner-occupied and that loan amounts not exceed 80 percent (90 percent with private mortgage insurance) of the appraised value or cost, whichever is lower, of the underlying collateral at origination. The Company utilizes an outsourced residential lending underwriting platform. Residential loans are originated on a pre-sold basis provided they meet the underwriting criteria established by our third party provider. If circumstances warrant, the Company may originate and retain loans that fall outside the scope of our third party provider’s underwriting guidelines. However, the Company does not underwrite residential real estate loans for the subprime market.
Commercial Real Estate. Commercial real estate loans as of December 31, 2009 were $175.0 million or 51 percent of the total loan portfolio. Commercial real estate generally represent loans to finance retail, office and industrial commercial properties, both owner-occupied and non-owner occupied. The expected source of repayment is generally the operations of the borrower’s business, rents or the obligor’s personal income. Management believes that commercial real estate collateral may provide an additional measure of security for these loans, and that lending to owner-occupied businesses mitigates, but does not eliminate, commercial real estate risk. The Company’s commercial real estate portfolio to-date has experienced low delinquency rates and only modest deterioration in the present downturn. However, no assurance can be given that residential real estate or other economic factors will not affect this portfolio.
| December 31, | ||||||
| 2009 | 2008 | |||||
| Commercial real estate |
||||||
| Owner occupied |
$ | 103,468 | $ | 95,098 | ||
| Non-owner occupied |
71,637 | 89,115 | ||||
| $ | 175,105 | $ | 184,213 | |||
The following table shows the contractual maturities of the Company’s loans, before deferred loan fees, at December 31, 2009:
| December 31, 2009 | ||||||||||||
| (dollars in thousands) | Due in one year or less |
Due after one year through five years |
Due after five years |
Total Loans | ||||||||
| Commercial |
$ | 30,365 | $ | 26,917 | $ | 12,444 | $ | 69,726 | ||||
| Real estate: |
||||||||||||
| Contruction |
28,411 | 13,501 | 146 | 42,058 | ||||||||
| Residential 1-4 family |
7,738 | 12,376 | 18,678 | 38,792 | ||||||||
| Multifamily |
12,957 | 1,812 | 766 | 15,535 | ||||||||
| Commercial |
33,454 | 54,177 | 87,474 | 175,105 | ||||||||
| Installment and other consumer |
1,479 | 600 | 525 | 2,604 | ||||||||
| Total loans |
$ | 114,404 | $ | 109,383 | $ | 120,033 | $ | 343,820 | ||||
| Loans with fixed interest rates |
$ | 21,736 | $ | 75,105 | $ | 56,085 | $ | 152,926 | ||||
| Loans with variable interest rates |
92,668 | 34,278 | 63,948 | 190,894 | ||||||||
| Total loans |
$ | 114,404 | $ | 109,383 | $ | 120,033 | $ | 343,820 | ||||
Allowance for Credit Losses and Credit Quality
Credit risk is inherent in the Bank’s lending activities. The allowance for credit losses represents management’s estimate of inherent losses in the portfolio as of the date of the financial statements. The loan portfolio is regularly reviewed to evaluate the adequacy of the allowance for credit losses. In determining the
42
Table of Contents
level of the allowance, the Company estimates losses inherent in all loans and commitments to make loans, and evaluates nonperforming loans to determine the amount, if any, necessary for a specific reserve. An important element in determining the adequacy of the allowance for credit losses is an analysis of loans by loan risk-rating categories. At a loan’s inception and periodically throughout the life of the loan, management evaluates the credit risk by using a risk-rating system. This grading system currently includes eleven levels of risk. Risk ratings range from “1” for the strongest credits to “10” for the weakest. A “10” rated loan would normally represent a loss. All loans rated 7-10 collectively comprise the Company’s “Watch List”. The specific grades from 7-10 are “watch list” (risk-rating 7), “special mention” (risk-rating 7.5), “substandard” (risk-rating 8), “doubtful” (risk-rating 9), and “loss” (risk-rating 10). When indicators such as operating losses, collateral impairment or delinquency problems show that a credit may have weakened, the credit will be downgraded as appropriate. Similarly, as borrowers bring loans current, show improved cash flows or improve the collateral position of a loan, the credits may be upgraded. The result of management’s ongoing evaluations and the risk ratings of the portfolio is an allowance currently consisting of four components: specific; general; special; and an amount available for other factors.
Specific Allowance. Loans on the Bank’s Watch List, as described above, are specifically reviewed and analyzed. Management considers in its analysis expected future cash flows, the value of collateral and other factors that may impact the borrower’s ability to pay. When significant conditions or circumstances exist on an individual loan indicating greater risk, a specific allowance may be allocated in addition to the general allowance percentage for that particular risk-rating.
General Allowance. All loans that do not require a specific allocation are subject to a general allocation based upon historic loss factors. In developing these loss factors, the portfolio is segmented into four categories (consumer, commercial and industrial, real estate construction and term commercial real estate). For each segment, a five-year loss migration analysis is performed to determine the probability and severity of losses as loans migrate downward through the Company’s risk-rating categories. In determining the probability and severity of losses to estimate losses inherent in the loan portfolio segments at December 31, 2009, the Company used a rolling three-year period weighted so as to provide more effect of recent loss experience on the results. At December 31, 2008, the Company used an unweighted five-year period to estimate losses.
Special Allowance. Special allowances are established to facilitate changes in the Bank’s strategy and other factors. Special allocations are to take into consideration various factors that include, but are not limited to:
| • | effectiveness of credit administration; |
| • | adequacy of loan review; |
| • | the adequacy of loan operations personnel and processes; |
| • | the trend in loan growth and the percentage of change; |
| • | the level of geographic and/or industry concentration; |
| • | the effect of competitive issues that impact loan underwriting and structure; |
| • | the impact of economic conditions, including interest rate trends; |
| • | the introduction of new loan products or special marketing efforts; |
| • | large credit exposure and trends |
Amounts Available for Other Factors. Management also attempts to ensure that the overall allowance appropriately reflects a margin for the imprecision necessarily inherent in estimates of expected credit losses. The quarterly analysis of specific and general allocations of the allowance is the principal method relied upon by management to ensure that changes in estimated credit loss levels are adjusted on a timely basis. In the analysis of the specific and general allocations of the allowance, management considers bank regulatory exam results and findings of external credit examiners in its quarterly evaluation of the allowance for credit losses.
43
Table of Contents
Liability for Unfunded Credit Commitments. Management determines the adequacy of the liability for unfunded credit commitments based upon reviews of individual credit facilities, current economic conditions, the risk characteristics of the various categories of commitments and other relevant factors. The liability is based on estimates, which are evaluated on a regular basis, and, as adjustments become necessary, they are reported in earnings in periods in which they become known.
Loans and other extensions of credit deemed uncollectible are charged to the allowance for loan losses. Subsequent recoveries, if any, are credited to the allowance. Draws on unfunded commitments that are considered uncollectible at the time funds are advanced are charged to the allowance for loan losses. Provisions for unfunded commitment losses are added to the liability for unfunded commitments, which is included in other liabilities in the consolidated balance sheets. Actual losses may vary from current estimates and the amount of the provision for credit losses may be either greater than or less than actual net charge-offs when and if they occur. The related provision for credit losses that is charged to income is the amount necessary to adjust the allowance for credit losses to the level determined through the above process.
The following table shows the components of the allowance for credit losses at the dates indicated:
| December 31, 2009 | December 31, 2008 | |||||||||||
| (dollars in thousands) | Amount | Percent | Amount | Percent | ||||||||
| General |
$ | 8,227 | 79 | % | $ | 5,615 | 40 | % | ||||
| Specific |
1,720 | 17 | % | 98 | 1 | % | ||||||
| Special |
379 | 4 | % | 8,281 | 59 | % | ||||||
| Amounts available for other factors |
30 | — | % | — | — | % | ||||||
| Total allowance for credit losses |
$ | 10,356 | 100 | % | $ | 13,994 | 100 | % | ||||
Management’s evaluation of the loan portfolio resulted in a total allowance for credit losses of $10.4 million at December 31, 2009 and $14.0 million at December 31, 2008. The allowance for credit losses, as a percentage of total loans, was 3.02 percent on December 31, 2009 compared with 3.23 percent at December 31, 2008. The shift in the component allocations when comparing year-end 2009 amounts with year-end 2008 amounts related primarily to the Company’s change to a shorter loss migration period used in the determination of the general component of the allowance for credit losses. Using a shorter migration period in 2009 provided more effect of recent loss experience in the general allowance and reduced the amount management determined necessary to address the various factors considered as part of the Bank’s special allowance. For loans considered impaired, specific allowances are provided in the event that the specific collateral analysis on each problem loan indicates that the liquidation of the collateral would not result in repayment of these loans if the loan is collateral dependent or if the present value of expected future cash flows on the loan is less than the balance. It is the Company’s general policy to recognize as charge-offs any specific allowances for known losses in lieu of carrying such amounts as a specific component of the allowance for credit losses. Specific reserves totaling $1.7 million were recorded on three impaired loans.
The allowance for credit losses is based upon estimates of probable losses inherent in the loan portfolio and the Company’s commitments to extend credit to borrowers. Overall, management believes that the allowance for credit losses is sufficient to absorb losses inherent in the loan portfolio at December 31, 2009, although there can be no assurance that future loan losses will not exceed management’s current estimates or that the level of nonperforming loans will subside.
Charge-offs in 2009, before recoveries, totaled $27.9 million. Of the total charge-offs, $18.0 million, or 64 percent, were real estate construction loans and $5.6 million related to commercial loans. Real estate construction loans accounted for 12 percent of the total loan portfolio at December 31, 2009 and 40 percent of the total loans on nonaccrual status. At December 31, 2008, real estate construction loans were 21 percent of the total loan portfolio and 56 percent of nonaccrual loans. Charge-offs of loans classified as residential 1-4 family total $2.5 million in 2009, significantly higher than prior periods. Approximately 78 percent of the 2009 residential 1-4 family loan charge-offs were related to residential real estate developers that pledged their personal residences as collateral for real estate construction loans.
44
Table of Contents
The following table shows the Company’s loan loss performance for the periods indicated:
| For the Year Ended December 31, | ||||||||||||||||||||
| (dollars in thousands) | 2009 | 2008 | 2007 | 2006 | 2005 | |||||||||||||||
| Loans outstanding at end of period, net of deferred fees |
$ | 343,327 | $ | 433,215 | $ | 397,325 | $ | 358,390 | $ | 270,247 | ||||||||||
| Average loans outstanding during the period |
399,091 | 428,014 | 383,477 | 319,577 | 219,882 | |||||||||||||||
| Allowance for credit losses, beginning of period |
$ | 13,994 | $ | 5,990 | $ | 4,825 | $ | 4,668 | $ | 3,796 | ||||||||||
| Loans charged off: |
||||||||||||||||||||
| Commercial |
5,550 | 2,592 | 73 | 2,576 | 627 | |||||||||||||||
| Real estate: |
||||||||||||||||||||
| Construction |
17,953 | 6,257 | 6,701 | — | — | |||||||||||||||
| Residential 1-4 family |
2,514 | 150 | — | 36 | 89 | |||||||||||||||
| Commercial |
1,762 | 613 | 235 | 70 | 1,000 | |||||||||||||||
| Consumer and other |
152 | 78 | 61 | 109 | 101 | |||||||||||||||
| Total loans charged off |
27,931 | 9,690 | 7,070 | 2,791 | 1,817 | |||||||||||||||
| Recoveries: |
||||||||||||||||||||
| Commercial |
1,477 | 30 | 319 | 276 | 74 | |||||||||||||||
| Real estate: |
||||||||||||||||||||
| Construction |
490 | 2 | 33 | — | — | |||||||||||||||
| Residential 1-4 family |
28 | 8 | — | — | 50 | |||||||||||||||
| Commercial |
17 | 29 | 4 | 3 | 4 | |||||||||||||||
| Consumer |
20 | 30 | 79 | 29 | 39 | |||||||||||||||
| Total recoveries |
2,032 | 99 | 435 | 308 | 167 | |||||||||||||||
| Net loans charged off during the period |
25,899 | 9,591 | 6,635 | 2,483 | 1,650 | |||||||||||||||
| Provision for credit losses |
22,261 | 17,595 | 7,800 | 2,640 | 870 | |||||||||||||||
| Adjustment incident to acquisition |
— | — | — | — | 1,651 | |||||||||||||||
| Allowance for credit losses, end of period |
$ | 10,356 | $ | 13,994 | $ | 5,990 | $ | 4,825 | $ | 4,667 | ||||||||||
| Ratio of net loans charged off to average loans outstanding |
6.49 | % | 2.24 | % | 1.73 | % | 0.78 | % | 0.75 | % | ||||||||||
| Components: |
||||||||||||||||||||
| Allowance for loan losses |
$ | 10,164 | $ | 13,712 | $ | 5,801 | $ | 4,481 | $ | 4,668 | ||||||||||
| Liability for unfunded credit commitments (1) |
192 | 282 | 189 | 344 | — | |||||||||||||||
| Total allowance for credit losses |
$ | 10,356 | $ | 13,994 | $ | 5,990 | $ | 4,825 | $ | 4,668 | ||||||||||
| Allowance for loan losses/total loans |
2.96 | % | 3.17 | % | 1.46 | % | 1.25 | % | 1.73 | % | ||||||||||
| Allowance for credit losses/total loans |
3.02 | % | 3.23 | % | 1.51 | % | 1.35 | % | 1.73 | % | ||||||||||
| Allowance for loan losses/nonperforming loans |
21 | % | 87 | % | 54 | % | 394 | % | 112 | % | ||||||||||
| Allowance for credit losses/nonperforming loans |
21 | % | 89 | % | 55 | % | 424 | % | 112 | % | ||||||||||
| (1) | During the first quarter of 2006, the portion of the allowance for loan losses related to unfunded credit commitments, was reclassified from the allowance for loan losses to other liabilities on the balance sheet. Amounts for 2005 were not material. |
At December 31, 2009, the Company’s recorded investment in impaired loans was $48.5 million, compared with $31.8 million at December 31, 2008. Specific reserves of $1.7 million were recorded on three loans totaling $4.3 million at December 31, 2009. The Company’s impaired loans are expected to be resolved over the coming quarters; however, further declines in collateral market prices could materially affect the Company’s results of operations and financial condition.
45
Table of Contents
The Company reviews the loans in its portfolio regularly for impaired loans. A loan is impaired when, based on current information and events, it is probable that the Bank will be unable to collect all interest and principal due. A loan is not considered to be impaired during a period of minimal delay (less than 90 days) unless available information strongly suggests impairment. The Bank measures impaired loans based on the present value of expected future cash flows discounted at the loan’s effective interest rate or, as a practical expedient, at the loan’s observable market price or the fair market value of the collateral if the loan is collateral dependent. In determining the fair value of collateral, the Company obtains external appraisals. Appraisals are obtained at least annually and more frequently if market factors dictate. Appraisals are obtained from a list of pre-approved independent, third party, local appraisal firms. Approval and addition to the list is based on experience, reputation, character, consistency and knowledge of the respective real estate market. At a minimum, it is ascertained that the appraiser is: (a) currently licensed in the state in which the property is located; (b) is experienced in the appraisal of properties similar to the property being appraised; (c) is actively engaged in the appraisal work; (d) has knowledge of current real estate market conditions and financing trends; (e) is reputable; and (f) is not on Freddie Mac’s nor the Bank’s Exclusionary List of appraisers and brokers. Upon receipt and review, an external appraisal is utilized to measure a loan for potential impairment. Our impairment analysis documents the date of the appraisal used in the analysis, whether the officer preparing the report deems it current, and, if not, allows for internal valuation adjustments with justification. Typical justified adjustments might include discounts for continued market deterioration subsequent to appraisal date, adjustments for the release of collateral contemplated in the appraisal, or the value of other collateral or consideration not contemplated in the appraisal. An appraisal over one year old in most cases will be considered stale dated and an updated or new appraisal will be required. Any adjustments from appraised value to net realizable value are detailed and justified in the impairment analysis, which is reviewed and approved by senior credit officers and the Company’s Chief Credit Administrator. Although an external appraisal is the primary source to value collateral dependent loans, we may also utilize values obtained through purchase and sale agreements, broker price opinions, or the sales price of the note. These alternative sources of value are used only if deemed to be more representative of value based on updated information regarding collateral resolution. Impairment analyses are updated, reviewed and approved on a quarterly basis at or near the end of each reporting period. Based on these processes, we do not believe there are significant time lapses for the recognition of additional loan loss provisions or charge-offs from the date they become known.
At December 31, 2009, loans evaluated for impairment total approximately 14 percent of the total loan portfolio, compared with seven percent at year-end 2008. The high proportion of impaired loans in 2009 led to higher charge-offs, as well as faster recognition of charge-offs. Real estate construction loans, the primary driver of nonperforming loans and charge-offs in 2009, 2008 and 2007, have decreased to 12 percent of the total loan portfolio at year-end 2009, with approximately 46 percent of the Company’s real estate construction loans evaluated for impairment at December 31, 2009. These factors were the primary reason for the ratio of the allowance for loan losses to nonperforming loans to decline at December 31, 2009 from the level at December 31, 2008.
46
Table of Contents
Nonperforming Assets
Nonperforming assets include repossessed real estate or other assets and loans for which the accrual of interest has been suspended. The following table presents information on the Company’s nonperforming assets, classified by bank regulatory guidelines for the preparation of the call report, and loans past due greater than 90 days and still accruing interest at the dates indicated:
| December 31, | ||||||||||||||||||||
| (dollars in thousands) | 2009 | 2008 | 2007 | 2006 | 2005 | |||||||||||||||
| Loans on nonaccrual status |
||||||||||||||||||||
| Commercial |
$ | 5,668 | $ | 1,429 | $ | 190 | $ | 1,137 | $ | 2,912 | ||||||||||
| Real estate |
||||||||||||||||||||
| Construction |
||||||||||||||||||||
| 1-4 family residential |
2,394 | 2,335 | 2,879 | — | — | |||||||||||||||
| Other construction |
17,097 | 6,503 | 7,657 | — | 1,107 | |||||||||||||||
| Total construction |
19,491 | 8,838 | 10,536 | — | 1,107 | |||||||||||||||
| Residential 1-4 family |
7,476 | 994 | — | — | 137 | |||||||||||||||
| Multi-family |
— | 90 | — | — | — | |||||||||||||||
| Commercial real estate |
15,846 | 4,338 | 101 | — | — | |||||||||||||||
| Total real estate |
42,813 | 14,260 | 10,637 | — | 1,244 | |||||||||||||||
| Installment and other consumer |
— | — | — | — | — | |||||||||||||||
| Total nonaccrual loans |
48,481 | 15,689 | 10,827 | 1,137 | 4,156 | |||||||||||||||
| Other real estate owned |
4,348 | 4,838 | 2,240 | — | — | |||||||||||||||
| Other repossessed assets |
— | — | 10 | 622 | — | |||||||||||||||
| Total nonperforming assets |
$ | 52,829 | $ | 20,527 | $ | 13,077 | $ | 1,759 | $ | 4,156 | ||||||||||
| Total assets |
$ | 552,412 | $ | 587,426 | $ | 514,180 | $ | 468,395 | $ | 370,095 | ||||||||||
| Percentage of nonperforming assets to total assets |
9.56 | % | 3.49 | % | 2.54 | % | 0.38 | % | 1.12 | % | ||||||||||
| Percentage of nonaccrual loans to total loans |
14.12 | % | 3.62 | % | 2.72 | % | 0.32 | % | 1.54 | % | ||||||||||
| Loans past due greater than 90 days and accruing |
$ | — | $ | 6,247 | $ | 149 | $ | — | $ | — | ||||||||||
Total nonperforming assets at December 31, 2009 were $52.8 million, compared with $20.5 million at December 31, 2008. The increase in nonperforming assets was attributable to continued financial stress on borrowers and nonperformance. The economy in the Bank’s market area is dependent to a significant degree on real estate and related industries (i.e. construction, housing). Although the Bank maintains a diversified loan portfolio, the present downturn in real estate, including construction, has had an adverse effect on borrowers’ ability to repay all types of loans and has affected the Company’s results of operations and financial condition. The Bank frequently reviews and updates its underwriting guidelines and monitors its delinquency levels for any negative or adverse trends and adjusts projected loan concentration limits and credit standards when necessary. Management remains concerned about the residential housing slowdown and the effect it has had on credit quality. Management has increased monitoring of construction and land acquisition loans and has ceased originations in these portfolios.
Generally, no interest is accrued on loans when factors indicate collection of interest is doubtful or when principal or interest payments become 90 days past due, unless collection of principal and interest are anticipated within a reasonable period of time and the loans are well secured. For such loans, previously accrued but uncollected interest is charged against current earnings, and income is only recognized to the extent payments are subsequently received and collection of the remaining recorded principal balance is considered probable. Interest income foregone on impaired loans was approximately $3.4 million, $0.8 million and $1.0 million in 2009, 2008 and 2007, respectively.
47
Table of Contents
There were no loans accounted for as troubled debt restructurings at December 31, 2009 and 2008. Restructuring of a loan may be granted in response to borrower financial difficulty and will generally provide for a temporary modification of loan repayment terms. Modification of terms such as one or a combination of the following would classify the debt as a troubled debt restructuring:
| • | Reduction of the stated interest rate for the remaining original life of the debt. |
| • | Extension of the maturity date or dates at a stated interest rate lower than the current market rate for new debt with similar risk. |
| • | Reduction of the face amount or maturity amount of the debt as stated in the instrument or other agreement. |
| • | Reduction of accrued interest. |
Nonaccrual loans at December 31, 2009 totaled $48.5 million compared with $15.7 million at December 31, 2008. At December 31, 2009, approximately 88 percent of total nonaccrual loans were real estate secured. The majority of the real estate collateral is located in the Puget Sound area of northern Washington and Portland, Oregon/Vancouver, Washington metropolitan area. Loans placed on nonaccrual during 2009 totaled $80.6 million. Of these loans, $45.4 million related to real estate construction and development loans and $16.8 million to commercial real estate loans. Commercial and industrial loans placed on nonaccrual in 2009 totaled $13.5 million. Loans totaling $6.2 million were foreclosed and transferred to other real estate owned. Of the loans placed on nonaccrual in 2008, $16.2 million were real estate construction and development related, $5.0 million were commercial real estate loans and $2.6 million were commercial and industrial loans. The following table presents activity in nonaccrual loans for 2009 and 2008:
| December 31, | ||||||||
| (dollars in thousands) | 2009 | 2008 | ||||||
| Beginning balance, January 1 |
$ | 15,689 | $ | 10,827 | ||||
| Additions to nonaccrual |
80,626 | 25,552 | ||||||
| Payments |
(19,058 | ) | (4,711 | ) | ||||
| Charge-offs |
(22,609 | ) | (9,041 | ) | ||||
| Transfers to foreclosed assets |
(6,167 | ) | (6,938 | ) | ||||
| Ending balance, December 31 |
$ | 48,481 | $ | 15,689 | ||||
Upon acquisition of real estate collateral through foreclosure, the property is promptly marketed for sale. If offers or indication of interest are not received within a short period of time, the offering price is analyzed and market conditions reviewed to assess whether a lower price reflects the market of the property and would enable a sale of the property. Property appraisals are updated at least annually and more frequently if market factors dictate. Increases in valuation adjustments recorded in a period are primarily based on updated appraisals or management’s authorization to reduce the selling price during the period. Foreclosed properties held as other real estate owned are recorded at the lower of the recorded investment in the loan or market value of the property less expected costs to sell.
48
Table of Contents
Foreclosed assets (other real estate owned and other repossessed assets) totaled $4.3 million at December 31, 2009, compared with $4.8 million at December 31, 2008. At December 31, 2009, the Company had seven OREO properties. One property totaling $2.2 million, or approximately 50 percent of the balance at year-end 2009, related to one residential real estate construction project in the Portland, Oregon metropolitan area. Property carried at $5.5 million was sold in 2009 for a loss of $57,000, and new foreclosures totaled $6.2 million. In 2008, property carried at $2.5 million was sold for a gain of $100,000 and new foreclosures totaled $6.9 million. The following table presents activity in the foreclosed assets portfolio for 2009 and 2008:
| December 31, | ||||||||
| (dollars in thousands) | 2009 | 2008 | ||||||
| Beginning balance, January 1 |
$ | 4,838 | $ | 2,250 | ||||
| Additions to foreclosed assets |
6,167 | 6,938 | ||||||
| Capitalized improvements |
— | 254 | ||||||
| Valuation adjustments |
(1,137 | ) | (2,137 | ) | ||||
| Sales of foreclosed assets |
(5,520 | ) | (2,467 | ) | ||||
| Ending balance, December 31 |
$ | 4,348 | $ | 4,838 | ||||
Other Assets
Comparing 2009 to 2008, the Company’s other assets decreased $17.1 million. The decrease was primarily due to decreases in net deferred tax assets of $6.7 million, the termination of the Company’s interest rate contracts that had a market value of $8.1 million at year-end 2008 and the write-off of goodwill totaling $1.8 million.
Deposits
We offer various deposit accounts, including noninterest-bearing checking and interest-bearing checking, savings, money market and certificates of deposit. The accounts vary as to terms, with principal differences being minimum balances required, length of time the funds must remain on deposit, interest rate and deposit or withdrawal options. Our goal remains to maximize our noninterest-bearing demand deposits relative to other deposits and borrowings, to minimize our interest expense.
The following table sets forth the composition of the Company’s deposit liabilities and associated average rates on the dates indicated:
| December 31, | |||||||||||||||||||||||||||
| 2009 | 2008 | 2007 | |||||||||||||||||||||||||
| (dollars in thousands) | Ending Balance |
Average Balance |
Average Rate |
Ending Balance |
Average Balance |
Average Rate |
Ending Balance |
Average Balance |
Average Rate |
||||||||||||||||||
| Noninterest-bearing demand deposits |
$ | 46,510 | $ | 52,282 | — | $ | 70,329 | $ | 85,798 | — | $ | 91,662 | $ | 100,817 | — | ||||||||||||
| Savings |
16,069 | 16,421 | 0.73 | % | 16,127 | 16,683 | 0.85 | % | 17,687 | 17,069 | 0.86 | % | |||||||||||||||
| Interest-bearing demand deposits |
43,546 | 28,924 | 0.40 | % | 13,547 | 15,513 | 0.34 | % | 18,105 | 16,513 | 0.36 | % | |||||||||||||||
| Money market accounts |
34,452 | 46,754 | 1.02 | % | 72,465 | 79,262 | 1.93 | % | 86,658 | 70,728 | 2.95 | % | |||||||||||||||
| Certificates of deposit under $100,000 |
267,020 | 287,314 | 3.72 | % | 255,879 | 197,828 | 4.36 | % | 145,156 | 138,703 | 4.92 | % | |||||||||||||||
| Certificates of deposit over $100,000 |
116,174 | 102,605 | 2.42 | % | 93,223 | 76,238 | 3.68 | % | 81,911 | 71,471 | 5.28 | % | |||||||||||||||
| Total |
$ | 523,771 | $ | 534,300 | 2.60 | % | $ | 521,570 | $ | 471,322 | 2.79 | % | $ | 441,179 | $ | 415,301 | 3.10 | % | |||||||||
49
Table of Contents
Noninterest bearing demand deposits at December 31, 2009 decreased $23.8 million from December 31, 2008, primarily due to the Company’s planned reduction in the number of non-U.S. resident relationships serviced by its Seattle-based international trade department and wire room. Money market deposits decreased $38.0 million during the same period, reflecting the loss of these non-U.S. resident relationships as well as a $32.0 million decrease in brokered money market accounts.
Interest-bearing demand deposits increased $30.0 million in 2009 over year-end 2008 primarily due to maturing certificates of deposit issued to Washington State agencies moving into FDIC insured NOW accounts. As of July 1, 2009, certificates of deposit issued to Washington State agencies required 100 percent collateralization, and as of May 31, 2010, all Washington State public deposits will require 100 percent collateralization. At December 31, 2009, the Company had $36.7 million of public deposits. The Company expects to collateralize approximately $26.5 million of public deposits with existing securities and its line of credit with the FHLB. The Company does not anticipate any significant impact to its liquidity as a result of the State of Washington’s public funds collateral requirements.
To offset reduced relationship deposits and maturing brokered CD’s and CDARs deposits in 2009, the Bank utilized internet listing service time deposits. Internet listing sourced deposits increased $80.6 million in 2009, as national brokered CD’s decreased $12.7 million and CDARs deposits decreased $1.6 million from December 31, 2008. To increase core deposits, the Bank has begun a variety of marketing programs to attract additional local deposits targeted at the retail level, as well as more aggressive efforts towards acquiring business-customer demand deposits. Total brokered deposits (national brokered CD’s, CDARs deposits and money market accounts defined as brokered deposits) were $163.1 million at December 31, 2009 compared with $209.5 million at December 31, 2008. Maturities of brokered deposits at December 31, 2009 are $72.7 million in 2010, $54.8 million in 2011 and $26.0 million in 2012, $9.2 million in 2013 and $0.3 million in 2014.
As a result of the Bank’s regulatory capital classification, it has not been able to accept or renew any brokered deposits since mid-2009. In addition, the rate paid by the Bank on any new or renewed deposits was limited by regulation to 75 basis points over the average prevailing rate in the market for deposits with comparable terms. Beginning January 1, 2010, the FDIC changed the rate limitation framework that bases the rate limit upon a national rate survey plus 75 basis points. Management believes that, despite these rate restrictions, the Bank can adjust pricing, the offering rates for savings, money market, and certificates of deposit, within an acceptable range to retain, increase, or decrease deposits in changing interest rate environments to meet its funding needs. To the extent that competitors in the Bank’s market decide to pay higher rates than we are permitted to as a result of the Bank’s regulatory restrictions, the Bank may experience a disintermediation of deposit funds.
The following table sets forth, by time remaining either to repricing or to maturity, all time certificates of deposit outstanding at December 31, 2009:
| Time deposits of $100,000 or more |
All other time deposits | |||||||||||||
| (dollars in thousands) | Amount | Percentage | Amount | Percentage | ||||||||||
| Three months or less |
$ | 14,270 | 12 | % | $ | 50,746 | 19 | % | ||||||
| After three months through six months |
12,873 | 11 | % | 33,886 | 13 | % | ||||||||
| After six months through one year |
42,692 | 37 | % | 59,128 | 22 | % | ||||||||
| After one year through five years |
46,339 | 40 | % | 123,260 | 46 | % | ||||||||
| Total |
$ | 116,174 | 100 | % | $ | 267,020 | 100 | % | ||||||
| Percentage of total time deposits |
30 | % | 70 | % | ||||||||||
Borrowings
In 2005, the Company formed a wholly owned Delaware statutory business trust subsidiary, Cowlitz Statutory Trust I (the Trust), which issued $12,000,000 of guaranteed undivided beneficial interests in the
50
Table of Contents
Company’s Junior Subordinated Deferrable Interest Debentures (Trust Preferred Securities). The proceeds from the issuance of the common securities and the Trust Preferred Securities were used by the Trust to purchase $12,372,000 of junior subordinated debentures of the Company. These debentures qualify as Tier 1 capital under Federal Reserve Board guidelines. Federal Reserve guidelines limit inclusion of trust-preferred securities offerings and certain other preferred capital elements to 25 percent of core capital elements. As of December 31, 2009, the amount of trust preferred securities included in Tier 1 capital totaled $3.6 million, with the balance of the securities included in Tier 2 capital. The interest rate is based on the 3-month LIBOR plus 1.75% and is adjusted quarterly. The effective rate at December 31, 2009 was 2.00 percent.
Beginning with the payment that was due in September 2009, the Company has deferred regularly scheduled interest payments on its outstanding junior subordinated notes relating to its Trust Preferred Securities. Under the terms of the junior subordinated notes and the trust documents, the Company is allowed to defer payments of interest for up to 20 consecutive quarterly periods. The Company is not in default with respect to the Trust Preferred Securities, and the deferral of interest does not constitute an event of default. The Company will continue to accrue interest, but the Company will not make cash interest payments until such time as it elects to resume payments. This action is consistent with the Company’s current business strategy to preserve cash balances at the holding company and maintain a strong balance sheet for the Bank. During the deferral period, the Company generally may not pay cash dividends on or repurchase its common stock.
The following table summarizes the ending balances, average balances, maximum balances and weighted average interest rates for the Company’s federal funds purchased.
| December 31, | |||||||||||
| (dollars in thousands) | 2009 | 2008 | 2007 | ||||||||
| Federal funds purchased |
|||||||||||
| Balance at end of period |
$ | — | $ | — | $ | 1,050 | |||||
| Average balance of borrowing during period |
— | 1,494 | 2,313 | ||||||||
| Maximum amount of borrowing outstanding at any month end during period |
— | 3,630 | 13,300 | ||||||||
| Weighted average interest rate for period |
— | 2.73 | % | 5.22 | % | ||||||
Liquidity
Liquidity represents the ability to meet deposit withdrawals and fund loan demand, while retaining the flexibility to take advantage of business opportunities. Daily and short-term liquidity needs have been principally met with deposits from customers, payments on loans, maturities and paydowns of investment securities, and wholesale borrowings, including brokered CDs, federal funds purchased, internet service listing deposits and, depending on the availability of collateral, borrowings from the FHLB. As mentioned elsewhere, the Bank is currently restricted by its Consent Order from issuing or renewing brokered deposits. Despite this restriction, the Bank maintained a significant liquidity position at December 31, 2009 through its core deposit base, issuance of internet service listing deposits and benefit of the increased FDIC deposit insurance limits.
Secondary sources of liquidity include sale of investment securities which are not held for pledging purposes and other classes of assets. Securities classified as available for sale which are not pledged may be sold in response to changes in interest rates or liquidity needs. Investments in securities available for sale were $48.5 million at December 31, 2009. The prices for loans and other assets are subject to market volatility that often discounts the value below the Bank’s carrying value of the asset. Consequently, even though the Bank may increase liquidity by the sale of assets, the Bank would recognize a loss and further reduce its capital if it were to sell assets at below their carrying value.
Longer term funding needs can be met through a variety of wholesale sources that have a broader range of maturities than customer deposits and add flexibility in liquidity planning and management. These wholesale sources include advances from the FHLB with longer maturities and securities that qualify as regulatory capital, including trust preferred securities and subordinated debt. In addition, the Company may also issue equity capital to address liquidity or capital needs, depending on market conditions.
51
Table of Contents
Liquid assets, mainly balances held at the Federal Reserve Bank, totaled $130.9 million at December 31, 2009, compared with $40.9 million at December 31, 2008. As discussed previously, the Company has taken strategic actions to increase its short-term liquidity. Specifically, loan totals have decreased $89.9 million since year-end 2008 and deposit totals have increased $2.2 million. The Company is selective in the renewal of loans at maturity and has declined loan renewals for borrowers that are loan-only credits where Cowlitz Bank is not the borrower’s primary bank. In addition, the Bank will likely decline loan renewals for borrowers who have risk factors the Bank deems unacceptable going forward, such as violation of loan terms and poor repayment history. Lastly, the Bank is working diligently to reduce nonperforming assets as quickly as possible. The Company can provide no assurance to its successful implementation of these plans or that further deterioration in economic conditions and deposit trends will not have a material adverse affect on the Company’s liquidity.
The Bank’s primary counterparty for borrowing purposes is the Federal Home Loan Bank of Seattle (the “FHLB”) that permits it to borrow up to 20 percent of the Bank’s assets, subject to collateral limitations. The line is available for overnight federal funds and with the collateral available on December 31, 2009, the Company believes the Bank could borrow up to approximately $55.0 million. FHLB borrowings in excess of $26.4 million would require the Company to purchase additional FHLB stock. The Bank also has access to additional liquidity through the Federal Reserve’s credit programs, subject to collateral limitations. Borrowing capacity from the FHLB or FRB may fluctuate based upon the acceptability and risk rating of loan collateral, and counterparties could adjust discount rates applied to such collateral at their discretion. The FRB or FHLB could restrict or limit the Bank’s access to secured borrowings.
At December 31, 2009, the Bank had one collateralized overnight federal funds borrowing line with a correspondent bank that provided access to an additional $7.3 million for short-term liquidity needs. As with many community banks, correspondent banks have withdrawn unsecured lines of credit or now require collateralization for their purchase of federal funds on a short-term basis due to the present adverse economic environment.
As disclosed in the accompanying Consolidated Statements of Cash Flows, net cash flows from (used by) operations in the years ended December 31, 2009, 2008 and 2007 were ($4.2 million), $8.0 million and $7.2 million, respectively. The net cash used by operations in 2009 was primarily due to the net operating loss. Net cash flow from operations was positive in 2008 and 2007. Net cash flows from investing activities of $86.9 million in 2009 related primarily to the decrease in loan balances and mortgage-backed securities repayments. Net cash used by investment activities of $63.0 million and $46.2 million in 2008 and 2007, respectively, related primarily to the increase in loans during the period and the purchase of securities. Cash from financing activities in 2009, 2008 and 2007 was primarily provided by net deposit growth.
52
Table of Contents
Capital Resources
Capital Ratios
Management is committed to maintaining capital at a level sufficient to protect shareholders and depositors, provide for reasonable growth and fully comply with regulatory requirements. The Company and the Bank are required to maintain minimum amounts of capital to “risk-weighted” assets, as defined by banking regulators. As of December 31, 2009, the Bank was categorized as “under-capitalized” under the regulatory framework for prompt corrective action due to the total capital to risk-weighted assets rates falling below the adequately capitalized category. The Bank was above the well-capitalized minimum for the Tier 1 risk-based ratio and above the adequately-capitalized minimum for the Tier 1 leverage ratio. There are no conditions or events subsequent to December 31, 2009 that management believes have changed the Bank’s or the Company’s category.
| Actual | For Capital Adequacy Purposes |
To Be Well- Capitalized Under Prompt Corrective Action Provisions | |||||||||||||
| Amount | Ratio | Amount | Ratio | Amount | Ratio | ||||||||||
| December 31, 2009 |
|||||||||||||||
| Total risk-based capital: |
|||||||||||||||
| Consolidated |
$ | 27,538 | 7.40 | % | $ | 29,759 | ³8.00% | N/A | N/A | ||||||
| Bank |
$ | 27,291 | 7.34 | % | $ | 29,739 | ³8.00% | $37,174 | ³10.00% | ||||||
| Tier 1 risk-based capital: |
|||||||||||||||
| Consolidated |
$ | 14,424 | 3.88 | % | $ | 14,880 | ³4.00% | N/A | N/A | ||||||
| Bank |
$ | 22,571 | 6.07 | % | $ | 14,870 | ³4.00% | $22,304 | ³6.00% | ||||||
| Tier 1 (leverage) capital: |
|||||||||||||||
| Consolidated |
$ | 14,424 | 2.50 | % | $ | 23,087 | ³4.00% | N/A | N/A | ||||||
| Bank |
$ | 22,571 | 3.91 | % | $ | 23,087 | ³4.00% | $28,859 | ³5.00% | ||||||
Certain Bank level capital ratios set forth above are substantially higher than the capital ratios at the Consolidated level. This is mainly because regulatory calculations give different treatment to the $12.4 million in Trust Preferred debt proceeds. At the Company level a substantial percentage of Trust Preferred debt is excluded from regulatory capital, while it is fully included at the Bank level.
During the second quarter of 2009, the holding company contributed $1.0 million of capital to the Bank, using available cash balances. The holding company has approximately $367,000 of available cash at December 31, 2009, and continues to analyze all of its capital management options. The Company may face additional restrictions from the Board of Governors of the Federal Reserve based on the Bank’s capitalization, other conditions giving rise to the Consent Order and the decline in the consolidated regulatory capital ratios that fell below capital adequacy minimums as of December 31, 2009.
The Company is continuing its efforts to raise additional capital from a variety of sources. Any potential investment would be subject to due diligence and may require the approval of the Company’s shareholders. Certain prospective investors have engaged in various stages of due diligence as to the condition of the Company including discussions with management as well as a review of historical financial information and financial analyses of future performance, including loan portfolio credit quality. There can be no assurance that the Company’s efforts to raise additional capital will be successful.
Stock Repurchase Program
In September 2007, the Company announced a stock repurchase program for up to 50,000 shares (restated for the reverse stock split (one-for-ten) effective March 1, 2010). Under the program, the Company intended to use existing funds to finance any repurchases. When evaluating timing and amount of common stock repurchases, management considers a number of factors including, but not limited to, projected earnings generation, risk weighted asset growth, capital ratios relative to regulatory capital guidelines, availability and
53
Table of Contents
cost of other capital resources and the market valuation of its stock price. No shares were purchased as of December 31, 2009 and none are expected to be purchased in 2010. The Company is currently restricted from repurchasing its common stock without approval of the Federal Reserve Bank.
Return on Equity and Assets
Return on daily average assets and equity and certain other ratios for the periods indicated are presented below:
| December 31, | ||||||||||||
| (dollars in thousands, except per share amounts) | 2009 | 2008 | 2007 | |||||||||
| Net income (loss) |
$ | (34,775 | ) | $ | (8,098 | ) | $ | 86 | ||||
| Total average assets |
587,757 | 541,519 | 489,141 | |||||||||
| Return on average assets |
(5.92 | )% | (1.50 | )% | 0.02 | % | ||||||
| Average equity |
$ | 36,310 | $ | 51,917 | $ | 53,932 | ||||||
| Return on average equity |
(95.77 | )% | (15.60 | )% | 0.16 | % | ||||||
| Average equity to average assets ratio |
6.18 | % | 9.59 | % | 11.03 | % | ||||||
| Diluted earnings per share |
$ | (67.83 | ) | $ | (15.96 | ) | $ | 0.17 | ||||
| Cash dividends paid per share |
$ | — | $ | — | $ | — | ||||||
Impact of Inflation and Changing Prices
A financial institution’s asset and liability structure is substantially different from that of an industrial firm in that primarily all assets and liabilities of a bank are monetary in nature, with relatively little investment in fixed assets or inventories. Inflation has an important impact on the growth of total assets and the resulting need to increase equity capital at higher than normal rates in order to maintain appropriate capital ratios. Management believes that the impact of inflation on financial results depends on the ability to react to changes in interest rates and, by such reaction, reduce the inflationary impact on performance. Management has an asset/liability program which attempts to manage interest rate sensitivity. In addition, periodic reviews of banking services and products are conducted to adjust pricing in view of current and expected costs.
The financial statements included in Item 8 below have been prepared in accordance with accounting principles generally accepted in the United States, which requires the Bank to measure financial position and operating results principally in terms of historic dollars. Changes in the relative value of money due to inflation or recession are generally not considered. The primary effect of inflation on our results of operations is through increased operating costs, such as compensation, occupancy and business development expenses. In management’s opinion, changes in interest rates affect the financial condition of a financial institution to a far greater degree than changes in the rate of inflation. Although interest rates are greatly influenced by changes in the inflation rate, they do not necessarily change at the same rate or in the same magnitude as the inflation rate. Interest rates are highly sensitive to many factors that are beyond the Bank’s control, including U.S. fiscal and monetary policy and general national and global economic conditions.
Item 7a. Quantitative and Qualitative Disclosures about Market Risk
Asset-Liability Management/Interest Rate Sensitivity
The principal purpose of asset-liability management is to manage the Company’s sources and uses of funds to maximize net interest income under different interest rate conditions with minimal risk. A key component of the asset-liability management is the measurement of interest-rate sensitivity. Interest-rate sensitivity refers to the volatility in earnings resulting from fluctuations in interest rates, variability in spread relationships, and the mismatch of re-pricing intervals between assets and liabilities. Effective interest rate sensitivity management seeks to ensure that both assets and liabilities respond to changes in interest rates within an acceptable time frame, thereby minimizing the impact of interest rate changes on net interest income. The policy of the Company is to control the exposure of the Company’s earnings to changing interest rates by generally maintaining a
54
Table of Contents
position within a narrow range around an “earnings neutral” or “balanced” position. The Board of Directors has established guidelines for maintaining the Company’s earnings risk due to future interest rate changes. This analysis provides an indication of the Company’s earnings risk due to future interest rate changes. At December 31, 2009, the analysis indicated that the earnings risk was within the Company’s policy guidelines.
The following table presents interest-rate sensitivity data at December 31, 2009. Interest rate sensitivity is measured as the difference between the volumes of assets and liabilities at a point in time which are subject to repricing at various time horizons. The differences are known as interest sensitivity gaps. Since these gaps are actively managed and change daily as adjustments are made in interest rate views and market outlook, positions at the end of any period may not be reflective of the Company’s interest rate view in subsequent periods. Active management dictates that longer-term economic views are balanced against the prospects of short-term interest rate changes in all re-pricing intervals.
| Estimated Maturity or Repricing at December 31, 2009 | ||||||||||||||||||||||||
| (dollars in thousands) | Three months or less |
Three months through six months |
Six months through one year |
One year through five years |
After 5 years |
Total | ||||||||||||||||||
| Interest-earning assets: |
||||||||||||||||||||||||
| Temporary investments |
$ | 130,890 | — | — | — | — | $ | 130,890 | ||||||||||||||||
| Investments available-for-sale (1) (2) |
— | — | 8,716 | 18,963 | 20,812 | 48,491 | ||||||||||||||||||
| Federal Home Loan Bank Stock |
— | — | — | — | 1,247 | 1,247 | ||||||||||||||||||
| Loans, net of deferred loan fees |
196,529 | 3,095 | 12,700 | 74,998 | 56,005 | 343,327 | ||||||||||||||||||
| Total interest-earning assets |
327,419 | 3,095 | 21,416 | 93,961 | 78,064 | 523,955 | ||||||||||||||||||
| Allowance for loan losses |
(10,164 | ) | ||||||||||||||||||||||
| Noninterest-bearing cash and due from banks |
8,815 | |||||||||||||||||||||||
| Bank-owned life insurance |
15,560 | |||||||||||||||||||||||
| Other assets |
14,246 | |||||||||||||||||||||||
| Total assets |
$ | 552,412 | ||||||||||||||||||||||
| Interest-bearing liabilities: |
||||||||||||||||||||||||
| Savings, money market and interest-bearing demand deposits |
7,642 | 7,642 | 15,284 | 51,049 | 12,450 | 94,067 | ||||||||||||||||||
| Certificates of deposit |
65,016 | 46,759 | 101,820 | 169,599 | — | 383,194 | ||||||||||||||||||
| Junior subordinated debentures |
12,372 | — | — | — | — | 12,372 | ||||||||||||||||||
| Other borrowings |
— | — | 6 | — | — | 6 | ||||||||||||||||||
| Total interest-bearing liabilities |
85,030 | 54,401 | 117,110 | 220,648 | 12,450 | 489,639 | ||||||||||||||||||
| Demand deposits |
46,510 | |||||||||||||||||||||||
| Other liabilities |
4,208 | |||||||||||||||||||||||
| Shareholders’ equity |
12,055 | |||||||||||||||||||||||
| Total liabilities and shareholders’ equity |
$ | 552,412 | ||||||||||||||||||||||
| Interest sensitivity gap |
$ | 242,389 | $ | (51,306 | ) | $ | (95,694 | ) | $ | (126,687 | ) | $ | 65,614 | |||||||||||
| Cumulative interest sensitivity gap |
$ | 242,389 | $ | 191,083 | $ | 95,389 | $ | (31,298 | ) | $ | 34,316 | |||||||||||||
| Cumulative gap as a percent of earning assets |
46.3 | % | 36.5 | % | 18.2 | % | -6.0 | % | 6.5 | % | ||||||||||||||
| (1) | Mortgage-backed securities, which are not due at a single maturity date, have been allocated over maturity groupings based on the expected maturity of the underlying loan collateral |
| (2) | Certain investment securities have call options which, if exercised, may cause the actual maturities to differ from the stated contractual maturities |
55
Table of Contents
Market Risk
Interest rate and credit risks are the most significant market risks impacting the Company’s performance. Other types of market risk, such as foreign currency exchange rate risk and commodity price risk, do not arise in the normal course of the Company’s business activities. The Company relies on loan reviews, prudent loan underwriting standards and an adequate allowance for credit losses to mitigate credit risk.
Interest rate risk is managed through the monitoring of the Company’s gap position (see Asset-Liability Management/Interest Rate Sensitivity) and sensitivity to interest rate risk by subjecting the Company’s balance sheet to hypothetical interest rate shocks. The Company’s primary objective in managing interest rate risk is to minimize the adverse impact of changes in interest rates on the Company’s net interest income and capital, while structuring the Company’s asset/liability position to obtain the maximum yield-cost spread on that structure.
The Company utilizes asset/liability-modeling software to determine the effect of a shift in market interest rates, with scenarios of interest rates increasing and decreasing 100 and 200 basis points. The model utilized to create the table presented below is based on the concept that all rates do not move by the same amount or at the same time. Although certain assets and liabilities may have similar maturities or periods of repricing, they may not react correspondingly to changes in market interest rates. In addition, interest rates on certain types of assets and liabilities may fluctuate with changes in market interest rates, while interest rates on other types of assets may lag behind changes in market rates. Further, in the event of a change in interest rates, prepayment and early withdrawal levels would likely deviate from those assumed in the table. The ability of certain borrowers to make scheduled payments on the adjustable rate loans may decrease in the event of an interest rate increase due to adjustments in the amount of the payments.
The model attempts to account for such limitations by imposing weights on the gaps between assets and liabilities. These weights are based on the ratio between the amount of rate change and each category of asset/liability, and the amount of any change in the federal funds rate. Local market conditions and the strategy of the Company determine the weights for loan and core deposits, while national markets set the other weights. In addition, a timing factor has been used as fixed rate instruments do not re-price immediately; renewals may have different terms than original maturities; and the timing of changes for each type of instrument varies (for example, core deposit re-pricing usually occurs sometime after a change in the federal funds rate, but variable rate loans re-price immediately with changes to the Company’s prime interest rate). Due to the various assumptions used for this simulation analysis, no assurance can be given that actual results will correspond with projected results.
The following table shows the estimated impact on the Bank’s net interest income over a time horizon of one year from the base case and the quantification of market value changes for all financial assets and liabilities, given an increase in market interest rates as of December 31, 2009. For the scenarios shown, the interest rate simulation assumes a parallel and sustained shift in market interest rates ratably over a twelve-month period and no change in the composition or size of the balance sheet. Due to the current low rate environment, no scenarios were evaluated using decreasing rates.
| (dollars in thousands) | Increase (Decrease) in Net Interest Income from Base Scenario |
Percentage Change in Net Interest Income |
Increase (Decrease) in Present Value of Equity |
Percentage Change in Present Value of Equity |
|||||||||
| Up 200 basis points |
$ | 1,706 | 15.6 | % | $(8,190 | ) | (41.8 | )% | |||||
| Up 100 basis points |
856 | 7.8 | % | (4,365 | ) | (22.3 | )% | ||||||
| Down 100 basis points |
N/M | (1) | N/M | (1) | N/M | (1) | N/M | (1) | |||||
| Down 200 basis points |
N/M | (1) | N/M | (1) | N/M | (1) | N/M | (1) | |||||
| (1) | Market rates in effect at December 31, 2009 were less than 1.0 %, thus downward simulation scenarios are not meaningful. |
56
Table of Contents
Loans and certificates of deposit represent the majority of interest rate exposure. Historically, savings and interest-bearing checking accounts have not re-priced in proportion to changes in overall market interest rates. Changes in net interest income can generally be attributed to the balance of loans and certificates of deposit maturing or re-pricing.
As illustrated in the above table, our balance sheet is currently asset sensitive, meaning that interest earning assets mature or re-price more frequently than interest-bearing liabilities in a given period. Therefore, according to the model, net interest income should increase slightly when rates increase and shrink somewhat when rates fall in an interest rate shift that is parallel across all terms of the yield curve. This is primarily a result of the proportion of variable rate loans in our portfolio and the significant amount of short-term cash equivalent assets on the balance sheet at December 31, 2009.
The change in fair values of financial assets is mainly a result of loans representing 66 percent of total interest-earning assets at December 31, 2009. As a percentage of total loans, $152.9 million, or approximately 44 percent, had fixed interest rates that decline in value during a period of rising interest rates.
While asset/liability models have become a main focus of risk management, the Company believes that statistical models alone do not provide a reliable method of monitoring and controlling risk. The quantitative risk information provided is limited by the parameters established in creating the related models. In addition, the simulation model does not take into account any future actions which the Company could take to mitigate an adverse impact due to changes in interest rates from those expected or competitive influences on the Company’s deposit base. Therefore, the Company uses these models only as a supplement to other risk management tools.
Contractual Obligations
The following table sets forth our long-term contractual obligations at December 31, 2009 (in thousands):
| Payments due per period | |||||||||||||||
| Less Than One Year |
1-3 Years | 3-5 Years | Thereafter | Total | |||||||||||
| Time deposits |
$ | 213,595 | $ | 151,336 | $ | 18,263 | $ | — | $ | 383,194 | |||||
| Junior subordinated debt |
— | — | — | 12,372 | 12,372 | ||||||||||
| Operating leases |
812 | 1,018 | 690 | 591 | 3,111 | ||||||||||
| Supplemental employee retirement plan |
— | — | 54 | 447 | 501 | ||||||||||
| Total |
$ | 214,407 | $ | 152,354 | $ | 19,007 | $ | 13,410 | $ | 399,178 | |||||
See additional discussion under Notes 10, 12, 17 and 18 of the Consolidated Financial Statements.
57
Table of Contents
| Item 8. | Financial Statements and Supplementary Data |
REPORT OF INDEPENDENT REGISTERED PUBLIC ACCOUNTING FIRM
To the Shareholders and Board of Directors
Cowlitz Bancorporation and Subsidiary
We have audited the accompanying consolidated statements of condition of Cowlitz Bancorporation (a Washington Corporation) and Subsidiary as of December 31, 2009 and 2008, and the related consolidated statements of operations, changes in shareholders’ equity and comprehensive income (loss) and cash flows for each of the years in the three-year period ended December 31, 2009. These consolidated financial statements are the responsibility of Cowlitz Bancorporation’s management. Our responsibility is to express an opinion on these consolidated financial statements based on our audits.
We conducted our audits in accordance with standards of the Public Company Accounting Oversight Board (United States). The Company is not required to have, nor were we engaged to perform, an audit of its internal control over financial reporting. Our audit included consideration of internal control over financial reporting as a basis for designing audit procedures that are appropriate in the circumstances, but not for the purpose of expressing an opinion on the effectiveness of the Company’s internal control over financial reporting. Accordingly, we express no such opinion. Those standards require that we plan and perform the audit to obtain reasonable assurance about whether the financial statements are free of material misstatement. An audit includes examining, on a test basis, evidence supporting the amounts and disclosures in the consolidated financial statements. An audit also includes assessing the accounting principles used and significant estimates made by management, as well as evaluating the overall consolidated financial statement presentation. We believe that our audits provide a reasonable basis for our opinion.
In our opinion, the consolidated financial statements referred to above present fairly, in all material respects, the financial position of Cowlitz Bancorporation and Subsidiary as of December 31, 2009 and 2008, and the results of their operations and their cash flows for each of the years in the three-year period ended December 31, 2009, in conformity with U.S. generally accepted accounting principles.
The accompanying consolidated financial statements as of and for the year ended December 31, 2009, have been prepared assuming that the Company will continue as a going concern. As discussed in Note 2 to the consolidated financial statements, the Company’s significant net loss from operations in 2009 and 2008, deterioration in the credit quality of its loan portfolio, and the decline in the level of its regulatory capital to support operations raise substantial doubt about the Company’s ability to continue as a going concern. Management’s plans concerning these matters are also discussed in Note 2 to the consolidated financial statements. The consolidated financial statements do not include any adjustments that might result from the outcome of this uncertainty.

Portland, Oregon
March 31, 2010
58
Table of Contents
COWLITZ BANCORPORATION AND SUBSIDIARY
CONSOLIDATED STATEMENTS OF CONDITION
(dollars in thousands)
| December 31, 2009 |
December 31, 2008 |
|||||||
| Assets |
||||||||
| Cash and cash equivalents |
$ | 139,705 | $ | 55,106 | ||||
| Investment securities |
48,491 | 64,064 | ||||||
| Restricted equity securities |
1,247 | 1,247 | ||||||
| Loans, net of deferred loan fees |
343,327 | 433,215 | ||||||
| Allowance for loan losses |
(10,164 | ) | (13,712 | ) | ||||
| Total loans, net |
333,163 | 419,503 | ||||||
| Cash surrender value of bank-owned life insurance |
15,560 | 14,942 | ||||||
| Premises and equipment |
5,489 | 6,185 | ||||||
| Foreclosed assets |
4,348 | 4,838 | ||||||
| Goodwill |
— | 1,798 | ||||||
| Accrued interest receivable and other assets |
4,409 | 19,743 | ||||||
| Total assets |
$ | 552,412 | $ | 587,426 | ||||
| Liabilities |
||||||||
| Deposits: |
||||||||
| Non-interest-bearing demand |
$ | 46,510 | $ | 70,329 | ||||
| Savings and interest-bearing demand |
59,615 | 29,674 | ||||||
| Money market |
34,452 | 72,465 | ||||||
| Certificates of deposit |
383,194 | 349,102 | ||||||
| Total deposits |
523,771 | 521,570 | ||||||
| Junior subordinated debentures and other borrowings |
12,378 | 12,423 | ||||||
| Accrued interest payable and other liabilities |
4,208 | 4,652 | ||||||
| Total liabilities |
540,357 | 538,645 | ||||||
| Commitments and contingencies (Note 17) |
||||||||
| Shareholders’ equity |
||||||||
| Preferred stock, no par value; 5,000,000 shares authorized; no shares issued and outstanding at December 31, 2009 and 2008 |
— | — | ||||||
| Common stock, no par value; 25,000,000 shares authorized with 514,638 and 511,036 shares issued and outstanding at December 31, 2009 and 2008, respectively |
29,357 | 29,270 | ||||||
| Additional paid-in capital |
2,581 | 2,539 | ||||||
| Retained earnings (accumulated deficit) |
(21,120 | ) | 13,655 | |||||
| Accumulated other comprehensive income |
1,237 | 3,317 | ||||||
| Total shareholders’ equity |
12,055 | 48,781 | ||||||
| Total liabilities and shareholders’ equity |
$ | 552,412 | $ | 587,426 | ||||
See accompanying notes
59
Table of Contents
COWLITZ BANCORPORATION AND SUBSIDIARY
CONSOLIDATED STATEMENTS OF OPERATIONS
(dollars in thousands except per share amounts)
| Years Ended December 31, | ||||||||||||
| 2009 | 2008 | 2007 | ||||||||||
| Interest income |
||||||||||||
| Interest and fees on loans |
$ | 25,650 | $ | 32,976 | $ | 33,141 | ||||||
| Interest on taxable investment securities |
1,821 | 1,363 | 1,865 | |||||||||
| Interest on non-taxable investment securities |
914 | 1,023 | 916 | |||||||||
| Other interest and dividend income |
210 | 301 | 304 | |||||||||
| Total interest income |
28,595 | 35,663 | 36,226 | |||||||||
| Interest expense |
||||||||||||
| Savings and interest-bearing demand deposits |
237 | 195 | 206 | |||||||||
| Money market |
475 | 1,501 | 2,054 | |||||||||
| Certificates of deposit |
13,160 | 11,420 | 10,602 | |||||||||
| Federal funds purchased and other borrowings |
2 | 48 | 134 | |||||||||
| Junior subordinated debentures |
336 | 604 | 875 | |||||||||
| Total interest expense |
14,210 | 13,768 | 13,871 | |||||||||
| Net interest income before provision for credit losses |
14,385 | 21,895 | 22,355 | |||||||||
| Provision for credit losses |
22,261 | 17,595 | 7,800 | |||||||||
| Net interest income (loss) after provision for credit losses |
(7,876 | ) | 4,300 | 14,555 | ||||||||
| Noninterest income |
||||||||||||
| Service charges on deposit accounts |
889 | 801 | 683 | |||||||||
| Fiduciary income |
799 | 609 | 692 | |||||||||
| Increase in cash surrender value of bank-owned life insurance |
618 | 614 | 570 | |||||||||
| International trade fees |
110 | 580 | 644 | |||||||||
| Wire fees |
63 | 334 | 364 | |||||||||
| Mortgage brokerage fees |
281 | 211 | 289 | |||||||||
| Securities losses |
(94 | ) | (1,924 | ) | (265 | ) | ||||||
| Gains on terminated interest rate contracts |
3,110 | — | — | |||||||||
| Other income |
470 | 458 | 485 | |||||||||
| Total noninterest income |
6,246 | 1,683 | 3,462 | |||||||||
| Noninterest expense |
||||||||||||
| Salaries and employee benefits |
8,305 | 9,202 | 9,488 | |||||||||
| Net occupancy and equipment |
2,564 | 2,546 | 2,280 | |||||||||
| Professional services |
1,993 | 1,202 | 1,579 | |||||||||
| Data processing and communications |
1,218 | 1,029 | 959 | |||||||||
| Federal deposit insurance |
2,040 | 378 | 103 | |||||||||
| Foreclosed asset expense, net |
1,554 | 2,418 | 447 | |||||||||
| Loan collection and related expenses |
867 | 360 | 91 | |||||||||
| Interest rate contracts adjustments |
395 | (1,134 | ) | 215 | ||||||||
| Goodwill impairment |
1,798 | — | — | |||||||||
| Other expense |
3,490 | 3,412 | 3,559 | |||||||||
| Total noninterest expense |
24,224 | 19,413 | 18,721 | |||||||||
| Loss before income taxes |
(25,854 | ) | (13,430 | ) | (704 | ) | ||||||
| Income tax provision (benefit) |
8,921 | (5,332 | ) | (790 | ) | |||||||
| Net income (loss) |
$ | (34,775 | ) | $ | (8,098 | ) | $ | 86 | ||||
| Earnings (loss) per common share |
||||||||||||
| Basic |
$ | (67.83 | ) | $ | (15.96 | ) | $ | 0.17 | ||||
| Diluted |
$ | (67.83 | ) | $ | (15.96 | ) | $ | 0.17 | ||||
| Weighted average shares outstanding |
||||||||||||
| Basic |
512,663 | 507,531 | 497,250 | |||||||||
| Diluted |
512,663 | 507,531 | 517,553 | |||||||||
See accompanying notes
60
Table of Contents
COWLITZ BANCORPORATION AND SUBSIDIARY
CONSOLIDATED STATEMENTS OF CHANGES IN SHAREHOLDERS’
EQUITY AND COMPREHENSIVE INCOME (LOSS)
(dollars in thousands)
| Common stock | Additional Paid-in Capital |
Retained Earnings (Accumulated Deficit) |
Accumulated Other Comprehensive Income (Loss) |
Total Shareholders’ Equity |
|||||||||||||||||
| Shares | Amount | ||||||||||||||||||||
| Balance, December 31, 2006 |
488,932 | 27,279 | 2,366 | 21,667 | (587 | ) | 50,725 | ||||||||||||||
| Comprehensive income: |
|||||||||||||||||||||
| Net income |
— | — | — | 86 | — | 86 | |||||||||||||||
| Net change in unrealized gain on: |
|||||||||||||||||||||
| Investments available-for-sale, net of taxes of ($7) |
— | — | — | — | 14 | 14 | |||||||||||||||
| Cash flow hedges, net of taxes of ($1,582) |
— | — | — | — | 2,940 | 2,940 | |||||||||||||||
| Comprehensive income |
3,040 | ||||||||||||||||||||
| Proceeds from exercise of stock options and stock purchase plan |
16,512 | 1,657 | — | — | — | 1,657 | |||||||||||||||
| Share-based compensation |
— | — | 118 | — | — | 118 | |||||||||||||||
| Balance, December 31, 2007 |
505,444 | 28,936 | 2,484 | 21,753 | 2,367 | 55,540 | |||||||||||||||
| Comprehensive loss: |
|||||||||||||||||||||
| Net loss |
— | — | — | (8,098 | ) | — | (8,098 | ) | |||||||||||||
| Net change in unrealized gain (loss) on: |
|||||||||||||||||||||
| Investments available-for-sale, net of taxes of $494 |
— | — | — | — | (917 | ) | (917 | ) | |||||||||||||
| Cash flow hedges, net of taxes of ($1,010) |
— | — | — | — | 1,867 | 1,867 | |||||||||||||||
| Comprehensive loss |
(7,148 | ) | |||||||||||||||||||
| Proceeds from exercise of stock options and stock purchase plan |
2,022 | 114 | — | — | — | 114 | |||||||||||||||
| Issuance of stock |
3,570 | 220 | — | — | — | 220 | |||||||||||||||
| Share-based compensation |
— | — | 55 | — | — | 55 | |||||||||||||||
| Balance, December 31, 2008 |
511,036 | 29,270 | 2,539 | 13,655 | 3,317 | 48,781 | |||||||||||||||
| Comprehensive loss: |
|||||||||||||||||||||
| Net loss |
— | — | — | (34,775 | ) | — | (34,775 | ) | |||||||||||||
| Net change in unrealized gain (loss) on: |
|||||||||||||||||||||
| Investments available-for-sale |
— | — | — | — | 1,653 | 1,653 | |||||||||||||||
| Cash flow hedges |
— | — | — | — | (3,733 | ) | (3,733 | ) | |||||||||||||
| Comprehensive loss |
(36,855 | ) | |||||||||||||||||||
| Proceeds from exercise of stock options and stock purchase plan |
3,720 | 87 | — | — | — | 87 | |||||||||||||||
| Fractional shares surrendered due to reverse stock split |
(118 | ) | — | — | — | — | — | ||||||||||||||
| Share-based compensation |
— | — | 42 | — | — | 42 | |||||||||||||||
| Balance, December 31, 2009 |
514,638 | $ | 29,357 | $ | 2,581 | $ | (21,120 | ) | $ | 1,237 | $ | 12,055 | |||||||||
See accompanying notes
61
Table of Contents
COWLITZ BANCORPORATION AND SUBSIDIARY
CONSOLIDATED STATEMENTS OF CASH FLOWS
(dollars in thousands)
| Years Ended December 31, | ||||||||||||
| 2009 | 2008 | 2007 | ||||||||||
| Cash flows from operating activities |
||||||||||||
| Net income (loss) |
$ | (34,775 | ) | $ | (8,098 | ) | $ | 86 | ||||
| Adjustments to reconcile net income (loss) to net cash from operating activities: |
||||||||||||
| Deferred tax provision (benefit) |
8,921 | (5,369 | ) | (782 | ) | |||||||
| Share-based compensation |
(63 | ) | 349 | 269 | ||||||||
| Depreciation and amortization |
1,489 | 1,489 | 1,017 | |||||||||
| Provision for credit losses |
22,261 | 17,595 | 7,800 | |||||||||
| Increase in cash surrender value of bank-owned life insurance |
(618 | ) | (614 | ) | (570 | ) | ||||||
| Investment securities impairment |
96 | 1,724 | — | |||||||||
| (Gain) loss on sales/calls of investment securities |
(2 | ) | 200 | 265 | ||||||||
| Interest rate contracts adjustments |
(1,201 | ) | (1,390 | ) | 215 | |||||||
| Gains on terminated interest rate contracts |
(3,110 | ) | — | — | ||||||||
| Net (gain) loss on sales of foreclosed assets |
56 | (100 | ) | 306 | ||||||||
| Write-down of foreclosed assets |
1,137 | 2,137 | — | |||||||||
| Goodwill impairment |
1,798 | — | — | |||||||||
| Net (increase) decrease in accrued interest receivable and other assets |
89 | (597 | ) | (726 | ) | |||||||
| Net increase (decrease) in accrued interest payable and other liabilities |
(250 | ) | 642 | (648 | ) | |||||||
| Net cash (used by) from operating activities |
(4,172 | ) | 7,968 | 7,232 | ||||||||
| Cash flows from investing activities |
||||||||||||
| Proceeds from maturities and sales of investment securities |
18,371 | 12,477 | 10,465 | |||||||||
| Purchases of investment securities |
(932 | ) | (25,471 | ) | (7,540 | ) | ||||||
| Net decrease (increase) in loans |
57,823 | (52,421 | ) | (48,431 | ) | |||||||
| Proceeds from sale of foreclosed assets |
5,464 | 2,567 | 929 | |||||||||
| Proceeds from termination of interest rate contracts |
6,403 | 482 | — | |||||||||
| Purchases of bank-owned life insurance |
— | — | (267 | ) | ||||||||
| Purchases of premises and equipment |
(239 | ) | (609 | ) | (1,375 | ) | ||||||
| Net cash from (used by) investing activities |
86,890 | (62,975 | ) | (46,219 | ) | |||||||
| Cash flows from financing activities |
||||||||||||
| Net increase in deposits |
1,839 | 79,876 | 41,559 | |||||||||
| Net increase (decrease) in federal funds purchased |
— | (1,050 | ) | 550 | ||||||||
| Repayment of Federal Home Loan Bank and other borrowings |
(45 | ) | (78 | ) | (109 | ) | ||||||
| Proceeds from exercise of stock options and stock purchase plan |
87 | 114 | 1,657 | |||||||||
| Net cash from financing activities |
1,881 | 78,862 | 43,657 | |||||||||
| Net increase in cash and cash equivalents |
84,599 | 23,855 | 4,670 | |||||||||
| Cash and cash equivalents, beginning of year |
55,106 | 31,251 | 26,581 | |||||||||
| Cash and cash equivalents, end of year |
$ | 139,705 | $ | 55,106 | $ | 31,251 | ||||||
| Supplemental disclosure of cash flow information |
||||||||||||
| Cash paid for interest |
$ | 14,626 | $ | 12,976 | $ | 13,891 | ||||||
| Cash (refunded) paid for income taxes |
$ | (104 | ) | $ | (124 | ) | $ | 247 | ||||
| Supplemental disclosure of investing and financing activities |
||||||||||||
| Loans transferred to foreclosed assets |
$ | 6,167 | $ | 6,938 | $ | 2,862 | ||||||
| Change in unrealized gains (losses) on available-for-sale investment securities and interest rate contracts, net of tax |
$ | (2,080 | ) | $ | 950 | $ | 2,954 | |||||
See accompanying notes
62
Table of Contents
COWLITZ BANCORPORATION AND SUBSIDIARY
NOTES TO CONSOLIDATED FINANCIAL STATEMENTS
NOTE 1—ORGANIZATION AND SUMMARY OF SIGNIFICANT ACCOUNTING POLICIES
Organization—Cowlitz Bancorporation (the Company) was organized in 1991 under Washington law to become the holding company for Cowlitz Bank (the “Bank”), a Washington state chartered bank that commenced operations in 1978. The principal executive offices of the Company are located in Longview, Washington. The Bank operates four branches in Cowlitz County in southwest Washington. Outside of Cowlitz County, the Bank does business under the name Bay Bank with branches in Bellevue, Seattle, and Vancouver, Washington, and Portland and Wilsonville, Oregon. The Bank also provides mortgage banking services through its Bay Mortgage division with offices in Longview and Vancouver, Washington.
The Company offers or makes available a broad range of financial services to its customers, primarily small- and medium-sized businesses, professionals, and retail customers. The Bank’s commercial and personal banking services include commercial and real estate lending, consumer lending, international banking services, internet banking, cash management, mortgage banking and trust services.
Principles of consolidation—The accompanying consolidated financial statements include the accounts of the Company and its subsidiary. All significant inter-company transactions and balances have been eliminated. The Company has one wholly-owned trust, Cowlitz Statutory Trust I (the Trust), for purposes of issuing guaranteed undivided beneficial interests in junior subordinated debentures (Trust Preferred Securities). In accordance with Accounting Standards Codification Section 810-10-15 “Consolidation of Variable Interest Entities,” the Company does not consolidate the Trust. Certain reclassifications have been made in prior years’ data to conform to the current year’s presentation.
Operating Segments—The Company is principally engaged in community banking activities through its branches and corporate offices. Community banking activities include accepting deposits, providing loans and lines of credit to local individuals, businesses and governmental entities, investing in investment securities and money market instruments, international banking services, and holding or managing assets in a fiduciary agency capacity on behalf of its trust customers and their beneficiaries. The Company also provides mortgage lending solutions for its customers, consisting of all facets of residential lending including FHA and VA loans, and “bridge” loans. While management monitors the revenue streams of the various products and services, financial performance is being evaluated on a company-wide basis for 2009 as was the case in 2008 and 2007. Accordingly, operations were considered by management to be aggregated within one reportable operating segment.
Use of estimates in preparation of the consolidated financial statements—Preparation of the consolidated financial statements, in conformity with accounting principles generally accepted in the United States of America, requires management to make certain estimates and assumptions that affect the reported amounts of assets and liabilities and disclosure of contingent assets and liabilities at the date of the financial statements and the reported amounts of revenues and expenses during the reporting period. Actual results could differ from those estimates. Significant estimates relate to the determination of the allowance for credit losses, fair value of investment securities and the valuation of goodwill, other real estate owned and deferred tax assets.
Recently Issued Accounting Standards—In June 2009, the Financial Accounting Standards Board (“FASB”) codified FASB ASC 105, “Generally Accepted Accounting Principles,” to establish the FASB Accounting Standards Codification (“ASC”), which became effective on September 15, 2009. At that date, the ASC became the FASB’s officially recognized source of authoritative GAAP applicable to all public and non-public non-governmental entities, superceding existing FASB, American Institute of Certified Public Accountants (“AICPA”), Emerging Issues task Force (“EITF”) and related literature. Rules and interpretive releases of the Securities and Exchange Commission (“SEC”) under the authority of federal securities laws are also sources of authoritative GAAP for SEC registrants. All other accounting literature is considered
63
Table of Contents
non-authoritative. The switch to the ASC affects the way companies refer to GAAP in financial statements and accounting policies. Citing particular content in the ASC involves specifying the unique numeric path to the content through the Topic, Subtopic, Section and Paragraph structure. The adoption of the FASB ASC 105 did not have any impact on the Company’s consolidated financial statements, and only affects how the Company’s references authoritative accounting guidance going forward.
In December 2007, the FASB issued new authoritative guidance under ASC Topic 805 (formerly Statement of Financial Accounting Standards SFAS No. 141R, “Business Combinations”). The new authoritative guidance under ASC Topic 805 applies to all transactions and other events in which one entity obtains control over one or more other businesses. ASC Topic 805 requires an acquirer to recognize the assets acquired, the liabilities assumed, and any noncontrolling interest in the acquiree at the acquisition date, measured at their fair values as of the acquisition date. ASC Topic 805 also requires an acquirer to recognize assets acquired and liabilities assumed arising from contractual contingencies as of the acquisition date, measured at their acquisition-date fair values. ASC Topic 805 requires acquirers to expense acquisition-related costs as incurred rather than require allocation of such costs to the assets acquired and liabilities assumed. The new authoritative guidance in ASC Topic 805 was effective for business combination reporting for fiscal years beginning on or after December 15, 2008.
In April 2009, the FASB issued new authoritative guidance under the following three ASC’s intended to provide additional guidance and enhance disclosures regarding fair value measurements and impairment of securities:
ASC Topic 820 (formerly FASB Staff Position (FSP) FAS 157-4, “Fair Value Measurements and Disclosures”), provides additional guidance for estimating fair value in accordance with ASC Topic 820 when the volume and level of activity for the asset or liability have decreased significantly, and identifying transactions that are not orderly. The revisions affirm the objective that fair value is the price that would be received to sell an asset in an orderly transaction (that is not a forced liquidation or distressed sale) between market participants at the measurement date under current market conditions, even if the market is inactive. The amendment provides additional guidance for estimating fair value when the volume and level of activity for the asset or liability have decreased significantly. It also provides guidance on identifying circumstances that indicate a transaction is not orderly. If determined that a quoted price is distressed (not orderly), and thereby, not representative of fair value, the entity may need to make adjustments to the quoted price or utilize an alternative valuation technique (e.g. income approach or multiple valuation techniques) to determine fair value. Additionally, an entity must incorporate appropriate risk premium adjustments, reflective of an orderly transaction under current market conditions, due to uncertainty in cash flows. The revised guidance requires disclosures in interim and annual periods regarding the inputs and valuation techniques used to measure fair value and a discussion of changes in valuation techniques and related inputs, if any, during the period. It also requires financial institutions to disclose the fair values of investment securities by major security type. The provisions of ASC Topic 820 were effective for the Company’s interim period ended on June 30, 2009 and did not have a significant effect on the Company’s consolidated financial statements.
ASC Topic 825 (formerly FSP FAS 107-1 and APB 28-1, “Interim Disclosures about Fair Value of Financial Instruments”), requires disclosures about fair value of financial instruments in interim reporting periods of publicly traded companies that were previously only required to be disclosed in annual financial statements. The provisions of ASC Topic 825 were effective for the Company’s interim period ended June 30, 2009 and did not have a significant effect on the Company’s consolidated financial statements.
ASC Topic 320 (formerly FSP FAS 115-2 and FAS 124-2, “Recognition and Presentation of Other-Than-Temporary Impairments”), amends current other-than-temporary impairment (“OTTI”) guidance in GAAP for debt securities to make the guidance more operational and to improve the presentation and disclosure of OTTI on debt and equity securities in the financial statements. ASC Topic 320 does not amend existing recognition and measurement guidance related to other-than-temporary impairments of equity securities. Previously, an entity was required to assess whether it has the intent and ability to hold a security to recovery in determining whether
64
Table of Contents
an impairment of that security is OTTI. If the impairment was deemed OTTI, the investment was written-down to fair value through earnings. Under the revised guidance, OTTI is triggered if an entity has the intent to sell the security, it is likely that it will be required to sell the security before recovery, or if the entity does not expect to recover the entire amortized cost basis of the security. If the entity intends to sell the security or it is likely it will be required to sell the security before recovering its cost basis, the entire impairment loss would be recognized in earnings as an OTTI. If the entity does not intend to sell the security and it is not likely that the entity will be required to sell the security but the entity does not expect to recover the entire amortized cost basis of the security, only the portion of the impairment loss representing credit losses would be recognized in earnings as an OTTI. The credit loss is measured as the difference between the amortized cost basis and the present value of the cash flows expected to be collected of a security. Projected cash flows are discounted by the original or current effective interest rate depending on the nature of the security being measured for potential OTTI. The remaining impairment loss related to all other factors, the difference between the present value of the cash flows expected to be collected and fair value, would be recognized as a charge to other comprehensive income (OCI). Impairment losses related to all other factors are to be presented as a separate category within OCI. For investment securities held to maturity, this amount is accreted over the remaining life of the debt security prospectively based on the amount and timing of future estimated cash flows. The accretion of the OTTI amount recorded in OCI increases the carrying value of the investment and does not affect earnings. If there is an indication of additional credit losses the security is re-evaluated accordingly to the procedures described above. Upon adoption of the revised guidance, the noncredit portion of previously recognized OTTI shall be reclassified to accumulated OCI by a cumulative-effect adjustment to the opening balance of retained earnings. The provisions of ASC Topic 320 were effective for the Company’s interim period ended on June 30, 2009. The Company adopted the provisions of ASC Topic 320 in the second quarter of 2009 and recorded a $77,000 charge for OTTI related to one security. An additional OTTI charge of $9,000 on the security was recognized in the fourth quarter of 2009.
In May 2009, the FASB issued new authoritative guidance under ASC Topic 855 (formerly SFAS No. 165, “Subsequent Events”). The objective of ASC Topic 855 is to establish general standards of accounting for and disclosure of events that occur after the balance sheet date but before financial statements are issued or are available to be issued. In particular, this Statement sets forth:
| • | The period after the balance sheet date during which management of a reporting entity should evaluate events or transactions that may occur for potential recognition or disclosure in the financial statements. |
| • | The circumstances under which an entity should recognize events or transactions occurring after the balance sheet date in its financial statements. |
| • | The disclosures that an entity should make about events or transactions that occurred after the balance sheet date. |
In accordance with ASC Topic 855, an entity should apply the requirements to interim or annual financial periods ending after June 15, 2009. This Topic does not apply to subsequent events or transactions that are within the scope of other applicable GAAP that provide different guidance on the accounting treatment for subsequent events or transactions. This Topic applies to both interim financial statements and annual financial statements. The adoption of ASC Topic 855 as of June 30, 2009 did not have a significant effect on the Company’s consolidated financial statements.
In August 2009, the FASB issued ASU No. 2009-05, “Measuring Liabilities at Fair Value”. This update amends FASB ASC 820 “Fair Value Measurements and Disclosure,” in regards to the fair value measurement of liabilities. FASB ASC 820 clarifies that in circumstances in which a quoted price for a identical liability in an active market is not available, a reporting entity shall utilize one or more of the following techniques: i) the quoted price of the identical liability when traded as an asset, ii) the quoted price for a similar liability or a similar liability when traded as an asset, or iii) another valuation technique that is consistent with the principles of FASB ASC 820. In all instances a reporting entity shall utilize the approach that maximizes the use of relevant observable inputs and minimizes the use of unobservable inputs. Also, when measuring the fair value of a
65
Table of Contents
liability a reporting entity shall not include a separate input or adjustment to other inputs relating to the existence of a restriction that prevents the transfer of the liability. The adoption of ASU 2009-05 as of December 31, 2009 did not have a material impact on the Company’s consolidated financial statements.
In January 2010, the FASB issued ASU No. 2010-06, “Fair Value Measurements and Disclosures (Topic 820)—Improving Disclosures about Fair Value Measurements.” FASB ASU No. 2009-06 requires (i) fair value disclosures by each class of assets and liabilities (generally a subset within a line item as presented in the statement of financial position) rather than major category, (ii) for items measured at fair value on a recurring basis, the amounts of significant transfers between Levels 1 and 2, and transfers into and out of Level 3, and the reasons for those transfers, including separate discussion related to the transfers into each level apart from transfers out of each level, and (iii) gross presentation of the amounts of purchases, sales, issuances, and settlements in the Level 3 recurring measurement reconciliation. Additionally, the ASU clarifies that a description of the valuation technique(s) and inputs used to measure fair values is required for both recurring and nonrecurring fair value measurements. Also, if a valuation technique has changed, entities should disclose that change and the reason for the change. Disclosures other than the gross presentation changes in the Level 3 reconciliation are effective for the first reporting period beginning after December 15, 2009. The requirement to present the Level 3 activity of purchases, sales, issuances, and settlements on a gross basis will be effective for fiscal years beginning after December 15, 2010. The Company is currently evaluating the impact of adoption of FASB ASU No. 2010-06 and does not expect the adoption of this ASU will have a material impact on the Company’s consolidated financial statements.
Cash and cash equivalents—For the purpose of presentation in the statements of cash flows, cash and cash equivalents include cash on hand, amounts due from banks including short-term certificates of deposit (original maturities of 90 days or less), and federal funds sold. Federal funds sold generally mature the day following purchase.
Investment securities—The Company is required to specifically identify its investment securities as “held-to-maturity,” “available-for-sale,” or “trading accounts.” Accordingly, management has determined that all investment securities held at December 31, 2009 and 2008 are “available for sale” and conform to the following accounting policies:
Securities available for sale—Available-for-sale securities consist of bonds, notes, debentures and certain equity securities not classified as held-to-maturity securities. Securities are generally classified as available for sale if the instrument may be sold in response to such factors as (1) changes in market interest rates and related changes in the prepayment risk, (2) needs for liquidity, (3) changes in the availability of and the yield on alternative instruments and (4) changes in funding sources and terms. Unrealized holding gains and losses, net of tax, on available-for-sale securities are reported as other comprehensive income and carried as accumulated comprehensive income or loss within shareholders’ equity until realized. Fair values for these investment securities are based on quoted market prices. Gains and losses on the sale of available-for-sale securities are determined using the specific-identification method. Premiums and discounts are recognized in interest income using the effective interest method over the period to maturity.
Securities held to maturity—Bonds, notes and debentures for which the Company has the intent and ability to hold to maturity are reported at cost, adjusted for premiums and discounts that are recognized in interest income, using the interest method over the period to maturity.
Declines in the fair value of individual held-to-maturity and available-for-sale securities, below their cost, that are other-than-temporary result in write-downs of the individual securities to their fair value and the corresponding establishment of a new cost basis for the security. The related write-downs are included in earnings as realized losses. At each financial statement date, management assesses each investment to determine if impaired investments are temporarily impaired or if the impairment is other-than-temporary based upon the positive and negative evidence available. Evidence evaluated includes, but is not limited to, industry analyst reports, credit market conditions, and interest rate trends.
66
Table of Contents
Prior to the second quarter of 2009, the Company would assess an other-than-temporary impairment (“OTTI”) or permanent impairment based on the nature of the decline and whether the Company has the ability and intent to hold the investments until a market price recovery. If the Company determined a security to be other-than-temporarily or permanently impaired, the full amount of impairment would be recognized through earnings in its entirety. New guidance related to the recognition and presentation of OTTI of debt securities became effective in the second quarter of 2009. Rather than asserting whether a Company has the ability and intent to hold an investment until a market price recovery, a Company must consider whether it intends to sell a security or if it is likely that they would be required to sell the security before recovery of the amortized cost basis of the investment, which may be maturity. For debt securities, if we intend to sell the security or it is likely we will be required to sell the security before recovering its cost basis, the entire impairment loss would be recognized in earnings as an OTTI. If we do not intend to sell the security, or it is likely that we will not be required to sell the security before recovering its cost basis of the security, only the portion of the impairment loss representing credit losses would be recognized in earnings. The credit loss on a security is measured as the difference between the amortized cost basis and the present value of the cash flows expected to be collected. Projected cash flows are discounted by the original or current effective interest rate depending on the nature of the security being measured for potential OTTI. The remaining impairment related to all other factors, the difference between the present value of the cash flows expected to be collected and fair value, is recognized as a charge to other comprehensive income. If there is an indication of additional credit losses the security is re-evaluated according to the procedures described above.
Restricted equity securities—Restricted equity securities consist primarily of the Bank’s investment in the Federal Home Loan Bank of Seattle (“FHLB”). FHLB stock is carried at par and does not have a readily determinable fair value. Ownership of FHLB stock is restricted to the FHLB and member institutions, and can only be purchased and redeemed at par value, which approximates its fair value. Management periodically evaluates FHLB stock for other-than-temporary or permanent impairment. Management’s determination of whether these investments are impaired is based on its assessment of the ultimate recoverability of cost rather than by recognizing temporary decline in value. The determination of whether a decline affects the ultimate recoverability of cost is influenced by criteria such as: (1) the significance of any decline in net assets of the FHLB as compared to the capital stock amount for the FHLB and the length of time this situation has persisted; (2) commitments by the FHLB to make payments required by law or regulation and the level of such payments in relation to the operating performance of the FHLB; (3) the impact of legislative and regulatory changes on institutions and, accordingly, the customer base of the FHLB; and (4) the liquidity position of the FHLB.
As a member of the Federal Home Loan Bank (“FHLB”) system, the Bank is required to maintain a minimum level of investment in FHLB stock based on its outstanding FHLB advances. At December 31, 2009, the Bank’s minimum required investment in FHLB stock was $262,200. The Bank may request redemption of any stock in excess of the minimum required investment. Stock redemptions are made at the discretion of the FHLB.
Investment in limited partnerships—The Company has ownership interests in two limited partnerships that own and operate affordable housing projects. Investment in these projects serve as an element of compliance with the Community Reinvestment Act, and the Company receives tax benefits in the form of deductions for operating losses and tax credits. The Company uses the equity method in accounting for its interest in the partnership’s operating results; tax credits are recorded in the years they become available to reduce income taxes. The tax credits may be used to reduce taxes currently payable or may be carried back one year or forward 20 years to recapture or reduce taxes.
The Company also has an investment in a Small Business Investment Company Limited Partnership. The Partnership is operating as a licensee under Section 301C of the Small Business Investment Act of 1958. The Partnership invests in small businesses, as defined by the Small Business Administration. The partnership was newly formed in 2004. Generally, losses are incurred in the early term of the investment until the underlying business investees become attractive to third-party purchasers and a transaction is consummated. Investments by the Partnership also serve as an element of compliance with the Community Reinvestment Act.
67
Table of Contents
Loans—Loans are stated at the amount of unpaid principal, reduced by an allowance for loan losses and unearned loan fees. Interest income on simple interest loans is accrued daily on the principal balance outstanding. Generally, no interest is accrued on loans when factors indicate that collection of interest is doubtful or when principal or interest payments become 90 days past due, unless collection of principal and interest is anticipated within a reasonable period of time and the loans are well secured. For such loans, previously accrued but uncollected interest is charged against current earnings, and income is only recognized to the extent that payments are subsequently received and collection of the remaining recorded investment is probable. Nonaccrual loans are returned to accrual status when the borrower brings current all past due principal and interest amounts and when future payments are expected in accordance with the contractual terms of the loan. Nonrefundable fees and related direct costs associated with the origination or purchase of loans are deferred and netted against outstanding loan balances. The net deferred fees and costs are generally amortized into interest income over the loan term using a method that approximates the effective yield method. Other credit-related fees, such as standby letter of credit fees, loan placement fees, and annual credit card fees are recognized as noninterest income during the period the related service is performed.
A loan is impaired when, based on current information and events, it is probable that the Company will be unable to collect all amounts due according to the contractual terms of the loan agreement. The Company measures impairment based on the present value of expected future cash flows discounted at the loan’s effective interest rate or, as a practical expedient, impairment is measured based on the loan’s observable market price or the fair value of the collateral, if the loan is collateral dependent. Impaired loans are charged to the allowance when management believes, after considering economic and business conditions, collection efforts and collateral position that the borrower’s financial condition is such that collection of principal is not probable.
Loans are reported as restructured when the Bank grants a concession(s) to a borrower experiencing financial difficulties that it would not otherwise consider. Examples of such concessions include forgiveness of principal or accrued interest, extending the maturity date(s) or providing a lower interest rate than would be normally available for a transaction of similar risk. As a result of these concessions, restructured loans are impaired as the Bank will not collect all amounts due, both principal and interest, in accordance with the terms of the original loan agreement.
Allowance for credit losses—The allowance for credit losses is based on management’s estimates and maintained at a level that is adequate to absorb probable incurred losses inherent in the loan portfolio. Management determines the adequacy of the allowance based upon reviews of individual loans, delinquencies, recent loss experience, current economic conditions, the risk characteristics of the various categories of loans and other pertinent factors. Actual losses may vary from current estimates. These estimates are reviewed periodically and are adjusted as deemed necessary. Loans deemed uncollectible are charged to the allowance for loan losses and recoveries on loans previously charged off are added to the allowance for loan losses.
The Company also assesses the credit risk associated with off-balance sheet loan commitments and letters of credit and determines the appropriate amount of credit loss liability that should be recorded. The liability for off-balance sheet credit exposure related to loan commitments is included in other liabilities, and together with the allowance for loan losses, is the allowance for credit losses.
The factors supporting the allowance for loan losses and the reserve for unfunded commitments do not diminish the fact that the entire allowance for loan losses and reserve for unfunded commitments are each available to absorb losses in the loan portfolio and related commitment portfolio, respectively. The Company’s principal focus, therefore, is on the adequacy of the total allowance for loan losses and reserve for unfunded commitments.
The allowance for loan losses and reserve for unfunded commitments are both subject to review by banking regulators. The Bank’s primary regulators regularly conduct reviews of the allowance for loan losses and reserve for unfunded commitments as an integral part of their examination process. Should the regulators determine that the allowance for loan losses or reserve for unfunded commitments are not, in their opinion, adequate, the Bank may be required to recognize additional provision for loan losses.
68
Table of Contents
Premises and equipment—Premises and equipment are stated at cost less accumulated depreciation. Depreciation and amortization expense is computed by the straight-line method over the estimated useful lives for the majority of the assets, which range from 3 to 40 years.
Goodwill and other intangibles—Goodwill is recognized from the excess of cost over the fair value of net assets acquired in the course of business acquisitions. Core deposit intangibles (CDI) are also recognized as a result of business combinations. Goodwill and intangible assets with indefinite useful lives are not amortized. Intangible assets with definite useful lives are amortized to their estimated residual values over their estimated useful lives, and also reviewed for impairment. Amortization of core deposit intangibles is included in other noninterest expense in the consolidated statements of operations.
Goodwill is evaluated for impairment on an annual basis at December 31, or when circumstances indicate an impairment may exist. Impairment analysis of the fair value of goodwill involves a substantial amount of judgment such that quantitative and qualitative factors are both used in the Company’s analysis.
Events and factors that may significantly affect the analysis and are qualitative in nature include: a significant decline in the Company’s expected future cash flows, a substantial increase in the discount factor, a sustained, significant decline in the Company’s stock price and market capitalization, a significant adverse change in legal factors or in the business climate. Other factors might include changing competitive forces, customer behaviors and attrition, revenue trends and cost structures, along with specific industry and market conditions. Adverse change in these factors could have a significant impact on the recoverability of intangible assets.
The goodwill impairment analysis also involves a quantitative two-step process. The first step is a comparison of the Company’s fair value to its carrying value. Management estimates fair value using a combination of the income approach and market approach with the best information available, including market information and discounted cash flow analysis. The income approach uses a reporting unit’s projection of estimated operating results and cash flows that is discounted using a weighted-average cost of capital that reflects current market conditions. For purposes of the goodwill impairment test, the Company was identified as a single reporting unit. The market approach estimates the fair value of a company by examining the price at which similar companies, or shares of similar companies, are exchanged.
If the first step indicates there may be impairment, a second step is performed to confirm and measure the amount of impairment loss. The amount of impairment is determined by comparing the implied fair value of reporting unit goodwill to the carrying value of the goodwill in the same manner as if the reporting unit was being acquired in a business combination. Specifically, a company would allocate the fair value to all of the assets and liabilities of the reporting unit, including any unrecognized intangible assets, in a hypothetical analysis that would calculate the implied fair value of goodwill. If the implied fair value of goodwill is less than the recorded goodwill, the Company would record an impairment charge for the difference.
Foreclosed assets—Other real estate owned (“OREO”) and other foreclosed assets, acquired through or in lieu of foreclosure, is carried at the lower of cost or estimated fair value, less estimated costs to sell. Prior to foreclosure, the balance of the underlying loan is adjusted to equal the estimated fair value of the assets to be acquired, less estimated costs to sell, by a charge to the allowance for loan losses. After foreclosures, management periodically obtains appraisals or other independent valuations and any subsequent OREO valuation adjustments or subsequent gains or losses upon final disposition of OREO are charged to foreclosed asset expense.
Income taxes—Income taxes are accounted for using the asset and liability method. Under this method, a deferred tax asset or liability is determined based on enacted tax rates, which are expected to be in effect when the differences between the financial statement carrying amounts and tax bases of existing assets and liabilities are reported in the Company’s income tax returns. The deferred tax provision or benefit for the year is equal to the net change in the deferred tax asset or liability from the beginning to the end of the year. The effect on
69
Table of Contents
deferred taxes of a change in tax rates is recognized in income in the period that includes the enactment date. Valuation allowances are established to reduce the net carrying amount of deferred tax assets if it is determined to be more likely than not that all or some portion of the potential deferred tax asset will not be realized. In accordance with ASC Topic 740, Income Taxes, management has determined that all of the net deferred tax asset will likely not be realized and has thus established a 100% valuation allowance against the net deferred tax asset.
The Company and its subsidiary file income tax returns in the U.S. federal jurisdiction and the state of Oregon. The Company is no longer subject to U.S. federal, state and local income tax examinations by tax authorities for years prior to 2005. The Company’s policy is to recognize interest related to unrealized tax benefits and penalties as operating expenses. There were no interest or penalties accrued at December 31, 2009. The Company believes that it has appropriate support for the income tax positions taken and to be taken on its tax returns, and that its accruals for tax liabilities are adequate for all open years based on an assessment of many factors including past experience and interpretations of tax law applied to the facts of each matter.
Earnings (loss) per share of common stock—The Company’s basic earnings (loss) per common share is computed by dividing net income (loss) by the weighted-average number of common shares outstanding during the period. The Company’s diluted earnings (loss) per common share is computed similar to basic earnings (loss) per share except the denominator is increased to include the number of additional common shares that would have been outstanding if potentially dilutive common shares had been issued. Included in the denominator is the dilutive effect of stock options computed by the treasury stock method.
Share-based compensation—The Company has three active share-based compensation plans. The stock option plan permits the grant of stock options and stock awards to eligible employees and directors. The stock appreciation rights plan provides for the award of stock appreciation rights (SARs) to directors and officers of the Company that represent the right to receive an amount in cash equal to the excess of the fair market value of a share of the Company’s common stock on the award date. The employee stock purchase plan allows eligible employees to defer a whole percentage of their salary, from 1 percent to 10 percent, over a period of six months in order to purchase Company shares of common stock. The price is determined at 85 percent of the lowest market price on either the first or last day of the six-month deferral period.
ASC Topic 718 (formerly SFAS No. 123R, Share-Based Payments), requires companies to recognize in the income statement the grant-date fair value of stock options and other equity-based forms of compensation issued to employees over the employees’ requisite service period (generally the vesting period). The fair value of stock options and SARs is estimated on the date of grant using the Black-Scholes option-pricing model based on the following assumptions. Expected volatility is based on the historical volatility of the price of the Company’s stock for a period consistent with the expected life of the Company’s stock options. The Company used historical data to estimate stock option exercise and employee termination rates with the valuation model. The expected term represents the period of time that share-based awards are expected to be outstanding and is estimated based on historical stock option exercise activity. Expected dividends are estimated to be zero due to the Company’s recent historical practice of not paying dividends. The risk-free rate of return for periods within the contractual life of the share-based awards was based on the U.S. Treasury yield curve in effect at the time of the valuation. As of each reporting date the Company revalues the fair value of the outstanding SAR awards using the Black Scholes pricing model and adjusts the accrued liability accordingly.
Derivative Financial Instruments—In the ordinary course of business, the Company enters into derivative transactions to manage its interest rate risk. All derivative instruments are recorded as either other assets or other liabilities at fair value. Subsequent changes in a derivative’s fair value are recognized currently in earnings and included in noninterest expense unless specific hedge accounting criteria are met.
ASC Topic 815 (formerly SFAS No. 161, “Disclosures About Derivative Instruments and Hedging Activities—an Amendment of FASB Statement No.133), requires contemporaneous documentation of the Company’s hedge relationships. Such documentation includes the nature of the risk being hedged, the identification of the cash flow, or cash flows, that share the risk exposure that is designated as being hedged, the
70
Table of Contents
selection of the instrument that will be used to hedge the identified risk and the method used to assess the effectiveness of the hedge relationship. All components of each derivative instrument’s gain or loss are included in the assessment of hedge effectiveness. The Company performs its effectiveness assessments and measures ineffectiveness by comparing the actual swaps and floor with hypothetically perfect interest rate contracts that match the key provisions of the hedged loans. Under this approach, the cumulative change in fair value of the actual swaps and floor are compared to the cumulative change in fair value of hypothetically perfect interest rate contracts. The correlations between the hedging instruments and hedged items are assessed at inception of the hedge and on an ongoing basis, which includes determining whether the hedge relationship is expected to be highly effective in offsetting changes in cash flows of hedged items.
All derivative instruments that qualify for hedge accounting are recorded at fair value and classified either as a hedge of the fair value of a recognized asset or liability (“fair value” hedge) or as a hedge of the variability of cash flows to be received or paid related to a recognized asset or liability or a forecasted transaction (“cash flow” hedge). Changes in the fair value of a derivative that is highly effective and designated as a fair value hedge and the offsetting changes in the fair value of the hedged item are recorded in income. Changes in the fair value of a derivative that is highly effective and designated as a cash flow hedge are recognized in other comprehensive income (loss) until the income or loss from the cash flows of the hedged item is recognized. The Company performs an assessment, both at the inception of the hedge and on quarterly basis thereafter to determine whether these derivatives are expected to continue to be highly effective in offsetting changes in the value of the hedged items. The change in fair value related to the ineffective portion of the hedging derivative is immediately recorded in noninterest expense.
If a derivative designated as a cash flow hedge is terminated or ceases to be highly effective, the gain or loss is amortized to interest income over the same period(s) that the forecasted hedged transactions impact earnings (cash flow hedge). If the hedged item is disposed of, or the forecasted transaction is no longer probable, the derivative is recorded at fair value with any resulting gain or loss included in the gain or loss from the disposition of the hedged item or, in the case of a forecasted transaction that is no longer probable, included in earnings immediately.
Comprehensive income (loss)—Comprehensive income (loss) includes net income (loss) reported on the statements of operations and changes in the fair value of available-for-sale investment securities and interest rate contracts accounted for as cash flow hedges. These amounts are included in “Accumulated Other Comprehensive Income (Loss)” on the consolidated statements of changes in shareholders’ equity and comprehensive income (loss).
The components of other comprehensive income (loss) related to investment securities and cash flow hedges for the years ended December 31 were as follows:
| (dollars in thousands) | 2009 | 2008 | 2007 | |||||||||
| Net income (loss) reported |
$ | (34,775 | ) | $ | (8,098 | ) | $ | 86 | ||||
| Unrealized gain (loss) from securities: |
||||||||||||
| Net unrealized gain (loss) on available-for-sale securities arising during the period, net of tax |
1,559 | (2,166 | ) | (158 | ) | |||||||
| Reclassification adjustment of losses included in income, net of tax |
94 | 1,249 | 172 | |||||||||
| Net change in unrealized gains (losses) from securities |
1,653 | (917 | ) | 14 | ||||||||
| Unrealized gain (loss) from cash flow hedging instruments: |
||||||||||||
| Net unrealized gain (loss) from cash flow hedging instruments arising during the period, net of tax |
578 | 2,768 | 2,833 | |||||||||
| Reclassification adjustment of (gains) losses included in income, net of tax |
(4,311 | ) | (901 | ) | 107 | |||||||
| Net change in unrealized (gains) losses from cash flow hedging instruments |
(3,733 | ) | 1,867 | 2,940 | ||||||||
| Total comprehensive income (loss) |
$ | (36,855 | ) | $ | (7,148 | ) | $ | 3,040 | ||||
71
Table of Contents
NOTE 2—GOING CONCERN
The Consolidated financial statements have been prepared assuming that the Company will continue as a going concern. The Company and the subsidiary Bank are considered “under-capitalized” as of December 31, 2009 as discussed in Note 15. Due to market conditions discussed below and other factors, there is uncertainty about the Company’s ability to satisfy regulatory requirements, including restoration of the Bank to capital levels stipulated in the Consent Order (the “Order”) issued by the Federal Deposit Insurance Corporation (the “FDIC”) and the Washington Department of Financial Institutions (the “DFI”) dated January 27, 2010, based on certain findings from an examination of the Bank concluded in August 2009. The Order required the Bank, among other things, to attain a 10 percent Tier 1 leverage capital ratio by April 27, 2010. The additional capital required to satisfy the requirement of the Order as of December 31, 2009 was approximately $35 million.
As a part of its capital raising efforts launched during the fourth quarter of 2008, the Company engaged a highly qualified investment banking firm with expertise in the financial services sector to assist with a review all strategic opportunities available to the Company. The principal focus of this effort has been on securing a significant private equity investment. While the Company’s financial condition has been weakened by the severe downturn in the real estate markets and higher levels of expenses associated with nonperforming assets, as well as an increase in FDIC insurance assessments, it is the Company’s belief that general concern about the U.S. economy and prospects for expanded government regulation of financial institutions has also been a significant impediment to securing capital commitments.
While there are a number of financial institutions of similar size and condition that have been attempting to raise capital over the past year, there has been a very limited amount of private equity that has been raised. Although the Company has not been successful to date in obtaining private equity, it has engaged in numerous discussions and due diligence with qualified institutional and private investors. The Company will continue to vigorously pursue contacts and discussions with prospective investors and is confident that if the conditions in the capital markets improve over the coming months, the prospects for success in these efforts will substantially increase. The Company also is continuing its strategy to significantly reduce loans, thereby reducing the required level of capital.
During 2009 and 2008, the Company took decisive actions to address the deterioration in the construction and development sector of the loan portfolio resulting from a general and severe deterioration in the residential real estate valuations and sales activity. Loan charge-offs totaling $37.6 million were recognized during 2009 and 2008, of which over 64 percent were related to construction and land development loans. Although additional loan loss provisions and charge-offs will likely be recognized during 2010, the Company does not expect the other segments of the portfolio will suffer from extreme losses and, accordingly, that the regulatory capital levels will not be impacted by the same magnitude in 2010 as in 2009 and 2008.
Despite the restrictions on issuance and renewal of brokered certificates of deposit which became effective in 2009, the Bank maintained a significant liquidity position at December 31, 2009 through its core deposit base, issuance of internet service listing deposits and benefit of the increased FDIC deposit insurance limits. At December 31, 2009, the Bank had $139.7 million of cash and cash equivalent investments.
Efforts to improve the Bank’s capital levels through improved internal equity generation were also initiated in the first quarter of 2010 in conjunction with a review of the Bank’s business model. Management is implementing cost reduction strategies involving wage controls, reductions in discretionary spending, and eliminating unprofitable business lines and may consider merging certain branches to reduce staffing and operating expense levels. Efforts to identify additional expense reductions are ongoing.
There are no assurances that plans to achieve objectives set forth in the Order will successfully improve the Bank’s results of operation or financial condition or result in termination of the Order from the FDIC and the DFI. In addition, failure to increase capital levels consistent with the requirements of the Order could result in
72
Table of Contents
further enforcement actions by the FDIC and/or DFI. Full satisfaction of the Order’s requirements will depend almost exclusively on raising a significant amount of additional capital. The Company may also face additional restrictions from the Board of Governors of the Federal Reserve based on the Bank’s and Company’s capitalization and other conditions giving rise to the Order.
The consolidated financial statements have been prepared assuming that the Company will continue as a going concern. There can be no assurances that the Company’s actions referred to above will be successful, and these events raise substantial doubt about the Company’s ability to continue as a going concern. The consolidated financial statements do not include any adjustments that might result from the outcome of these uncertainties.
NOTE 3—REVERSE STOCK SPLIT
Effective March 1, 2010, the Company affected a one-for-ten reverse stock split of shares of its common stock issued and outstanding, with payment of cash for any resulting fractional shares. The Company’s number of authorized shares of 25,000,000 was maintained. All references to number of common shares and per share amounts have been restated to reflect the reverse stock split.
NOTE 4—EARNINGS (LOSS) PER SHARE
The following table reconciles the denominator of the basic and diluted earnings (loss) per share computations:
| Years Ended December 31, | ||||||
| 2009 | 2008 | 2007 | ||||
| Weighted-average shares outstanding—basic |
512,663 | 507,531 | 497,250 | |||
| Effect of assumed conversion of stock options |
— | — | 20,303 | |||
| Weighted-average shares outstanding—diluted |
512,663 | 507,531 | 517,553 | |||
No options to purchase shares were included in the computation of diluted earnings (loss) per share for the years ended December 31, 2009 and 2008, as their inclusion would be anti-dilutive. Stock options outstanding in 2009 and 2008, with prices ranging from $44.40 to $168.10, were 63,061 and 67,206, respectively, and averaged 64,634 and 68,653, respectively. All options outstanding were included in the computation of diluted earnings for the year ended December 31, 2007.
NOTE 5—RESERVE REQUIREMENTS
By regulation, the Bank must meet reserve requirements established by the Federal Reserve Bank equal to a percentage of its reservable deposits. No reserves were required at December 31, 2009 or 2008.
NOTE 6—INVESTMENT SECURITIES
The amortized cost and estimated fair value of investment securities at December 31 are shown below:
| (dollars in thousands) December 31, 2009: |
Amortized Cost |
Unrealized Gains |
Unrealized Losses |
Fair Value | |||||||||
| U.S. Agency mortgage-backed securities |
$ | 21,714 | $ | 1,022 | $ | — | $ | 22,736 | |||||
| Non-agency mortgage-backed securities |
4,186 | 22 | (823 | ) | 3,385 | ||||||||
| Municipal bonds |
21,326 | 652 | (153 | ) | 21,825 | ||||||||
| Other securities |
535 | 10 | — | 545 | |||||||||
| $ | 47,761 | $ | 1,706 | $ | (976 | ) | $ | 48,491 | |||||
73
Table of Contents
| December 31, 2008: |
Amortized Cost |
Unrealized Gains |
Unrealized Losses |
Fair Value | |||||||||
| U.S. Agency mortgage-backed securities |
$ | 39,003 | $ | 820 | $ | (5 | ) | $ | 39,818 | ||||
| Non-agency mortgage-backed securities |
3,971 | — | (1,557 | ) | 2,414 | ||||||||
| Municipal bonds |
21,965 | 93 | (777 | ) | 21,281 | ||||||||
| Other securities |
546 | 5 | — | 551 | |||||||||
| $ | 65,485 | $ | 918 | $ | (2,339 | ) | $ | 64,064 | |||||
The following table presents the gross unrealized losses and fair value of the Company’s investment securities aggregated by investment category and length of time that individual securities have been in a continuous unrealized loss position, at December 31, 2009:
| Less Than 12 Months | 12 Months or More | Total | |||||||||||||||||||
| (dollars in thousands) | Fair Value |
Unrealized Losses |
Fair Value |
Unrealized Losses |
Fair Value |
Unrealized Losses |
|||||||||||||||
| Non-agency mortgage-backed securities |
$ | — | $ | — | $ | 2,646 | $ | (823 | ) | $ | 2,646 | $ | (823 | ) | |||||||
| Municipal bonds |
1,355 | (5 | ) | 4,827 | (148 | ) | 6,182 | (153 | ) | ||||||||||||
| $ | 1,355 | $ | (5 | ) | $ | 7,473 | $ | (971 | ) | $ | 8,828 | $ | (976 | ) | |||||||
At December 31, 2009, there were 18 investment securities in an unrealized loss position, of which 13 were in a continuous loss position for 12 months or more. The Company uses an independent third party to determine current fair values of the securities it holds. These fair market values are compared to current carrying values to determine if a security is in an unrealized gain or loss position.
Management evaluates securities for other-than-temporary impairment (“OTTI”) quarterly. Consideration is given to, among other things: (1) the length of time and extent to which the fair value has been less than cost; (2) the financial condition and near term prospects of the issuer; (3) our intent and ability to retain a security for a period of time sufficient to allow for any anticipated recovery in fair value; and (4) whether we expect to recover the amortized cost basis of the security.
The Company holds three non-agency mortgage-backed securities, two of which have been in a loss position for greater than twelve months. Management has reviewed these securities for the presence of OTTI, taking into consideration current market conditions, fair value in relationship to cost, credit agency ratings, credit enhancements and coverage ratios, historical experience of prepayment rates, collateral default rates and default loss severity. The Company’s analysis in 2009 on one non-agency mortgage-backed security rated less than investment grade, with an amortized cost basis of $2.4 million, indicated a shortfall of estimated contractual cash flows to the tranche of this security owned by the Company. The difference between management’s estimate of the present value of the cash flows expected to be collected and the amortized cost basis, is considered to be uncollectible and accordingly, the Company recorded an OTTI loss of $86,000 in 2009. The amount of unrealized loss included in OCI at December 31, 2009 related to this security was $722,000.
Management continues to monitor the credit performance of this security and if the performance deteriorates from current levels, additional OTTI losses may be recognized in the future. The unrealized losses on the two other securities were due to changes in market interest rates or widening of market spreads subsequent to the initial purchase of the securities and not credit quality. The Company does not have the intent to sell these securities and does not anticipate that these securities will be required to be sold before anticipated recovery, and expects full principal and interest to be collected. Therefore, the Company does not consider these investments to be OTTI at December 31, 2009.
74
Table of Contents
The Company recorded an OTTI charge of $10,000 on its FNMA preferred securities for the year ended December 31, 2009 and $1,724,000 in 2008. In reaching the determination to record this impairment, management reviewed the facts and circumstances available regarding these securities, the financial condition of the issuer and the prospects for a change in market value within a reasonable period of time.
The unrealized losses on the Company’s investments in state and political subdivisions are due to market conditions, not in estimated cash flows. The Company does not have the intent to sell these securities and does not anticipate that these securities will be required to be sold before anticipated recovery, and expects full principal and interest to be collected. Therefore, the Company does not consider these investments to be OTTI at December 31, 2009.
The amortized cost and estimated fair value of investment securities by contractual maturity at December 31, 2009, are shown below. Expected maturities may differ from contractual maturities because borrowers may have the right to call or prepay the obligations with or without call or prepayment penalties.
| Available-for-Sale | ||||||
| (dollars in thousands) | Amortized Cost |
Estimated Fair Value | ||||
| Due within one year |
$ | 8,343 | $ | 8,716 | ||
| Due after one year through five years |
18,902 | 18,963 | ||||
| Due after five years through ten years |
12,130 | 12,423 | ||||
| Due after ten years |
8,386 | 8,389 | ||||
| $ | 47,761 | $ | 48,491 | |||
For the purposes of the maturity schedule, mortgage-backed securities, which are not due at a single maturity date, have been allocated over maturity groupings based on the expected maturity of the underlying collateral. Mortgage-backed securities often mature earlier than their stated contractual maturities because of accelerated principal repayments of the underlying loans. As of December 31, 2009 and 2008, investment securities in the amounts of $47.4 million and $45.1 million, respectively, were pledged as collateral to secure public deposits and borrowings.
The Company realized gross losses related to sales and calls of securities of $2,000, $200,000 and $265,000 for the years 2009, 2008 and 2007, respectively.
75
Table of Contents
NOTE 7—LOANS AND ALLOWANCE FOR CREDIT LOSSES
The following table presents the loan portfolio, in accordance with Bank regulatory guidance for the preparation of the call report, as of December 31, 2009 and 2008:
| December 31, | ||||||||
| (dollars in thousands) | 2009 | 2008 | ||||||
| Commercial |
$ | 69,726 | $ | 113,991 | ||||
| Real estate: |
||||||||
| Construction |
||||||||
| 1-4 family residential |
4,601 | 18,386 | ||||||
| Multi-family/condominimums |
557 | 12,636 | ||||||
| Residential land development |
21,253 | 22,621 | ||||||
| Commercial |
15,647 | 39,548 | ||||||
| Total construction |
42,058 | 93,191 | ||||||
| Residential 1-4 family |
38,792 | 36,662 | ||||||
| Multifamily |
15,535 | 3,028 | ||||||
| Commercial real estate |
175,105 | 184,213 | ||||||
| Total real estate |
271,490 | 317,094 | ||||||
| Installment and other consumer |
2,604 | 3,146 | ||||||
| Total loans, gross |
343,820 | 434,231 | ||||||
| Deferred loan fees |
(493 | ) | (1,016 | ) | ||||
| Loans, net of deferred loan fees |
$ | 343,327 | $ | 433,215 | ||||
The allowance for credit losses is based upon estimates of probable losses inherent in the loan portfolio and the Company’s commitments to extend credit to borrowers. The amount of loss ultimately incurred for these loans can vary significantly from the estimated amounts. An analysis of the change in the allowance for credit losses for the years ended December 31 is as follows:
| (dollars in thousands) | 2009 | 2008 | 2007 | |||||||||
| Balance at beginning of year |
$ | 13,994 | $ | 5,990 | $ | 4,825 | ||||||
| Provision for credit losses |
22,261 | 17,595 | 7,800 | |||||||||
| Recoveries |
2,032 | 99 | 435 | |||||||||
| Charge-offs |
(27,931 | ) | (9,690 | ) | (7,070 | ) | ||||||
| Balance at end of year |
$ | 10,356 | $ | 13,994 | $ | 5,990 | ||||||
| Components: |
||||||||||||
| Allowance for loan losses |
$ | 10,164 | $ | 13,712 | $ | 5,801 | ||||||
| Liability for unfunded loan commitments |
192 | 282 | 189 | |||||||||
| Total allowance for credit losses |
$ | 10,356 | $ | 13,994 | $ | 5,990 | ||||||
At December 31, 2009, the recorded investment in loans classified as impaired totaled $48.5 million, with an associated allowance of $1.7 million. At December 31, 2008, the recorded investment in loans classified as impaired totaled $31.8 million, with an associated allowance of $98,000. The average recorded investment in impaired loans was approximately $48.7 million, $23.1 million and $7.8 million for the years ended December 31, 2009, 2008, and 2007, respectively. The amount of interest recognized on impaired loans during the portion of the year they were impaired was not significant in any of the years presented.
Nonaccrual loans totaled $48.5 million at December 31, 2009 and $15.7 million at December 31, 2008. If nonaccrual loans had performed according to their original terms, additional interest income of approximately $3.4 million, $0.8 million and $1.0 million would have been recognized in 2009, 2008 and 2007, respectively.
76
Table of Contents
Interest payments received on a nonaccrual loan are recorded as interest income, unless collection of the remaining recorded investment is not probable, in which case payments received are recorded as a reduction of principal. Loans 90 days past due and still accruing were none and $6.2 million at December 31, 2009 and 2008, respectively.
NOTE 8—PREMISES AND EQUIPMENT
Premises and equipment consist of the following at December 31:
| (dollars in thousands) | 2009 | 2008 | ||||||
| Land |
$ | 614 | $ | 614 | ||||
| Buildings and improvements |
5,701 | 5,633 | ||||||
| Furniture and equipment |
4,503 | 5,110 | ||||||
| Total premises and equipment |
10,818 | 11,357 | ||||||
| Accumulated depreciation |
(5,329 | ) | (5,172 | ) | ||||
| Premises and equipment, net |
$ | 5,489 | $ | 6,185 | ||||
Depreciation expense was $934,000, $939,000 and $742,000 for the years ended December 31, 2009, 2008 and 2007, respectively.
NOTE 9—GOODWILL AND CORE DEPOSIT INTANGIBLES
As of December 31, 2009, management performed its annual goodwill impairment evaluation. In addition to the quantitative two-step analysis, management also considered certain qualitative information in its goodwill impairment analysis. Some of the qualitative factors were: the continued decline in stock values for financial services companies, including Cowlitz Bancorporation, which indicates that the value of goodwill for the industry, particularly for banks with a financial profile similar to ours, has been severely diminished; in 2009, the Company recorded a 100 percent valuation allowance against its deferred tax assets due to there being no assurance that the Company will generate future taxable income to utilize such assets; and the Bank is currently operating under a Consent Order with the FDIC requiring, among other things, increasing capital and profitability of the Bank, as well as restricting the Bank’s access to brokered deposits. After considering both the quantitative and qualitative factors in its impairment analysis, management recorded a 100 percent impairment charge against this asset in the fourth quarter of 2009.
The following table summarizes changes in the Company’s goodwill and core deposit intangibles for the years ended December 31, 2009 and 2008.
| (dollars in thousands) | Goodwill | Core Deposit Intangibles |
||||||
| Balance, December 31, 2007 |
$ | 1,798 | $ | 35 | ||||
| Amortization |
— | (35 | ) | |||||
| Balance, December 31, 2008 |
1,798 | — | ||||||
| Impairment |
(1,798 | ) | — | |||||
| Balance, December 31, 2009 |
$ | — | $ | — | ||||
NOTE 10—CERTIFICATES OF DEPOSIT
Included in certificates of deposit are certificates in denominations of $100,000 or greater totaling $116.2 million and $93.2 million at December 31, 2009 and 2008, respectively. Interest expense relating to certificates of deposit in denominations of $100,000 or greater was $2.5 million, $2.8 million, and $3.8 million for the years ended December 31, 2009, 2008, and 2007, respectively.
77
Table of Contents
At December 31, 2009, the scheduled maturities for all time deposits are as follows:
| (dollars in thousands) | |||
| Years ending December 31, 2010 |
$ | 213,595 | |
| 2011 |
108,576 | ||
| 2012 |
42,760 | ||
| 2013 |
12,432 | ||
| 2014 |
5,831 | ||
| $ | 383,194 | ||
As a result of the bank’s regulatory capital classification, it has not been able to accept or renew any brokered certificates of deposits since mid-2009. Total brokered deposits (national brokered CD’s and CDARs deposits) were $163.1 million at December 31, 2009 with scheduled maturities as follows:
| (dollars in thousands) | |||
| Years ending December 31, 2010 |
$ | 72,740 | |
| 2011 |
54,811 | ||
| 2012 |
25,999 | ||
| 2013 |
9,219 | ||
| 2014 |
283 | ||
| $ | 163,052 | ||
NOTE 11—FEDERAL FUNDS PURCHASED
The balance in unsecured overnight federal funds purchased was zero at December 31, 2009 and December 31, 2008. The Bank had uncommitted federal funds line of credit agreements with other financial institutions totaling $7.3 million and $25 million at December 31, 2009 and 2008, respectively. Availability of the lines is subject to federal funds balances available for loan, continued borrower eligibility and are reviewed and renewed periodically throughout the year. These lines are intended to support short-term liquidity needs. The federal funds line of credit agreement at year-end 2009 limits the usage to ten consecutive days.
NOTE 12—JUNIOR SUBORDINATED DEBENTURES AND OTHER BORROWINGS
Junior subordinated debentures and other borrowings consist of the following at December 31:
| (dollars in thousands) | 2009 | 2008 | ||||
| Junior subordinated debentures |
$ | 12,372 | $ | 12,372 | ||
| Notes payable to FHLB; payable in monthly installments including interest; through November 2009 |
— | 37 | ||||
| Contract payable; payable in monthly installments including interest through September 2010 |
6 | 14 | ||||
| $ | 12,378 | $ | 12,423 | |||
In April 2005, the Company formed a wholly owned Delaware statutory business trust subsidiary, Cowlitz Statutory Trust I (the Trust), which issued $12,000,000 of guaranteed undivided beneficial interests in the Company’s Junior Subordinated Deferrable Interest Debentures (Trust Preferred Securities). The Company owns all of the common securities of the Trust. The proceeds from the issuance of the common securities and the Trust Preferred Securities were used by the Trust to purchase $12,372,000 of junior subordinated debentures of the Company. The debentures, which represent the sole asset of the Trust, accrue and pay distributions quarterly at a variable rate of 90-day LIBOR plus 1.75 percent per annum of the stated liquidation value of $1,000 per capital
78
Table of Contents
security. The Company has entered into contractual arrangements which, taken collectively, fully and unconditionally guarantee payment of: (1) accrued and unpaid distributions required to be paid on the Trust Preferred Securities, (2) the redemption price with respect to any Trust Preferred Securities called for redemption by the Trust, and (3) payments due upon a voluntary or involuntary dissolution, winding up or liquidation of the Trust. The Trust Preferred Securities are mandatorily redeemable upon maturity of the debentures on June 15, 2035 or upon earlier redemption as provided in the indenture. The Company has the right to redeem the debentures purchased by the Trust in whole or in part after five years. As specified in the indenture, if the debentures are redeemed prior to maturity, the redemption price will be the principal amount and any accrued but unpaid interest.
These debentures qualify as Tier 1 capital under Federal Reserve Board guidelines. Federal Reserve guidelines limit inclusion of trust preferred securities and certain other preferred capital elements to 25 percent of core capital elements. As of December 31, 2009, the amount of trust preferred securities included in Tier 1 capital totaled $3.6 million, with the balance of the securities included in Tier 2 capital.
Beginning with the payment that was due in September 2009, the Company has deferred regularly scheduled interest payments on its outstanding junior subordinated notes relating to its Trust Preferred Securities. Under the terms of the junior subordinated notes and the trust documents, the Company is allowed to defer payments of interest for up to 20 consecutive quarterly periods. The Company is not in default with respect to the Trust Preferred Securities, and the deferral of interest does not constitute an event of default. The Company will continue to accrue interest, but the Company will not make cash interest payments until such time as it elects to resume payments. This action is consistent with the Company’s current business strategy to preserve cash balances at the holding company and maintain a strong balance sheet for the Bank. During the deferral period, the Company generally may not pay cash dividends on or repurchase its common stock. The amount of deferred interest was $139,300 at year-end 2009.
The FHLB borrowing agreements require the Bank to deliver collateral to the FHLB in Seattle, Washington and limit outstanding borrowings to 20 percent of total assets. The FHLB has issued standby letters of credit totaling $5.5 million at December 31, 2009 to support the Bank’s public deposits.
NOTE 13—INCOME TAXES
Components of the income tax provision (benefit) were as follows for the years ended December 31:
| (dollars in thousands) | 2009 | 2008 | 2007 | ||||||||
| Current tax expense (benefit) |
$ | — | $ | 37 | $ | (8 | ) | ||||
| Deferred tax expense (benefit) |
8,921 | (5,369 | ) | (782 | ) | ||||||
| Income tax provision (benefit) |
$ | 8,921 | $ | (5,332 | ) | $ | (790 | ) | |||
79
Table of Contents
The composition of deferred tax assets and deferred tax liabilities was as follows at December 31:
| (dollars in thousands) | 2009 | 2008 | ||||||
| Deferred tax assets: |
||||||||
| Allowance for loan losses |
$ | 3,568 | $ | 4,814 | ||||
| Liability for unfunded commitments |
68 | 99 | ||||||
| Intangibles |
489 | 608 | ||||||
| Net operating loss carryforwards |
12,012 | 2,282 | ||||||
| Unrealized loss on investment securities available for sale |
— | 499 | ||||||
| Valuation allowance on OREO |
1,106 | 666 | ||||||
| Impairment loss on securities |
611 | 577 | ||||||
| Tax credits |
776 | 661 | ||||||
| Other |
287 | 354 | ||||||
| Gross deferred tax assets |
18,917 | 10,560 | ||||||
| Valuation allowance |
(17,569 | ) | — | |||||
| Total deferred tax asset |
1,348 | 10,560 | ||||||
| Deferred tax liabilities: |
||||||||
| Federal Home Loan Bank stock dividends |
(245 | ) | (245 | ) | ||||
| Deferred loan fees |
(179 | ) | (194 | ) | ||||
| Accumulated depreciation |
(225 | ) | (257 | ) | ||||
| Unrealized gain on available for sale securities |
(256 | ) | — | |||||
| Unrealized gain on cash flow hedging instruments |
(178 | ) | (2,604 | ) | ||||
| Other |
(265 | ) | (139 | ) | ||||
| (1,348 | ) | (3,439 | ) | |||||
| Net deferred tax assets |
$ | — | $ | 7,121 | ||||
The net deferred tax assets as shown in the table above are included in other assets on the Consolidated Statements of Financial Condition. At December 31, 2009, the Company had $17.6 million of net deferred tax assets comprised of tax-affected cumulative temporary differences primarily related to the provision for credit losses and net operating loss and tax credit carry-forwards. The Company has provided a 100 percent valuation allowance against the net deferred tax assets at December 31, 2009 as there is no assurance that the Company will generate future taxable income to utilize such assets. Management will review the valuation allowance periodically and make adjustments as warranted.
At December 31, 2009, the Company had a $35.1 million federal net operating loss carry-forward, expiring $229,000 in 2020, $3.9 million in 2025, $3.2 million in 2027, and $27.8 million in 2029 and unused general business credit carry-forwards of $567,000 that are available to reduce future federal income tax, expiring at various times between 2024 and 2029. In addition, the Company has available alternative minimum tax credit carry-forwards of approximately $209,000 that may be used indefinitely to reduce regular federal income taxes.
A reconciliation between the statutory federal income tax provision and the effective tax provision is as follows:
| Years Ended December 31, | ||||||||||||
| (dollars in thousands) | 2009 | 2008 | 2007 | |||||||||
| Federal income taxes at statutory rate |
$ | (8,791 | ) | $ | (4,566 | ) | $ | (240 | ) | |||
| Effect of valuation allowance |
18,004 | — | — | |||||||||
| Effect of goodwill impairment |
621 | — | — | |||||||||
| Effect of state income taxes |
(221 | ) | (142 | ) | (13 | ) | ||||||
| Effect of nontaxable loan and investment income |
(559 | ) | (563 | ) | (493 | ) | ||||||
| Tax credits |
(112 | ) | (112 | ) | (112 | ) | ||||||
| Other |
(21 | ) | 51 | 68 | ||||||||
| $ | 8,921 | $ | (5,332 | ) | $ | (790 | ) | |||||
80
Table of Contents
The Company and its subsidiary file income tax returns in the U.S. federal jurisdiction and the State of Oregon. The years 2006 through 2008 remain open to examination for federal income taxes, and years 2005 through 2008 remain open for State examination. The Company’s policy is to recognize interest related to the unrealized tax benefits and penalties as operating expenses. There were no interest or penalties paid during the years ended December 31, 2009 and 2008. No accrued interest or penalties were recorded as of December 31, 2009 and 2008. The Company believes that it has appropriate support for the income tax positions taken and to be taken on its tax returns, and that its accruals for tax liabilities are adequate for all open years based on an assessment of many factors including past experience and interpretations of tax law applied to the facts of each matter.
NOTE 14—DERIVATIVE INSTRUMENTS AND HEDGING ACTIVITIES
The Company holds loans that have variable rates, thus creating exposure to the variability or uncertainty of future cash flows due to changes in interest rates. The Company periodically uses interest rate contracts to manage the risk of overall changes in cash flows associated with interest receipts on its prime-based variable-rate loans. In the first quarter of 2006, the Company purchased a $50 million five-year prime-based interest rate floor, and in November 2006 the Company purchased two interest rate swaps with an aggregate notional value totaling $75 million. The interest rate swap contracts were scheduled to expire in May 2011. The Company began applying cash flow hedge accounting treatment, as prescribed by ASC Topic 815, as of December 12, 2006 to all of its interest rate contracts. In a cash flow hedge, the effective portion of the change in the fair value of the hedging derivative is recorded in accumulated other comprehensive income (loss) and is subsequently reclassified into earnings during the same period in which the hedged item affects earnings. The change in fair value of any ineffective portion of the hedging derivative is recognized immediately in earnings. When a hedged item is de-designated prior to maturity, previous adjustments to accumulated other comprehensive income or loss are recognized in earnings to match the earnings recognition pattern over the life of the hedged item if the expected cash flows are probable of occurring as originally specified at inception of the initial hedging relationship.
One interest rate swap contract was terminated in the second quarter of 2008 for a pre-tax gain of $482,000. The other interest rate swap contract was terminated in the first quarter of 2009 for a pre-tax gain of $3.8 million. At the time of the terminations of these contracts, the forecasted transactions at the inception of the hedging relationship remained probable. Therefore, the realized gains were being amortized into earnings over the original term of the interest rate contracts. The Company terminated its interest rate floor contract in the third quarter of 2009 for a pre-tax gain of $2.6 million. As of the end of the third quarter of 2009, the Company determined that the amount of loans eligible for hedge accounting under the terms of its hedge designation documentation had significantly decreased and that it was not probable that the Company would have $125 million of loans eligible for hedge accounting as established under the terms of it hedge documentation. At September 30, 2009, approximately $40.1 million of loans were eligible for hedge accounting under the terms of the Company’s original hedge designation. Gains recognized on terminated interest rate contracts no longer qualifying for hedge accounting totaled $3.1 million and were recorded in noninterest income in the third quarter of 2009. Gains totaling $600,000 remained in Accumulated Other Comprehensive Income at September 30, 2009 to be amortized over the remaining term of the original designated hedging relationship. At December 31, 2009 and 2008, the unrealized gain, net of tax, on interest rate contracts included in Accumulated Other Comprehensive Income was $506,600 and $4.2 million, and the fair value of the Company’s interest rate contracts designated as hedging instruments (included in other assets on the Consolidated Statements of Condition) was zero and $8.1 million, respectively.
81
Table of Contents
The following table shows the location and amount of gains and losses reported in the Consolidated Statement of Operations on the Company’s interest rate contracts, designated as hedging instruments, for the year ended December 31, 2009:
| (dollars in thousands) | ||||||||||||||||
| Amount of Gain or (Loss) Recognized in OCI (Effective Portion) |
Location of Gain or (Loss) Reclassified from Accumulated OCI Into Income (Effective Portion) |
Amount of Gain or (Loss) Reclassified from Accumulated OCI Into Income (Effective Portion) |
Location of Gain or (Loss) Reclassified from Accumulated OCI Into Income (Effective Portion) |
Amount of Gain or (Loss) Reclassified from Accumulated OCI Into Income (Effective Portion) |
Location of Gain or (Loss) Recognized in Income (Ineffective Portion) |
Amount of Gain or (Loss) Recognized in Income (Ineffective Portion) |
||||||||||
| $(1,565) |
Interest Income | $ | 1,604 | Noninterest Income | $ | 3,110 | Noninterest Expense | $ | (395 | ) | ||||||
In the next twelve months, it is estimated that the hedged forecasted transactions will affect earnings such that a non-cash credit of $412,100 will be reclassified into earnings from accumulated other comprehensive income.
NOTE 15—SHAREHOLDERS’ EQUITY AND REGULATORY CAPITAL
The Company pays dividends from its retained earnings, which are principally provided through dividends and income from its subsidiaries. However, state agencies restrict the amount of funds the Bank may transfer to the Company in the form of cash dividends, loans, or advances.
The Company and the Bank are subject to various regulatory capital requirements administered by federal and state banking agencies. Failure to meet minimum capital requirements can initiate certain mandatory or discretionary actions by regulators that, if undertaken, could have a direct material effect on the Company’s operations and consolidated financial statements. Under capital adequacy guidelines and the regulatory framework for prompt corrective action, the Company and the Bank must meet specific capital guidelines that involve quantitative measures of assets, liabilities, and certain off-balance-sheet items as calculated under regulatory accounting practices. Capital amounts and classification are also subject to qualitative judgments by the regulators about components, risk weightings, and other factors.
Quantitative measures established by regulation to ensure capital adequacy require the Company and the Bank to maintain minimum amounts and ratios (set forth in the table below) of total and Tier 1 capital (as defined in the regulations) to risk-weighted assets (as defined), and of Tier 1 capital (as defined) to average assets (as defined).
82
Table of Contents
As of December 31, 2009, the Bank was categorized as “under-capitalized” under the regulatory framework for prompt corrective action due to the total capital to risk-weighted assets ratio and the Tier 1 leverage capital ratio falling below the adequately capitalized category. The Bank was above the well-capitalized minimum for the Tier 1 risk-based capital ratio. At December 31, 2009, the consolidated company was below the capital ratio requirements to be adequately capitalized for the total capital ratio and the Tier 1 leverage ratio. The leverage ratio reflects, in part, the effect of maintaining a high level of liquidity at year-end 2009. The minimum ratios and the actual capital ratios at December 31, 2009 and 2008 are presented in the following table along with the regulatory levels:
| Actual | For Capital Adequacy Purposes |
To Be Well-Capitalized Under Prompt Corrective Action Provisions | ||||||||||||||
| Amount | Ratio | Amount | Ratio | Amount | Ratio | |||||||||||
| December 31, 2009 |
||||||||||||||||
| Total risk-based capital: |
||||||||||||||||
| Consolidated |
$ | 27,538 | 7.40% | $ | 29,759 | ³8.00% | N/A | N/A | ||||||||
| Bank |
$ | 27,291 | 7.34% | $ | 29,739 | ³8.00% | $37,174 | ³10.00% | ||||||||
| Tier 1 risk-based capital: |
||||||||||||||||
| Consolidated |
$ | 14,424 | 3.88% | $ | 14,880 | ³4.00% | N/A | N/A | ||||||||
| Bank |
$ | 22,571 | 6.07% | $ | 14,870 | ³4.00% | $ | 22,304 | ³6.00% | |||||||
| Tier 1 (leverage) capital: |
||||||||||||||||
| Consolidated |
$ | 14,424 | 2.50% | $ | 23,087 | ³4.00% | N/A | N/A | ||||||||
| Bank |
$ | 22,571 | 3.91% | $ | 23,087 | ³4.00% | $ | 28,859 | ³5.00% | |||||||
| December 31, 2008 |
||||||||||||||||
| Total risk-based capital: |
||||||||||||||||
| Consolidated |
$ | 54,637 | 11.47% | $ | 38,118 | ³8.00% | N/A | N/A | ||||||||
| Bank |
$ | 52,819 | 11.10% | $ | 38,076 | ³8.00% | $ | 47,595 | ³10.00% | |||||||
| Tier 1 risk-based capital: |
||||||||||||||||
| Consolidated |
$ | 48,582 | 10.20% | $ | 19,059 | ³4.00% | N/A | N/A | ||||||||
| Bank |
$ | 46,770 | 9.83% | $ | 19,038 | ³4.00% | $ | 28,557 | ³6.00% | |||||||
| Tier 1 (leverage) capital: |
||||||||||||||||
| Consolidated |
$ | 48,582 | 8.74% | $ | 22,240 | ³4.00% | N/A | N/A | ||||||||
| Bank |
$ | 46,770 | 8.41% | $ | 22,243 | ³4.00% | $ | 27,804 | ³5.00% | |||||||
NOTE 16—SHARE-BASED COMPENSATION AND EMPLOYEE STOCK PURCHASE PLANS
The Company has a stock option plan, a stock appreciation rights (SARs) plan and an employee stock purchase plan, which are described below. Compensation expense related to these plans was a net credit of $63,000 in 2009 and a net charge of $284,000 and $215,000 in 2008 and 2007, respectively. The net credit in 2009 was primarily due to the reversal of previously accrued expense of $105,000 related to the SAR plan. The estimated liability for expense under the SAR plan is directly related to the price of the Company’s stock, which has declined subsequent to the issuance of SARs to employees. Unrestricted stock awards (3,570 shares) were granted in 2008 at a market price of $61.98 for total compensation cost of $221,300. Income tax benefits recognized in the statement of operations for share-based compensation in 2009, 2008 and 2007 were none, $100,000 and $74,000, respectively. Share-based compensation cost in 2007 also included $49,800 of costs related to the accelerated vesting of stock options granted in prior years for a retiring director. At December 31, 2009 and 2008, unrecognized estimated compensation cost related to non-vested SARs and stock options was not significant.
83
Table of Contents
The average fair value of stock options and SARs is estimated on the date of grant using the Black-Scholes option pricing model. There were no stock options granted in 2009 and 2008 and no SARs granted in 2009. The following table presents the weighted average assumptions used in the grant date fair value calculation.
| Options 2007 |
SARs | |||||||||||
| 2008 | 2007 | |||||||||||
| Risk free interest rate |
4.5 | % | 3.3 | % | 4.5 | % | ||||||
| Expected dividend |
— | — | — | |||||||||
| Expected term, in years |
5.1 | 5.1 | 5.1 | |||||||||
| Expected volatility |
26.5 | % | 26.9 | % | 26.5 | % | ||||||
| Number of shares granted |
700 | 14,790 | 12,580 | |||||||||
| Fair value of option/SAR granted |
$ | 54.90 | $ | 28.00 | $ | 52.40 | ||||||
Stock Option Plan
The Company has one active shareholder approved stock option plan (the 2003 Plan) that permits the grant of stock options and stock awards for up to 50,000 shares, of which 2,380 were available for issue at December 31, 2009. Under the 2003 Plan, options may be granted to the Company’s employees, non-employee directors, and others whom management believes contributed to the long-term financial success of the Company. From time-to-time, the Company also grants stock options outside the 2003 Plan in the process of recruiting senior management. The exercise price of all stock option awards must be at least equal to the fair value of the common stock on the date of grant and can vest immediately or over time at the discretion of the Board of Director’s Compensation Committee and expire ten years after the date of grant. It is the Company’s policy to issue new shares for stock options exercised or stock awards.
The following table summarizes stock option activity for the years ended December 31:
| 2009 | 2008 | 2007 | ||||||||||||||||
| (dollars in thousands) | Common Shares |
Weighted- Average Price |
Common Shares |
Weighted- Average Price |
Common Shares |
Weighted- Average Price | ||||||||||||
| Balance, beginning of year |
67,207 | $ | 109.80 | 72,214 | $ | 109.20 | 87,154 | $ | 106.90 | |||||||||
| Granted |
— | — | — | — | 700 | 168.10 | ||||||||||||
| Exercised |
(1,225 | ) | 46.20 | (307 | ) | 45.30 | (15,535 | ) | 99.30 | |||||||||
| Forfeited/Expired |
(2,921 | ) | 110.60 | (4,700 | ) | 104.10 | (105 | ) | 77.00 | |||||||||
| Balance, end of year |
63,061 | $ | 111.01 | 67,207 | $ | 109.80 | 72,214 | $ | 109.20 | |||||||||
| Exercisable, end of year |
62,781 | $ | 110.80 | 66,787 | $ | 109.40 | 71,534 | $ | 108.70 | |||||||||
The aggregate intrinsic value of options outstanding and options exercisable as of December 31, 2009 was zero. The total intrinsic value of options exercised was $15,000, $13,000 and $727,000 in the years ended December 31, 2009, 2008 and 2007, respectively. During the years ended December 31, 2009, 2008 and 2007, the amount of cash received from the exercise of stock options was $57,000, $14,000 and $1,543,000, respectively.
84
Table of Contents
At December 31, 2009, exercise prices for outstanding options ranged from $44.40 to $168.10. As of December 31, 2009, outstanding stock options consisted of the following:
| Exercise Price Range |
Options Outstanding |
Weighted- Average Exercise Price |
Weighted- Average Remaining Life (years) |
Options Exercisable |
Weighted- Average Exercise Price | |||||||
| $40.00 – $60.00 |
1,585 | $ | 51.50 | 1.8 | 1,585 | $ | 51.50 | |||||
| $60.10 – $100.00 |
8,600 | 70.74 | 3.2 | 8,600 | 70.74 | |||||||
| $100.10 – $110.00 |
22,120 | 107.83 | 4.3 | 22,120 | 107.83 | |||||||
| $110.10 – $140.00 |
19,906 | 117.88 | 0.5 | 19,906 | 117.88 | |||||||
| $140.10 – $150.00 |
10,150 | 143.95 | 6.0 | 10,150 | 143.95 | |||||||
| $150.10 – $170.00 |
700 | 168.10 | 7.2 | 420 | 168.10 | |||||||
| 63,061 | $ | 111.01 | 3.2 | 62,781 | $ | 110.80 | ||||||
Stock Appreciation Rights
In January 2007, the Company’s Board of Directors approved the 2007 Stock Appreciation Rights Plan (SAR Plan). The SAR Plan provides for the award of SARs to directors and officers of the Company. Each stock appreciation right represents the right to receive an amount in cash equal to the excess of the fair market value of a share of the Company’s common stock on the award date. The amount of the cash liability under the SAR Plan is estimated quarterly using the Black-Scholes option pricing model with updated assumptions. SARs vest 20 percent on the date of grant and 20 percent on each anniversary of the grant with accelerated vesting upon death, disability, a change in control and upon retirement after reaching age 62 while employed with at least five years of service. Unvested SARs are forfeited upon termination. SARs automatically convert into a deemed investment account at 10 years from the date of grant and can be converted into the deemed investment account at any time upon election of the recipient. SARs do not have dividend or voting rights or any other rights of the owner of an actual share of common stock. Recipient accounts are distributed in cash upon termination or, if elected by the recipient in advance, a specific distribution date not later than the later of termination or the January following the date the recipient reaches age 65.
Employee Stock Purchase Plan
The Company maintains an employee stock purchase plan (ESPP). The ESPP allows eligible employees to defer a whole percentage of their salary, from 1 percent to 10 percent, over a period of six months in order to purchase Company shares of common stock. The price is determined at 85 percent of the lowest market price on either the first or last day of the six-month deferral period. Under the terms of the ESPP, the Company issued: 2,495 shares with purchase prices of $19.10 and $6.00 in 2009; 1,715 shares with purchase prices of $49.80 and $64.20 in 2008; 976 shares with purchase prices of $139.00 and $99.50 in 2007. The Company is authorized to issue up to 17,500 shares of common stock under the ESPP. As of December 31, 2009, there were 5,262 shares remaining under the ESPP.
85
Table of Contents
NOTE 17—COMMITMENTS AND CONTINGENCIES
Lease Commitments
The Company is party to several lease commitments for premises and equipment. Future rental payments on these lease commitments are indicated in the table below. This payment schedule reflects actual commitments on non-cancellable lease agreements in which the Company is currently involved, and does not include potential additional payments related to possible lease extensions.
| (dollars in thousands) | |||
| Years ending December 31, 2010 |
$ | 812 | |
| 2011 |
559 | ||
| 2012 |
459 | ||
| 2013 |
440 | ||
| 2014 |
250 | ||
| Thereafter |
591 | ||
| $ | 3,111 | ||
Rent expense under lease agreements was $854,000, $884,000 and $898,000 for the years ended December 31, 2009, 2008 and 2007, respectively.
Financial Instruments with Off-Balance Sheet Risk
In the normal course of business, the Bank enters into agreements with customers that give rise to various commitments and contingent liabilities that involve elements of credit risk, interest rate risk, and liquidity risk. These commitments and contingent liabilities are commitments to extend credit, credit card arrangements, and standby letters of credit.
A summary of the Bank’s undisbursed commitments and contingent liabilities at December 31, 2009, is as follows:
| (dollars in thousands) | Fixed Rate |
Variable Rate |
Total | ||||||
| Commitments to extend credit |
$ | 439 | $ | 23,138 | $ | 23,577 | |||
| Credit card commitments |
3,380 | — | 3,380 | ||||||
| Standby letters of credit |
— | 1,019 | 1,019 | ||||||
| $ | 3,819 | $ | 24,157 | $ | 27,976 | ||||
Commitments to extend credit, credit card arrangements and standby letters of credit all include exposure to some credit loss in the event of non-performance of the customer. The Bank’s credit policies and procedures for credit commitments and financial guarantees are the same as those for extension of credit that are recorded in the consolidated statements of condition. Because most of these instruments have fixed maturity dates and many of them expire without being drawn upon, they do not generally present a significant liquidity risk to the Bank.
The Bank has also committed as a partner in several venture capital and low income housing investment funds. The companies administering the funds seek small business and real estate investments that meet certain criteria under the Community Reinvestment Act. When eligible investments are identified, the partners in the funds are asked to contribute a portion of their commitment. The Bank had committed a total of $2.5 million in such funds at December 31, 2009 and $0.3 million was unfunded as of that date.
86
Table of Contents
NOTE 18—EMPLOYEE BENEFIT PLANS
The Company has a contributory retirement savings plan established under section 401(k) of the Internal Revenue Code covering substantially all full-time and part-time employees who have completed three months of service. The plan allows an employee to contribute a portion of his or her annual wages subject to a maximum dollar limit which is set by law. In addition, at the discretion of the Board of Directors, the Company may contribute funds into the plan on behalf of each employee participant. Currently, the Company matches the contribution of each participant up to 3 percent of their income, with a $3,000 maximum match. In 2008 and 2007, regardless of the employee’s participation in the plan, the Company contributed an additional one percent of the employee’s salary, up to a maximum of $3,000. For these contributions, the recipient was required to be employed by the Company on the last day of the plan year. The plan also requires completion of six months of service to become eligible for Company contributions. Any funds contributed by the Company vest 25 percent per year and are fully vested after four years of service. The Company contributed $205,700, $217,000 and $214,000 to the plan for the years ended December 31, 2009, 2008 and 2007, respectively.
The Company has entered into supplemental retirement plans for two executive officers. These plans provide for retirement benefits that increase annually until the executives reach age 65 and will be paid out annually over the executives’ lives. As of December 31, 2009, the Company’s liability pursuant to these supplemental retirement plans was $501,000. Expense related to the plans of $107,400, $99,100 and $92,300 was recorded during 2009, 2008 and 2007, respectively.
NOTE 19—FAIR VALUE OF FINANCIAL ASSETS AND LIABILITIES
Fair Value Hierarchy
ASC Topic 820 (formerly FSP FAS 157-4, “Fair Value Measurements and Disclosures”), defines fair value as the exchange price that would be received for an asset or paid to transfer a liability (an exit price) in the principal or most advantageous market for the asset or liability in an orderly transaction between market participants on the measurement date. ASC Topic 820 also establishes a fair value hierarchy which requires an entity to maximize the use of observable inputs and minimize the use of unobservable inputs when measuring fair value. The standard describes three levels of inputs that may be used to measure fair value:
Level 1. Quoted prices (unadjusted) for identical assets or liabilities in active markets that the entity has the ability to access as of the measurement date. An active market is a market in which transactions for the asset or liability occur with significant frequency and volume to provide pricing information on an ongoing basis.
Level 2. Significant other observable inputs other than Level 1 prices, such as quoted prices for similar assets or liabilities, quoted prices in markets that are not active, and other inputs that are observable or can be corroborated by observable market data by correlation or other means.
Level 3. Significant unobservable inputs that reflect a company’s own assumptions about the assumptions that market participants would use in pricing an asset or liability developed based on the best information available in the circumstances.
Assets and Liabilities Measured at Fair Value
The Company used the following methods and significant assumptions to estimate fair value.
Securities: The fair values of securities available for sale are determined by obtaining quoted prices on nationally recognized securities exchanges or matrix pricing, which is a mathematical technique used widely in the industry to value debt securities without relying exclusively on quoted prices for the specific securities but rather by relying on the securities’ relationship to other benchmark quoted securities.
Interest Rate Contracts: The Company has elected to use the income approach to value the interest rate contracts, using observable Level 2 market expectations at measurement date and standard valuation techniques
87
Table of Contents
to convert future amounts to a single present amount assuming that participants are motivated, but not compelled to transact. As such, significant fair value inputs can generally be verified and do not typically involve significant judgments by management.
Impaired Loans: Impaired loans are evaluated and valued at the time the loan is identified as impaired, at the lower of cost or fair value. As a practical expedient, fair value may be measured based on a loan’s observable market price or the underlying collateral securing the loan. Collateral may be real estate or business assets including equipment. The value of collateral is determined based on independent appraisals.
Other Real Estate Owned and Other Repossessed Assets: OREO is real property that the Bank has taken ownership of in partial or full satisfaction of a loan or loans. Other repossessed assets are personal property that the bank has taken ownership of in partial or full satisfaction of a loan or loans. These assets are recorded at the lower of the carrying amount of the loan or fair value less estimated costs to sell. This amount becomes the property’s new basis. Any write-downs based on the property fair value less estimated cost to sell at the date of acquisition are charged to the allowance for loan and lease losses. Management periodically reviews OREO and other repossessed assets in an effort to ensure the property is carried at the lower of its new basis or fair value, net of estimated costs to sell. Any write-downs subsequent to acquisition are charged to earnings.
Goodwill: Refer to Note 1 for discussion of method used to estimate the fair value of goodwill.
Financial instruments are broken down in the table that follows by recurring or nonrecurring measurement status. Recurring assets are initially measured at fair value and are required to be remeasured at fair value in the financial statements at each reporting date. Assets measured on a nonrecurring basis are assets that due to an event or circumstance were required to be remeasured at fair value after initial recognition in the financial statements at some time during the reporting period.
| Balance | Quoted Prices in Active Markets for Identical Assets (Level 1) |
Significant Other Observable Inputs (Level 2) |
Significant Unobservable Inputs (Level 3) |
Losses Included in Earnings |
||||||||||||
| December 31, 2009 |
||||||||||||||||
| Recurring basis: |
||||||||||||||||
| Available for sale securities |
||||||||||||||||
| U.S. Agency mortgage-backed securities |
$ | 22,736 | $ | — | $ | 22,736 | $ | — | $ | — | ||||||
| Non-agency mortgage-backed securities |
3,385 | — | 3,385 | — | — | |||||||||||
| Municipal bonds |
21,825 | — | 21,825 | — | — | |||||||||||
| Other securities |
545 | 510 | 35 | — | — | |||||||||||
| Total recurring basis |
$ | 48,491 | $ | 510 | $ | 47,981 | $ | — | $ | — | ||||||
| Nonrecurring basis: |
||||||||||||||||
| Impaired loans (1) |
$ | 19,480 | $ | — | $ | — | $ | 19,480 | $ | (14,869 | ) | |||||
| Other real estate owned (2) (3) |
4,348 | — | — | 4,348 | (1,139 | ) | ||||||||||
| Goodwill (4) |
— | — | — | — | (1,798 | ) | ||||||||||
| Total nonrecurring basis |
$ | 23,828 | $ | — | $ | — | $ | 23,828 | $ | (17,806 | ) | |||||
| December 31, 2008 |
||||||||||||||||
| Recurring basis: |
||||||||||||||||
| Available for sale securities |
||||||||||||||||
| U.S. Agency mortgage-backed securities |
$ | 39,818 | $ | — | $ | 39,818 | $ | — | $ | — | ||||||
| Non-agency mortgage-backed securities |
2,414 | — | 2,414 | — | — | |||||||||||
| Municipal bonds |
21,281 | — | 21,281 | — | — | |||||||||||
| Other securities |
551 | 505 | 46 | — | — | |||||||||||
| Total available for sale securities |
64,064 | 505 | 63,559 | — | — | |||||||||||
| Interest rate contracts |
8,110 | — | 8,110 | — | — | |||||||||||
| Total recurring basis |
$ | 72,174 | $ | 505 | $ | 71,669 | $ | — | $ | — | ||||||
| Nonrecurring basis: |
||||||||||||||||
| Impaired loans (1) |
$ | 4,321 | $ | — | $ | — | $ | 4,321 | $ | (901 | ) | |||||
| Other real estate owned (2) (3) |
4,838 | — | — | 4,838 | (2,137 | ) | ||||||||||
| Total nonrecurring basis |
$ | 9,159 | $ | — | $ | — | $ | 9,159 | $ | (3,038 | ) | |||||
88
Table of Contents
| (1) | Impaired loans included in the table above are collateral dependent and have been adjusted to fair value based on the estimated fair value of the underlying collateral, less estimated selling costs. If the Bank determines that the value of an impaired loan is less than the recorded investment in the loan, the carrying value is adjusted through a charge-off recorded through the allowance for loan losses. The Losses Included in Earnings column shown above represents charge-offs related to impaired loans recognized during the years ended December 31, 2009 and 2008. |
| (2) | Loans receivable transferred to foreclosed assets during the year ended December 31, 2009 with a carrying value totaling $8.8 million were written down to their fair value less cost to sell totaling $6.2 million, resulting in a loss of $2.6 million, which was charged to the allowance for loan losses. Loans receivable transferred to foreclosed assets during the year ended December 31, 2008 with a carrying value totaling $8.2 million were written down to their fair value less cost to sell totaling $6.9 million, resulting in a loss of $1.3 million, which was charged to the allowance for loan losses. |
| (3) | During the year ended December 31, 2009, a valuation allowance totaling $1.1 million was recorded on certain OREO properties with a carrying value of $3.7 million before the valuation allowance and was charged to earnings during the year. A valuation allowance totaling $2.1 million was recorded on certain OREO properties with a carrying value of $3.4 million before the valuation allowance and was charged to earnings during year ended December 31, 2008. |
| (4) | A 100 percent goodwill impairment charge of $1.8 million was charged to earnings during the year ended December 31, 2009. |
The loans in the table above represent impaired, collateral dependent loans that have been adjusted to fair value. When management determines that the value of the underlying collateral is less than the recorded investment in the loan, the Company recognizes this impairment and adjusts the carrying value of the loan to fair value by charging off the amount of the impairment to the allowance for loan losses.
Financial Disclosures about Fair Value of Financial Instruments
ASC Topic 825-10 requires disclosure of the estimated fair value of certain financial instruments and the methods and significant assumptions used to estimate their fair values. Certain financial instruments and all nonfinancial instruments are excluded from the scope of Subtopic. Accordingly, the fair value disclosures required by the Subtopic are only indicative of the value of individual financial instruments and should not be considered an indication of the fair value of the Company.
The estimated fair values of all of the Company’s financial instruments at December 31 were as follows:
| 2009 | 2008 | |||||||||||
| (dollars in thousands) | Carrying Amount |
Fair Value |
Carrying Amount |
Fair Value | ||||||||
| Financial assets: |
||||||||||||
| Cash and cash equivalents |
$ | 139,705 | $ | 139,705 | $ | 55,106 | $ | 55,106 | ||||
| Investment securities |
48,491 | 48,491 | 64,064 | 64,064 | ||||||||
| Federal Home Loan Bank stock |
1,247 | 1,247 | 1,247 | 1,247 | ||||||||
| Loans |
333,163 | 311,264 | 419,503 | 388,387 | ||||||||
| Interest rate contracts |
— | — | 8,110 | 8,110 | ||||||||
| Financial liabilities: |
||||||||||||
| Non-interest-bearing demand deposits |
$ | 46,510 | $ | 46,510 | $ | 70,329 | $ | 70,329 | ||||
| Savings and interest-bearing demand deposits |
59,615 | 59,615 | 29,674 | 29,674 | ||||||||
| Money market deposits |
34,452 | 34,452 | 72,465 | 72,465 | ||||||||
| Certificates of deposit |
383,194 | 385,465 | 349,102 | 356,409 | ||||||||
| Junior subordinated debentures |
12,372 | 2,944 | 12,372 | 6,424 | ||||||||
The following methods and assumptions were used to estimate the fair value of each class of financial instrument not stated above, for which it is practicable to estimate that value:
Cash and cash equivalents—For these short-term instruments, the carrying amount is a reasonable estimate of fair value.
Federal Home Loan Bank stock—The carrying amount approximates fair value.
Loan receivables—Fair values are estimated for portfolios of loans with similar financial characteristics. Loans are segregated by type, including commercial, real estate and consumer loans. Each loan category is
89
Table of Contents
further segregated by fixed and variable rate, performing and nonperforming categories. The carrying values of variable rate loans approximate fair value. The fair values of fixed rate loans are calculated by discounting contractual cash flows at rates which similar loans are currently being made. The 2009 fair value calculations of real estate construction and development loans and nonperforming loans have been further discounted by a liquidity factor related to the current market environment.
Deposit liabilities—The fair values disclosed for demand deposits are, by definition, equal to the amount payable on demand at the reporting date (that is, their carrying amounts). The carrying amounts of variable rate money market accounts and savings accounts approximate their fair values at the reporting date. Fair values for fixed rate CDs are estimated using a discounted cash flow calculation that applies interest rates currently being offered on certificates to a schedule of aggregated expected monthly maturities on time deposits.
Junior subordinated debentures—The fair value is estimated using discounted cash flow analysis, based on the current rate for similar debentures.
Commitments to extend credit, credit card commitments and standby letters of credit—The fair values of off-balance sheet commitments to extend credit, credit card commitments and standby letters of credit are not considered practicable to estimate because of the lack of quoted market prices and the inability to estimate fair value without incurring excessive costs.
NOTE 20—CONCENTRATIONS OF CREDIT RISK
Most of the Bank’s loans, lending commitments, and commercial and standby letters of credit have been granted to customers in the Bank’s market areas. The majority of such customers are also depositors of the Bank. The concentrations of credit by type of loan are set forth in Note 7. The distribution of commitments to extend credit approximates the distribution of loans outstanding. Commercial and standby letters of credit were granted primarily to commercial borrowers as of December 31, 2009. The Bank’s loan policies provide for a “house lending limit” periodically established by management with approval from the Board of Directors. An application for credit that exceeds the house lending limit must obtain approval for exception to the policy by the Board of Director’s loan committee. In addition, the Bank is limited by law as to the amount of credit it may extend to any single borrower or group of related borrowers.
90
Table of Contents
NOTE 21—PARENT COMPANY ONLY FINANCIAL STATEMENTS
Condensed Balance Sheets
| December 31, | ||||||
| (dollars in thousands) | 2009 | 2008 | ||||
| Assets |
||||||
| Cash and cash equivalents |
$ | 367 | $ | 1,654 | ||
| Investment in bank subsidiary |
23,809 | 58,518 | ||||
| Other assets |
402 | 1,112 | ||||
| Total assets |
$ | 24,578 | $ | 61,284 | ||
| Liabilities and Shareholders’ Equity |
||||||
| Junior subordinated debentures |
$ | 12,372 | $ | 12,372 | ||
| Other liabilities |
151 | 131 | ||||
| Total liabilities |
12,523 | 12,503 | ||||
| Shareholders’ Equity |
12,055 | 48,781 | ||||
| Total liabilities and shareholders’ equity |
$ | 24,578 | $ | 61,284 | ||
Condensed Statements of Operations
| Years ended December 31, | ||||||||||||
| (dollars in thousands) | 2009 | 2008 | 2007 | |||||||||
| Income |
||||||||||||
| Intercompany interest income |
$ | 11 | $ | 29 | $ | 30 | ||||||
| Expense |
||||||||||||
| Interest expense |
336 | 604 | 875 | |||||||||
| Other expenses |
779 | 603 | 495 | |||||||||
| 1,115 | 1,207 | 1,370 | ||||||||||
| Loss before income tax benefit and equity in undistributed earnings of subsidiary |
(1,104 | ) | (1,178 | ) | (1,340 | ) | ||||||
| Income tax expense (benefit) |
42 | (395 | ) | (460 | ) | |||||||
| Net loss before equity in undistributed earnings of subsidiary |
(1,146 | ) | (783 | ) | (880 | ) | ||||||
| Equity in undistributed earnings (loss) of subsidiary |
(33,629 | ) | (7,315 | ) | 966 | |||||||
| Net income (loss) |
$ | (34,775 | ) | $ | (8,098 | ) | $ | 86 | ||||
91
Table of Contents
NOTE 21—PARENT COMPANY ONLY FINANCIAL DATA—(continued)
Condensed Statements of Cash Flows
| Years Ended December 31, | ||||||||||||
| (dollars in thousands) | 2009 | 2008 | 2007 | |||||||||
| Cash flows from operating activities |
||||||||||||
| Net income (loss) |
$ | (34,775 | ) | $ | (8,098 | ) | $ | 86 | ||||
| Adjustments to reconcile net income (loss) to net cash from operating activities: |
||||||||||||
| Undistributed loss (earnings) of subsidiary |
33,629 | 7,315 | (966 | ) | ||||||||
| Deferred tax provision (benefit) |
42 | (395 | ) | (460 | ) | |||||||
| Share-based compensation |
42 | 55 | 118 | |||||||||
| Decrease in other assets |
708 | 613 | 419 | |||||||||
| Decrease in other liabilities |
(20 | ) | (9 | ) | (43 | ) | ||||||
| Net cash used by operations |
(374 | ) | (519 | ) | (846 | ) | ||||||
| Cash flows from investing activities |
||||||||||||
| Investment in bank subsidiary |
(1,000 | ) | (1,000 | ) | — | |||||||
| Net cash used by investment activities |
(1,000 | ) | (1,000 | ) | — | |||||||
| Cash flows from financing activities |
||||||||||||
| Proceeds from exercise of stock options and stock purchase plan |
87 | 114 | 1,657 | |||||||||
| Net cash from financing activities |
87 | 114 | 1,657 | |||||||||
| Net increase (decrease) in cash and cash equivalents |
(1,287 | ) | (1,405 | ) | 811 | |||||||
| Cash and cash equivalents, beginning of year |
1,654 | 3,059 | 2,248 | |||||||||
| Cash and cash equivalents, end of year |
$ | 367 | $ | 1,654 | $ | 3,059 | ||||||
92
Table of Contents
NOTE 22—QUARTERLY FINANCIAL INFORMATION (UNAUDITED)
The following sets forth unaudited quarterly financial data for the years 2009 and 2008:
| (dollars in thousands, except per share) | March 31 | June 30 | September 30 | December 31 | ||||||||||||
| 2009 |
||||||||||||||||
| Interest income |
$ | 7,765 | $ | 7,510 | $ | 7,243 | $ | 6,077 | ||||||||
| Interest expense |
3,576 | 3,674 | 3,574 | 3,386 | ||||||||||||
| Net interest income |
4,189 | 3,836 | 3,669 | 2,691 | ||||||||||||
| Provision for credit losses |
3,505 | 3,695 | 6,368 | 8,693 | ||||||||||||
| Noninterest income |
863 | 758 | 3,907 | 718 | ||||||||||||
| Noninterest expense |
5,136 | 5,726 | 5,270 | 8,092 | ||||||||||||
| Income before income taxes |
(3,589 | ) | (4,827 | ) | (4,062 | ) | (13,376 | ) | ||||||||
| Income tax provision (benefit) |
(1,687 | ) | 10,608 | — | — | |||||||||||
| Net income (loss) |
$ | (1,902 | ) | $ | (15,435 | ) | $ | (4,062 | ) | $ | (13,376 | ) | ||||
| Earnings (loss) per common share—basic and diluted |
$ | (3.72 | ) | $ | (30.13 | ) | $ | (7.91 | ) | $ | (22.64 | ) | ||||
| 2008 |
||||||||||||||||
| Interest income |
$ | 9,147 | $ | 8,932 | $ | 8,892 | $ | 8,692 | ||||||||
| Interest expense |
3,745 | 3,197 | 3,308 | 3,518 | ||||||||||||
| Net interest income |
5,402 | 5,735 | 5,584 | 5,174 | ||||||||||||
| Provision for credit losses |
593 | 13,002 | 2,300 | 1,700 | ||||||||||||
| Noninterest income |
962 | 447 | (520 | ) | 794 | |||||||||||
| Noninterest expense |
4,610 | 6,924 | 4,727 | 3,152 | ||||||||||||
| Income before income taxes |
1,161 | (13,744 | ) | (1,963 | ) | 1,116 | ||||||||||
| Income tax provision (benefit) |
259 | (5,653 | ) | (367 | ) | 429 | ||||||||||
| Net income (loss) |
$ | 902 | $ | (8,091 | ) | $ | (1,596 | ) | $ | 687 | ||||||
| Earnings (loss) per common share—basic and diluted |
$ | 1.78 | $ | (16.00 | ) | $ | 3.15 | $ | 1.34 | |||||||
93
Table of Contents
| Item 9. | Changes in and Disagreements with Accountants on Accounting and Financial Disclosure |
None.
Item 9A(T). Controls and Procedures
Evaluation of Disclosure Controls and Procedures
In connection with the preparation of this Annual Report on Form 10-K, an evaluation was carried out by management of the Company, with the participation of the President and Chief Executive Officer (“CEO”) and Chief Financial Officer (“CFO”), of the effectiveness of the Company’s disclosure controls and procedures (as defined in Rules 13a-15(e) and 15d-15(e) under the Securities Exchange Act of 1934 (Exchange Act)) as of December 31, 2009. Disclosure controls and procedures are designed to ensure that information required to be disclosed in reports filed or submitted under the Exchange Act is recorded, processed, summarized and reported within the time periods specified in SEC rules and forms and that such information is accumulated and communicated to management, including the CEO and CFO, to allow timely decisions regarding required disclosures.
During the evaluation of disclosure controls and procedures as of December 31, 2009 conducted during the preparation of the Company’s financial statements to be included in this Annual Report on Form 10-K , a material weakness in internal control over financial reporting was identified relating to the valuation of impaired assets, including the timely charge-off of collateral dependent loans and write-downs of other real estate owned. As a result of this material weakness, described more fully below, the Company’s CEO and CFO concluded that, as of December 31, 2009, the Company’s disclosure controls and procedures were ineffective.
Notwithstanding the existence of this material weakness in internal control over financial reporting relating to the timely identification and valuation of impaired assets, the Company believes that the consolidated financial statements in this Annual Report on Form 10-K fairly present, in all material respects, the Company’s consolidated financial condition as of December 31, 2009 and 2008, and consolidated results of its operations and cash flows for the years ended December 31, 2009, 2008 and 2007, in conformity with U.S. generally accepted accounting principles (GAAP).
Changes in Internal Control over Financial Reporting
Changes in the Company’s internal control over financial reporting that have materially affected, or are reasonably likely to materially affect, the Company’s internal control over financial reporting, were made subsequent to the quarter ended December 31, 2009, and have been described below. There were no material changes to internal control during the quarter ending December 31, 2009.
Management’s Report on Internal Control over Financial Reporting
The Company’s management is responsible for establishing and maintaining adequate internal control over financial reporting as defined in Rules 13a-15(f) and 15d-15(f) under the Exchange Act. The Company’s internal control over financial reporting is designed to provide reasonable assurance regarding the reliability of financial reporting and the preparation of financial statements for external purposes in accordance with U.S. GAAP. The Company’s internal control over financial reporting includes those policies and procedures that:
(i) pertain to the maintenance of records that, in reasonable detail, accurately and fairly reflect the transactions and dispositions of the assets of the Company;
(ii) provide reasonable assurance that transactions are recorded as necessary to permit preparation of financial statements in accordance with U.S. GAAP, and that receipts and expenditures of the Company are being made only in accordance with authorizations of management and directors of the Company; and
(iii) provide reasonable assurance regarding prevention or timely detection of unauthorized acquisition, use or disposition of the Company’s assets that could have a material effect on the financial statements.
94
Table of Contents
Because of its inherent limitations, internal control over financial reporting may not prevent or detect misstatements. Also, projections of any evaluation of effectiveness to future periods are subject to the risk that controls may become inadequate because of changes in conditions, or that the degree of compliance with the policies or procedures may deteriorate.
Management assessed the effectiveness of the Company’s internal control over financial reporting as of December 31, 2009. In making this assessment, management used the criteria set forth by the Committee of Sponsoring Organizations of the Treadway Commission (COSO) in Internal Control-Integrated Framework. As a result of management’s evaluation of the Company’s internal control over financial reporting, management identified a material weakness in the Company’s internal control over financial reporting related to the valuation of assets for impairment. The material weakness resulted from the aggregation of the following deficiencies:
| • | Ineffective controls related to valuation of impaired loans, including timely charge-off of collateral dependent loans; and |
| • | Personnel involved in other real estate owned valuation did not communicate updated appraisal results in a timely fashion to accounting personnel for accounting and disclosure consideration. |
This material weakness resulted in a material amount of adjustments to the provision for credit losses and other real estate owned expenses that were corrected prior to the issuance of the Company’s financial statements. Additionally, solely as a result of the material weakness, management has concluded that the Company’s internal control over financial reporting was not effective as of December 31, 2009.
Remediation Plan for Material weakness in Internal Control over Financial Reporting
Subsequent to December 31, 2009, and immediately following management’s identification of the above-referenced material weakness, management began taking steps to remediate the material weakness. These ongoing efforts include strengthening corporate oversight of impaired asset valuation methodologies and processes, and improving the timeliness of communications between the Special Assets Group and accounting personnel for accounting and disclosure consideration. Management believes that these changes will contribute significantly to the remediation of the material weakness in internal control over financial reporting that was in existence as of December 31, 2009. Additional changes will be implemented as determined necessary.
This annual report does not include an attestation report of the Company’s registered public accounting firm regarding internal control over financial reporting. Management’s report was not subject to attestation by the Company’s registered public accounting firm pursuant to temporary rules of the Securities and Exchange Commission that permit the Company to provide only management’s report in this annual report.
| Item 9B. | Other Information |
Submission of Matters to a Vote of Securities Holders
| (a) | Cowlitz Bancorporation Annual Shareholder’s Meeting was held on December 31, 2009 |
| (b) | All six directors stood for election at the Annual Shareholders’ Meeting and the six individuals listed in Item 9B(c) below were elected. |
| (c) | The number of votes cast for, against, or withheld, including separate tabulations with respect to each nominee is presented below and has not been restated for the reverse stock split on March 1, 2010: |
| Nominee |
For | Percentage of Voted |
Withheld | Percentage of Voted | ||||
| Ernie D. Ballou |
1,919,521 | 46.76 | 2,185,374 | 53.24 | ||||
| Richard J. Fitzpatrick |
1,917,408 | 46.71 | 2,187,487 | 53.29 | ||||
| Brian E. Magnuson |
1,918,024 | 46.73 | 2,186,871 | 53.27 | ||||
| John M. Petersen |
1,919,521 | 46.76 | 2,185,374 | 53.24 | ||||
| Phill S. Rowley |
1,918,024 | 46.73 | 2,186,871 | 53.27 | ||||
| Linda M. Tubbs |
1,919,721 | 46.77 | 2,185,174 | 53.23 |
95
Table of Contents
The proposal to approve an amendment to affect a one-for-ten reverse stock split of the Company’s common stock and payment of cash for transactional shares, and maintaining the current authorized common share level at 25,000,000 was approved at the Annual Shareholders’ Meeting.
The number of votes cast for, against, or withheld, including percentage voted is presented below:
| Votes | Percentage of Voted | |||
| For |
3,258,269 | 63.47 | ||
| Against |
843,719 | 16.43 | ||
| Abstain |
2,907 | 0.06 | ||
| Broker non-votes: |
— | — |
96
Table of Contents
| Item 10. | Directors, Executive Officers, and Corporate Governance |
Section 16(a) Beneficial Ownership Reporting Compliance
Section 16(a) of the Securities Exchange Act of 1934 requires our executive officers and directors and all persons who own more than ten percent of the outstanding shares of the Common Stock of the Company to file initial reports of beneficial ownership and all subsequent changes in beneficial ownership of the Common Stock and other equity securities of the Company with the SEC.
Based solely on review of copies of the forms provided to the Company and the representations by the executive officers and directors, the Company believes, to the best of its knowledge, that all Section 16(a) filing requirements were satisfied for the fiscal year ending December 31, 2009.
Board of Directors
The Company’s Bylaws provide that directors are elected to serve approximately one-year terms of office. The Bylaws establish the number of directors between five and ten, with the exact number to be fixed from time to time by resolution of the Board of Directors. The number of directors is currently set at six.
Ernie D. Ballou, age 61, has served on the Board of Directors since May 2003. He has served as EVP & Chief Credit Administrator of Cowlitz Bank since January 2003 and has served on the Cowlitz Bank Board of Directors since February 2003. He also serves as VP/Credit Administrator for the Company. Mr. Ballou has over thirty years of lending experience, including twenty-five years with First Interstate Bank (now Wells Fargo Bank), most recently serving as Senior Vice President and Senior Credit Administrator for the Northwest Region. Prior to joining Cowlitz, Mr. Ballou was self-employed, initiating credit training seminars and conducting independent credit reviews for banking institutions. The board of directors believes that Mr. Ballou’s lending experience at larger and more complex banks provides him with the banking experience and expertise that is valuable for the board. In addition, they note that the FDIC formally approved Mr. Ballou for this position in May 2003.
Richard J. Fitzpatrick, age 60, has served as President/CEO of Cowlitz Bancorporation and Cowlitz Bank since March 2003. He has served on the Boards of Directors of Cowlitz Bancorporation and Cowlitz Bank since March 2003, as well. Prior to joining Cowlitz, Mr. Fitzpatrick spent nine years with Banknorth Group Inc., most recently as Regional President, responsible for operations in Vermont and New York. Other positions he held include Chief Banking Officer responsible for Banknorth Group Inc.’s seven banks, and President and Chief Executive Officer of Howard Bank, a subsidiary of Banknorth Group, Inc. The board of director’s recognizes Mr. Fitzpatrick’s past experience as a leader at larger institutions provides the board with a member who has operated an organization, and Mr. Fitzpatrick’s extensive experience with issues specific to the banking industry are essential to the board. In addition, Mr. Fitzpatrick had to be formally approved by the FDIC.
Brian E. Magnuson, age 53, joined the Board of Directors in December 2005. Mr. Magnuson currently serves on the Audit, Compensation and Corporate Governance Committees. He is President of Cascade Networks, specializing in high-speed wireless and fiber optic Internet, a position he has held since 2003. Mr. Magnuson co-founded Cascade Networks in 2001. Mr. Magnuson is an active member and resident of the Longview, Washington community, which was one reason that the board of directors was prompted to invite Mr. Magnuson to join the board in 2005. In addition, his experience and success as a business owner was attractive to our board of directors.
John M. Petersen, age 59, was appointed to the Board of Directors of Cowlitz Bancorporation and Cowlitz Bank in September 2004. Mr. Petersen serves on the Audit and Compensation Committees and chairs the Corporate Governance Committee. He also serves as Chairman of the Cowlitz Bank Trust Committee and serves
97
Table of Contents
on the Cowlitz Bank Asset/Liability Committee. Mr. Petersen currently holds the position of Senior Director of CBRE/Melody and Company Capital Markets, a commercial real estate investment-banking firm, where he has worked since 2001. He has also held several senior positions at Bank of America and Security Pacific Bank. Mr. Petersen is an active community leader in the Portland area, currently serving as the First Vice President of the Portland State University Foundation Board, serving on their executive committee and the real estate committee, as well as other board committees. Mr. Peterson was selected to serve on the board due to his broad knowledge of commercial real estate. In addition, Mr. Petersen’s legal and banking background were key to his selection and have proven to be an asset.
Phill S. Rowley, age 63, was appointed to the Cowlitz Bancorporation and Cowlitz Bank Board of Directors in August 2003. Mr. Rowley has served as Chairman of the Cowlitz Bancorporation Board since March 2004. He serves as Chairman of the Audit Committee. Mr. Rowley also serves on the Compensation Committee and on the Cowlitz Bank Trust and Asset/Liability Committees. Mr. Rowley is currently the President and CEO of Treasury Management Services, Inc., providing consulting in asset/liability management, investment portfolio management and corporate funding strategies, as well as board and executive management training in these associated areas of banking. He founded Treasury Management Services in 1998. He also serves on the faculties of several premier banking schools. Mr. Rowley has held several positions for various banks during his 39-year banking career. Mr. Rowley was selected to serve on the board of directors due to his expansive experience in asset/liability management. His credentials have allowed him to serve as our financial expert, which adds to his importance to this board.
Linda M. Tubbs, age 62, was appointed to the Cowlitz Bancorporation and Cowlitz Bank Board of Directors in September 2004. Ms. Tubbs serves as Chairwoman of the Compensation Committee and of the Cowlitz Bank Board of Directors. She also serves on the Audit and Corporate Governance Committees and the Cowlitz Bank Asset/Liability Committee. Ms. Tubbs is active in the Vancouver, Washington community. She retired from Wells Fargo in 1998, where she was an Executive Vice President, managing commercial banking in Oregon, Washington, Idaho, and Utah. Ms. Tubbs has served on various local boards and is a former chairwoman of Oregon Public Broadcasting. Ms. Tubbs banking experience, specifically in commercial lending, as well as her commitment to being an active member of the Vancouver, Washington market area, were key factors in her selection to serve on the board of directors.
Executive Officers
The age, position, and experience of the Company’s executive officers, other than Richard J. Fitzpatrick and Ernie D. Ballou, about whom information is provided above, are as follows:
Gerald L. Brickey, 57, joined the Company in December 2005. Prior to joining the company he held the position of Controller from 1998 to 2005 for Pope & Talbot, Inc., a New York Stock Exchange listed forest products company headquartered in Portland, Oregon. Mr. Brickey has over twenty years of financial services industry experience. He currently holds the positions of Vice President/Chief Financial Officer of the Company and Executive Vice President/Chief Financial Officer of Cowlitz Bank.
Lynda Larrabee, 47, joined the Company in November 1997. Ms. Larrabee has over twenty years of banking experience. She currently holds the positions of Vice President of Administration and Corporate Secretary of the Company and Senior Vice President/Chief Administrative Officer of Cowlitz Bank.
Corporate Governance
The Board of Directors conducts its business through regular meetings and through its Audit Committee, Compensation Committee and Corporate Governance Committee. During 2009, the Board held eleven regular meetings and eighteen special meetings. Each director serving in 2009 attended at least 75 percent of the regular and special meetings, and of the meetings of committees on which he or she served.
98
Table of Contents
The Audit Committee operates pursuant to a written charter, which is available on our website, www.cowlitzbancorporation.com. The primary responsibilities of the Audit Committee are to recommend the selection of the Company’s independent auditors, review with the independent auditors the Company’s financial statements to determine if the Company is applying the appropriate accounting policies, and consult with the independent auditors on the Company’s internal accounting controls. Each member of the Audit Committee is an independent director as defined under Rule 4200(a)(15) of the NASDAQ listing standards. The Board believes that each of the current members of the committee has employment experience that provides them with appropriate financial sophistication to serve on the committee. In addition, the Board has reviewed the qualifications of the members of the committee and has determined that Phill Rowley possesses the requisite financial knowledge and experience to qualify as an “audit committee financial expert.” The Audit Committee met four times in 2009. The Audit Committee members include: Phill Rowley, Chairman; Brian Magnuson; John Petersen; and Linda Tubbs.
The Compensation Committee operates pursuant to a written charter, which is available on our website. The Compensation Committee reviews and approves compensation for Company executives, including salaries and bonus plans, equity incentive grants and other benefits. The Compensation Committee also oversees the Company’s Stock Incentive Plan, Employee Stock Purchase Plan and Stock Appreciation Plan. The Compensation Committee met seven times in 2009. The Compensation Committee members include: Linda Tubbs, Chairwoman; Brian Magnuson; John Petersen; and Phill Rowley.
The Corporate Governance Committee operates pursuant to a written charter, which is available on our website. The Corporate Governance Committee assists the Board of Directors in identifying qualified individuals to become board members, determining the composition of the Board and its committees, developing and implementing effective corporate governance policies and procedures, developing and enforcing the Code of Conduct and Ethics Policy, monitoring a process to assess the effectiveness of the Board, its members, and its committees, and ensuring the Company is in compliance with NASDAQ listing standards. The Corporate Governance Committee met twice in 2009. The Corporate Governance Committee members include: John Petersen, Chairman; Brian Magnuson; Phill Rowley; and Linda Tubbs.
Nomination Procedures
There have been no changes to the nomination procedures since the date of the proxy statement for the 2009 annual meeting of shareholders. The Corporate Governance Committee, which has a charter and consists entirely of independent directors, performs the functions of a nominating committee. The Corporate Governance Committee Charter includes the following factors that the committee will consider in potential board candidates: professional experience, other directorships, personal skills and expertise in technology, finance, marketing, financial reporting and areas unique to the Company. The committee also gives consideration to geographic location, time and educational commitment, integrity, and reputation of director candidates.
A shareholder may recommend a candidate for consideration. Such recommendation will be reviewed and evaluated by the Corporate Governance Committee. The committee will use the same procedures and criteria for evaluating potential nominees recommended by shareholders as it does for potential nominees selected by the Company. Shareholder recommendations for Board candidates should be submitted to the Company’s Corporate Secretary, Lynda Larrabee, at Cowlitz Bancorporation, PO Box 1518 / 927 Commerce Avenue, Longview, Washington 98632. In 2009, the Company did not hire any third party to recommend potential Board candidates. When there is a vacancy on the Board, or when the Corporate Governance Committee recommends expanding the Board, the committee generally consults with business associates, community leaders, legal counsel and other professionals to identify potential candidates.
In addition, the Company’s Bylaws permit shareholders who are entitled to vote at the annual meeting to nominate individuals to stand for election provided notice of such nomination is received by the Company’s Secretary at our principal executive offices in Longview, Washington at least 90 days before the first anniversary
99
Table of Contents
of the date on which the Company first mailed proxy materials for the prior year’s annual meeting of shareholders. The nomination notice must state the name, age and business and residence addresses of the nominee and the nominating shareholder; the number of shares held of record by the nominee and the nominating shareholder and any other shares that are directly or indirectly beneficially owned; principal occupation of the nominee; and all other information regarding the nominee that would be required to be disclosed in solicitations of proxies for the election of directors or is otherwise required in each case pursuant to Schedule 14A under the Securities Exchange Act of 1934. The notice must also be accompanied by a signed consent from each proposed nominee that such nominee consents to being named in and having information regarding such nominee included in any proxy materials or other communications to shareholders if the Company chooses to do so and agrees to serve as a director if elected.
Code of Ethics and Business Conduct Policy
The Company has adopted a Code of Ethics and Business Conduct Policy. The Policy requires all employees and directors to avoid conflicts of interest, comply with all laws and regulations, conduct business in an ethical manner, adhere to appropriate confidentiality standards, and act in the Company’s best interest. A copy of the Policy is available on our website, www.cowlitzbancorporation.com.
| Item 11. | Executive Compensation |
Executive Compensation Tables
The following table sets forth the annual compensation earned during 2009 and 2008 by the Company’s “Named Executive Officers”.
| Name and Principal Position |
Year | Salary | Stock Awards | SAR Awards (1) |
Nonequity Incentive Plan Compensation |
All Other Compensation (2) |
Total Compensation | |||||||||||||
| Richard J. Fitzpatrick |
2009 | $ | 294,514 | $ | — | $ | — | $ | — | $ | 14,442 | $ | 308,956 | |||||||
| President & CEO | 2008 | $ | 285,934 | $ | 113,467 | $ | 140,000 | $ | — | $ | 16,291 | $ | 555,692 | |||||||
| Ernie Ballou |
2009 | $ | 207,339 | $ | — | $ | — | $ | — | $ | 16,911 | $ | 224,250 | |||||||
| Vice President | 2008 | $ | 201,297 | $ | 68,079 | $ | 84,000 | $ | — | $ | 12,169 | $ | 365,545 | |||||||
| Gerald L. Brickey |
2009 | $ | 181,692 | $ | — | $ | — | $ | — | $ | 3,000 | $ | 184,692 | |||||||
| Vice President & CFO | 2008 | $ | 176,400 | $ | 31,771 | $ | 39,200 | $ | — | $ | 5,250 | $ | 252,621 | |||||||
| (1) | The amounts shown in the table represent the aggregate grant date fair value of the total award. As of December 31, 2009, the value of the awards was zero due to the decline in the price of the Company’s stock. See footnote 16 to the Consolidated Financial Statements in Item 8. |
| (2) | Includes automobile expense and Company contribution to 401(k) Plan. |
Narrative Disclosure to Summary Compensation Table.
Employment Agreements. Richard J. Fitzpatrick entered into an employment agreement with the Company effective on February 10, 2003, which has a five-year term, with the agreement that on the third anniversary and each anniversary thereafter the term shall be extended for an additional one year period unless either party delivers written notice of its intent not to extend the term. No such notice was delivered by February 10, 2010, thus the contract is currently extended to February 11, 2013. The term, however, will end no later than the anniversary following Mr. Fitzpatrick’s sixty-fifth birthday. Under the employment agreement, Mr. Fitzpatrick’s base salary is subject to annual review and appropriate upward adjustments. Under the agreement, Mr. Fitzpatrick is entitled to receive a bonus of at least 30 percent of salary and additional stock options, provided specific performance goals are met. The agreement contains a covenant not to compete during the employment period and for a period following termination equal to the number of months for which Mr. Fitzpatrick is entitled to severance payment of employment or twelve months, whichever is greater.
100
Table of Contents
Ernie Ballou entered into an employment agreement with the Company on January 13, 2003. Mr. Ballou’s initial base salary was $160,000 per year, subject to annual review and appropriate upward adjustments. Mr. Ballou’s agreement initially entitled him to receive 25 percent of his base salary as annual bonus and additional stock options, provided specific performance goals are met. The agreement contains a covenant not to compete during the employment period and for a six-month period following termination.
Gerald L. Brickey entered into an employment agreement with the Company on December 28, 2005. Mr. Brickey’s initial base salary was $160,000 per year. Mr. Brickey is entitled to receive 25 percent of his base salary as incentive compensation if he achieves certain management objectives established on an annual basis. The agreement contains a covenant regarding non-solicitation and non-raiding of employees.
In December 2008, the Company amended each of the employment agreements with the Named Executive Officers primarily to bring the agreements into compliance with the provisions of Internal Revenue Code Section 409A and related Treasury regulations. Each of the named executive officer employment agreements provide for benefits upon termination following a change in control, for “good reason” by the officer and by the Company without cause. See “Potential Payments upon Termination or Change in Control” below.
Stock Awards, Stock Options and Stock Appreciation Rights. No stock awards, stock options or stock appreciation rights were granted in 2009. The following information has been restated to reflect the reverse stock split (one-for-ten) on March 1, 2010. In 2008, the named executive officers received fully vested stock awards under the 2003 Stock Incentive Plan in the following amounts: Mr. Fitzpatrick—1,830 shares; Mr. Ballou—1,098 shares; and Mr. Brickey—512 shares, respectively. In 2008, the named executive officers received cash-settled stock appreciation right awards pursuant to the 2007 Stock Appreciation Right Plan in the following amounts: Richard Fitzpatrick—5,000; Ernie Ballou—3,000; and Gerald Brickey—1,400. Each stock appreciation right represents the right to receive an amount equal to the excess of the fair market value of a share of the Company’s common stock on a valuation date over the fair market value of a share of the Company’s common stock on the award date. On a valuation date, the excess amount is credited to a bookkeeping account and credited with interest on a monthly basis at the 5-year LIBOR swap rate plus one percent with the rate adjusted quarterly. Stock appreciation rights vest 20 percent on the date of grant and 20 percent on each anniversary of the grant with accelerated vesting upon death, disability, a change in control and upon retirement after reaching age 62 while employed with at least five years of service. Unvested rights are forfeited upon termination. Stock appreciation rights automatically convert at 10 years from the date of grant and can be converted into the deemed investment account at any time upon election of the recipient. Stock appreciation rights do not have dividend or voting rights or any other rights of the owner of an actual share of common stock. Recipient accounts are distributed upon termination or, if elected by the recipient in advance, a specific distribution date not later than the later of termination or the January following the date the recipient reaches age 65.
Nonequity Incentive Compensation. For 2009 and 2008, the named executive officers did not receive any nonequity incentive compensation. The criteria included under each executive’s nonequity incentive compensation plan included: net income and earnings per share, return on assets, loan quality (measured by delinquency rates), loan production, and satisfactory regulatory compliance. In addition, the Compensation Committee considers subjective goals such as improvements in product offerings, overall process improvements, employee relations and morale, community involvement and Board relations.
101
Table of Contents
Outstanding Equity Awards at Fiscal Year-End. The following table indicates outstanding stock options and stock appreciation rights.
| Name |
Number of Securities Underlying Unexercised Options Exercisable (2) |
Number of Securities Underlying Unexercised Option Unexercisable (1) (2) |
Option Exercise Price (2) |
Option Expiration Date | |||||
| Richard J. Fitzpatrick |
|||||||||
| Stock Option |
5,000 | — | $ | 68.70 | 02/10/13 | ||||
| Stock Option |
5,000 | — | $ | 107.30 | 12/31/13 | ||||
| Stock Option |
2,500 | — | $ | 109.10 | 01/03/15 | ||||
| Stock Option |
3,500 | — | $ | 144.00 | 12/30/15 | ||||
| Stock Appreciation Right |
2,100 | 1,400 | $ | 166.50 | 01/24/17 | ||||
| Stock Appreciation Right |
2,000 | 3,000 | $ | 91.50 | 01/30/18 | ||||
| Ernie Ballou |
|||||||||
| Stock Option |
3,000 | — | $ | 68.60 | 01/13/13 | ||||
| Stock Option |
3,000 | — | $ | 107.30 | 12/31/13 | ||||
| Stock Option |
1,500 | — | $ | 109.10 | 01/03/15 | ||||
| Stock Option |
2,100 | — | $ | 144.00 | 12/30/15 | ||||
| Stock Appreciation Right |
1,260 | 840 | $ | 166.50 | 01/24/17 | ||||
| Stock Appreciation Right |
1,200 | 1,800 | $ | 91.50 | 01/30/18 | ||||
| Gerald L. Brickey |
|||||||||
| Stock Option |
2,000 | — | $ | 140.00 | 12/30/15 | ||||
| Stock Appreciation Right |
840 | 560 | $ | 166.50 | 01/24/17 | ||||
| Stock Appreciation Right |
560 | 840 | $ | 91.50 | 01/30/18 | ||||
| (1) | Stock appreciation rights are cash-settled rights and vest 20% per year beginning on the date of grant. |
| (2) | Restated for reverse stock split (one-for-ten) |
Additional Narrative Disclosure.
Pension Benefits. Mr. Fitzpatrick’s SERP provides for a retirement benefit to be paid commencing the later of the first day of the month following his sixty-fifth birthday or the first day of the month which follows the month containing the six-month anniversary of the termination date of his employment and continuing until the later of his death or his spouse’s death. The aggregate retirement benefit is determined actuarially so that the aggregate amount paid until termination of the benefit will equal the average of his three highest years of base salary and bonus multiplied by (a) 1.5 percent, (b) the number of whole plus fractional years since February 10, 2003, and (c) the number of whole plus fractional years of his predicted life expectancy after age 65. If Mr. Fitzpatrick dies while employed by Cowlitz, his spouse will receive payments starting on the date Mr. Fitzpatrick would have reached age 65 until his spouse’s death, based on annuitizing the amount accrued for the SERP benefit as of the date of his death for her life expectancy.
Mr. Ballou’s SERP provides for a retirement benefit to be paid commencing the later of the first day of the month following his sixty-fifth birthday or the first day of the month which follows the month containing the six-month anniversary of the termination date of his employment and continuing until the later of his death or his spouse’s death. The annual amount of the benefit is determined actuarially to be an amount that if paid from the commencement date until the later of his or his spouse’s death would in total equal a base amount. The base amount is calculated based on an average of his highest three years of base and bonus compensation, multiplied by the product of (a) 1.5 percent, (b) the number of whole plus fractional years of his employment with Cowlitz since January 1, 2007, and (c) the number of whole plus fractional years of his predicted life expectancy after age 65. If Mr. Ballou’s employment terminates early, the amount of the benefit is subject to reduction pursuant to a
102
Table of Contents
vesting schedule. In 2006, he was 20 percent vested and the benefit vests 20 percent on January 1st of each of the next four years, so that as of January 1, 2010 he was 100 percent vested in the benefit. If Mr. Ballou dies while employed by Cowlitz, his spouse will receive payments starting on the date Mr. Ballou would have reached age 65 until his spouse’s death, based on annuitizing the amount accrued as of the date of his death for her life expectancy.
The change in the actuarial present value of pension benefits for 2009, which represents the expense to the Company, was $69,065 for Mr. Fitzpatrick and $38,302 for Mr. Ballou compared with $69,052 and $29,943, respectively, for 2008.
Potential Payments upon Termination or Change in Control. The discussion below reflects the amount of compensation that would be paid to the Company’s named executive officers upon termination of each of officer’s employment under various circumstances. The amounts shown assume a termination date of December 31, 2009 and, in the change in control discussion, a change in control during 2009. The exact values will differ upon the actual date of termination due to changes in salary and bonus and the cost of welfare benefits. Each employment agreement and the SERPs provide for payments upon termination of employment, including termination associated with a change in control of the Company, as described in this section.
Under his SERP Mr. Fitzpatrick would have been entitled to receive $39,694 per year had his employment terminated for any reason on December 31, 2009. As of December 31, 2009, Mr. Ballou was 80 percent vested in his SERP and would have been entitled to receive $11,278 per year had his employment terminated for any reason on that date.
If the Company terminates a named executive officer for cause the Company will not be obligated to pay the officer any additional compensation or benefits under the employment agreements. The definition of “cause” is provided in each officer’s employment agreement. If a named executive officer voluntarily terminates employment with the Company without having “good reason” to do so, the executive is not entitled to any additional salary, cash bonus, severance pay or continuation of benefits under the employment agreements. The circumstances that give rise to “good reason” for an executive to terminate employment are defined in each executive’s employment agreement.
Upon involuntarily termination by the Company of a named executive officer without cause or termination by the officer for good reason, each officer is entitled to a payment under his or her employment agreement. The table below presents the amounts each named executive officer would have been entitled to receive upon such termination:
| Amount | |||
| Richard J. Fitzpatrick |
$ | 1,161,487 | |
| Ernie Ballou |
237,661 | ||
| Gerald Brickey |
181,692 | ||
Mr. Fitzpatrick’s employment agreement provides that he is entitled to receive continuation of his base salary for the balance of the term of his employment agreement if he is terminated without cause or leaves the Company for good reason. As of December 31, 2009, the term of his employment agreement was scheduled to expire on February 11, 2013. Under Mr. Ballou’s employment agreement, his severance benefit following a termination without cause or for good reason is paid in installments over 12 months and is equal to 12 months base salary plus continued insurance and auto benefits for up to 12 months. Under Mr. Brickey’s employment agreement dated December 28, 2005, he was entitled to receive six months base salary paid over six months upon termination without cause or for good reason. Effective March 26, 2008, we entered into a First Amendment to Mr. Brickey’s employment agreement, which increased the amount Mr. Brickey is entitled to receive if he is terminated by Cowlitz other than for cause to twelve months salary.
103
Table of Contents
Under the terms of Mr. Ballou’s employment agreement, in the event of termination as a result of death or disability, he will be entitled to receive an amount equal to the bonus paid to Mr. Ballou the prior year pro-rated, if at all, based on the number of months of service in the year of termination. Mr. Ballou received no cash bonus in 2008. Mr. Fitzpatrick and Mr. Brickey are not entitled to any payments under their respective employment agreements had they died or become disabled on December 31, 2009.
The employment agreements for the named executive officers provide for payment of the following severance amounts upon termination within two years following a change in control by the Company without cause or by the officer for good reason. If a change in control had been announced or occurred prior to December 31, 2009 and termination occurred as of December 31, 2009 the named executive officers would have received the following:
| Named Executive Officer |
Amount | ||
| Richard J. Fitzpatrick |
$ | 1,622,922 | |
| Ernie Ballou |
468,154 | ||
| Gerald Brickey |
381,043 | ||
Mr. Fitzpatrick’s benefit is paid in a lump sum and is equal to three times the sum of his highest annual base salary, highest performance bonus, value of contributions the Company would have made to or for his account in a retirement plan and the value of annual welfare benefit plan contributions. Mr. Ballou’s benefit is paid in a lump sum and is equal to 24 months base salary, two times the amount of the highest bonus paid in the two years preceding termination, continued insurance coverage for up to 24 months, and continued use of the Company provided automobile and reimbursement of auto insurance for up to 24 months. As of December 31, 2009, Mr. Brickey’s benefit is paid in a lump sum and equal to 24 months base salary, two times the highest bonus paid to him in the two years prior to the change in control and continuing insurance benefits for up to twenty-four months.
The agreements provide for reduction of payments that are considered an “excess parachute payment” under Internal Revenue Code Section 280G to an amount that will not be considered an “excess parachute payment.”
Director Compensation. The following table provides information on directors’ compensation in 2009.
| Name |
Fees Earned or Paid in Cash |
Option Awards |
Total Compensation | ||||||
| Brian E. Magnuson |
$ | 29,150 | $ | — | $ | 29,150 | |||
| John M. Petersen |
33,300 | — | 33,300 | ||||||
| Phill S. Rowley |
43,100 | — | 43,100 | ||||||
| Linda M. Tubbs |
37,800 | — | 37,800 | ||||||
104
Table of Contents
In 2009, the non-employee Directors received the following for meetings attended:
| Personal Attendance |
Call-in Attendance | |||||
| Cowlitz Bank & Bancorp Board of Directors |
||||||
| Chairman |
$ | 1,250 | $ | 500 | ||
| Directors |
750 | 250 | ||||
| Special Board of Directors |
750 | 300 | ||||
| Audit Committee |
||||||
| Chairman |
$ | 400 | $ | 200 | ||
| Members |
200 | 100 | ||||
| Compensation Committee |
||||||
| Chairman |
$ | 500 | $ | 300 | ||
| Members |
300 | 200 | ||||
| Corporate Governance Committee |
||||||
| Chairman |
$ | 300 | $ | 200 | ||
| Members |
200 | 100 | ||||
| Bank Audit Committee |
||||||
| Chairman |
$ | 500 | $ | 300 | ||
| Members |
300 | 200 | ||||
| Item 12. | Security Ownership of Certain Beneficial Owners and Management and Related Stockholder Matters |
The following table sets forth information regarding the beneficial ownership of the Common Stock of the Company with respect to each person known to the Company who own more than 5 percent of the outstanding Common Stock, directors and executive officers of the Company and by all directors and executive officers as a group (8 persons) as of March 15, 2009 share amounts reflect the impact of the Company’s common stock one-for-ten reverse stock split affected March 1, 2010. Each beneficial owner has the sole power to vote and to dispose of all shares of Common Stock owned by such beneficial owner. The only class of capital stock outstanding is the Company’s Common Stock. The address of each officer and director is care of Cowlitz Bancorporation, PO Box 1518 / 927 Commerce Avenue, Longview, Washington 98632.
| Name & Position of Beneficial Owner |
Total Shares (1) |
Exercisable Options |
Percentage | ||||
| Directors and Executive Officers |
|||||||
| Ernie D. Ballou—VP & Director |
10,058 | 9,600 | * | ||||
| Richard J. Fitzpatrick—President, CEO & Director |
16,236 | 16,000 | * | ||||
| Brian E. Magnuson—Director |
1,100 | 1,000 | * | ||||
| John M. Petersen—Director |
1,441 | 1,000 | * | ||||
| Phillip S. Rowley—Chairman |
3,550 | 2,500 | * | ||||
| Linda M. Tubbs—Director |
1,500 | 1,000 | * | ||||
| Gerald L. Brickey—VP & Chief Financial Officer |
3,525 | 2,000 | * | ||||
| Lynda Larrabee—VP, Administrative Officer & Secretary |
3,625 | 2,550 | * | ||||
| All directors and executive officers as a group |
41,035 | 35,650 | 8.00 | % | |||
| 5% Shareholders |
|||||||
| Benjamin Namatinia (2) |
71,000 | — | 14.12 | % | |||
| 601 Columbia Street, Apt 201, Vancouver, WA 98660 |
|||||||
| Crescent Capital VI, LLC (3) |
150,836 | — | 29.38 | % | |||
| 11624 SE 5th St., Suite 200, Bellevue, WA 98005 |
|||||||
| * | Less than 1 percent |
| (1) | Includes exercisable options. |
| (2) | As reported on a Form 4/A filed with the SEC on March 1, 2010 |
| (3) | As reported on a Schedule 13D filed with the SEC on November 16, 2009. |
105
Table of Contents
The following table provides information as of December 31, 2009 regarding equity compensation plans approved by the shareholders and equity compensation plans that were not approved by the shareholders.
| (a) | (b) | (c) | |||||
| Plan Category |
Number of securities to be issued upon exercise of outstanding options, warrants and rights |
Weighted-average exercise price of outstanding options, warrants and rights |
Number of securities remaining available for future issuance under equity compensation plans (excluding securities reflected in column (a)) | ||||
| Equity compensation plans approved by shareholders |
34,655 | $ | 111.01 | 2,380 | |||
| Equity compensation plans not approved by shareholders (1) |
28,406 | $ | 111.01 | — | |||
| Total |
63,061 | $ | 111.01 | 2,380 | |||
| (1) | 19,806 shares with a weighted average exercise price of $117.80 (restated for reverse stock split, one-for-ten) were issued as part of the acquisition of Northern Bank of Commerce (“NBC”) in 2000 to NBC’s directors and its President/CEO. The balance has been issued as hiring incentives to senior management level employees. |
| Item 13. | Certain Relationships and Related Transactions, and Director Independence |
From time to time, the Company has outstanding banking relationships with executive officers, directors, their spouses, associates, and related organizations. All such loans are made in the ordinary course of business and on substantially the same terms and conditions, including interest rate and collateral required, as comparable transactions with unaffiliated parties. Such loans do not involve more than the normal risk of collectability or present other unfavorable features. The total amount of loans outstanding at December 31, 2009 was $164,000 which was 1.4 percent of shareholders’ equity.
The Company does not have a formal process to approve other transactions with related persons. Under NASDAQ Rule 4350(h), the Audit Committee must approve all transactions with related persons. Under the Company’s Code of Conduct and Ethics Policy, all transactions must be reported to the Board of Directors. Transactions with related persons are reviewed and approved in accordance with NASDAQ Rule 4350(h).
The Board of Directors has reviewed each director’s relationship to the Company to determine board independence, and has determined that the following directors qualify as “independent” as defined in the NASDAQ listing standards: Brian Magnuson, John Petersen, Phill Rowley and Linda Tubbs. In determining the independence of directors, the Board of Directors considered each director’s response to a director questionnaire in which each of the independent directors indicated that they had no transactions with the Company other than banking transactions in the ordinary course of business. The Board of Directors also considered that directors are required to report conflicts of interest to the Company under the Company’s Code of Ethics and Business Conduct Policy and no directors reported a conflict.
| Item 14. | Principal Accountant Fees and Services |
Moss Adams LLP serves as the Company’s independent public accountant. Representatives of Moss Adams LLP are expected to be present at the annual meeting and will have the opportunity to make a statement if they desire to do so. It is expected that such representatives will be available to respond to appropriate questions.
Audit Fees. The aggregate fees billed by Moss Adams LLP for the audit of the Company’s annual consolidated financial statements for the fiscal year ended December 31, 2009 and the review of the consolidated financial statements included in the Company’s filings on Form 10-Q for fiscal 2009 were $182,000 and for fiscal 2008 were $142,840.
106
Table of Contents
Audit-Related Fees. In 2009 audit-related fees were $28,000. In 2008, the audit-related fees were $25,063. Audit-related fees in 2009 and 2008 include services associated with audits of employee benefit plans and accounting consultation.
Tax Fees. Tax fees for the year 2009 were $18,000 and $16,870 for the year 2008, relating to filing of federal and local tax returns.
All Other Fees. Fees billed to the Company for other services rendered by Moss Adams LLP for the fiscal years ended December 31, 2009 and 2008, were zero.
Pre-Approval Policies. The Audit Committee selects and oversees our independent auditors. Audit Committee policy prohibits Moss Adams from providing certain non-audit services to us and requires all audit and permissible non-audit services provided by Moss Adams to be pre-approved by the Audit Committee. In determining whether to pre-approve the provision by Moss Adams of a permissible non-audit service, the Audit Committee considers whether the provision of the service could impair the independence of Moss Adams with respect to us. The Audit Committee considers the facts and circumstances of the proposed engagement, including whether Moss Adams can provide the service more effectively and economically than other firms because of its familiarity with our businesses and operations. The Audit Committee also considers the proposed engagement in light of any other non-audit services provided to us by Moss Adams and the fees paid to Moss Adams for those services. The Audit Committee requires competitive bidding for non-audit services unless it is not warranted because of the facts and circumstances of the proposed engagement. Moss Adams LLP may not perform any prohibited services as defined by the Sarbanes-Oxley Act of 2002.
Independence. The Audit Committee has determined that the provision of services rendered above is compatible with maintaining Moss Adams LLP’s independence.
107
Table of Contents
| Item 15. | Exhibits and Financial Statement Schedules |
The following documents have been filed as part of this report:
Financial Statements included in Item 8 of this Form 10-K:
| • | Consolidated Statements of Condition |
| • | Consolidated Statements of Operations |
| • | Consolidated Statements of Changes in Shareholder’s Equity and Comprehensive Income (Loss) |
| • | Consolidated Statements of Cash Flow |
| • | Notes to Consolidated Financial Statements |
All schedules have been omitted because the information is not required, not applicable, not present in amounts sufficient to require submission or are included in the financial statements or notes thereto. The Company has one unconsolidated subsidiary. There are no fifty percent or less owned subsidiaries or affiliates whose securities are pledged as collateral that are not consolidated. The unconsolidated wholly-owned subsidiary is Cowlitz Statutory Trust I, which is not consolidated pursuant to ASC 810-10-15.
The exhibit list is set forth on the Exhibit Index immediately following the signature page. The exhibits filed as part of this report or incorporated by reference herein are listed on the Exhibit Index. Management contracts are indicated by an asterisk.
108
Table of Contents
SIGNATURES
Pursuant to the requirements of Section 13 or 15(d) of the Securities Exchange Act of 1934, the registrant has duly caused this report to be signed on its behalf by the undersigned, thereunto duly authorized, on the 31st day of March 2010.
| COWLITZ BANCORPORATION (Registrant) |
| /s/ RICHARD J. FITZPATRICK |
| Richard J. Fitzpatrick |
| President and Chief Executive Officer |
Pursuant to the requirements of the Securities Exchange Act of 1934, this report has been signed below by the following persons on behalf of the registrant in the capacities indicated on the 31st day of March 2010.
| /s/ PHILL S. ROWLEY Phill S. Rowley, Chairman |
| /s/ BRIAN MAGNUSON Brian Magnuson, Director |
| /s/ ERNIE BALLOU Ernie Ballou, Director |
| /s/ LINDA TUBBS Linda Tubbs, Director |
| /s/ JOHN PETERSEN John Petersen, Director |
| Principal Executive Officer: |
| /s/ RICHARD J. FITZPATRICK Richard J. Fitzpatrick President and Chief Executive Officer, Director |
| Principal Accounting and Principal Financial Officer: |
| /s/ GERALD L. BRICKEY Gerald L. Brickey Vice President and Chief Financial Officer |
109
Table of Contents
EXHIBIT INDEX
| 3.1 | Restated Articles of Incorporation | |
| 3.2 | Amended and Restated Bylaws (incorporated by reference to Exhibit 3.2 to the Form 10-K filed March 31, 2009) | |
| 10.1 | * Employment Agreement with Rich Fitzpatrick (incorporated by reference to Exhibit 10.12 to the Company’s Form 10-Q filed May 15, 2003) | |
| 10.1.1 | *Amendment to Employment Agreement with Rich Fitzpatrick dated effective as of December 17, 2008 (incorporated by reference to Exhibit 10.1.1 to Form 10-K filed March 31, 2009) | |
| 10.1.2 | * Corrected Amendment dated effective as of December 18, 2009 to Employment Agreement with Rich Fitzpatrick dated effective as of December 17, 2008 | |
| 10.2 | *Cowlitz Bancorporation 2003 Stock Incentive Plan (incorporated by reference to Appendix B to the Company’s proxy statement for the 2003 annual meeting of shareholders filed April 15, 2003) | |
| 10.3 | * Employment Agreement with Ernie Ballou (incorporated by reference to Exhibit 10.13 to the Company’s Form 10-Q filed May 15, 2003) | |
| 10.3.1 | *Amendment to Employment Agreement of Ernie Ballou (incorporated by reference to Exhibit 10.2 to the Company’s Form 8-K filed November 2, 2005) | |
| 10.3.2 | * Second Amendment to Employment Agreement of Ernie Ballou dated effective as of December 17, 2008 (incorporated by reference to Exhibit 10.3.1 to Form 10-K filed March 31, 2009) | |
| 10.4 | *Cowlitz Bancorporation Employee Stock Purchase Plan (incorporated by reference to Appendix A to the Registrant’s proxy statement for the 2003 annual meeting of shareholders filed April 15, 2003) | |
| 10.5.1 | Form of Indemnification Agreement for Directors (incorporated by reference to Exhibit 10.1 to Form 10-Q filed May 15, 2009) | |
| 10.5.2 | Form of Indemnification Agreement for Officers (incorporated by reference to Exhibit 10.2 to Form 10-Q filed May 15, 2009) | |
| 10.6 | Guarantee Agreement dated April 29, 2005 between the Company and Wilmington Trust Company relating to the issuance of trust preferred securities (incorporated by reference to Exhibit 10.8 to the Company’s Registration Statement on Form S-4, Registration No. 333-126423, filed July 6, 2005) | |
| 10.7 | * Employment Agreement for Gerald L. Brickey dated effective as of December 28, 2005 (incorporated by reference to Exhibit 99.1 to the Company’s Form 8-K filed January 24, 2006) | |
| 10.7.1 | *First Amendment to Employment Agreement with Gerald L. Brickey dated effective as of March 26, 2008 (incorporated by reference to Exhibit 10.1 to the Company’s Form 10-Q filed May 15, 2008) | |
| 10.7.2 | * Second Amendment to Employment Agreement of Gerald L. Brickey dated effective as of December 17, 2008 (incorporated by reference to Exhibit 10.7.1 to Form 10-K filed March 31, 2009) | |
| 10.8 | * Supplemental Executive Retirement Plan for Rich Fitzpatrick (incorporated by reference to Exhibit 10.1 to the Company’s Form 8-K filed November 2, 2005) | |
| 10.9 | * Supplemental Executive Retirement Plan for Ernie Ballou (incorporated by reference to Exhibit 99.1 to the Company’s Current Report on Form 8-K filed December 5, 2006) | |
| 10.10 | * 2007 Stock Appreciation Plan (incorporated by reference to Exhibit 99.1 to the Company’s Form 8-K filed January 30, 2007) | |
| 10.11 | * Form of award agreement under 2007 Stock Appreciation Plan (incorporated by reference to Exhibit 99.2 to the Company’s Form 8-K filed January 30, 2007) | |
110
Table of Contents
| 10.12 | *Form of Restricted Stock Agreement under 2003 Stock Incentive Plan (incorporated by reference to Exhibit 10.12 to Form 10-K filed March 31, 2009) | |
| 10.13 | *Employment Agreement for Lynda Larrabee dated effective as of December 1, 2008 (incorporated by reference to Exhibit 10.13 to Form 10-K filed March 31, 2009) | |
| 99.1 | Stipulation and Consent Order with FDIC and DFI (incorporated by reference to Exhibit 99.1 to Form 8-K filed February 2, 2010) | |
| 21 | List of all Subsidiaries of the Registrant: | |
| Cowlitz Bank, a Washington state-charted banking corporation, which does business as Cowlitz Bank, Bay Bank and Bay Mortgage | ||
| Cowlitz Statutory Trust I, a Delaware statutory trust | ||
| 23 | Consent of Moss Adams LLP | |
| 31.1 | Certification of Chief Executive Officer | |
| 31.2 | Certification of Chief Financial Officer | |
| 32 | Certification of Chief Executive Officer and Chief Financial Officer | |
111