Attached files
Exhibit 13
Guaranty Federal Bancshares, Inc.
2009 Annual Report
|
Contents
i President's Message
1 Investor Information
2 Common Stock Prices & Dividends
4 Selected Consolidated Financial and Other Data
5 Management's Discussion and Analysis of Financial Condition and Results of Operations
17 Consolidated Financial Statements
49 Report of Independent Registered Public Accounting Firm
50 Directors and Officers
|
Investor Information
ANNUAL MEETING OF STOCKHOLDERS:
The Annual Meeting of Stockholders of the Company will be held Wednesday, May 26, 2010 at 6:00 p.m., local time, at the Guaranty Bank Operations Center, 1414 W. Elfindale, Springfield, Missouri.
ANNUAL REPORT ON FORM 10-K:
Copies of the Company's Annual Report on Form 10-K, including the financial statements, filed with the Securities and Exchange Commission are available without charge upon written request to:
Lorene Thomas, Secretary
Guaranty Federal Bancshares, Inc.,
1341 W. Battlefield St., Springfield, MO 65807-4181
TRANSFER AGENT:
Registrar and Transfer Company
10 Commerce Drive
Cranford, NJ 07016
STOCK TRADING INFORMATION:
Symbol: GFED
SPECIAL LEGAL COUNSEL:
Husch Blackwell Sanders LLP
901 St. Louis St., Suite 1900
Springfield, MO 65806
INDEPENDENT REGISTERED PUBLIC ACCOUNTING FIRM:
BKD, LLP
910 St. Louis St.
PO Box 1190
Springfield, MO 65801-1190
STOCKHOLDER AND FINANCIAL INFORMATION:
Carter Peters,
Executive Vice President, Chief Financial Officer
417-520-4333
|
1
Guaranty Federal Bancshares, Inc.
2009 Annual Report
|
Common Stock Prices & Dividends
|
|
|
The common stock of Guaranty Federal Bancshares, Inc. (the "Company") is listed for trading on the NASDAQ Global Market under the symbol "GFED". As of March 18, 2010, there were approximately 1410 holders of shares of the Company's common stock. At that date the Company had 6,779,800 shares of common stock issued and 2,638,440 shares of common stock outstanding.
|
|
|
During the year ended December 31, 2009, the Company did not declare a cash dividend. During the year ended December 31, 2008, the Company paid dividends of (i) $0.18 per share on April 18, 2008, to stockholders of record as of April 7, 2008, (ii) $0.18 per share on July 18, 2008 to stockholders of record as of July 7, 2008. The Company did not declare a cash dividend in the third or fourth quarters of 2008. Any future dividends, if any, will be at the discretion of the Company's Board of Directors and will depend on, among other things, the Company's results of operations, cash requirements and surplus, financial condition and other factors that the Company's Board of Directors may consider relevant.
|
|
|
The table below reflects the range of common stock high and low closing prices per the NASDAQ Global Market by quarter for the years ended December 31, 2009 and 2008.
|
|
Year ended
|
Year ended
|
|||||||||||||||
|
December 31, 2009
|
December 31, 2008
|
|||||||||||||||
|
High
|
Low
|
High
|
Low
|
|||||||||||||
|
Quarter ended:
|
||||||||||||||||
|
March 31
|
$ | 5.95 | 3.85 | $ | 28.78 | 24.94 | ||||||||||
|
June 30
|
7.50 | 4.61 | 26.43 | 20.25 | ||||||||||||
|
September 30
|
7.00 | 5.05 | 19.75 | 11.40 | ||||||||||||
|
December 31
|
6.74 | 5.04 | 11.50 | 4.25 | ||||||||||||
2
Guaranty Federal Bancshares, Inc.
2009 Annual Report
|
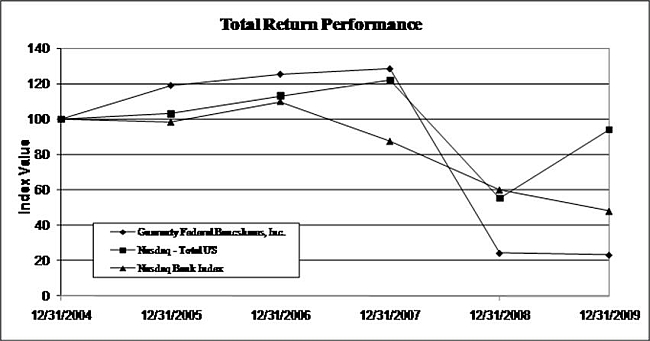
Set forth below is a stock performance graph comparing the cumulative total shareholder return on the Common Stock with (a) the cumulative total stockholder return on stocks included in The Nasdaq – Total U.S. Index and (b) the cumulative total stockholder return on stocks included in The Nasdaq Bank Index. All three investment comparisons assume the investment of $100 as of the close of business on December 31, 2004 and the hypothetical value of that investment as of the Company's fiscal years ended December 31, 2005, 2006, 2007, 2008, and 2009, assuming that all dividends were reinvested. The graph reflects the historical performance of the Common Stock, and, as a result, may not be indicative of possible future performance of the Common Stock. The data used to compile this graph was obtained from NASDAQ.
|
|
Period Ending
|
||||||||||||||||||||||||
|
Index
|
12/31/04
|
12/31/05
|
12/31/06
|
12/31/07
|
12/31/08
|
12/31/09
|
||||||||||||||||||
|
Guaranty Federal Bancshares, Inc.
|
100.00 | 119.13 | 125.48 | 128.49 | 24.31 | 23.26 | ||||||||||||||||||
|
NASDAQ – Total US
|
100.00 | 103.01 | 113.10 | 121.91 | 55.28 | 94.16 | ||||||||||||||||||
|
NASDAQ Bank Index
|
100.00 | 98.21 | 109.88 | 87.40 | 59.99 | 48.02 | ||||||||||||||||||
3
Guaranty Federal Bancshares, Inc.
Selected Consolidated Financial and Other Data
The following tables include certain information concerning the financial position and results of operations of Guaranty Federal Bancshares, Inc. (including consolidated data from operations of the Bank) as of the dates indicated. Dollar amounts are expressed in thousands except per share data.
|
Summary Balance Sheets
|
As of December 31,
|
|||||||||||||||||||
|
2009
|
2008
|
2007
|
2006
|
2005
|
||||||||||||||||
|
ASSETS
|
||||||||||||||||||||
|
Cash and cash equivalents
|
$ | 33,017 | $ | 15,097 | $ | 12,046 | $ | 14,881 | $ | 20,506 | ||||||||||
|
Investments and interest-bearing deposits
|
119,693 | 66,062 | 15,385 | 8,669 | 7,702 | |||||||||||||||
|
Loans receivable, net
|
528,503 | 558,327 | 516,242 | 480,269 | 435,528 | |||||||||||||||
|
Accrued interest receivable
|
2,671 | 2,632 | 3,323 | 2,910 | 2,089 | |||||||||||||||
|
Prepaids and other assets
|
25,249 | 16,573 | 8,613 | 10,075 | 7,696 | |||||||||||||||
|
Foreclosed assets
|
6,760 | 5,655 | 727 | 173 | 27 | |||||||||||||||
|
Premises and equipment
|
11,818 | 11,324 | 9,442 | 7,868 | 7,453 | |||||||||||||||
|
Bank owned life insurance
|
10,069 | - | - | - | - | |||||||||||||||
| $ | 737,780 | $ | 675,670 | $ | 565,778 | $ | 524,845 | $ | 481,001 | |||||||||||
|
LIABILITIES
|
||||||||||||||||||||
|
Deposits
|
$ | 513,051 | $ | 447,079 | $ | 418,191 | $ | 352,230 | $ | 320,059 | ||||||||||
|
Federal Home Loan Bank advances
|
116,050 | 132,436 | 76,086 | 108,000 | 100,000 | |||||||||||||||
|
Securities sold under agreements to repurchase
|
39,750 | 39,750 | 9,849 | 1,703 | 1,594 | |||||||||||||||
|
Subordinated debentures
|
15,465 | 15,465 | 15,465 | 15,465 | 15,465 | |||||||||||||||
|
Other liabilities
|
2,053 | 3,627 | 3,500 | 2,548 | 1,791 | |||||||||||||||
| 686,369 | 638,357 | 523,091 | 479,946 | 438,909 | ||||||||||||||||
|
STOCKHOLDERS' EQUITY
|
51,411 | 37,313 | 42,687 | 44,899 | 42,092 | |||||||||||||||
| $ | 737,780 | $ | 675,670 | $ | 565,778 | $ | 524,845 | $ | 481,001 | |||||||||||
|
Supplemental Data
|
As of December 31,
|
|||||||||||||||||||
| 2009 | 2008 | 2007 | 2006 | 2005 | ||||||||||||||||
|
Number of full-service offices
|
9 | 10 | 8 | 8 | 7 | |||||||||||||||
|
Cash dividends per common share
|
$ | - | $ | 0.36 | $ | 0.70 | $ | 0.67 | $ | 0.65 | ||||||||||
|
Summary Statements of Operations
|
Years ended December 31,
|
|||||||||||||||||||
|
2009
|
2008
|
2007
|
2006
|
2005
|
||||||||||||||||
|
Interest income
|
$ | 33,873 | $ | 36,363 | $ | 37,972 | $ | 35,204 | $ | 27,413 | ||||||||||
|
Interest expense
|
20,527 | 19,524 | 20,519 | 17,386 | 11,860 | |||||||||||||||
|
Net interest income
|
13,346 | 16,839 | 17,453 | 17,818 | 15,553 | |||||||||||||||
|
Provision for loan losses
|
6,900 | 14,744 | 840 | 750 | 945 | |||||||||||||||
|
Net interest income after provision for loan losses
|
6,446 | 2,095 | 16,613 | 17,068 | 14,608 | |||||||||||||||
|
Noninterest income
|
4,288 | 2,316 | 4,729 | 3,660 | 3,468 | |||||||||||||||
|
Noninterest expense
|
14,710 | 12,760 | 11,842 | 10,177 | 8,670 | |||||||||||||||
|
Income (loss) before income taxes
|
(3,976 | ) | (8,349 | ) | 9,500 | 10,551 | 9,406 | |||||||||||||
|
Provision (credit) for income taxes
|
(1,635 | ) | (2,989 | ) | 3,400 | 4,042 | 3,507 | |||||||||||||
|
Net income (loss)
|
$ | (2,341 | ) | $ | (5,360 | ) | $ | 6,100 | $ | 6,509 | $ | 5,899 | ||||||||
|
Preferred stock dividends and discount accretion
|
1,032 | - | - | - | - | |||||||||||||||
|
Net income (loss) available to common shareholders
|
$ | (3,373 | ) | $ | (5,360 | ) | $ | 6,100 | $ | 6,509 | $ | 5,899 | ||||||||
|
Basic income (loss) per common share
|
$ | (1.29 | ) | $ | (2.06 | ) | $ | 2.25 | $ | 2.34 | $ | 2.12 | ||||||||
|
Diluted income (loss) per common share
|
$ | (1.29 | ) | $ | (2.06 | ) | $ | 2.19 | $ | 2.25 | $ | 2.03 | ||||||||
4
Guaranty Federal Bancshares, Inc.
Management's Discussion and Analysis of Financial Condition and Results of Operations
GENERAL
Guaranty Federal Bancshares, Inc. (the "Company") is a Delaware corporation organized on December 30, 1997 that operates as a one-bank holding company. The Bank is a wholly-owned subsidiary of the Company.
The primary activity of the Company is to oversee its investment in the Bank. The Company engages in few other activities, and the Company has no significant assets other than its investment in the Bank. For this reason, unless otherwise specified, references to the Company include the operations of the Bank. The Company's principal business consists of attracting deposits from the general public and using such deposits to originate multi-family, construction and commercial real estate loans, mortgage loans secured by one- to four-family residences, and consumer and business loans. The Company also uses these funds to purchase government sponsored mortgage-backed securities, US government and agency obligations, and other permissible securities. When cash outflows exceed inflows, the Company uses borrowings and brokered deposits as additional financing sources.
The Company derives revenues principally from interest earned on loans and investments and, to a lesser extent, from fees charged for services. General economic conditions and policies of the financial institution regulatory agencies, including the Missouri Division of Finance and the Federal Deposit Insurance Corporation ("FDIC") significantly influence the Company's operations. Interest rates on competing investments and general market interest rates influence the Company's cost of funds. Lending activities are affected by the interest rates at which such financing may be offered. The Company intends to focus on commercial, one- to four-family residential and consumer lending throughout southwestern Missouri.
The Company has two wholly-owned subsidiaries other than the Bank, its principal subsidiary: (i) Guaranty Statutory Trust I, a Delaware statutory trust; and (ii) Guaranty Statutory Trust II, a Delaware statutory trust. These Trusts were formed in December 2005 for the exclusive purpose of issuing trust preferred securities to acquire junior subordinated debentures issued by the Company. The Company's banking operation conducted through the Bank is the Company's only reportable segment. See also the discussion contained in the section captioned "Segment Information" in Note 1 of the Notes to Consolidated Financial Statements in this report.
The discussion set forth below, and in any other portion of this report, may contain forward-looking statements. Such statements are based upon the information currently available to management of the Company and management's perception thereof as of the date of this report. When used in this document, words such as "anticipates," "estimates," "believes," "expects," and similar expressions are intended to identify forward-looking statements but are not the exclusive means of identifying such statements. Such statements are subject to risks and uncertainties. Actual results of the Company's operations could materially differ from those forward-looking comments. The differences could be caused by a number of factors or combination of factors including, but not limited to: changes in demand for banking services; changes in portfolio composition; changes in management strategy; increased competition from both bank and non-bank companies; changes in the general level of interest rates; and other factors set forth in reports and other documents filed by the Company with the Securities and Exchange Commission from time to time including the risk factors of the Company set forth in Item 1A. of the Company's Form 10-K.
FINANCIAL CONDITION
From December 31, 2008 to December 31, 2009, the Company's total assets increased $62,109,459 (9%) to $737,779,852, liabilities increased $48,011,728 (8%) to $686,369,219, and stockholders' equity increased $14,097,731 (38%) to $51,410,633. The ratio of stockholders' equity to total assets increased to 7.0% during this period, compared to 5.5% as of December 31, 2008.
From December 31, 2008 to December 31, 2009, available-for-sale securities increased $37,153,912 (57%). The increase is primarily due to purchases of $82.8 million, offset by sales, maturities and principal repayments of $46.9 million. The purchases were made with funding provided by the Bank's money market deposit campaign and the decline in loan balances. See further explanation below. During fiscal year 2009, the Company sold various securities in its portfolio with a recognized gain of $689,769, including its remaining investment in the Federal Home Loan Mortgage Corporation (26,600 shares).
From December 31, 2008 to December 31, 2009, held-to-maturity securities decreased $83,682 (15%) to $472,783 due to principal repayments received during the year. Stock of the Federal Home Loan Bank of Des Moines ("FHLB") was decreased by $753,500 (11%) to $5,976,600 due to lower stock requirements necessary from the reduction in FHLB advances.
5
Guaranty Federal Bancshares, Inc.
Management's Discussion and Analysis of Financial Condition and Results of Operations
From December 31, 2008 to December 31, 2009, net loans receivable decreased by $31,355,190 (6%) to $525,038,053. During this period, permanent loans secured by both owner and non-owner occupied one to four unit residential real estate increased $919,960 (1%), multi-family permanent loans increased $2,741,088 (9%), construction loans decreased $63,493,411 (75%), permanent loans secured by commercial real estate increased $32,762,341 (16%), commercial loans decreased $3,970,483 (3%), and installment loans decreased $3,007,596 (12%).
As of December 31, 2009, management identified loans totaling $40,009,123 as impaired with a related allowance for loan losses of $7,240,708. Impaired loans increased by $120,458 during 2009, compared to the balance of $39,888,665 at December 31, 2008.
From December 31, 2008 to December 31, 2009, the allowance for loan losses decreased $2,652,369 to $14,076,123. In addition to the provision for loan loss of $6,900,000 recorded by the Company during the year ended December 31, 2009, loan charge-offs exceeded recoveries by $9,552,369 for the twelve months ended December 31, 2009. The allowance for loan losses as of December 31, 2009 and December 31, 2008 was 2.61% and 2.92% of gross loans outstanding (excluding mortgage loans held for sale), respectively. As of December 31, 2009, the allowance for loan losses was 35% of impaired loans versus 42% as of December 31, 2008. Management believes the allowance for loan losses is at a level to be sufficient in providing for potential loan losses in the Bank's existing loan portfolio.
From December 31, 2008 to December 31, 2009, prepaid expense and other assets increased $2,666,050 (66%) to $6,731,409. The change was primarily due to purchases of tax credit investments (for future federal tax benefit) of $3.4 million.
As of December 31, 2009, prepaid FDIC deposit insurance premiums of $4,135,875 consisted of insurance assessments paid for fiscal years 2010, 2011 and 2012. In November 2009, the FDIC adopted a final rule to collect, in advance, all estimated premiums for these years in lieu of another special assessment, as was done for the June 30, 2009 quarter end.
As of December 31, 2009, foreclosed assets held for sale consisted primarily of real estate related to single family residences and one commercial development in Northwest Arkansas of $3.7 million.
From December 31, 2008 to December 31, 2009, premises and equipment increased $494,053 (4%) to $11,817,516 due to purchases of $1.5 million for the Company's new operations center and a branch remodel. These purchases were offset by depreciation of $965,504 in 2009.
From December 31, 2008 to December 31, 2009, bank owned life insurance increased $10,069,540 due to the Company's $10 million purchase of single premium life insurance on key members of management with the purpose of partially offsetting the Company's employee benefit costs as a whole. This purchase was completed on October 30, 2009.
From December 31, 2008 to December 31, 2009, deposits increased $65,971,633 (15%) to $513,051,102. During this period, checking and savings accounts increased by $160.5 million and certificates of deposit decreased by $94.5 million. The increase in the checking and savings accounts was due to the Bank's strong emphasis on increasing money market accounts through an aggressive deposit campaign. Management has implemented additional marketing efforts to obtain additional personal and commercial checking business from these customers. At December 31, 2009, included in the certificates of deposit totals are $19.8 million in deposits classified as "brokered", a decrease of $20.0 million from December 31, 2008.
From December 31, 2008 to December 31, 2009, the Company's borrowings from the FHLB decreased $16.4 million (12%) to $116,050,000, due to principal repayments during the period.
From December 31, 2008 to December 31, 2009, notes payable decreased $1.4 million (100%) due to the full repayment of the Company's notes payable during the period.
From December 31, 2008 to December 31, 2009, stockholders' equity (including unrealized appreciation on available-for-sale securities and interest rate swaps, net of tax) increased $14.1 million (38%) to $51,410,633. As a result of the Company's participation in the Department of the Treasury's Capital Purchase Program (CPP), stockholders' equity increased by $17 million during the period (See Note 15 to the Consolidated Financial Statements for further discussion). In addition, in conjunction with the preferred stock issued under the CPP, the Company has accrued a total of $779,167 of dividends (at 5%). The Company incurred a net loss for the year ended December 31, 2009 of $2,340,718. On a per common share basis, stockholders' equity decreased $.79 from $14.28 as of December 31, 2008 to $13.49 as of December 31, 2009.
6
Guaranty Federal Bancshares, Inc.
Management's Discussion and Analysis of Financial Condition and Results of Operations
AVERAGE BALANCES, INTEREST AND AVERAGE YIELDS
The following table shows the balances as of December 31, 2009 of various categories of interest-earning assets and interest-bearing liabilities and the corresponding yields and costs, and, for the periods indicated: (1) the average balances of various categories of interest-earning assets and interest-bearing liabilities, (2) the total interest earned or paid thereon, and (3) the resulting weighted average yields and costs. In addition, the table shows the Company's rate spreads and net yields. Average balances are based on daily balances. Tax-free income is not material; accordingly, interest income and related average yields have not been calculated on a tax equivalent basis. Average loan balances include non-accrual loans. Dollar amounts are expressed in thousands.
|
As of
|
Year Ended
|
Year Ended
|
Year Ended
|
|||||||||||||||||||||||||||||||||||||||||
|
December 31, 2009
|
December 31, 2009
|
December 31, 2008
|
December 31, 2007
|
|||||||||||||||||||||||||||||||||||||||||
|
Balance
|
Yield / Cost
|
Average Balance
|
Interest
|
Yield / Cost
|
Average Balance
|
Interest
|
Yield / Cost
|
Average Balance
|
Interest
|
Yield / Cost
|
||||||||||||||||||||||||||||||||||
|
ASSETS
|
||||||||||||||||||||||||||||||||||||||||||||
|
Interest-earning:
|
||||||||||||||||||||||||||||||||||||||||||||
|
Loans
|
$ | 542,579 | 5.53 | % | $ | 548,847 | $ | 29,695 | 5.41 | % | $ | 555,828 | $ | 33,019 | 5.94 | % | $ | 482,806 | $ | 37,114 | 7.69 | % | ||||||||||||||||||||||
|
Investment securities
|
103,132 | 2.95 | % | 102,096 | 3,744 | 3.67 | % | 58,727 | 3,125 | 5.32 | % | 10,688 | 537 | 5.02 | % | |||||||||||||||||||||||||||||
|
Other assets
|
51,079 | 0.93 | % | 65,853 | 434 | 0.66 | % | 7,869 | 219 | 2.78 | % | 7,372 | 321 | 4.35 | % | |||||||||||||||||||||||||||||
|
Total interest-earning
|
696,790 | 4.81 | % | 716,796 | 33,873 | 4.73 | % | 622,424 | 36,363 | 5.84 | % | 500,866 | 37,972 | 7.58 | % | |||||||||||||||||||||||||||||
|
Noninterest-earning
|
40,990 | 25,294 | 24,092 | 18,730 | ||||||||||||||||||||||||||||||||||||||||
| $ | 737,780 | $ | 742,090 | $ | 646,516 | $ | 519,596 | |||||||||||||||||||||||||||||||||||||
|
LIABILITIES AND STOCKHOLDERS' EQUITY
|
||||||||||||||||||||||||||||||||||||||||||||
|
Interest-bearing:
|
||||||||||||||||||||||||||||||||||||||||||||
|
Savings accounts
|
$ | 14,644 | 0.99 | % | $ | 13,069 | $ | 121 | 0.93 | % | $ | 12,980 | $ | 143 | 1.10 | % | $ | 13,474 | $ | 320 | 2.37 | % | ||||||||||||||||||||||
|
Transaction accounts
|
255,420 | 2.88 | % | 215,494 | 6,152 | 2.85 | % | 102,341 | 1,806 | 1.76 | % | 100,689 | 2,940 | 2.92 | % | |||||||||||||||||||||||||||||
|
Certificates of deposit
|
214,056 | 3.01 | % | 262,719 | 9,108 | 3.47 | % | 285,845 | 12,270 | 4.29 | % | 246,785 | 12,600 | 5.11 | % | |||||||||||||||||||||||||||||
|
FHLB advances
|
116,050 | 2.72 | % | 112,851 | 3,152 | 2.79 | % | 119,957 | 3,238 | 2.70 | % | 65,575 | 3,470 | 5.29 | % | |||||||||||||||||||||||||||||
|
Subordinated debentures
|
15,465 | 6.62 | % | 15,465 | 1,024 | 6.62 | % | 15,465 | 1,024 | 6.62 | % | 15,465 | 1,024 | 6.62 | % | |||||||||||||||||||||||||||||
|
Other borrowed funds
|
39,750 | 2.91 | % | 39,750 | 970 | 2.44 | % | 38,604 | 1,043 | 2.70 | % | 3,691 | 165 | 4.47 | % | |||||||||||||||||||||||||||||
|
Total interest-bearing
|
655,385 | 2.94 | % | 659,348 | 20,527 | 3.11 | % | 575,192 | 19,524 | 3.39 | % | 445,679 | 20,519 | 4.60 | % | |||||||||||||||||||||||||||||
|
Noninterest-bearing
|
30,984 | 30,467 | 30,516 | 28,401 | ||||||||||||||||||||||||||||||||||||||||
|
Total liabilities
|
686,369 | 689,815 | 605,708 | 474,080 | ||||||||||||||||||||||||||||||||||||||||
|
Stockholders' equity
|
51,411 | 52,275 | 40,808 | 45,516 | ||||||||||||||||||||||||||||||||||||||||
| $ | 737,780 | $ | 742,090 | $ | 646,516 | $ | 519,596 | |||||||||||||||||||||||||||||||||||||
|
Net earning balance
|
$ | 41,405 | $ | 57,448 | $ | 47,232 | $ | 55,187 | ||||||||||||||||||||||||||||||||||||
|
Earning yield less costing rate
|
1.87 | % | 1.62 | % | 2.45 | % | 2.98 | % | ||||||||||||||||||||||||||||||||||||
|
Net interest income, and net yield spread on interest-earning assets
|
$ | 13,346 | 1.86 | % | $ | 16,839 | 2.71 | % | $ | 17,453 | 3.48 | % | ||||||||||||||||||||||||||||||||
|
Ratio of interest-earning assets to interest-bearing liabilities
|
106 | % | 109 | % | 108 | % | 112 | % | ||||||||||||||||||||||||||||||||||||
7
Guaranty Federal Bancshares, Inc.
Management's Discussion and Analysis of Financial Condition and Results of Operations
The following table sets forth information regarding changes in interest income and interest expense for the periods indicated resulting from changes in average balances and average rates shown in the previous table. For each category of interest-earning assets and interest-bearing liabilities information is provided with respect to changes attributable to: (i) changes in balance (change in balance multiplied by the old rate), (ii) changes in interest rates (change in rate multiplied by the old balance); and (iii) the combined effect of changes in balance and interest rates (change in balance multiplied by change in rate). Dollar amounts are expressed in thousands.
|
Year ended
|
Year ended
|
|||||||||||||||||||||||||||||||
|
December 31, 2009 versus December 31, 2008
|
December 31, 2008 versus December 31, 2007
|
|||||||||||||||||||||||||||||||
|
Average Balance
|
Interest Rate
|
Rate & Balance
|
Total
|
Average Balance
|
Interest Rate
|
Rate & Balance
|
Total
|
|||||||||||||||||||||||||
|
Interest income:
|
||||||||||||||||||||||||||||||||
|
Loans
|
$ | (415 | ) | $ | (2,946 | ) | $ | 37 | $ | (3,324 | ) | $ | 5,613 | $ | (8,433 | ) | $ | (1,275 | ) | $ | (4,095 | ) | ||||||||||
|
Investment securities
|
2,308 | (972 | ) | (717 | ) | 619 | 2,414 | 32 | 142 | 2,588 | ||||||||||||||||||||||
|
Other assets
|
1,614 | (167 | ) | (1,232 | ) | 215 | 22 | (116 | ) | (8 | ) | (102 | ) | |||||||||||||||||||
|
Net change in interest income
|
3,507 | (4,085 | ) | (1,912 | ) | (2,490 | ) | 8,049 | (8,517 | ) | (1,141 | ) | (1,609 | ) | ||||||||||||||||||
|
Interest expense:
|
||||||||||||||||||||||||||||||||
|
Savings accounts
|
1 | (23 | ) | - | (22 | ) | (12 | ) | (171 | ) | 6 | (177 | ) | |||||||||||||||||||
|
Transaction accounts
|
1,997 | 1,115 | 1,234 | 4,346 | 48 | (1,163 | ) | (19 | ) | (1,134 | ) | |||||||||||||||||||||
|
Certificates of deposit
|
(993 | ) | (2,360 | ) | 191 | (3,162 | ) | 1,994 | (2,006 | ) | (318 | ) | (330 | ) | ||||||||||||||||||
|
FHLB advances
|
(192 | ) | 113 | (7 | ) | (86 | ) | 2,878 | (1,700 | ) | (1,410 | ) | (232 | ) | ||||||||||||||||||
|
Subordinated debentures
|
- | - | - | - | - | - | - | - | ||||||||||||||||||||||||
|
Other borrowed funds
|
31 | (101 | ) | (3 | ) | (73 | ) | 1,561 | (65 | ) | (618 | ) | 878 | |||||||||||||||||||
|
Net change in interest expense
|
844 | (1,256 | ) | 1,415 | 1,003 | 6,469 | (5,105 | ) | (2,359 | ) | (995 | ) | ||||||||||||||||||||
|
Change in net interest income
|
$ | 2,663 | $ | (2,829 | ) | $ | (3,327 | ) | $ | (3,493 | ) | $ | 1,580 | $ | (3,412 | ) | $ | 1,218 | $ | (614 | ) | |||||||||||
RESULTS OF OPERATIONS - COMPARISON OF YEAR ENDED DECEMBER 31, 2009 AND DECEMBER 31, 2008
|
Average for the Year Shown
|
||||||||||||
|
Prime
|
Ten-Year Treasury
|
One-Year Treasury
|
||||||||||
|
December 31, 2009
|
3.25 | % | 3.26 | % | 0.47 | % | ||||||
|
December 31, 2008
|
5.09 | % | 3.66 | % | 1.83 | % | ||||||
|
Change in rates
|
-1.84 | % | -0.40 | % | -1.36 | % | ||||||
Interest Rates. The Bank charges borrowers and pays depositors interest rates that are largely a function of the general level of interest rates. The above table sets forth the weekly average interest rates for the 52 weeks ending December 31, 2009 and December 31, 2008 as reported by the Federal Reserve. The Bank typically indexes its adjustable rate commercial loans to prime and its adjustable rate mortgage loans to the one-year treasury rate. The ten-year treasury rate is a proxy for 30-year fixed rate home mortgage loans.
Rates were steady and remained low for 2009 as the Federal Reserve Open Market Committee ("FOMC") left the discount rate at 25 basis points. As of December 31, 2009, the prime rate was 3.25% and unchanged from December 31, 2008.
Interest Income. Total interest income decreased $2,489,956 (7%). The average balance of interest-earning assets increased $94,372,000 (15%) while the yield on average interest earning assets decreased 111 basis points to 4.73%.
8
Guaranty Federal Bancshares, Inc.
Management's Discussion and Analysis of Financial Condition and Results of Operations
The impact of the Federal Reserve's interest rate cuts throughout 2008 adversely impacted the Bank's loan portfolio in 2009, specifically those loans which are directly tied to the prime rate. Interest on loans decreased $3,323,730 (10%) and the average loan receivable balance decreased $6,981,000 (1%) while the average yield decreased 53 basis points to 5.41%. Another factor that has impacted the Company's yield on loans is the level of nonaccrual loans which has increased to $34.3 million as of December 31, 2009, as compared to $20.7 million as of December 31, 2008. Also, during 2009, the Company increased its investment securities and interest-bearing deposits during the year which, because of the low rate environment for investment yields, decreased the average yield on investment securities by 165 basis points as compared to fiscal year 2008.
Interest Expense. Total interest expense increased $1,002,361 (5%) as the average balance of interest-bearing liabilities increased $84,156,000 (15%) while the average cost of interest-bearing liabilities decreased 28 basis points to 3.11%.
The primary increase in interest-bearing liabilities was due to the Bank's strong emphasis on increasing money market accounts through an aggressive deposit campaign. This initiative to improve core deposit liquidity has increased the Bank's interest expense on deposits. Interest expense on deposits increased $1,161,458 (8%) during 2009 as the average balance of interest bearing deposits increased $90,116,000 (22%), but the average interest rate paid to depositors decreased 41 basis points to 3.13%.
The average balance of FHLB advances decreased $7,106,000 (6%) while the average cost of those advances increased 9 basis points to 2.79%. As a result, interest expense on these advances decreased $85,135 (3%). As of December 31, 2009, FHLB advances were 16% of total assets, compared to 20% of total assets as of December 31, 2008.
Net Interest Income. The Company's net interest income decreased $3,492,317 (21%). During the year ended December 31, 2009, the average balance of interest-earning assets exceeded the average balance of interest-bearing liabilities by $57,448,000, resulting in an increase in the average net earning balance of $10,216,000 (22%). In addition, the Company's spread between the average yield on interest-earning assets and the average cost of interest-bearing liabilities decreased by 83 basis points from 2.45% to 1.62%.
Provision for Loan Losses. Provisions for loan losses are charged or credited to earnings to bring the total allowance for loan losses to a level considered adequate by the Company to provide for potential loan losses in the existing loan portfolio. When making its assessment, the Company considers prior loss experience, volume and type of lending, local banking trends and past due loans in the Company's loan portfolio. In addition, the Company considers general economic conditions and other factors related to collectibility of the Company's loan portfolio.
Based on its internal analysis and methodology, management recorded a provision for loan losses of $6,900,000 and $14,744,079 for the years ended December 31, 2009 and 2008, respectively. Provisions recorded in 2009 are due to the Bank's charge-offs during the year, increases in nonperforming loans, continuing concerns over the local and national economy and certain specific borrowers. However, despite growing nonperforming loan balances during 2009, the Company has experienced a significant decline in overall loan balances as of December 31, 2009, as compared to December 31, 2008 (a decline of $32.5 million or 6%). The Company has also experienced lower reserve requirements on newly classified nonperforming credits during the year ended December 31, 2009 and this is reflected in a lower provision requirement for fiscal year 2009, as compared to fiscal year 2008.
The Bank will continue to monitor its allowance for loan losses and make future additions based on economic and regulatory conditions. Management of the Company anticipates the need to continue increasing the allowance for loan losses through charges to the provision for loan losses if growth in the Bank's loan portfolio is experienced or other circumstances warrant. Although the Bank maintains its allowance for loan losses at a level which it considers to be sufficient to provide for potential loan losses in its existing loan portfolio, there can be no assurance that future loan losses will not exceed internal estimates. In addition, the amount of the allowance for loan losses is subject to review by regulatory agencies which can order the establishment of additional loan loss provisions.
Non-Interest Income. Non-interest income increased $1,971,343 (85%). The gain on sale of loans of $1,443,385 for 2009, compared to $875,010 for 2008, was the result of mortgage banking activities related to the sale of single-family conforming residential loans in the secondary market. The Bank attempts to minimize its risk of price changes by committing to sell loans while the loans are in the origination process. Gains on investment securities for the year ended December 31, 2009 were $689,769, compared to a loss of $563,615 for the year ended December 31, 2008. The gains in fiscal 2009 were due to the Company recognizing certain gains in its available-for-sale portfolio to reduce potential credit and interest rate risk issues. The losses in fiscal 2008 were attributable to other-than-temporary impairment charges on its equity securities associated with companies operating in the financial sector. Deposit service charges decreased $225,403 (11%) due primarily to declines in overdraft charges. Loss on foreclosed assets decreased $260,274 (33%) in 2009, but remained elevated primarily due to the difficult market conditions causing sharp declines in real estate values on foreclosed properties held or sold by the Company.
9
Guaranty Federal Bancshares, Inc.
Management's Discussion and Analysis of Financial Condition and Results of Operations
Non-Interest Expense. Non-interest expense increased $1,949,873 (15%). This increase was primarily due to increases in salaries and employee benefits of $434,820 (6%) and FDIC deposit insurance premiums of $1,135,555 (295%).
The increase in compensation was due to additions in several key managerial positions in the areas of commercial lending, credit administration, finance and risk management. However, overall staff decreased from 163 full-time equivalent employees as of December 31, 2008 to 162 full-time equivalent employees as of December 31, 2009.
Increases in FDIC deposit insurance premiums were due to increases in premium rates that began in the first quarter of 2009 and the special assessment that was incurred as of June 30, 2009, and was paid on September 30, 2009.
Income Taxes. The credit for income taxes is a direct result of the Company's taxable loss for the year ended December 31, 2009.
Cash Dividends Paid. The Company did not pay dividends on its common shares during 2009. During 2009, the Company paid $672,917 in dividends on its preferred stock issued under the CPP.
RESULTS OF OPERATIONS - COMPARISON OF YEAR ENDED DECEMBER 31, 2008 AND DECEMBER 31, 2007
|
Average for the Year Shown
|
||||||||||||
|
Prime
|
Ten-Year Treasury
|
One-Year Treasury
|
||||||||||
|
December 31, 2008
|
5.09 | % | 3.66 | % | 1.83 | % | ||||||
|
December 31, 2007
|
8.05 | % | 4.63 | % | 4.53 | % | ||||||
|
Change in rates
|
-2.96 | % | -0.97 | % | -2.70 | % | ||||||
Interest Rates. The above table sets forth the weekly average interest rates for the 52 weeks ending December 31, 2008 and December 31, 2007 as reported by the Federal Reserve.
Rates were steady for the first eight months of 2007, but due to several economic factors, the FOMC began decreasing the discount rate at its September 2007 meeting and continued for each meeting thereafter in 2007. The FOMC continued its aggressive easing of rates in the first quarter of 2008 and then again in the fourth quarter. As of December 31, 2008, the prime rate was 3.25%.
Interest Income. Total interest income decreased $1,609,148 (4%). The average balance of interest-earning assets increased $121,558,000 (24%) while the yield on average interest earning assets decreased 174 basis points to 5.84%.
Interest on loans decreased $4,094,632 (11%) and the average loan receivable balance increased $73,022,000 (15%) while the average yield decreased 175 basis points to 5.94%.
10
Guaranty Federal Bancshares, Inc.
Management's Discussion and Analysis of Financial Condition and Results of Operations
Interest Expense. Total interest expense decreased $995,079 (5%) as the average balance of interest-bearing liabilities increased $129,513,000 (29%) while the average cost of interest-bearing liabilities decreased 121 basis points to 3.39%.
Interest expense on deposits decreased $1,641,062 (10%) as the average balance of interest bearing deposits increased $40,218,000 (11%) and the average interest rate paid to depositors decreased 88 basis points to 3.52%.
The average balance of advances increased $54,382,000 (83%) and the average cost of those advances decreased 259 basis points to 2.70%. As a result, interest expense on these advances decreased $232,062 (7%). As of December 31, 2008 FHLB advances were 20% of total assets, compared to 13% of total assets as of December 31, 2007.
Net Interest Income. The Company's net interest income decreased $614,069 (4%). During the year ended December 31, 2008, the average balance of interest-earning assets exceeded the average balance of interest-bearing liabilities by $47,232,000, resulting in a decrease in the average net earning balance of $7,955,000 (14%). In addition, the Company's spread between the average yield on interest-earning assets and the average cost of interest-bearing liabilities decreased by 53 basis points from 2.98% to 2.45%.
Provision for Loan Losses. Provisions for loan losses are charged or credited to earnings to bring the total allowance for loan losses to a level considered adequate by the Company to provide for potential loan losses in the existing loan portfolio. When making its assessment, the Company considers prior loss experience, volume and type of lending, local banking trends and past due loans in the Company's loan portfolio. In addition, the Company considers general economic conditions and other factors related to collectibility of the Company's loan portfolio.
During the year ended December 31, 2008, the Company experienced loan charge-offs, in excess of recoveries, of $3,978,510 and, based on a review as discussed above, elected to record a provision for loan loss of $14,744,079 to increase the allowance for loan losses to $16,728,492 as of December 31, 2008. The provision for loan losses recorded by the Company during year ended December 31, 2007 was $840,000. The increase in the provision for loan losses was due primarily to the significant increase in impaired and nonperforming loans during 2008. Management of the Company anticipates the need to continue increasing the loan loss allowance in the future through charges to provision for loan losses based on potential increases in problem credits, any growth in its loan portfolio or other circumstances.
Non-Interest Income. Non-interest income decreased $2,412,416 (51%). The gain on sale of loans of $875,010 for 2008, compared to $1,177,017 for 2007, was the result of mortgage banking activities related to the sale of single-family conforming residential loans in the secondary market. The Bank attempts to minimize its risk of price changes by committing to sell loans while the loans are in the origination process. The loss on investments for the year ended December 31, 2008 was $563,615, compared to a gain of $618,363 for the year ended December 31, 2007. The losses in fiscal 2008 were attributable to other-than-temporary impairment charges on its equity securities associated with companies operating in the financial sector. The gains recognized in 2007 were solely due to the sale of shares in FHLMC stock. The Company suspended its sale of its shares in FHLMC stock in the fourth quarter of 2007 due to its significant financial downturn and a sharp decline in the FHLMC stock price. Deposit service charges decreased $187,950 (8%) due primarily to declines in overdraft charges. Loss on foreclosed assets increased $741,922 (1,770%) primarily due to the difficult market conditions causing sharp declines in real estate values on foreclosed properties held or sold by the Company.
Non-Interest Expense. Non-interest expense increased $917,659 (8%). This increase was primarily due to increases in salaries and employee benefits of $443,036 (6%) and FDIC deposit insurance premiums of $342,441 (805%).
The increase in compensation was due to additions in several staff positions in the areas of commercial lending, corporate services, human resources and internal audit with the majority of these new hires beginning in fiscal 2008 or late in fiscal 2007. The staff increased from 150 full-time equivalent employees as of December 31, 2007 to 163 full-time equivalent employees as of December 31, 2008.
11
Guaranty Federal Bancshares, Inc.
Management's Discussion and Analysis of Financial Condition and Results of Operations
Increases in FDIC premiums were due to insurance assessments that began in 2007. Because of credits available to the Company for 2007, these increased costs were not owed by the Company until the first quarter of 2008.
Income Taxes. The credit for income taxes is a direct result of the decrease in the Company's taxable income for the year ended December 31, 2008 as compared to the year ended December 31, 2007.
Cash Dividends Paid. The Company paid dividends of $0.18 per share on April 18, 2008, to stockholders of record as of April 7, 2008, and $0.18 per share on July 18, 2008 to stockholders of record as of July 7, 2008.
ASSET / LIABILITY MANAGEMENT
The goal of the Bank's asset/liability policy is to manage interest rate risk so as to maximize net interest income over time in changing interest rate environments. Management monitors the Bank's net interest spreads (the difference between yields received on assets and paid on liabilities) and, although constrained by market conditions, economic conditions, and prudent underwriting standards, it offers deposit rates and loan rates that maximize net interest income. Management also attempts to fund the Bank's assets with liabilities of a comparable duration to minimize the impact of changing interest rates on the Bank's net interest income. Since the relative spread between financial assets and liabilities is constantly changing, the Bank's current net interest income may not be an indication of future net interest income.
The Bank has continued to emphasize the origination of short-term commercial real estate, construction, commercial business, home equity, consumer and adjustable-rate, one- to four-family residential loans while originating fixed-rate, one- to four-family residential loans primarily for immediate resale in the secondary market.
The Bank constantly monitors its deposits in an effort to decrease their interest rate sensitivity. Rates of interest paid on deposits at the Bank are priced competitively in order to meet the Bank's asset/liability management objectives and spread requirements. As of December 31, 2009 and 2008, the Bank's savings accounts, checking accounts, and money market deposit accounts totaled $298,995,433 or 58% of its total deposits and $138,504,922 or 31% of total deposits, respectively. The weighted average rate paid on these accounts increased 136 basis points from 1.13% on December 31, 2008 to 2.49% on December 31, 2009 primarily due to the Bank's money market deposit campaign. The Bank expects to have the ability to significantly reduce the rate paid on these accounts in 2010 while closely monitoring its liquidity position. The Bank believes, based on historical experience, that a significant portion of such accounts represents non-interest rate sensitive core deposits. The Bank does believe that certain accounts generated from the 2009 money market deposit campaign to be interest rate sensitive, however, the Bank does not have the historical experience with this type of campaign to predict fluctuations based on expected rate reductions.
INTEREST RATE SENSITIVITY ANALYSIS
The following table sets forth as of December 31, 2009, management's estimates of the projected changes in net portfolio value ("NPV") in the event of instantaneous and permanent increases and decreases in market interest rates. Dollar amounts are expressed in thousands.
|
BP Change
|
Estimated Net Portfolio Value
|
NPV as % of PV of Assets
|
|||||||||||||||||||
|
in Rates
|
$ Amount
|
$ Change
|
% Change
|
NPV Ratio
|
Change
|
||||||||||||||||
| +300 | 57,416 | (2,520 | ) | -4 | % | 8.01 | % | -0.10 | % | ||||||||||||
| +200 | 58,222 | (1,714 | ) | -3 | % | 8.04 | % | -0.07 | % | ||||||||||||
| +100 | 58,996 | (940 | ) | -2 | % | 8.07 | % | -0.04 | % | ||||||||||||
|
NC
|
59,936 | - | 0 | % | 8.11 | % | 0.00 | % | |||||||||||||
| -100 | 61,320 | 1,384 | 2 | % | 8.20 | % | 0.09 | % | |||||||||||||
| -200 | 64,410 | 4,474 | 7 | % | 8.52 | % | 0.41 | % | |||||||||||||
Computations of prospective effects of hypothetical interest rate changes are based on an internally generated model using actual maturity and repricing schedules for the Bank's loans and deposits, and are based on numerous assumptions, including relative levels of market interest rates, loan repayments and deposit run-offs, and should not be relied upon as indicative of actual results. Further, the computations do not contemplate any actions the Bank may undertake in response to changes in interest rates.
12
Guaranty Federal Bancshares, Inc.
Management's Discussion and Analysis of Financial Condition and Results of Operations
Management cannot predict future interest rates or their effect on the Bank's NPV in the future. Certain shortcomings are inherent in the method of analysis presented in the computation of NPV. For example, although certain assets and liabilities may have similar maturities or periods to repricing, they may react in differing degrees to changes in market interest rates. Additionally, certain assets, such as adjustable-rate loans, which represent the Bank's primary loan product, have an initial fixed rate period typically from one to five years and over the remaining life of the asset changes in the interest rate are restricted. In addition, the proportion of adjustable-rate loans in the Bank's loan portfolio could decrease in future periods due to refinancing activity if market interest rates remain constant or decrease in the future. Further, in the event of a change in interest rates, prepayment and early withdrawal levels could deviate significantly from those assumed in the table. Finally, the ability of many borrowers to service their adjustable-rate debt may decrease in the event of an interest rate increase.
The Bank's Board of Directors is responsible for reviewing the Bank's asset and liability policies. The Bank's management is responsible for administering the policies and determinations of the Board of Directors with respect to the Bank's asset and liability goals and strategies. Management expects that the Bank's asset and liability policies and strategies will continue as described above so long as competitive and regulatory conditions in the financial institution industry and market interest rates continue as they have in recent years.
LIQUIDITY AND CAPITAL RESOURCES
Liquidity refers to the ability to manage future cash flows to meet the needs of depositors and borrowers and fund operations. Maintaining appropriate levels of liquidity allows the Company to have sufficient funds available for customer demand for loans, withdrawal of deposit balances and maturities of deposits and other liabilities. The Company's primary sources of liquidity include cash and cash equivalents, customer deposits and FHLB borrowings. The Company also has established borrowing lines available from the Federal Reserve Bank which is considered a secondary source of funds.
The Company's most liquid assets are cash and cash equivalents, which are cash on hand, amounts due from financial institutions, and certificates of deposit with other financial institutions that have an original maturity of three months or less. The levels of such assets are dependent on the Bank's operating, financing, and investment activities at any given time. The Company's cash and cash equivalents totaled $33,016,697 as of December 31, 2009 and $15,097,015 as of December 31, 2008, representing an increase of $17,919,682. The Company's interest-bearing deposits totaled $16,560,802 as of December 31, 2009 and $0 as of December 31, 2008. The variations in levels of cash and cash equivalents are influenced by deposit flows and anticipated future deposit flows, which are subject to, and influenced by, many factors.
In addition to the capital necessary to meet the Company's conditional commitments discussed under the caption "Off-Balance Sheet Arrangements" below, the Bank also has $140,285,863 in certificates of deposit that are scheduled to mature in one year or less. Management anticipates that the majority of these certificates will renew in the normal course of operations. Based on existing collateral as well as the FHLB's limitation of advances to 30% of assets, the Bank has the ability to borrow an additional $41,549,000 from the FHLB, as of December 31, 2009. Based on existing collateral, the Bank has the ability to borrow $12,987,000 from the Federal Reserve Bank as of December 31, 2009. The Bank plans to maintain its FHLB and Federal Reserve Bank borrowings to a level that will provide a borrowing capacity sufficient to provide for contingencies.
The Company's Tier 1 capital position of $64,678,000 is 8.8% of average assets as of December 31, 2009. The Company has an excess of $35,324,000, $41,562,000, and $25,740,000 of required regulatory levels of tangible, core, and risk-based capital, respectively. In addition, under current regulatory guidelines, the Bank is classified as well capitalized. See also additional information provided under the caption "Regulatory Matters" in Note 1 of the Notes to Consolidated Financial Statements.
With regards to the securities sold to the Treasury under the CPP, if the Company is unable to redeem the Series A Preferred Stock within five years of its issuance, the cost of capital to the Company will increase significantly from 5% per annum ($850,000 annually) to 9% per annum ($1,530,000 annually). Depending on the Company's financial condition at the time, the increase in the annual dividend rate on the Series A Preferred Stock could have a material adverse effect on the Company's liquidity and net income available to common stockholders.
13
Guaranty Federal Bancshares, Inc.
Management's Discussion and Analysis of Financial Condition and Results of Operations
OFF-BALANCE SHEET ARRANGEMENTS
Various commitments and contingent liabilities arise in the normal course of business, which are not required to be recorded on the balance sheet. The most significant of these are loan commitments, lines of credit and standby letters of credit. Commitments to extend credit are agreements to lend to a customer as long as there is no violation of any condition established in the contract. As of December 31, 2009 and 2008, the Bank had outstanding commitments to originate loans of approximately $5,589,000 and $5,001,000, respectively. Lines of credit are agreements to lend to a customer as long as there is no violation of any condition established in the contract. As of December 31, 2009 and 2008, unused lines of credit to borrowers aggregated approximately $32,539,000 and $49,253,000 for commercial lines and $17,820,000 and $20,829,000 for open-end consumer lines. Since a portion of the loan commitment and line of credit may expire without being drawn upon, the total unused commitments and lines do not necessarily represent future cash requirements.
Standby letters of credit are irrevocable conditional commitments issued by the Bank to guarantee the performance of a customer to a third party. The credit risk involved in issuing standby letters of credit is essentially the same as that involved in extending loans to customers. The Bank had total outstanding standby letters of credit amounting to $15,623,000 and $15,059,000 as of December 31, 2009 and 2008, respectively. The commitments extend over varying periods of time.
In connection with the Company's issuance of the Trust Securities and pursuant to two guarantee agreements by and between the Company and Wilmington Trust Company, the Company issued a limited, irrevocable guarantee of the obligations of each Trust under the Trust Securities whereby the Company has guaranteed any and all payment obligations of the Trusts related to the Trust Securities including distributions on, and the liquidation or redemption price of, the Trust Securities to the extent each Trust does not have funds available.
AGGREGATE CONTRACTUAL OBLIGATIONS
The following table summarizes the Company's fixed and determinable contractual obligations by payment date as of December 31, 2009. Dollar amounts are expressed in thousands.
|
Payments Due By Period
|
||||||||||||||||||||
|
Contractual Obligations
|
Total
|
One Year or less
|
One to Three Years
|
Three to Five Years
|
More than Five Years
|
|||||||||||||||
|
Deposits without stated maturity
|
$ | 298,995 | 298,995 | - | - | - | ||||||||||||||
|
Time and brokered certificates of deposit
|
214,056 | 140,286 | 66,621 | 6,352 | 797 | |||||||||||||||
|
Other borrowings
|
39,750 | - | - | - | 39,750 | |||||||||||||||
|
Federal Home Loan Bank advances
|
116,050 | 23,000 | 25,000 | 15,700 | 52,350 | |||||||||||||||
|
Subordinated debentures
|
15,465 | - | - | - | 15,465 | |||||||||||||||
|
Operating leases
|
356 | 94 | 100 | 75 | 87 | |||||||||||||||
|
Purchase obligations
|
- | - | - | - | - | |||||||||||||||
|
Other long term obligations
|
248,671 | 248,671 | - | - | - | |||||||||||||||
|
Total
|
$ | 933,343 | 711,046 | 91,721 | 22,127 | 108,449 | ||||||||||||||
IMPACT OF INFLATION AND CHANGING PRICES
The Company prepared the consolidated financial statements and related data presented herein in accordance with accounting principles generally accepted in the United States of America which require the measurement of financial position and operating results in terms of historical dollars, without considering changes in the relative purchasing power of money over time due to inflation.
14
Guaranty Federal Bancshares, Inc.
Management's Discussion and Analysis of Financial Condition and Results of Operations
Unlike most companies, the assets and liabilities of a financial institution are primarily monetary in nature. As a result, interest rates have a more significant impact on a financial institution's performance than the effects of general levels of inflation. Interest rates do not necessarily move in the same direction or in the same magnitude as the price of goods and services, since such prices are affected by inflation. In the current interest rate environment, liquidity and the maturity structure of the Bank's assets and liabilities are critical to the maintenance of acceptable performance levels.
CRITICAL ACCOUNTING POLICIES
Management's Discussion and Analysis of Financial Condition and Results of Operations is based upon the Company's consolidated financial statements and the notes thereto, which have been prepared in accordance with accounting principles generally accepted in the United States of America. The preparation of these financial statements requires management to make estimates and judgments that affect the reported amounts of assets and liabilities and the disclosure of contingent assets and liabilities at the date of the financial statements and the reported amounts of revenues and expenses during the reported periods. On an on-going basis, management evaluates its estimates and judgments.
Management bases its estimates and judgments on historical experience and on various other factors that are believed to be reasonable under the circumstances, the results of which form the basis for making judgments about the carrying values of assets and liabilities that are not readily apparent from other sources. There can be no assurance that actual results will not differ from those estimates. If actual results are different than management's judgements and estimates, the Company's financial results could change, and such change could be material to the Company.
Material estimates and judgments that are particularly susceptible to significant change relate to the determination of the allowance for loan losses. In connection with the determination of the allowance for loan losses, management obtains independent appraisals for significant properties.
The Company has identified the accounting policies for the allowance for loan losses and related significant estimates and judgments as critical to its business operations and the understanding of its results of operations. For a detailed discussion on the application of these significant estimates and judgments and our accounting policies, also see Note 1 of the notes to consolidated financial statements in this report.
IMPACT OF NEW ACCOUNTING PRONOUNCEMENTS
In June 2009, the Financial Accounting Standards Board (FASB) issued Accounting Standards Update (ASU) No. 2009-1 (formerly SFAS No. 168), "Topic 105 - Generally Accepted Accounting Principles - Accounting Standards Codification and the Hierarchy of Generally Accepted Principles." This standard establishes the FASB Accounting Standards Codification (ASC) as the single source of authoritative U.S. generally accepted accounting principles (GAAP) to be applied by nongovernmental entities. Rules and interpretative releases of the SEC under authority of federal securities laws are also sources of authoritative guidance for SEC registrants. The Codification does not change current GAAP, but is intended to simplify user access to all authoritative GAAP by providing all the authoritative literature related to a particular topic in one place. All non-grandfathered, non-SEC accounting literature not included in the Codification will become non-authoritative. The standard was effective for the third quarter of 2009 and did not have a material impact on the Company's consolidated financial statements. However, the appropriate changes to GAAP references have been made to the consolidated financial statements.
In June 2009, the FASB issued SFAS No. 167, "Amendments to FASB Interpretation No. 46R"(not yet reflected in FASB ASC). The standard amends FIN No. 46R to require a company to analyze whether its interest in a variable interest entity ("VIE") gives it a controlling financial interest. A company must assess whether it has an implicit financial responsibility to ensure that the VIE operates as designed when determining whether it has the power to direct the activities of the VIE that significantly impact its economic performance. Ongoing reassessments of whether a company is the primary beneficiary are also required by the standard. SFAS No. 167 amends the criteria to qualify as a primary beneficiary as well as how to determine the existence of a VIE. This Statement will be effective as of the beginning of each reporting entity's first annual reporting period that begins after November 15, 2009, for interim periods within the first annual reporting period, and for interim and annual reporting periods thereafter. Earlier application is not permitted.
15
Guaranty Federal Bancshares, Inc.
Management's Discussion and Analysis of Financial Condition and Results of Operations
In August 2009, the FASB issued ASU 2009-05, "Fair Value Measurements and Disclosures (Topic 820) – Measuring Liabilities at Fair Value" to provide guidance when estimating the fair value of a liability. When a quoted price in an active market for the identical liability is not available, fair value should be measured using:
|
·
|
the quoted price of an identical liability when traded as an asset,
|
|
·
|
quoted prices of similar liabilities or similar liabilities when traded as assets, or
|
|
·
|
another valuation technique consistent with the principles of Topic 820 such as an income approach or a market approach.
|
If a restriction exists that prevents the transfer of the liability, a separate adjustment related to the restriction is not required when estimating fair value. The ASU was effective for the Company on October 1, 2009. Its adoption had no material impact on the Company's consolidated financial statements.
SUMMARY OF UNAUDITED QUARTERLY OPERATING RESULTS
|
Year Ended December 31, 2009, Quarter ended
|
||||||||||||||||
|
Mar-09
|
Jun-09
|
Sep-09
|
Dec-09
|
|||||||||||||
|
Interest income
|
$ | 8,323,301 | $ | 8,504,112 | $ | 8,534,335 | $ | 8,511,688 | ||||||||
|
Interest expense
|
5,307,991 | 5,204,374 | 5,086,082 | 4,928,138 | ||||||||||||
|
Net interest income
|
3,015,310 | 3,299,738 | 3,448,253 | 3,583,550 | ||||||||||||
|
Provision for loan losses
|
980,000 | 3,300,000 | 670,000 | 1,950,000 | ||||||||||||
|
Gain on loans and investment securities
|
355,410 | 759,812 | 656,036 | 361,896 | ||||||||||||
|
Other noninterest income, net
|
453,562 | 762,651 | 674,332 | 263,795 | ||||||||||||
|
Noninterest expense
|
3,744,565 | 4,035,322 | 3,391,956 | 3,537,840 | ||||||||||||
|
Income (loss) before income taxes
|
(900,283 | ) | (2,513,121 | ) | 716,665 | (1,278,599 | ) | |||||||||
|
Provision (credit) for income taxes
|
(308,163 | ) | (881,039 | ) | 142,202 | (587,620 | ) | |||||||||
|
Net income (loss)
|
(592,120 | ) | (1,632,082 | ) | 574,463 | (690,979 | ) | |||||||||
|
Preferred stock dividends and discount accretion
|
187,594 | 281,390 | 281,391 | 281,391 | ||||||||||||
|
Net income (loss) available to common shareholders
|
$ | (779,714 | ) | $ | (1,913,472 | ) | $ | 293,072 | $ | (972,370 | ) | |||||
|
Basic earnings (loss) per share
|
$ | (0.30 | ) | $ | (0.73 | ) | $ | 0.11 | $ | (0.37 | ) | |||||
|
Diluted earnings (loss) per share
|
$ | (0.30 | ) | $ | (0.73 | ) | $ | 0.11 | $ | (0.37 | ) | |||||
|
Year Ended December 31, 2008, Quarter ended
|
||||||||||||||||
|
Mar-08
|
Jun-08
|
Sep-08
|
Dec-08
|
|||||||||||||
|
Interest income
|
$ | 9,231,033 | $ | 8,925,204 | $ | 9,267,799 | $ | 8,939,356 | ||||||||
|
Interest expense
|
5,201,066 | 4,811,710 | 4,747,203 | 4,764,245 | ||||||||||||
|
Net interest income
|
4,029,967 | 4,113,494 | 4,520,596 | 4,175,111 | ||||||||||||
|
Provision for loan losses
|
820,000 | 5,684,079 | 1,675,000 | 6,565,000 | ||||||||||||
|
Gain (loss) on sale of loans and investment securities
|
231,077 | 159,640 | 207,870 | (287,192 | ) | |||||||||||
|
Other noninterest income, net
|
650,774 | 660,770 | 641,024 | 52,188 | ||||||||||||
|
Noninterest expense
|
3,101,408 | 3,213,100 | 3,167,272 | 3,278,030 | ||||||||||||
|
Income (loss) before income taxes
|
990,410 | (3,963,275 | ) | 527,218 | (5,902,923 | ) | ||||||||||
|
Provision (credit) for income taxes
|
373,552 | (1,466,995 | ) | 227,759 | (2,123,175 | ) | ||||||||||
|
Net income (loss)
|
$ | 616,858 | $ | (2,496,280 | ) | $ | 299,459 | $ | (3,779,748 | ) | ||||||
|
Basic earnings (loss) per share
|
$ | 0.24 | $ | (0.96 | ) | $ | 0.11 | $ | (1.45 | ) | ||||||
|
Diluted earnings (loss) per share
|
$ | 0.23 | $ | (0.96 | ) | $ | 0.11 | $ | (1.45 | ) | ||||||
16
Guaranty Federal Bancshares, Inc.
Consolidated Balance Sheets
December 31, 2009 and 2008
|
December 31, 2009
|
December 31, 2008
|
|||||||
|
ASSETS
|
||||||||
|
Cash and due from banks
|
$ | 4,527,813 | $ | 3,826,567 | ||||
|
Interest-bearing deposits in other financial institutions
|
28,488,884 | 11,270,448 | ||||||
|
Cash and cash equivalents
|
33,016,697 | 15,097,015 | ||||||
|
Interest-bearing deposits
|
16,560,802 | - | ||||||
|
Available-for-sale securities
|
102,659,251 | 65,505,339 | ||||||
|
Held-to-maturity securities
|
472,783 | 556,465 | ||||||
|
Stock in Federal Home Loan Bank, at cost
|
5,976,600 | 6,730,100 | ||||||
|
Mortgage loans held for sale
|
3,465,080 | 1,933,798 | ||||||
|
Loans receivable, net of allowance for loan losses of December 31, 2009 and 2008 - $14,076,123 and $16,728,492, respectively
|
525,038,053 | 556,393,243 | ||||||
|
Accrued interest receivable:
|
||||||||
|
Loans
|
2,014,418 | 2,310,062 | ||||||
|
Investments
|
657,145 | 322,388 | ||||||
|
Prepaid expenses and other assets
|
6,731,409 | 4,065,359 | ||||||
|
Prepaid FDIC deposit insurance premiums
|
4,135,875 | - | ||||||
|
Foreclosed assets held for sale
|
6,759,648 | 5,655,257 | ||||||
|
Premises and equipment
|
11,817,516 | 11,323,463 | ||||||
|
Bank owned life insurance
|
10,069,540 | - | ||||||
|
Income taxes receivable
|
3,718,970 | 9,091 | ||||||
|
Deferred income taxes
|
4,686,065 | 5,768,813 | ||||||
| $ | 737,779,852 | $ | 675,670,393 | |||||
|
LIABILITIES AND STOCKHOLDERS' EQUITY
|
||||||||
|
LIABILITIES
|
||||||||
|
Deposits
|
$ | 513,051,102 | $ | 447,079,469 | ||||
|
Federal Home Loan Bank advances
|
116,050,000 | 132,436,000 | ||||||
|
Securities sold under agreements to repurchase
|
39,750,000 | 39,750,000 | ||||||
|
Subordinated debentures
|
15,465,000 | 15,465,000 | ||||||
|
Notes payable
|
- | 1,435,190 | ||||||
|
Advances from borrowers for taxes and insurance
|
135,610 | 166,327 | ||||||
|
Accrued expenses and other liabilities
|
519,385 | 448,226 | ||||||
|
Accrued interest payable
|
1,398,122 | 1,577,279 | ||||||
| 686,369,219 | 638,357,491 | |||||||
|
COMMITMENTS AND CONTINGENCIES
|
- | - | ||||||
|
STOCKHOLDERS' EQUITY
|
||||||||
|
Capital Stock:
|
||||||||
|
Series A preferred stock, $0.01 par value; authorized 2,000,000 shares; issued and outstanding December 31, 2009 - 17,000 shares
|
15,874,788 | - | ||||||
|
Common stock, $0.10 par value; authorized 10,000,000 shares; issued December 31, 2009 and 2008 - 6,779,800 shares;
|
677,980 | 677,980 | ||||||
|
Common stock warrants; December 31, 2009 - 459,459 shares
|
1,377,811 | - | ||||||
|
Additional paid-in capital
|
58,523,646 | 58,535,159 | ||||||
|
Unearned ESOP shares
|
(660,930 | ) | (888,930 | ) | ||||
|
Retained earnings, substantially restricted
|
35,741,705 | 39,114,189 | ||||||
|
Accumulated other comprehensive income
|
||||||||
|
Unrealized appreciation on available-for-sale securities and effect of interest rate swaps, net of income taxes; December 31, 2009 and 2008 - $996,342 and $991,281, respectively
|
1,696,502 | 1,687,858 | ||||||
| 113,231,502 | 99,126,256 | |||||||
|
Treasury stock, at cost; December 31, 2009 and December 31, 2008 -4,079,067 and 4,077,567 shares, respectively
|
(61,820,869 | ) | (61,813,354 | ) | ||||
| 51,410,633 | 37,312,902 | |||||||
| $ | 737,779,852 | $ | 675,670,393 | |||||
See Notes to Consolidated Financial Statements
17
Guaranty Federal Bancshares, Inc.
Consolidated Statements of Operations
Years Ended December 31, 2009, 2008 and 2007
|
2009
|
2008
|
2007
|
||||||||||
|
Interest Income
|
||||||||||||
|
Loans
|
$ | 29,695,487 | $ | 33,019,217 | $ | 37,113,849 | ||||||
|
Investment securities
|
3,743,688 | 3,124,862 | 537,176 | |||||||||
|
Other
|
434,261 | 219,313 | 321,515 | |||||||||
| 33,873,436 | 36,363,392 | 37,972,540 | ||||||||||
|
Interest Expense
|
||||||||||||
|
Deposits
|
15,381,190 | 14,219,732 | 15,860,794 | |||||||||
|
Federal Home Loan Bank advances
|
3,152,354 | 3,237,489 | 3,469,551 | |||||||||
|
Subordinated debentures
|
1,023,783 | 1,023,783 | 1,023,783 | |||||||||
|
Other
|
969,258 | 1,043,220 | 165,175 | |||||||||
| 20,526,585 | 19,524,224 | 20,519,303 | ||||||||||
|
Net Interest Income
|
13,346,851 | 16,839,168 | 17,453,237 | |||||||||
|
Provision for Loan Losses
|
6,900,000 | 14,744,079 | 840,000 | |||||||||
|
Net Interest Income After
|
||||||||||||
|
Provision for Loan Losses
|
6,446,851 | 2,095,089 | 16,613,237 | |||||||||
|
Noninterest Income
|
||||||||||||
|
Service charges
|
1,802,288 | 2,027,691 | 2,215,641 | |||||||||
|
Other fees
|
52,233 | 40,129 | 90,360 | |||||||||
|
Gain (loss) on investment securities
|
689,769 | (563,615 | ) | 618,363 | ||||||||
|
Gain on sale of loans
|
1,443,385 | 875,010 | 1,177,017 | |||||||||
|
Loss on foreclosed assets
|
(523,557 | ) | (783,831 | ) | (41,909 | ) | ||||||
|
Other income
|
823,376 | 720,767 | 669,095 | |||||||||
| 4,287,494 | 2,316,151 | 4,728,567 | ||||||||||
|
Noninterest Expense
|
||||||||||||
|
Salaries and employee benefits
|
7,952,105 | 7,517,285 | 7,074,249 | |||||||||
|
Occupancy
|
1,806,100 | 1,682,277 | 1,614,403 | |||||||||
|
FDIC deposit insurance premiums
|
1,520,551 | 384,996 | 42,555 | |||||||||
|
Data processing
|
423,205 | 374,123 | 391,679 | |||||||||
|
Advertising
|
316,666 | 399,996 | 399,996 | |||||||||
|
Other expense
|
2,691,056 | 2,401,133 | 2,319,269 | |||||||||
| 14,709,683 | 12,759,810 | 11,842,151 | ||||||||||
|
Income (Loss) Before Income Taxes
|
(3,975,338 | ) | (8,348,570 | ) | 9,499,653 | |||||||
|
Provision (Credit) for Income Taxes
|
(1,634,620 | ) | (2,988,859 | ) | 3,399,771 | |||||||
|
Net Income (Loss)
|
$ | (2,340,718 | ) | $ | (5,359,711 | ) | $ | 6,099,882 | ||||
|
Preferred Stock Dividends and Discount Accretion
|
1,031,766 | - | - | |||||||||
|
Net Income (Loss) Available to Common Shareholders
|
$ | (3,372,484 | ) | $ | (5,359,711 | ) | $ | 6,099,882 | ||||
|
Basic Income (Loss) Per Common Share
|
$ | (1.29 | ) | $ | (2.06 | ) | $ | 2.25 | ||||
|
Diluted Income (Loss) Per Common Share
|
$ | (1.29 | ) | $ | (2.06 | ) | $ | 2.19 | ||||
See Notes to Consolidated Financial Statements
18
Guaranty Federal Bancshares, Inc.
Consolidated Statements of Cash Flows
Years Ended December 31, 2009, 2008 and 2007
|
2009
|
2008
|
2007
|
||||||||||
|
CASH FLOWS FROM OPERATING ACTIVITIES
|
||||||||||||
|
Net income (loss)
|
$ | (2,340,718 | ) | $ | (5,359,711 | ) | $ | 6,099,882 | ||||
|
Items not requiring (providing) cash:
|
||||||||||||
|
Deferred income taxes
|
701,199 | (4,143,816 | ) | (187,839 | ) | |||||||
|
Depreciation
|
965,504 | 934,941 | 902,322 | |||||||||
|
Provision for loan losses
|
6,900,000 | 14,744,079 | 840,000 | |||||||||
|
Gain on sale of loans and investment securities
|
(2,133,154 | ) | (777,222 | ) | (1,795,380 | ) | ||||||
|
Other than temporary impairment on investment securities
|
- | 465,827 | - | |||||||||
|
Loss (gain) on sale of foreclosed assets
|
285,010 | 627,888 | (4,621 | ) | ||||||||
|
Accretion of gain on termination of interest rate swaps
|
(1,017,492 | ) | (169,582 | ) | - | |||||||
|
Amortization of deferred income, premiums and discounts, net
|
352,345 | (47,702 | ) | 108,733 | ||||||||
|
Stock award plans
|
95,268 | 92,846 | 71,325 | |||||||||
|
Origination of loans held for sale
|
(78,535,230 | ) | (51,082,040 | ) | (71,861,627 | ) | ||||||
|
Proceeds from sale of loans held for sale
|
78,447,333 | 52,165,250 | 73,901,281 | |||||||||
|
Release of ESOP shares
|
121,219 | 408,388 | 672,765 | |||||||||
|
Increase in cash surrender value of bank owned life insurance
|
(69,540 | ) | - | - | ||||||||
|
Changes in:
|
||||||||||||
|
Prepaid FDIC deposit insurance premiums
|
(4,135,875 | ) | - | - | ||||||||
|
Accrued interest receivable
|
(39,113 | ) | 690,998 | (413,139 | ) | |||||||
|
Prepaid expenses and other assets
|
767,817 | 372,439 | 114,073 | |||||||||
|
Accrued expenses and other liabilities
|
(214,248 | ) | (67,163 | ) | 235,832 | |||||||
|
Income taxes payable
|
(3,333,407 | ) | (519,838 | ) | 1,051,189 | |||||||
|
Net cash provided by (used in) operating activities
|
(3,183,082 | ) | 8,335,582 | 9,734,796 | ||||||||
|
CASH FLOWS FROM INVESTING ACTIVITIES
|
||||||||||||
|
Net change in loans
|
18,959,641 | (64,369,071 | ) | (39,788,084 | ) | |||||||
|
Principal payments on held-to-maturity securities
|
83,682 | 98,467 | 108,250 | |||||||||
|
Principal payments on available-for-sale securities
|
13,087,448 | 2,373,721 | 376,625 | |||||||||
|
Purchase of available-for-sale securities
|
(82,769,479 | ) | (55,463,436 | ) | (11,926,192 | ) | ||||||
|
Proceeds from sales of available-for-sale securities
|
25,356,214 | - | 1,128,153 | |||||||||
|
Proceeds from maturities of available-for-sale securities
|
8,500,000 | 2,100,000 | 2,580,000 | |||||||||
|
Purchase of premises and equipment
|
(1,459,557 | ) | (2,816,054 | ) | (2,476,863 | ) | ||||||
|
Purchase of tax credit investments
|
(3,433,867 | ) | (1,596,387 | ) | - | |||||||
|
Purchase of interest bearing deposits
|
(34,605,802 | ) | - | - | ||||||||
|
Proceeds from maturities of interest bearing deposits
|
18,045,000 | - | - | |||||||||
|
Purchase of bank owned life insurance
|
(10,000,000 | ) | - | - | ||||||||
|
Proceeds from termination of interest rate swaps
|
- | 1,695,836 | - | |||||||||
|
(Purchase) redemption of FHLB stock
|
753,500 | (2,715,400 | ) | 1,368,000 | ||||||||
|
Capitalized costs on foreclosed assets held for sale
|
(122,162 | ) | - | - | ||||||||
|
Proceeds from sale of foreclosed assets held for sale
|
4,268,852 | 1,827,560 | 1,453,674 | |||||||||
|
Net cash used in investing activities
|
(43,336,530 | ) | (118,864,764 | ) | (47,176,437 | ) | ||||||
19
Guaranty Federal Bancshares, Inc.
Consolidated Statements of Cash Flows (continued)
Years Ended December 31, 2009, 2008 and 2007
|
2009
|
2008
|
2007
|
||||||||||
|
CASH FLOWS FROM FINANCING ACTIVITIES
|
||||||||||||
|
Net increase (decrease) in demand deposits,
|
|
|
|
|||||||||
|
NOW accounts and savings accounts
|
$ | 160,490,510 | $ | (3,267,786 | ) | $ | 12,779,497 | |||||
|
Net increase (decrease) in certificates of deposit
|
(94,518,877 | ) | 32,155,971 | 53,182,151 | ||||||||
|
Net increase in securities sold under agreements to repurchase
|
- | 29,900,705 | 8,146,074 | |||||||||
|
Proceeds from FHLB advances
|
5,000,000 | 2,243,650,075 | 1,855,538,600 | |||||||||
|
Repayments of FHLB advances
|
(21,386,000 | ) | (2,187,300,075 | ) | (1,887,452,600 | ) | ||||||
|
Proceeds from issuance of notes payable
|
- | 1,064,000 | 2,468,000 | |||||||||
|
Repayments of notes payable
|
(1,435,190 | ) | (347,000 | ) | (1,749,810 | ) | ||||||
|
Advances from borrowers for taxes and insurance
|
(30,717 | ) | 8,516 | (65,058 | ) | |||||||
|
Proceeds from issuance preferred stock and warrants
|
17,000,000 | - | - | |||||||||
|
Stock options exercised
|
- | 578,661 | 1,118,762 | |||||||||
|
Common and preferred cash dividends paid
|
(672,917 | ) | (1,397,922 | ) | (1,879,256 | ) | ||||||
|
Treasury stock purchased
|
(7,515 | ) | (1,465,150 | ) | (7,479,118 | ) | ||||||
|
Net cash provided by financing activities
|
64,439,294 | 113,579,995 | 34,607,242 | |||||||||
|
INCREASE (DECREASE) IN CASH AND CASH EQUIVALENTS
|
17,919,682 | 3,050,813 | (2,834,399 | ) | ||||||||
|
CASH AND CASH EQUIVALENTS, BEGINNING OF YEAR
|
15,097,015 | 12,046,202 | 14,880,601 | |||||||||
|
CASH AND CASH EQUIVALENTS, END OF YEAR
|
$ | 33,016,697 | $ | 15,097,015 | $ | 12,046,202 | ||||||
|
Supplemental Cash Flows Information
|
||||||||||||
|
Real estate acquired in settlement of loans
|
$ | 5,536,091 | $ | 7,383,283 | $ | 2,003,838 | ||||||
|
Interest paid
|
$ | 20,705,742 | $ | 19,740,608 | $ | 20,140,586 | ||||||
|
Income taxes paid, net
|
$ | 496,661 | $ | 1,525,017 | $ | 2,563,603 | ||||||
|
Common stock dividends declared and unpaid
|
$ | - | $ | - | $ | 469,373 | ||||||
|
Sale and financing of foreclosed assets held for sale
|
$ | 315,000 | $ | - | $ | - | ||||||
See Notes to Consolidated Financial Statements
20
Guaranty Federal Bancshares, Inc.
Consolidated Statements of Stockholders’ Equity
Years Ended December 31, 2009, 2008 and 2007
|
Preferred Stock
|
Common Stock
|
Common Stock Warrants
|
Additional Paid-In Capital
|
Unearned ESOP Shares
|
Treasury Stock
|
Retained Earnings
|
Accumulated Other Comprehensive Income
|
Total
|
||||||||||||||||||||||||||||
|
Balance, January 1, 2007
|
$ | - | $ | 665,353 | $ | - | $ | 55,730,352 | $ | (1,344,930 | ) | $ | (52,869,086 | ) | $ | 41,183,006 | $ | 1,534,548 | $ | 44,899,243 | ||||||||||||||||
|
Comprehensive income
|
||||||||||||||||||||||||||||||||||||
|
Net income
|
- | - | - | - | - | - | 6,099,882 | - | 6,099,882 | |||||||||||||||||||||||||||
|
Change in unrealized appreciation on available-for-sale securities,net of income taxes of ($605,380)
|
- | - | - | - | - | - | - | (1,030,781 | ) | (1,030,781 | ) | |||||||||||||||||||||||||
|
Total comprehensive income
|
5,069,101 | |||||||||||||||||||||||||||||||||||
|
Dividends ($0.70 per share)
|
- | - | - | - | - | - | (1,880,439 | ) | - | (1,880,439 | ) | |||||||||||||||||||||||||
|
Stock award plans
|
- | - | - | 286,346 | - | - | - | - | 286,346 | |||||||||||||||||||||||||||
|
Stock options exercised
|
- | 8,296 | - | 1,110,466 | - | - | - | - | 1,118,762 | |||||||||||||||||||||||||||
|
Release of ESOP shares
|
- | - | - | 444,765 | 228,000 | - | - | - | 672,765 | |||||||||||||||||||||||||||
|
Treasury stock purchased
|
- | - | - | - | - | (7,479,118 | ) | - | - | (7,479,118 | ) | |||||||||||||||||||||||||
|
Balance, December 31, 2007
|
- | 673,649 | - | 57,571,929 | (1,116,930 | ) | (60,348,204 | ) | 45,402,449 | 503,767 | 42,686,660 | |||||||||||||||||||||||||
|
Comprehensive income (loss)
|
||||||||||||||||||||||||||||||||||||
|
Net loss
|
- | - | - | - | - | - | (5,359,711 | ) | - | (5,359,711 | ) | |||||||||||||||||||||||||
|
Change in unrealized appreciation on available-for-sale securities and interest rate swaps, net of income taxes of $695,418
|
- | - | - | - | - | - | - | 1,184,091 | 1,184,091 | |||||||||||||||||||||||||||
|
Total comprehensive loss
|
(4,175,620 | ) | ||||||||||||||||||||||||||||||||||
|
Dividends ($0.36 per share)
|
- | - | - | - | - | - | (928,549 | ) | - | (928,549 | ) | |||||||||||||||||||||||||
|
Stock award plans
|
- | - | - | 208,512 | - | - | - | - | 208,512 | |||||||||||||||||||||||||||
|
Stock options exercised
|
- | 4,331 | - | 574,330 | - | - | - | - | 578,661 | |||||||||||||||||||||||||||
|
Release of ESOP shares
|
- | - | - | 180,388 | 228,000 | - | - | - | 408,388 | |||||||||||||||||||||||||||
|
Treasury stock purchased
|
- | - | - | - | - | (1,465,150 | ) | - | - | (1,465,150 | ) | |||||||||||||||||||||||||
|
Balance, December 31, 2008
|
- | 677,980 | - | 58,535,159 | (888,930 | ) | (61,813,354 | ) | 39,114,189 | 1,687,858 | 37,312,902 | |||||||||||||||||||||||||
|
Comprehensive income (loss)
|
||||||||||||||||||||||||||||||||||||
|
Net loss
|
- | - | - | - | - | - | (2,340,718 | ) | - | (2,340,718 | ) | |||||||||||||||||||||||||
|
Change in unrealized appreciation on available-for-sale securities and interest rate swaps, net of income taxes of $5,061
|
- | - | - | - | - | - | - | 8,644 | 8,644 | |||||||||||||||||||||||||||
|
Total comprehensive loss
|
(2,332,074 | ) | ||||||||||||||||||||||||||||||||||
|
Preferred stock issued
|
15,622,189 | - | - | - | - | - | - | - | 15,622,189 | |||||||||||||||||||||||||||
|
Common stock warrants issued
|
- | - | 1,377,811 | - | - | - | - | - | 1,377,811 | |||||||||||||||||||||||||||
|
Preferred stock discount accretion
|
252,599 | - | - | - | - | - | (252,599 | ) | - | - | ||||||||||||||||||||||||||
|
Preferred stock dividends
|
- | - | - | - | - | - | (779,167 | ) | - | (779,167 | ) | |||||||||||||||||||||||||
|
Stock award plans
|
- | - | - | 95,268 | - | - | - | - | 95,268 | |||||||||||||||||||||||||||
|
Release of ESOP shares
|
- | - | - | (106,781 | ) | 228,000 | - | - | - | 121,219 | ||||||||||||||||||||||||||
|
Treasury stock purchased
|
- | - | - | - | - | (7,515 | ) | - | - | (7,515 | ) | |||||||||||||||||||||||||
|
Balance, December 31, 2009
|
$ | 15,874,788 | $ | 677,980 | $ | 1,377,811 | $ | 58,523,646 | $ | (660,930 | ) | $ | (61,820,869 | ) | $ | 35,741,705 | $ | 1,696,502 | $ | 51,410,633 | ||||||||||||||||
See Notes to Consolidated Financial Statements
21
Guaranty Federal Bancshares, Inc.
Notes to Consolidated Financial Statements
NOTE 1: NATURE OF OPERATIONS AND SUMMARY OF SIGNIFICANT ACCOUNTING POLICIES
Nature of Operations
The Company operates as a one-bank holding company. The Bank is primarily engaged in providing a full range of banking and mortgage services to individual and corporate customers in southwest Missouri. The Bank is subject to competition from other financial institutions. The Company and the Bank are also subject to the regulation of certain federal and state agencies and receive periodic examinations by those regulatory authorities.
Principles of Consolidation
The consolidated financial statements include the accounts of the Company and its wholly owned subsidiary, the Bank. All significant intercompany profits, transactions and balances have been eliminated in consolidation.
Use of Estimates
The preparation of financial statements in conformity with accounting principles generally accepted in the United States of America requires management to make estimates and assumptions that affect the reported amounts of assets and liabilities and disclosure of contingent assets and liabilities at the date of the financial statements and the reported amounts of revenues and expenses during the reporting period. Actual results could differ from those estimates.
Material estimates that are particularly susceptible to significant change in the near term relate to the determination of the allowance for loan losses, the valuation of real estate acquired in connection with foreclosures or in satisfaction of loans and fair values. In connection with the determination of the allowance for loan losses and the valuation of foreclosed assets held for sale, management obtains independent appraisals for significant properties.
Securities
Certain debt securities that management has the positive intent and ability to hold to maturity are classified as "held to maturity" and recorded at amortized cost. Securities not classified as held to maturity are classified as "available-for-sale" and are carried at fair value, with unrealized gains and losses excluded from earnings and reported in other comprehensive income. Purchase premiums are recognized in interest income using the interest method over the terms of the securities. Gains and losses on the sale of securities are recorded on the trade date and are determined using the specific identification method.
Effective April 1, 2009, the Company adopted new accounting guidance related to recognition and presentation of other-than-temporary impairment (ASC 320-10). When the Company does not intend to sell a debt security, and it is more likely than not, the Company will not have to sell the security before a recovery of its cost basis, it recognizes the credit component of an other-than-temporary impairment of a debt security in earnings and the remaining portion in other comprehensive income. For held-to-maturity debt securities, the amount of an other-than-temporary impairment recorded in other comprehensive income for the noncredit portion of a previous other-than-temporary impairment is amortized prospectively over the remaining life of the security on the basis of the timing of future estimated cash flows of the security.
As a result of this guidance, the Company's consolidated statement of operations as of December 31, 2009, reflects the full impairment (that is, the difference between the security's amortized cost basis and fair value) on debt securities that the Company intends to sell or would more likely than not be required to sell before the expected recovery of the amortized cost basis. For available-for-sale and held-to-maturity debt securities that management has no intent to sell and believes that it more likely than not will not be required to sell prior to recovery, only the credit loss component of the impairment is recognized in earnings, while the noncredit loss is recognized in accumulated other comprehensive income. The credit loss component recognized in earnings is identified as the amount of principal cash flows not expected to be received over the remaining term of the security as projected based on cash flow projections.
22
Guaranty Federal Bancshares, Inc.
Notes to Consolidated Financial Statements
Prior to the adoption of the recent accounting guidance on April 1, 2009, management considered, in determining whether other-than-temporary impairment exists, (1) the length of time and extent to which the fair value has been less than cost, (2) the financial condition and near-term prospects of the issuer and (3) the intent and ability of the Company to retain its investment in the issuer for a period of time sufficient to allow for any anticipated recovery in fair value.
Mortgage Loans Held for Sale
Mortgage loans held for sale are carried at the lower of cost or fair value, determined using an aggregate basis. Write-downs to fair value are recognized as a charge to earnings at the time a decline in value occurs. Forward commitments to sell mortgage loans are sometimes acquired to reduce market risk on mortgage loans in the process of origination and mortgage loans held for sale. Gains and losses resulting from sales of mortgage loans are recognized when the respective loans are sold to investors. Gains and losses are determined by the difference between the selling price and the carrying amounts of the loans sold, and are recorded in noninterest income. Direct loan origination costs and fees are deferred at origination of the loan and are recognized in noninterest income upon sale of the loan.
Loans
For loans amortized at cost, interest income is accrued based on the unpaid principal balance. Loan origination fees net of certain direct origination costs, are deferred and amortized as a level yield adjustment over the respective term of the loan.
The accrual of interest on loans is discontinued at the time the loan is 90 days past due unless the credit is well-secured and in process of collection. Past due status is based on contractual terms of the loan. In all cases, loans are placed on nonaccrual or charged off at an earlier date if collection of principal or interest is considered doubtful.
All interest accrued but not collected for loans that are placed on nonaccrual or charged off is reversed against interest income. The interest on these loans is accounted for on the cash-basis or cost-recovery method, until qualifying for return to accrual. Loans are returned to accrual status when all the principal and interest amounts contractually due are brought current and future payments are reasonably assured.
Allowance for Loan Losses
The allowance for loan losses is established as losses are estimated to have occurred through a provision for loan losses charged to income. Loan losses are charged against the allowance when management believes the uncollectibility of a loan balance is confirmed. Subsequent recoveries, if any, are credited to the allowance.
The allowance for loan losses is evaluated on a regular basis by management and is based upon management's periodic review of the collectibility of the loans in light of historical experience, the nature and volume of the loan portfolio, adverse situations that may affect the borrower's ability to repay, estimated value of any underlying collateral and prevailing economic conditions. This evaluation is inherently subjective as it requires estimates that are susceptible to significant revision as more information becomes available.
The allowance consists of allocated and general components. The allocated component relates to loans that are classified as impaired. For those loans that are classified as impaired, an allowance is established when the discounted cash flows (or collateral value or observable market price) of the impaired loan is lower than the carrying value of that loan. The general component covers nonclassified loans and is based on historical charge-off experience and expected loss given default derived from the Bank's internal risk rating process. Other adjustments may be made to the allowance for pools of loans after an assessment of internal or external influences on credit quality that are not fully reflected in the historical loss or risk rating data.
A loan is considered impaired when, based on current information and events, it is probable that the Bank will be unable to collect the scheduled payments of principal or interest when due according to the contractual terms of the loan agreement. Factors considered by management in determining impairment include payment status, collateral value and the probability of collecting scheduled principal and interest payments when due. Loans that experience insignificant payment delays and payment shortfalls generally are not classified as impaired. Management determines the significance of payment delays and payment shortfalls on a case-by-case basis, taking into consideration all of the circumstances surrounding the loan and the borrower, including the length of the delay, the reasons for the delay, the borrower's prior payment record and the amount of the shortfall in relation to the principal and interest owed. Impairment is measured on a loan-by-loan basis by either the present value of expected future cash flows discounted at the loan's effective interest rate, the loan's obtainable market price or the fair value of the collateral if the loan is collateral dependent.
23
Guaranty Federal Bancshares, Inc.
Notes to Consolidated Financial Statements
Groups of loans with similar risk characteristics are collectively evaluated for impairment based on the group's historical loss experience adjusted for changes in trends, conditions and other relevant factors that affect repayment of the loans. Accordingly, the Bank does not separately identify individual consumer and residential loans for impairment measurements, unless such loans are the subject of a restructuring agreement due to financial difficulties of the borrower.
Foreclosed Assets Held for Sale
Assets acquired through, or in lieu of, loan foreclosure are held for sale and are initially recorded at fair value less cost to sell at the date of foreclosure, establishing a new cost basis. Subsequent to foreclosure, valuations are periodically performed by management and the assets are carried at the lower of carrying amount or fair value less estimated cost to sell. Revenue and expenses from operations and changes in the valuation allowance are included in net expenses from foreclosed assets.
Premises and Equipment
Depreciable assets are stated at cost less accumulated depreciation. Depreciation is charged to expense using the straight-line and accelerated methods over the estimated useful lives of the assets. The estimated useful lives for each major depreciable classification of premises and equipment are as follows:
|
Buildings and improvements
|
35-40 years
|
|
Furniture and fixtures and vehicles
|
3-10 years
|
Bank Owned Life Insurance
Bank owned life insurance policies are carried at their cash surrender value. The Company recognizes tax-free income from the periodic increases in cash surrender value of these policies and from death benefits.
Income Taxes
The Company accounts for income taxes in accordance with income tax accounting guidance (ASC 740, Income Taxes). The income tax accounting guidance results in two components of income tax expense: current and deferred. Current income tax expense reflects taxes to be paid or refunded for the current period by applying the provisions of the enacted tax law to the taxable income or excess of deductions over revenues. The Company determines deferred income taxes using the liability (or balance sheet) method. Under this method, the net deferred tax asset or liability is based on the tax effects of the differences between the book and tax bases of assets and liabilities, and enacted changes in tax rates and laws are recognized in the period in which they occur.
Deferred income tax expense results from changes in deferred tax assets and liabilities between periods. Deferred tax assets are recognized if it is more likely than not, based on the technical merits, that the tax position will be realized or sustained upon examination. The term more likely than not means a likelihood of more than 50 percent; the terms examined and upon examination also include resolution of the related appeals or litigation processes, if any. A tax position that meets the more-likely-than-not recognition threshold is initially and subsequently measured as the largest amount of tax benefit that has a greater than 50 percent likelihood of being realized upon settlement with a taxing authority that has full knowledge of all relevant information. The determination of whether or not a tax position has met the more-likely-than-not recognition threshold considers the facts, circumstances and information available at the reporting date and is subject to management's judgment. Deferred tax assets are reduced by a valuation allowance if, based on the weight of evidence available, it is more likely than not that some portion or all of a deferred tax asset will not be realized.
24
Guaranty Federal Bancshares, Inc.
Notes to Consolidated Financial Statements
The Company recognizes interest and penalties on income taxes as a component of income tax expense.
The Company files consolidated income tax returns with its subsidiary. With a few exceptions, the Company is no longer subject to U.S. federal or state income tax examinations by tax authorities for years before 2006.
Cash Equivalents
The Company considers all liquid investments with original maturities of three months or less to be cash equivalents. At December 31, 2009 and 2008, the Company had no cash equivalents.
One or more of the financial institutions holding the Company's cash accounts are participating in the FDIC's Transaction Account Guarantee Program. Under the program, through June 30, 2010, all noninterest-bearing transaction accounts at these institutions are fully guaranteed by the FDIC for the entire amount in the account.
For financial institutions opting out of the FDIC's Transaction Account Guarantee Program or interest-bearing cash accounts, the FDIC's insurance limits increased to $250,000 effective October 3, 2008. The increase in federally insured limits is currently set to expire December 31, 2013.
Restriction on Cash and Due From Banks
The Company is required to maintain reserve funds in cash and/or on deposit with the Federal Reserve Bank. The reserve required on December 31, 2009 and 2008, was $4,063,000 and $3,662,000, respectively.
Comprehensive Income (Loss)
Comprehensive income (loss) consists of net income (loss) and other comprehensive income (loss), net of applicable income taxes. Other comprehensive income (loss) includes unrealized appreciation (depreciation) on available-for-sale securities, unrealized appreciation (depreciation) on available-for-sale securities for which a portion of an other-than-temporary impairment has been recognized in income, unrealized appreciation (depreciation) on held-to-maturity securities for which a portion of an other-than-temporary impairment has been recognized in income, and unrealized gains on interest rate swaps.
Regulatory Matters
The Company and the Bank are subject to various regulatory capital requirements administered by the federal banking agencies. Failure to meet minimum capital requirements can initiate certain mandatory and possibly additional discretionary actions by regulators that, if undertaken, could have a direct and material effect on the Company's financial statements. Under capital adequacy guidelines and the regulatory framework for prompt corrective action, the Company and the Bank must meet specific capital guidelines that involve quantitative measures of assets, liabilities and certain off-balance-sheet items as calculated under regulatory accounting practices. The capital amounts and classification are also subject to qualitative judgments by the regulators about components, risk weightings and other factors.
Quantitative measures established by regulation to ensure capital adequacy require the Company and the Bank to maintain minimum amounts and ratios (set forth in the table below). Management believes, as of December 31, 2009 and 2008, that the Company and the Bank meet all capital adequacy requirements to which they are subject.
As of December 31, 2009, the most recent notification from the Missouri Division of Finance and the Federal Deposit Insurance Corporation categorized the Bank as well capitalized under the regulatory framework for prompt corrective action. To be categorized as well capitalized the Bank must maintain minimum total risk-based, Tier I risk-based and Tier I leverage ratios as set forth in the following table. There are no conditions or events since that notification that management believes have changed the Company's or the Bank's category.
25
Guaranty Federal Bancshares, Inc.
Notes to Consolidated Financial Statements
The Company's and the Bank's actual capital amounts and ratios are also presented in the table. No amount was deducted from capital for interest-rate risk. Dollar amounts are expressed in thousands.
|
Actual
|
For Capital Adequacy Purposes
|
To Be Well Capitalized Under Prompt Corrective Action Provisions
|
||||||||||||||||||||||
|
Amount
|
Ratio
|
Amount
|
Ratio
|
Amount
|
Ratio
|
|||||||||||||||||||
|
As of December 31, 2009
|
||||||||||||||||||||||||
|
Tier 1 (core) capital, and ratio to adjusted total assets
|
||||||||||||||||||||||||
|
Company
|
$ | 64,678 | 8.8 | % | $ | 29,354 | 4.0 | % | n/a | n/a | ||||||||||||||
|
Bank
|
$ | 61,224 | 8.4 | % | $ | 29,311 | 4.0 | % | $ | 36,639 | 5.0 | % | ||||||||||||
|
Tier 1 (core) capital, and ratio to risk-weighted assets
|
||||||||||||||||||||||||
|
Company
|
$ | 64,678 | 11.2 | % | $ | 23,116 | 4.0 | % | n/a | n/a | ||||||||||||||
|
Bank
|
$ | 61,224 | 10.6 | % | $ | 23,074 | 4.0 | % | $ | 34,611 | 6.0 | % | ||||||||||||
|
Total risk-based capital, and ratio to risk-weighted assets
|
||||||||||||||||||||||||
|
Company
|
$ | 71,973 | 12.5 | % | $ | 46,233 | 8.0 | % | n/a | n/a | ||||||||||||||
|
Bank
|
$ | 68,519 | 11.9 | % | $ | 46,148 | 8.0 | % | $ | 57,685 | 10.0 | % | ||||||||||||
|
Actual
|
For Capital Adequacy Purposes
|
To Be Well Capitalized Under Prompt Corrective Action Provisions
|
||||||||||||||||||||||
|
Amount
|
Ratio
|
Amount
|
Ratio
|
Amount
|
Ratio
|
|||||||||||||||||||
|
As of December 31, 2008
|
||||||||||||||||||||||||
|
Tier 1 (core) capital, and ratio to adjusted total assets
|
||||||||||||||||||||||||
|
Company
|
$ | 50,619 | 7.5 | % | $ | 26,963 | 4.0 | % | n/a | n/a | ||||||||||||||
|
Bank
|
$ | 49,833 | 7.4 | % | $ | 26,914 | 4.0 | % | $ | 33,642 | 5.0 | % | ||||||||||||
|
Tier 1 (core) capital, and ratio to risk-weighted assets
|
||||||||||||||||||||||||
|
Company
|
$ | 50,619 | 8.9 | % | $ | 22,697 | 4.0 | % | n/a | n/a | ||||||||||||||
|
Bank
|
$ | 49,833 | 8.8 | % | $ | 22,697 | 4.0 | % | $ | 34,046 | 6.0 | % | ||||||||||||
|
Total risk-based capital, and ratio to risk-weighted assets
|
||||||||||||||||||||||||
|
Company
|
$ | 57,838 | 10.2 | % | $ | 45,394 | 8.0 | % | n/a | n/a | ||||||||||||||
|
Bank
|
$ | 57,045 | 10.1 | % | $ | 45,394 | 8.0 | % | $ | 56,743 | 10.0 | % | ||||||||||||
26
Guaranty Federal Bancshares, Inc.
Notes to Consolidated Financial Statements
The amount of dividends that the Bank may pay is subject to various regulatory limitations. As of December 31, 2009 and 2008 the Bank exceeded its minimum capital requirements. The Bank may not pay dividends which would reduce capital below the minimum requirements shown above.
Earnings Per Common Share
The computation for earnings per common share for the years ended December 31, 2009, 2008 and 2007 is as follows:
|
Year Ended
|
Year Ended
|
Year Ended
|
||||||||||
|
December 31, 2009
|
December 31, 2008
|
December 31, 2007
|
||||||||||
|
Net income (loss) available to common shareholders
|
$ | (3,372,484 | ) | $ | (5,359,711 | ) | $ | 6,099,882 | ||||
|
Average common shares outstanding
|
2,622,895 | 2,604,440 | 2,713,384 | |||||||||
|
Effect of dilutive securities
|
- | - | 77,998 | |||||||||
|
Average diluted shares outstanding
|
2,622,895 | 2,604,440 | 2,791,382 | |||||||||
|
Basic income (loss) per common share
|
$ | (1.29 | ) | $ | (2.06 | ) | $ | 2.25 | ||||
|
Diluted income (loss) per common share
|
$ | (1.29 | ) | $ | (2.06 | ) | $ | 2.19 | ||||
Due to the Company's net loss for the years ended December 31, 2009 and 2008, no potentially dilutive shares were included in the computation of diluted earnings per share.
Segment Information
The principal business of the Company is overseeing the business of the Bank. The Company has no significant assets other than its investment in the Bank. The banking operation is the Company's only reportable segment. The banking segment is principally engaged in the business of originating mortgage loans secured by one-to-four family residences, multi-family, construction, commercial and consumer loans. These loans are funded primarily through the attraction of deposits from the general public, borrowings from the Federal Home Loan Bank and brokered deposits. Selected information is not presented separately for the Company's reportable segment, as there is no material difference between that information and the corresponding information in the consolidated financial statements.
27
Guaranty Federal Bancshares, Inc.
Notes to Consolidated Financial Statements
NOTE 2: SECURITIES
The amortized cost and approximate fair values, together with gross unrealized gains and losses, of securities classified as available-for-sale are as follows:
|
Amortized Cost
|
Gross Unrealized Gains
|
Gross Unrealized (Losses)
|
Approximate Fair Value
|
|||||||||||||
|
As of December 31, 2009
|
||||||||||||||||
|
Equity Securities
|
$ | 102,212 | $ | 4,055 | $ | (41,219 | ) | $ | 65,048 | |||||||
|
Debt Securities:
|
||||||||||||||||
|
U. S. government agencies
|
30,528,386 | 98,160 | (86,326 | ) | 30,540,220 | |||||||||||
|
Government sponsored mortgage-backed securities
|
69,844,555 | 2,209,428 | - | 72,053,983 | ||||||||||||
| $ | 100,475,153 | $ | 2,311,643 | $ | (127,545 | ) | $ | 102,659,251 | ||||||||
|
Amortized Cost
|
Gross Unrealized Gains
|
Gross Unrealized (Losses)
|
Approximate Fair Value
|
|||||||||||||
|
As of December 31, 2008
|
||||||||||||||||
|
Equity Securities:
|
||||||||||||||||
|
FHLMC stock
|
$ | 26,057 | $ | - | $ | (6,639 | ) | $ | 19,418 | |||||||
|
Other
|
572,087 | 4,157 | (34,611 | ) | 541,633 | |||||||||||
|
Debt Securities:
|
||||||||||||||||
|
U. S. government agencies
|
2,450,000 | 24,130 | - | 2,474,130 | ||||||||||||
|
Government sponsored mortgage-backed securities
|
61,304,310 | 1,173,274 | (7,426 | ) | 62,470,158 | |||||||||||
| $ | 64,352,454 | $ | 1,201,561 | $ | (48,676 | ) | $ | 65,505,339 | ||||||||
Maturities of available-for-sale debt securities as of December 31, 2009:
|
Amortized Cost
|
Approximate Fair Value
|
|||||||
|
Within one year
|
$ | 5,500,000 | $ | 5,517,631 | ||||
|
1-5 years
|
22,578,386 | 22,638,073 | ||||||
|
After ten years
|
2,450,000 | 2,384,516 | ||||||
|
Government sponsored mortgage-backed securities not due on a single maturity date
|
69,844,555 | 72,053,983 | ||||||
| $ | 100,372,941 | $ | 102,594,203 | |||||
28
Guaranty Federal Bancshares, Inc.
Notes to Consolidated Financial Statements
The amortized cost and approximate fair values, together with gross unrealized gains and losses, of securities classified as held to maturity are as follows:
|
Amortized Cost
|
Gross Unrealized Gains
|
Gross Unrealized (Losses)
|
Approximate Fair Value
|
|||||||||||||
|
As of December 31, 2009
|
||||||||||||||||
|
Debt Securities:
|
||||||||||||||||
|
U. S. government agencies
|
$ | 114,119 | $ | - | $ | (535 | ) | $ | 113,584 | |||||||
|
Government sponsored mortgage-backed securities
|
358,664 | 27,470 | - | 386,134 | ||||||||||||
| $ | 472,783 | $ | 27,470 | $ | (535 | ) | $ | 499,718 | ||||||||
|
Amortized Cost
|
Gross Unrealized Gains
|
Gross Unrealized (Losses)
|
Approximate Fair Value
|
|||||||||||||
|
As of December 31, 2008
|
||||||||||||||||
|
Debt Securities:
|
||||||||||||||||
|
U. S. government agencies
|
$ | 135,538 | $ | - | $ | (3,236 | ) | $ | 132,302 | |||||||
|
Government sponsored mortgage-backed securities
|
420,927 | 24,565 | (1,395 | ) | 444,097 | |||||||||||
| $ | 556,465 | $ | 24,565 | $ | (4,631 | ) | $ | 576,399 | ||||||||
Maturities of held-to-maturity securities as of December 31, 2009:
|
Amortized Cost
|
Approximate Fair Value
|
|||||||
|
After ten years
|
$ | 114,119 | $ | 113,584 | ||||
|
Government sponsored mortgage-backed securities not due on a single maturity date
|
358,664 | 386,134 | ||||||
| $ | 472,783 | $ | 499,718 | |||||
The carrying value of securities pledged as collateral, to secure public deposits and for other purposes, amounted to $67,572,830 and $55,417,307 as of December 31, 2009 and 2008, respectively.
Gross gains of $689,769, $0 and $618,363 and gross losses of $0, $563,615 and $0 resulting from sale of available-for-sale securities and other than temporary impairment write-downs were realized for the years ended December 31, 2009, 2008 and 2007 respectively. The tax effect of these net gains (losses) was $255,215, ($208,538) and $228,794 in 2009, 2008 and 2007, respectively.
The Company evaluates all securities quarterly to determine if any unrealized losses are deemed to be other than temporary. Certain investment securities are valued less than their historical cost. These declines are primarily the result of the rate for these investments yielding less than current market rates, or declines in stock prices of equity securities. Based on evaluation of available evidence, management believes the declines in fair value for these securities are temporary. It is management's intent to hold the debt securities to maturity or until recovery of the unrealized loss. Should the impairment of any of these debt securities become other than temporary, the cost basis of the investment will be reduced and the resulting loss recognized in net income in the period the other-than-temporary impairment is identified, to the extent the loss is related to credit issues, and to other comprehensive income to the extent the decline on debt securities is related to other factors and the Company does not intend to sell the security prior to recovery of the unrealized loss.
29
Guaranty Federal Bancshares, Inc.
Notes to Consolidated Financial Statements
No securities were written down for other-than-temporary impairment during the year ended December 31, 2009. During the fourth quarter of 2008, the Company determined that one investment security in the other equity securities category had become other than temporarily impaired. As a result of this impairment, the Company charged down the security to its current market value. The total of this charge-down was $465,827 for fiscal year 2008. No securities were written down for other-than-temporary impairment during the year ended December 31, 2007.
Certain other investments in debt and equity securities are reported in the financial statements at an amount less than their historical cost. Total fair value of these investments at December 31, 2009 and 2008, was $7,052,226 and $1,629,386, respectively, which is approximately 7% and 3% of the Company's investment portfolio. These declines primarily resulted from changes in market interest rates and failure of certain investments to meet projected earnings targets.
The following table shows gross unrealized losses and fair value, aggregated by investment category and length of time that individual securities have been in a continuous unrealized loss position at December 31, 2009 and 2008.
|
December 31, 2009
|
||||||||||||||||||||||||
|
Less than 12 Months
|
12 Months or More
|
Total
|
||||||||||||||||||||||
|
Description of Securities
|
Fair Value
|
Unrealized Losses
|
Fair Value
|
Unrealized Losses
|
Fair Value
|
Unrealized Losses
|
||||||||||||||||||
|
Equity Securities
|
$ | - | $ | - | $ | 30,315 | $ | (41,219 | ) | $ | 30,315 | $ | (41,219 | ) | ||||||||||
|
U. S. government agencies
|
7,021,911 | (86,861 | ) | - | - | 7,021,911 | (86,861 | ) | ||||||||||||||||
| $ | 7,021,911 | $ | (86,861 | ) | $ | 30,315 | $ | (41,219 | ) | $ | 7,052,226 | $ | (128,080 | ) | ||||||||||
|
December 31, 2008
|
||||||||||||||||||||||||
|
Less than 12 Months
|
12 Months or More
|
Total
|
||||||||||||||||||||||
|
Description of Securities
|
Fair Value
|
Unrealized Losses
|
Fair Value
|
Unrealized Losses
|
Fair Value
|
Unrealized Losses
|
||||||||||||||||||
|
Equity Securities
|
$ | 56,342 | $ | (41,250 | ) | $ | - | $ | - | $ | 56,342 | $ | (41,250 | ) | ||||||||||
|
U. S. government agencies
|
- | - | 132,302 | (3,236 | ) | 132,302 | (3,236 | ) | ||||||||||||||||
|
Government sponsored mortgage-backed securities
|
1,440,742 | (8,821 | ) | - | - | 1,440,742 | (8,821 | ) | ||||||||||||||||
| $ | 1,497,084 | $ | (50,071 | ) | $ | 132,302 | $ | (3,236 | ) | $ | 1,629,386 | $ | (53,307 | ) | ||||||||||
30
Guaranty Federal Bancshares, Inc.
Notes to Consolidated Financial Statements
NOTE 3: LOANS AND ALLOWANCE FOR LOAN LOSSES
Categories of loans at December 31, 2009 and 2008 include:
|
2009
|
2008
|
|||||||
|
Real estate - residential mortgage:
|
||||||||
|
One to four family units
|
$ | 108,673,726 | $ | 107,753,766 | ||||
|
Multi-family
|
34,498,240 | 31,757,153 | ||||||
|
Real estate - construction
|
21,579,167 | 85,072,577 | ||||||
|
Real estate - commercial
|
236,980,868 | 204,218,526 | ||||||
|
Commercial loans
|
114,497,545 | 118,468,028 | ||||||
|
Installment loans
|
23,016,687 | 26,024,283 | ||||||
|
Total loans
|
539,246,233 | 573,294,333 | ||||||
|
Less:
|
||||||||
|
Allowance for loan losses
|
(14,076,123 | ) | (16,728,492 | ) | ||||
|
Deferred loan fees/costs, net
|
(132,057 | ) | (172,598 | ) | ||||
|
Net loans
|
$ | 525,038,053 | $ | 556,393,243 | ||||
A loan is considered impaired, in accordance with the impairment accounting guidance (ASC-310-10-35-16), when based on current information and events, it is probable the Bank will be unable to collect all amounts due from the borrower in accordance with the contractual terms of the loan. Impaired loans include nonperforming commercial loans but also include loans modified in troubled debt restructurings where concessions have been granted to borrowers experiencing financial difficulties. These concessions could include a reduction in the interest rate on the loan, payment extensions, forgiveness of principal, forbearance or other actions intended to maximize collection.
Included in certain loan categories in the impaired loans are troubled debt restructurings that were classified as impaired. At December 31, 2009, the Bank had $783,573 of residential mortgages, $72,077 of commercial domestic loans and $5,995,497 of real estate loans that were modified in troubled debt restructurings and impaired. These loans were performing in accordance with their modified terms at December 31, 2009.
31
Guaranty Federal Bancshares, Inc.
Notes to Consolidated Financial Statements
The following table presents the Bank's nonaccrual loans at December 31, 2009 and 2008.
|
Years ended
|
||||||||
|
December 31,
|
||||||||
|
2009
|
2008
|
|||||||
|
Impaired loans without a valuation allowance
|
$ | 13,234,984 | $ | 5,407,045 | ||||
|
Impaired loans with a valuation allowance
|
26,774,139 | 34,481,620 | ||||||
|
Total impaired loans
|
$ | 40,009,123 | $ | 39,888,665 | ||||
|
Valuation allowance related to impaired loans
|
$ | 7,240,708 | $ | 9,135,248 | ||||
|
Total nonaccrual loans
|
$ | 34,284,778 | $ | 20,694,465 | ||||
|
Total loans past due 90 days or more and still accruing
|
$ | - | $ | 442,850 | ||||
| 2009 | 2008 | |||||||
|
Average investment in impaired loans
|
$ | 39,642,406 | $ | 22,220,454 | ||||
|
Interest income recognized on impaired loans
|
$ | 1,223,789 | $ | 960,075 | ||||
|
Interest income recognized on a cash basis on impaired loans
|
$ | 582,506 | $ | 144,615 | ||||
Activity in the allowance for loan losses was as follows:
|
Years ended
|
||||||||||||
|
December 31,
|
||||||||||||
|
2009
|
2008
|
2007
|
||||||||||
|
Balance, beginning of year
|
$ | 16,728,492 | $ | 5,962,923 | $ | 5,783,477 | ||||||
|
Provision charged to expense
|
6,900,000 | 14,744,079 | 840,000 | |||||||||
|
Losses charged off, net of recoveries of $217,888, $135,274 and $70,990 for the years ended
|
||||||||||||
|
December 31, 2009, 2008 and 2007 respectively
|
(9,552,369 | ) | (3,978,510 | ) | (660,554 | ) | ||||||
|
Balance, end of year
|
$ | 14,076,123 | $ | 16,728,492 | $ | 5,962,923 | ||||||
The weighted average interest rate on loans as of December 31, 2009 and 2008 was 5.53% and 5.41%, respectively.
The Bank serviced mortgage loans for others amounting to $279,849 and $488,626 as of December 31, 2009 and 2008, respectively. The Bank serviced commercial loans for others amounting to $21,736,513 and $22,914,384 as of December 31, 2009 and 2008, respectively.
32
Guaranty Federal Bancshares, Inc.
Notes to Consolidated Financial Statements
NOTE 4: PREMISES AND EQUIPMENT
Major classifications of premises and equipment, stated at cost, are as follows:
|
December 31,
|
December 31,
|
|||||||
|
2009
|
2008
|
|||||||
|
Land
|
$ | 2,250,789 | $ | 2,250,789 | ||||
|
Buildings and improvements
|
11,489,655 | 10,742,945 | ||||||
|
Automobile
|
16,479 | 16,479 | ||||||
|
Furniture, fixtures and equipment
|
7,563,573 | 6,850,726 | ||||||
|
Leasehold improvements
|
271,799 | 271,799 | ||||||
| 21,592,295 | 20,132,738 | |||||||
|
Less accumulated depreciation
|
(9,774,779 | ) | (8,809,275 | ) | ||||
|
Net premises and equipment
|
$ | 11,817,516 | $ | 11,323,463 | ||||
Depreciation expense was $965,504, $934,941 and $902,322 for the years ended December 31, 2009, 2008, and 2007, respectively.
NOTE 5: BANK OWNED LIFE INSURANCE
In October 2009, the Company purchased $10 million of Bank owned life insurance on certain key members of management. Such policies are recorded at their cash surrender value, or the amount that can be realized. The increase in cash surrender value in excess of the single premium paid is reported as other noninterest income. The balance at December 31, 2009 was $10,069,540.
NOTE 6: OTHER COMPREHENSIVE INCOME (LOSS)
Other comprehensive income (loss) components and related taxes were as follows:
|
Year ended
|
||||||||||||
|
December 31,
|
||||||||||||
|
2009
|
2008
|
2007
|
||||||||||
|
Unrealized gains (losses) on available-for-sale securities
|
$ | 1,720,966 | $ | (210,360 | ) | $ | (1,017,798 | ) | ||||
|
Unrealized gains on interest rate swaps
|
- | 1,695,836 | - | |||||||||
|
Accretion of gains on interest rate swaps
|
(1,017,492 | ) | (169,582 | ) | - | |||||||
|
Less: Reclassification adjustment for realized (gains) losses and write-downs included in income
|
(689,769 | ) | 563,615 | (618,363 | ) | |||||||
|
Other comprehensive income (loss) before tax effect
|
13,705 | 1,879,509 | (1,636,161 | ) | ||||||||
|
Tax expense (benefit)
|
5,061 | 695,418 | (605,380 | ) | ||||||||
|
Other comprehensive income (loss)
|
$ | 8,644 | $ | 1,184,091 | $ | (1,030,781 | ) | |||||
33
Guaranty Federal Bancshares, Inc.
Notes to Consolidated Financial Statements
The components of accumulated other comprehensive income, included in stockholders' equity, are as follows:
|
2009
|
2008
|
|||||||
|
Unrealized gain on available-for-sale securities
|
$ | 2,184,098 | $ | 1,152,885 | ||||
|
Unrealized gain on interest rate swaps
|
508,746 | 1,526,254 | ||||||
| 2,692,844 | 2,679,139 | |||||||
|
Tax effect
|
996,342 | 991,281 | ||||||
|
Net of tax amount
|
$ | 1,696,502 | $ | 1,687,858 | ||||
NOTE 7: DEPOSITS
|
December 31, 2009
|
December 31, 2008
|
|||||||||||||||||||||||
|
Weighted Average Rate
|
Balance
|
Percentage of Deposits
|
Weighted Average Rate
|
Balance
|
Percentage of Deposits
|
|||||||||||||||||||
|
Demand
|
0.00 | % | $ | 28,931,387 | 5.6 | % | 0.00 | % | $ | 31,219,635 | 7.0 | % | ||||||||||||
|
NOW
|
1.19 | % | 55,453,004 | 10.8 | % | 1.13 | % | 42,949,458 | 9.6 | % | ||||||||||||||
|
Money market
|
3.32 | % | 199,967,347 | 39.0 | % | 1.85 | % | 52,082,723 | 11.7 | % | ||||||||||||||
|
Savings
|
0.99 | % | 14,643,695 | 2.9 | % | 0.94 | % | 12,253,106 | 2.7 | % | ||||||||||||||
| 2.49 | % | 298,995,433 | 58.3 | % | 1.13 | % | 138,504,922 | 31.0 | % | |||||||||||||||
|
Certificates:
|
||||||||||||||||||||||||
| 0% - 3.99% | 2.16 | % | 137,610,825 | 26.8 | % | 3.25 | % | 182,335,203 | 40.8 | % | ||||||||||||||
| 4.00% - 5.99% | 4.51 | % | 76,421,540 | 14.9 | % | 4.79 | % | 126,209,344 | 28.2 | % | ||||||||||||||
| 6.00% - 7.99% | 7.77 | % | 23,304 | 0.0 | % | 7.77 | % | 30,000 | 0.0 | % | ||||||||||||||
| 3.00 | % | 214,055,669 | 41.7 | % | 3.88 | % | 308,574,547 | 69.0 | % | |||||||||||||||
|
Total Deposits
|
2.70 | % | $ | 513,051,102 | 100.0 | % | 3.03 | % | $ | 447,079,469 | 100.0 | % | ||||||||||||
The aggregate amount of certificates of deposit with a minimum balance of $100,000 was approximately $70,308,000 and $98,135,000, as of December 31, 2009 and 2008, respectively.
A summary of certificates of deposit by maturity as of December 31, 2009, is as follows:
|
2010
|
$ | 140,285,863 | ||
|
2011
|
50,621,981 | |||
|
2012
|
15,998,647 | |||
|
2013
|
4,518,230 | |||
|
2014
|
1,833,659 | |||
|
Thereafter
|
797,289 | |||
| $ | 214,055,669 |
34
Guaranty Federal Bancshares, Inc.
Notes to Consolidated Financial Statements
A summary of interest expense on deposits is as follows:
|
Years ended
|
||||||||||||
|
December 31,
|
||||||||||||
|
2009
|
2008
|
2007
|
||||||||||
|
NOW and Money Market accounts
|
$ | 6,151,371 | $ | 1,806,564 | $ | 2,940,311 | ||||||
|
Savings accounts
|
121,362 | 142,739 | 320,172 | |||||||||
|
Certificate accounts
|
9,140,075 | 12,341,918 | 12,657,119 | |||||||||
|
Early withdrawal penalties
|
(31,618 | ) | (71,489 | ) | (56,808 | ) | ||||||
| $ | 15,381,190 | $ | 14,219,732 | $ | 15,860,794 | |||||||
The Bank utilizes brokered deposits as an additional funding source. The aggregate amount of brokered deposits was approximately $19,798,000 and $39,869,000 as of December 31, 2009 and 2008, respectively.
NOTE 8: BORROWINGS
Federal Home Loan Bank Advances
Federal Home Loan Bank advances consist of the following:
|
December 31, 2009
|
December 31, 2008
|
|||||||||||||||
|
Maturity Date
|
Amount
|
Weighted Average Rate
|
Amount
|
Weighted Average Rate
|
||||||||||||
|
2009
|
- | - | 21,386,000 | 1.01 | % | |||||||||||
|
2010
|
23,000,000 | 3.10 | % | 18,000,000 | 3.77 | % | ||||||||||
|
2011
|
25,000,000 | 3.53 | % | 25,000,000 | 3.53 | % | ||||||||||
|
2013
|
15,700,000 | 2.14 | % | 15,700,000 | 2.14 | % | ||||||||||
|
Thereafter
|
52,350,000 | 2.26 | % | 52,350,000 | 2.26 | % | ||||||||||
| $ | 116,050,000 | 2.68 | % | $ | 132,436,000 | 2.49 | % | |||||||||
The FHLB requires the Bank to maintain collateral in relation to outstanding balances of advances. For collateral purposes, the FHLB values mortgage loans free of other pledges, liens and encumbrances at 80% of their fair value, and investment securities free of other pledges, liens and encumbrances at 95% of their fair value. Based on existing collateral as well as the FHLB's limitation of advances to 30% of assets, the Bank has the ability to borrow an additional $41,549,000 from the FHLB, as of December 31, 2009.
Federal Reserve Bank Borrowings
During 2008, the Bank established a borrowing line with Federal Reserve Bank. The Bank has the ability to borrow $13.0 million as of December 31, 2009. The Federal Reserve Bank requires the Bank to maintain collateral in relation to borrowings outstanding. The Bank had an outstanding balance of $0 as of December 31, 2009 and 2008.
Securities Sold Under Agreements to Repurchase
The Company borrowed $9.8 million under a structured repurchase agreement in September 2007. Effective in September 2009, interest is based on a fixed rate of 3.56% until maturity in September 2014. The counterparty, Barclay's Capital, Inc., has the option to terminate the agreement any time until maturity date.
35
Guaranty Federal Bancshares, Inc.
Notes to Consolidated Financial Statements
The Company borrowed $30.0 million under three structured repurchase agreements in January 2008. Interest is based on a fixed weighted average rate of 2.65% until maturity in January 2018. Beginning in February 2010, the counterparty, Barclay's Capital, Inc., has the option to terminate the agreements any time until maturity.
The Company has pledged certain investment securities with a fair value of $47.1 million and $51.5 million as of December 31, 2009 and 2008, respectively, to these repurchase agreements.
Notes payable
The Company had a $1.4 million revolving line of credit with a correspondent bank to be used for stock repurchases and investments. The line of credit was secured by bank stock and bore interest at one-month LIBOR plus 1.75%, payable quarterly. The balance was $0 and $1,435,190 at December 31, 2009 and 2008, respectively. On January 30, 2009, the outstanding balance of this line of credit was paid in full and was not renewed.
NOTE 9: SUBORDINATED DEBENTURES
During 2005, the Company formed two wholly owned grantor trust subsidiaries, Guaranty Statutory Trust I and Guaranty Statutory Trust II, to issue preferred securities representing undivided beneficial interests in the assets of the trusts and to invest the gross proceeds of the preferred securities in notes of the Company. Trust I issued $5,000,000 of preferred securities and Trust II issued $10,000,000 of preferred securities. The sole assets of Trust I were originally $5,155,000 aggregate principal amount of the Company's fixed rate subordinated debenture notes due 2036, which are redeemable beginning in 2011. The sole assets of Trust II were originally $10,310,000 aggregate principal amount of the Company's fixed/variable rate subordinated debenture notes due 2036, which are redeemable beginning in 2011. Trust II subordinated debenture notes bear interest at a fixed rate for five years and thereafter at a floating rate based on LIBOR. The preferred securities qualify as either Tier I or Tier II capital for regulatory purposes, subject to certain limitations.
NOTE 10: INCOME TAXES
As of December 31, 2009 and 2008, retained earnings included approximately $5,075,000 for which no deferred income tax liability has been recognized. This amount represents an allocation of income to bad debt deductions for tax purposes only. Reduction of amounts so allocated for purposes other than tax bad debt losses or adjustments arising from carryback of net operating losses would create income for tax purposes only, which would be subject to the then current corporate income tax rate. The unrecorded deferred income tax liability on the above amount was approximately $1,878,000 as of December 31, 2009 and 2008.
The provision (credit) for income taxes consists of:
|
Years Ended
|
||||||||||||
|
December 31,
|
||||||||||||
|
2009
|
2008
|
2007
|
||||||||||
|
Taxes currently payable
|
$ | (2,335,819 | ) | $ | 1,154,957 | $ | 3,587,610 | |||||
|
Deferred income taxes
|
701,199 | (4,143,816 | ) | (187,839 | ) | |||||||
| $ | (1,634,620 | ) | $ | (2,988,859 | ) | $ | 3,399,771 | |||||
36
Guaranty Federal Bancshares, Inc.
Notes to Consolidated Financial Statements
The tax effects of temporary differences related to deferred taxes shown on the December 31, 2009 and 2008 balance sheets are:
|
December 31,
|
December 31,
|
|||||||
|
2009
|
2008
|
|||||||
|
Deferred tax assets:
|
||||||||
|
Allowances for loan losses
|
$ | 5,208,165 | $ | 6,189,542 | ||||
|
Accrued compensated absences
|
18,500 | 18,500 | ||||||
|
Interest on non-accrual loans
|
- | 10,494 | ||||||
|
Impairment loss on available-for-sale securities
|
- | 158,381 | ||||||
|
Writedowns on foreclosed assets held for sale
|
360,952 | - | ||||||
|
State low income housing tax credits
|
1,021,332 | - | ||||||
|
Deferred loan fees/costs
|
48,861 | 63,861 | ||||||
| 6,657,810 | 6,440,778 | |||||||
|
Deferred tax liabilities:
|
||||||||
|
FHLB stock dividends
|
(120,632 | ) | (120,632 | ) | ||||
|
Unrealized appreciation on available-for-sale securities
|
(808,116 | ) | (426,567 | ) | ||||
|
Accumulated depreciation
|
(164,223 | ) | (62,580 | ) | ||||
|
Other
|
(93,078 | ) | (62,186 | ) | ||||
| (1,186,049 | ) | (671,965 | ) | |||||
|
Deferred tax asset before valuation allowance
|
5,471,761 | 5,768,813 | ||||||
|
Valuation allowance:
|
||||||||
|
Beginning balance
|
- | - | ||||||
|
Increase for state low income housing tax credits during the period
|
(785,696 | ) | - | |||||
|
Ending balance
|
(785,696 | ) | - | |||||
|
Net deferred tax asset
|
$ | 4,686,065 | $ | 5,768,813 | ||||
A reconciliation of income tax expense at the statutory rate to income tax expense at the Company's effective rate is shown below:
|
Years ended
|
||||||||||||
|
December 31,
|
||||||||||||
|
2009
|
2008
|
2007
|
||||||||||
|
Computed at statutory rate
|
(34.0 | %) | (34.0 | %) | 34.0 | % | ||||||
|
Increase (reduction) in taxes resulting from:
|
||||||||||||
|
State financial institution tax and credits
|
(30.6 | %) | 0.1 | % | 0.8 | % | ||||||
|
ESOP
|
(1.9 | %) | 0.5 | % | 3.1 | % | ||||||
|
Valuation allowance
|
19.8 | % | - | - | ||||||||
|
Other
|
5.6 | % | (2.4 | %) | (2.1 | %) | ||||||
|
Actual tax provision (credit)
|
(41.1 | %) | (35.8 | %) | 35.8 | % | ||||||
Missouri law provides that banks will be taxed based on an annual privilege tax of 7% of net income. The privilege tax is included in the provision for income taxes.
NOTE 11: DISCLOSURES ABOUT FAIR VALUE OF ASSETS AND LIABILITIES
ASC Topic 820, Fair Value Measurements, defines fair value as the price that would be received to sell an asset or paid to transfer a liability in an orderly transaction between market participants at the measurement date. Topic 820 also specifies a fair value hierarchy which requires an entity to maximize the use of observable inputs and minimize the use of unobservable inputs when measuring fair value. The standard describes three levels of inputs that may be used to measure fair value:
37
Guaranty Federal Bancshares, Inc.
Notes to Consolidated Financial Statements
Level 1: Quoted prices in active markets for identical assets or liabilities
Level 2: Observable inputs other than Level 1 prices, such as quoted prices for similar assets or liabilities; quoted prices in markets that are not active; or other inputs that are observable or can be corroborated by observable market data for substantially the full term of the assets or liabilities
Level 3: Unobservable inputs that are supported by little or no market activity and that are significant to the fair value of the assets or liabilities
The following is a description of the inputs and valuation methodologies used for assets measured at fair value on a recurring basis and recognized in the accompanying balance sheets, as well as the general classification of such assets and liabilities pursuant to the valuation hierarchy.
Available-for-sale securities: Where quoted market prices are available in an active market, securities are classified within Level 1 of the valuation hierarchy. Level 1 securities include equity securities. If quoted market prices are not available, then fair values are estimated by using pricing models, quoted prices of securities with similar characteristics or discounted cash flows. Level 2 securities include U.S. government agencies and government sponsored mortgage-backed securities. The Company has no Level 3 securities.
The following table presents the fair value measurements of assets recognized in the accompanying balance sheets measured at fair value on a recurring basis and the level within the fair value hierarchy in which the fair value measurements fall at December 31, 2009 and 2008 (dollar amounts in thousands):
|
Financial Assets:
|
||||||||||||||||
|
Level 1 inputs
|
Level 2 inputs
|
Level 3 inputs
|
Total fair value
|
|||||||||||||
|
Equity Securities:
|
||||||||||||||||
|
Other
|
$ | 65 | $ | - | $ | - | $ | 65 | ||||||||
|
Debt Securities:
|
||||||||||||||||
|
U.S. government agencies
|
- | 30,540 | - | 30,540 | ||||||||||||
|
Government sponsored mortgage-backed securities
|
- | 72,054 | - | 72,054 | ||||||||||||
|
Available-for-sale securities
|
$ | 65 | $ | 102,594 | $ | - | $ | 102,659 | ||||||||
The following is a description of the valuation methodologies used for assets measured at fair value on a nonrecurring basis and recognized in the accompanying balance sheets, as well as the general classification of such assets pursuant to the valuation hierarchy.
Foreclosed Assets Held for Sale: Fair value is estimated using recent appraisals, comparable sales and other estimates of value obtained principally from independent sources, adjusted for selling costs. Foreclosed assets held for sale are classified within Level 3 of the valuation hierarchy.
Impaired loans (Collateral Dependent): Loans for which it is probable that the Company will not collect all principal and interest due according to contractual terms are measured for impairment. Allowable methods for determining the amount of impairment include estimating fair value using the fair value of the collateral for collateral dependent loans.
If the impaired loan is identified as collateral dependent, then the fair value method of measuring the amount of impairment is utilized. This method requires obtaining a current independent appraisal of the collateral and applying a discount factor to the value. Impaired loans that are collateral dependent are classified within Level 3 of the fair value hierarchy when impairment is determined using the fair value method.
38
Guaranty Federal Bancshares, Inc.
Notes to Consolidated Financial Statements
The following table presents the fair value measurement of assets and liabilities measured at fair value on a nonrecurring basis and the level within the fair value hierarchy in which the fair value measurements fall at December 31, 2009 and 2008 (dollar amounts in thousands):
|
Impaired loans:
|
||||||||||||||||
|
Level 1 inputs
|
Level 2 inputs
|
Level 3 inputs
|
Total fair value
|
|||||||||||||
|
December 31, 2009
|
$ | - | $ | - | $ | 17,186 | $ | 17,186 | ||||||||
|
December 31, 2008
|
$ | - | $ | - | $ | 32,706 | $ | 32,706 | ||||||||
|
Foreclosed assets held for sale:
|
||||||||||||||||
|
Level 1 inputs
|
Level 2 inputs
|
Level 3 inputs
|
Total fair value
|
|||||||||||||
|
December 31, 2009
|
$ | - | $ | - | $ | 3,897 | $ | 3,897 | ||||||||
The following methods were used to estimate the fair value of all other financial instruments recognized in the accompanying balance sheets at amounts other than fair value.
Cash and cash equivalents, interest-bearing deposits and Federal Home Loan Bank stock
The carrying amounts reported in the balance sheets approximate those assets' fair value.
Held-to-maturity securities
Fair value is based on quoted market prices, if available. If a quoted market price is not available, fair value is estimated using quoted market prices for similar securities.
Loans
The fair value of loans is estimated by discounting the future cash flows using the market rates at which similar loans would be made to borrowers with similar credit ratings and for the same remaining maturities. Loans with similar characteristics were aggregated for purposes of the calculations. The carrying amount of accrued interest approximates its fair value.
Deposits
Deposits include demand deposits, savings accounts, NOW accounts and certain money market deposits. The carrying amount approximates fair value. The fair value of fixed-maturity certificates of deposit is estimated by discounting the future cash flows using rates currently offered for deposits of similar remaining maturities.
Federal Home Loan Bank advances and securities sold under agreements to repurchase
The fair value of advances and securities sold under agreements to repurchase is estimated by using rates on debt with similar terms and remaining maturities.
Subordinated debentures and notes payable
For these variable rate instruments, the carrying amount is a reasonable estimate of fair value. There is currently a limited market for similar debt instruments and the Company has the option to call the subordinated debentures at an amount close to its par value.
Interest payable
The carrying amount approximates fair value.
Commitments to originate loans, letters of credit and lines of credit
The fair value of commitments to originate loans is estimated using the fees currently charged to enter into similar agreements, taking into account the remaining terms of the agreements and the present credit worthiness of the counterparties. For fixed-rate loan commitments, fair value also considers the difference between current levels of interest rates and the committed rates. The fair value of letters of credit and lines of credit are based on fees currently charged for similar agreements or on the estimated cost to terminate them or otherwise settle the obligations with the counterparties at the reporting date.
39
Guaranty Federal Bancshares, Inc.
Notes to Consolidated Financial Statements
The following table presents estimated fair values of the Company's financial instruments at December 31, 2009 and 2008.
|
December 31, 2009
|
December 31, 2008
|
|||||||||||||||
|
Carrying Amount
|
Fair Value
|
Carrying Amount
|
Fair Value
|
|||||||||||||
|
Financial assets:
|
||||||||||||||||
|
Cash and cash equivalents
|
$ | 33,016,697 | 33,016,697 | $ | 15,097,015 | 15,097,015 | ||||||||||
|
Interest-bearing deposits
|
16,560,802 | 16,560,802 | $ | - | - | |||||||||||
|
Held-to-maturity securities
|
472,783 | 499,718 | 556,465 | 576,399 | ||||||||||||
|
Federal Home Loan Bank stock
|
5,976,600 | 5,976,600 | 6,730,100 | 6,730,100 | ||||||||||||
|
Mortgage loans held for sale
|
3,465,080 | 3,465,080 | 1,933,798 | 1,933,798 | ||||||||||||
|
Loans, net
|
525,038,053 | 529,941,646 | 556,393,243 | 575,444,855 | ||||||||||||
|
Interest receivable
|
2,671,563 | 2,671,563 | 2,632,450 | 2,632,450 | ||||||||||||
|
Financial liabilities:
|
||||||||||||||||
|
Deposits
|
513,051,102 | 517,380,184 | 447,079,469 | 456,127,421 | ||||||||||||
|
Federal Home Loan Bank advances
|
116,050,000 | 112,377,239 | 132,436,000 | 134,713,550 | ||||||||||||
|
Securities sold under agreements to repurchase
|
39,750,000 | 40,198,606 | 39,750,000 | 40,622,942 | ||||||||||||
|
Subordinated debentures
|
15,465,000 | 15,465,000 | 15,465,000 | 15,465,000 | ||||||||||||
|
Notes payable
|
- | - | 1,435,190 | 1,435,190 | ||||||||||||
|
Interest payable
|
1,398,122 | 1,398,122 | 1,577,279 | 1,577,279 | ||||||||||||
|
Unrecognized financial instruments (net of contractual value):
|
||||||||||||||||
|
Commitments to extend credit
|
- | - | - | - | ||||||||||||
|
Unused lines of credit
|
- | - | - | - | ||||||||||||
NOTE 12: SIGNIFICANT ESTIMATES AND CONCENTRATIONS
Accounting principles generally accepted in the United States of America require disclosure of certain significant estimates and current vulnerabilities due to certain concentrations. Estimates related to the allowance for loan losses are reflected in the footnote regarding loans. Current vulnerabilities due to certain concentrations of credit risk are discussed in the footnote regarding loans.
The current protracted economic decline continues to present financial institutions with circumstances and challenges which in some cases have resulted in large declines in the fair values of investments and other assets, constraints on liquidity and significant credit quality problems, including severe volatility in the valuation of real estate and other collateral supporting loans. The financial statements have been prepared using the values and information currently available to the Company.
Given the volatility of current economic conditions, the values of assets and liabilities recorded in the financial statements could change rapidly, resulting in material future adjustments in asset values, the allowance for loan losses, or capital that could negatively impact the Company's ability to meet regulatory capital requirements and maintain sufficient liquidity.
NOTE 13: EMPLOYEE BENEFIT PLANS
Stock Option Plans
The Company has established four stock option plans for the benefit of certain directors, officers and employees of the Company and its subsidiary. A committee of the Company's Board of Directors administers the plans. The stock options under these plans may be either incentive stock options or nonqualified stock options. Incentive stock options can be granted only to participants who are employees of the Company or its subsidiary. The option price must not be less than the market value of the Company stock on the date of grant. All options expire no later than ten years from the date of grant. The options vest at the rate of 20% per year over a five-year period.
40
Guaranty Federal Bancshares, Inc.
Notes to Consolidated Financial Statements
On May 19, 2004, the Company's stockholders voted to approve a 2004 Stock Option Plan ("2004 SOP"). The purpose of the plan is to attract and retain qualified personnel for positions of substantial responsibility. The aggregate number of shares with respect to options issued under this plan shall not exceed 250,000 shares. To date 200,000 stock options have been granted under this plan, with 12,000 stock options cancelled.
The table below summarizes transactions under the Company's stock option plans:
|
Number of shares
|
||||||||||||
|
Incentive Stock Option
|
Non-Incentive Stock Option
|
Weighted Average Exercise Price
|
||||||||||
|
Balance outstanding as of January 1, 2007
|
155,491 | 115,206 | $ | 17.30 | ||||||||
|
Granted
|
19,500 | 25,000 | 29.48 | |||||||||
|
Exercised
|
(56,958 | ) | (26,000 | ) | 13.49 | |||||||
|
Forfeited
|
- | - | - | |||||||||
|
Balance outstanding as of December 31, 2007
|
118,033 | 114,206 | 20.48 | |||||||||
|
Granted
|
34,000 | 20,000 | 26.72 | |||||||||
|
Exercised
|
(28,313 | ) | (15,002 | ) | 13.36 | |||||||
|
Forfeited
|
(15,470 | ) | (2,500 | ) | 21.17 | |||||||
|
Balance outstanding as of December 31, 2008
|
108,250 | 116,704 | 23.29 | |||||||||
|
Granted
|
41,500 | 20,000 | 5.31 | |||||||||
|
Exercised
|
- | - | - | |||||||||
|
Forfeited
|
(1,000 | ) | - | 28.43 | ||||||||
|
Balance outstanding as of December 31, 2009
|
148,750 | 136,704 | 19.40 | |||||||||
|
Options exercisable as of December 31, 2009
|
57,650 | 87,704 | 20.98 | |||||||||
Stock-based compensation expense recognized for the years ended December 31, 2009, 2008 and 2007 was $95,268, $92,846 and $71,325, respectively. As of December 31, 2009, there was $202,900 of unrecognized compensation expense related to nonvested stock options, which will be recognized over the remaining vesting period.
As of December 31, 2009, total outstanding stock options of 285,454 had a remaining contractual life of 6.35 years.
The total intrinsic value of outstanding stock options was $0 at December 31, 2009 and 2008, respectively, and the total intrinsic value of outstanding exercisable stock options was $0 at December 31, 2009 and 2008, respectively. There were no options exercised during fiscal year 2009. The total intrinsic value of stock options exercised was $387,957 in 2008. The total fair value of share awards vested was $173,736 and $193,815 during 2009 and 2008, respectively.
The fair value of each option granted is estimated on the date of the grant using the Black-Scholes pricing model with the following weighted-average assumptions:
41
Guaranty Federal Bancshares, Inc.
Notes to Consolidated Financial Statements
|
December 31, 2009
|
December 31, 2008
|
December 31, 2007
|
||||||||||
|
Dividends per share
|
$ | - | $ | 0.36 | $ | 0.70 | ||||||
|
Risk-free interest rate
|
1.75 | % | 3.25 | % | 4.54 | % | ||||||
|
Expected life of options
|
5 years
|
5 years
|
5 years
|
|||||||||
|
Weighted-average volatility
|
57.58 | % | 7.17 | % | 4.62 | % | ||||||
|
Weighted-average fair value of options granted during year
|
$ | 1.31 | $ | 1.72 | $ | 2.95 | ||||||
Employee Stock Ownership Plan
The Bank sponsors an internally-leveraged Employee Stock Ownership Plan (ESOP). All employees are eligible to participate after they attain age twenty-one and complete twelve consecutive months of service during which they work at least 1,000 hours. The ESOP borrowed $3,444,540 from the Company and purchased 344,454 shares of the common stock of the Company. The ESOP debt is secured by shares of the Company. The loan will be repaid from contributions to the ESOP as approved annually by the Bank's Board of Directors. As the debt is repaid, shares are released from collateral and allocated to employees' accounts. The shares pledged as collateral are reported as unearned ESOP shares in the consolidated balance sheet. When shares are committed for release, the shares become outstanding for earnings per share computations. Dividends on allocated ESOP shares are recorded as a reduction of retained earnings and may be paid directly to participants or credited to their account; dividends are not paid on unallocated ESOP shares. Compensation expense is recognized ratably based on the average fair value of shares committed to be released. Compensation expense attributed to the ESOP was $121,218, $408,388 and $672,765 for the years ended December 31, 2009, 2008 and 2007, respectively.
The following is a summary of ESOP shares as of December 31, 2009:
|
Beginning ESOP shares
|
344,454 | |||
|
Released shares
|
(253,981 | ) | ||
|
Shares committed for release
|
(22,618 | ) | ||
|
Unreleased shares
|
67,855 | |||
|
Fair value of unreleased shares
|
$ | 344,703 |
NOTE 14: DERIVATIVE FINANCIAL INSTRUMENTS
The Company recorded all derivative financial instruments at fair value in the financial statements. Derivatives were used as a risk management tool to hedge the exposure to changes in interest rates or other identified market risks.
When a derivative is intended to be a qualifying hedged instrument, the Company prepares written hedge documentation that designates the derivative as 1) a hedge of fair value of a recognized asset or liability (fair value hedge) or 2) a hedge of a forecasted transaction, such as, the variability of cash flows to be received or paid related to a recognized asset or liability (cash flow hedge). The written documentation includes identification of, among other items, the risk management objective, hedging instrument, hedged item, and methodologies for assessing and measuring hedge effectiveness and ineffectiveness, along with support for management's assertion that the hedge will be highly effective.
On November 7, 2008, the Company elected to terminate three interest rate swap agreements with a total notional value of $90 million. At termination, the swaps had a market value (gain) of approximately $1.7 million. The gain was deferred and is being accreted into income. The Company recognized $1.0 million and $170,000 of this gain in 2009 and 2008, respectively. The remaining gain of $508,746 as of December 31, 2009 will be accreted into interest income over the remaining six month term in accordance with the stated maturity date of the original agreements.
42
Guaranty Federal Bancshares, Inc.
Notes to Consolidated Financial Statements
NOTE 15: PREFERRED STOCK AND COMMON STOCK WARRANTS
On January 30, 2009, as part of the U.S. Department of the Treasury's Troubled Asset Relief Program's Capital Purchase Program ("CPP"), the Company entered into a Securities Purchase Agreement - Standard Terms with the United States Department of the Treasury (the "Treasury") pursuant to which the Company sold to the Treasury 17,000 shares of Fixed Rate Cumulative Perpetual Preferred Stock, Series A (the "Series A Preferred Stock") and issued a ten year warrant (the "Warrant") to purchase 459,459 shares of the Company's common stock (the "Common Stock") for $5.55 per share (the "Warrant Shares") for a total purchase price of $17.0 million (the "Transaction").
The Series A Preferred Stock qualifies as Tier 1 capital and is entitled to cumulative preferred dividends at a rate of 5% per year for the first five years, payable quarterly, and 9% thereafter. The Series A Preferred Stock has a liquidation preference of $1,000 per share, plus accrued and unpaid dividends. The failure by the Company to pay a total of six quarterly dividends, whether or not consecutive, gives the holders of the Series A Preferred Stock the right to elect two directors to the Company's Board of Directors.
During the first three years after the Transaction, the Company may not redeem the Series A Preferred Stock except in conjunction with a "qualified equity offering" meeting certain requirements. After three years, the Company may redeem the Series A Preferred Stock for $1,000 per share, plus accrued and unpaid dividends, in whole or in part, subject to regulatory approval.
The Warrant is exercisable immediately upon issuance and expires in ten years. The Warrant has anti-dilution protections and certain other protections for the holder of the Warrant, as well as potential registration rights upon written request from the Treasury. The Treasury has agreed not to exercise voting rights with respect to the Warrant Shares that it may acquire upon exercise of the Warrant. If the Series A Preferred Stock is redeemed in whole, the Company has the right to purchase any shares of the Common Stock held by the Treasury at their fair market value at that time.
The Company is subject to certain contractual restrictions under the CPP and the Certificate of Designations for the Series A Preferred Stock that could prohibit the Company from declaring or paying dividends on its common stock or the Series A Preferred Stock.
The proceeds from the CPP were allocated between the Series A Preferred Stock and the Warrant based on a fair value assigned using a discounted cash flow model. This resulted in an initial value of $15,622,189 for the Series A Preferred Stock and $1,377,811 for the Warrant. The discount of approximately $1.4 million on the Series A Preferred Stock is being accreted over the straight-line method (which approximates the level-yield method) over five years ending February 28, 2014.
On February 17, 2009, the American Recovery and Reinvestment Act of 2009 (the "ARRA") was signed into law. The ARRA imposes certain additional executive compensation and corporate expenditure limits on all current and future CPP recipients. These limits are in addition to those previously imposed by the Treasury under the Emergency Economic Stabilization Act of 2008 (the "EESA"). The Treasury released an interim final rule (the "IFR") on TARP standards for compensation and corporate governance on June 10, 2009, which implemented and further expanded the limitations and restrictions imposed by EESA and ARRA. The IFR applies to the Company as of the date of publication in the Federal Register on June 15, 2009, but was subject to comment which ended on August 14, 2009. The Treasury has not yet published a final version of the IFR.
As a result of the Company's participation in the CPP, the restrictions and standards established under EESA and ARRA are applicable to the Company. Neither the ARRA nor the EESA restrictions shall apply to any CPP recipient, including the Company, at such time that the federal government no longer holds any of the Company's Series A Preferred Stock.
43
Guaranty Federal Bancshares, Inc.
Notes to Consolidated Financial Statements
NOTE 16: OTHER EXPENSES
Other expenses for the years ended December 31, 2009, 2008 and 2007 were as follows:
|
December 31,2009
|
December 31, 2008
|
December 31, 2007
|
||||||||||
|
Directors compensation
|
$ | 167,749 | $ | 165,407 | $ | 161,263 | ||||||
|
Outside services
|
86,730 | 110,012 | 70,484 | |||||||||
|
Legal expense
|
370,988 | 123,346 | 76,018 | |||||||||
|
Miscellaneous deposit expense
|
103,752 | 58,483 | 137,930 | |||||||||
|
Office supplies
|
126,844 | 120,329 | 96,257 | |||||||||
|
Telephone
|
104,166 | 81,328 | 148,718 | |||||||||
|
Postage
|
175,017 | 191,374 | 184,985 | |||||||||
|
Insurance
|
62,971 | 70,318 | 59,808 | |||||||||
|
Supervisory exam
|
57,271 | 46,013 | 41,145 | |||||||||
|
Accounting
|
187,389 | 164,672 | 297,699 | |||||||||
|
Organization dues
|
98,853 | 98,617 | 87,570 | |||||||||
|
Loan expense
|
285,078 | 232,565 | 272,248 | |||||||||
|
Contributions
|
40,302 | 40,147 | 36,500 | |||||||||
|
ATM expense
|
260,375 | 229,356 | 211,044 | |||||||||
|
Other operating
|
563,571 | 669,166 | 437,600 | |||||||||
| $ | 2,691,056 | $ | 2,401,133 | $ | 2,319,269 | |||||||
NOTE 17: RELATED PARTY TRANSACTIONS
In the ordinary course of business, the Bank has granted loans to executive officers and directors and their affiliates. Annual activity consisted of the following:
|
Year ended December 31,
|
||||||||||||
|
2009
|
2008
|
2007
|
||||||||||
|
Balance, beginning of year
|
$ | 6,800,439 | $ | 3,590,630 | $ | 3,508,387 | ||||||
|
New Loans
|
688,200 | 4,460,569 | 100,000 | |||||||||
|
Repayments
|
(659,141 | ) | (1,250,760 | ) | (17,757 | ) | ||||||
|
Balance, end of year
|
$ | 6,829,498 | $ | 6,800,439 | $ | 3,590,630 | ||||||
In management's opinion, such loans and other extensions of credit and deposits were made in the ordinary course of business and were made on substantially the same terms as those prevailing at the time for comparable transactions with other persons. Further, in management's opinion, these loans did not involve more than normal risk of collectability or present other unfavorable features.
NOTE 18: COMMITMENTS AND CREDIT RISK
Commitments to extend credit are agreements to lend to a customer as long as there is no violation of any condition established in the contract. Commitments generally have fixed expiration dates or other termination clauses and may require payment of a fee. Since a portion of the commitments may expire without being drawn upon, the total commitment amounts do not necessarily represent future cash requirements. The Bank evaluates each customer's credit worthiness on a case-by-case basis. The amount of collateral obtained, if deemed necessary by the Bank upon extension of credit, is based on management's credit evaluation of the counterparty. Collateral held varies but may include accounts receivable, inventory, property and equipment, commercial real estate and residential real estate.
44
Guaranty Federal Bancshares, Inc.
Notes to Consolidated Financial Statements
As of December 31, 2009 and 2008, the Bank had outstanding commitments to originate fixed-rate mortgage loans of approximately $5,589,000 and $5,001,000, respectively. The commitments extend over varying periods of time with the majority being disbursed within a thirty-day period.
Standby letters of credit are irrevocable conditional commitments issued by the Bank to guarantee the performance of a customer to a third party. Financial standby letters of credit are primarily issued to support public and private borrowing arrangements, including commercial paper, bond financing and similar transactions. Performance standby letters of credit are issued to guarantee performance of certain customers under non-financial contractual obligations. The credit risk involved in issuing standby letters of credit is essentially the same as that involved in extending loans to customers. Fees for letters of credit are initially recorded by the Bank as deferred revenue and are included in earnings at the termination of the respective agreements. Should the Bank be obligated to perform under the standby letters of credit, the Bank may seek recourse from the customer for reimbursement of amounts paid.
The Bank had total outstanding standby letters of credit amounting to $15,623,000 and $15,059,000 as of December 31, 2009 and 2008, respectively, with terms ranging from 30 days to 4 years.
Lines of credit are agreements to lend to a customer as long as there is no violation of any condition established in the contract. Lines of credit generally have fixed expiration dates. Since a portion of the line may expire without being drawn upon, the total unused lines do not necessarily represent future cash requirements. Each customer's credit worthiness is evaluated on a case-by-case basis. The amount of collateral obtained, if deemed necessary, is based on management's credit evaluation of the counterparty. Collateral held varies but may include accounts receivable, inventory, property and equipment, commercial real estate and residential real estate. Management uses the same credit policies in granting lines of credit as it does for on balance sheet instruments.
As of December 31, 2009 and 2008, unused lines of credit to borrowers aggregated approximately $32,539,000 and $49,253,000, respectively, for commercial lines and $17,820,000 and $20,829,000, respectively, for open-end consumer lines.
As of December 31, 2009 and 2008, the Company had commitments to purchase $2 million and $3 million, respectively, in federal low income housing investments in southwest Missouri.
45
Guaranty Federal Bancshares, Inc.
Notes to Consolidated Financial Statements
NOTE 19: CONDENSED PARENT COMPANY STATEMENTS
The condensed balance sheets as of December 31, 2009 and 2008, and statements of operations and cash flows for the years ended December 31, 2009, 2008 and 2007 for the parent company, Guaranty Federal Bancshares, Inc., are as follows:
|
Balance Sheets
|
||||||||
|
December 31,
|
||||||||
|
2009
|
2008
|
|||||||
|
Assets
|
||||||||
|
Cash
|
$ | 2,813,094 | $ | 1,050,726 | ||||
|
Available-for-sale securities
|
65,048 | 541,633 | ||||||
|
Due from subsidiary
|
22,195 | 22,195 | ||||||
|
Investment in subsidiary
|
62,944,398 | 51,546,714 | ||||||
|
Investment in Capital Trust I & II
|
465,000 | 465,000 | ||||||
|
Prepaid expenses and other assets
|
391,471 | 402,565 | ||||||
|
Refundable income taxes
|
395,344 | 204,136 | ||||||
|
Deferred income taxes
|
43,596 | 169,649 | ||||||
| $ | 67,140,146 | $ | 54,402,618 | |||||
|
Liabilities
|
||||||||
|
Notes payable
|
$ | - | $ | 1,435,190 | ||||
|
Subordinated debentures
|
15,465,000 | 15,465,000 | ||||||
|
Accrued expenses and other liabilities
|
264,513 | 189,526 | ||||||
|
Stockholders' equity
|
||||||||
|
Series A preferred stock
|
15,874,788 | - | ||||||
|
Common stock
|
677,980 | 677,980 | ||||||
|
Common stock warrants
|
1,377,811 | - | ||||||
|
Additional paid-in capital
|
58,523,646 | 58,535,159 | ||||||
|
Unearned ESOP shares
|
(660,930 | ) | (888,930 | ) | ||||
|
Retained earnings
|
35,741,705 | 39,114,189 | ||||||
|
Unrealized appreciation on available-for-sale securities and interest rate swaps, net
|
1,696,502 | 1,687,858 | ||||||
|
Treasury stock
|
(61,820,869 | ) | (61,813,354 | ) | ||||
| $ | 67,140,146 | $ | 54,402,618 | |||||
46
Guaranty Federal Bancshares, Inc.
Notes to Consolidated Financial Statements
|
Statements of Operations
|
Years ended December 31,
|
|||||||||||
|
2009
|
2008
|
2007
|
||||||||||
|
Income
|
||||||||||||
|
Dividends from subsidiary bank
|
$ | - | $ | 2,537,098 | $ | 8,487,268 | ||||||
|
Gain (loss) on investment securities
|
365,077 | (563,615 | ) | - | ||||||||
|
Interest income:
|
||||||||||||
|
Related party
|
36,726 | 70,165 | 135,015 | |||||||||
|
Other
|
55,425 | 78,865 | 30,783 | |||||||||
| 457,228 | 2,122,513 | 8,653,066 | ||||||||||
|
Expense
|
||||||||||||
|
Interest expense:
|
||||||||||||
|
Other
|
2,556 | 53,132 | 13,037 | |||||||||
|
Related party
|
1,023,783 | 1,023,783 | 1,023,783 | |||||||||
|
Occupancy
|
- | 2,200 | 2,400 | |||||||||
|
Other
|
458,947 | 686,676 | 953,200 | |||||||||
| 1,485,286 | 1,765,791 | 1,992,420 | ||||||||||
|
Income (loss) before income taxes and equity in undistributed losses of subsidiaries
|
(1,028,058 | ) | 356,722 | 6,660,646 | ||||||||
|
Credit for income taxes
|
(302,528 | ) | (595,913 | ) | (349,935 | ) | ||||||
|
Income (loss) before equity in undistributed earnings of subsidiaries
|
(725,530 | ) | 952,635 | 7,010,581 | ||||||||
|
Equity in undistributed losses of subsidiaries
|
(1,615,188 | ) | (6,312,346 | ) | (910,699 | ) | ||||||
|
Net income (loss)
|
$ | (2,340,718 | ) | $ | (5,359,711 | ) | $ | 6,099,882 | ||||
47
Guaranty Federal Bancshares, Inc.
Notes to Consolidated Financial Statements
|
Statements of Cash Flows
|
Years ended December 31,
|
|||||||||||
|
2009
|
2008
|
2007
|
||||||||||
|
Cash Flows From Operating Activities
|
||||||||||||
|
Net income (loss)
|
$ | (2,340,718 | ) | $ | (5,359,711 | ) | $ | 6,099,882 | ||||
|
Items not requiring (providing) cash:
|
||||||||||||
|
Equity in undistributed loss of subsidiaries
|
1,615,188 | 3,775,248 | - | |||||||||
|
Release of ESOP shares
|
121,219 | 408,388 | 672,765 | |||||||||
|
Stock award plan expense
|
95,268 | 92,846 | 71,325 | |||||||||
|
(Gain) Loss on investment securities
|
(365,077 | ) | 563,615 | - | ||||||||
|
Changes in:
|
||||||||||||
|
Prepaid expenses and other assets
|
11,094 | 64,497 | 19,210 | |||||||||
|
Income taxes payable/refundable
|
(62,672 | ) | 434,415 | 353,980 | ||||||||
|
Accrued expenses
|
(31,264 | ) | (34,475 | ) | (52,707 | ) | ||||||
|
Net cash provided by (used in) operating activities
|
(956,962 | ) | (55,177 | ) | 7,164,455 | |||||||
|
Cash Flows From Investing Activities
|
||||||||||||
|
Capital contributions to subsidiary bank
|
(13,000,000 | ) | - | - | ||||||||
|
Purchase of AFS securities
|
- | (717,512 | ) | (718,190 | ) | |||||||
|
Maturities of AFS securities
|
- | 300,000 | - | |||||||||
|
Proceeds from sales of AFS securities
|
834,952 | - | - | |||||||||
|
Distributions in excess of net income of subsidiary
|
- | 2,537,098 | 910,699 | |||||||||
|
Net decrease in advance to subsidiary
|
- | 5,932 | 769 | |||||||||
|
Net cash provided by (used in) investing activities
|
(12,165,048 | ) | 2,125,518 | 193,278 | ||||||||
|
Cash Flows From Financing Activities
|
||||||||||||
|
Stock options exercised
|
- | 578,661 | 1,118,762 | |||||||||
|
Cash dividends paid on common and preferred stock
|
(672,917 | ) | (1,397,922 | ) | (1,879,256 | ) | ||||||
|
Treasury stock purchased
|
(7,515 | ) | (1,465,150 | ) | (7,479,118 | ) | ||||||
|
Proceeds from issuance of notes payable
|
- | 1,064,000 | 2,468,000 | |||||||||
|
Repayment of notes payable
|
(1,435,190 | ) | (347,000 | ) | (1,749,810 | ) | ||||||
|
Proceeds from issuance of preferred stock and warrants
|
17,000,000 | - | - | |||||||||
|
Net cash provided by (used in) financing activities
|
14,884,378 | (1,567,411 | ) | (7,521,422 | ) | |||||||
|
Increase (decrease) in cash
|
1,762,368 | 502,930 | (163,689 | ) | ||||||||
|
Cash, beginning of year
|
1,050,726 | 547,796 | 711,485 | |||||||||
|
Cash, end of year
|
$ | 2,813,094 | $ | 1,050,726 | $ | 547,796 | ||||||
48
Report of Independent Registered Public Accounting Firm
Audit Committee, Board of Directors and Stockholders
Guaranty Federal Bancshares, Inc.
Springfield, Missouri
We have audited the accompanying consolidated balance sheets of Guaranty Federal Bancshares, Inc. as of December 31, 2009 and 2008, and the related consolidated statements of operations, stockholders' equity and cash flows for each of the years in the three-year period ended December 31, 2009. The Company's management is responsible for these financial statements. Our responsibility is to express an opinion on these financial statements based on our audits.
We conducted our audits in accordance with the standards of the Public Company Accounting Oversight Board (United States). Those standards require that we plan and perform the audits to obtain reasonable assurance about whether the financial statements are free of material misstatement. The Company is not required to have, nor were we engaged to perform, an audit of its internal control over financial reporting. Our audits included consideration of internal control over financial reporting as a basis for designing auditing procedures that are appropriate in the circumstances, but not for the purpose of expressing an opinion on the effectiveness of the Company's internal control over financial reporting. Accordingly, we express no such opinion. Our audits also included examining, on a test basis, evidence supporting the amounts and disclosures in the financial statements, assessing the accounting principles used and significant estimates made by management and evaluating the overall financial statement presentation. We believe that our audits provide a reasonable basis for our opinion.
In our opinion, the consolidated financial statements referred to above present fairly, in all material respects, the financial position of Guaranty Federal Bancshares, Inc. as of December 31, 2009 and 2008, and the results of its operations and its cash flows for each of the years in the three-year period ended December 31, 2009, in conformity with accounting principles generally accepted in the United States of America.
/s/BKD, LLP
Springfield, Missouri
March 30, 2010
49
Guaranty Federal Bancshares, Inc.
2009 Annual Report
|
Board of Directors
|
Officers
|
|
|
Guaranty Federal Bancshares, Inc. and Guaranty Bank
|
Guaranty Federal Bancshares, Inc.
|
|
|
Don M. Gibson
|
||
|
Chairman of the Board
|
||
|
Guaranty Federal Bancshares and
|
Shaun A. Burke
|
|
|
Guaranty Bank
|
President,
|
|
|
Chief Executive Officer
|
||
|
Jack L. Barham
|
||
|
Vice Chairman of the Board
|
Carter M. Peters
|
|
|
Guaranty Federal Bancshares
|
Executive Vice President,
|
|
|
Chief Financial Officer/Chief Operations Officer
|
||
|
Shaun A. Burke
|
||
|
President and CEO
|
H. Michael Mattson
|
|
|
Guaranty Federal Bancshares and
|
Executive Vice President,
|
|
|
Guaranty Bank
|
Chief Lending Officer
|
|
|
James R. Batten, CPA
|
E. Lorene Thomas
|
|
|
Executive Vice President
|
Corporate Secretary
|
Convoy of Hope
Kurt D. Hellweg
President and CEO
International Dehydrated Foods, Inc. and
American Dehydrated Foods, Inc.
Gregory V. Ostergren
Chairman, President and CEO
American National Property and Casualty
Insurance Companies
Tim Rosenbury, AIA
Executive Vice President and Chairman
Butler, Rosenbury and Partners, Inc.
James L. Sivils, III, JD
Partner - Morelock Ross Companies
John F. Griesemer
Executive Vice President and COO
Springfield Underground, Inc.
50