Attached files
EXHIBIT
13
SONESTA
INTERNATIONAL HOTELS CORPORATION
ANNUAL
REPORT 2009
TO OUR
SHAREHOLDERS:
2009 was
a challenging year for the hotel industry and for Sonesta. Due to the
decisions we made and the actions we took, however, the Company is
well-positioned for the future.
Revenue
losses at our three (3) hotels in Boston, Miami and New Orleans in 2009 compared
to 2008 ranged from 3% to 30%. Average daily rates plummeted an
average of 13% at these three properties. Hardest hit was the group
business segment which suffered from the double whammy of the distressed economy
and “the AIG effect”: the reticence of companies to book luxury
hotels lest they be criticized for enjoying junkets at shareholder (or taxpayer)
expense. In our three domestic hotels, group business was off an
average of 32%.
At Royal
Sonesta Hotel Boston, occupancy for 2009 dropped only three (3) percentage
points from 2008, but the average daily rate plunged 20%. The Hotel
relies on corporate group business and the fall-off in demand from this segment
resulted in discounting rates. Overall, revenues were down 21% in
2009 compared to 2008.
While
city-wide conventions in New Orleans were marked by low attendance earlier in
2009, convention attendance appeared to rebound by the end of the year – a
positive sign for the Crescent City. Revenues at Royal Sonesta Hotel
New Orleans totaled $31,679,000, down only 3% from 2008, helped by a strong 2009
fourth quarter. Contributing to the Hotel’s revenues in a tough year
was the opening last March of Irvin Mayfield’s Jazz Playhouse just off the
Hotel’s lobby. The Hotel’s association with Mr. Mayfield, who won a
Grammy at this year’s awards celebration in Los Angeles, has been a great
success for the Hotel.
Of our
domestic hotels, Sonesta Bayfront Coconut Grove suffered the most business-wise
from the economic downturn. Occupancy for the year dropped to 59%
from 71% in 2008, and the Hotel’s ADR fell 18% from 2008. Total
revenues fell 30% from 2008’s total. During 2009, we redesigned the
Hotel’s pool deck, creating an exciting venue where guests can relax and where
the Hotel can host social and business events.
As
announced in September 2009, the Company and its partner, Fortune International,
sold the project we owned together in Key Biscayne, Florida. The
project had stalled due to a combination of lack of financing as the result of
the recession and the glut of unsold condominiums in South
Florida. We agreed with Fortune to test the market in the spring of
last year and, in September, sold the project for $78 million. After
paying off existing debt and sale-related costs, the Company received
approximately $12 million, including reimbursement of $2.7 million we advanced
for project-related costs in 2009 and $9.3 million of net sale
proceeds. All told, the Company effectively sold the Sonesta Beach
Resort property for $71 million: the $60 million we received from
Fortune in April 2005, plus approximately $2 million of additional sale proceeds
over the next 18 months under the terms of our deal, and the $9 million of sale
proceeds we received in September. Included in our 2009 income is a
$42 million pre-tax gain on this transaction.
During
2009, we successfully launched our U.S.-focused franchising
program. Although highly competitive, we believe there are
opportunities to offer the Sonesta brand and marketing system to owners and
operators of hotels that meet our brand criteria and are prepared to implement
our service and operational standards. In January 2010, we introduced
our first franchised property under this program: Sonesta Hotel
Orlando Downtown is a 341-room hotel in Orlando that was formerly flagged as a
Sheraton. We are proud to welcome this hotel into the Sonesta
Collection and expect to add other franchised hotels during 2010.
We were
also pleased to maintain our two franchised properties in St. Maarten in the
Collection. Our contracts for Sonesta Maho Beach Resort & Casino
and Sonesta Great Bay Resort & Casino have been extended for at least five
(5) years. Additionally, both properties will be upgraded, and the
Company is providing a loan of $1,000,000 for this purpose.
In
addition to the franchises in Orlando and St. Maarten, our franchise program in
South America grew by five hotels, from eight properties to thirteen, during
2009 and early 2010. The new properties are located in Valledupar,
Colombia; Cusco, Peru; and Concepcion, Calama, and Osorno, Chile. The
Sonesta hotels in Chile, Colombia and Peru are operated by GHL Hoteles, which is
based in Colombia. The hotels in Brazil are operated by
SuperClubs. (We are pleased to report that the recent earthquake in
Chile resulted in no loss of life at the Sonesta properties there, although
Sonesta Hotel Concepcion suffered some damage.)
Although
2009 proved a particularly challenging year to access hotel opportunities in the
U.S., we did not sit still. In addition to launching our franchising
program and introducing our first franchised hotel, we positioned the Company to
exploit appropriate opportunities. We continue to explore any
opportunities that will add value to our brand and our Company, including
franchises, management opportunities, and acquisitions.
In
February 2010, we completed the refinancing of our Royal Sonesta Hotel
Boston. The existing loan was due to mature in July 2010, but we were
able to lock in a lower interest rate for five (5) years with a Boston-based
bank that will result in interest savings of approximately $700,000 per
year. The Company has provided a $5 million guaranty on the $32
million loan; in addition, we have deposited $5 million in a cash collateral
account with the bank which will be released over a two-year period provided
debt service coverage ratios reach stipulated targets.
If you
would like additional information about Sonesta hotels, resorts, or cruises
please visit our website at Sonesta.com
We
appreciate the continued interest and support of our hotel owners, guests,
partners, employees, and of you, our shareholders.
/s/ Peter J.
Sonnabend
Peter
J. Sonnabend
Executive
Chairman of the Board
/s/ Stephanie Sonnabend
Stephanie Sonnabend
Chief
Executive Officer and President
March 22,
2010
1
SONESTA
INTERNATIONAL HOTELS CORPORATION
5-YEAR
SELECTED FINANCIAL DATA
(In
thousands except for per share data)
|
2009
|
2008
|
2007
|
2006
|
__2005
|
||||||||||||||||
|
Revenues
|
$ | 60,458 | $ | 71,552 | $ | 67,938 | $ | 77,595 | $ | 88,125 | ||||||||||
|
Other
revenues from managed and affiliated
|
||||||||||||||||||||
|
properties
|
4,361 | 8,965 | 18,747 | 21,237 | 14,543 | |||||||||||||||
|
Total
revenues
|
64,819 | 80,517 | 86,685 | 98,832 | 102,668 | |||||||||||||||
|
Operating
income (loss)
|
(951 | ) | 6,671 | 2,228 | (3,829 | ) | (1,905 | ) | ||||||||||||
|
Net
interest expense
|
(2,463 | ) | (1,788 | ) | (1,292 | ) | (1,441 | ) | (2,836 | ) | ||||||||||
|
Other
income(1)
|
41,859 | 574 | 250 |
_49
|
_4,054
|
|||||||||||||||
|
Income
(loss) before income taxes
|
38,445 | 5,457 | 1,186 | (5,221 | ) | (687 | ) | |||||||||||||
|
Income
tax provision (benefit)
|
13,168 | 1,377 | (151 | ) | (1,698 | ) | (5,355 | ) | ||||||||||||
|
Net
income (loss)
|
$ | 25,277 | $ | 4,080 | $ | 1,337 | $ | (3,523 | ) | $ | 4,668 | |||||||||
|
Basic
and diluted net income (loss) pershare of common stock
|
$ | 6.84 | $ | 1.10 | $ | 0.36 | $ | (0.95 | ) | $ | 1.26 | |||||||||
|
Cash
dividends declared
|
$ | 1.00 | $ | 1.35 | $ | 0.20 | $ | 0.20 | $ | 1.10 | ||||||||||
|
Net
property and equipment
|
$ | 34,270 | $ | 35,031 | $ | 37,303 | $ | 38,400 | $ | 72,799 | ||||||||||
|
Total
assets
|
80,731 | 127,040 | 129,591 | 126,428 | 130,619 | |||||||||||||||
|
Long-term
debt including currently payable
portion
|
31,839 | 33,002 | 34,061 | 34,061 | 34,061 | |||||||||||||||
|
Common
stockholders' equity
|
26,653 | 4,126 | 8,547 | 7,371 | 11,865 | |||||||||||||||
|
Common
stockholders' equity
per share
|
7.21 | 1.12 | 2.31 | 1.99 | 3.21 | |||||||||||||||
|
Common
shares outstanding at
end of year
|
3,698 | 3,698 | 3,698 | 3,698 | 3,698 | |||||||||||||||
(1)
Includes pre-tax gain of $41,843,000 from the dissolution of a
development partnership (see Note 3).
Market
price data for the Company’s common stock showing high and low prices by quarter
for each of the last two years is as follows:
|
NASDAQ
Quotations
|
||||||||||||||||
|
2009
|
2008
|
|||||||||||||||
|
High
|
Low
|
High
|
Low
|
|||||||||||||
|
First
|
$ | 14.40 | $ | 6.48 | $ | 35.99 | $ | 18.93 | ||||||||
|
Second
|
10.25 | 5.75 | 30.61 | 22.92 | ||||||||||||
|
Third
|
12.69 | 8.00 | 27.97 | 18.78 | ||||||||||||
|
Fourth
|
15.70 | 8.02 | 20.79 | 7.85 | ||||||||||||
The
Company’s common stock trades on the NASDAQ Stock Market under the symbol
SNSTA. As of February 16, 2010 there were 307 holders of record of
the Company’s common stock.
A copy of the Company’s Form 10-K
Report, which is filed annually with the Securities and Exchange Commission, is
available to stockholders. Requests should be sent to the Office of
the Secretary at the Company’s Executive Office. In addition, this
report may be accessed through the link to the SEC’s website on
sonesta.com.
2
|
|
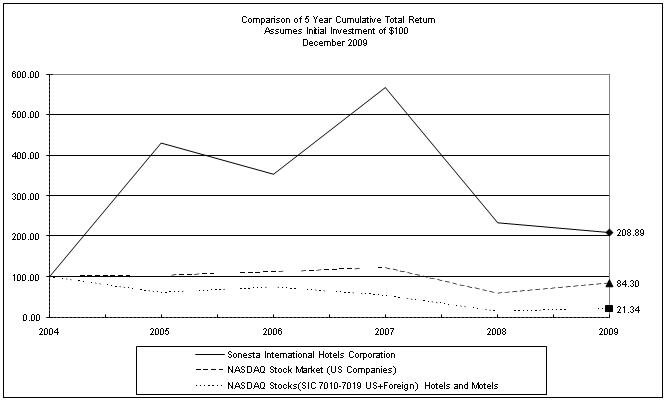
Performance
Graph
|
The
following graph compares the annual percentage change in the cumulative total
stockholder return on the Company’s Common Stock against the cumulative total
return of the NASDAQ Stock Market (US Companies) and the NASDAQ Hotels and
Motels Stocks (SIC 7010-7019) for the five-year period commencing December 31,
2004 and ending December 31, 2009.
3
MANAGEMENT'S
DISCUSSION AND ANALYSIS OF RESULTS OF OPERATIONS AND FINANCIAL
CONDITION
The
Company's consolidated financial statements include the revenues, expenses,
assets and liabilities of Royal Sonesta Hotel Boston, Royal Sonesta Hotel New
Orleans and the Company’s investment in a partnership which owned the site of
the former Sonesta Beach Resort Key Biscayne. The Boston property is owned by
the Company, and the New Orleans hotel is operated under a long-term lease. The
financial statements also include the Company’s revenues and expenses from the
management of properties in the United States and Egypt, and license fee income
from properties in New Orleans, Louisiana (until October 2008); St. Maarten,
Brazil, Chile, Colombia and Peru.
Results of
Operations
During
2009, the Company recorded net income of $25,277,000, or $6.84 per share,
compared to net income of $4,080,000, or $1.10 per share, during
2008. A reconciliation of the $21,197,000 increase in earnings
follows (in thousands):
|
Gain
from dissolution of development partnership
|
$ | 41,843 | ||
|
Decrease
in operating income Royal Sonesta Boston
|
(3,566 | ) | ||
|
Increase
in operating income Royal Sonesta New Orleans
|
605 | |||
|
Decrease
in income from Management Agreement settlement during 2008
|
(3,279 | ) | ||
|
Increase
in operating loss from management activities
|
(1,382 | ) | ||
|
Decrease
in interest income
|
(780 | ) | ||
|
Other
changes
|
(453 | ) | ||
|
Increase
in pre-tax income
|
32,988 | |||
|
Increase
in tax expense
|
(11,791 | ) | ||
|
Increase
in net income 2009 compared to 2008
|
$ | 21,197 |
|
·
|
In
2009, the Company recorded a pre-tax of gain of $41,843,000, following the
sale of assets by a development partnership in which the Company was a 50%
owner (see Note 3, Investment in Development
Partnership).
|
|
·
|
Royal
Sonesta Hotel Boston experienced a difficult year, during which revenues
declined in excess of $6 million, or 21%, in a very competitive Boston
hotel market. The primary reason for the decline was a decrease
in group and convention business.
|
|
·
|
Revenues
at Royal Sonesta Hotel New Orleans decreased by a modest 3% during the
2009 recession year due to a strong 2009 fourth quarter compared to the
same period a year ago. Operating income increased due to lower
costs and operating expenses and lower rent
expense.
|
|
·
|
During
the 2008 third quarter, the Company recorded pre-tax income of $3,279,000
related to the settlement of a dispute with the owner of Trump
International Sonesta Beach Resort Sunny Isles (see Note
2). The Company terminated the management agreement for this
property effective April 1, 2008.
|
|
·
|
Income
from management activities decreased primarily as a result of lower income
from the Company’s managed properties in Egypt and lower income from
Sonesta Bayfront Hotel Coconut Grove. The Company had no income
from Trump International Sonesta Beach Resort Sunny Isles during 2009 (see
Note 2 – Operations).
|
|
·
|
Interest
income declined due to lower investment returns on the Company’s cash
balances.
|
A
detailed analysis of the revenues and expenses by location follows.
Revenues
The
Company records costs incurred on behalf of owners of managed and affiliated
properties, and expenses reimbursed from managed and affiliated properties, on a
gross basis. The revenues included and discussed in this Management’s
Discussion and Analysis exclude the “other revenues and expenses from managed
and affiliated properties”.
|
TOTAL
REVENUES
(in
thousands)
|
||||||||||||||||
|
NO.
OF
|
||||||||||||||||
|
ROOMS
|
2009
|
2008
|
2007
|
|||||||||||||
|
Royal
Sonesta Hotel Boston
|
400 | $ | 24,462 | $ | 30,778 | $ | 29,377 | |||||||||
|
Royal
Sonesta Hotel New Orleans
|
500 | 31,679 | 32,795 | 31,888 | ||||||||||||
|
Management
and service fees
|
4,317 | 7,979 | 6,673 | |||||||||||||
|
Total
revenues, excluding other revenues from
|
||||||||||||||||
|
managed
and affiliated properties
|
$ | 60,458 | $ | 71,552 | $ | 67,938 | ||||||||||
2009 versus
2008: Total revenues, excluding other revenues from managed
and affiliated properties, were $60,458,000 in 2009 compared to $71,552,000 in
2008, a decrease of $11,094,000. Revenues at Royal Sonesta Hotel
Boston decreased by $6,316,000 in 2009 compared to 2008, representing a 21%
decrease. The Boston hotel market was severely impacted by the
economic recession in 2009. Revenues at Royal Sonesta Hotel New
Orleans declined by a modest 3%, despite the poor economic
conditions. During the 2009 fourth quarter, revenues increased
compared to a year ago, as demand improved in the City of New
Orleans. Revenues from management activities decreased from
$7,979,000 in 2008 to $4,317,000 in 2009. This was primarily the
result of decreased fee income from the Company’s managed operations in Egypt,
and lower fee income from Sonesta Bayfront Hotel Coconut Grove, as well as no
fee income from Trump International Sonesta Beach Resort Sunny Isles, which the
Company stopped operating as of April 1, 2008. In addition, the
Company experienced a decline in income from hotels to which it
licenses the use of its name as well as other corporate activities including
purchasing, training and reservation services. A more detailed
analysis of the revenues by hotel, and of our management income,
follows.
Royal
Sonesta Hotel Boston reported revenues of $24,462,000 during 2009, compared to
$30,778,000 in 2008, representing a $6,316,000, or 21%,
decrease. Room revenues decreased by $4,702,000, due to a 23%
decrease in room revenues per available room (“REVPAR”). The hotel’s
occupancy levels were down by three percentage points compared to 2008, but the
majority of the decline in revenues was due to a reduction in average daily room
rates achieved. The decline in room revenues was due primarily to a
decrease in revenue generated from the group and convention market
segment. Business from this market segment depends heavily on high
levels of corporate spending, which was severely impacted by the economic
recession. The decrease in group and convention business also
effected the hotel’s competitors, which resulted in increased competition for
available transient business. Room nights sold in the transient
market segment actually increased in 2009 compared to 2008, but the hotel had to
discount its rates substantially to capture this additional transient
business. Revenues from other sources, which are primarily from food
and beverage sales, decreased by $1,614,000, or 16%, in 2009 compared to
2008. Banquet revenues, which depend heavily on group and convention
business at the hotel, decreased substantially, but this
4
decrease
was partially offset by an increase in revenue from the hotel’s ArtBar
restaurant, which was renovated during 2008.
Royal
Sonesta Hotel New Orleans reported a decrease in revenues of $1,116,000, or 3%,
to $31,679,000 in 2009. This decrease was entirely due to a
$1,135,000 decrease in room revenues. The hotel’s REVPAR in 2009
decreased by 5%, primarily as a result of a decrease in group and convention
business. Room nights sold to the transient market segment during
2009 equaled those sold in 2008. Revenues from other sources
increased by $19,000 in 2009 compared to 2008. Decreases in banquet
revenues due to the reduced group and convention business was partially offset
by increased revenues from the hotel’s Desire restaurant as well as increased
beverage revenues. The beverage revenue increase was mainly due to
the transformation of the hotel’s main lounge into Irvin Mayfield’s Jazz
Playhouse during early 2009.
Revenues
from management activities decreased from $7,979,000 in 2008 to $4,317,000 in
2009. Management income from the Company’s collection of managed
hotels and cruise ships in Egypt decreased by $1,077,000 in the 2009 period
compared to last year, primarily due to the fact that it did not achieve
stipulated profit levels in two of its resorts which it needs to achieve in
order to earn incentive fees. In general, business levels in Egypt
declined only moderately. Management income from Sonesta Bayfront
Hotel Coconut Grove decreased by $853,000 due to the sharp decline in net
operating income in 2009. The Company is committed to an annual
minimum return payment to the hotel’s owner, and the Company eliminates fees
from its income to the extent net operating income is insufficient to pay this
minimum return. Management income during 2008 included $840,000 from
Trump International Sonesta Beach Resort Sunny Isles. The management
agreement for this resort was terminated by the Company effective April 1,
2008. The remaining decrease in management fee income was primarily
from lower income from two hotels in St. Maarten to which the Company has
licensed the use of its name, and lower income earned from Corporate services,
including purchasing, training and reservation services.
2008 versus
2007: Total revenues, excluding other revenues from managed
and affiliated properties, were $71,552,000 in 2008 compared to $67,938,000 in
2007, an increase of $3,614,000. Revenues at Royal Sonesta Hotel
Boston increased by $1,401,000 in 2008 compared to 2007, representing a 5%
increase. Demand in the Boston hotel market was strong in 2008
through the month of October. Revenues declined during the last two
months of 2008. Revenues at Royal Sonesta Hotel New Orleans in 2008
increased by a modest 3%. Business during the first eight months of
the year was strong, but September 2008 revenues were impacted by Hurricane
Gustav. Revenues during the fourth quarter decreased compared to
2007, due to worsening economic conditions. Revenues from management
activities increased from $6,673,000 during 2007 to $7,979,000 during 2008,
primarily due to an increase in management income from the Company’s collection
of hotels and cruise ships in Egypt. A more detailed analysis of the
revenues by hotel, and of our management income, follows.
Royal
Sonesta Hotel Boston recorded revenues of $30,778,000 during 2008 compared to
$29,377,000 in 2007, representing an increase of $1,401,000, or
5%. This increase was mainly due to an increase of $1,160,000 in room
revenues. Room revenues per available room (“REVPAR”) increased by 6%
in 2008 compared to 2007, mainly due to an increase in occupancy
levels. Demand in Boston was strong through October 2008, which
benefitted the Hotel. The increase in occupancy was entirely from
increased transient rooms business. The increase in non-rooms revenue
of $241,000 was mainly due to increased food and beverage revenues, which
included higher revenues from the hotel’s newly renovated ArtBar.
Revenues
at Royal Sonesta Hotel New Orleans during 2008 totaled $32,795,000 compared to
$31,888,000 during 2007, representing an increase of $907,000, or
3%. In general, hotel business in New Orleans continued to improve
during the first eight months of 2008 from the downturn in business following
Hurricane Katrina in 2005. September revenues, however, were impacted
by Hurricanes Gustav and Ike, and fourth quarter 2008 revenues were affected by
decreased business volumes resulting from worsened economic
conditions. Room revenues increased by $771,000 in 2008 due to a 4%
REVPAR increase which was entirely due to higher average room rates
achieved. Revenues other than rooms increased by $215,000 due to
increased banquet revenues. Revenues from the hotel’s laundry, which
also services third party hotels, decreased by $79,000 in 2008 compared to 2007
due to the loss of revenues from Chateau Sonesta Hotel New Orleans, which was
operated by the Company under a management agreement until October
2007.
Revenues
from management activities increased from $6,673,000 during 2007 to $7,979,000
during 2008, representing an increase of $1,306,000. Of this
increase, $1,146,000 resulted from improved fee income from the Company’s
collection of hotels and Nile River cruise ships in Egypt. Business
in Egypt in 2008 continued to improve, and management income also included fee
income from Sonesta Pharaoh Beach Resort Hurghada, which was added under
management effective January 1, 2008. The remaining increase resulted
from higher income from hotels to which the Company licenses the use of its name
in St. Maarten and South America, partially offset by decreased fee income from
Chateau Sonesta Hotel New Orleans, which the Company stopped operating in
October, 2007, and decreased income from Trump International Sonesta Beach
Resort following the termination by the Company of the management agreement for
this hotel effective April 1, 2008 (see Note 2).
Operating
Income
|
OPERATING
INCOME/(LOSS)
(in
thousands)
|
||||||||||||
|
2009
|
2008
|
2007
|
||||||||||
|
Royal
Sonesta Hotel Boston
|
$ | 1,898 | $ | 5,464 | $ | 4,926 | ||||||
|
Royal
Sonesta Hotel New Orleans
|
749 | 144 | 885 | |||||||||
|
Operating
income from hotels after
management and service
fees
|
2,647 | 5,608 | 5,811 | |||||||||
|
Management
activities and other income
|
(3,598 | ) | (2,216 | ) | (3,583 | ) | ||||||
|
Subtotal
|
(951 | ) | 3,392 | 2,228 | ||||||||
|
Income
from Management Agreement
settlement,
net
|
-- | 3,279 | -- | |||||||||
|
Operating
income (loss)
|
$ | (951 | ) | $ | 6,671 | $ | 2,228 | |||||
2009 versus
2008: The Company recorded an operating loss of $951,000 in
2009 compared to operating income of $6,671,000 in 2008, a decrease of
$7,622,000. During the 2008 third quarter, the Company recorded
pre-tax income of $3,279,000 related to the settlement of a dispute with the
owner of Trump International Sonesta Beach Resort Sunny Isles. The
Company terminated the management agreement for this property effective April 1,
2008. Operating income at Royal Sonesta Hotel Boston decreased by
$3,566,000, primarily due to a 21% decrease in revenues. Operating
income at Royal Sonesta New Orleans increased by $605,000, as decreased
expenses,
5
including
rent expense, more than offset the modest decrease in revenues during
2009. Operating losses from management activities increased from
$2,216,000 in 2008 to $3,598,000 in 2009, primarily due to lower fee income from
the Company’s managed hotels and cruise ships in Egypt, and lower fee income
from Sonesta Bayfront Hotel Coconut Grove and Trump International Sonesta Beach
Resort Sunny Isles. A more detailed discussion of the changes in
operating income by location follows.
Royal
Sonesta Hotel Boston reported operating income of $1,898,000 during 2009
compared to $5,464,000 during 2008, a decrease of $3,566,000. A
decrease in revenues of $6,316,000 was partially offset by a decrease of
$2,750,000, or 11%, in expenses. Costs and operating expenses
decreased by $1,764,000, primarily due to lower payroll costs. During
2009, the hotel reduced staffing levels in all operating departments, and in
addition eliminated certain management positions. Employee benefit
costs also decreased due to the suspension of matching contributions to the
Company’s 401(k) plan, and the fact that no bonuses were paid to hotel
management for the year 2009. The remaining decrease in expenses was
primarily from lower administrative and general costs, including credit card
commissions, and lower advertising, human resources and maintenance
expenses.
Operating
income at Royal Sonesta Hotel New Orleans increased from $144,000 during 2008 to
$749,000 in 2009. Decreases in revenues of $1,116,000 in 2009 were
more than offset by a decrease in expenses of $1,721,000. The
decrease in expenses was mainly due to lower costs and operating expenses and
rent expense. Costs and operating expenses decreased by $650,000, or
4%, mainly due to lower payroll and benefits costs and lower utility
costs. Rent expense decreased by $959,000. The Company
operates Royal Sonesta Hotel New Orleans under a lease, under which rent payable
to the landlord equals 75% of net cash flow. The savings in rent was
due to lower operating profits, as well as an increase in capital expenditures
in 2009 compared to 2008. Capital expenditures are deducted from cash
flow for rent purposes.
The
Company’s loss from management activities, which is computed after giving effect
to management and marketing fees from owned and leased hotels, increased from
$2,216,000 in 2008 to $3,598,000 in 2009. Revenues from management
activities decreased by $3,662,000, which decrease was partially offset by a
decrease in expenses related to these activities of
$2,280,000. Corporate office costs during 2009 decreased because of
lower employee benefit costs due to the suspension of matching 401(k) plan
contributions, and lower bonus expense. Corporate salaries were
frozen during 2009. In addition, 2008 expenses included an amount of
$720,000 related to an employment agreement with Roger Sonnabend, the Company’s
former Executive Chairman of the Board, who passed away in December
2008. Expenses in 2008 also included legal fees and other costs
related to a hotel project in Miami. The Company started to work on
this project during the summer of 2008 but decided in February 2009 not to
pursue this opportunity. Lastly, the 2008 period included additional
depreciation expense of $567,000 related to accelerated depreciation of an
investment the Company made in Trump International Sonesta Beach Resort Sunny
Isles, following the Company’s termination of the management agreement for this
hotel effective April 1, 2008.
2008 versus
2007: The Company recorded operating income in 2008 of
$6,671,000, compared to operating income of $2,228,000 in 2007, an increase of
$4,443,000. In the 2008 third quarter, the Company recorded pre-tax income of
$3,279,000 related to the settlement of a dispute with the owner of Trump
International Sonesta Beach Resort. The Company terminated the
management agreement for this property effective April 1, 2008 (see Note
2). Operating income at Royal Sonesta Hotel Boston increased by
$538,000 compared to 2007 due to a 5% increase in revenues at this
property. Operating income at Royal Sonesta Hotel New Orleans
decreased by $741,000, mainly due to higher rent expense incurred under the
lease under which the Company operates the hotel. Operating losses
from management activities decreased by $1,367,000 to $2,216,000 in 2008,
primarily due to higher income achieved from the Company’s managed hotels and
cruise ships in Egypt. A more detailed discussion of the changes in
operating income by location follows.
Royal
Sonesta Hotel Boston increased operating income during 2008 by $538,000 to
$5,464,000. Revenues during 2008 increased by $1,401,000, but were
partially offset by a 4% increase in expenses, totaling $863,000. The
expense increase was almost entirely due to a 5% increase in cost and operating
expenses, totaling $624,000. The hotel operated at a higher occupancy
level in 2008 compared to 2007, resulting in increased payroll
expenses. In addition, the hotel incurred higher commissions and
reservations costs, increases in linens and guest supplies expense, as well as
increased employee benefit costs. In December 2008, the hotel
incurred severance expenses related to layoffs following the decline in business
in late 2008.
Operating
income from Royal Sonesta Hotel New Orleans decreased from $885,000 in 2007 to
$144,000 in 2008. Increases in revenues of $907,000 were more than
offset by increased expenses of $1,648,000. The hotel expensed
$303,000 in 2008 for costs incurred during 2006, 2007 and 2008 related to the
potential addition of a spa in the hotel, following its decision to postpone
this project because of the high cost. Rent expense increased by
$1,185,000 in 2008 compared to 2007. The Company operates the hotel
under a lease, and rent is equal to 75% of net cash flow. The rent
increase was due in part to higher operating profits achieved in 2008 compared
to 2007. In addition, the hotel spent less on capital additions in
2008 compared to previous year. Under the lease, capital expenditures
are deducted from cash flow for rent purposes. Excluding the rent
increase and development cost write off, the hotel’s total expenses were
virtually the same in 2008 as in 2007. Costs and operating expenses,
as well as advertising and repairs and maintenance costs, increased slightly,
but this increase was offset by decreased real estate tax expense in 2008 due to
a favorable abatement received from the City of New
Orleans. Operating profits from the hotel’s laundry, which also
services third party hotels, decreased by $266,000 in 2008 compared to
2007. This was in part due to the loss of revenues from Chateau
Sonesta Hotel New Orleans, which was operated by the Company under a management
agreement until October, 2007, as well as increased costs and operating expenses
of the laundry, including utility costs.
The
Company’s loss from management activities, which is computed after giving effect
to management fees from owned and leased hotels, decreased by $1,367,000 to
$2,216,000 in 2008. Revenues increased by $1,306,000, primarily from
increased fee income from the Company’s managed operations in
Egypt. Expenses related to these activities decreased by
$61,000. Corporate expenses in 2008 included $720,000 related to an
employment agreement with Roger Sonnabend, the Company’s former Executive
Chairman of the Board who passed away in December 2008. The 2008
expenses also included approximately $250,000 in costs related to a hotel
project in Miami. The Company started to work on this project during
the summer of 2008, but decided in February 2009 not to pursue this
opportunity. The Company also incurred higher legal costs related to
the negotiation of management agreements for additional hotels, including the
aforementioned project. Expenses in 2007 included $691,000 based on
an employment agreement following the retirement of a long term Company
executive, Mr. Paul Sonnabend. In addition, the Company spent
approximately $265,000 in 2007 on legal and other costs in connection with a
review of the Company’s strategic options to enhance
6
shareholder
value.
Other
Income and Deductions
Interest
expense, which consists entirely of interest paid on the Company’s mortgage loan
secured by Royal Sonesta Hotel Boston, decreased by $105,000 in 2009 compared to
2008 and by $42,000 in 2008 compared to 2007, due to principal payments made on
the loan during these two years.
Interest
income decreased from $1,720,000 in 2007 to $1,182,000 in 2008, and to $402,000
in 2009. The decrease in 2009 was the result of lower income earned
on the Company’s short-term cash investments, due to lower rates of
return. In addition, the 2008 period included interest earned on a
loan to the owner of Sonesta Bayfront Hotel Coconut Grove, which was repaid
during 2008. The decrease in interest income was partially offset by
interest earned on a new loan made to the owners of Sonesta Beach Resort and
Sonesta Club, in Sharm El Sheikh.
During
2009 the Company reported a gain of $41,843,000 following the dissolution of a
development partnership in which the Company owned a 50% limited
interest. The partnership sold the land and improvements formerly
comprising Sonesta Beach Resort Key Biscayne during the 2009 third quarter (see
Note 3, Investment in Development Partnership). Also included in 2009
is a gain of approximately $34,000 on the sale of a condominium unit in Trump
International Sonesta Beach Resort Sunny Isles, which the Company managed until
April 1, 2008. The $576,000 gain on sale of assets in 2008 resulted
primarily from a $422,000 gain on the sale of a co-op unit the Company owned in
New York City to the Company’s Executive Chairman. The sale price was
$700,000. The Company’s Board of Directors approved this
transaction. In addition, the Company realized a gain on the sale of
art in 2008.
Federal,
State and Foreign Income Taxes
During
2009 the Company recorded a tax expense of $13,168,000 on pre-tax income of
$38,445,000. This tax expense is approximately the same as the
statutory federal income tax rate. State tax expense on income
attributed to Louisiana, Florida and Massachusetts was partially offset by
general business tax credits and an adjustment to the gain reported on the Key
Biscayne transaction (see Note 3) which is not subject to tax.
In 2008,
the Company recorded a net tax provision of $1,377,000 on its pre-tax income of
$5,457,000. The Company was able to take substantial credits for
foreign taxes paid in 2008, and for foreign taxes paid in prior years which had
been carrying forward. In addition, the Company benefited from
current and prior year’s general business credits, including work opportunity
tax credits related to Hurricane Katrina. The Company also recorded a
state income tax benefit of $216,000 for Massachusetts taxes resulting from
changes enacted in tax laws during 2008. These changes include
conforming to federal entity classification rules and adopting a unitary method
of taxation.
Liquidity
and Capital Resources
The
Company had cash and cash equivalents of approximately $35 million at December
31, 2009. As of that date, the majority of these funds were held in
money market mutual funds and non-interest bearing bank accounts.
In
September 2009 the Company received $12,076,000 in connection with the sale by a
partnership, in which the Company owned a 50% limited partnership interest, of
the land and improvements formerly comprising Sonesta Beach Resort Key
Biscayne. This payment included the repayment of advances made by the
Company to the partnership during 2009 of $2,664,000 and, in addition,
$9,412,000 for its share of the sale proceeds of the assets (see Note 3,
Investment in Development Partnership).
During
2009, the Company paid dividends totaling $1.25 per share
($4,623,000). In 2008, the Company paid dividends totaling $1.20 per
share ($4,438,000).
The
Company contributed $934,000 and $1,280,000 to its Pension Plan in 2009 and
2008, respectively.
In
December 2009, the Company agreed to loan $1,000,000 to the owners of two hotels
in St. Maarten, to which the Company licenses the use of its
name. The Company expects to fund this loan during 2010.
In August
2009, the Company loaned a total of $1,363,000 to the owner of Sonesta St.
George Hotel Luxor and Sonesta St. George I Cruise Ship, which are both managed
by the Company. The loan consisted of cash advances of $500,000 and a
conversion of receivables for fees and expenses due to the Company from the
hotel and the ship. The proceeds of the loan helped fund improvements
to the Luxor hotel, including additional rooms and meeting
facilities. The hotel’s owner also agreed to an extension of the
management agreement by 5 years.
In
February 2010, the Company refinanced the mortgage loan secured by Royal Sonesta
Hotel Boston. The existing loan in the principal amount of
$31,645,000, which was to mature in July 2010, was replaced by a $32 million
loan. The Company paid a 1% fee at closing, and incurred legal and
other costs related to the new loan. The interest rate on the new,
5-year loan is 6.4%, compared to 8.6% on the loan which was
refinanced. The annual interest savings as a result of the lower
interest rate is approximately $700,000. As part of the security for
the new loan, the Company agreed to fund a restricted cash collateral account in
the amount of $5 million (see Note 5 – Borrowing Arrangements).
The
Company operates Sonesta Bayfront Hotel Coconut Grove, in Miami, which is a
condominium hotel that opened in April 2002. Under its agreements,
the Company is committed to fund net operating losses, and to provide the
hotel’s owner with a minimum annual return ($419,000 during 2009), adjusted
annually by increases in the Consumer Price Index (“CPI”). The
management agreement can be terminated by the hotel’s owner if the Company fails
to cure shortfalls against a minimum target return ($978,000 during 2009),
adjusted annually by increases in the CPI. The hotel’s 2008 net
operating profit was sufficient to cover the owner’s target return and the
Company’s fees from the hotel of $1,039,000. In 2009, the hotel’s net
operating profit fell short of the target return but was sufficient to cover the
minimum annual return and fees to the Company totaling $150,000. The
Company has decided not to fund the owner’s target return for 2009, and notified
the owner of same in January 2010. As a result, the owner had the
right to terminate the management agreement provided it sent the Company a
termination notice on or before March 3, 2010, but the hotel’s owner did not
exercise this right. (While the hotel’s owner has claimed that the
notice deadline was extended beyond March 3, 2010, the Company has advised the
owner of its position that the deadline has passed.) In October 2008,
the Company received $2,627,000 in connection with the repayment of a loan made
to the owner of the hotel for initial furniture, fixtures and equipment and
pre-opening expenses.
The
Company made a loan of $500,000 to the owner of Sonesta Beach Resort Sharm El
Sheikh in January 2010, to help finance the construction of additional hotel
rooms and facilities. In January 2008, the Company agreed to convert
approximately $1.6 million of receivables for fees and expenses from the two
hotels it manages in
7
Sharm El
Sheikh, Egypt into a five-year loan. This was part of a transaction
which also included the extension until 2024 of the management agreement for
Sonesta Club Sharm El Sheikh, which otherwise would have expired at the end of
2009. In return, the Company agreed to pay $500,000, which payment
was made by reducing outstanding receivables from Sonesta Club.
Company
management believes that its present cash balances will be more than adequate to
meet its cash requirements for 2010 and for the foreseeable future.
As of
December 31, 2009, the Company’s fixed contractual obligations were as follows
(in thousands):
|
YEAR
|
||||||||||||||||||||||||||||
|
2010
|
2011
|
2012
|
2013
|
2014
|
Thereafter
|
Total
|
||||||||||||||||||||||
|
Long-Term
Debt Obligations
|
$ | 2,725 | $ | 2,569 | $ | 2,569 | $ | 2,569 | $ | 2,569 | $ | 29,582 | $ | 42,583 | ||||||||||||||
|
Operating
Leases
|
737 | 625 | 291 | 104 | -- | -- | 1,757 | |||||||||||||||||||||
|
Total
|
$ | 3,462 | $ | 3,194 | $ | 2,860 | $ | 2,673 | $ | 2,569 | $ | 29,582 | $ | 44,340 | ||||||||||||||
The
Company’s hotels also have certain purchase obligations, primarily for
maintenance and service contracts. These are not included in the
contractual obligations since the amounts committed are not material, and
because the majority of these contracts may be terminated on relatively short
notice.
8
Economic
Outlook
The
economic recession affected the Company’s business during 2009. Hotel
business depends heavily on economic activity, and the Company’s U.S. hotels
were impacted in 2009 both from lower consumer demand as well as diminished
corporate spending. The Company’s Boston and New Orleans hotels
depend heavily on corporate groups and conventions, and reduced corporate
spending has a significant negative impact on these market
segments. The expectation for 2010 is that revenues will show modest
growth, at best, which in turn will mean that hotel profits will remain
depressed. During 2009, the Company froze salaries and cut employee
benefits. For 2010, only modest increases were
awarded. The refinancing of the mortgage loan secured by Royal
Sonesta Hotel Boston will result in annual interest savings of approximately
$700,000 starting in February 2010.
It is
impossible to predict the extent of the impact of the continued poor economic
conditions on the Company’s 2010 results. The Company has adequate
cash resources to continue operations, and meet its foreseeable
needs.
Critical
Accounting Policies and Estimates
The
consolidated financial statements are prepared in accordance with accounting
principles generally accepted in the United States, which require the Company to
make estimates and assumptions. The Company believes that of its significant
accounting policies, the following may involve a higher degree of judgment and
complexity.
|
·
|
Revenue
recognition – a substantial portion of our revenues result from the
operations of our owned and leased hotels. These revenues are
recognized at the time that lodging and other hotel services are provided
to our guests. Certain revenues, principally those
relating to groups using lodging and banquet facilities, are billed
directly to the customers. These revenues are subject to
credit risk, which the Company manages by establishing allowances for
uncollectible accounts. If management establishes
allowances for uncollectible accounts that are insufficient, it will
overstate income, and this will result in increases in allowances for
uncollectible accounts in future periods.
Management,
license and service fees represents fee income from hotels operated under
management agreements, and license fees from hotels to which the Company
has licensed the use of the “Sonesta” name. Management fees
include base fees and marketing fees, which are generally based on a
percentage of gross revenues, and incentive fees, which are generally
based on the hotels’ profitability. These fees are typically
based on revenues and income achieved during each calendar
year. Incentive fees, and management fees of which the receipt
is based on annual profits achieved, are recognized throughout the year on
a quarterly basis based on profits achieved during the interim periods
when our agreements provide for quarterly payments during the calendar
years they are earned, and when such fees would be due if the management
agreements were terminated. As a result, during quarterly
periods, fee income may not be indicative of eventual income recognized at
the end of each calendar year due to changes in business conditions and
profitability. License fees are earned based on a percentage of
room revenues of the hotels.
The
Company records the reimbursement of certain expenses incurred on behalf
of managed and affiliated properties, and the costs incurred on behalf of
owners of managed properties on a “gross” basis in revenues and
costs. These costs relate primarily to payroll and benefit
costs of managed properties in which the Company is the
employer.
|
|
·
|
Impairment
of long lived assets – the Company monitors the carrying value of its
owned properties and its investment in development property from the
perspective of accounting rules relating to impairment. A
requirement to assess impairment would be triggered by so called
“impairment indicators”. For us, these might include low rates
of occupancy, operating costs in excess of revenues, or maturing mortgages
for which there were no suitable refinancing
options. Impairment also needs to be considered with respect to
costs incurred for new hotel investments or development opportunities that
are under study. The Company monitors these costs on a
quarterly basis and if a pending project is no longer considered to be
viable, the cost is charged against income. If the Company
estimates incorrectly or misjudges the impairment indicators, it may
result in the Company failing to record an impairment charge, or recording
a charge which may be inaccurate.
|
|
·
|
Pension
Benefits – the Company maintains a defined benefit plan for eligible
employees, which was frozen effective December 31,
2006. Costs and liabilities are developed from
actuarial valuations. In these valuations are assumptions
relating to discount rates, expected return on assets and employee
turnover. Differences between assumed amounts and actual
performance will impact reported amounts for the Company’s pension
expense, as well as the liability for future pension
benefits.
|
|
·
|
Sonesta
Bayfront Hotel Coconut Grove – the Company operates a condominium hotel
under a management agreement, under which it is committed to fund net
operating losses, and provide the owner with minimum annual returns
($419,000 during 2009), adjusted annually by increases in the Consumer
Price Index. In addition, the management agreement may be
subject to termination if the Company elects not to cure shortfalls
against a minimum target return ($978,000 during 2009), adjusted annually
by increases in the Consumer Price Index. Under its agreements,
the Company is entitled to management and marketing fees based on
revenues, and incentive fees based on profits. In case the
aforementioned annual minimum returns and minimum target returns are not
met, the Company’s policy is to eliminate management and marketing fees
from its revenues. If the amount of the shortfall exceeds the
fee income, the Company will book the additional amount as an
administrative and general expense.
|
|
·
|
Trump
International Sonesta Beach Resort - until April 2008, the
Company operated a condominium hotel in Sunny Isles Beach,
Florida. The hotel opened in April 2003. Under
the management agreement, the Company was entitled to management and
marketing fees based on the hotel’s revenues, and incentive fees based on
the hotel’s net operating income. The Company was obligated to advance
funds for operating losses and to provide a minimum annual return of
$800,000 to the hotel’s owner, starting as of November 1,
2004. From the opening in April 2003 until November 1,
2004, the Company was obligated to advance 50% of any net operating
losses. Amounts advanced under these obligations were subject
to repayment, without interest, out of future profits in excess of the
aforementioned minimum return. During the years the minimum
returns were not earned, the Company eliminated the fee income earned from
the property from its revenues. If the amounts of the
shortfalls exceeded the total fee income, the Company reflected such
excess amounts either as long-term receivables and advances on its balance
sheet, or recorded an expense equal to the amount advanced. The
Company exercised its right to terminate the management agreement
effective April 1, 2008, and receive back advances it made under the
agreement totaling $7,031,000. In October
2008,
|
9
|
following
the settlement of a dispute, the Company received $5,002,000 in connection
with the termination of the management agreement, which included the
repayment of advances and the payment of fees which were not previously
recorded. The Company had invested in the furniture, fixtures
and equipment of the non-guestroom areas of the hotel, an amount of
$2,268,000. This was included in other long-term assets, and
was being amortized over the 10-year initial term of the management
agreement. As a result of the decision to terminate the
agreement, the Company accelerated the depreciation of the long-term asset
during the 2007 fourth quarter.
|
|
·
|
Accounting
for 2005 Asset Transfer – in April 2005, the Company completed the
transfer of the land and improvements of Sonesta Beach Key Biscayne to a
development partnership, of which the Company was a 50%
partner. At that time, the Company received non-refundable
proceeds of approximately $60 million, and was entitled to a priority
return of an additional $60 million from the sale proceeds of residential
condominium units to be constructed on the site. Since the
Company had a continuing involvement in the ownership of the development,
the initial gain was being deferred. In 2009, the development
partnership sold its assets and the Company realized the previously
deferred gain (see Note 3 – Investment in Development
Partnership).
|
10
Quantitative
and Qualitative Disclosure of Market Risk
The
Company is exposed to market risk from changes in interest rates. As
of December 31, 2009 the Company used fixed rate debt to finance the ownership
of Royal Sonesta Boston. In February 2010, the loan was replaced with
a new $32 million loan that has a variable interest rate based on LIBOR, but the
Company has entered into an interest rate swap agreement that provides for a
6.4% fixed interest rate for the term of the loan. The table that
follows summarizes the Company’s fixed rate debt obligations, and presents the
fair value of the debt based on current prevailing interest rates for similar
financing. This information should be read in conjunction with Note 5 —
Borrowing Arrangements.
Short and
Long Term Debt (in thousands) maturing in:
|
YEAR
|
||||||||||||||||||||||||||||||||
|
2010
|
2011
|
2012
|
2013
|
2014
|
Thereafter
|
Total
|
Fair Value
|
|||||||||||||||||||||||||
|
Fixed
rate
|
$ | 594 | $ | 563 | $ | 600 | $ | 639 | $ | 681 | $ | 29,118 | $ | 32,195 | $ | 32,195 | ||||||||||||||||
|
Average
interest rate
|
6.5 | % | 6.4 | % | 6.4 | % | 6.4 | % | 6.4 | % | 6.4 | % | ||||||||||||||||||||
Selected
Quarterly Financial Data
Following
are selected quarterly financial information for the years ended December 31,
2009 and 2008.
|
(in
thousands except for per share data)
|
||||||||||||||||
|
2009
|
||||||||||||||||
|
1st
|
2nd
|
3rd
|
4th
|
|||||||||||||
|
Revenues
|
$ | 13,103 | $ | 16,497 | $ | 14,517 | $ | 16,341 | ||||||||
|
Other
revenues from managed and
|
||||||||||||||||
|
affiliated
properties
|
1,221 | 1,082 | 1,045 | 1,013 | ||||||||||||
|
Total
revenues
|
14,324 | 17,579 | 15,562 | 17,354 | ||||||||||||
|
Operating
income (loss)
|
(2,400 | ) | 363 | 148 | 938 | |||||||||||
|
Net
income (loss)
|
(2,212 | ) | (109 | ) | 27,379 | 219 | ||||||||||
|
Net
income (loss) per share
|
$ | (0.60 | ) | $ | (0.03 | ) | $ | 7.41 | $ | 0.06 | ||||||
|
2008
|
||||||||||||||||
|
1st
|
2nd
|
3rd
|
4th
|
|||||||||||||
|
Revenues
|
$ | 17,798 | $ | 20,422 | $ | 16,398 | $ | 16,934 | ||||||||
|
Other
revenues from managed and
|
||||||||||||||||
|
affiliated
properties
|
5,117 | 1,346 | 1,286 | 1,216 | ||||||||||||
|
Total
revenues
|
22,915 | 21,768 | 17,684 | 18,150 | ||||||||||||
|
Operating
income (loss)
|
80 | 2,730 | 4,411 | (550 | ) | |||||||||||
|
Net
income (loss)
|
90 | 1,506 | 2,792 | (308 | ) | |||||||||||
|
Net income
(loss) per share
|
$ | 0.02 | $ | 0.41 | $ | 0.76 | $ | (0.09 | ) | |||||||
11
Fourth
Quarter Results
Revenues
|
TOTAL
REVENUES
(in
thousands)
|
||||||||||||
|
NO.
OF
|
||||||||||||
|
ROOMS
|
2009
|
2008
|
||||||||||
|
Royal
Sonesta Hotel Boston
|
400 | $ | 6,324 | $ | 7,344 | |||||||
|
Royal
Sonesta Hotel New Orleans
|
500 | 8,685 | 7,884 | |||||||||
|
Management
and service fees
|
1,332 | 1,706 | ||||||||||
|
Total
revenues, excluding other revenues from
managed
and affiliated properties
|
$ | 16,341 | $ | 16,934 | ||||||||
Total
revenues, excluding other revenues from managed and affiliated properties,
during the fourth quarter of 2009 were $16,341,000 compared to $16,934,000
during the fourth quarter of 2008, a decrease of $593,000.
Royal
Sonesta Hotel Boston reported fourth quarter 2009 revenues of $6,324,000
compared to $7,344,000 in the fourth quarter of 2008, representing a $1,020,000,
or 14%, decrease. Economic conditions continued to effect the demand
for hotel rooms in the Boston market during the fourth quarter. The
decrease was almost entirely due to an $883,000 decrease in room revenues,
resulting from an 18% decrease in room revenue per available room
(“REVPAR”). The hotel’s occupancy levels during the fourth quarter of
2009 were actually slightly higher compared to 2008, but the hotel’s average
daily room rates declined substantially. The hotel’s group and
convention business continued to decline during the 2009 fourth
quarter. Lack of corporate group and convention business has created
strong competition for transient business, which led to a decline in room rates
from this market segment. Revenues from other sources declined by
$137,000 in the 2009 fourth quarter due to a decrease in banquet revenues,
resulting from the decrease in group and convention business.
Royal
Sonesta Hotel New Orleans reported 2009 fourth quarter revenues of $8,685,000,
which represented an increase of $801,000 compared to 2008 fourth quarter
revenues of $7,884,000. Demand in New Orleans improved during the
2009 fourth quarter, resulting in a $486,000 increase in room revenues, due to a
10% REVPAR increase. This increase was entirely due to higher
occupancy levels. Business from both the group and convention as well
as the transient market segments were up during the 2009 fourth
quarter. Revenues from other sources increased by $315,000, which
included increased banqueting and beverage sales.
Revenues
from management activities decreased from $1,706,000 in the 2008 fourth quarter
to $1,332,000 during the 2009 fourth quarter, a decrease of
$374,000. This was mainly due to a $250,000 decrease in fee income
from the Company’s managed hotels in Egypt. Profit levels at two of
the Company’s resorts in Egypt fell short of thresholds which the hotels need to
achieve in order for the Company to earn incentive fees.
Operating
Income
|
OPERATING
INCOME (LOSS)
(in
thousands)
|
||||||||
|
2009
|
2008
|
|||||||
|
Royal
Sonesta Hotel Boston
|
$ | 676 | $ | 1,257 | ||||
|
Royal
Sonesta Hotel New Orleans
|
388 | (373 | ) | |||||
|
Operating
income from hotels after
management and service
fees
|
1,064 | 884 | ||||||
|
Management
activities and other
income
|
(126 | ) | (1,434 | ) | ||||
|
Operating
income (loss)
|
$ | 938 | $ | (550 | ) | |||
The
Company reported operating income of $938,000 during the fourth quarter of 2009,
compared to an operating loss of $550,000 in the fourth quarter of
2008.
Operating
income at Royal Sonesta Hotel Boston decreased from $1,257,000 in the fourth
quarter of 2008 to $676,000 during the fourth quarter of 2009, a $581,000
decrease. Revenues during the fourth quarter decreased by $1,020,000,
which decrease was partially offset by a $439,000, or 7%, decrease in
expenses. Costs and operating expenses decreased by $188,000, due to
a decrease in payroll and employee benefits costs. In addition,
expenses for administrative and general, sales and marketing, human resources,
and depreciation decreased compared to last year.
Royal
Sonesta Hotel New Orleans reported operating income of $388,000 in the 2009
fourth quarter, an improvement of $761,000 compared to the $373,000 operating
loss in the fourth quarter of 2008. Revenues increased by $801,000 in
the 2009 period, which increase was partially offset by a very slight $40,000
increase in overall expenses. Modest increases in costs and operating
expenses, sales and marketing expense and maintenance costs were partially
offset by decreases in administrative and general expenses. During
the 2008 fourth quarter, the hotel expensed $303,000 for costs incurred during
2006, 2007 and 2008 related to the potential addition of a spa in the hotel,
following its decision to postpone this project indefinitely because of the high
costs.
Operating
loss from management activities, which is computed after giving effect to
management and marketing fees from owned and leased hotels, decreased from
$1,434,000 during the fourth quarter of 2008 to $126,000 during the 2009 fourth
quarter. Decreases in revenues from these activities of $374,000 were
more than offset by a decrease in expenses of $1,682,000 during the 2009 fourth
quarter. The reduction in corporate costs was entirely due to a
decrease in administrative and general expenses. During the 2008
fourth quarter, administrative and general expense included an amount of
$720,000 related to an employment agreement with Roger Sonnabend, the Company’s
former Executive Chairman of the Board, who passed away in December
2008. Expenses in 2008 also included legal fees and other costs
related to a hotel project in Miami. The Company incurred these costs
during 2008 but decided in early 2009 not to pursue this
opportunity. During the 2009 fourth quarter, the Company reversed an
expense totaling $376,000 related to Sonesta Bayfront Hotel Coconut
Grove. During the first nine months of 2009, the Company provided for
the cost to cure a target return under the contract for this
hotel. In January 2010, the Company decided not to cure this target
return for the 2009 calendar year (see also Note 2,
Operations). Administrative and general expenses in the 2009 quarter
were also lower compared to 2008 due to decreases in employee benefits costs,
following the suspension of matching 401(k) contributions starting in April
2009, and due to lower bonus expense.
12
SONESTA
INTERNATIONAL HOTELS CORPORATION
CONSOLIDATED
STATEMENTS OF OPERATIONS
For the
years ended December 31, 2009 and 2008
(in
thousands, except for per share data)
|
2009
|
2008
|
|||||||
|
Revenues:
|
||||||||
|
Rooms
|
$ | 35,215 | $ | 41,052 | ||||
|
Food and beverage
|
16,209 | 17,519 | ||||||
|
Management, license and service
fees
|
4,302 | 7,956 | ||||||
|
Parking, telephone and
other
|
4,732 | 5,025 | ||||||
| 60,458 | 71,552 | |||||||
|
Other
revenues from managed and affiliated properties
|
4,361 | 8,965 | ||||||
|
Total
revenues
|
64,819 | 80,517 | ||||||
|
Costs
and expenses:
|
||||||||
|
Costs and operating
expenses
|
28,009 | 30,819 | ||||||
|
Advertising and
promotion
|
5,688 | 5,608 | ||||||
|
Administrative and
general
|
12,363 | 14,405 | ||||||
|
Human resources
|
904 | 1,191 | ||||||
|
Maintenance
|
3,395 | 3,549 | ||||||
|
Rentals
|
4,486 | 5,392 | ||||||
|
Property taxes
|
1,385 | 1,358 | ||||||
|
Depreciation and
amortization
|
5,179 | 5,838 | ||||||
| 61,409 | 68,160 | |||||||
|
Other expenses from managed and
affiliated properties
|
4,361 | 8,965 | ||||||
|
Total
costs and expenses
|
65,770 | 77,125 | ||||||
|
Income
from Management Agreement settlement, net
|
-- | 3,279 | ||||||
|
Operating
income (loss)
|
(951 | ) | 6,671 | |||||
|
Other
income (deductions):
|
||||||||
|
Interest expense
|
(2,865 | ) | (2,970 | ) | ||||
|
Interest income
|
402 | 1,182 | ||||||
|
Foreign exchange
loss
|
(16 | ) | (2 | ) | ||||
|
Gain on sales of assets and
dissolution of development partnership
|
41,875 | 576 | ||||||
| 39,396 | (1,214 | ) | ||||||
|
Income
before income taxes
|
38,445 | 5,457 | ||||||
|
Income
tax expense
|
13,168 | 1,377 | ||||||
|
Net
income
|
$ | 25,277 | $ | 4,080 | ||||
|
Basic
and diluted income per share
|
$ | 6.84 | $ | 1.10 | ||||
|
Dividends
per share
|
$ | 1.00 | $ | 1.35 | ||||
|
Weighted
average number of shares outstanding
|
3,698 | 3,698 | ||||||
See
accompanying notes to consolidated financial statements.
13
SONESTA
INTERNATIONAL HOTELS CORPORATION
CONSOLIDATED
BALANCE SHEETS
December
31, 2009 and 2008
(in
thousands, except for per share data)
|
2009
|
2008
|
|||||||
|
ASSETS
|
||||||||
|
Current
assets:
|
||||||||
|
Cash and cash
equivalents
|
$ | 35,557 | $ | 37,463 | ||||
|
Restricted cash
|
-- | 175 | ||||||
|
Accounts and notes
receivable:
|
||||||||
|
Trade, less allowance of $70 ($59
in 2008) for doubtful accounts
|
5,092 | 5,407 | ||||||
|
Other, including current portion
of long-term receivables andadvances
|
1,242 | 1,001 | ||||||
|
Total accounts and notes
receivable
|
6,334 | 6,408 | ||||||
|
Inventories
|
623 | 628 | ||||||
|
Current deferred tax
assets
|
476 | 462 | ||||||
|
Prepaid expenses and other
current assets
|
1,242 | 2,163 | ||||||
|
Total current
assets
|
44,232 | 47,299 | ||||||
|
Long-term
receivables and advances
|
1,354 | 992 | ||||||
|
Deferred
tax assets
|
-- | 9,049 | ||||||
|
Investment
in development partnership (see Note 3)
|
-- | 33,666 | ||||||
|
Property
and equipment, at cost:
|
||||||||
|
Land and land
improvements
|
2,102 | 2,102 | ||||||
|
Buildings
|
25,721 | 25,610 | ||||||
|
Furniture and
equipment
|
30,859 | 30,150 | ||||||
|
Leasehold
improvements
|
9,109 | 8,785 | ||||||
|
Projects in
progress
|
64 | 472 | ||||||
| 67,855 | 67,119 | |||||||
|
Less accumulated depreciation and
amortization
|
33,585 | 32,088 | ||||||
|
Net property and
equipment
|
34,270 | 35,031 | ||||||
|
Other
long-term assets
|
875 | 1,003 | ||||||
| $ | 80,731 | $ | 127,040 | |||||
See
accompanying notes to consolidated financial statements.
14
SONESTA
INTERNATIONAL HOTELS CORPORATION
CONSOLIDATED
BALANCE SHEETS
|
2009
|
2008
|
|||||||
|
LIABILITIES
AND STOCKHOLDERS’ EQUITY
|
||||||||
|
Current
liabilities:
|
||||||||
|
Current portion of long-term
debt
|
$ | 594 | $ | 1,163 | ||||
|
Accounts payable
|
2,887 | 3,747 | ||||||
|
Advance deposits
|
1,103 | 1,281 | ||||||
|
Accrued income
taxes
|
327 | 402 | ||||||
|
Accrued
liabilities:
|
||||||||
|
Salaries and
wages
|
1,278 | 1,772 | ||||||
|
Rentals
|
3,741 | 4,787 | ||||||
|
Interest
|
236 | 244 | ||||||
|
Pension and other employee
benefits
|
2,064 | 1,612 | ||||||
|
Other
|
1,028 | 862 | ||||||
| 8,347 | 9,277 | |||||||
|
Total current
liabilities
|
13,258 | 15,870 | ||||||
|
Long-term
debt
|
31,245 | 31,839 | ||||||
|
Deferred
gain (see Note 3)
|
-- | 64,481 | ||||||
|
Pension
liability, non-current
|
6,554 | 9,338 | ||||||
|
Other
non-current liabilities
|
1,082 | 1,386 | ||||||
|
Deferred
tax liabilities
|
1,939 | -- | ||||||
|
Commitments
and contingencies (see Note 7)
|
||||||||
|
Stockholders’
equity:
|
||||||||
|
Common stock:
|
||||||||
|
Class A, $.80 par
value
|
||||||||
|
Authorized--10,000
shares
|
||||||||
|
Issued – 6,102 shares at stated
value
|
4,882 | 4,882 | ||||||
|
Retained
earnings
|
35,734 | 14,155 | ||||||
|
Treasury shares – 2,404, at
cost
|
(12,053 | ) | (12,053 | ) | ||||
|
Accumulated other comprehensive
loss
|
(1,910 | ) | (2,858 | ) | ||||
|
Total stockholders’
equity
|
26,653 | 4,126 | ||||||
| $ | 80,731 | $ | 127,040 | |||||
15
SONESTA
INTERNATIONAL HOTELS CORPORATION
CONSOLIDATED
STATEMENTS OF STOCKHOLDERS’ EQUITY
|
|
For
the years ended December 31, 2009 and
2008
|
|
|
(in
thousands, except for per share
data)
|
|
Common
Shares Outstanding
|
Class
A Common Stock
|
Treasury
Shares at Cost
|
Retained
Earnings
|
Accumulated
Other Comprehensive Income (Loss)
|
Total
Stockholders’
Equity
|
||||||||||||||||
|
3,698
|
Balance
January 1, 2008
|
$ | 4,882 | $ | (12,053 | ) | $ | 15,068 | $ | 650 | $ | 8,547 | |||||||||
|
--
|
Cash
dividends declared on common stock ($1.35 per share)
|
-- | -- | (4,993 | ) | -- | (4,993 | ) | |||||||||||||
|
--
|
Net
income
|
-- | -- | 4,080 | -- | 4,080 | |||||||||||||||
|
--
|
Pension
plan, actuarial loss recognized
|
-- | -- | -- | (3,508 | ) | (3,508 | ) | |||||||||||||
|
3,698
|
Balance
December 31, 2008
|
4,882 | (12,053 | ) | 14,155 | (2,858 | ) | 4,126 | |||||||||||||
|
--
|
Cash
dividends declared on common stock ($1.00 per share)
|
-- | -- | (3,698 | ) | -- | (3,698 | ) | |||||||||||||
|
--
|
Net
income
|
-- | -- | 25,277 | -- | 25,277 | |||||||||||||||
|
--
|
Pension
plan, actuarial gain recognized
|
-- | -- | -- | 948 | 948 | |||||||||||||||
|
3,698
|
Balance
December 31, 2009
|
$ | 4,882 | $ | (12,053 | ) | $ | 35,734 | $ | (1,910 | ) | $ | 26,653 | ||||||||
SONESTA
INTERNATIONAL HOTELS CORPORATION
CONSOLIDATED
STATEMENTS OF COMPREHENSIVE INCOME (LOSS)
|
|
For
the years ended December 31, 2009 and
2008
|
|
|
(in
thousands)
|
|
2009
|
2008
|
|||||||
|
Net
income
|
$ | 25,277 | $ | 4,080 | ||||
|
Other
comprehensive income (loss), net of tax:
|
||||||||
|
Pension
Plan, actuarial income (loss) recognized
|
948 | (3,508 | ) | |||||
|
Comprehensive
income
|
$ | 26,225 | $ | 572 | ||||
See
accompanying notes to consolidated financial statements.
16
SONESTA
INTERNATIONAL HOTELS CORPORATION
CONSOLIDATED
STATEMENTS OF CASH FLOWS
For the
years ended December 31, 2009 and 2008
(in
thousands)
|
2009
|
2008
|
|||||||
|
Cash
provided (used) by operating activities
|
||||||||
|
Net income
|
$ | 25,277 | $ | 4,080 | ||||
|
Adjustments to reconcile net
income to net cash
|
||||||||
|
provided (used) by operating
activities
|
||||||||
|
Depreciation and amortization of
property and equipment
|
5,179 | 5,838 | ||||||
|
Other amortization and non-cash
expenses
|
92 | 262 | ||||||
|
Deferred federal and state income
tax provision
|
11,994 | 353 | ||||||
|
Gain on sales of assets and
dissolution of development
partnership
|
(41,875 | ) | (576 | ) | ||||
|
Changes in assets and
liabilities
|
||||||||
|
Restricted cash
|
175 | 1,526 | ||||||
|
Accounts and notes
receivable
|
(44 | ) | (39 | ) | ||||
|
Inventories
|
5 | (21 | ) | |||||
|
Prepaid expenses and
other
|
(146 | ) | 71 | |||||
|
Accounts payable
|
64 | (1,301 | ) | |||||
|
Advance deposits
|
(178 | ) | (1,655 | ) | ||||
|
Income taxes
|
953 | (223 | ) | |||||
|
Accrued
liabilities
|
(2,474 | ) | (319 | ) | ||||
|
Cash provided (used) by
operating activities
|
(978 | ) | 7,996 | |||||
|
Cash
provided by investing activities
|
||||||||
|
Proceeds from sales of
assets
|
257 | 1,058 | ||||||
|
Payments received from development
partnership
|
9,412 | 125 | ||||||
|
Expenditures for property and
equipment
|
(4,612 | ) | (3,494 | ) | ||||
|
New loans and
advances
|
(3,224 | ) | (135 | ) | ||||
|
Payments received on long-term
receivables and advances
|
3,025 | 4,789 | ||||||
|
Cash provided by investing
activities
|
4,858 | 2,343 | ||||||
|
Cash
used in financing activities
|
||||||||
|
Repayments of long-term
debt
|
(1,163 | ) | (1,058 | ) | ||||
|
Cash dividends
paid
|
(4,623 | ) | (4,438 | ) | ||||
|
Cash used in financing
activities
|
(5,786 | ) | (5,496 | ) | ||||
|
Net
increase (decrease) in cash and cash equivalents
|
(1,906 | ) | 4,843 | |||||
|
Cash
and cash equivalents at beginning of year
|
37,463 | 32,620 | ||||||
|
Cash
and cash equivalents at end of year
|
$ | 35,557 | $ | 37,463 | ||||
See
accompanying notes to consolidated financial statements.
17
SONESTA
INTERNATIONAL HOTELS CORPORATION
NOTES
TO CONSOLIDATED FINANCIAL STATEMENTS
|
1.
|
Basis
of Presentation and Significant Accounting
Policies
|
Basis
of Presentation:
Sonesta
International Hotels Corporation (the Company) is engaged in the operation of
hotels in Boston, Massachusetts and New Orleans, Louisiana. The
Company also operates, under management agreements, hotels in Coconut Grove,
Florida, and Sunny Isles, Florida (until March 2008); and in Cairo, Sharm El
Sheikh, Luxor, Taba, Hurghada and Port Said (until March 2009),
Egypt. The Company also manages five Nile River cruise ships in
Egypt. Sonesta has granted licenses, for which it receives fees, for
the use of its name for hotels in St. Maarten, Brazil, Chile, Colombia and
Peru.
Principles
of Consolidation:
The
consolidated financial statements include the results of operations of
wholly-owned and leased properties, and fee income and certain revenues and
costs from reimbursable expenses incurred at managed and affiliated
properties. All significant intercompany balances and transactions
have been eliminated. The Company has identified certain of its
management agreements as variable interest entities. However, the
Company does not believe it bears the majority of the risk of loss from the
variable interest entity’s activities, nor is it entitled to receive the
majority of the variable interest entity’s residual returns. As a
result, these entities are not consolidated in the Company’s financial
statements.
Foreign
Currency Transactions:
Assets
and liabilities denominated in foreign currency are converted at end of year
rates, and income and expense items are converted at weighted average rates
during the period. The net result of such conversions is charged or
credited to the statement of operations.
Inventories:
Inventories
consist of merchandise and supplies, and are stated at the lower of cost
(first-in/first-out method) or market.
Revenue
Recognition:
The
Company’s revenues are primarily derived from (1) owned and leased hotels, (2)
management, license and service fees and (3) other revenues from managed and
affiliated properties.
|
·
|
Owned
and leased hotels – The majority of the Company’s income is derived
from its owned and leased hotels from the rental of rooms, food
and beverage sales as well as charges for parking, telephone and other
incidental charges. These revenues are recognized when rooms
are occupied and services have been
rendered.
|
|
·
|
Management,
license and service fees – Represents fee income from hotels operated
under management agreements, and license fees from hotels to which the
Company has licensed the use of the “Sonesta” name. Management
fees include base fees and marketing fees, which are generally based on a
percentage of gross revenues, and incentive fees, which are generally
based on the hotels’ profitability. These fees are typically
based on revenues and income achieved during each calendar
year. Incentive fees, and management and marketing fees of
which the receipt is based on annual profits achieved, are recognized
throughout the year on a quarterly basis based on profits achieved during
the interim periods when our agreements provide for quarterly payments
during the calendar years they are earned, and when such fees would be due
if the management agreements were terminated. As a result,
during quarterly periods, fee income may not be indicative of eventual
income recognized at the end of each calendar year due to changes in
business conditions and profitability. License fees are earned
based on a percentage of room revenues of the hotels. Revenues
and expenses of hotels operated under management agreements are excluded
from the Company’s consolidated statements of operations, except for
certain costs described below.
|
|
·
|
Other
revenues from managed and affiliated properties – The reimbursements of
certain expenses incurred on behalf of managed and affiliated properties,
and the costs incurred on behalf of owners of managed properties are
recorded on a “gross” basis in revenues and costs. These costs
relate primarily to payroll and related costs of managed properties in
which the Company is the employer. The revenue for these costs
is included in Other revenue from managed and affiliated properties and
the offsetting expense is included in Other expenses from managed and
affiliated properties.
|
Advertising:
The cost
of advertising is generally expensed as incurred.
Property
and Equipment:
Property
and equipment are stated at cost. Depreciation and amortization of
items of property and equipment are computed on the straight-line method based
on the following estimated useful lives:
|
Buildings
and building improvements:
|
||
|
Owned
properties
|
10
to 40 years
|
|
|
Furniture
and Equipment:
|
||
|
Located
in owned properties
|
5
to 10 years
|
|
|
Located
in leased properties
|
5
to 10 years or remaining lease terms
|
|
|
Leasehold
improvements:
|
Remaining
lease terms
|
|
Impairment
of Long-Lived Assets and Long-Lived Assets to be Disposed of:
The
carrying values of long-lived assets, which include property and equipment and
intangibles, are evaluated periodically for impairment when impairment
indicators are present. Future undiscounted cash flows of the
underlying assets are compared to the assets’ carrying
values. Adjustments to fair value are made if the sum of expected
future undiscounted cash flows are less than book value. To date, no
adjustments for impairment have been made.
Income
Taxes:
We use
the asset and liability method to account for income taxes. Under
this method, deferred income taxes reflect the net tax effects of temporary
differences between the carrying amount of assets and liabilities for financial
statement and income tax purposes and tax carry forwards, as determined under
enacted tax laws and rates. The Company and its United States
subsidiaries file a consolidated federal income tax return. Federal
and foreign income taxes are provided on earnings of foreign
subsidiaries.
Fair
Value of Financial Instruments:
The
Company's financial instruments consist of cash and cash equivalents, accounts
and notes receivable, accounts payable and long-term debt. The
Company believes that the carrying value of its financial instruments
approximates their fair values. The majority of the Company’s cash
and cash equivalents at December 31, 2009 were held in money market mutual funds
and non-interest bearing bank accounts. The book balance at December
31, 2009 of the Company’s
18
long-term
debt, which carries an interest rate of 8.6%, is $31,839,000, which approximates
its fair value.
Fair
Value Measurements:
Effective
January 1, 2008, the Company adopted the new standard regarding fair value which
establishes a new framework for measuring fair value and expands related
disclosures. Broadly, the framework requires fair value to be
determined based on the exchange price that would be received for an asset or
paid to transfer a liability (an exit price) in the principal or most
advantageous market for the asset or liability in an orderly transaction between
market participants. The standard established a three-level valuation
hierarchy based upon observable and non-observable inputs.
Observable
inputs reflect market data obtained from independent sources, while unobservable
inputs reflect our market assumptions. Preference is given to
observable inputs. These two types of inputs create the following
fair value hierarchy:
Level 1 –
Quoted prices for identical instruments in active markets.
Level 2 –
Quoted prices for similar instruments in active markets; quoted prices for
identical or similar instruments in markets that are not active; and
model-derived valuations whose inputs are observable or whose significant value
drivers are observable.
Level 3 –
Significant inputs to the valuation model are unobservable.
The
Company maintains policies and procedures to value instruments using the best
and most relevant data available.
Impact
of Recently Issued Accounting Standards:
The FSAB
has issued ASU
2009-16 which amends FASB ASC 810, “Consolidation” (originally issued as
SFAS No. 160, “Noncontrolling
Interest in Consolidated Financial Statements”). ASU 2009-16
addresses consolidation rules for noncontrolling interests. The
objective is to improve the relevance, comparability, and transparency of the
financial information that a reporting entity provides in its consolidated
financial statements by establishing accounting and reporting standards for the
noncontrolling interest in a subsidiary and for the deconsolidation of a
subsidiary. It applies to all entities that prepare consolidated
financial statements, except for not-for-profit organization, but will affect
only those entities that have an outstanding noncontrolling interest in one or
more subsidiaries or that deconsolidate a subsidiary. This guidance
is effective for fiscal years, and interim periods within those fiscal years,
beginning on or after December 15, 2008. The adoption of ASU 2009-16
did not have a material impact on the Company’s financial
statements
The FSAB
has issued FASB ASC 805, “Business Combinations” (ASC 805) (originally issued as
SFAS No.141R, “Business
Combinations”). The objective is to provide consistency to the
accounting and financial reporting of business combinations by using only one
method, the purchase method. This Statement is effective for fiscal
years, and interim periods within those fiscal years, beginning on or after
December 15, 2008. The provisions of ASC 805 will be applied to
future business combinations that the Company enters into.
In March
2008, the FASB amended the guidance in FASB ASC 815, “Derivatives and Hedging”
(ASC 815) (originally issued as SFAS No. 161, “Disclosures about Derivative
Instruments and Hedging Activities”). The amendment to ASC 815
enhances the disclosure requirements for derivative instruments and hedging
activities. Entities are required to provide enhanced disclosures
about (a) how and why an entity uses derivative instruments, (b) how derivative
instruments and related hedged items are accounted for under ASC 815, and its
related interpretations, and (c) how derivative instruments and related hedged
items affect an entity’s financial position, financial performance and cash
flows. This Statement is effective for fiscal years, and interim
periods within those fiscal years, beginning after November 15,
2008. Through December 31, 2009, the Company did not use any
derivative instruments. As a result the adoption of the amended ASC
815 guidance did not have an impact on the Company’s financial
statements.
Use
of Estimates:
The
preparation of financial statements in conformity with accounting principles
generally accepted in the United States requires management to make estimates
and assumptions that affect the amounts reported in the financial statements and
accompanying notes. Actual results could differ from those
estimates.
Subsequent
Events:
The
Company evaluated all events or transactions that occurred after December 31,
2009 through the date of this annual report. The only significant
subsequent event were the refinancing of a mortgage loan as further described in
Note 5, Borrowing Arrangements and loans made to managed and licensed properties
further described in Note 7. Commitments and
Contingencies.
Statement
of Cash Flows:
Cash and
cash equivalents consist of cash on hand and short-term, highly liquid
investments with original maturities of less than 90 days, which are readily
convertible into cash.
Cash paid
for interest in 2009 and 2008 was approximately $2,832,000 and $2,936,000,
respectively. Cash paid for income taxes in 2009 and 2008 was
approximately $236,000 and $1,350,000, respectively.
In August
2009, the Company made a loan of $1,363,000 to the owner of Sonesta St. George
Hotel Luxor and Sonesta St. George I Cruise Ship, which are both managed by the
Company. The loan included the conversion of receivables for fees and
expenses totaling $863,000, and as a result the Company recorded the following
non-cash transaction (in thousands):
|
Increase
in Long term receivables
|
$ | 863 | ||
|
Decrease
in Accounts Receivable
|
(863 | ) |
In
January 2008, the Company agreed to convert approximately $1.6 million of
receivables for fees and expenses from two hotels it manages in Sharm El Sheikh,
Egypt into a five year loan. In addition, the Company paid the
hotels’ owner $500,000 for an extension of the management agreement for one of
the hotels, which payment was made by reducing outstanding
receivables. In connection with this transaction, the Company
recorded the following non-cash transaction (in thousands):
|
Increase
in Long term receivables
|
$ | 1,473 | ||
|
Increase
in Long term assets
|
545 | |||
|
Decrease
in Accounts Receivable
|
(2,018 | ) |
|
2.
|
Operations
|
The
Company operates the Sonesta Bayfront Hotel Coconut Grove, in Miami, which is a
condominium hotel that opened in April 2002. Under its agreements,
the Company is committed to fund net operating losses, and to provide the
hotel’s owner with a minimum annual return ($419,000 during 2009), adjusted
annually by increases in the Consumer Price Index (“CPI”). The
management agreement can be terminated by the hotel’s owner if the Company fails
to cure shortfalls against a minimum target return ($978,000 during 2009),
adjusted annually by increases in the CPI. The hotel’s 2008 net
operating profit was sufficient to cover the owner’s target return and the
Company’s fees from the hotel of $1,039,000. In 2009, the hotel’s net
operating profit fell short of the target return but was sufficient to cover
the
19
minimum
annual return and fees to the Company totaling $150,000. The Company
has decided not to fund the owner’s target return for 2009, and notified the
owner of same in January 2010. As a result, the owner had the right
to terminate the management agreement provided it sent the Company a termination
notice on or before March 3, 2010, but the hotel’s owner did not exercise this
right. (While the hotel’s owner has claimed that the notice deadline
was extended beyond March 3, 2010, the Company has advised the owner of its
position that the deadline has passed.) In October 2008, the Company
received $2,627,000 in connection with the repayment of a loan made to the owner
of the hotel for initial furniture, fixtures and equipment and pre-opening
expenses.
In August
2009, the Company loaned a total of $1,363,000 to the owner of Sonesta St.
George Hotel Luxor and Sonesta St. George I Cruise Ship, which are both managed
by the Company. The loan consisted of cash advances of $500,000 and a
conversion of receivables for fees and expenses due to the Company from the
hotel and the ship. The proceeds of the loan helped fund improvements
to the Luxor hotel, including additional rooms and meeting
facilities. The hotel’s owner also agreed to an extension of the
management agreement by 5 years.
During
2009, the Company launched a franchise program, focused on adding additional
Sonesta hotels in the United States. A franchise agreement was signed
in late 2009 for a hotel in Orlando, which was reflagged as Sonesta Hotel
Orlando Downtown in January 2010. Under its franchise agreements, the
Company is entitled to receive fees based on gross room revenues of the
hotel.
During
2009, the Company added 5 hotels in Valledupar, Colombia; Cusco, Peru; and
Concepcion, Calama, and Osorno, Chile. Under the franchise agreements
for these hotels, the Company receives fees for the use of its
name. In December 2009, license agreements for two hotels in St.
Maarten were extended by a minimum period of 5 years. Completion of a
resort in Jaco, Costa Rica has been delayed. The Company has a
management agreement to operate the hotel upon completion.
In
January 2008, the Company agreed to pay $500,000 to the owners of its two
managed hotels in Sharm El Sheikh, Egypt, in return for an extension until 2024
of the management agreement for Sonesta Club, which otherwise would have expired
in 2009. The payment was made by reducing receivables for fees and
expenses from this hotel. In addition, the Company agreed to convert
approximately $1.6 million of receivables from both hotels into a five-year
loan, at an interest rate below market (5.25%). The Company accounted
for the loan based on a market rate of 6.5%, and discounted the loans
accordingly. The discount of $45,000, in addition to the $500,000
payment, has been recorded as an other long term asset, and will be amortized
over the extended term of the management agreement.
From
April 2003 through March 2008, the Company operated Trump International Sonesta
Beach Resort Sunny Isles, in Florida, under a management
agreement. The Company had a one-time right to cancel the management
agreement, effective five years after the opening date, upon 6 months notice,
and receive repayment of advances it was obligated to make for net operating
losses and certain minimum returns due to the hotel’s owner. The
amount due upon termination, $7,031,000, was disputed by the hotel’s
owner. An arbitration procedure to resolve the dispute commenced in
April 2008 and was settled in October 2008. The Company received a
total of $5,002,000, which included the amount of the settlement of $4,929,000,
and its share of the interest earned on an escrow account in the amount of
$73,000. Of the settlement amount, $1,135,000 repaid the Company’s
outstanding receivable. After deducting $515,000 for legal and other
costs in connection with the arbitration, the remaining amount of $3,279,000 was
recorded as income in the 2008 third quarter. This amount relates to
fees due to the Company which were not previously recorded since the hotel’s
profits were insufficient to pay them, and the collectability was
uncertain.
Gross
revenues for hotels operated by the Company under management contracts for third
party owners, by geographic area, for the years ended December 31, 2009 and
2008, are summarized below:
|
(in
thousands)
|
||||||||
|
(unaudited)
|
||||||||
|
2009
|
2008
|
|||||||
|
United
States(1)
|
$ | 9,376 | $ | 26,060 | ||||
|
Egypt
|
64,376 | 73,569 | ||||||
| $ | 73,752 | $ | 99,629 | |||||
(1)
Includes Trump International Sonesta Beach Resort Sunny Isles through March
2008.
Costs and
operating expenses for owned and leased hotels for the years ended December 31,
2009 and 2008 are summarized below:
|
(in
thousands)
|
||||||||
|
2009
|
2008
|
|||||||
|
Direct
departmental costs:
|
||||||||
|
Rooms
|
$ | 9,869 | $ | 10,760 | ||||
|
Food and beverage
|
13,404 | 14,246 | ||||||
|
Heat, light and
power
|
2,330 | 2,932 | ||||||
|
Other
|
2,406 | 2,881 | ||||||
| $ | 28,009 | $ | 30,819 | |||||
Direct
departmental costs include payroll expense and related payroll burden, the cost
of food and beverage consumed and other departmental costs.
|
3.
|
Investment
in Development Partnership
|
The
Company was a 50% limited partner in a development partnership which owned the
land and improvements formerly comprising the Sonesta Beach Resort Key
Biscayne. The Company contributed the land and improvements to the
partnership in April 2005, and the hotel closed in August 2006. The
Company deferred the $64,481,000 gain on the transfer due to the Company’s
continuing involvement in the partnership.
The
intent of the partnership was to develop a new condominium resort on the site,
but due to permitting issues and the deterioration of the real estate market in
South Florida these plans did not materialize. The partnership sold
the Resort land and improvements in September 2009 for $78 million in
cash. In connection with this sale, the Company received $12,076,000
in September 2009, consisting of repayment of advances made to the partnership
during 2009 of $2,664,000 and $9,412,000 for its share of the sale
proceeds.
The sale
ended the Company’s continuing involvement in the resort and resulted in the
Company recognizing a pre-tax gain of $41,843,000 during the 2009 third
quarter. The gain consists of the $64,481,000 previously deferred
gain, plus the $9,412,000 of sale proceeds received during the third quarter of
2009, less the Company’s carrying value of its investment in the partnership
(see table below). The carrying value of the investment was adjusted
by $1,616,000 during the 2009 third quarter upon final reconciliation of the
property’s book and tax basis.
20
|
Reconciliation
of Gain (in thousands)
|
||||
|
Deferred
gain
|
$ | 64,481 | ||
|
Additional
proceeds
|
9,412 | |||
|
Less
investment
|
(32,050 | ) | ||
|
Gain
recognized
|
$ | 41,843 | ||
|
4.
|
Long-Term
Receivables and Advances
|
|
(in
thousands)
|
||||||||
|
December 31,2009
|
December 31,2008
|
|||||||
|
Sharm
El Sheikh, Egypt (a)
|
$ | 940 | $ | 1,215 | ||||
|
Luxor,
Egypt (b)
|
1,311 | -- | ||||||
|
Other
|
215 | 187 | ||||||
|
Total long-term receivables and
advances
|
2,466 | 1,402 | ||||||
|
Less: current
portion
|
1,112 | 410 | ||||||
|
Net long-term receivables and
advances
|
$ | 1,354 | $ | 992 | ||||
|
(a)
|
This
loan was made in January 2008 to the owners of Sonesta Beach Hotel Sharm
El Sheikh and Sonesta Club Sharm El Sheikh by converting receivables for
fees and expenses into a five year loan, payable in monthly installments,
starting in January 2008. The Company is accounting for this
loan using an effective interest rate of 6.5%. Monthly payments
of $28,820 on this loan are paid directly from the hotels and deducted
from distributions of profits to the owners of these managed
hotels.
|
|
(b)
|
These
loans, in the original amount of $1,363,000, were made in August 2009 to
the owner of Sonesta St. George Hotel Luxor and Sonesta St. George I
Cruise Ship, which are both managed by the Company. The loans
consist of cash advances of $500,000, and the conversion of receivables
for fees and expenses due to the Company totaling $863,000. The
Company made these loans to assist the owner with the financing of
improvements to the Sonesta St. George Hotel Luxor, which included
additional guest rooms and meeting/function space. The interest
rate is 5.25%, and payments of interest and principal commenced in
November 2009. The last payment is due October
2011.
|
Management
continually monitors the collectability of its receivables and advances and
believes they are fully realizable.
|
5.
|
Borrowing
Arrangements
|
Long-Term
Debt
The
Company’s long-term debt consists of a first mortgage note payable by
Charterhouse of Cambridge Trust and Sonesta of Massachusetts, Inc., which are
the Company’s subsidiaries that own and operate the Royal Sonesta Hotel
Boston. The principal balance outstanding at December 31, 2009 and
December 31, 2008 was $31,839,000 and $33,002,000, respectively. The
debt is secured by a first mortgage on the Royal Sonesta Hotel Boston property,
which is included in fixed assets at a net book value of $19,385,000 at December
31, 2009. This loan, which was to mature in July 2010, carried an
interest rate of 8.6%. Monthly payments of principal and interest
were $332,911.
On
February 12, 2010, the Company refinanced the mortgage loan. The
existing non-recourse loan in the principal amount of $31,645,000 was paid
off. The loan was replaced with a new $32 million
loan. This loan, which will mature March 1, 2015, has a variable rate
based on LIBOR, but the Company has entered into an interest swap agreement that
provides for a 6.4% fixed interest rate for the term of the
loan. Payments of interest and principal, based on a 25 year
amortization period, will be $642,213 per quarter. The Company paid a
1% fee at closing, and is also responsible for legal and other costs related to
the new loan. The loan is secured by:
|
1.
|
a
first mortgage on the Royal Sonesta Hotel Boston
property,
|
|
2.
|
a
parent company guaranty of $5 million,
and
|
|
3.
|
a
restricted cash collateral account in the amount of $5
million. This cash collateral account will be released over a
two year period provided the Hotel achieves certain debt service coverage
ratios.
|
The loan
is subject to a maximum loan to value ratio, and to minimum debt service
coverage ratios, which will be tested quarterly based on trailing twelve month
earnings of the Hotel.
Aggregate
principal payments for the years subsequent to December 31, 2009, are as
follows:
|
Year
|
(in thousands)
|
|||
|
2010
|
$ | 594 | ||
|
2011
|
563 | |||
|
2012
|
600 | |||
|
2013
|
639 | |||
|
2014
|
681 | |||
|
Thereafter
|
29,118 | |||
|
6.
|
Stockholders’
Equity
|
Basic
Income per Share
As the
Company has no dilutive securities, there is no difference between basic and
diluted earnings per share. The following table sets forth the
computation of basic income or loss per share (in thousands, except for per
share data):
|
2009
|
2008
|
|
|
Numerator:
|
||
|
Net income
|
$25,277
|
$4,080
|
|
Denominator:
|
||
|
Weighted average number of
shares outstanding
|
3,698
|
3,698
|
|
Net
income per share
|
$6.84
|
$1.10
|
|
7.
|
Commitments
and Contingencies
|
The
Company operates the Sonesta Bayfront Hotel Coconut Grove, Miami, which is a
condominium hotel that opened in April 2002. Under the management
agreement for this hotel, the Company is committed to fund operating losses and
a minimum annual return to the owner of the hotel. During 2009 and
2008, the hotel’s earnings were sufficient to cover the minimum
return. Further information is provided in Note 2 –
Operations.
In
February 2010, the Company signed agreements to loan $1,000,000 to the owners of
two hotels in St. Maarten, to which the Company licenses the use of its
name. The proceeds will be used to fund improvements at both of the
properties. At the same time, the license agreements for these
properties were extended by a minimum of five years.
The
Company operates Royal Sonesta Hotel New Orleans under a lease, under which rent
payable to the landlord equals 75% of net cash flow.
21
In
January 2010, the Company made a loan of $500,000 to the owner of Sonesta Beach
Resort Sharm El Sheikh, to help finance the development of additional hotel
rooms and facilities.
Minimum
fixed rentals under operating leases, principally on real estate, payable
subsequent to December 31, 2009 (exclusive of real estate taxes, insurance and
other occupancy costs) are as follows:
|
(in
thousands)
|
||||
|
Period
|
Operating leases
|
|||
|
2010
|
$ |
737
|
||
|
2011
|
625 | |||
|
2012
|
291 | |||
|
2013
|
104 | |||
Rentals
charged to operations are as follows:
|
(in
thousands)
|
||||||||
|
2009
|
2008
|
|||||||
|
Real
Estate:
|
||||||||
|
Fixed rentals
|
$ | 738 | $ | 661 | ||||
|
Percentage rentals based on
defined operating profits
|
3,748 | 4,731 | ||||||
| $ | 4,486 | $ | 5,392 | |||||
The
Company has incentive compensation plans for management under which hotel profit
bases, as established annually, must be achieved before any incentive
compensation may be earned. The incentive compensation charged to
operations was $232,000 in 2009 and $865,000 in 2008.
|
8.
|
Pension
and Benefit Plans
|
Pension
Plan
The
Company maintains a non-contributory defined benefit pension plan (the Plan) for
certain employees of Sonesta International Hotels Corporation and its
subsidiaries. Benefits are based on the employee’s years of service
and the highest average monthly salary during any 60 consecutive months of
employment. The Company’s funding policy is to contribute annually at
least the minimum contribution required by ERISA. The Company
does not offer any other post-retirement benefit plans.
Pension
Plan Freeze
Effective
December 31, 2006, the Company froze the Plan. Participants in the
Plan at December 31, 2006 continue to be eligible to receive a pension benefit,
provided they meet the 5 years of service vesting requirement during their
employment with the Company. However, the amount of all pension
benefits due under the Plan was frozen at the December 31, 2006
level. Any additional service and/or compensation increases after
January 1, 2007 will not increase the participants’ benefits. In
addition, employees hired after July 1, 2005 will not receive benefits under the
Plan.
Obligations
and Funded Status
The
following table sets forth the funded status of the Plan at December 31, 2009
and 2008:
|
(in thousands)
|
||||||||
|
2009
|
2008
|
|||||||
|
Change
in benefit obligation
|
||||||||
|
Benefit
obligation at beginning of year
|
$ | 27,807 | $ | 28,543 | ||||
|
Service
cost
|
82 | -- | ||||||
|
Interest
cost
|
1,596 | 1,650 | ||||||
|
Actuarial
gain
|
(753 | ) | (505 | ) | ||||
|
Benefits
paid
|
(1,119 | ) | (1,881 | ) | ||||
|
Benefit
obligation at end of year
|
27,613 | 27,807 | ||||||
|
Change
in plan assets
|
||||||||
|
Fair
value of plan assets at beginning of year
|
17,767 | 22,490 | ||||||
|
Actual
return on plan assets
|
2,521 | (3,926 | ) | |||||
|
Employer
contribution
|
934 | 1,280 | ||||||
|
Benefits
paid
|
(1,119 | ) | (1,881 | ) | ||||
|
Administrative
expenses
|
(215 | ) | (196 | ) | ||||
|
Fair
value of plan assets at end of year
|
19,888 | 17,767 | ||||||
|
Benefit
obligation in excess of Plan assets
|
7,725 | 10,040 | ||||||
|
Unrecognized
actuarial loss
|
(3,023 | ) | (4,567 | ) | ||||
|
Additional
loss charged to comprehensive loss
|
3,023 | 4,567 | ||||||
|
Accrued
pension liability
|
$ | 7,725 | $ | 10,040 | ||||
The
Company recognized accrued benefit costs of $7,725,000 and $10,040,000 in its
balance sheet at December 31, 2009 and 2008, respectively.
Included
in accumulated other comprehensive loss at December 31, 2009 are
unrecognized actuarial losses of $3,023,000 ($1,910,000, net of tax) that have
not yet been recognized in net periodic pension cost. The actuarial loss
included in accumulated other comprehensive loss and expected to be recognized
in net periodic pension cost during the year ended December 31, 2010 is
$165,000 ($104,000, net of tax).
The
following table presents the projected and accumulated benefit obligation
compared to plan assets:
|
(in
thousands)
|
||||||||
|
December
31,
|
||||||||
|
2009
|
2008
|
|||||||
|
Projected
benefit obligation
|
$ | 27,613 | $ | 27,807 | ||||
|
Accumulated
benefit obligation
|
27,613 | 27,807 | ||||||
|
Fair
value of plan assets
|
19,888 | 17,767 | ||||||
The
components of the Company’s net periodic pension cost (credit) for the Plan were
as follows:
|
(in
thousands)
|
||||||||
|
__2009
|
__2008
|
|||||||
|
Service
cost
|
$ | 82 | $ | -- | ||||
|
Interest
cost
|
1,596 | 1,650 | ||||||
|
Expected
return on plan assets
|
(1,716 | ) | (1,887 | ) | ||||
|
Recognized
actuarial (gain) loss
|
202 | (48 | ) | |||||
|
Net
periodic benefit cost (credit)
|
$ | 164 | $ | (285 | ) | |||
22
Weighted-average
assumption used to determine benefit obligations at the end of December 31, 2009
and 2008 were:
|
2009
|
2008
|
|||||||
|
Discount
rate
|
6.00 | % | 6.00 | % | ||||
Weighted-average
assumptions used to determine net periodic pension costs for the years ended
December 31, 2009 and 2008 were:
|
2009
|
2008
|
|||||||
|
Discount
rate
|
6.00 | % | 6.00 | % | ||||
|
Expected
return on plan assets
|
8.50 | % | 8.50 | % | ||||
The
assumed rate of return on plan assets has remained unchanged since
1988. Management believes 8.50% is a realistic long-term
rate of return. The balanced retirement fund into which plan
assets have been invested since 1987 has provided a composite average annual
rate of return of 9.7% since 1987.
Plan
Assets
The
Plan’s assets are invested in the Boston Trust Balanced Retirement Fund (the
“Fund”), which is managed by Boston Trust Investment Management
Company. The Fund’s weighted-average asset allocations at December
31, 2009 and 2008, by asset category, were as follows:
|
Plan assets at December 31,
|
||||||||
|
2009
|
2008
|
|||||||
|
Cash
& money market investments
|
1 | % | 9 | % | ||||
|
Government
debt securities
|
31 | % | 38 | % | ||||
|
Corporate
debt securities
|
4 | % | 4 | % | ||||
|
Equity
securities
|
64 | % | 49 | % | ||||
| 100 | % | 100 | % | |||||
The
Plan’s assets have been invested in the Fund since 1987. The
investment objective of the Fund is to achieve capital growth over the long-term
through a broadly diversified, actively managed blend of stocks, bonds and money
market instruments. In order to moderate the Fund’s risk
and volatility, a mix of assets is selected for the Fund with the dual objective
of providing the opportunity to participate in favorable economic environments,
and also moderating downside risk in the event economic conditions
deteriorate. To further balance risk and return, individual
investments are held across a wide range of economic
sectors. Specific equity selections focus on financially sound
companies with strong competitive positions in their
industry. Bond holdings are primarily of higher quality
issuers.
The
following table presents the fair values of the Plan’s assets, by asset
category, as of December 31, 2009:
|
(in
thousand)
|
||||||||||||||||
|
Quoted
Prices in Active Markets for Identical Assets
|
Significant
Observable Inputs
|
Significant
Unobservable Inputs
|
||||||||||||||
|
(Level
1)
|
(Level
2)
|
(Level
3)
|
Total
|
|||||||||||||
|
Boston
Trust Balanced Retirement Fund
|
$ | -- | $ | 19,810 | $ | -- | $ | 19,810 | ||||||||
|
Boston
Trust Daily Income Account
|
78 | -- | -- | 78 | ||||||||||||
|
Investments
as of December 31, 2008
|
$ | 78 | $ | 19,810 | $ | -- | $ | 19,888 | ||||||||
Balanced Retirement
Fund:
The
Boston Trust Balanced Retirement Fund is a public investment vehicle valued
using the Net Asset Value (“NAV”) provided by the administrator of the
fund. The NAV is based on the value of the underlying assets owned by
the fund, minus its liabilities, and then divided by the number of shares
outstanding. The NAV is classified within level 2 of the
valuation hierarchy because the NAV’s unit price is quoted on a private market
that is not active; however, the unit price is based on the underlying
investments which are traded on an active market.
Money Market
Accounts
The
Boston Trust Daily Income Account is a money market fund that is stated at cost,
plus accrued interest, which approximates market. Purchases and sales
of securities are recorded on a trade-date basis. Interest income is
recorded on the accrual basis. Dividends are recorded on the
ex-dividend date.
Cash
Flows
The
Company expects to make contributions totaling $1,172,000 during 2010, and has
classified this amount as a current liability in the accompanying balance
sheet.
The
following table sets forth estimated future benefit payments from the
Plan.
|
(in
thousands)
|
||||
|
Estimated
Pension Benefit Payments
|
||||
|
2010
|
$ | 1,195 | ||
|
2011
|
1,190 | |||
|
2012
|
1,263 | |||
|
2013
|
1,319 | |||
|
2014
|
1,435 | |||
|
2015
through 2019
|
9,561 | |||
Savings
Plan
The
Company has an employee savings plan (the Savings Plan) that qualifies as a
deferred salary arrangement under Section 401(k) of the Internal Revenue
Code. Under the Savings Plan, participating U.S. employees may defer
a portion of their pre-tax earnings up to the Internal Revenue Service annual
contribution limit. All U.S. employees of the Company are eligible to
participate in the Savings Plan. Participating employees may choose
to invest their contributions in each one of twenty-seven mutual funds, which
include equity funds, balanced funds and a money market fund. The
Company does bear the costs of administering the Plan, which were $13,000 in
2009 and $12,000 in 2008.
Effective
January 1, 2007, following a freeze of the Pension Plan, the Company started
providing matching contributions of up to 4% of earnings to employees who make
contributions to their 401(k) savings accounts. The Company matched
the first 3% salary deferral of its employees, and 50% of the next
2%. The Company suspended matching contributions on April 1, 2009 to
reduce expenses. The amount contributed by the Company and included
in expenses in 2009 and 2008 totaled $165,000 and $644,000,
respectively. The Company will resume matching contributions on April
1, 2010, matching 50% of the employees’ salary deferral, up to a maximum of
2%.
|
9.
|
Segment
Information
|
The
Company has two reportable segments: Owned and Leased Hotels, and
Management Activities. The Owned and Leased Hotels segment consists
of the operations of the Company’s hotels in Boston and New Orleans. Revenues
for this segment are derived mainly from
23
rooms,
food and beverage, parking and telephone receipts from hotel
guests. The Management Activities segment includes the operations of
hotels and resorts under management agreements, and also includes fees from
hotels to which the Company has granted licenses. Revenues from this
segment are derived mainly from management, marketing, license and service fees
charged to the third party owners of these properties. The accounting
policies of the reportable segments are the same as those described in the
summary of significant accounting policies. The segments’ operating
income or losses and pretax profit or losses are after giving effect to
management, marketing and service fees to the Company’s Boston and New Orleans
hotels. Segment data for the years ended December 31, 2009 and 2008
are as follows:
|
Year
ended December 31, 2009
|
||||||||||||
|
(in
thousands)
|
||||||||||||
|
Owned
&
Leased Hotels
|
Management
Activities
|
Consolidated
|
||||||||||
|
Revenues
|
$ | 56,141 | $ | 4,317 | $ | 60,458 | ||||||
|
Other
revenues from managed
|
||||||||||||
|
and affiliated
properties
|
-- | 4,361 | 4,361 | |||||||||
|
Total
revenues
|
56,141 | 8,678 | 64,819 | |||||||||
|
Operating
income (loss) before depreciation
|
||||||||||||
|
and amortization
expense
|
7,599 | (3,371 | ) | 4,228 | ||||||||
|
Depreciation
and amortization
|
(4,952 | ) | (227 | ) | (5,179 | ) | ||||||
|
Interest
income (expense), net
|
(2,853 | ) | 390 | (2,463 | ) | |||||||
|
Other
income (deductions)
|
(4 | ) | 41,863 | 41,859 | ||||||||
|
Segment
pre-tax profit (loss)
|
(210 | ) | 38,655 | 38,445 | ||||||||
|
Segment
assets
|
39,392 | 41,339 | 80,731 | |||||||||
|
Segment
capital additions
|
4,530 | 82 | 4,612 | |||||||||
|
Year
ended December 31, 2008
|
||||||||||||
|
(in
thousands)
|
||||||||||||
|
Owned
&
Leased Hotels
|
Management
Activities
|
Consolidated
|
||||||||||
|
Revenues
|
$ | 63,573 | $ | 7,979 | $ | 71,552 | ||||||
|
Other
revenues from managed
|
||||||||||||
|
and affiliated
properties
|
-- | 8,965 | 8,965 | |||||||||
|
Total
revenues
|
63,573 | 16,944 | 80,517 | |||||||||
|
Operating
income before depreciation
|
||||||||||||
|
and amortization
expense
|
10,565 | 1,944 | 12,509 | |||||||||
|
Depreciation
and amortization
|
(4,957 | ) | (881 | ) | (5,838 | ) | ||||||
|
Interest
income (expense), net
|
(2,963 | ) | 1,175 | (1,788 | ) | |||||||
|
Other
income (deductions)
|
(9 | ) | 583 | 574 | ||||||||
|
Segment
pre-tax profit
|
2,636 | 2,821 | 5,457 | |||||||||
|
Segment
assets
|
38,582 | 88,458 | 127,040 | |||||||||
|
Segment
capital additions
|
234 | 3,260 | 3,494 | |||||||||
Segment
assets for Management Activities in the information above include cash held in
corporate accounts, and loans to and receivables from properties under
management and license agreements. Segment assets for Owned and
Leased hotels include the book value of the hotels’ fixed assets, and the
hotels’ other current and long-term assets.
Segment
data by geographic area of the Company's revenues (excluding other revenues from
managed and affiliated properties), operating income and long-lived assets
follows:
|
(in
thousands)
|
||||||||
|
Revenues
|
||||||||
|
2009
|
2008
|
|||||||
|
United
States
|
$ | 57,236 | $ | 67,206 | ||||
|
Other
|
3,222 | 4,346 | ||||||
|
Consolidated
|
$ | 60,458 | $ | 71,552 | ||||
|
Operating
income (loss)
|
||||||||
|
2009
|
2008
|
|||||||
|
United
States
|
$ | (3,398 | ) | $ | 3,066 | |||
|
Other
|
2,447 | 3,605 | ||||||
|
Consolidated
|
$ | (951 | ) | $ | 6,671 | |||
|
Long-lived
assets
|
||||||||
|
2009
|
2008
|
|||||||
|
United
States
|
$ | 33,917 | $ | 34,654 | ||||
|
Other
|
353 | 377 | ||||||
|
Consolidated
|
$ | 34,270 | $ | 35,031 | ||||
|
10.
|
Legal
Proceedings
|
From time
to time the Company is subject to routine litigation incidental to its business,
which is generally covered by insurance. The Company believes that
the results of such litigation will not have a materially adverse effect on its
financial condition.
|
11.
|
Related
Party Transactions
|
The
Company has, from time to time, purchased artwork for its hotels and executive
offices from a gallery owned by the wife of Mr. Roger Sonnabend, the Company’s
former Executive Chairman of the Board. Purchases of artwork for the
Company from January 1, 2008 through March 1, 2010, totaled
$13,000. The gallery also handled the sale of Company artwork
totaling $240,000 during 2008, resulting in a gain of
$120,000. During 2008, the Company sold a piece of art directly to
Mr. Peter J. Sonnabend in return for cash and two other pieces of
art. The Audit Committee of the Company’s Board of Directors has
instituted policies and procedures to assure that the prices for artwork
acquired from or sold to the gallery, and artwork purchased from or sold to
executives, are at least as favorable to the Company as would have been obtained
from unrelated third parties.
In
October 2007, the Company entered into a purchase and sale agreement to sell a
coop unit to the Executive Chairman of the Board, Mr. Peter J. Sonnabend, for
$700,000. The transaction closed in 2008 and resulted in a gain of
$422,000 which is included in gain on sale of assets in the 2008 statement of
operations. The Company’s Board of Directors approved the
transaction.
In
accordance with an employment agreement, the Company expensed $720,000 in 2008
in connection with the passing of Mr. Roger Sonnabend, the Company’s Executive
Chairman of the Board, in December 2008.
24
|
12.
|
Income
Taxes
|
The table
below allocates the Company's income tax expense (benefit) based upon the source
of income:
|
(in
thousands)
|
||||||||||||||||
|
2009
|
2008
|
|||||||||||||||
|
Domestic
|
Foreign
|
Domestic
|
Foreign
|
|||||||||||||
|
Income
before income taxes
|
$ | 35,865 | $ | 2,580 | $ | 1,764 | $ | 3,693 | ||||||||
|
Federal,
foreign and state income
|
||||||||||||||||
|
tax provision
(benefit)
|
||||||||||||||||
|
Current
federal income tax (benefit)
|
$ | 28 | $ | 467 | $ | (76 | ) | $ | 454 | |||||||
|
State
and foreign tax, principally current
|
265 | 414 | 118 | 528 | ||||||||||||
|
Deferred
federal and state income tax (benefit)
|
11,997 | (3 | ) | 356 | (3 | ) | ||||||||||
| $ | 12,290 | $ | 878 | $ | 398 | $ | 979 | |||||||||
Deferred
federal and state income tax includes deferred state income tax provisions of
$358,000 in 2009 and deferred state income tax benefits of $274,000 in
2008.
During
2009 the Company recorded a tax expense of $13,168,000 on pre-tax income of
$38,445,000. This tax expense is approximately the same as the
statutory federal income tax rate. State tax expense on income
attributed to Louisiana, Florida and Massachusetts was partially offset by
general business tax credits and an adjustment to the gain reported on the Key
Biscayne transaction (see Note 3) which is not subject to tax.
In 2008,
the Company recorded a tax expense of $1,377,000 on its pre-tax income of
$5,457,000. The Company recorded substantial credits for foreign
taxes paid in 2008, and for foreign taxes paid in prior years which had been
carrying forward. In addition, the Company benefited from current and
prior year’s general business credits, including work opportunity tax credits
related to Hurricane Katrina.
A
reconciliation of the net tax expense (benefit) applicable to income or losses
at the statutory rate follows:
|
(in
thousands)
|
||||||||
|
2009
|
2008
|
|||||||
|
Expected
tax expense at the federal statutory rate of 34%
|
$ | 13,071 | $ | 1,855 | ||||
|
State
income tax provision (benefit), net of federal taxes
|
411 | (103 | ) | |||||
|
Prior
year’s foreign tax credits
|
-- | (278 | ) | |||||
|
Tax
basis difference on assets sold
|
(549 | ) | -- | |||||
|
General
business credits, including Katrina credits
|
(179 | ) | (120 | ) | ||||
|
Fixed
assets tax basis adjustments
|
112 | -- | ||||||
|
Deferred
tax assets paid at 35% federal rate
|
316 | -- | ||||||
|
Other
|
(14 | ) | 23 | |||||
| $ | 13,168 | $ | 1,377 | |||||
25
Deferred
tax expenses (benefits) result from temporary differences in the recognition of
revenues and expenses for tax and financial reporting purposes. The
source of these differences and their tax effects are as follows:
|
(in
thousands)
|
||||||||
|
2009
|
2008
|
|||||||
|
Tax
depreciation more (less) than book depreciation
|
$ | 10 | $ | (114 | ) | |||
|
Federal
tax on deferred gain on sale of assets
|
10,726 | (42 | ) | |||||
|
State
tax on deferred gain on sale of assets
|
755 | (3 | ) | |||||
|
General
business credits used
|
-- | 242 | ||||||
|
Pension
contribution more than pension expense
|
429 | 155 | ||||||
|
Employee
benefits
|
107 | (175 | ) | |||||
|
Trump
settlement (see Note 2)
|
-- | 224 | ||||||
|
Other
temporary differences
|
(33 | ) | 66 | |||||
| $ | 11,994 | $ | 353 | |||||
Temporary
differences between the financial statement carrying amounts and the tax basis
of assets and liabilities that give rise to significant portions of deferred
income taxes at December 31, 2009 and 2008 relate to the following:
|
(in
thousands)
|
||||||||
|
2009
|
2008
|
|||||||
|
Current
deferred tax asset
|
||||||||
|
Employee benefits accrued but
deferred for tax purposes
|
$ | 461 | $ | 440 | ||||
|
Other
|
15 | 22 | ||||||
|
Current
deferred tax asset
|
$ | 476 | $ | 462 | ||||
|
Long-term
deferred tax assets (liabilities)
|
||||||||
|
Depreciation book tax
difference
|
$ | (4,657 | ) | $ | (6,263 | ) | ||
|
Pension expense in excess of
contributions
|
2,412 | 3,437 | ||||||
|
Federal tax on deferred gain on
sale of assets
|
-- | 10,726 | ||||||
|
State tax on deferred gain on
sale of assets
|
-- | 755 | ||||||
|
Employee
benefits
|
287 | 403 | ||||||
|
State tax benefits of
$1,100,000 in 2009 and $1,400,000 in 2008 fromnet operating loss
carry-forwards, net of valuation allowance
|
-- | -- | ||||||
|
Other
|
19 | (9 | ) | |||||
|
Deferred
tax asset (liability)
|
$ | (1,939 | ) | $ | 9,049 | |||
At
December 31, 2009, the Company had state net operating loss carry-forwards of
approximately $16,400,000 for income tax purposes. Of the total
carry-forwards available at December 31, 2009, approximately $4,200,000 expires
in 2010, $3,700,000 expires in 2011, $4,200,000 expires in 2012, $3,300,000
expires in 2013, and $1,000,000 expires in 2014. For financial
reporting purposes, valuation allowances of $1,100,000 and $1,400,000 have been
recognized at December 31, 2009 and 2008, respectively, to offset the deferred
tax assets related to those carry-forwards.
Effective
for years beginning January 1, 2009, the Commonwealth of Massachusetts has
enacted tax law changes, including conforming to federal entity classification
rules, and adopting a unitary method of taxation. In connection with this
change, the Company recorded a state income tax benefit of $216,000 during
2008.
We
adopted the provisions for accounting for uncertainty in income taxes effective
January 1, 2007. There was no impact on the Company’s results of
operations or financial position as a result of the adoption. The total amount
of unrecognized tax benefits at the end of each of the years ended December 31,
2009 and 2008 were $150,000. These entire balances are for tax positions that,
if recognized, would impact the effective tax rate.
26
The table
below reconciles the total amounts of unrecognized tax benefits at the beginning
and end of the years 2009 and 2008 (in thousands):
|
2009
|
2008
|
|||||||
|
Unrecognized
tax benefits at beginning of year
|
$ | 150 | $ | 228 | ||||
|
Decreases
for prior year tax positions
|
-- | (60 | ) | |||||
|
Decrease
attributable to settlements with taxing authorities
|
-- | (18 | ) | |||||
|
Unrecognized
tax benefits at end of year
|
$ | 150 | $ | 150 | ||||
The
Company recognizes accrued interest and penalties related to unrecognized tax
benefits as a component of state and federal income tax expense. As of December
31, 2009, the total amount of accrued interest and penalties is
$33,000.
The
Company files income tax returns, including returns for its subsidiaries, with
federal, state, local, and foreign jurisdictions. During 2008, the Internal
Revenue Service completed an examination of the federal income tax return for
the tax year ended December 31, 2005. No adjustments were made to its 2005 tax
return as a result of the examination. The Company is currently subject to audit
by the Internal Revenue Service for the calendar years 2006, 2007, 2008 and
2009. During 2008, the State of Florida completed an examination of the returns
for calendar years 2004, 2005 and 2006. The adjustments resulting from this
audit totaled $18,000. Various state and local income tax returns are subject to
audit for the calendar years 2005, 2006, 2007, 2008 and 2009. The Company does
not expect that the amounts of unrecognized tax benefits will change
significantly within the next 12 months.
27
CATURANO
& COMPANY
REPORT OF INDEPENDENT
REGISTERED PUBLIC ACCOUNTING FIRM
To the
Board of Directors and Stockholders
Sonesta
International Hotels Corporation:
We have
audited the accompanying consolidated balance sheet of Sonesta International
Hotels Corporation as of December 31, 2009 and 2008 and the related consolidated
statements of operations, stockholders' equity, comprehensive income (loss) and
cash flows for each of the years then ended. These financial
statements are the responsibility of the Company's management. Our
responsibility is to express an opinion on these financial statements based on
our audit.
We
conducted our audit in accordance with the standards of the Public Company
Accounting Oversight Board (United States). Those standards require that we plan
and perform the audits to obtain reasonable assurance about whether the
consolidated financial statements are free of material misstatement. The Company
is not required to have, nor were we engaged to perform an audit of its internal
control over financial reporting. Our audits included consideration of internal
controls over financial reporting as a basis for designing audit procedures that
are appropriate in the circumstances, but not for the purpose of expressing an
opinion on the effectiveness of the Company's controls over financial reporting.
Accordingly, we express no such opinion. An audit includes examining, on a test
basis, evidence supporting the amounts and disclosures in the consolidated
financial statements. An audit also includes assessing the accounting principles
used and significant estimates made by management, as well as evaluating the
overall financial statement presentation. We believe that our audits provide a
reasonable basis for our opinion.
In our
opinion, the consolidated financial statements referred to above present fairly,
in all material respects, the financial position of Sonesta International Hotels
Corporation as of December 31, 2009 and 2008 and the consolidated results of
their operations and their cash flows for the years then ended, in conformity
with accounting principles generally accepted in the United States of
America.
/s/
CATURANO AND COMPANY, P.C.
Boston,
Massachusetts
March 25,
2010
Certified
Public
Accountants An
Independent Member of Baker Tilly International
80 City
Square, Boston, Massachusetts
02129 617-912-9000 FX
617-912-9001www.caturano.com
28