Attached files
| file | filename |
|---|---|
| EX-2.1 - EX-2.1 - PRGX GLOBAL, INC. | g22652exv2w1.htm |
| EX-23.1 - EX-23.1 - PRGX GLOBAL, INC. | g22652exv23w1.htm |
| EX-21.1 - EX-21.1 - PRGX GLOBAL, INC. | g22652exv21w1.htm |
| EX-32.1 - EX-32.1 - PRGX GLOBAL, INC. | g22652exv32w1.htm |
| EX-31.1 - EX-31.1 - PRGX GLOBAL, INC. | g22652exv31w1.htm |
| EX-31.2 - EX-31.2 - PRGX GLOBAL, INC. | g22652exv31w2.htm |
| EX-10.32 - EX-10.32 - PRGX GLOBAL, INC. | g22652exv10w32.htm |
| EX-10.26 - EX-10.26 - PRGX GLOBAL, INC. | g22652exv10w26.htm |
| EX-10.33 - EX-10.33 - PRGX GLOBAL, INC. | g22652exv10w33.htm |
| EX-10.32.1 - EX-10.32.1 - PRGX GLOBAL, INC. | g22652exv10w32w1.htm |
| EX-10.31 - EX-10.31 - PRGX GLOBAL, INC. | g22652exv10w31.htm |
Table of Contents
UNITED STATES
SECURITIES AND EXCHANGE COMMISSION
SECURITIES AND EXCHANGE COMMISSION
Washington, D.C. 20549
Form 10-K
(Mark One)
| þ | ANNUAL REPORT PURSUANT TO SECTION 13 OR 15(d) OF THE SECURITIES EXCHANGE ACT OF 1934 |
For the fiscal year ended December 31, 2009
OR
| o | TRANSITION REPORT PURSUANT TO SECTION 13 OR 15(d) OF THE SECURITIES EXCHANGE ACT OF 1934 |
For the transition period from to
Commission File Number 0-28000
PRGX Global, Inc.
(Exact name of registrant as specified in its charter)
| Georgia | 58-2213805 | |
| (State or other jurisdiction of | (I.R.S. Employer | |
| incorporation or organization) | Identification No.) | |
| 600 Galleria Parkway | 30339-5986 | |
| Suite 100 | (Zip Code) | |
| Atlanta, Georgia | ||
| (Address of principal executive offices) |
Registrant’s telephone number, including area code: (770) 779-3900
Securities registered pursuant to Section 12(b) of the Act:
| Title of each class | Name of each exchange on which registered | |
| Common Stock, No Par Value | The NASDAQ Stock Market LLC (The Nasdaq Global Market) | |
| Preferred Stock Purchase Rights | The NASDAQ Stock Market LLC (The Nasdaq Global Market) |
Securities registered pursuant to Section 12(g) of the Act: None
Indicate by check mark if the registrant is a well-known seasoned issuer, as defined in Rule
405 of the Securities Act. Yes o No þ
Indicate by check mark if the registrant is not required to file reports pursuant to Section
13 or Section 15(d) of the Act. Yes o No þ
Note—Checking the box above will not relieve any registrant required to file reports pursuant
to Section 13 or 15(d) of the Exchange Act from their obligations under those Sections.
Indicate by check mark whether the registrant (1) has filed all reports required to be filed
by Section 13 or 15(d) of the Securities Exchange Act of 1934 during the preceding 12 months (or
for such shorter period that the registrant was required to file such reports), and (2) has been
subject to such filing requirements for the past 90 days. Yes þ No o
Indicate by check mark if disclosure of delinquent filers pursuant to Item 405 of Regulation
S-K is not contained herein and will not be contained, to the best of the registrant’s knowledge,
in definitive proxy or information statements incorporated by reference in Part III of this Form
10-K or any amendment to this Form 10-K. þ
Indicate by check mark whether the registrant has submitted electronically and posted on its
corporate Web site, if any, every Interactive Data File required to be submitted and posted
pursuant to Rule 405 of Regulation S-T during the preceding 12 months (or for such shorter period
that the registrant was required to submit and post such files). Yes o No o
Indicate by check mark whether the registrant is a large accelerated filer, an accelerated
filer, a non-accelerated filer, or a smaller reporting company. See definitions of “large
accelerated filer,” “accelerated filer” and “small reporting company” in Rule 12b-2 of the Exchange
Act. (Check One):
| o Large accelerated filer | o Accelerated filer | þ Non-accelerated filer | o Small reporting company | |||
| (Do not check if a smaller reporting company) |
||||||
Indicate by check mark whether the registrant is a shell company (as defined in Rule 12b-2 of
the Act). Yes o No þ
The aggregate market value, as of June 30, 2009, of common shares of the registrant held by
non-affiliates of the registrant was approximately $44.7 million, based upon the last sales price
reported that date on The Nasdaq Global Market of $2.70 per share. (Aggregate market value is
estimated solely for the purposes of this report and shall not be construed as an admission for the
purposes of determining affiliate status.)
Common shares of the registrant outstanding as of March 26, 2010 were 23,285,392.
Documents Incorporated by Reference
Part III: Portions of Registrant’s Proxy Statement relating to the Company’s 2010 Annual
Meeting of Shareholders.
PRGX Global, Inc.
FORM 10-K
December 31, 2009
December 31, 2009
| Page | ||||||||
| 1 | ||||||||
| 12 | ||||||||
| 19 | ||||||||
| 19 | ||||||||
| 19 | ||||||||
| 19 | ||||||||
| 20 | ||||||||
| 22 | ||||||||
| 24 | ||||||||
| 41 | ||||||||
| 42 | ||||||||
| 81 | ||||||||
| 81 | ||||||||
| 81 | ||||||||
| 82 | ||||||||
| 82 | ||||||||
| 83 | ||||||||
| 84 | ||||||||
| 84 | ||||||||
| 85 | ||||||||
| 90 | ||||||||
| EX-2.1 | ||||||||
| EX-10.26 | ||||||||
| EX-10.31 | ||||||||
| EX-10.32 | ||||||||
| EX-10.32.1 | ||||||||
| EX-10.33 | ||||||||
| EX-21.1 | ||||||||
| EX-23.1 | ||||||||
| EX-31.1 | ||||||||
| EX-31.2 | ||||||||
| EX-32.1 | ||||||||
Table of Contents
PART I
ITEM 1. Business
The following discussion includes “forward-looking” statements within the meaning of the
Private Securities Litigation Reform Act of 1995. These forward-looking statements are at times
identified by words such as “plans,” “intends,” “expects,” or “anticipates” and words of similar
effect and include statements regarding the Company’s financial and operating plans and goals.
These forward-looking statements include any statements that cannot be assessed until the
occurrence of a future event or events. Actual results may differ materially from those expressed
in any forward-looking statements due to a variety of factors, including but not limited to those
discussed herein and below under Item 1A “Risk Factors.”
PRGX Global, Inc. and its subsidiaries (collectively, the “Company,” “we” or “us”), a United
States of America (“U.S.”) based company, incorporated in the State of Georgia in 1996, is a
business analytics and information services firm. At the heart of the Company’s client services
portfolio is the core capability of data mining to deliver “actionable insights”. This core
capability is represented in the Company’s go-to-market services message which is “Audit —
Analytics — Advice”, with analytics central to the Company’s value proposition.
“Actionable insights” allow the Company’s clients to improve their financial performance by
reducing costs, improving business processes and directly increasing profitability. Hence, the
Company’s recent rebranding to PRGX with its accompanying tag line of “Discover Your Hidden
Profits.” This process of discovery is entirely about the Company’s clients entrusting it with
their data so the Company can identify levers to improve its clients’ corporate and financial
performance.
Historically, the Company’s legacy business has been “recovery audit” which is a service
provided based on the mining of a tremendous amount of the
Company’s clients’ data, looking for overpayments to
their third party suppliers. Most of the Company’s large retail clients in mature markets employ their
own internal staff to audit and recover overpayments to suppliers,
and additionally engage the Company as a
supplement to this internal function. For other clients, including
some large and mid-size retailers, healthcare companies and the
Company’s “commercial” (non-retail, non-healthcare)
clients, the Company serves as the complete outsourced provider of
this standard function. We process over 1.5 million client files
each year, including purchase orders, receipt and shipment data,
invoices, payables data and point of sales data, and have over
4 petabytes of client data available for analysis.
As part of the Company’s new strategy announced in 2009 (see “The PRGX Strategy” below for
additional information), the Company launched similar integrated value propositions across other
drivers of client profitability. As evidenced by the Company’s February 2010 acquisition of
Etesius Limited, a spend analytics company based in Chelmsford, United Kingdom (see Note 19 of
“Notes to Consolidated Financial Statements” included in Item 8 of this Form 10-K for information
regarding this acquisition), the Company is bolstering its client proposition around spend
analytics and sourcing/procurement excellence. The data that the Company processes from its
clients can be used to create spend reporting at the line item level of detail, which in turn
enables supplier rationalization, collaborative purchasing, strategic sourcing and procurement
transformation, all of which can dramatically enhance the client’s bottom line. The Company is
providing these insights through web based technologies using the “SAAS” (software as a service)
delivery model. The Company’s SAAS model uses a monthly license fee allowing customers to rapidly
tailor service levels such as frequency of data refresh and scope of reporting outputs. The
Company’s range of software based solutions extends to fraud and compliance reporting, control
monitoring and contract management. As the Company’s clients’ data volume and complexity continues
to grow, the Company is utilizing its deep data management experience to incubate new “actionable
insight” solutions in retail and healthcare as well as developing custom analytics services. Taken
together, the Company’s software capability and solutions provide multiple routes to discovering
hidden profits.
1
Table of Contents
The
PRGX Recovery Audit Service Line
The Company is the leading worldwide provider of recovery audit services principally to large
businesses and government agencies having numerous payment transactions and complex purchasing
environments. These businesses and agencies include:
| • | retailers such as discount, department, specialty, grocery and drug stores, and wholesalers who sell to these retailers; | ||
| • | business enterprises other than retailers/wholesalers such as manufacturers, financial services firms, and pharmaceutical companies; | ||
| • | healthcare payers, both private sector health insurance companies and state and federal government payers such as the Centers for Medicare and Medicaid Services (“CMS”); and | ||
| • | federal and state government agencies other than government healthcare payers. |
In businesses and agencies with large transaction volumes and continuously fluctuating prices
or complex rate structures, some small percentage of erroneous overpayments to vendors or providers
is inevitable. Although the vast majority of these payment transactions are processed correctly,
errors occur in a small percentage of transactions. In the aggregate, these transaction errors can
represent significant amounts of cash flow for the Company’s clients. The Company’s trained,
experienced industry specialists use sophisticated proprietary technology and advanced recovery
techniques and methodologies to identify overpayments on behalf of clients.
Under virtually all of its recovery audit contracts, the Company receives a contractual
percentage of overpayments and other savings it identifies and its clients recover or realize. In
other instances, the Company derives some of its revenues on a “fee-for-service” basis where the
fee is a flat fee, a fee per hour, or a fee per other unit of service.
The Company conducts its operations through three reportable operating segments: Recovery
Audit Services — Americas, Recovery Audit Services — Europe/Asia-Pacific and New Services. The
Recovery Audit Services Americas segment represents recovery audit services (other than healthcare
recovery audit services) provided in the U.S., Canada and Latin America. The Recovery Audit
Services — Europe/Asia-Pacific segment represents recovery audit services (other than healthcare
recovery audit services) provided in Europe, Asia and the Pacific region. The New Services segment
represents services to healthcare organizations including recovery audit services, business
analytics and advisory services. The Company includes the unallocated portion of corporate selling,
general and administrative expenses not specifically attributable to the Recovery Audit Services
and New Services segments in a segment referred to as corporate support. The Company revised its
reportable segments during the fourth quarter of 2009 to reflect the current management and
operational structure. Prior to 2009, the Company reported its results under two operating segments
— Domestic Accounts Payable Services and International Accounts Payable Services. The presentation
of prior years’ financial information in this Form 10-K has been restated to conform to the current
presentation. See Note 5 of “Notes to Consolidated Financial Statements” included in Item 8 of this
Form 10-K for operating segment disclosures.
The Company currently provides services to clients in over 30 countries. The Americas and
Europe/Asia-Pacific Recovery Audit Services segments principally consist of services that entail
the review of client accounts payable disbursements to identify and recover overpayments. These
operating segments include accounts payable services provided to retailers and wholesale
distributors (the Company’s historical client base) and accounts payable and other services
provided to various other types of business entities and governmental agencies.
In January 2010, PRG-Schultz International, Inc. was renamed PRGX Global, Inc., with
simultaneous updates to the Company’s logo, marketing communications and website. The purpose of
the rebranding was to create a better marketing platform for communicating all of the value that
the Company can deliver to clients.
The Recovery Audit Industry
2
Table of Contents
Businesses and government agencies with substantial volumes of payment transactions involving
multiple vendors, numerous discounts and allowances, fluctuating prices and complex pricing
arrangements or rate structures find it difficult to process every payment correctly. Although the
vast majority of payment transactions are processed correctly, errors occur in a small percentage
of transactions. These errors include, but are not limited to, missed or inaccurate discounts,
allowances and rebates, vendor pricing errors and duplicate payments. In the aggregate, these
transaction errors can represent significant amounts of cash flow for the Company’s clients. The
errors are caused by factors such as communication failures between the purchasing and accounts
payable departments, complex pricing arrangements or rate structures, personnel turnover and
changes in information and accounting systems.
Although some organizations (including some large retailers) maintain internal recovery audit
departments to recover certain types of payment errors and identify opportunities to reduce costs,
independent recovery audit firms, like the Company, are often retained as well due to their
specialized knowledge and focused technologies. In the U.S., Canada, the United Kingdom and France,
large retailers routinely engage independent recovery audit firms as standard business practice. In
other countries, large retailers and many other types of businesses are also engaging independent
recovery audit firms.
The Company believes that the domestic and international recovery audit industry for accounts
payable services in major markets worldwide is comprised of the Company, one smaller but
substantial competitor, and numerous other smaller competitors. Most of the smaller recovery audit
firms are believed to not possess multi-country service capabilities and lack the centralized
resources or broad client base to support the technology investments required to provide
comprehensive recovery audit services for large, complex accounts payable systems. These firms are
generally less equipped to audit large, data intensive purchasing and accounts payable systems. In
addition, many of these firms have limited resources, and may lack experience and the knowledge of
national promotions, seasonal allowances and current recovery audit practices. As a result, the
Company believes that compared to most other firms providing accounts payable recovery audit
services it has competitive advantages based on its national and international presence,
well-trained and experienced professionals, and advanced technology.
As businesses have evolved, the Company and the recovery audit industry have evolved with
them, innovating processes, error identification tools, and claim types to maximize recoveries. The
following are a number of factors significantly impacting the recovery audit industry:
| • | Data Capture and Availability. Businesses are increasingly using technology to manage complex procurement and accounts payable systems and realize greater operating efficiencies. Many businesses worldwide communicate with vendors electronically — whether by Electronic Data Interchange (“EDI”) or the Internet — to exchange inventory and sales data, transmit purchase orders, submit invoices, forward shipping and receiving information and remit payments. These systems capture more detailed data and enable the cost effective review of more transactions by recovery auditors. | ||
| • | Increasing Number of Auditable Claim Categories. Traditionally, the recovery audit industry identified simple, or “disbursement,” claim types such as the duplicate payment of invoices. Enhancements to accounts payable software, particularly large enterprise software solutions used by many large companies, have reduced the extent to which these companies make simple disbursement errors. However, the introduction of creative vendor discount programs, complex pricing arrangements and activity-based incentives has led to an increase in auditable transactions and potential sources of error. These transactions are complicated to audit as the underlying transaction data is difficult to access and recognizing mistakes is complex. Recovery audit firms such as the Company with significant industry-specific expertise and sophisticated technology are best equipped to audit these complicated, or “contract compliance,” claim categories. | ||
| • | Globalization. As the operations of major retailers and other business enterprises become increasingly global, they often seek service providers with a global reach. | ||
| • | Consolidation in the Retail Industry. Retailer consolidation continues in both the U.S. and internationally. As retailers grow larger, vendors become more reliant on a smaller number of customers and, as a result, the balance of power favors retailers rather than their vendors. This dynamic creates an environment that allows retailers to assert overpayment claims more easily. |
3
Table of Contents
| • | Significant Promotional Activity. Trade promotion spending is substantial within the retail trade and significant sums are being spent in categories with numerous transactions and a high potential for errors, such as scan downs, or discounts at the point of sale. Because of the high volume of trade promotion within retail, there are significant opportunities for mistakes and, therefore, auditable claims. |
| • | Move Toward Standard Auditing Practices. Increasingly, vendors to the Company’s clients are insisting on the satisfaction of certain conditions, such as clearer post-audit procedures, better documentation and electronic communication of claims, before accepting the validity of a claim. |
The evolution of the recovery audit industry is expected to continue. In particular, the
Company expects that the industry will continue to move towards the electronic capture and
presentation of data, more automated, centralized processing and faster approvals and deductions of
claims.
The PRGX Recovery Audit Solution
The Company provides its domestic and international clients with comprehensive recovery audit
services by using sophisticated proprietary technology and a business intelligence platform,
utilizing advanced auditing techniques and methodologies, and by employing highly trained,
experienced industry specialists. As a result, the Company believes it is able to identify
significantly more payment errors than its clients are able to identify through their internal
audit capabilities and more payment errors than many of its competitors are able to identify.
The Company is a leader in developing and utilizing sophisticated software audit tools and
techniques that enhance the identification and recovery of payment errors. By leveraging its
technology investment across a large client base, the Company is able to continue developing
proprietary software tools and expanding its technology leadership in the recovery audit industry.
The Company is also a leader in establishing new recovery audit practices to reflect evolving
industry trends.
The Company’s auditors are highly skilled professionals. Many have joined the Company from
finance-related management positions in the industries the Company serves. To support its clients,
the Company provides its auditors and audit teams with data processing services, software and
software support, sales and marketing assistance, and training and administrative services.
The PRGX Strategy
During 2009, the Company’s executive management team performed an extensive review of the
Company’s competitive advantages and marketplace opportunities and developed a revised business
strategy. The five components of the new growth strategy are:
| 1. | grow the accounts payable recovery audit business; | ||
| 2. | grow the healthcare recovery audit business; | ||
| 3. | expand data mining for profitability; | ||
| 4. | grow the advisory services business; and | ||
| 5. | build a strong team with a high-performance culture. |
These elements of the new growth strategy represent the reinvigoration of the core business
while significantly expanding the services portfolio. The go-to-market strategy is built on a
competency foundation that includes data mining, audit/forensics capabilities, finance and
procure-to-pay business process expertise, and a proprietary business intelligence platform. The
services that best leverage these capabilities are now referred to as audit, analytics and advice.
The Company believes that these services can be combined to effectively discover and deliver hidden
profits for its clients, enabling the creation of a new service category in the professional
services marketplace: Profit Discovery.
Grow the Accounts Payable Recovery Audit Business
4
Table of Contents
The “Grow the Accounts Payable Recovery Audit Business” component of the new strategy is
centered on expanding the Company’s traditional stronghold in recovery audit in the retail
industry, along with a renewed focus on profitably delivering recovery audit services to non-retail
(or what is internally referred to as “commercial”) clients.
In order to facilitate growth in the accounts payable recovery audit market, the Company has
reintroduced a dedicated sales force. In addition, several programs have been initiated to improve
the quality of the Company’s client relationships and to better manage its existing accounts. The
Company has established alliance agreements with several third party service providers to allow the
Company to offer its clients a comprehensive suite of recovery audit services beyond accounts
payable to include tax, real estate, and telecommunications audits. The new service offerings made
possible by these alliance partners both broaden the scope of our audits with existing clients and
will help establish new client relationships and business opportunities around the globe. With a
keen focus on business development and audit strategy, the Company is optimistic about building
this core part of its business.
For the commercial market, a dedicated sales team has again been created for the commercial
recovery audit market, enabling the aggressive pursuit of this client base. Through the
centralization of audit services capabilities, the Company has substantially improved its ability
to serve these clients profitably. Additional service delivery model adjustments are underway to
further improve the gross margin of what is expected to become a larger portion of the Company’s
recovery audit client base.
Simultaneously, although over a slightly longer time frame, the Company is building the
next-generation recovery audit business model by leveraging emergent technology and a global
service footprint to significantly lower the cost-to-serve. This will enable the Company to serve
current clients more efficiently and will also significantly expand the addressable target market.
Grow the Healthcare Recovery Audit Business
The majority of the Company’s Healthcare Recovery Audit services to date relates to the
auditing of Medicare spending as part of the legislatively mandated recovery audit contractor
(“RAC”) program of the Centers for Medicare and Medicaid Services (“CMS”), the federal agency that
administers the Medicare program. From March 28, 2005 through March 27, 2008, the Company was one
of three recovery audit contractors that participated in CMS’s demonstration recovery audit
contractor project after being awarded contracts by CMS. Under the demonstration project, the
Company was responsible for auditing Medicare spending in the State of California and two other
contractors were responsible for auditing Medicare spending in Florida and New York. Under CMS’s
national RAC program, the auditing under which is still ramping up, the Company is operating as a
subcontractor in three of the national RAC program’s four geographic regions. The principal
services provided as part of the Medicare RAC program involve the identification of overpayments
and underpayments made by Medicare to healthcare providers, such as hospitals and physicians’
practices. The Company identifies such improper payments by using various methods, including
proprietary methods which are comparable to the Company’s proprietary techniques developed through
many years of performing other types of recovery audits involving massive volumes of transaction
data.
The Company’s growth strategy in healthcare is to execute with excellence its role in the CMS
RAC program, and leverage its healthcare services infrastructure to expand recovery audit services
to other healthcare payers. The Company has invested heavily in the infrastructure and tools
required to execute its RAC program subcontracts and expects to continue investing in this business
over the next 9 to 12 months. We believe much of this infrastructure can be applied to audit
medical claims paid by other healthcare payers. The Company has started building a sales capability
to sell into other government entities, private payers, and self-administered employers.
Expand Data Mining for Profitability
The Company has launched an integrated value proposition across drivers of client
profitability other than the recovery of overpayments. As evidenced by the Company’s acquisition
of Etesius Limited on February 25, 2010 (see Note 19 of “Notes to Consolidated Financial
Statements” included in Item 8 of this Form 10-K for more information), the Company is bolstering
its client proposition around spend analytics and sourcing/procurement excellence. All of the data
that the Company processes from its clients can be used to create spend reporting at the line item
level of detail, a capability which many of the Company’s clients do not possess in-house. These
reports
5
Table of Contents
are provided to the Company’s clients as a service, commonly known as “SAAS” or software as a
service, at a frequency level and service level pre-defined by the client. The Company will also
provide software solutions around fraud testing and prevention, compliance and controls, contract
management and other elements of the procure to pay process.
Grow the Advisory Services Business
Senior executives of complex organizations regularly require external help to identify and
realize profit improvement opportunities. The Company’s advisory services combine data analytics
with deep functional expertise and a practical hands-on approach to help these client executives
improve their operating margins. Our immediate service offerings supporting the CFO suite include
working capital optimization, corporate performance management, enterprise cost reduction and
finance transformation. Additional service areas that leverage the Company’s analytical
capabilities and long-standing client relationships are in development. These new services are
designed to improve the profitability of its clients’ procure-to-pay cycle and merchandise
optimization.
Build a Strong Team with a High-Performance Culture
The final element of the Company’s strategy is to become a magnet for global talent and
expertise relevant to its service lines and operations. As part of the Company’s overall
transformation, a culture of results-oriented performance and collaboration must be built, and
innovation and knowledge sharing must be facilitated. This transformation is crucial to ensure
that the very best practices are captured, understood, and deployed consistently across every
client globally. In addition, the Company intends to significantly increase its focus on
recruiting. The success of the Company’s new strategy is predicated on finding and putting in
place client-facing personnel who can identify the levers to add to clients’ profitability and
effectively position the Company’s services.
PRGX Services
Accounts Payable Recovery Audit Services
Recovery auditing is a business service focused on finding overpayments created by complex
purchasing processes. Through the use of proprietary technology, audit techniques and
methodologies, the Company’s trained and skilled auditors examine procurement records on a
post-payment basis to identify overpayments, including those resulting from situations such as
missed or inaccurate discounts, allowances and rebates, vendor pricing errors and duplicate
payments.
The Company serves two main client types in its core accounts payable recovery audit business:
retailers/wholesalers and business enterprises other than retailers/wholesalers (called
“commercial” clients within the recovery audit industry). Each type is typically served with a
different service delivery model, as more particularly described below.
Retail/Wholesale
Accounts payable recovery audit services provided to retail/wholesale clients currently
accounts for the substantial majority of the Company’s revenues. These audit services typically
recur annually and are the most extensive of the Company’s recovery audit services, focusing on
numerous recovery categories related to procurement and payment activities, as well as
client/vendor promotions and allowances. These audits typically entail comprehensive and customized
data acquisition from the client, frequently including purchasing, receiving, point-of-sale,
pricing and deal documentation, emails, and payment data. Recovery audits for larger
retail/wholesale clients often require year-round on-site work by multi-auditor teams.
Commercial
The service model for commercial clients is generally different from that for retailers. The
substantial majority of the Company’s domestic commercial recovery audit services clients are
served using a disbursement audit service model which entails obtaining limited data from the
client and an audit focus on a select few recovery categories. Services to these types of clients
to date have tended to be either periodic (typically, every two to three years) or
6
Table of Contents
rotational in nature with different divisions of a given client being audited in pre-arranged
periodic sequences. Accordingly, revenues derived from a given commercial client may change
markedly from year to year. Additionally, the duration of a disbursement audit is often measured in
weeks or months, as opposed to years, and the number of auditors assigned per client is usually
between one and five.
Healthcare Recovery Audit Services
The principal services currently provided as part of healthcare recovery audit involve the
identification of overpayments and underpayments made to healthcare providers, such as hospitals
and physicians’ practices. The Company identifies such improper payments by using various methods,
including proprietary methods which are comparable to the Company’s proprietary techniques
developed through many years of performing other types of recovery audits involving massive volumes
of transaction data. Auditing medical claims data requires in-depth expertise in healthcare
procedures and billing processes, requiring a staff of healthcare professionals, including doctors
and nurses.
Three different categories of healthcare recovery auditing are:
| • | Administrative compliance — analysis of paid claims data to determine if services were provided based on contractual, policy and procedural standards; | ||
| • | Coding and billing — analysis of paid claims data and corresponding medical records to determine payment accuracy; and | ||
| • | Medical necessity — analysis of paid claims data and review of medical records to determine if services were reasonable and necessary. |
The Company’s clients for its healthcare recovery audit services include CMS and other
governmental and private payers.
Business Analytics and Advisory Services
The Company provides advisory services to senior finance executives to optimize working
capital, reduce enterprise costs, transform the finance function and improve corporate performance.
These services target client functional and process areas where the Company has established
expertise. Recovery audit services operate in a mindset of continuous improvement, i.e., reporting
on the over-payment “categories” and their root causes. The Company’s advisory services teams are
well positioned to help clients resolve many of the root causes of errors identified as part of the
Company’s recovery audit services.
Further, the Company believes there are additional opportunities to expand the advisory
services it provides to clients. Specific opportunities relate to services tailored for CFOs and
controllers, direct procurement or merchandising for retailers, and indirect procurement leaders
across all industries. The Company is investing in a portfolio of services that will target the CFO
suite, and will continue to evaluate how to leverage deep category insights to help clients procure
better.
Both the business analytics and advisory services businesses have independent go-to-market
elements, however the Company sees the opportunity for greater client value by leveraging analytics
capabilities and insights in combination with the delivery of advisory services. To deliver on
this promise, the first of what will eventually be several key ‘integrated value propositions,’
combining services across our continuum, are currently under development. With a combination of
data analytics, deep functional expertise, and a practical hands-on approach, the Company is
building a body of project work that it believes will serve as important qualifications for the
future, and the Company is expanding its business analytics and advisory services teams as it makes
additional investments in these areas in 2010.
Clients
The Company provides its services principally to large and mid-sized businesses and government
agencies having numerous payment transactions and complex procurement environments.
Retailers/wholesalers continue to constitute the largest part of the Company’s client and revenue
base. The Company’s five largest clients contributed
7
Table of Contents
approximately 29.9%, 30.4% and 32.6% of its revenues from continuing operations for the years
ended December 31, 2009, 2008 and 2007, respectively. For the years ended December 31, 2009 and
2008, Wal-Mart Stores Inc. (and its affiliated companies) accounted for approximately 12.3% and
11.2% of our total revenues, respectively. The Company did not have any clients who individually
provided revenues in excess of 10.0% of total revenues from continuing operations during the year
ended December 31, 2007.
Sales and Marketing
Due to the highly confidential and proprietary nature of an organization’s purchasing
patterns, procurement practices and payment data, as well as the typical desire to maximize the
amount of funds recovered, most prospective clients conduct an extensive investigation prior to
engaging a specific recovery audit firm. The Company has found that its service offerings that are
the most annuity-like in nature, such as a contract compliance audit, typically require a
relatively long sales cycle and a relatively high level of direct person-to-person contact.
To support the overall recovery audit growth strategy the Company has developed new sales
teams for Recovery Audit Services-Americas. Within this segment, sales roles have been created to
separately target the retail recovery audit market, the commercial recovery audit market, and the
healthcare recovery audit market. Different sales strategies have also been implemented to best
serve each of the different markets (e.g. external sales vs. internal sales) and sales enablement
resources have been created to support the different Americas sales teams. Recovery audit sales
efforts are also coordinated with the business analytics and advisory services sales efforts to
ensure that integrated solutions that meet client needs are being offered. Similar sales
strategies and dedicated sales teams are also in use in the Europe/Asia-Pacific recovery audit
market.
Client Contracts
The Company typically provides services to its clients under terms of a contract. The
Company’s compensation under recovery audit service contracts is in most all cases set as a
stipulated percentage of improper payments or other savings recovered for or realized by clients.
Recovery audit clients generally recover claims by either (a) taking credits against outstanding
payables or future purchases from the involved vendors, or (b) receiving refund checks directly
from those vendors. The manner in which a recovery audit claim is recovered by a client is often
dictated by industry practice. In many cases, client-specific procedural guidelines must be
satisfied by the Company before recovery audit claims are submitted for client approval. For some
services provided by the Company such as advisory services, client contracts often provide for
compensation to the Company in the form of a flat fee, or fee rate per hour, or a fee per other
unit of service.
Most of the Company’s contracts contain provisions that would permit the client to terminate
the contract without cause prior to the completion of the term of the agreement by providing us
with relatively short prior written notice of the termination. In addition to being subject to
termination for material default, the Company’s CMS RAC program subcontracts are subject to
termination or partial termination for convenience to the extent all or any portion of the work
covered by the associated RAC prime contract is eliminated by CMS, or to the extent the Company’s
performance of the subcontract results in an organizational conflict of interest that is not
mitigated or able to be mitigated after joint consultation among CMS, the RAC prime contractor and
the Company.
Technology
The Company uses advanced, proprietary information systems and processes and a large-scale
technology infrastructure to conduct its audits of clients’ payment transactions. Because of the
ever increasing volume and complexity of the transactions of its clients, the Company believes that
its proprietary technology and processes serve as important competitive advantages over both its
principal competitors and its clients’ in-house internal recovery audit functions. To sustain these
competitive advantages, the Company continually invests in technology initiatives for the purpose
of sustaining and improving its advantages in delivering innovative solutions that improve both the
effectiveness and efficiency of the Company’s services.
The Company’s data acquisition, data processing and data management methodologies are aimed at
maximizing efficiencies and productivity and maintaining the highest standards of transaction
auditing accuracy.
8
Table of Contents
At the beginning of a typical recovery audit engagement, the Company utilizes a dedicated
staff of data acquisition specialists and proprietary tools to acquire a wide array of transaction
data from the client for the time period under review. The Company typically receives this data by
secured electronic transmissions, magnetic media or paper. For paper-based data the Company uses a
custom, proprietary imaging technology to scan the paper into electronic format. Upon receipt, the
data is secured, catalogued, backed up and converted into standard, readable formats using third
party and proprietary tools.
Massive volumes of client data are cleansed and mapped by the Company’s technology
professionals, primarily using high performance database and storage technologies, into
standardized layouts at one of the Company’s data processing facilities. Statistical reports are
also generated to verify the completeness and accuracy of the data.
The data is then processed using algorithms (business rules) leveraging over thirty years’
experience to help uncover patterns or potential problems in clients’ various transactional
streams. The Company delivers this data with a high probability of transaction errors to its
auditors who, using the Company’s proprietary audit software, sort, filter and search the data to
validate and identify actual transaction errors. The Company also maintains a secure database of
audit information with the ability to query on multiple variables, including claim categories,
industry codes, vendors and audit years, to facilitate the identification of additional recovery
opportunities and provide recommendations for process improvements to clients.
Once errors are validated, the information is presented to clients for approval and submission
to vendors as “claims.” The Company offers an Internet-based claim presentation and collaboration
tool, which leverages its proprietary imaging technology to help the client view, approve and
submit claims to vendors.
In the spend analytics business, the Company uses proprietary algorithms and technologies to
clean and classify a client’s vendor spend data down to the line item level. This information is
then presented to clients as a multi-dimensional data cube over a web-based interface. The Company
believes these proprietary algorithms and technologies provide it with a competitive advantage over
many of its competitors.
The Company has implemented and manages several distinct technical and procedural controls to
ensure the confidentiality and security of client data and other information. The data security
program encompasses compliance with applicable regulatory requirements within a framework based on
International Standards Organization publications and industry best practices.
Auditor Hiring, Training and Compensation
Many of the Company’s auditors and specialists formerly held finance-related management
positions in the industries the Company serves. Training provided in the field by the Company’s
experienced auditors enables newly hired auditors to develop and refine their auditing skills and
improve productivity. Additionally, the Company provides training for auditors utilizing both
classroom training and training via self-paced media such as specialized computer-based training
modules. Training programs are periodically upgraded based on feedback from auditors and changing
industry protocols. Many of the Company’s auditors and specialists participate in one of the
Company’s incentive compensation plans that link compensation of the auditor or specialist to audit
performance.
Proprietary Rights
From time to time, the Company develops new software and methodologies that replace or enhance
existing proprietary software and methodologies. The Company relies primarily on trade secret and
copyright protection for its proprietary software and other proprietary information. The Company
owns or has rights to various copyrights, trademarks and trade names used in the Company’s
business. The Company’s trademarks and trade names include, but are not limited to
PRGXSM, Discover Your Hidden ProfitsSM, PRG-Schultz®, imDex®, AuditPro™,
SureF!nd™ , Direct F!nd™ and claimDex™.
Competition
Accounts Payable Recovery Audit
9
Table of Contents
The Company has numerous accounts payable recovery audit competitors, all but one of which are
believed to be substantially smaller than the Company. The Company believes that only one of its
competitors, also believed to be smaller than the Company, offers a full suite of international
recovery audit services. Barriers to effective entry and longevity as a viable accounts payable
auditor are believed to vary based on the complexity of the audit. For complex audits, including
contract compliance auditing such as that done for large retailers, the Company believes that
barriers to entry are significant as a result of numerous factors including, but not limited to,
significant technology infrastructure requirements, the need to gather, summarize and examine
volumes of client data at the line-item level of detail, the need to establish effective audit
techniques and methodologies, and the need to hire and train audit professionals to work in a very
specialized manner that requires technical proficiency with numerous recovery categories.
The Company believes that the barriers to entry for less complex duplicate and statement
disbursement audit services are relatively low and that this market is highly competitive. It is
the Company’s belief that the low barriers to entry for these types of services result from limited
technology infrastructure requirements, the need for relatively minimal high-level data, and an
audit focus on a select few recovery categories. The Company’s revenues for the less complex
duplicate and statement disbursement audit services total less than 5% of its total revenues for
2009.
While the Company believes that it has the greatest depth and breadth of audit expertise, data
and technology capabilities, scale and global presence in the industry, the Company faces
competition from the following:
Client Internal Recovery Audit Departments. A number of large retailers (particularly those in
the discount, grocery and drug sectors) have developed an internal recovery audit process to
review transactions prior to turning them over to external recovery audit firms. Regardless of
the level of recoveries made by internal recovery audit departments, the Company has observed
that virtually all large retail clients retain at least one (primary), and sometimes two
(primary and secondary), external recovery audit firms to capture errors not identified by their
internal recovery audit departments.
Other Accounts Payable Recovery Audit Firms. The competitive landscape in the recovery audit
industry is comprised of:
| • | Full-service accounts payable recovery audit firms. The Company believes that only one other company also offers a full suite of U.S. and international recovery audit services; | ||
| • | A large number of smaller accounts payable recovery firms which have a limited client base and which use less sophisticated tools to mine disbursement claim categories at low contingency rates. These firms are most common in the U.S. market. Competition in most international markets, if any, typically comes from small niche providers; | ||
| • | Firms that offer a hybrid of audit software tools and training for use by internal audit departments, and/or general accounts payable process improvement enablers; and | ||
| • | Firms with specialized skills focused on recovery audit services for discrete sectors such as sales and use tax or real estate. |
Other Providers of Recovery Audit Services. The major international accounting firms provide
recovery audit services; however, the Company believes their practices tend to be focused on
tax-related services.
Healthcare Recovery Audit Services
A number of national and regional private payers also have developed their own post payment
recovery audit capabilities. Nevertheless, these private payers typically also retain or engage one
or more third party post payment audit service providers. The competitive landscape in the
healthcare recovery audit includes:
| • | Firms that provide recovery audit services across multiple industries including healthcare; | ||
| • | Firms that provide healthcare IT solutions and services to both the government and private payers; and |
10
Table of Contents
| • | Firms that contract with federal and state governments’ integrity programs. |
Business Analytics Services
The Company’s business analytics services compete with a range of providers ranging from
large, well known ERP software vendors, procurement specific software providers and smaller,
very specialized analytics providers. In addition, in certain instances the Company may be
competing against consulting firms that develop custom analytics tools on behalf of their
clients.
Advisory Services
The Company’s advisory services business faces competition from regional and local consulting
firms as well as from privately and publicly held worldwide and national firms, many of whom
have established and well known franchises and brands. These businesses compete generally on the
basis of the range, quality and cost of the services and products provided to clients. The
Company believes that it is differentiated from its competitors by virtue of synergies with the
Company’s analytics capabilities and its direct channel to existing accounts payable recovery
audit clients.
Regulation
Various aspects of the Company’s business, including, without limitation, its data
acquisition, processing and reporting protocols, are subject to extensive and frequently changing
governmental regulation in both the U.S. and internationally. These regulations include extensive
data protection and privacy requirements such as, in the U.S., the Health Insurance Portability and
Accountability Act of 1996 (“HIPAA”), with respect to the Company’s healthcare claims recovery
audit work, and, internationally, the European Data Protection Directive, as such Directive has
been implemented by various members of the European Union in which the Company operates. Failure
to comply with such regulations may, depending on the nature of the noncompliance, result in the
termination or loss of contracts, the imposition of contractual damages, civil sanctions, damage to
the Company’s reputation or in certain circumstances, criminal penalties.
Employees
As of January 31, 2010, the Company had approximately 1,300 employees, of whom approximately
630 were located in the U.S. The majority of the Company’s employees are involved in the audit
function. None of the Company’s employees are covered by a collective bargaining agreement and the
Company believes its employee relations are satisfactory.
Website
The Company makes available free of charge on its website, www.prgx.com, its annual report on
Form 10-K, quarterly reports on Form 10-Q, current reports on Form 8-K and all amendments to those
reports. The Company makes all filings with the Securities and Exchange Commission available on its
website no later than the close of business on the date the filing was made. In addition, investors
can access the Company’s filings with the Securities and Exchange Commission at www.sec.gov.
11
Table of Contents
ITEM 1A. Risk Factors
Revenues from our accounts payable recovery audit business have declined over the last several
years. We must successfully execute our recovery audit growth strategy in order to reverse this
trend.
Over time, our clients tend to resolve recurring transaction processing deficiencies. In
addition, many of our clients have internal staffs that audit the transactions before we do. As the
skills, experience and resources of our clients’ internal recovery audit staffs improve, they will
identify many overpayments themselves and reduce some of our audit recovery opportunities. Based on
these and other factors, including competitive rate pressures and loss of clients from time to
time, without improved audit execution and acquisition of new clients, we believe that our accounts
payable recovery audit business will continue to experience revenue declines.
We depend on our largest clients for significant revenues, so losing a major client could adversely
affect our revenues and liquidity.
We generate a significant portion of our revenues from our largest clients. For the years
ended December 31, 2009, 2008 and 2007, our five largest clients accounted for approximately 29.9%,
30.4% and 32.6% of our revenues from continuing operations, respectively. For the years ended
December 31, 2009 and 2008, Wal-Mart Stores Inc. (and its affiliated companies) accounted for
approximately 12.3% and 11.2% of our total revenues, respectively. If we lose any of our major
clients, our results of operations and liquidity could be materially and adversely affected.
We have a history of losses and may not be able to sustain profitability.
We reported a net loss from continuing operations of $7.1 million for the year ended December
31, 2007 and net losses of $21.1 million, $207.7 million, $71.5 million, and $160.8 million for the
years ended December 31, 2006, 2005, 2004 and 2003, respectively. Despite reporting a profit from
continuing operations for the years ended December 31, 2009 and 2008, we can make no assurance that
our ongoing cost management efforts or our attempts to increase our revenues will be successful on
a sustained basis. If we are not able to increase revenues and effectively manage our costs, we may
not be able to sustain profitability in the future or generate sufficient cash to fund our
operations and pay our indebtedness.
Client and vendor bankruptcies and financial difficulties could reduce our earnings.
Our clients generally operate in intensely competitive environments and, accordingly,
bankruptcy filings by our clients are not uncommon. Bankruptcy filings by our large clients or the
significant vendors who supply them or unexpectedly large vendor claim chargebacks lodged against
one or more of our larger clients could have a materially adverse effect on our financial condition
and results of operations. Similarly, our inability to collect our accounts receivable due to other
financial difficulties of one or more of our large clients could adversely affect our financial
condition and results of operations.
Recent economic conditions which have adversely impacted the U.S. retail industry may continue
to negatively impact our revenues. Since we audit our clients’ purchases on an average of 12-18
months in arrears, we may not know the full impact of the recent economic downturn on our business
and revenues until late 2010 or later. We expect that if the retail industry economic conditions
continue to erode, it could continue to have a negative impact on our revenues. Specifically,
client liquidity and the liquidity of client vendors can significantly impact claim production, the
claim approval process, and the ability of clients to offset or otherwise make recoveries from
their vendors.
If a client files for bankruptcy, we could be subject to an action to recover certain payments
received in the 90 days prior to the bankruptcy filing known as “preference payments.” If we are
unsuccessful in defending against such claims, we would be required to make unbudgeted cash
payments which could strain our financial liquidity and our earnings would be reduced.
Our growth strategy may not be successful.
As discussed in Item 1 “The PRGX Strategy,” our objective is to build on our position as the
leading worldwide provider of recovery audit services and to develop and grow our business
analytics and advisory services businesses.
12
Table of Contents
Our strategic plan to achieve these objectives focuses on a series of initiatives designed to
maintain our dedicated focus on clients and rekindle our growth. We are executing a number of
initiatives that are designed to implement our strategy. These initiatives are ongoing and the
results of the strategy and implementation will not be known until sometime in the future. Each of
the initiatives requires sustained management focus, organization and coordination over time, as
well as success in building relationships with third parties. If we are unable to implement our
strategy successfully, our results of operations and cash flows could be adversely affected. In
addition, implementation of our strategy will require material investments and cost increases which
may not yield incremental revenues and improved financial performance as planned.
We have incurred significant costs in establishing the necessary resources to provide services for
Medicare audit recovery work and we will continue to incur significant costs as a subcontractor in
the national RAC program. Furthermore, revenues from our Medicare audit recovery work lag
significantly behind these costs and may not justify the costs incurred.
We have expended substantial resources in connection with preparing for and providing Medicare
audit services under CMS’s RAC program. While our participation in the RAC demonstration project
made an important contribution to our revenues in 2006 and 2007, the RAC demonstration project
contract expired on March 27, 2008. We continue to incur significant costs relating to our
participation as a subcontractor in the national RAC program. We incurred an operating loss of
approximately $4.0 million during the year ended December 31, 2009 in connection with our RAC
subcontractor program work. In addition, as a result of the complex regulations governing Medicare
payments and recoupments, including a multi-layered scheme for provider appeals of overpayment
determinations, the terms of the Company’s Medicare audit subcontracts and the complexity of
Medicare data, systems and processes, generally, it is more difficult and takes longer to achieve
recoveries than in other areas of our recovery audit business.
Recovery auditing of Medicare spending is subject to a number of pressures and uncertainties that
could impact our future opportunities and revenues from this business.
As contrasted with recovery auditing for our retail/wholesale and commercial clients, recovery
auditing of Medicare spending is a legislatively mandated program subject to, among other things,
the efforts of healthcare providers and provider associations, including political pressures, to
end or severely limit the CMS recovery audit program. These efforts and political pressures are
expected to be ongoing throughout the life of the CMS recovery audit program and during 2007, for
example, resulted in a number of significant developments. In October 2007, CMS implemented a
temporary “pause” in our review under the RAC demonstration program of certain payments made to
rehabilitation hospitals. Further, on November 8, 2007, legislation was introduced in Congress
proposing a one year halt to CMS’s recovery audit program and calling for an assessment of the
program by the U.S. Government Accountability Office. Although the referenced legislation was not
passed, and the national CMS RAC program is underway, similar legislative efforts to delay or
eliminate the program could emerge at any time and management is unable to assess the prospects for
the success of any such legislation. Furthermore, efforts by healthcare providers and provider
associations to limit or end the program are expected to be ongoing. If CMS’s recovery audit
program is significantly limited or delayed, subjected to burdensome or commercially challenging
requirements, terms and/or conditions, or altogether terminated, our future revenues, operating
results and financial condition could be materially adversely impacted.
Our participation in the national Medicare recovery audit program is as a subcontractor, and
consequently, is subject to being reduced or eliminated should the prime contractors with whom we
have contracted have their prime contracts with CMS terminated or should those contracts expire.
Under CMS’s national recovery audit contractor program, we will be participating as a
subcontractor in three of the national RAC program’s four geographic regions. Accordingly, we have
entered into three separate contracts with the prime contractors and are not directly contracting
with CMS. Under these circumstances, we generally bear the risk that the prime contractors will
not meet their performance obligations to CMS under the prime contract, that the prime contractors
will not pay us amounts due under the subcontracts and that the prime contractors will seek to
minimize our role in RAC program. The failure of a prime contractor to perform its obligations to
CMS could result in the termination of such contract with CMS which would, in turn, result in the
termination of our subcontract. Additionally, CMS could choose to not exercise its option to
extend its contract with any of the prime contractors at the end of any one-year term, which would
also, in turn, result in our subcontract with that prime contractor
13
Table of Contents
expiring. The termination or expiration of these subcontracts or the failure of the prime
contractors to make required payments to us could have a material adverse effect on our business,
financial condition and results of operations.
We may be unable to protect and maintain the competitive advantage of our proprietary technology
and intellectual property rights.
Our operations could be materially and adversely affected if we are not able to protect our
proprietary software, audit techniques and methodologies, and other proprietary intellectual
property rights. We rely on a combination of trade secret and copyright laws, nondisclosure and
other contractual arrangements and technical measures to protect our proprietary rights. Although
we presently hold U.S. and foreign registered trademarks and U.S. registered copyrights on certain
of our proprietary technology, we may be unable to obtain similar protection on our other
intellectual property. In addition, our foreign registered trademarks may not receive the same
enforcement protection as our U.S. registered trademarks.
Additionally, to protect our confidential and trade secret information, we generally enter
into nondisclosure agreements with our employees, consultants, clients and potential clients. We
also limit access to, and distribution of, our proprietary information. Nevertheless, we may be
unable to deter misappropriation or unauthorized dissemination of our proprietary information,
detect unauthorized use and take appropriate steps to enforce our intellectual property rights.
Even though we take care to protect our own intellectual property, there is no guarantee that our
competitors will not independently develop technologies that are substantially equivalent or
superior to our technology. Moreover, although we believe that our services and products do not
infringe on the intellectual property rights of others, we are also subject to the risk that
someone else will assert a claim against us in the future for violating their intellectual property
rights.
Security breaches or computer viruses could harm our business by disrupting our delivery of
services, damaging our reputation or exposing us to liability.
We receive, process, store and transmit our clients’ confidential data electronically.
Unauthorized access to our computer systems or stored data could result in the theft or disclosure
of confidential information or the deletion or modification of records or could cause interruptions
in our operations. These security risks increase when we transmit information over the Internet or
other electronic networks. Despite implemented security measures, computer viruses from electronic
networks or in physical media could infiltrate our systems and disrupt our delivery of services or
expose our clients’ confidential information. A security breach or computer virus could have a
negative impact on our reputation, could expose us to liability to our clients, third parties or
government authorities and could cause our present and potential clients to choose another service
provider. Any of these developments could have a material adverse effect on our business, results
of operations and financial condition.
Operational failures in our data processing facilities could harm our business and reputation.
An interruption of data processing services caused by damage or destruction of our facilities
or a failure of our data processing equipment could result in a loss of clients, difficulties in
obtaining new clients and a reduction in revenue. In addition, we may also be liable to third
parties or our clients because of such interruption. These risks increase with longer service
interruptions. Despite any disaster recovery and business continuity plans and precautions we have
implemented (including insurance) to protect against the effects of service delivery interruptions,
such interruptions could result in a material adverse effect on our business, results of operations
and financial condition.
Our failure to retain the services of key members of management and highly skilled personnel could
adversely impact our operations and financial performance.
Our future success depends largely on the efforts and skills of our executive officers and key
employees. As such, we have entered into employment agreements with key members of management.
While these employment agreements limit the ability of key employees to directly compete with us in
the future, nothing prevents them from leaving our company.
In addition, it is especially challenging to attract and retain highly qualified skilled
auditors and other professionals in an industry where competition for skilled personnel is intense.
Accordingly, our future performance also depends, in part, on the ability of our management team to
work together effectively, manage our workforce,
14
Table of Contents
and retain highly qualified personnel.
We rely on operations outside the U.S. for a significant portion of our revenues.
Approximately 45.8% and 42.8% of our revenues from continuing operations were generated from
operations outside the U.S. in 2009 and 2008, respectively. These international operations are
subject to numerous risks, including:
| • | political and economic instability in the international markets we serve; | ||
| • | difficulties in staffing and managing foreign operations and in collecting accounts receivable; | ||
| • | fluctuations in currency exchange rates, particularly weaknesses in the British pound, the euro, the Canadian dollar, the Mexican peso, and the Brazilian real and other currencies of countries in which we transact business, which could result in currency translations that materially reduce our revenues and earnings; | ||
| • | costs associated with adapting our services to our foreign clients’ needs; | ||
| • | unexpected changes in regulatory requirements and laws; | ||
| • | expenses and legal restrictions associated with transferring earnings from our foreign subsidiaries to us; | ||
| • | burdens of complying with a wide variety of foreign laws and labor practices; | ||
| • | business interruptions due to widespread disease, potential terrorist activities, or other catastrophes; | ||
| • | reduced or limited protection of our intellectual property rights; and | ||
| • | longer accounts receivable cycles. |
Because we expect a significant portion of our revenues to continue to come from operations
outside the U.S., the occurrence of any of these events could materially and adversely affect our
business, financial condition and results of operations.
Our
revenues from providing accounts payable recovery audit services to commercial clients have
been declining.
The service model for commercial clients is generally different from that for retailers. The
substantial majority of our domestic commercial accounts payable recovery audit clients are served
using a disbursement audit service model which entails obtaining limited data from the client and
an audit focus on a select few recovery categories. Historically, services to these types of
clients have tended to be either periodic (typically, every two to three years) or rotational in
nature with different divisions of a given client being audited in pre-arranged periodic sequences.
Accordingly, revenues derived from a given commercial client may change markedly from year to year.
Additionally, the duration of a disbursement audit is often measured in weeks or months, as opposed
to years, and the number of auditors assigned per client is usually between one and five. We will
need to successfully execute our strategies to lower our cost to serve commercial recovery audit
clients, broaden the number of profitably served recovery audit clients and grow our other lines of
business in order to stabilize and increase our revenues to replace declining revenues from this
business.
Our recovery audit services, business analytics and advisory services businesses operate in highly
competitive environments and are subject to pricing pressure.
The recovery audit business is highly competitive, with numerous other recovery audit firms
and other providers of recovery audit services, and with many clients having developed their own
internal audit capabilities. As a result of competition among the providers of recovery audit
services and the availability of certain audit services from clients’ internal audit departments,
our recovery audit services business is subject to intense price pressure. Such price pressure
could cause our profit margins to decline and have a material adverse effect on our business,
financial condition, and results of operations.
Our business analytics and advisory services businesses also have numerous competitors varying
in size, market strength and specialization. These businesses face competition, in some cases,
from firms who have established and well known franchises and brands. Frequently, these businesses
must compete not only on service quality and expertise, but also on price. Intense price
competition faced by these service lines could negatively impact our profit margins and have a
potential adverse effect on our business, financial condition and results of operations.
15
Table of Contents
Generally our client contracts contain provisions under which the client may terminate the
agreement prior to the completion of the agreement.
Many of our client contracts contain provisions that would permit the client to terminate the
contract without cause prior to the completion of the term of the agreement by providing us with
relatively short prior written notice of the termination. As a result, the existence of
contractual relationships with our clients is not an assurance that we will continue to provide
services for our clients through the entire terms of their respective agreements. If clients
representing a significant portion of our revenues terminated their agreements unexpectedly, we may
not, in the short-term, be able to replace the revenues and earnings from such contracts and this
would have a material adverse effect on our operations and financial results. In addition, client
contract terminations could also harm our reputation within the industry which could negatively
impact our ability to obtain new clients.
Our failure to comply with applicable governmental privacy laws and regulations could substantially
impact our business, operations and financial condition.
We are subject to extensive and evolving federal, state and foreign privacy laws and
regulations. Changes in privacy laws or regulations or new interpretations of existing laws or
regulations could have a substantial effect on our operating methods and costs. Failure to comply
with such regulations could result in the termination or loss of contracts, the imposition of
contractual damages, civil sanctions, damage to the Company’s reputation, or in certain
circumstances, criminal penalties, any of which could have a material adverse effect on our results
of operations, financial condition, business and prospects. Determining compliance with such
regulations is complicated by the fact that many of these laws and regulations have not been fully
interpreted by governing regulatory authorities or the courts and many of the provisions of such
laws and regulations are open to a wide range of interpretations. There can be no assurance that
we are or have been in compliance with all applicable existing laws and regulations or that we will
be able to comply with new laws or regulations.
The ownership change that occurred as a result of our 2006 exchange offer limits our ability to use
our net operating losses.
We have substantial tax loss and credit carry-forwards for U.S. federal income tax purposes.
On March 17, 2006, as a result of the closing of its exchange offer, the Company experienced an
ownership change as defined under Section 382 of the Internal Revenue Code (“IRC”). This ownership
change resulted in an annual IRC Section 382 limitation that limits the use of certain tax
attribute carry-forwards. Of the $47.4 million of U.S. federal net loss carry-forwards available to
the Company, $21.9 million of the loss carry-forwards are subject to an annual usage limitation of
$1.4 million. We believe that such limitations and the loss of these carry-forwards may
significantly increase our projected future tax liability.
Certain of our tax positions may be subject to challenge by the Internal Revenue Service and other
tax authorities, and if successful, these challenges could increase our future tax liabilities and
expense.
For U.S. federal income tax purposes, as well as local country tax purposes in the
jurisdictions where we operate, from time to time we take positions under provisions of applicable
tax law that are subject to varying interpretations. Certain of our tax positions may be subject
to challenge by the applicable taxing authorities, including, in the U.S., the Internal Revenue
Service. If our tax positions are successfully challenged, our future tax liabilities and expense
could significantly increase.
For example, during 2008, the Company acceded to a position taken by the taxing authorities in
the United Kingdom (“UK”) regarding the denial of certain goodwill deductions taken on UK tax
returns for 2003 through 2005. As a result, foreign net operating loss carry-forwards were reduced
by approximately $17.0 million based on December 31, 2008 foreign exchange rates. Accordingly,
deferred tax assets of $5.1 million were written off.
While we believe that our tax positions are proper based on applicable law and we believe that
it is more likely than not that we would prevail with respect to challenges to these positions, we
can make no assurances that we would prevail if our positions are challenged or that business
economics would justify the mounting of a legal defense against such challenges. If our tax
positions are successfully challenged by the U.S. or non-U.S. taxing authorities, it could increase
our future tax liabilities and expense and have a material adverse impact on our financial
position, results of operations and cash flows.
16
Table of Contents
Future impairment of goodwill, other intangible assets and long-lived assets would reduce our
future earnings.
As of December 31, 2009, the Company’s goodwill and other intangible assets totaled $28.7
million. We must perform annual assessments to determine whether some portion, or all, of our
goodwill, intangible assets and other long-term assets are impaired. Future annual impairment
testing under Financial Accounting Standards Board (“FASB”) Accounting Standards Codification
(“ASC”) 350, “Intangibles — Goodwill and Other” (“FASB ASC 350”) could result in a determination
that our goodwill or other intangible assets have been impaired, and future annual impairment
testing under FASB ASC 350 could result in a determination that our long-lived assets have been
impaired. Adverse future changes in the business environment or in our ability to perform audits
successfully and compete effectively in our market or the discontinuation of our use of certain of
our intangible or other long-lived assets could result in impairment which could materially
adversely impact future earnings.
Our articles of incorporation, bylaws, shareholder rights plan and Georgia law may inhibit a change
of control that shareholders may favor.
Our articles of incorporation, bylaws and Georgia law contain provisions that may delay, deter
or inhibit a future acquisition not approved by our Board of Directors. This could occur even if
our shareholders receive attractive offers for their shares or if a substantial number, or even a
majority, of our shareholders believe the takeover is in their best interest. These provisions are
intended to encourage any person interested in acquiring us to negotiate with and obtain the
approval of our Board of Directors in connection with the transaction. Provisions that could delay,
deter or inhibit a future acquisition include the following:
| • | a classified Board of Directors; | ||
| • | the requirement that our shareholders may only remove directors for cause; | ||
| • | specified requirements for calling special meetings of shareholders; and | ||
| • | the ability of the Board of Directors to consider the interests of various constituencies, including our employees, clients and creditors and the local community, in making decisions. |
Our articles of incorporation also permit the Board of Directors to issue shares of preferred
stock with such designations, powers, preferences and rights as it determines, without any further
vote or action by our shareholders. In addition, we have in place a “poison pill” shareholders’
rights plan that could trigger a dilutive issuance of common stock upon substantial purchases of
our common stock by a third party that are not approved by the Board of Directors. These provisions
also could discourage bids for our shares of common stock at a premium and have a material adverse
effect on the market price of our common stock.
The terms of our credit facility place restrictions on us, which create risks of default and reduce
our flexibility.
Our
current credit facility (see “New Credit Facility” included in Item 7 of this Form 10-K
for information regarding our new credit facility) contains a number of affirmative, negative, and
financial covenants which limit our ability to take certain actions and require us to comply with
specified financial ratios and other performance covenants. No assurance can be provided that we
will not violate the covenants of our secured credit facility in the future. If we are unable to
comply with our financial covenants in the future, our lenders could pursue their contractual
remedies under the credit facility, including requiring the immediate repayment in full of all
amounts outstanding, if any. Additionally, we cannot be certain that, if the lenders demanded
immediate repayment of any amounts outstanding, we would be able to secure adequate or timely
replacement financing on acceptable terms or at all.
Our ability to make payments due on our debt will depend upon our future operating
performance, which is subject to general economic and competitive conditions and to financial,
business and other factors, many of which we cannot control. If the cash flow from our operating
activities is insufficient, we may take actions such as delaying or reducing capital expenditures,
attempting to restructure or refinance our debt, selling assets or operations or seeking additional
equity capital. Some or all of these actions may not be sufficient to allow us to service our debt
obligations and we could be required to file for bankruptcy. Further, we may be unable to take any
of these actions on satisfactory terms, in a timely manner or at all. In addition, our credit
agreements may limit our ability to take several of these actions. Our failure to generate
sufficient funds to pay our debts or to undertake any of these actions successfully could
materially adversely affect our business, results of operations and financial condition.
Our stock price has been and may continue to be volatile.
17
Table of Contents
Our common stock is currently traded on The Nasdaq Global Market. The trading price of our
common stock has been and may continue to be subject to large fluctuations. For example, for the
year ended December 31, 2009, our stock traded as high as $6.98 per share and as low as $2.48 per
share. Our stock price may increase or decrease in response to a number of events and factors,
including:
| • | future announcements concerning us, key clients or competitors; | ||
| • | quarterly variations in operating results and liquidity; | ||
| • | changes in financial estimates and recommendations by securities analysts; | ||
| • | developments with respect to technology or litigation; | ||
| • | the operating and stock price performance of other companies that investors may deem comparable to our company; | ||
| • | acquisitions and financings; and | ||
| • | sales and purchases of blocks of stock by insiders. |
Fluctuations in the stock market, generally, also impact the volatility of our stock price.
Finally, general economic conditions and stock market movements may adversely affect the price of
our common stock, regardless of our operating performance.
18
Table of Contents
ITEM 1B. Unresolved Staff Comments
None.
ITEM 2. Properties
The Company’s principal executive offices are located in approximately 132,000 square feet of
office space in Atlanta, Georgia. The Company leases this space under an agreement expiring on
December 31, 2014. The Company has subleased approximately 58,000 square feet of its principal
executive office space to independent third parties. The Company’s various operating units lease
numerous other parcels of operating space in the various countries in which the Company currently
conducts its business.
Excluding the lease for the Company’s principal executive offices, the majority of the
Company’s real property leases are individually less than five years in duration. See Note 9 of
“Notes to Consolidated Financial Statements” included in Item 8 of this Form 10-K.
ITEM 3. Legal Proceedings
In the normal course of business, the Company is involved in and subject to claims,
contractual disputes and other uncertainties. Management, after reviewing with legal counsel all of
these actions and proceedings, believes that the aggregate losses, if any, will not have a material
adverse effect on the Company’s financial position or results of operations.
ITEM 4. [Reserved]
19
Table of Contents
PART II
ITEM 5. Market for Registrant’s Common Equity, Related Stockholder Matters and Issuer Purchases of
Equity Securities
The Company’s common stock is traded under the symbol “PRGX” on The Nasdaq Global Market
(Nasdaq). The Company has not paid cash dividends on its common stock since it became a public
company in 1996 and does not intend to pay cash dividends in the foreseeable future. Moreover,
restrictive covenants included in the Company’s secured credit facility specifically prohibit
payment of cash dividends and limits the amount of its common stock that the Company may repurchase
to $1.0 million on an annual basis. As of February 28, 2010, there were 211 holders of record of
the Company’s common stock and management believes there were in excess of 2,500 beneficial
holders. The following table sets forth, for the quarters indicated, the range of high and low
sales prices for the Company’s common stock as reported by Nasdaq during 2009 and 2008.
| High | Low | |||||||
2009 Calendar Quarter |
||||||||
1st Quarter |
$ | 4.91 | $ | 2.74 | ||||
2nd Quarter |
4.04 | 2.48 | ||||||
3rd Quarter |
6.01 | 2.60 | ||||||
4th Quarter |
6.98 | 4.50 | ||||||
| High | Low | |||||||
2008 Calendar Quarter |
||||||||
1st Quarter |
$ | 9.57 | $ | 6.77 | ||||
2nd Quarter |
10.72 | 8.45 | ||||||
3rd Quarter |
12.30 | 8.29 | ||||||
4th Quarter |
9.02 | 3.22 | ||||||
The Company did not repurchase any of its common stock during the quarter ended December 31, 2009.
20
Table of Contents
Performance Graph
Set forth below is a line graph presentation comparing the cumulative shareholder return on
the Company’s common stock, on an indexed basis, against cumulative total returns of The Nasdaq
Composite Index and the RDG Technology Composite Index. The graph assumes that the value of the
investment in the common stock in each index was $100 on December 31, 2004 and shows total return
on investment for the period beginning December 31, 2004 through December 31, 2009, assuming
reinvestment of any dividends. Notwithstanding anything to the contrary set forth in any of the
Company’s filings under the Securities Act of 1933, or the Securities Exchange Act of 1934 that
might incorporate future filings, including this Annual Report on Form 10-K, in whole or in part,
the Performance Graph presented below shall not be incorporated by reference into any such filings.
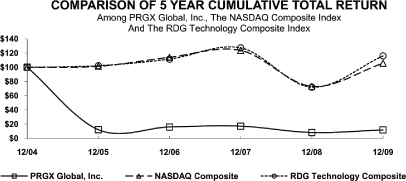
VALUE OF $100 INVESTED ON DECEMBER 31, 2004 AT:
Cumulative Total Return
| 12/04 | 12/05 | 12/06 | 12/07 | 12/08 | 12/09 | |||||||||||||||||||
PRGX Global, Inc. |
100.00 | 12.13 | 15.90 | 17.04 | 8.11 | 11.75 | ||||||||||||||||||
NASDAQ Composite |
100.00 | 101.33 | 114.01 | 123.71 | 73.11 | 105.61 | ||||||||||||||||||
RDG Technology Composite |
100.00 | 102.13 | 111.45 | 127.27 | 71.89 | 115.97 | ||||||||||||||||||
21
Table of Contents
ITEM 6. Selected Financial Data
The following table sets forth selected consolidated financial data for the Company as of and
for the five years ended December 31, 2009. Such historical consolidated financial data have been
derived from the Company’s Consolidated Financial Statements and Notes thereto, which have been
audited by the Company’s Independent Registered Public Accounting Firms. The Consolidated Balance
Sheets as of December 31, 2009 and 2008, and the related Consolidated Statements of Operations,
Shareholders’ Equity (Deficit) and Cash Flows for each of the years in the three-year period ended
December 31, 2009 and the report of the Independent Registered Public Accounting Firm thereon are
included in Item 8 of this Form 10-K.
The Company’s Consolidated Financial Statements have been reclassified to reflect Meridian,
Communications Services, Channel Revenue, Airline, and the recovery audit services business units
in Japan and South Africa as discontinued operations for all periods presented. All per share data
has been restated to give effect to the one-for-ten reverse stock split which became effective
August 14, 2006.
The data presented below should be read in conjunction with the Consolidated Financial
Statements and Notes thereto included elsewhere in this Form 10-K and other financial information
appearing elsewhere in this Form 10-K, including “Management’s Discussion and Analysis of Financial
Condition and Results of Operations.”
| Years Ended December 31, | ||||||||||||||||||||
| 2009 | 2008 | 2007 | 2006 | 2005 | ||||||||||||||||
| (In thousands, except per share data) | ||||||||||||||||||||
Statements of Operations Data: |
||||||||||||||||||||
Revenues |
$ | 179,583 | $ | 195,706 | $ | 227,369 | $ | 225,898 | $ | 251,527 | ||||||||||
Cost of revenues |
116,718 | 125,901 | 140,877 | 161,827 | 167,886 | |||||||||||||||
Gross margin |
62,865 | 69,805 | 86,492 | 64,071 | 83,641 | |||||||||||||||
Selling, general and administrative
expenses (1) |
43,873 | 44,028 | 67,063 | 56,500 | 104,760 | |||||||||||||||
Impairment charges (2) |
— | — | — | — | 170,375 | |||||||||||||||
Operational restructuring expense |
— | — | 1,644 | 4,130 | 11,167 | |||||||||||||||
Operating income (loss) |
18,992 | 25,777 | 17,785 | 3,441 | (202,661 | ) | ||||||||||||||
Gain on bargain purchase, net (3) |
2,388 | — | — | — | — | |||||||||||||||
Interest expense, net |
3,025 | 3,245 | 13,815 | 16,311 | 8,278 | |||||||||||||||
Loss on debt extinguishment and
financial restructuring |
— | — | 9,397 | 10,047 | — | |||||||||||||||
Income (loss) from continuing
operations before income taxes and
discontinued operations |
18,355 | 22,532 | (5,427 | ) | (22,917 | ) | (210,939 | ) | ||||||||||||
Income tax expense (4) |
3,028 | 3,502 | 1,658 | 1,165 | 63 | |||||||||||||||
Income (loss) from continuing
operations before discontinued
operations |
15,327 | 19,030 | (7,085 | ) | (24,082 | ) | (211,002 | ) | ||||||||||||
Discontinued operations: |
||||||||||||||||||||
Earnings from discontinued
operations, net of income taxes |
— | — | 20,215 | 2,983 | 3,262 | |||||||||||||||
Net earnings (loss) |
$ | 15,327 | $ | 19,030 | $ | 13,130 | $ | (21,099 | ) | $ | (207,740 | ) | ||||||||
Basic earnings (loss) per common share: |
||||||||||||||||||||
Earnings (loss) from continuing
operations before discontinued
operations |
$ | 0.67 | $ | 0.87 | $ | (0.62 | ) | $ | (3.77 | ) | $ | (34.03 | ) | |||||||
Earnings from discontinued operations |
— | — | 1.66 | 0.45 | 0.53 | |||||||||||||||
Net earnings (loss) |
$ | 0.67 | $ | 0.87 | $ | 1.04 | $ | (3.32 | ) | $ | (33.50 | ) | ||||||||
Diluted earnings (loss) per common share: |
||||||||||||||||||||
Earnings (loss) from continuing
operations before discontinued
operations |
$ | 0.65 | $ | 0.83 | $ | (0.62 | ) | $ | (3.77 | ) | $ | (34.03 | ) | |||||||
Earnings from discontinued operations |
— | — | 1.66 | 0.45 | 0.53 | |||||||||||||||
Net earnings (loss) |
$ | 0.65 | $ | 0.83 | $ | 1.04 | $ | (3.32 | ) | $ | (33.50 | ) | ||||||||
22
Table of Contents
| December 31, | ||||||||||||||||||||
| 2009 | 2008 | 2007 | 2006 | 2005 | ||||||||||||||||
| (In thousands) | ||||||||||||||||||||
Balance Sheet Data: |
||||||||||||||||||||
Cash and cash equivalents |
$ | 33,026 | $ | 26,688 | $ | 42,364 | $ | 30,228 | $ | 8,361 | ||||||||||
Working capital |
18,479 | 10,512 | 16,998 | 5,218 | (9,123 | ) | ||||||||||||||
Total assets |
110,513 | 98,783 | 122,438 | 178,667 | 162,062 | |||||||||||||||
Long-term debt, excluding
current installments |
11,070 | 14,331 | 38,078 | 136,922 | 140,401 | |||||||||||||||
Redeemable preferred stock |
— | — | — | 11,199 | — | |||||||||||||||
Total shareholders’ equity (deficit) |
$ | 41,439 | $ | 22,710 | $ | 2,349 | $ | (104,483 | ) | $ | (102,365 | ) | ||||||||
| (1) | The Company adopted the provisions of FASB ASC 718, “Compensation — Stock Compensation” (“FASB ASC 718”) in 2006 and recognized $3.3 million, $2.2 million, $21.0 million and $6.4 million of stock-based compensation charges during the years ended December 31, 2009, 2008, 2007 and 2006, respectively. See Note 1(k) and Note 14 of “Notes to Consolidated Financial Statements” included in Item 8 of this Form 10-K. | |
| (2) | During 2005, the Company recognized impairment charges related to goodwill and intangible assets. See Note 1(f) and Note 7 of “Notes to Consolidated Financial Statements” included in Item 8 of this Form 10-K. | |
| (3) | In July 2009, the Company acquired the business and certain assets of First Audit Partners LLP. The excess of the fair value of assets acquired over the purchase price resulted in a gain on bargain purchase. See Note 17 of “Notes to Consolidated Financial Statements” included in Item 8 of this Form 10-K. | |
| (4) | Low effective tax rates in 2009 and 2008 are primarily attributable to reductions in the deferred tax asset valuation allowance. Low effective tax rates in 2007, 2006 and 2005 are primarily attributable to the non-recognition of loss carry-forward benefits. See Note (h) and Note 10 of “Notes to Consolidated Financial Statements” included in Item 8 of this Form 10-K. |
23
Table of Contents
ITEM 7. Management’s Discussion and Analysis of Financial Condition and Results of Operations
Introduction
The Company conducts its operations through three reportable operating segments: Recovery
Audit Services — Americas, Recovery Audit Services — Europe/Asia-Pacific and New Services. The
Recovery Audit Services Americas segment represents recovery audit services (other than healthcare
recovery audit services) provided in the U.S., Canada and Latin America. The Recovery Audit
Services — Europe/Asia-Pacific segment represents recovery audit services (other than healthcare
recovery audit services) provided in Europe, Asia and the Pacific region. The New Services segment
represents services to healthcare organizations including recovery audit services, business
analytics and advisory services. The Company includes the unallocated portion of corporate selling,
general and administrative expenses not specifically attributable to the Recovery Audit Services
and New Services segments in a segment referred to as corporate support. The Company revised its
reportable segments during the fourth quarter of 2009 to reflect the current management and
operational structure. Prior to 2009, the Company reported its results under two operating segments
— Domestic Accounts Payable Services and International Accounts Payable Services. The presentation
of prior years’ financial information in this Form 10-K has been restated to conform to the current
presentation. See Note 5 of “Notes to Consolidated Financial Statements” included in Item 8 of this
Form 10-K for operating segment disclosures.
The Company’s revenues are based on specific contracts with its clients. Such contracts for
recovery audit services generally specify: (a) time periods covered by the audit; (b) the nature
and extent of services to be provided by the Company; (c) the client’s duties in assisting and
cooperating with the Company; and (d) fees payable to the Company, generally expressed as a
specified percentage of the amounts recovered by the client resulting from overpayment claims
identified. Clients generally recover claims by either taking credits against outstanding payables
or future purchases from the involved vendors, or receiving refund checks directly from those
vendors. The manner in which a claim is recovered by a client is often dictated by industry
practice. In addition, many clients establish client-specific procedural guidelines that the
Company must satisfy prior to submitting claims for client approval. For some services provided by
the Company, such as advisory services, client contracts provide for compensation to the Company in
the form of a flat fee, a fee per hour, or a fee per other unit of service.
The vast majority of the Company’s recovery audit clients are in the retail industry segment,
which the Company believes has been significantly impacted by the recent global economic downturn.
The decrease in consumer spending associated with the economic downturn has resulted in many of the
Company’s clients reducing their purchases from vendors, which makes it more difficult for those
clients to offset recovery claims that the Company discovers against current vendor invoices. In
addition, many client vendors are experiencing their own financial issues, and the liquidity of
these vendors can also negatively impact the claims recovery process. Because the vast majority
of the Company’s current business is based on such recoveries, these factors may negatively impact
the Company’s revenues in future periods. Client bankruptcy or insolvency proceedings could also
adversely impact the Company’s future revenues.
Despite the impact of the recent economic downturn on consumer spending and retailers’
purchases from their vendors, the effect on the Company’s financial results has generally been
delayed, as the Company did not begin to experience any material negative effects from the downturn
until the first half of 2009. One factor insulating the Company somewhat from an economic downturn
is that the Company’s clients are frequently more motivated to use the Company’s services to
recover prior overpayments to make up for relatively weaker financial performance in their own
business operations. Also, the client purchase data on which the Company performs its recovery
audit services is historical data, the age of which varies from client to client; however, such
data typically reflects transactions between the Company’s clients and their vendors that generally
took place 3 to 15 months prior to the data being provided to the Company for audit. The fact that
the Company’s audits typically lag current client spending by up to 15 months has also delayed
somewhat the corresponding adverse impact of the recent economic downturn on the Company’s
revenues.
Given that the data on which the Company performs its recovery audit services is typically 3
to 15 months removed from the actual dates of transactions between the Company’s clients and their
vendors, the Company expects that it will not begin to recognize increased revenues from recovery
auditing in the retail industry as a result of improving economic conditions until well after the
positive effects of such improved conditions have been realized by its clients. While the net
impact of the recent economic downturn on the Company’s recovery audit revenues is difficult to
precisely determine or predict, the Company believes that its revenues will remain at a level that
will not have a significant adverse impact on the Company’s liquidity, and management has taken
steps to
24
Table of Contents
mitigate any adverse impact of the economic downturn on the Company’s revenues and overall
financial health. These steps include limiting salary increases for Company employees and devoting
substantial efforts in the development of a lower “cost-to-serve” service model to enable the
Company to more cost effectively serve commercial clients in an effort to reduce the Company’s
dependency on customers in the retail industry. Further, management is working diligently to
expand the Company’s business beyond its core recovery audit services to retailers, such as the
Company’s efforts to expand its business analytics and advisory services businesses as discussed
above under “Business” included in Item 1 of this Form 10-K.
Another area in which the Company continues to devote considerable effort to expand its
business beyond its core accounts payable retail recovery auditing is the Company’s work in the
healthcare industry. The Company’s results in 2006 and 2007, and to a significantly lesser extent
in 2008, were affected by its involvement in the demonstration recovery audit contractor (“RAC”)
program of the Centers for Medicare and Medicaid Services (“CMS”), the federal agency that
administers the Medicare program. The demonstration RAC program was designed by CMS to recover
Medicare overpayments and identify Medicare underpayments through the use of recovery auditing.
CMS awarded the Company a contract to audit Medicare spending in the State of California in 2005 as
part of the RAC demonstration program. As a result of the expiration of the Company’s RAC
demonstration program contract in March 2008, revenues from the auditing of Medicare payments in
California made only a small contribution to the Company’s overall revenues for the year ended
December 31, 2008. There will be no additional revenues to the Company or repayments to CMS
relating to the RAC demonstration program.
In late 2006, legislation was enacted that mandated that recovery auditing of Medicare be
extended beyond the March 2008 end of the RAC demonstration program and that CMS enter into
additional contracts with recovery audit contractors to expand recovery auditing of Medicare
spending to all 50 states by January 1, 2010. On February 9, 2009, the Company announced that it
had entered into subcontracts with three of the four national RAC program contract awardees. While
the magnitude and exact timing of revenues from the Company’s participation as a RAC subcontractor
is difficult to predict, management currently does not expect to receive any meaningful revenues
from its Medicare auditing work until the second half of 2010. In preparation for its work as a RAC
subcontractor, the Company has incurred costs primarily relating to staffing and upgrading its
technology systems. The Company incurred an operating loss of $4.0 million during the year ended
December 31, 2009 related this effort.
CMS is responsible for implementation of the overall national RAC program, and the Company’s
future revenues from its RAC program subcontracts are heavily dependent on CMS’s implementation
schedule and priorities, both of which are beyond the Company’s control. The national RAC program
is still in the early stages of implementation and has experienced delays that make it very
difficult to predict the timing of the Company’s revenues from this program.
25
Table of Contents
Results of Operations
The following table sets forth the percentage of revenues represented by certain items in the
Company’s Consolidated Statements of Operations for the periods indicated:
| Years Ended December 31, | ||||||||||||
| 2009 | 2008 | 2007 | ||||||||||
Statements of Operations Data: |
||||||||||||
Revenues |
100.0 | % | 100.0 | % | 100.0 | % | ||||||
Cost of revenues |
65.0 | 64.3 | 62.0 | |||||||||
Gross margin |
35.0 | 35.7 | 38.0 | |||||||||
Selling, general and administrative expenses |
24.4 | 22.5 | 29.5 | |||||||||
Operational restructuring expenses |
— | — | 0.7 | |||||||||
Operating income |
10.6 | 13.2 | 7.8 | |||||||||
Gain on bargain purchase, net |
1.3 | — | — | |||||||||
Interest expense, net |
1.7 | 1.7 | 6.1 | |||||||||
Loss on debt extinguishment and financial restructuring |
— | — | 4.1 | |||||||||
Earnings (loss) from continuing operations before
income taxes and discontinued operations |
10.2 | 11.5 | (2.4 | ) | ||||||||
Income tax expense |
1.7 | 1.8 | 0.7 | |||||||||
Earnings (loss) from continuing operations before
discontinued operations |
8.5 | 9.7 | (3.1 | ) | ||||||||
Discontinued operations: |
||||||||||||
Earnings from discontinued operations, net of
income taxes |
— | — | 8.9 | |||||||||
Net earnings |
8.5 | % | 9.7 | % | 5.8 | % | ||||||
Recovery Audit and New Services
Revenues. Recovery Audit and New Services revenues for the years ended December 31, 2009, 2008
and 2007 were as follows (in millions):
| 2009 | 2008 | 2007 | ||||||||||
Recovery Audit Services — Americas |
$ | 121.6 | $ | 138.2 | $ | 143.6 | ||||||
Recovery Audit Services — Europe/Asia-Pacific |
52.5 | 53.6 | 59.1 | |||||||||
New Services |
5.5 | 3.9 | 24.7 | |||||||||
Total |
$ | 179.6 | $ | 195.7 | $ | 227.4 | ||||||
Total revenues for the year ended December 31, 2009 decreased by $16.1 million, or 8.2%,
compared to the year ended December 31, 2008. Total revenues for the year ended December 31, 2008
decreased by $31.7 million, or 13.9%, compared to the year ended December 31, 2007.
Recovery Audit Services — Americas revenues decreased by $16.6 million, or 12.0%, in 2009
compared to 2008. Reported revenues were adversely impacted by the strengthening of the U.S. dollar
relative to foreign currencies in Canada and Latin America. On a constant dollar basis, adjusted
for changes in foreign exchange (“FX”) rates, Recovery Audit Services — Americas revenues
decreased by 10.4% during 2009 as compared to 2008. Since the vast majority of the Company’s
recovery audit clients are in the retail industry segment, the Company’s operations are subject to
the economic pressures the retail industry faces. The recent unfavorable economic conditions which
have adversely impacted the U.S. retail industry have negatively impacted the Company’s revenues.
The liquidity of the Company’s clients’ vendors can negatively impact claim production, the claim
approval process and the ability of the Company’s clients to offset or otherwise obtain recoveries
from their vendors. Management believes that the year over year decreases in Recovery Audit
Services — Americas revenues for the year ended December 31, 2009 are also related to several
additional factors, including competitive rate pressures, fewer clients served, the impact of the
Company’s clients developing and strengthening their own internal audit capabilities as a
substitute for the
26
Table of Contents
Company’s services and the impact of improved client processes and fewer recurring transaction
errors. However, the impact of improved client processes and fewer recurring transaction errors is
offset somewhat by the Company’s use of best practices and innovation to identify additional audit
claim categories and recovery opportunities. Future revenues could be adversely impacted by an
increase in retailer bankruptcies resulting from the recent economic downturn. For the year ended
December 31, 2008, revenues decreased by $5.4 million or 3.8% compared to 2007. The revenues in
2008 were adversely impacted by a strengthening of the U.S. dollar relative to foreign currencies,
particularly in the fourth quarter of 2008. On a constant dollar basis, adjusted for FX rates,
Recovery Audit Services — Americas revenues decreased by 3.7% during 2008 compared to 2007. This
decrease was primarily attributable to declines in the U.S. revenues due to continued competitive
rate pressures, fewer clients served, fewer claims being processed as a result of improved client
processes and the impact of the Company’s clients developing and strengthening their own internal
audit capabilities as a substitute for the Company’s services.
Revenues in the Recovery Audit Services — Europe/Asia-Pacific segment for the year ended
December 31, 2009 decreased by $1.1 million, or 2.1%, compared to the year ended December 31, 2008.
Reported revenues were adversely impacted by the strengthening of the U.S. dollar relative to
foreign currencies in Europe, Asia and Australia. On a constant dollar basis, adjusted for changes
in FX rates, Recovery Audit Services — Europe/Asia-Pacific revenues increased by 8.5% during 2009
as compared to 2008. These increases are principally attributable to revenues from the acquisition
of First Audit Partners LLP (“FAP”) in July 2009. Revenues in the Recovery Audit Services —
Europe/Asia-Pacific segment for 2008 decreased by $5.5 million, or 9.3% compared to 2007. The
reported revenues were adversely impacted by a strengthening of the U.S. dollar relative to foreign
currencies, primarily currencies in Europe, particularly in the fourth quarter of 2008. On a
constant dollar basis adjusted for FX rates, Recovery Audit Services — Europe/Asia-Pacific
revenues decreased by 7.1% during 2008 compared to 2007. The 2008 decline in Recovery Audit
Services — Europe/Asia-Pacific revenues (on a FX adjusted basis) was primarily attributable to
decreased revenues in Europe which had continued to decline at a rate consistent with the previous
several years.
Management believes there is opportunity to increase revenues in its core recovery audit
services segments as a result of both market share growth and the growth of the addressable market
for such services. Management also believes that the Company has growth opportunities related to
the provision of adjacent services in the procure-to-pay value chain and to the CFO suite of its
core client base, and from capitalizing on the Company’s existing data mining and related
competencies. The pursuit of these opportunities will require investments and management believes
that without such investments, a reversal of the Company’s overall declining revenue trend is not
likely. Management intends to execute its strategic initiatives to pursue these opportunities. No
assurances can be provided, however, as to when any revenues from these opportunities will be
recognized or the magnitude of any such revenues.
New Services revenues for the year ended December 31, 2009 increased by $1.6 million, or
41.0%, compared to the year ended December 31, 2008 but decreased by $20.8 million, or 84%, for
2008 compared to 2007. The 2009 and 2008 New Services revenues primarily consist of advisory
services revenues while the 2007 New Services revenues relate almost entirely to the CMS RAC
demonstration program. Management expects New Services revenues to significantly increase in 2010
due to increases in advisory services revenues and revenues from entry into analytics services. The
Company also expects future revenues from its participation as a subcontractor in three of the
Medicare RAC program’s four geographic regions. While the magnitude and timing of such revenues is
difficult to predict, management currently does not expect to receive any meaningful revenues from
Medicare auditing until the second half of 2010.
Cost of Revenues (“COR”). COR consists principally of commissions and other forms of variable
compensation paid or payable to the Company’s auditors based primarily upon the level of
overpayment recoveries and/or profit margins derived therefrom, fixed auditor salaries,
compensation paid to various types of hourly support staff, and salaried operational and client
service managers for the Company’s recovery audit, business analytics and advisory services
businesses. Also included in COR are other direct and indirect costs incurred by these personnel,
including office rent, travel and entertainment, telephone, utilities, maintenance and supplies,
clerical assistance, and depreciation. A significant portion of the components comprising COR is
variable and will increase or decrease with increases and decreases in revenues.
COR for the years ended December 31, 2009, 2008 and 2007 was as follows (in millions):
27
Table of Contents
| 2009 | 2008 | 2007 | ||||||||||
Recovery Audit Services — Americas |
$ | 68.0 | $ | 76.3 | $ | 84.7 | ||||||
Recovery Audit Services — Europe/Asia-Pacific |
40.3 | 41.3 | 47.7 | |||||||||
New Services |
8.4 | 8.3 | 8.5 | |||||||||
Total |
$ | 116.7 | $ | 125.9 | $ | 140.9 | ||||||
COR as a percentage of revenues for Recovery Audit Services — Americas was 55.9%, 55.2% and
59.0% for the years ended December 31, 2009, 2008 and 2007, respectively. This equates to gross
margin percentages of 44.1%, 44.8% and 41.0%, respectively, for the Recovery Audit Services —
Americas segment.
For Recovery Audit Services — Americas, the slight increase in COR as a percentage of
revenues for 2009 as compared to 2008 was primarily attributed to COR not declining at the same
rate the corresponding revenues declined. The dollar and percentage of revenue improvement in
Recovery Audit Services — Americas COR for 2008 compared to 2007 was attributable to reductions in
indirect costs (principally reduced headcount) and severance charges included in 2007 related to
the execution of the Company’s optimization strategy to exit smaller less profitable clients.
COR as a percentage of revenues for Recovery Audit Services — Europe/Asia-Pacific was 76.8%,
77.1% and 80.7% for the years ended December 31, 2009, 2008 and 2007, respectively. This equates to
gross margin percentages of 23.2%, 22.9% and 19.3%, respectively.
The slight dollar and percentage of revenues improvement for Recovery Audit Services —
Europe/Asia-Pacific COR in 2009 primarily resulted from decreased commissions paid to third parties
in Europe. The Company closed offices in many countries during 2007, resulting in improved gross
margins in 2008 compared to 2007.
The higher COR as a percentage of revenues for Recovery Audit Services — Europe/Asia-Pacific
(76.8% for 2009) compared to Recovery Audit Services — Americas (55.9% for 2009) is primarily due
to differences in service delivery models, scale and geographic fragmentation. The Recovery Audit
Services — Europe/Asia-Pacific segment generally serves fewer clients in each geographic market
and generates lower revenues per client than those served by the Company’s Recovery Audit Services
— Americas segment.
New Services COR in 2009 and 2008 relates entirely to costs of advisory services and the
Company’s preparation for performance of the CMS RAC program subcontracts. The excess of New
Services COR over revenues represents a portion of the Company’s investment in the New Services
segment. Management expects such investment (COR exceeding revenues) to continue in 2010. New
Services COR in 2007 relates primarily to performance in the RAC demonstration program which ended
in March 2008.
Selling, General and Administrative Expenses (“SG&A”). SG&A expenses of the Recovery Audit
and New Services segments include the expenses of sales and marketing activities, information
technology services and allocated corporate data center costs, human resources, legal, accounting,
administration, foreign currency transaction gains and losses, gains and losses on assets
disposals, depreciation of property and equipment and amortization of intangibles related to the
Recovery Audit and New Services segments.
Recovery Audit and New Services SG&A for the years ended December 31, 2009, 2008 and 2007 were
as follows (in millions):
| 2009 | 2008 | 2007 | ||||||||||
Recovery Audit Services — Americas |
$ | 17.6 | $ | 16.7 | $ | 20.1 | ||||||
Recovery Audit Services — Europe/Asia-Pacific |
5.3 | 8.4 | 6.4 | |||||||||
New Services |
1.2 | 1.9 | 2.4 | |||||||||
Total |
$ | 24.1 | $ | 27.0 | $ | 28.9 | ||||||
Recovery Audit Services — Americas SG&A includes foreign currency transaction gains and
losses, including the gains and losses related to intercompany balances. Gains and losses result
from the re-translation of the foreign subsidiaries’ balances payable to the U.S. parent from their
local currency to their U.S. dollar equivalent. Substantial changes from period to period in FX
rates may significantly impact the amount of such gains and losses. During the years ended December
31, 2009, 2008 and 2007, Recovery Audit Services — Americas SG&A recognized $0.4 million, $0.2
million and $0.1 million, respectively, of FX gains related to intercompany balances.
28
Table of Contents
Recovery Audit Services — Americas SG&A excluding the FX gains related to intercompany
balances, increased 6.5% for the year ended December 31, 2009 compared to 2008. Recovery Audit
Services — Americas SG&A, excluding the FX gains related to intercompany balances for the year
ended December 31, 2008, decreased by 16.3%, compared to 2007. The increase in 2009 Recovery Audit
Services — Americas SG&A, excluding the intercompany FX gains, was primarily a result of costs
incurred in connection with the Company’s execution of its new strategic initiatives. The decrease
in 2008 Recovery Audit Services — Americas SG&A, excluding the intercompany FX gains, as compared
to 2007 resulted primarily from headcount reductions and reductions in facilities costs.
Recovery Audit Services — Europe/Asia-Pacific SG&A includes foreign currency transaction
gains and losses, including the gains and losses related to intercompany balances. During the years
ended December 31, 2009, 2008 and 2007, Recovery Audit Services — Europe/Asia-Pacific SG&A
recognized $1.2 million, $(3.5 million) and $1.1 million, respectively, of FX gains (losses)
related to intercompany balances.
Recovery Audit Services — Europe/Asia-Pacific SG&A, excluding the FX gains (losses) related
to intercompany balances increased 32.7% for the year ended December 31, 2009 compared to 2008.
Recovery Audit Services — Europe/Asia-Pacific SG&A, excluding the FX gains (losses) related to
intercompany balances, decreased 34.7% for the year ended December 31, 2008 compared to 2007. The
increase in 2009 Recovery Audit Services — Europe/Asia-Pacific SG&A, excluding the intercompany FX
gains (losses), was attributable to non-intercompany FX losses, severance costs and amortization
expense associated with the acquisition of the business and certain assets of FAP, which was
completed in July 2009 (see Note 17 — Business
Acquisition in “Notes to Consolidated Financial Statements” in Part II, Item 8 of this Form 10-K). The decrease in 2008 Recovery Audit Services —
Europe/Asia-Pacific SG&A, excluding the intercompany FX gains (losses), as compared to 2007
resulted primarily from headcount reductions and the closing or consolidation of offices in
numerous countries.
New Services SG&A for the year ended December 31, 2009 decreased by $0.7 million, or 36.8%,
compared to 2008. New Services SG&A for the year ended December 31, 2008 decreased by $0.5
million, or 20.8%, compared to 2007. The decreases in 2009 and 2008 are primarily attributable to
decreased use of professional services.
Corporate Support
Corporate Support SG&A represents the unallocated portion of SG&A expenses which are not
specifically attributable to Recovery Audit Services — Americas, Recovery Audit Services —
Europe/Asia-Pacific or New Services and include the expenses of information technology services,
the corporate data center, human resources, legal, accounting, treasury, administration and
stock-based compensation charges.
Corporate Support SG&A totaled the following for the years ended December 31, 2009, 2008 and
2007 (in millions):
| 2009 | 2008 | 2007 | ||||||||||
Selling, general and administrative expenses |
$ | 19.8 | $ | 17.0 | $ | 38.2 | ||||||
Corporate Support SG&A for the years ended December 31, 2009, 2008 and 2007 includes
stock-based compensation charges of $3.3 million, $2.2 million and $21.0 million, respectively. The
disproportionate 2007 charge for stock-based compensation resulted primarily from the issuance of
additional performance units in accordance with the anti-dilution provisions of the 2006 Management
Incentive Plan (“2006 MIP”) that was negotiated as part of the Company’s financial restructuring
completed in March 2006. See “2006 Management Incentive Plan” below for further details regarding
the Company’s 2006 MIP.
Corporate Support SG&A, excluding stock-based compensation charges,
increased 11.5% for the
year ended December 31, 2009 compared to the year ended December 31, 2008. Corporate Support SG&A,
excluding stock-based compensation charges, decreased 14.0% for the year ended December 31, 2008
compared to the year ended December 31, 2007. The increase in these costs for 2009 compared to 2008
is attributable to a $0.7 million additional accrual for the settlement of the Fleming Post
Confirmation Trust litigation (see Note 13 — Commitments and Contingencies in “Notes to Consolidated Financial Statements” in Part II, Item 8 of this Form 10-K), severance charges, and
increased compensation and recruiting costs associated with hiring a new chief executive officer.
The decrease in these costs for 2008 compared to 2007 resulted from reductions in payroll and
related taxes and benefits,
occupancy costs, insurance, professional fees and other miscellaneous expenses.
29
Table of Contents
Interest Expense and Income
Net interest expense for the years ended December 31, 2009, 2008 and 2007 amounted to $3.0
million, $3.2 million and $13.8 million, respectively. The reductions in net interest expense are
directly attributable to the Company’s reductions in debt obligations over the past few years. See
“Liquidity and Capital Resources - Financing Activities and Interest Expense” below for additional
information related to the Company’s interest expense and income.
Loss on Debt Extinguishment
In 2007, the company recorded a $9.4 million charge as a result of debt extinguishments. See
“Liquidity and Capital Resources - 2007 Financial Restructuring” below for additional information
related to the Company’s debt extinguishments.
Income Tax Expense
The Company’s reported effective tax rates on earnings (loss) from continuing operations
before income taxes and discontinued operations approximated 16.5%, 15.5%, and (30.6)% for the
years ended December 31, 2009, 2008 and 2007, respectively. The 2009 and 2008 effective tax rates
are less than the expected tax rate primarily due to a reduction in the Company’s deferred tax
asset valuation allowance. The reflection of tax expense in 2007 in spite of reported losses from
continuing operations primarily results from taxes on foreign income and the non-recognition of tax
benefits on operating loss carry-forwards through the use of a valuation allowance against deferred
tax assets.
For the years ended December 31, 2009, 2008 and 2007, management determined that based on all
available evidence, deferred tax asset valuation allowances of $58.3 million, $64.3 million and
$79.8 million, respectively, were appropriate as of those dates. The reduction of the allowance
during 2008 was partially attributable to a reduction of previously recognized foreign operating
loss carry-forwards related to goodwill deductions taken in the United Kingdom (“UK”). During 2008,
the Company acceded to a position taken by the taxing authorities in the UK regarding the denial of
certain goodwill deductions taken on UK tax returns for 2003 through 2005. As a result, foreign net
operating loss carry-forwards were reduced by approximately $17.0 million based on December 31,
2008 FX rates. Accordingly, deferred tax assets of $5.1 million were written off. This reduction
in the Company’s deferred tax assets was offset by a corresponding reduction in the previously
established valuation allowance against these assets.
Additional $5.3 million and $5.7 million reductions in the December 31, 2009 and 2008,
respectively, valuation allowance resulted from like reductions in deferred tax assets related to
intangible asset amortization deductions for tax purposes related to intangible assets that have
been previously written off for financial reporting purposes.
On March 17, 2006, the Company experienced an ownership change as defined under Section 382 of
the Internal Revenue Code (“IRC”). This ownership change resulted in an annual IRC Section 382
limitation that mathematically limits the use of certain tax attribute carry-forwards. Of the $47.4
million of U.S. federal loss carry-forwards available to the Company, $21.9 million of the loss
carry-forwards are subject to an annual usage limitation of $1.4 million. As of December 31, 2009,
the Company had approximately $47.4 million of U.S. federal loss carry-forwards available to reduce
future taxable income. The loss carry-forwards expire through 2029.
FASB ASC 740 prescribes a “more-likely-than-not” recognition threshold and measurement
attribute for the financial statement recognition and measurement of a tax position taken or
expected to be taken in a tax return. FASB ASC 740 also offers guidance on derecognition,
classification, interest and penalties, accounting in interim periods, disclosure, and transition.
In accordance with FASB ASC 740, the Company’s policy for recording interest and penalties
associated with tax positions is to record such items as a component of income before taxes. As a
result of the 2007 implementation of FASB ASC 740, the Company recognized a $0.3 million increase
in liability for unrecognized tax benefits, which was accounted for as an increase to the January
1, 2007 accumulated deficit balance.
30
Table of Contents
Discontinued Operations
On May 30, 2007, the Company sold its Meridian VAT reclaim business (“Meridian”) to Averio
Holdings Limited, a Dublin, Ireland based company affiliated with management of Meridian. The
Company received proceeds from the sale of approximately $22.4 million at closing and an additional
$2.2 million on December 31, 2007. Meridian had previously been reported as a separate reportable
operating segment. Meridian’s operating results for 2007 up until the sale date presented in the
consolidated financial statements have been reclassified and are included in discontinued
operations. The Company recognized a gain on sale during the year ended December 31, 2007 of
approximately $19.9 million as a result of the transaction.
Operating income of the discontinued operations for the year ended December 31, 2007 amounted
to $0.8 million. Income tax expense of $0.4 million was allocated to earnings from discontinued
operations in 2007.
31
Table of Contents
Liquidity and Capital Resources
As of December 31, 2009, the Company had $33.0 million in cash and cash equivalents and no
borrowings under the revolver portion of its former credit facility. The revolver had approximately
$14.3 million of calculated availability for borrowings.
While management believes that the recent global economic downturn has contributed to a
decrease in the revenues that the Company would have otherwise earned in recent periods, this
decrease has not resulted in the need for the Company to draw down on its revolving credit facility
to fund its operations and has not materially adversely impacted the Company’s overall liquidity
position. In addition, the Company was in compliance with the covenants in its credit facility as
of December 31, 2009 and expects to continue to be in compliance with its new credit facility (see
“New Credit Facility” below) for the foreseeable future.
Operating Activities. Net cash provided by operating activities was $18.2 million, $16.7
million and $30.3 million during the years ended December 31, 2009, 2008 and 2007, respectively.
The $1.5 million increase in cash provided by operating activities in 2009 compared to 2008 was due
to a $6.5 million improvement in the change in operating assets and liabilities from the beginning
to the end of the relevant periods, partially offset by lower operating profit. The $6.5 million
improvement in the change in operating assets and liabilities in 2009 compared to 2008 was the
result of significant payments for long term compensation and severance liabilities in 2008
combined with a significant decrease in the refund liability in 2008 compared to the decrease in
2009. These improvements in cash flow in 2009 were partially offset by significant payments for
foreign income taxes, the PCT legal settlement, and other accrued liabilities made during the year
ended December 31, 2009. Such changes are itemized in the Company’s Consolidated Statements of Cash
Flows included in Part II, Item 8 of this Form 10-K.
The $13.6 million decline in cash provided by operating activities in 2008 compared to 2007
was primarily due to lower operating profit in 2008 (after taking into consideration the non-cash
impacts of stock-based compensation) combined with a $7.4 million additional use of cash related to
changes in operating assets and liabilities in 2008 compared to 2007. The difference in the year to
year changes in operating assets and liabilities included a significant decrease in the refund
liability in 2008 compared to 2007 and significant reductions in noncurrent compensation
obligations and other long-term liabilities during 2008, including a $2.0 million cash distribution
under the 2006 MIP.
In addition to capital expenditures, the Company incurred an operating loss of approximately
$4.0 million for the year ended December 31, 2009 related to the CMS RAC program. The Company
expects a similar loss in 2010.
For the years ended December 31, 2009 and 2008, the Company had one customer, Wal-Mart Stores
Inc., that exceeded 10% of the Company’s total revenues. The loss of this customer would negatively
impact the Company’s operating cash flows and would potentially have a material adverse impact on
the Company’s liquidity.
Investing Activities and Depreciation and Amortization Expense. Depreciation and amortization
expense for the years ended December 31, 2009, 2008 and 2007 amounted to $6.1 million, $5.2 million
and $6.8 million, respectively. Net cash used for property and equipment capital expenditures was
$5.5 million $3.3 million and $4.0 million during the years ended December 31, 2009, 2008 and 2007,
respectively. Purchases of property, plant and equipment during 2009, 2008 and 2007 primarily
related to investments to upgrade the Company’s information technology infrastructure and to
prepare for participation in the CMS RAC program.
Capital expenditures are discretionary and management currently expects future capital
expenditures to increase over the next several quarters as the Company continues to enhance its
healthcare audit systems supporting its performance in the CMS RAC program and other healthcare
audits and in preparation and execution of the Company’s strategic initiatives discussed above. The
Company invested $1.0 million, $0.6 million and $1.0 million, in software development and
infrastructure costs related to CMS RAC program in 2009, 2008 and 2007, respectively. Changes in
operating plans and results could cause management to alter its capital expenditure plans.
As discussed more fully in Note 17 — Business Acquisition in “Notes to
Consolidated Financial Statements” in Part II, Item 8 of this Form 10-K, in July 2009, the Company acquired the business
and certain assets of FAP for a purchase price valued at $5.8 million. The purchase price included
an initial cash payment of $1.6 million which was paid in July 2009.
32
Table of Contents
Financing Activities and Interest Expense. Net cash used in financing activities was $5.7
million, $28.0 million and $36.2 million for the years ended December 31, 2009, 2008 and 2007,
respectively. During 2009, the Company made mandatory payments totaling $5.0 million on its then
existing term loan and reduced its capital lease obligations by $0.3 million.
During 2008, the Company reduced the balance of its term loan by $25.9 million. This amount
included $10.9 million of mandatory payments as well as a voluntary prepayment of $15.0 million. In
March 2008, the Company completed an amendment of its credit facility, permitting the $15.0 million
pre-payment without penalty and increasing the borrowing capacity under the revolver portion of its
credit facility by $10 million. The Company also reduced its capital lease obligations by $0.3
million during 2008. In December 2008, the Company repurchased 429,378 shares of its outstanding
common stock for $1.7 million.
New Credit Facility
On January 19, 2010, the Company entered into a four-year revolving credit and term loan
agreement with SunTrust Bank (“SunTrust”). The SunTrust credit facility consists of a $15.0
million committed revolving credit facility and a $15.0 million term loan. The SunTrust credit
facility is guaranteed by the Company and its domestic subsidiaries and secured by substantially
all of the assets of the Company. Amounts eligible for borrowing
under the SunTrust revolver are based on eligible accounts receivable and other factors. Availability under the SunTrust revolver
at January 31, 2010 was $5.7 million.
The principal portion of the SunTrust term loan must be repaid in quarterly installments of
$0.8 million each commencing in March 2010. The loan agreement requires mandatory prepayments with
the net cash proceeds from certain asset sales, equity offerings and insurance proceeds received by
the Company. The loan agreement also requires an additional annual prepayment if excess cash flow
as defined in the agreement exceeds a certain threshold. The first of any such excess cash flow
payments would be payable in April 2011. The remaining balance of the SunTrust term loan is due in
January 2014. As of February 28, 2010, there were no outstanding borrowings under the SunTrust
revolver. Interest on both the revolver and term loan are payable monthly and accrues at an index
rate using the one-month LIBOR rate, plus an applicable margin as determined by the loan agreement.
The applicable interest rate margin varies from 2.25% per annum to 3.5% per annum, dependent on the
Company’s consolidated leverage ratio, and is determined in accordance with a pricing grid under
the SunTrust loan agreement. The Company also must pay a commitment fee of 0.5% per annum, payable
monthly, on the unused portion of the $15.0 million SunTrust revolving credit facility. As of
January 31, 2010 the applicable interest rate under the SunTrust credit facility was 2.48%.
The SunTrust credit facility includes customary affirmative, negative, and financial covenants
binding on the Company, including delivery of financial statements and other reports, maintenance
of existence, and transactions with affiliates. The negative covenants limit the ability of the
Company, among other things, to incur debt, incur liens, make investments, sell assets, repurchase
shares of it capital stock or declare or pay dividends on its capital stock. The financial
covenants included in the SunTrust credit facility, among other things, limit the amount of capital
expenditures the Company can make, set forth maximum leverage and net funded debt ratios for the
Company and a minimum fixed charge coverage ratio, and also require the Company to maintain minimum
consolidated earnings before interest, taxes, depreciation and amortization. In addition, the
SunTrust credit facility includes customary events of default.
The Company used substantially all the funds from the SunTrust term loan to repay in full the
$14.2 million outstanding under the Ableco term loan.
Management believes that the Company will have sufficient borrowing capacity and cash
generated from operations to fund its capital and operational needs for at least the next twelve
months.
Former Credit Facility
In September 2007, the Company entered into an amended and restated financing agreement with
Ableco consisting of a $20 million revolving credit facility and a $45 million term loan which was
funded in October 2007. The principal portion of the $45 million term loan with Ableco required
quarterly principal payments of $1.25 million each commencing in April 2008. The loan agreement
also required an annual additional payment
33
Table of Contents
contingently payable based on an excess cash flow calculation as defined in the agreement.
During 2009, the Company reduced the balance on its term loan by $5.0 million of mandatory
payments. During 2008, the Company reduced the balance on its term loan by $25.9 million. This
reduction included $10.9 million of mandatory payments as well as a voluntary payment of $15.0
million. During the first quarter of 2008, the Company completed an amendment of its amended and
restated financing agreement, permitting the $15.0 million pre-payment without penalty and
increasing the initial borrowing capacity under the revolver portion of its facility by $10
million. Certain components of the borrowing availability calculation were reduced over the term of
the loan and availability was based on eligible accounts receivable and other factors.
Availability under the revolver at December 31, 2009 was $14.3 million. The amended and restated
financing agreement was replaced by a new facility in January 2010. See “New Credit Facility”
above for more information.
The remaining balance of the term loan was due on September 17, 2011. Interest on the term
loan balance was payable monthly and accrued at the Company’s option at either prime plus 2.0% or
at LIBOR plus 4.75%, but under either option may not be less than 9.75%. Interest on outstanding
balances under the revolving credit facility, if any, accrued at the Company’s option at either
prime plus 0.25% or at LIBOR plus 2.25%. The Company also paid a commitment fee of 0.5% per annum,
payable monthly, on the unused portion of the revolving credit facility. As of December 31, 2009,
there were no outstanding borrowings under the revolving credit facility. The balance on the term
loan as of December 31, 2009 was $14.0 million. The weighted-average interest rates on term loan
balances outstanding under the credit facility during 2009 and 2008, including fees, were 11.0% and
10.9%, respectively.
Since the credit facility was replaced in January 2010, the annual additional contingent
payment based on 2009 excess cash flow due in April 2010 will not be required.
The credit facility was guaranteed by each of the Company’s direct and indirect domestic
wholly owned subsidiaries and certain of its foreign subsidiaries and was secured by substantially
all of the Company’s assets (including the stock of the Company’s domestic subsidiaries and
two-thirds of the stock of certain of the Company’s foreign subsidiaries). The credit facility
would have matured on September 17, 2011.
The credit facility included customary affirmative, negative, and financial covenants binding
on the Company, including delivery of financial statements and other reports, maintenance of
existence, and transactions with affiliates. The negative covenants limited the ability of the
Company to, among other things, incur debt, incur liens, sell assets, repurchase shares of its
capital stock or declare or pay dividends on its capital stock. The financial covenants included in
the credit facility, among other things, limited the amount of capital expenditures the Company
could make, set forth a maximum leverage ratio for the Company and a minimum fixed charge coverage
ratio, and also required the Company to maintain minimum consolidated earnings before interest,
taxes, depreciation and amortization.
2007 Financial Restructuring
During the fall of 2007, the Company undertook a financial restructuring designed to
de-leverage the Company’s balance sheet and provide it with more financial flexibility. The 2007
restructuring included amending and restating the Company’s credit facility and redeeming the
Company’s 11% senior notes, 10% senior convertible notes and 9% Series A convertible preferred
stock. The Company’s credit facility with Ableco LLC (“Ableco”) was amended and restated to
provide the Company with a $20 million revolving credit facility and a $45 million term loan, which
was funded in October 2007.
As part of the redemption of its 11% senior notes and its 10% senior convertible notes, the
Company solicited consents from the holders of its 11% senior notes and its 10% senior convertible
notes to amend the indentures governing the notes to provide for simultaneous redemption of both
series and to shorten the redemption period for the notes. The Company paid an aggregate of $0.2
million in consent fees and conversion fees to certain holders in connection with their prior
agreements to consent to the amendment to the indenture governing the 11% senior notes and to
convert, upon the call for redemption, the 10% senior convertible notes and 9% Series A convertible
preferred stock held by such holders. As expected, over 99% of the outstanding 10% senior
convertible notes and shares of 9% Series A convertible preferred stock were converted by the
holders into shares of the Company’s common stock prior to the applicable redemption dates. As a
result, only an aggregate of approximately $0.2 million in 10% senior convertible notes and 9%
Series A convertible preferred stock were outstanding and redeemed by the Company. The full $51.5
million in principal amount of the 11% senior notes were redeemed by the Company. The Company was
also required to pay a $1.0 million prepayment fee to the holders of the 11% senior
34
Table of Contents
notes in connection with the redemption. The Company used the term loan portion of its
amended and restated credit facility to supplement the funding of the redemption of the 11% senior
notes, the 10% senior convertible notes and the 9% Series A convertible preferred stock.
The face amount of the 11% senior notes redeemed exceeded their carrying amount net of
unamortized discount and deferred loan costs by $8.4 million. Such amount, along with a $1.0
million prepayment premium, $9.4 million in total, is reported as a loss on debt extinguishment in
the Consolidated Statement of Operations for the year ended December 31, 2007. Unamortized deferred
loan costs of $2.1 million related to the 10% senior convertible notes that were converted to
common stock were charged to additional paid-in capital in 2007. As a consequence of the prepayment
of the $25 million term loan in 2007 and the replacement of the revolving credit facility, the
Company wrote-off $1.7 million of unamortized deferred loan costs in 2007. Such amount is included
in interest expense in the Consolidated Statement of Operations for the year ended December 31,
2007. The Company incurred approximately $3.1 million of costs in connection with the amended and
restated Ableco credit facility. Such amount was capitalized and amortized over the life of the
facility.
The aggregate impact of the transactions described above resulted in interest expense of $3.2
million, $4.1 million and $15.1 million for the years ended December 31, 2009, 2008 and 2007. Cash
paid for interest during the years ended December 31, 2009, 2008 and 2007 amounted to $1.9 million,
$3.2 million and $14.4 million, respectively.
Discontinued Operations
Net cash provided by (used in) the operating activities of discontinued operations was $(2.0
million) during the year ended December 31, 2007. Such cash flows were primarily attributable to
the operations of Meridian prior to its sale in May 2007. The sale of Meridian provided net
proceeds of $23.2 million in 2007. A substantial portion of such proceeds was required to be used
to repay debt under the Company’s credit facility.
Stock Repurchase Program
In February 2008, the Board of Directors of the Company approved a stock repurchase program.
Under the terms of the program, as extended by the Board of Directors, the Company may repurchase
up to $10 million of its common stock from time to time through March 31, 2011. The new credit
facility permits the Company to repurchase up to $1.0 million of its common stock annually. For the
year ended December 31, 2009, the Company repurchased 78,754 shares at an average price of $3.10
for a total purchase price of approximately $0.2 million. This equates to approximately 0.4% of
the then outstanding shares. For the year ended December 31, 2008, the Company repurchased 429,378
shares at an average price of $3.93 for a total purchase price of approximately $1.7 million. This
equates to approximately 2% of the then outstanding shares.
35
Table of Contents
Contractual Obligations and Other Commitments
As discussed in “Notes to Consolidated Financial Statements” included in Item 8 of this Form
10-K, the Company has certain contractual obligations and other commitments. A summary of those
commitments as of December 31, 2009, adjusted to include the terms of the new credit facility and
the Etesius Limited acquisition which occurred subsequent to December 31, 2009, is as follows:
| Payments Due by Period (in thousands) | ||||||||||||||||||||
| Less | More | |||||||||||||||||||
| Than | 3-5 | Than | ||||||||||||||||||
| Contractual obligations | Total | 1 Year | 1-3 Years | Years | 5 Years | |||||||||||||||
Long-term debt obligations (1) |
$ | 15,000 | $ | 3,000 | $ | 9,000 | $ | 3,000 | $ | — | ||||||||||
Operating lease obligations |
32,193 | 6,958 | 19,090 | 5,822 | 323 | |||||||||||||||
Capital lease obligations (2) |
273 | 273 | — | — | — | |||||||||||||||
Cash portions of stock-based compensation (3) |
635 | 424 | 211 | — | — | |||||||||||||||
Purchase price payments to former FAP owners
(4) |
5,733 | 2,701 | 3,032 | — | — | |||||||||||||||
Payments to Messrs. Cook and Toma (5) |
2,256 | 1,182 | 180 | 894 | — | |||||||||||||||
Purchase price payments to Etesius Limited
shareholders (6) |
4,000 | 2,800 | 500 | 700 | — | |||||||||||||||
Severance |
1,126 | 1,126 | — | — | — | |||||||||||||||
Total |
$ | 61,216 | $ | 18,464 | $ | 32,013 | $ | 10,416 | $ | 323 | ||||||||||
| (1) | Represents amounts payable under the Company’s new credit facility effective January 19, 2010; excludes variable rate interest (LIBOR plus 2.25% to 3.50% per annum) payable monthly. | |
| (2) | Includes interest imputed at 11.3% | |
| (3) | Represents the portions of Performance Units outstanding under the 2006 MIP payable in cash. Amounts presented are based on the market price of the Company’s common stock at December 31, 2009. Actual payments are due to be made on April 30 of each year and will be based on the market price of the Company’s common stock at the settlement dates — see 2006 Management Incentive Plan below. | |
| (4) | Represents deferred payments due under the FAP asset purchase agreement — see Acquisitions below. The amounts above include variable consideration which may be due based on cash flows generated by the acquired business over the next four years. The obligations are denominated in British pounds sterling. The U.S. dollar amounts above are based on December 31, 2009 foreign exchange rates. | |
| (5) | In connection with the Company’s 2006 financial restructuring, required payments to Messrs. Cook and Toma were revised — see Executive Severance Payments below. | |
| (6) | Represents deferred payments due under the Etesius Limited share purchase agreement — see Acquisitions below. The above does not include variable consideration which may be due based on the financial performance of certain Company’s service lines over the next four years. Management has not completed its analysis of the variable consideration payable. |
2006 Management Incentive Plan
At the annual meeting of shareholders held on August 11, 2006, the shareholders of the Company
approved a proposal granting authorization to issue up to 2.1 million shares of the Company’s
common stock under the Company’s 2006 Management Incentive Plan (“2006 MIP”). On September 29,
2006, an aggregate of 682,301 Performance Units were awarded under the 2006 MIP to the seven
executive officers of the Company. The awards had an aggregate grant date fair value of $4.0
million. At Performance Unit settlement dates (which vary by participant), participants are paid in
common stock and in cash. Participants will receive a number of shares of Company common stock
equal to 60% of the number of Performance Units being settled, plus a cash payment equal to 40% of
the fair market value of that number of shares of common stock equal to the number of Performance
Units being settled. The awards were 50% vested at the award date and the remainder of the awards
vested ratably over approximately the following eighteen months with the awards fully vesting on
March 17, 2008. On March 28, 2007, an additional executive officer of the Company was granted
20,000 Performance Units under the 2006 MIP. The award had a grant date fair value of $0.3 million
and was scheduled to vest ratably over four years. The awards contain certain anti-dilution and
change of control provisions. Also, the number of Performance Units awarded were automatically
adjusted on a pro-rata basis upon the conversion into common stock of the Company’s senior
convertible notes and Series A convertible preferred stock. During 2007 and 2006, an additional
1,436,484 Performance Units and 122,073 Performance Units, respectively, with aggregate grant date
fair values of $24.0 million and $1.6 million, respectively, were granted as a result of this
automatic adjustment provision.
All Performance Units must be settled before April 30, 2016. The Company recognized
compensation expense (credit) of $(0.2 million), $(0.4 million) and $19.6 million during the years
ended December 31, 2009, 2008 and 2007, respectively, related to these 2006 MIP Performance Unit
awards, including $17.7 million related to the
36
Table of Contents
automatic adjustments for the year ended December 31, 2007. The 2009 and 2008 compensation
credits resulted from the remeasurement of the liability-classified portion of the awards to fair
value. The fair value of these awards is based on the market price of the Company’s common stock.
The amount of compensation expense recognized is based on the assumption that none of the
Performance Unit awards will be forfeited.
During 2009, an aggregate of 1,474,129 Performance Units under the 2006 MIP were settled by
eight current and former executive officers. These settlements resulted in the issuance of 884,473
shares of common stock and cash payments totaling $1.9 million. As of December 31, 2009, a total of
268,988 Performance Units were outstanding and fully vested under the 2006 MIP.
During 2008, an aggregate of 493,137 Performance Units under the 2006 MIP were settled by six
executive officers. These settlements resulted in the issuance of 295,879 shares of common stock
and cash payments totaling $2.0 million.
Acquisitions
In July 2009 the Company acquired the business and certain assets of FAP for a purchase price
valued at $5.8 million. The purchase price included an initial cash payment of $1.6 million and
requires additional deferred payments of $0.8 million paid in January 2010 and a $1.3 million
payment in July 2010. Additional variable consideration may also be due based on the operating
results generated by the acquired business over the next four years. The Company currently
estimates the fair value of variable consideration to be $2.1 million.
In February 2010, the Company acquired all the issued and outstanding capital stock of Etesius
Limited, a privately-held European provider of purchasing and payables technologies and spend
analytics based in Chelmsford, United Kingdom. The purchase price included an initial cash payment
of $2.8 million and additional deferred payments of $1.2 million over four years. Additional
variable consideration of up to $3.8 million may also be payable based on the future performance of
certain segments of the Company’s service lines over the next four years.
Executive Severance Payments
The July 31, 2005 retirements of the Company’s former Chairman, President and CEO, John M.
Cook, and the Company’s former Vice Chairman, John M. Toma, resulted in an obligation to pay
retirement benefits of approximately $7.6 million (present value basis) to be paid in monthly cash
installments principally over a three-year period, beginning February 1, 2006. On March 16, 2006,
the terms of the applicable severance agreements were amended in conjunction with the Company’s
financial restructuring. Pursuant to the terms of the severance agreements, as amended (1) the
Company’s obligations to pay monthly cash installments to Mr. Cook and Mr. Toma were extended from
36 months to 58 months and from 24 months to 46 months, respectively; however, the total dollar
amount of monthly cash payments to be made to each remained unchanged, and (2) the Company agreed
to pay a fixed sum of $150,000 to defray the fees and expenses of the legal counsel and financial
advisors to Messrs. Cook and Toma. The original severance agreements, and the severance agreements,
as amended, also provide for an annual reimbursement, beginning on or about February 1, 2007, to
Mr. Cook and Mr. Toma for the cost of health insurance for themselves and their respective spouses
(not to exceed $25,000 and $20,000, respectively, subject to adjustment based on changes in the
Consumer Price Index), continuing until each reaches the age of 80. At December 31, 2009, the
Company’s accrued payroll and related expenses and noncurrent compensation obligations include $1.2
million and $0.8 million, respectively, related to these obligations.
Off Balance Sheet Arrangements
As of December 31, 2009, the Company did not have any material off-balance sheet arrangements,
as defined in Item 303(a)(4)(ii) of the SEC’s Regulation S-K.
Critical Accounting Policies
The Company’s significant accounting policies are more fully described in Note 1 of “Notes to
Consolidated Financial Statements” included in Item 8 of this Form 10-K. However, certain of the
Company’s accounting policies
37
Table of Contents
are particularly important to the portrayal of its financial position and results of
operations and require the application of significant judgment by management. As a result, they are
subject to an inherent degree of uncertainty. Accounting policies that involve the use of estimates
that meet both of the following criteria are considered by management to be “critical” accounting
policies. First, the accounting estimate requires the Company to make assumptions about matters
that are highly uncertain at the time that the accounting estimate is made. Second, alternative
estimates in the current period, or changes in the estimate that are reasonably likely in future
periods, would have a material impact on the presentation of the Company’s financial condition,
changes in financial condition or results of operations.
In addition to estimates that meet the “critical” estimate criteria, the Company also makes
many other accounting estimates in preparing its consolidated financial statements and related
disclosures. All estimates, whether or not deemed critical, affect reported amounts of assets,
liabilities, revenues and expenses, as well as disclosures of contingent assets and liabilities. On
an on-going basis, management evaluates its estimates and judgments, including those related to
revenue recognition, refund liabilities, accounts receivable allowance for doubtful accounts,
goodwill and other intangible assets and income taxes. Management bases its estimates and judgments
on historical experience, information available prior to the issuance of the consolidated financial
statements and on various other factors that are believed to be reasonable under the circumstances.
This information forms the basis for making judgments about the carrying values of assets and
liabilities that are not readily apparent from other sources. Materially different results can
occur as circumstances change and additional information becomes known, including changes in those
estimates not deemed “critical”.
Management believes the following critical accounting policies, among others, involve its more
significant estimates and judgments used in the preparation of its consolidated financial
statements. The development and selection of accounting estimates, including those deemed
“critical,” and the associated disclosures in this Form 10-K have been discussed with the audit
committee of the Board of Directors.
| • | Revenue Recognition. The Company recognizes revenues on the accrual basis except with respect to certain International units where revenues are recognized on the cash basis in accordance with FASB ASC 605 “Revenue Recognition". Revenues are generally recognized for a contractually specified percentage of amounts recovered when it has been determined that our clients have received economic value (generally through credits taken against existing accounts payable due to the involved vendors or refund checks received from those vendors), and when the following criteria are met: (a) persuasive evidence of an arrangement exists; (b) services have been rendered; (c) the fee billed to the client is fixed or determinable; and (d) collectibility is reasonably assured. Additionally, for purposes of determining appropriate timing of recognition and for internal control purposes, the Company relies on customary business practices and processes for documenting that the criteria described in (a) through (d) above have been met. Such customary business practices and processes may vary significantly by client. On occasion, it is possible that a transaction has met all of the revenue recognition criteria described above but revenues are not recognized, unless management can otherwise determine that criteria (a) through (d) above have been met, because the Company’s customary business practices and processes specific to that client have not been completed. The determination that each of the aforementioned criteria has been met, particularly the determination of the timing of economic benefit received by the client and the determination that collectibility is reasonably assured, requires the application of significant judgment by management and a misapplication of this judgment could result in inappropriate recognition of revenues. | ||
| • | Unbilled Receivables & Refund Liabilities. Unbilled receivables are usually contractual and relate to claims for which our client has received economic value. Unbilled receivables arise when a portion of the Company’s fee is deferred at the time of the initial invoice. At a later date (which can be up to a year after the original invoice, or a year after completion of the audit period), the unbilled receivable amount is invoiced. Notwithstanding the deferred due date, the Company and the client acknowledge that this unbilled receivable has been earned at the time of the original invoice, it just has a deferred due date. | ||
| Refund liabilities result from reductions in the economic value previously received by the Company’s clients with respect to vendor claims identified by the Company and for which the Company has previously recognized revenues. Such refund liabilities are recognized by either offsets to amounts otherwise due from clients or by cash refunds to clients. The Company computes the estimate of its refund liabilities at any given time based on actual historical refund data. |
38
Table of Contents
| Periodic changes in unbilled receivables and refund liabilities are recorded as adjustments to revenues. | |||
| During the first quarter of 2008, management revised its estimate of expected refund rates in its Recovery Audit Services — Americas. Such change in estimate resulted from a decline in actual Recovery Audit Services — Americas refund rates observed during 2007. The impact of this change in estimate resulted in a $0.8 million increase in first quarter 2008 income from continuing operations. During the fourth quarter of 2008, management changed its method of estimating the refund liability related to its Recovery Audit Services — Europe/Asia-Pacific segment to be more consistent with the methodology used in the Recovery Audit Services — Americas. The impact of the change in estimate resulted in a $0.9 million decrease in fourth quarter 2008 income from continuing operations. The combined impact of the 2008 refund liability estimate changes was to decrease income from continuing operations by $0.1 million, or less than $0.01 per basic and diluted share. Management does not expect that these changes in estimate will have a material impact on future period results. | |||
| • | Goodwill and Other Intangible Assets. During each of the fourth quarters of 2009, 2008 and 2007, the Company completed the required annual impairment testing of goodwill and other intangible assets in accordance with FASB ASC 350. As a result of this testing, the Company concluded that there was no impairment of goodwill and other intangible assets. | ||
| During the third quarter of 2007, management re-evaluated its policy related to the amortization of its customer relationships intangible asset. The customer relationships intangible asset had been amortized since its acquisition in 2002 using the straight-line method over a twenty year expected life. Management’s re-evaluation concluded that the original twenty year life continued to be a reasonable expectation. However, because of the expectation that revenues and profits from these customers will likely decline in future years, management concluded that an accelerated method of amortization of the customer relationships intangible asset would be more appropriate. The accelerated method results in amortization of the net unamortized June 30, 2007 balance over the remaining 14.5 year life at a rate that declines at approximately 8% per year. The Company adopted the new method in the third quarter of 2007 and the resulting change in amortization is being accounted for on a prospective basis in accordance with FASB ASC 350. Amortization expense in 2007 increased by $0.5 million as a result of this change in method. | |||
| • | Income Taxes. The Company’s effective tax rate is based on historical and anticipated future taxable income, statutory tax rates and tax planning opportunities available to the Company in the various jurisdictions in which it operates. Significant judgment is required in determining the effective tax rate and in evaluating the Company’s tax positions. Tax regulations require items to be included in the tax returns at different times than the items are reflected in the financial statements. As a result, the Company’s effective tax rate reflected in its Consolidated Financial Statements included in Item 8 of this Form 10-K is different than that reported in its tax returns. Some of these differences are permanent, such as expenses that are not deductible on the Company’s tax returns, and some are temporary differences, such as depreciation expense. Temporary differences create deferred tax assets and liabilities. Deferred tax assets generally represent items that can be used as a tax deduction or credit in the Company’s tax returns in future years for which it has already recorded the tax benefit in the statement of operations. The Company establishes valuation allowances to reduce net deferred tax assets to the amounts that it believes are more likely than not to be realized. These valuation allowances are adjusted in light of changing facts and circumstances. Deferred tax liabilities generally represent tax expense recognized in the Company’s consolidated financial statements for which payment has been deferred, or expense for which a deduction has already been taken on the Company’s tax returns but has not yet been recognized as an expense in its consolidated financial statements. | ||
| FASB ASC 740, “Income Taxes", requires that deferred tax assets be reduced by a valuation allowance if it is more likely than not that some portion or all of a deferred tax asset will not be realized. The ultimate realization of deferred tax assets is dependent upon the generation of future taxable income during the periods in which those temporary differences are deductible. In making this determination, management considers all available positive and negative evidence affecting specific deferred tax assets, including the Company’s past and anticipated future performance, the reversal of deferred tax liabilities, the length of carry-back and carry-forward periods, and the implementation of tax planning strategies. |
39
Table of Contents
| Objective positive evidence is necessary to support a conclusion that a valuation allowance is not needed for all or a portion of deferred tax assets when significant negative evidence exists. Cumulative losses in recent years are the most compelling form of negative evidence considered by management in this determination. | |||
| FASB ASC 740 prescribes a “more-likely-than-not” recognition threshold and measurement attribute for the financial statement recognition and measurement of a tax position taken or expected to be taken in a tax return. The Interpretation also offers guidance on derecognition, classification, interest and penalties, accounting in interim periods, disclosure, and transition. In accordance with FASB ASC 740, the Company’s policy for recording interest and penalties associated with tax positions is to record such items as a component of income before taxes. As a result of the implementation of FASB ASC 740 in 2007, the Company recognized a $0.3 million increase in liability for unrecognized tax benefits, which was accounted for as an increase to the January 1, 2007 accumulated deficit balance. | |||
| • | Stock-Based Compensation. The Company accounts for stock-based compensation in accordance with the requirements of FASB ASC 718, “Share Compensation” (“FASB ASC 718”). FASB ASC 718 requires that companies account for awards of equity instruments issued to employees under the fair value method of accounting and recognize such amounts in their statements of operations. Under FASB ASC 718, the Company is required to measure compensation cost for all stock-based awards at fair value on the date of grant and recognize compensation expense in its consolidated statements of operations over the service period over which the awards are expected to vest. The Company recognizes compensation expense over the indicated vesting periods using the straight-line method. | ||
| The fair value of all time-vested options is estimated as of the date of grant using the Black-Scholes option valuation model. The Black-Scholes option valuation model was developed for use in estimating the fair value of traded options that have no vesting restrictions and are fully transferable. Option valuation models require the input of highly subjective assumptions, including the expected stock price volatility. Because the Company’s employee stock options have characteristics significantly different from those of traded options and because changes in the subjective input assumptions can materially affect the fair value estimate, it is management’s opinion that existing models do not necessarily provide a reliable single measure of the fair value of the Company’s employee stock options. | |||
| The Company estimates the fair value of awards of restricted shares and nonvested shares, as defined in FASB ASC 718, as being equal to the market value of the common stock on the date of the award. Also, under FASB ASC 718, companies must classify their share-based payments as either liability-classified awards or as equity-classified awards. Liability-classified awards are remeasured to fair value at each balance sheet date until the award is settled. Equity-classified awards are measured at grant date fair value and are not subsequently remeasured. The Company has classified its share-based payments which are settled in Company common stock as equity-classified awards and its share-based payments that are settled in cash as liability-classified awards. Compensation costs related to equity-classified awards are generally equal to the fair value of the award at grant-date amortized over the vesting period of the award. The liability for liability-classified awards is generally equal to the fair value of the award as of the balance sheet date times the percentage vested at the time. The change in the liability amount from one balance sheet date to another is charged (or credited) to compensation cost. | |||
| During the years ended December 31, 2009, 2008 and 2007, stock-based compensation charges aggregated $3.3 million, $2.2 million and $21.0 million, respectively. Stock-based compensation is discussed in more detail in Note 1(l) and Note 14 of “Notes to Consolidated Financial Statements” included in Item 8 of this Form 10-K. |
New Accounting Standards
Refer to Note 1 of “Notes to Consolidated Financial Statements” for a discussion of recent
accounting standards and pronouncements.
40
Table of Contents
| ITEM 7A. Quantitative and Qualitative Disclosures About Market Risk | ||
Foreign Currency Market Risk. Our reporting currency is the U.S. dollar although we transact
business in various foreign locations and currencies. As a result, our financial results could be
significantly affected by factors such as changes in foreign currency exchange rates, or weak
economic conditions in the foreign markets in which we provide services. Our operating results are
exposed to changes in exchange rates between the U.S. dollar and the currencies of the other
countries in which we operate. When the U.S. dollar strengthens against other currencies, the value
of foreign functional currency revenues decreases. When the U.S. dollar weakens, the value of the
foreign functional currency revenues increases. Overall, we are a net receiver of currencies other
than the U.S. dollar and, as such, benefit from a weaker dollar. We are therefore adversely
affected by a stronger dollar relative to major currencies worldwide. During the year ended
December 31, 2009, we recognized $16.7 million of operating income from operations located outside
the U.S., virtually all of which was originally accounted for in currencies other than the U.S.
dollar. Upon translation into U.S. dollars, such operating income would increase or decrease,
assuming a hypothetical 10% change in weighted-average foreign currency exchange rates against the
U.S. dollar, by approximately $0.2 million.
Interest Rate Risk. Our interest income and expense are sensitive to changes in the general
level of U.S. interest rates. In this regard, changes in U.S. interest rates affect the interest
earned on our cash equivalents as well as interest paid on our debt. On January 19, 2010, the
Company entered into a four-year revolving credit and term loan agreement with SunTrust. Under the
new credit facility, the Company had $5.7 million of calculated borrowing availability under its
revolving credit facility and $15.0 million outstanding under a term loan as of January 31, 2010.
Interest on both the revolver and term loan are payable monthly and accrued at an index rate using
the one-month LIBOR rate, plus an applicable margin as determined by the loan agreement. The
applicable interest rate margin varies from 2.25% per annum to 3.5% per annum. There are no
borrowings outstanding under the revolving credit facility. However, assuming full utilization of
the revolving credit facility, a hypothetical 100 basis point change in interest rates applicable
to the revolver would result in an approximate $0.1 million change in annual pre-tax income. A
hypothetical 100 basis point change in interest rates applicable to the term loan would result in
an approximate $0.2 million change in annual pre-tax income.
Stock-Based Compensation. The Company estimates the fair value of awards of restricted shares
and nonvested shares, as defined in FASB ASC 505-50, as being equal to the market value of the
common stock. In addition, companies must classify their share-based payments as either
liability-classified awards or as equity-classified awards. Liability-classified awards are
remeasured to fair value at each balance sheet date until the award is settled. The Company has
classified its share-based payments that are settled in cash as liability-classified awards. The
liability for liability-classified awards is generally equal to the fair value of the award as of
the balance sheet date times the percentage vested at the time. The change in the liability amount
from one balance sheet date to another is charged (or credited) to compensation cost. Based on the
number of liability-classified awards outstanding as of December 31, 2009, a hypothetical $1.00
change in the market value of the Company’s common stock would result in a $0.1 million change in
pre-tax income.
41
Table of Contents
| ITEM 8. | Financial Statements and Supplementary Data |
INDEX TO CONSOLIDATED FINANCIAL STATEMENTS
| Page | ||||
| Number | ||||
| 43 | ||||
| 44 | ||||
| 45 | ||||
| 46 | ||||
| 47 | ||||
| 48 | ||||
42
Table of Contents
Report of Independent Registered Public Accounting Firm
Board of Directors and Shareholders
PRGX Global, Inc.
Atlanta, Georgia
PRGX Global, Inc.
Atlanta, Georgia
We have audited the accompanying consolidated balance sheets of PRGX Global, Inc. and subsidiaries
(the Company) as of December 31, 2009 and 2008 and the related consolidated statements of
operations, shareholders’ equity (deficit), and cash flows for each of the three years in the
period ended December 31, 2009. In connection with our audits of the financial statements, we have
also audited the financial statement schedule listed in the accompanying index. These consolidated
financial statements and schedule are the responsibility of the Company’s management. Our
responsibility is to express an opinion on these consolidated financial statements and schedule
based on our audits.
We conducted our audits in accordance with the standards of the Public Company Accounting Oversight
Board (United States). Those standards require that we plan and perform the audit to obtain
reasonable assurance about whether the financial statements are free of material misstatement. The
Company is not required to have, nor were we engaged to perform, an audit of its internal control
over financial reporting. Our audits included consideration of internal control over financial
reporting as a basis for designing audit procedures that are appropriate in the circumstances, but
not for the purpose of expressing an opinion on the effectiveness of the Company’s internal control
over financial reporting. Accordingly, we express no such opinion. An audit also includes
examining, on a test basis, evidence supporting the amounts and disclosures in the financial
statements, assessing the accounting principles used and significant estimates made by management,
as well as evaluating the overall presentation of the financial statements and schedule. We
believe that our audits provide a reasonable basis for our opinion.
In our opinion, the consolidated financial statements referred to above present fairly, in all
material respects, the financial position of PRGX Global, Inc. and subsidiaries at December 31,
2009 and 2008, and the results of its operations and its cash flows for each of the three years in
the period ended December 31, 2009, in conformity with accounting principles generally accepted in
the United States of America.
Also, in our opinion, the financial statement schedule, when considered in relation to the basic
consolidated financial statements taken as a whole, presents fairly, in all material respects, the
information set forth therein.
As discussed in Note 1(h) to the consolidated financial statements, “Income Taxes”, the Company
changed its method for recognizing and measuring tax positions in 2007 due to the adoption of
Financial Accounting Standards Board (FASB) Interpretation No. 48, “Accounting for Uncertainty in
Income Taxes – an Interpretation of FASB Statement No. 109” (included in FASB Accounting Standards
Codification Topic 740).
Atlanta, Georgia
|
/s/ BDO Seidman, LLP |
March 29, 2010
43
Table of Contents
PRGX GLOBAL, INC. AND SUBSIDIARIES
CONSOLIDATED STATEMENTS OF OPERATIONS
(In thousands, except per share data)
(In thousands, except per share data)
| Years Ended December 31, | ||||||||||||
| 2009 | 2008 | 2007 | ||||||||||
Revenues |
$ | 179,583 | $ | 195,706 | $ | 227,369 | ||||||
Cost of revenues |
116,718 | 125,901 | 140,877 | |||||||||
Gross margin |
62,865 | 69,805 | 86,492 | |||||||||
Selling, general and administrative expenses |
43,873 | 44,028 | 67,063 | |||||||||
Operational restructuring expense (Note 16) ) |
— | — | 1,644 | |||||||||
Operating income |
18,992 | 25,777 | 17,785 | |||||||||
Gain on bargain purchase, net (Note 17) |
2,388 | — | — | |||||||||
Interest expense |
(3,229 | ) | (4,090 | ) | (15,071 | ) | ||||||
Interest income |
204 | 845 | 1,256 | |||||||||
Loss on debt extinguishment (Note 8) |
— | — | (9,397 | ) | ||||||||
Earnings (loss) from continuing operations before
income taxes and discontinued operations |
18,355 | 22,532 | (5,427 | ) | ||||||||
Income tax expense (Note 10) |
3,028 | 3,502 | 1,658 | |||||||||
Earnings (loss) from continuing operations before
discontinued operations |
15,327 | 19,030 | (7,085 | ) | ||||||||
Discontinued operations (Note 2): |
||||||||||||
Earnings from discontinued operations, net of
income tax expense of $408 |
— | — | 347 | |||||||||
Gain on sale of discontinued operations |
— | — | 19,868 | |||||||||
Earnings from discontinued operations |
— | — | 20,215 | |||||||||
Net earnings |
$ | 15,327 | $ | 19,030 | $ | 13,130 | ||||||
Basic earnings per common share (Note 6): |
||||||||||||
Earnings (loss) from continuing operations before
discontinued operations |
$ | 0.67 | $ | 0.87 | $ | (0.62 | ) | |||||
Earnings from discontinued operations |
— | — | 1.66 | |||||||||
Net earnings |
$ | 0.67 | $ | 0.87 | $ | 1.04 | ||||||
Diluted earnings per common share (Note 6): |
||||||||||||
Earnings (loss) from continuing operations before
discontinued operations |
$ | 0.65 | $ | 0.83 | $ | (0.62 | ) | |||||
Earnings from discontinued operations |
— | — | 1.66 | |||||||||
Net earnings |
$ | 0.65 | $ | 0.83 | $ | 1.04 | ||||||
Weighted-average common shares outstanding (Note 6): |
||||||||||||
Basic |
22,915 | 21,829 | 12,204 | |||||||||
Diluted |
23,560 | 23,008 | 12,204 | |||||||||
See accompanying Notes to Consolidated Financial Statements.
44
Table of Contents
PRGX GLOBAL, INC. AND SUBSIDIARIES
CONSOLIDATED BALANCE SHEETS
(In thousands, except share and per share data)
(In thousands, except share and per share data)
| December 31, | ||||||||
| 2009 | 2008 | |||||||
ASSETS (Note 8) |
||||||||
Current assets: |
||||||||
Cash and cash equivalents |
$ | 33,026 | $ | 26,688 | ||||
Restricted cash |
256 | 61 | ||||||
Receivables: |
||||||||
Contract receivables, less allowances of $1,032 in 2009 and $921 in 2008: |
||||||||
Billed |
28,034 | 28,143 | ||||||
Unbilled |
4,481 | 5,568 | ||||||
| 32,515 | 33,711 | |||||||
Employee advances and miscellaneous receivables, less allowances of $351 in 2009 and $311
in 2008 |
276 | 285 | ||||||
Total receivables |
32,791 | 33,996 | ||||||
Prepaid expenses and other current assets |
2,306 | 2,264 | ||||||
Deferred income taxes (Note 10) |
29 | — | ||||||
Total current assets |
68,408 | 63,009 | ||||||
Property and equipment: |
||||||||
Computer and other equipment |
28,583 | 24,164 | ||||||
Furniture and fixtures |
2,888 | 2,885 | ||||||
Leasehold improvements |
2,975 | 2,992 | ||||||
| 34,446 | 30,041 | |||||||
Less accumulated depreciation and amortization |
(24,443 | ) | (22,140 | ) | ||||
Property and equipment, net |
10,003 | 7,901 | ||||||
Goodwill (Note 7) |
4,600 | 4,600 | ||||||
Intangible assets, less accumulated amortization of $13,573 in 2009 and $10,932 in 2008 (Note 7) |
24,104 | 18,968 | ||||||
Unbilled receivables |
1,410 | 1,789 | ||||||
Deferred loan costs, net of accumulated amortization (Note 8) |
1,431 | 2,170 | ||||||
Deferred income taxes (Note 10) |
253 | — | ||||||
Other assets |
304 | 346 | ||||||
| $ | 110,513 | $ | 98,783 | |||||
LIABILITIES AND SHAREHOLDERS’ EQUITY |
||||||||
Current liabilities: |
||||||||
Accounts payable and accrued expenses |
$ | 15,707 | $ | 16,275 | ||||
Accrued payroll and related expenses |
19,884 | 22,536 | ||||||
Refund liabilities |
7,467 | 7,870 | ||||||
Deferred revenues |
916 | 502 | ||||||
Current portions of debt and capital lease obligations (Note 8) |
3,260 | 5,314 | ||||||
Business acquisition obligations (Note 17) |
2,695 | — | ||||||
Total current liabilities |
49,929 | 52,497 | ||||||
Long-term debt and capital lease obligations (Note 8) |
11,070 | 14,331 | ||||||
Deferred income taxes (Note 10) |
— | 234 | ||||||
Noncurrent compensation obligations (Note 13(b)) |
978 | 2,849 | ||||||
Refund liabilities |
733 | 897 | ||||||
Other long-term liabilities |
6,364 | 5,265 | ||||||
Total liabilities |
69,074 | 76,073 | ||||||
Commitments and contingencies (Notes 3, 8, 9, 12 and 13) |
||||||||
Shareholders’ equity (Notes 12 and 14): |
||||||||
Common stock, no par value; $.01 stated value per share. Authorized 50,000,000 shares;
23,272,892 shares issued and outstanding in 2009 and 21,789,645 shares issued and
outstanding in 2008 |
233 | 218 | ||||||
Additional paid-in capital |
562,563 | 559,359 | ||||||
Accumulated deficit |
(524,661 | ) | (539,988 | ) | ||||
Accumulated other comprehensive income |
3,304 | 3,121 | ||||||
Total shareholders’ equity |
41,439 | 22,710 | ||||||
| $ | 110,513 | $ | 98,783 | |||||
See accompanying Notes to Consolidated Financial Statements.
45
Table of Contents
PRGX GLOBAL, INC. AND SUBSIDIARIES
CONSOLIDATED STATEMENTS OF SHAREHOLDERS’ EQUITY (DEFICIT)
Years Ended December 31, 2009, 2008 and 2007
(In thousands, except share data)
Years Ended December 31, 2009, 2008 and 2007
(In thousands, except share data)
| Accumulated | ||||||||||||||||||||||||||||||||
| Additional | Other | Total | ||||||||||||||||||||||||||||||
| Common Stock | Paid-In | Accumulated | Comprehensive | Treasury | Shareholders’ | Comprehensive | ||||||||||||||||||||||||||
| Shares | Amount | Capital | Deficit | Income (Loss) | Stock | Equity (Deficit) | Income (Loss) | |||||||||||||||||||||||||
Balance at December 31, 2006 |
8,398,770 | $ | 84 | $ | 513,920 | $ | (571,818 | ) | $ | 2,041 | $ | (48,710 | ) | $ | (104,483 | ) | ||||||||||||||||
FASB ASC 740 tax liability |
— | — | — | (330 | ) | — | — | (330 | ) | |||||||||||||||||||||||
Comprehensive income: |
||||||||||||||||||||||||||||||||
Net earnings |
— | — | — | 13,130 | — | — | 13,130 | $ | 13,130 | |||||||||||||||||||||||
Foreign currency translation adjustments |
— | — | — | — | 2,223 | — | 2,223 | 2,223 | ||||||||||||||||||||||||
Comprehensive income |
$ | 15,353 | ||||||||||||||||||||||||||||||
Issuances of common stock: |
||||||||||||||||||||||||||||||||
Conversions of Series A preferred stock |
4,098,541 | 41 | 11,601 | — | — | — | 11,642 | |||||||||||||||||||||||||
Conversions of convertible senior notes |
9,593,779 | 96 | 65,104 | — | — | — | 65,200 | |||||||||||||||||||||||||
Stock option exercises |
9,000 | — | 57 | — | — | — | 57 | |||||||||||||||||||||||||
Issuance costs of common stock |
— | — | (72 | ) | — | — | — | (72 | ) | |||||||||||||||||||||||
Accumulated dividends on preferred stock |
— | — | (487 | ) | — | — | — | (487 | ) | |||||||||||||||||||||||
Stock-based compensation expense |
— | — | 15,469 | — | — | — | 15,469 | |||||||||||||||||||||||||
Balance at December 31, 2007 |
22,100,090 | 221 | 605,592 | (559,018 | ) | 4,264 | (48,710 | ) | 2,349 | |||||||||||||||||||||||
Comprehensive income: |
||||||||||||||||||||||||||||||||
Net earnings |
— | — | — | 19,030 | — | — | 19,030 | $ | 19,030 | |||||||||||||||||||||||
Foreign currency translation adjustments |
— | — | — | — | (1,143 | ) | — | (1,143 | ) | (1,143 | ) | |||||||||||||||||||||
Comprehensive income |
$ | 17,887 | ||||||||||||||||||||||||||||||
Issuances of common stock: |
||||||||||||||||||||||||||||||||
Restricted share awards |
399,507 | 4 | (4 | ) | — | — | — | — | ||||||||||||||||||||||||
2006 MIP Performance Unit settlements |
295,879 | 3 | (3 | ) | — | — | — | — | ||||||||||||||||||||||||
Purchase of treasury stock |
— | — | — | — | — | (1,687 | ) | (1,687 | ) | |||||||||||||||||||||||
Retirement of treasury stock |
(1,005,831 | ) | (10 | ) | (50,387 | ) | — | — | 50,397 | — | ||||||||||||||||||||||
Stock-based compensation expense |
— | — | 4,161 | — | — | — | 4,161 | |||||||||||||||||||||||||
Balance at December 31, 2008 |
21,789,645 | 218 | 559,359 | (539,988 | ) | 3,121 | — | 22,710 | ||||||||||||||||||||||||
Comprehensive income: |
||||||||||||||||||||||||||||||||
Net earnings |
— | — | — | 15,327 | — | — | 15,327 | $ | 15,327 | |||||||||||||||||||||||
Foreign currency translation adjustments |
— | — | — | — | 183 | — | 183 | 183 | ||||||||||||||||||||||||
Comprehensive income |
$ | 15,510 | ||||||||||||||||||||||||||||||
Issuances of common stock: |
||||||||||||||||||||||||||||||||
Restricted share awards |
817,905 | 8 | (8 | ) | — | — | — | — | ||||||||||||||||||||||||
Restricted shares remitted by employees
for taxes |
— | — | (116 | ) | — | — | — | (116 | ) | |||||||||||||||||||||||
Stock option exercises |
9,375 | — | 26 | — | — | — | 26 | |||||||||||||||||||||||||
2006 MIP Performance Unit settlements |
884,473 | 9 | (9 | ) | — | — | — | — | ||||||||||||||||||||||||
Forfeited restricted share awards |
(149,752 | ) | (1 | ) | 1 | — | — | — | — | |||||||||||||||||||||||
Purchase of treasury stock |
— | — | — | — | — | (246 | ) | (246 | ) | |||||||||||||||||||||||
Retirement of treasury stock |
(78,754 | ) | (1 | ) | (245 | ) | — | — | 246 | — | ||||||||||||||||||||||
Stock-based compensation expense |
— | — | 3,555 | — | — | — | 3,555 | |||||||||||||||||||||||||
Balance at December 31, 2009 |
23,272,892 | $ | 233 | $ | 562,563 | $ | (524,661 | ) | $ | 3,304 | $ | — | $ | 41,439 | ||||||||||||||||||
See accompanying Notes to Consolidated Financial Statements.
46
Table of Contents
PRGX GLOBAL, INC. AND SUBSIDIARIES
CONSOLIDATED STATEMENTS OF CASH FLOWS
(In thousands)
(In thousands)
| Years Ended December 31, | ||||||||||||
| 2009 | 2008 | 2007 | ||||||||||
Cash flows from operating activities: |
||||||||||||
Net earnings |
$ | 15,327 | $ | 19,030 | $ | 13,130 | ||||||
Earnings from discontinued operations |
¾ | ¾ | 20,215 | |||||||||
Earnings (loss) from continuing operations |
15,327 | 19,030 | (7,085 | ) | ||||||||
Adjustments to reconcile earnings (loss) from continuing operations
to net cash provided by operating activities: |
||||||||||||
Loss on debt extinguishment and financial restructuring |
¾ | ¾ | 9,397 | |||||||||
Impairment charges included in operational restructuring |
¾ | ¾ | 344 | |||||||||
Gain on bargain purchase, net |
(2,388 | ) | ¾ | ¾ | ||||||||
Depreciation and amortization |
6,140 | 5,194 | 6,769 | |||||||||
Amortization of debt discount, premium and deferred loan costs |
789 | 786 | 3,257 | |||||||||
Stock-based compensation expense |
3,345 | 2,207 | 20,956 | |||||||||
Loss on disposals of property, plant and equipment, net |
109 | 101 | 298 | |||||||||
Deferred income taxes |
(516 | ) | 577 | 187 | ||||||||
Changes in assets and liabilities: |
||||||||||||
Restricted cash |
(195 | ) | (61 | ) | 139 | |||||||
Billed receivables |
1,092 | 423 | 3,495 | |||||||||
Unbilled receivables |
1,466 | 1,155 | 3,120 | |||||||||
Prepaid expenses and other current assets |
775 | 186 | (651 | ) | ||||||||
Other assets |
55 | 3 | 343 | |||||||||
Accounts payable and accrued expenses |
(2,531 | ) | 1,634 | (1,047 | ) | |||||||
Accrued payroll and related expenses |
(3,163 | ) | (7,561 | ) | (6,425 | ) | ||||||
Refund liabilities |
(567 | ) | (2,806 | ) | (198 | ) | ||||||
Deferred revenues |
405 | (63 | ) | 22 | ||||||||
Noncurrent compensation obligations |
(1,589 | ) | (3,508 | ) | (2,798 | ) | ||||||
Other long-term liabilities |
(388 | ) | (607 | ) | 165 | |||||||
Net cash provided by operating activities |
18,166 | 16,690 | 30,288 | |||||||||
Cash flows from investing activities: |
||||||||||||
Business acquisition |
(2,029 | ) | ¾ | ¾ | ||||||||
Purchases of property and equipment, net of disposal proceeds |
(5,511 | ) | (3,298 | ) | (4,002 | ) | ||||||
Net cash used in investing activities |
(7,540 | ) | (3,298 | ) | (4,002 | ) | ||||||
Cash flows from financing activities: |
||||||||||||
Payments on senior and convertible notes |
¾ | ¾ | (52,637 | ) | ||||||||
Repayments of debt |
(5,315 | ) | (26,279 | ) | (25,524 | ) | ||||||
Term loan borrowings |
¾ | ¾ | 45,000 | |||||||||
Payments for deferred loan costs |
(50 | ) | (59 | ) | (2,999 | ) | ||||||
Repurchases of common stock |
(246 | ) | (1,687 | ) | ¾ | |||||||
Restricted stock remitted by employees for taxes |
(116 | ) | ¾ | ¾ | ||||||||
Net proceeds from common stock issuances |
¾ | ¾ | 57 | |||||||||
Net proceeds from stock option exercises |
26 | ¾ | ¾ | |||||||||
Preferred stock redemptions |
¾ | ¾ | (44 | ) | ||||||||
Issuance costs on common and preferred stock |
¾ | ¾ | (72 | ) | ||||||||
Net cash used in financing activities |
(5,701 | ) | (28,025 | ) | (36,219 | ) | ||||||
Cash flows from discontinued operations: |
||||||||||||
Operating cash flows |
¾ | ¾ | (2,044 | ) | ||||||||
Investing cash flows |
¾ | ¾ | 23,151 | |||||||||
Net cash provided by discontinued operations |
¾ | ¾ | 21,107 | |||||||||
Effect of exchange rates on cash and cash equivalents |
1,413 | (1,043 | ) | 962 | ||||||||
Net change in cash and cash equivalents |
6,338 | (15,676 | ) | 12,136 | ||||||||
Cash and cash equivalents at beginning of year |
26,688 | 42,364 | 30,228 | |||||||||
Cash and cash equivalents at end of year |
$ | 33,026 | $ | 26,688 | $ | 42,364 | ||||||
Supplemental cash flow statement information: |
||||||||||||
Cash paid during the year for interest |
$ | 1,939 | $ | 3,191 | $ | 14,388 | ||||||
Cash paid during the year for income taxes, net of refunds received |
$ | 4,247 | $ | 2,475 | $ | 1,029 | ||||||
Deferred and contingent business acquisition consideration (Note 17) |
$ | 4,210 | $ | ¾ | $ | ¾ | ||||||
See accompanying Notes to Consolidated Financial Statements.
47
Table of Contents
PRGX GLOBAL, INC. AND SUBSIDIARIES
NOTES TO CONSOLIDATED FINANCIAL STATEMENTS
(1) SUMMARY OF SIGNIFICANT ACCOUNTING POLICIES
(a) Description of Business and Basis of Presentation
Description of Business
The principal business of PRGX Global, Inc. and subsidiaries (the “Company”) is providing
recovery audit services to large businesses and government agencies having numerous payment
transactions. These businesses include, but are not limited to:
| • | retailers such as discount, department, specialty, grocery and drug stores, and wholesalers who sell to these retailers; |
| • | business enterprises other than retailers/wholesalers such as manufacturers, financial services firms, and pharmaceutical companies; |
| • | healthcare payers, both private sector health insurance companies and state and federal government payers such as the Centers for Medicare and Medicaid Services (“CMS”); and |
| • | federal and state government agencies. |
The Company currently provides services to clients in over 30 countries.
Basis of Presentation
The consolidated financial statements include the financial statements of the Company and its
wholly owned subsidiaries. All significant intercompany balances and transactions have been
eliminated in consolidation. Financial statements for all years presented separately report results
of discontinued operations from results of continuing operations (see Note 2). Disclosures included
herein pertain to the Company’s continuing operations, unless otherwise noted.
Management of the Company has made a number of estimates and assumptions relating to the
reporting of assets and liabilities and the disclosure of contingent assets and liabilities to
prepare these consolidated financial statements in conformity with U.S. generally accepted
accounting principles (“GAAP”). Actual results could differ from those estimates.
(b) Revenue Recognition
The Company’s revenues are based on specific contracts with its clients. Such contracts
generally specify: (a) time periods covered by the audit; (b) nature and extent of audit services
to be provided by the Company; (c) the client’s duties in assisting and cooperating with the
Company; and (d) fees payable to the Company, generally expressed as a specified percentage of the
amounts recovered by the client resulting from overpayment claims identified. Clients generally
recover claims by either taking credits against outstanding payables or future purchases from the
involved vendors, or receiving refund checks directly from those vendors. The manner in which a
claim is recovered by a client is often dictated by industry practice. In addition, many clients
establish specific procedural guidelines that the Company must satisfy prior to submitting claims
for client approval, and they are unique to each client. For some services provided by the Company,
compensation is in the form of a flat fee, a fee per hour, or a fee per other unit of service.
The Company generally recognizes revenues on the accrual basis except with respect to certain
immaterial Recovery Audit Services – Europe/Asia-Pacific units. Revenues are generally recognized
for a contractually specified percentage of amounts recovered when it has been determined that the
Company’s clients have received economic value (generally through credits taken against existing
accounts payable due to the involved vendors or refund checks received from those vendors) and when
the following criteria are met: (a) persuasive evidence of an
48
Table of Contents
PRGX GLOBAL, INC. AND SUBSIDIARIES
NOTES TO CONSOLIDATED FINANCIAL STATEMENTS
arrangement exists; (b) services have been rendered; (c) the fee billed to the client is fixed
or determinable and (d) collectibility is reasonably assured. In certain limited circumstances, the
Company will invoice a client prior to meeting all four of these criteria; in such cases, revenues
are deferred until all of the criteria are met. Additionally, for purposes of determining
appropriate timing of recognition and for internal control purposes, the Company relies on
customary business practices and processes for documenting that the criteria described in (a)
through (d) above, have been met. Such customary business practices and processes may vary
significantly by client. On occasion, it is possible that a transaction has met all of the revenue
recognition criteria described above but revenues are not recognized, unless management can
otherwise determine that criteria (a) through (d) above have been met, because the Company’s
customary business practices and processes specific to that client have not been completed.
Historically, there has been a certain amount of revenues with respect to which, even though
the requirements of the Company’s revenue recognition policy were met, the Company’s customers’
vendors have ultimately rejected the claims underlying the revenues. In that case, the Company’s
customers, even though fees may have been collected by the Company, may request a refund or offset
of such amount. The Company records such refunds as a reduction of revenues. Refund liabilities are
provided for these reductions in the economic value previously received by the Company’s clients
with respect to vendor claims identified by the Company and for which the Company has previously
recognized revenues. The Company computes the estimate of its refund liabilities at any given time
based on actual historical refund data.
During the first quarter of 2008, management revised its estimation of expected refund rates
in its Recovery Audit Services – Americas segment. Such change in estimate resulted from a decline
in actual Recovery Audit Services – Americas refund rates observed during 2007. The impact of the
change in estimate resulted in a $0.8 million increase in first quarter 2008 income from continuing
operations. During the fourth quarter of 2008, management changed its method of estimating the
refund liability related to its Recovery Audit Services – Europe/Asia-Pacific segment to be more
consistent with the methodology used in the Recovery Audit Services – Americas segment. The impact
of the change in estimate resulted in a $0.9 million decrease in fourth quarter 2008 income from
continuing operations. The combined impact of the 2008 refund liability estimate changes was to
decrease income from continuing operations by $0.1 million, or less than $0.01 per basic and
diluted share. Management does not expect that these changes in estimate will have a material
impact on future period results.
Unbilled receivables are usually contractual and relate to claims for which clients have
received economic value. Unbilled receivables arise when a portion of the Company’s fee is deferred
at the time of the initial invoice. At a later date (which can be up to a year after original
invoice, and at other times a year after completion of the audit period), the unbilled receivable
amount is invoiced. Both the Company and the client acknowledge that this unbilled receivable has
been earned at the time of the original invoice, it just has a deferred due date.
Periodic changes in unbilled receivables and refund liabilities are recorded as adjustments to
revenues.
The Company derives a relatively small portion of revenues on a “fee-for-service” basis
whereby billing is based upon a flat fee, a fee per hour, or a fee per other unit of service. The
Company recognizes revenues for these types of services as they are provided and invoiced, and when
criteria (a) through (d) as set forth above are met.
(c) Cash and Cash Equivalents
Cash and cash equivalents include all cash balances and highly liquid investments with an
initial maturity of three months or less. The Company places its temporary cash investments with
high credit quality financial institutions. At times, certain investments may be in excess of the
Federal Deposit Insurance Corporation insurance limit.
At December 31, 2009 and 2008, the Company had cash and cash equivalents of $33.0 million and
$26.7 million, respectively, of which cash equivalents represent approximately $20.7 million and
$23.3 million, respectively. The Company had $17.1 million and $18.5 million in cash equivalents at
U.S. banks at December 31, 2009 and 2008, respectively. At December 31, 2009 and 2008, certain of
the Company’s international subsidiaries held $3.6 million and $4.8 million, respectively, in
temporary investments, the majority of which were at banks in Canada and Latin America.
49
Table of Contents
PRGX GLOBAL, INC. AND SUBSIDIARIES
NOTES TO CONSOLIDATED FINANCIAL STATEMENTS
(d) Property and Equipment
Property and equipment are stated at cost. Depreciation is provided using the straight-line
method over the estimated useful lives of the assets (three years for computer and other equipment,
five years for furniture and fixtures and three years for purchased software). Leasehold
improvements are amortized using the straight-line method over the shorter of the lease term or ten
years.
The Company evaluates property and equipment for impairment in accordance with Financial
Accounting Standards Board (“FASB”) Accounting Standards Codification (“ASC”) 360-10-35,
“Impairment or Disposal of Long-Lived Assets” (“FASB ASC 360-10-35”). In accordance with the
provisions of FASB ASC 360-10-35, the Company reviews the carrying value of property and equipment
for impairment whenever events and circumstances indicate that the carrying value of an asset may
not be recoverable from the estimated future cash flows expected to result from its use and
eventual disposition. In cases where undiscounted expected future cash flows are less than the
carrying value, an impairment loss equal to an amount by which the carrying value exceeds the fair
value of assets is recognized.
(e) Internally Developed Software
The Company accounts for software developed for internal use in accordance with FASB ASC
350-40 “Internal-Use Software” (“FASB ASC 350-40”). FASB ASC 350-40 provides guidance on a variety
of issues relating to costs of internal use software, including which of these costs should be
capitalized and which should be expensed as incurred. Internally developed software is amortized
using the straight-line method over the expected useful lives of three to seven years.
In accordance with the provisions of FASB ASC 350-40 the Company reviews the carrying value of
internally developed software for impairment whenever events and circumstances indicate that the
carrying value of an asset may not be recoverable from the estimated future cash flows expected to
result from its use and eventual disposition. In cases where undiscounted expected future cash
flows are less than the carrying value, an impairment loss equal to an amount by which the carrying
value exceeds the fair value of assets is recognized.
(f) Goodwill and Other Intangible Assets
Goodwill represents the excess of the purchase price over the estimated fair market value of
net assets of acquired businesses. The Company accounts for goodwill and other intangible assets in
accordance with FASB ASC 350, “Intangibles – Goodwill and Other” (“FASB ASC 350”). FASB ASC 350
requires that goodwill and intangible assets with indefinite useful lives not be amortized, but
instead be tested for impairment at least annually. This Statement also requires that intangible
assets with estimable useful lives be amortized over their respective estimated useful lives and
reviewed for impairment in accordance with FASB ASC 360.
Management evaluates the recoverability of goodwill and other intangible assets annually, or
more frequently if events or changes in circumstances, such as declines in sales, earnings or cash
flows or material adverse changes in the business climate indicate that the carrying value of an
asset might be impaired. Goodwill is considered to be impaired when the net book value of a
reporting unit exceeds its estimated fair value. The Company uses independent business valuation
professionals for the purpose of estimating fair value.
During the third quarter of 2007, management re-evaluated its policy related to the
amortization of its customer relationships intangible asset. The customer relationships intangible
asset had been amortized since its acquisition in 2002 using the straight-line method over a twenty
year expected life. Management’s re-evaluation concluded that the original twenty year life
continued to be a reasonable expectation. However, because of the expectation that revenues and
profits from these customers will likely decline in future years, management concluded that an
accelerated method of amortization of the customer relationships intangible asset would be more
appropriate. The accelerated method results in amortization of the net unamortized June 30, 2007
balance over the remaining 14.5 year life at a rate that declines at approximately 8% per year. The
Company adopted the new method in the third quarter of 2007 and the resulting change in
amortization is being accounted for on a
50
Table of Contents
PRGX GLOBAL, INC. AND SUBSIDIARIES
NOTES TO CONSOLIDATED FINANCIAL STATEMENTS
prospective basis in accordance with FASB ASC 350. Amortization expense in 2007 was increased
by $0.5 million as a result of the change in method.
(g) Direct Expenses
Direct expenses incurred during the course of recovery audit and delivery of advisory services
are typically expensed as incurred.
(h) Income Taxes
Income taxes are accounted for under the asset and liability method. Deferred tax assets and
liabilities are recognized for the future tax consequences attributable to differences between the
financial statement carrying amounts of existing assets and liabilities and their respective tax
bases and operating loss and tax credit carry forwards. Deferred tax assets and liabilities are
measured using enacted tax rates expected to apply to taxable income in the years in which those
temporary differences are expected to be recovered or settled. The effect on the deferred tax
assets and liabilities of a change in tax rates is recognized in income in the period that includes
the enactment date.
FASB ASC 740, “Income Taxes” (“FASB ASC 740”), requires that deferred tax assets be reduced by
a valuation allowance if it is more likely than not that some portion or all of a deferred tax
asset will not be realized. The ultimate realization of deferred tax assets is dependent upon the
generation of future taxable income during the periods in which those temporary differences are
deductible. In making this determination, management considers all available positive and negative
evidence affecting specific deferred tax assets, including the Company’s past and anticipated
future performance, the reversal of deferred tax liabilities, the length of carry-back and
carry-forward periods and the implementation of tax planning strategies. Objective positive
evidence is necessary to support a conclusion that a valuation allowance is not needed for all or a
portion of deferred tax assets when significant negative evidence exists.
FASB ASC 740 prescribes a “more-likely-than-not” recognition threshold and measurement
attribute for the financial statement recognition and measurement of a tax position taken or
expected to be taken in a tax return. FASB ASC 740 also offers guidance on derecognition,
classification, interest and penalties, accounting in interim periods, disclosure, and transition.
In accordance with FASB ASC 740, the Company’s policy for recording interest and penalties
associated with tax positions is to record such items as a component of income before taxes. As a
result of the 2007 implementation of FASB Interpretation No. 48 “Accounting for Uncertainty in
Income Taxes – an Interpretation of FASB Statement No. 109” (now included in FASB ASC 740), the
Company recognized a $0.3 million increase in liability for unrecognized tax benefits, which was
accounted for as an increase to the January 1, 2007 accumulated deficit balance.
(i) Foreign Currency
The local currency has been used as the functional currency in the majority of the countries
in which the Company conducts business outside of the United States. The assets and liabilities
denominated in foreign currency are translated into U.S. dollars at the current rates of exchange
at the balance sheet date. The translation gains and losses are included as a separate component of
shareholders’ equity (deficit) and are included in the determination of comprehensive income
(loss). Comprehensive income (loss) for the years ended December 31, 2009, 2008 and 2007 included
translation gains (losses) related to long-term intercompany balances of $0.2 million, $(0.7
million) and $(0.1 million), respectively. Revenues and expenses in foreign currencies are
translated at the weighted average exchange rates for the period. All realized and unrealized
foreign currency transaction gains and losses are included in selling, general and administrative
expenses. For the years ended December 31, 2009, 2008 and 2007, foreign currency transaction gains
(losses) included in selling, general and administrative expenses were $1.6 million, $(1.5 million)
and $1.6 million, respectively.
(j) Earnings Per Common Share
The Company applies the provisions of FASB ASC 260, “Earnings Per Share.” Basic earnings per
common share is computed by dividing net earnings available to common shareholders by the
weighted-average number of
51
Table of Contents
PRGX GLOBAL, INC. AND SUBSIDIARIES
NOTES TO CONSOLIDATED FINANCIAL STATEMENTS
shares of common stock outstanding during the year. Diluted earnings per common share is
principally computed by dividing net earnings available to common shareholders by the sum of (1)
the weighted-average number of shares of common stock outstanding during the period, (2) the
dilutive effect of the assumed exercise of stock options using the treasury stock method, and (3)
the dilutive effect of other potentially dilutive securities, including the Company’s convertible
note obligations and convertible preferred stock using the “if-converted” method. The potential
dilutive effect of stock options and convertible instruments is excluded from the determination of
diluted earnings per share if the effect would be antidilutive.
(k) Stock-Based Compensation
The Company accounts for stock-based compensation in accordance with the requirements of
FASB ASC 718, “Compensation - Stock Compensation” (“FASB ASC 718”). FASB ASC 718 requires that
companies account for awards of equity instruments issued to employees under the fair value method
of accounting and recognize such amounts in their statements of operations. The Company adopted
FASB ASC 718 on January 1, 2006. Under FASB ASC 718, the Company is required to measure
compensation cost for all stock-based awards at fair value on the date of grant and recognize
compensation expense in its consolidated statements of operations over the service period over
which the awards are expected to vest. The Company recognizes compensation expense over the
indicated vesting periods using the straight-line method. The Company recognizes compensation costs
for awards with performance conditions based on the probable outcome of the performance conditions.
Compensation cost is accrued if it is probable that the performance condition(s) will be achieved
and is not accrued if it is not probable that the performance condition(s) will be achieved.
The fair value of all time-vested options is estimated as of the date of grant using the
Black-Scholes option valuation model. The Black-Scholes option valuation model was developed for
use in estimating the fair value of traded options that have no vesting restrictions and are fully
transferable. Option valuation models require the input of highly subjective assumptions, including
the expected stock price volatility. Because the Company’s employee stock options have
characteristics significantly different from those of traded options and because changes in the
subjective input assumptions can materially affect the fair value estimate, it is management’s
opinion that existing models do not necessarily provide a reliable single measure of the fair value
of the Company’s employee stock options.
For time-vested option grants made in 2009, 2008 and 2007 which resulted in compensation
expense recognition, the Company used the following assumptions in its Black-Scholes valuation
models:
| 2009 | 2008 | 2007 | ||||
Risk-free interest rates |
1.60% - 2.71% | 2.37% - 3.08% | 4.05% - 4.17% | |||
Dividend yields |
— | — | — | |||
Volatility factor of expected market price |
.950 - 1.081 | .876 - .919 | .856 - .889 | |||
Weighted-average expected term of option |
4 - 5 years | 4 - 4.5 years | 4 - 4.5 years |
The Company estimates the fair value of awards of restricted shares and nonvested shares, as
defined in FASB ASC 718, as being equal to the market value of the common stock on the date of the
award. Also, under FASB ASC 718, companies must classify their share-based payments as either
liability-classified awards or as equity-classified awards. Liability-classified awards are
remeasured to fair value at each balance sheet date until the award is settled. Equity-classified
awards are measured at grant date fair value and are not subsequently remeasured. The Company has
classified its share-based payments which are settled in Company common stock as equity-classified
awards and its share-based payments that are settled in cash as liability-classified awards.
Compensation costs related to equity-classified awards are generally equal to the fair value of the
award at grant-date amortized over the vesting period of the award. The liability for
liability-classified awards is generally equal to the fair value of the award as of the balance
sheet date times the percentage vested at the time. The change in the liability amount from one
balance sheet date to another is charged (or credited) to compensation cost.
(l) Comprehensive Income (Loss)
The Company applies the provisions of FASB ASC 220, “Comprehensive Income.” This standard
establishes items that are required to be recognized under accounting standards as components of
comprehensive income (loss). Consolidated comprehensive income (loss) for the Company consists of
consolidated net earnings (loss)
52
Table of Contents
PRGX GLOBAL, INC. AND SUBSIDIARIES
NOTES TO CONSOLIDATED FINANCIAL STATEMENTS
and foreign currency translation, and is presented in the accompanying Consolidated Statements
of Shareholders’ Equity (Deficit).
(m) Segment Reporting
The Company reports its operating segment information in accordance with the provisions of
FASB ASC 280, “Segment Reporting” (“FASB ASC 280”). FASB ASC 280 requires, among other provisions,
that the Company disclose the measure of profit or loss for each reportable segment that is
reported to and used by the chief operating decision maker for purposes of making decisions about
allocating resources and assessing performance. Management of the Company, including the chief
operating decision maker, uses what is internally referred to as “Adjusted EBITDA” as its primary
measure of profit or loss for purposes of assessing the operating performance of all operating
segments. Adjusted EBITDA is earnings from continuing operations before interest, taxes,
depreciation and amortization (“EBITDA”) as adjusted for unusual and other significant items that
management views as distorting the operating results of the various segments from period to period.
EBITDA and Adjusted EBITDA are not computed or presented in accordance with generally accepted
accounting principles (“GAAP”). Such non-GAAP financial measures do not measure the profit or loss
of the reportable segments in accordance with GAAP. FASB ASC 280 requires such non-GAAP measures of
profit or loss to be reported if such measures are what are reported to and used by the Company’s
chief operating decision maker. FASB ASC 280 also requires that the total of the reportable
segments’ measures of profit or loss be reconciled to the Company’s operating results presented on
a GAAP basis. Such reconciliation is provided in Note 5 to these consolidated financial statements
along with other information about the Company’s reportable segments. The reconciling items are not
intended to be, nor should they be, interpreted as non-recurring or extraordinary, or in any manner
be deemed as adjustments made in accordance with GAAP. Because Adjusted EBITDA is not a financial
measure determined in accordance with GAAP, it may not be comparable to other similarly titled
measures of other companies.
The Company revised its reportable operating segments during the fourth quarter of 2009 to
reflect the current management and operational structure. See Note 5 below.
(n) New Accounting Standards
FASB ASC 105-10-65. In June 2009, the Financial Accounting Standards Board (“FASB”) issued
Statement of Financial Accounting Standards (“SFAS”) No. 168, “The FASB Accounting Standards
Codification and the Hierarchy of Generally Accepted Accounting Principles” (“SFAS No. 168” and
“FASB ASC 105-10-65”). The FASB Accounting Standards Codification (“ASC”) has become the source of
authoritative U.S. generally accepted accounting principles (“GAAP”) recognized by the FASB to be
applied by nongovernmental entities. Rules and interpretive releases of the Securities and Exchange
Commission (“SEC”) under authority of federal securities laws are also sources of authoritative
GAAP for SEC registrants. The ASC supersedes all existing non-SEC accounting and reporting
standards. All other nongrandfathered non-SEC accounting literature not included in the ASC has
become nonauthoritative. Following this statement, the FASB will not issue new standards in the
form of statements, FASB Staff Positions, or Emerging Issues Task Force Abstracts. Instead, it will
issue Accounting Standards Updates (“ASU”). ASU will serve only to update the ASC, provide
background information about the guidance, and provide the bases for conclusions on the changes in
the ASC. In conjunction with the adoption by the Company of FASB ASC 105-10-65 effective September
30, 2009, all references to accounting standards issued prior to SFAS No. 168 have been amended to
additionally reflect the corresponding ASC topic.
FASB ASC 260-10-45. In June 2008, the FASB issued Staff Position No. EITF 03-6-1, “Determining
Whether Instruments Granted in Share-Based Transactions Are Participating Securities” (“FSP EITF
03-6-1” and “FASB ASC 260-10-45”). FASB ASC 260-10-45 requires that unvested share-based payment
awards that contain nonforfeitable rights to dividends or dividend equivalents (whether paid or
unpaid) be accounted for as participating securities and should be included in the computation of
earnings per share. The adoption by the Company of FASB ASC 260-10-45 effective January 1, 2009 did
not have any material impact on the Company’s consolidated financial statements.
53
Table of Contents
PRGX GLOBAL, INC. AND SUBSIDIARIES
NOTES TO CONSOLIDATED FINANCIAL STATEMENTS
FASB ASC 470-20. In May 2008, the FASB issued Staff Position No. APB 14-1, “Accounting for
Convertible Debt Instruments That May Be Settled in Cash Upon Conversion (Including Partial Cash
Settlement)” (“FSP APB 14-1” and “FASB ASC 470-20”). FASB ASC 470-20 requires that the liability
and equity components of convertible debt instruments that may be settled in cash upon conversion
(including partial cash settlement) be separately accounted for in a manner that reflects an
issuer’s nonconvertible debt borrowing rate. The resulting debt discount is amortized over the
period the convertible debt is expected to be outstanding as additional non-cash interest expense.
Upon adoption, the provisions of FASB ASC 470-20 are required to be applied retrospectively to all
periods presented. The adoption by the Company of FASB ASC 470-20 effective January 1, 2009 did not
have any material impact on the Company’s consolidated financial statements.
FASB ASC 805. In December 2007 the FASB issued SFAS No. 141 (revised 2007), “Business
Combinations” (“SFAS No. 141(R)” and “FASB ASC 805”). FASB ASC 805 establishes principles and
requirements for how an acquirer recognizes and measures in its financial statements the
identifiable assets acquired, the liabilities assumed, and any noncontrolling interest in an
acquiree; recognizes and measures the goodwill acquired in a business combination or a gain from a
bargain purchase; determines what information to disclose to enable users of the financial
statements to evaluate the nature and financial effects of a business combination; and requires
that costs associated with business combinations be expensed as incurred. The adoption by the
Company of FASB ASC 805 effective January 1, 2009 did not have any material impact on the Company’s
consolidated financial statements except as described in Note 17 below.
FASB ASC 810-10-25. In June 2009, the FASB issued SFAS No. 167, “Amendments to FASB
Interpretation No. 46(R)” (“SFAS No. 167” and “FASB ASC 810-10-25”), which amends FASB
Interpretation No. 46(R) to require an analysis to determine whether a variable interest gives a
company a controlling financial interest in a variable interest entity and requires ongoing
reassessments of whether an enterprise is the primary beneficiary of a variable interest entity.
This statement is effective for fiscal years beginning after November 15, 2009. The Company has not
determined the impact, if any, FASB ASC 810-10-25 will have on its future financial statements.
FASB ASC 810-10-65. In December 2007, the FASB issued SFAS No. 160, “Noncontrolling Interests
in Consolidated Financial Statements” (“SFAS No. 160” and “FASB ASC 810-10-65”). FASB ASC 810-10-65
establishes new accounting and reporting standards for the noncontrolling interest in a subsidiary
and for the deconsolidation of a subsidiary. Specifically, this statement requires the recognition
of a noncontrolling interest (minority interest) as equity in the consolidated financial statements
and separate from the parent’s equity. The amount of net income attributable to the noncontrolling
interest will be included in consolidated net income on the face of the income statement. FASB ASC
810-10-65 clarifies that changes in a parent’s ownership interest in a subsidiary that do not
result in deconsolidation are equity transactions if the parent retains its controlling financial
interest. In addition, this statement requires that a parent recognize a gain or loss in net income
when a subsidiary is deconsolidated. Such gain or loss will be measured using the fair value of the
noncontrolling equity investment on the deconsolidation date. FASB ASC 810-10-65 also includes
expanded disclosure requirements regarding the interests of the parent and its noncontrolling
interest. The adoption by the Company of FASB ASC 810-10-65 effective January 1, 2009 did not have
any material impact on the Company’s consolidated financial statements.
FASB ASC 815. In March 2008, the FASB issued SFAS No. 161, “Disclosures about Derivative
Instruments and Hedging Activities – an amendment of FASB Statement No. 133” (“SFAS No. 161” and
“FASB ASC 815”), which requires additional disclosures about the objectives of derivative
instruments and hedging activities, the method of accounting for such instruments under SFAS
No. 133, “Accounting for Derivative Instruments and Hedging Activities” and its related
interpretations, and a tabular disclosure of the effects of such instruments and related hedged
items on a company’s financial position, financial performance, and cash flows. The adoption by the
Company of FASB ASC 815 effective January 1, 2009 did not have any material impact on the Company’s
consolidated financial statements.
FASB ASC 855. In May 2009, the FASB issued SFAS No. 165, “Subsequent Events” (“SFAS No. 165”
and “FASB ASC 855”), which establishes principles and requirements regarding the reporting of
subsequent events. The Company adopted FASB ASC 855 effective June 30, 2009.
54
Table of Contents
PRGX GLOBAL, INC. AND SUBSIDIARIES
NOTES TO CONSOLIDATED FINANCIAL STATEMENTS
FASB ASC 860. In June 2009, the FASB issued SFAS No. 166, “Accounting for Transfers of
Financial Assets, an amendment of SFAS No. 140” (“SFAS No. 166” and “FASB ASC 860”), which
eliminates the exceptions for qualifying special-purpose entities from the consolidation guidance
in FASB ASC 860, changes the requirements for derecognizing financial assets, and requires
additional disclosures in order to enhance information reported to users of financial statements by
providing greater transparency about transfers of financial assets, including securitization
transactions, and an entity’s continuing involvement in and exposure to the risks related to
transferred financial assets. This statement is effective for fiscal years beginning after November
15, 2009 and for transfers occurring on or after the effective date. The Company has not determined
the impact, if any, FASB ASC 860 will have on its future financial statements.
(2) DISCONTINUED OPERATIONS
On May 30, 2007, the Company sold its Meridian VAT reclaim business (“Meridian”) to Averio
Holdings Limited, a Dublin, Ireland based company affiliated with management of Meridian. The
Company received proceeds from the sale of approximately $22.4 million at closing and an additional
$2.2 million on December 31, 2007. The Company recognized a gain on sale of approximately $19.9
million in 2007 as a result of the transaction. The Meridian gain did not result in the
recognition of significant tax expense since it was recognized in a tax-favored jurisdiction.
Operating results of the discontinued operations up until the sale of Meridian for the three
years ended December 31, 2009, 2008 and 2007 are summarized below (in thousands).
| Years Ended December 31, | ||||||||||||
| 2009 | 2008 | 2007 | ||||||||||
Revenues |
$ | — | $ | — | $ | 17,386 | ||||||
Operating income |
$ | — | $ | — | $ | 755 | ||||||
Income tax expense of $0.4 million was allocated to earnings from discontinued operations in
2007.
(3) RETIREMENT OBLIGATIONS
The July 31, 2005 retirements of the Company’s former Chairman, President and CEO, John M.
Cook, and the Company’s former Vice Chairman, John M. Toma, resulted in an obligation to pay
retirement benefits of approximately $7.6 million (present value basis) to be paid in monthly cash
installments principally over a three-year period, beginning February 1, 2006. On March 16, 2006,
the terms of the applicable severance agreements were amended in conjunction with the Company’s
financial restructuring. Pursuant to the terms of the severance agreements, as amended (1) the
Company’s obligations to pay monthly cash installments to Mr. Cook and Mr. Toma were extended from
36 months to 58 months and from 24 months to 46 months, respectively; however, the total dollar
amount of monthly cash payments to be made to each remained unchanged, and (2) the Company agreed
to pay a fixed sum of $150,000 to defray the fees and expenses of the legal counsel and financial
advisors to Messrs. Cook and Toma. The original severance agreements, and the severance agreements,
as amended, also provide for an annual reimbursement, beginning on or about February 1, 2007, to
Mr. Cook and Mr. Toma for the cost of health insurance for themselves and their respective spouses
(not to exceed $25,000 and $20,000, respectively, subject to adjustment based on changes in the
Consumer Price Index), continuing until each reaches the age of 80. At December 31, 2009, accrued
payroll and related expenses included $1.2 million and noncurrent compensation obligations included
an additional $0.8 million related to these obligations.
(4) MAJOR CLIENTS
For the years ended December 31, 2009 and 2008, Wal-Mart Stores Inc. (and its affiliated
companies) accounted for approximately 12.3% and 11.2%, respectively, of total revenues from
continuing operations. The Company did not have any clients who individually provided revenues in
excess of 10.0% of total revenues from continuing operations during the year ended December 31,
2007.
55
Table of Contents
PRGX GLOBAL, INC. AND SUBSIDIARIES
NOTES TO CONSOLIDATED FINANCIAL STATEMENTS
(5) OPERATING SEGMENTS AND RELATED INFORMATION
The Company conducts its operations through three reportable operating segments: Recovery
Audit Services – Americas, Recovery Audit Services – Europe/Asia-Pacific and New Services. The
Recovery Audit Services Americas segment represents recovery audit services (other than healthcare
recovery audit services) provided in the U.S., Canada and Latin America. The Recovery Audit
Services — Europe/Asia-Pacific segment represents recovery audit services (other than healthcare
recovery audit services) provided in Europe, Asia and the Pacific region. The New Services segment
represents services to healthcare organizations including recovery audit services, business
analytics and advisory services. The Company includes the unallocated portion of corporate selling,
general and administrative expenses not specifically attributable to the Recovery Audit Services
and New Services segments in a segment referred to as corporate support. The Company revised its
reportable segments during the fourth quarter of 2009 to reflect the current management and
operational structure. Prior to 2009, the Company reported its results under two operating segments
– Domestic Accounts Payable Services and International Accounts Payable Services. The presentation
of prior years’ financial information in this Form 10-K has been restated to conform to the current
presentation.
56
Table of Contents
PRGX GLOBAL, INC. AND SUBSIDIARIES
NOTES TO CONSOLIDATED FINANCIAL STATEMENTS
Management evaluates the performance of its operating segments based upon revenues and
measures of profit or loss it refers to as EBITDA and adjusted EBITDA. Adjusted EBITDA is earnings
from continuing operations before interest, taxes, depreciation and amortization (“EBITDA”) as
adjusted for unusual and other significant items that management views as distorting the operating
results of the various segments from period to period. Adjustments include restructuring charges,
stock-based compensation, bargain purchase gains, intangible asset impairment charges, litigation
settlements, severance charges and foreign currency gains and losses on intercompany balances
viewed by management as individually or collectively significant. The Company does not have any
inter-segment revenues. Segment information for the years ended December 31, 2009, 2008 and 2007
and segment asset information as of December 31, 2009 and 2008 (in thousands) is presented below:
| Recovery | Recovery Audit | |||||||||||||||||||
| Audit | Services – | |||||||||||||||||||
| Services– | Europe/Asia- | New | Corporate | |||||||||||||||||
| Americas | Pacific | Services | Support | Total | ||||||||||||||||
2009 |
||||||||||||||||||||
Revenues |
$ | 121,561 | $ | 52,489 | $ | 5,533 | $ | ¾ | $ | 179,583 | ||||||||||
Earnings (loss) from continuing operations
before discontinued operations |
$ | 36,013 | $ | 9,055 | $ | (4,017 | ) | $ | (25,724 | ) | $ | 15,327 | ||||||||
Income taxes |
¾ | ¾ | ¾ | 3,028 | 3,028 | |||||||||||||||
Interest, net |
(99 | ) | 184 | ¾ | 2,940 | 3,025 | ||||||||||||||
Depreciation and amortization expense |
4,798 | 911 | 431 | ¾ | 6,140 | |||||||||||||||
EBITDA |
$ | 40,712 | $ | 10,150 | $ | (3,586 | ) | $ | (19,756 | ) | $ | 27,520 | ||||||||
Foreign currency gains on intercompany
balances |
(360 | ) | (1,235 | ) | ¾ | ¾ | (1,595 | ) | ||||||||||||
Litigation settlement |
¾ | ¾ | ¾ | 650 | 650 | |||||||||||||||
Stock-based compensation |
¾ | ¾ | ¾ | 3,345 | 3,345 | |||||||||||||||
Gain on bargain purchase, net |
¾ | (2,388 | ) | ¾ | ¾ | (2,388 | ) | |||||||||||||
Adjusted EBITDA |
$ | 40,352 | $ | 6,527 | $ | (3,586 | ) | $ | (15,761 | ) | $ | 27,532 | ||||||||
Capital expenditures, net of disposals |
$ | 4,281 | $ | 266 | $ | 964 | $ | ¾ | $ | 5,511 | ||||||||||
Allocated assets |
$ | 47,263 | $ | 21,421 | $ | 2,814 | $ | ¾ | $ | 71,498 | ||||||||||
Unallocated assets: |
||||||||||||||||||||
Cash and cash equivalents |
¾ | ¾ | ¾ | 33,026 | 33,026 | |||||||||||||||
Restricted cash |
¾ | ¾ | ¾ | 256 | 256 | |||||||||||||||
Deferred loan costs |
¾ | ¾ | ¾ | 1,431 | 1,431 | |||||||||||||||
Deferred income taxes |
¾ | ¾ | ¾ | 282 | 282 | |||||||||||||||
Prepaid expenses and other assets |
¾ | ¾ | ¾ | 4,020 | 4,020 | |||||||||||||||
Total assets |
$ | 47,263 | $ | 21,421 | $ | 2,814 | $ | 39,015 | $ | 110,513 | ||||||||||
57
Table of Contents
PRGX GLOBAL, INC. AND SUBSIDIARIES
NOTES TO CONSOLIDATED FINANCIAL STATEMENTS
| Recovery | Recovery Audit | |||||||||||||||||||
| Audit | Services – | |||||||||||||||||||
| Services – | Europe/Asia- | New | Corporate | |||||||||||||||||
| Americas | Pacific | Services | Support | Total | ||||||||||||||||
2008 |
||||||||||||||||||||
Revenues |
$ | 138,168 | $ | 53,600 | $ | 3,938 | $ | ¾ | $ | 195,706 | ||||||||||
Earnings (loss) from continuing operations
before discontinued operations |
$ | 45,305 | $ | 3,900 | $ | (6,222 | ) | $ | (23,953 | ) | $ | 19,030 | ||||||||
Income taxes |
¾ | ¾ | ¾ | 3,502 | 3,502 | |||||||||||||||
Interest, net |
(178 | ) | (45 | ) | ¾ | 3,468 | 3,245 | |||||||||||||
Depreciation and amortization expense |
4,657 | 308 | 229 | ¾ | 5,194 | |||||||||||||||
EBITDA |
49,784 | 4,163 | (5,993 | ) | (16,983 | ) | 30,971 | |||||||||||||
Foreign currency (gains) losses on
intercompany balances |
(181 | ) | 3,464 | ¾ | ¾ | 3,283 | ||||||||||||||
Stock-based compensation |
¾ | ¾ | ¾ | 2,207 | 2,207 | |||||||||||||||
Adjusted EBITDA |
$ | 49,603 | $ | 7,627 | $ | (5,993 | ) | $ | (14,776 | ) | $ | 36,461 | ||||||||
Capital expenditures, net of disposals |
2,441 | 302 | 555 | $ | ¾ | $ | 3,298 | |||||||||||||
Allocated assets |
$ | 51,184 | $ | 13,150 | $ | 1,130 | $ | ¾ | $ | 65,464 | ||||||||||
Unallocated assets: |
||||||||||||||||||||
Cash and cash equivalents |
¾ | ¾ | ¾ | 26,688 | 26,688 | |||||||||||||||
Restricted cash |
¾ | ¾ | ¾ | 61 | 61 | |||||||||||||||
Deferred loan costs |
¾ | ¾ | ¾ | 2,170 | 2,170 | |||||||||||||||
Prepaid expenses and other assets |
¾ | ¾ | ¾ | 4,400 | 4,400 | |||||||||||||||
Total assets |
$ | 51,184 | $ | 13,150 | $ | 1,130 | $ | 33,319 | $ | 98,783 | ||||||||||
2007 |
||||||||||||||||||||
Revenues |
$ | 143,568 | $ | 59,055 | $ | 24,746 | $ | ¾ | $ | 227,369 | ||||||||||
Earnings (loss) from continuing operations
before discontinued operations |
$ | 39,274 | $ | 5,070 | $ | 13,926 | $ | (65,355 | ) | $ | (7,085 | ) | ||||||||
Income taxes |
¾ | ¾ | ¾ | 1,658 | 1,658 | |||||||||||||||
Interest, net |
(666 | ) | (21 | ) | ¾ | 14,502 | 13,815 | |||||||||||||
Loss on financial restructuring |
¾ | ¾ | ¾ | 9,397 | 9,397 | |||||||||||||||
Depreciation and amortization expense |
5,999 | 742 | 28 | ¾ | 6,769 | |||||||||||||||
EBITDA |
$ | 44,607 | $ | 5,791 | $ | 13,954 | $ | (39,798 | ) | $ | 24,554 | |||||||||
Operational restructuring expenses |
¾ | ¾ | ¾ | 1,644 | 1,644 | |||||||||||||||
Foreign currency gains on
intercompany balances |
(130 | ) | (1,022 | ) | ¾ | ¾ | (1,152 | ) | ||||||||||||
Stock-based compensation |
¾ | ¾ | ¾ | 20,956 | 20,956 | |||||||||||||||
Adjusted EBITDA |
$ | 44,477 | $ | 4,769 | $ | 13,954 | $ | (17,198 | ) | $ | 46,002 | |||||||||
Capital expenditures, net of disposals |
$ | 2,400 | $ | 594 | $ | 1,008 | $ | ¾ | $ | 4,002 | ||||||||||
58
Table of Contents
PRGX GLOBAL, INC. AND SUBSIDIARIES
NOTES TO CONSOLIDATED FINANCIAL STATEMENTS
The following table presents revenues by country based on the location of clients served (in
thousands):
| 2009 | 2008 | 2007 | ||||||||||
United States |
$ | 97,141 | $ | 111,954 | $ | 140,388 | ||||||
United Kingdom |
25,111 | 26,556 | 30,548 | |||||||||
Canada |
20,560 | 21,099 | 18,707 | |||||||||
France |
12,055 | 11,438 | 12,084 | |||||||||
Mexico |
3,740 | 4,697 | 5,225 | |||||||||
Spain |
2,547 | 3,319 | 3,270 | |||||||||
Brazil |
4,320 | 3,339 | 3,211 | |||||||||
Germany |
1,224 | 2,445 | 2,459 | |||||||||
Australia |
1,424 | 1,113 | 2,428 | |||||||||
Sweden |
2,158 | 2,459 | 1,806 | |||||||||
Belgium |
2,186 | 885 | 1,089 | |||||||||
Other |
7,117 | 6,402 | 6,154 | |||||||||
| $ | 179,583 | $ | 195,706 | $ | 227,369 | |||||||
The following table presents long-lived assets by country based on the location of the asset
(in thousands):
| 2009 | 2008 | |||||||
United States |
$ | 31,678 | $ | 32,424 | ||||
United Kingdom |
7,701 | 554 | ||||||
All Other |
1,063 | 1,007 | ||||||
| $ | 40,442 | $ | 33,985 | |||||
For the years ended December 31, 2009 and 2008, Wal-Mart Stores Inc. (and its affiliated
companies) accounted for approximately 12.3% and 11.2% of the Company’s total revenues,
respectively. The Company did not have any clients who individually provided revenues in excess of
10.0% of total revenues from continuing operations during the year ended December 31, 2007. Such
revenues are located primarily in the Recovery Audit Services – Americas Segment.
(6) EARNINGS PER COMMON SHARE
The following tables set forth the computations of basic and diluted earnings per common share
for the three years ended December 31, 2009, 2008 and 2007 (in thousands, except per share data).
For the year ended December 31, 2007, the impact of all potentially dilutive securities is
antidilutive, thus diluted weighted average common shares and diluted earnings per common share
presented are the same as basic weighted average common shares and basic earnings per common share.
| 2009 | 2008 | 2007 | ||||||||||
Basic earnings per common share: |
||||||||||||
Numerator for earnings per common share calculations: |
||||||||||||
Earnings (loss) from continuing operations before
discontinued operations |
$ | 15,327 | $ | 19,030 | $ | (7,085 | ) | |||||
Preferred dividends |
¾ | ¾ | (487 | ) | ||||||||
Earnings (loss) for purposes of computing
basic earnings per common share from
continuing operations |
15,327 | 19,030 | (7,572 | ) | ||||||||
Earnings from discontinued operations |
¾ | ¾ | 20,215 | |||||||||
Earnings for purposes of computing basic
net earnings per common share |
$ | 15,327 | $ | 19,030 | $ | 12,643 | ||||||
59
Table of Contents
PRGX GLOBAL, INC. AND SUBSIDIARIES
NOTES TO CONSOLIDATED FINANCIAL STATEMENTS
| 2009 | 2008 | 2007 | ||||||||||
Denominator: |
||||||||||||
Denominator for basic earnings per common share –
weighted-average common shares outstanding |
22,915 | 21,829 | 12,204 | |||||||||
Basic earnings per common share: |
||||||||||||
Earnings (loss) from continuing operations before
discontinued operations |
$ | 0.67 | $ | 0.87 | $ | (0.62 | ) | |||||
Earnings from discontinued operations |
¾ | ¾ | 1.66 | |||||||||
Net earnings |
$ | 0.67 | $ | 0.87 | $ | 1.04 | ||||||
60
Table of Contents
PRGX GLOBAL, INC. AND SUBSIDIARIES
NOTES TO CONSOLIDATED FINANCIAL STATEMENTS
| 2009 | 2008 | 2007 | ||||||||||
Diluted earnings per common share: |
||||||||||||
Numerator for earnings per common share calculations: |
||||||||||||
Earnings (loss) from continuing operations before
discontinued operations |
$ | 15,327 | $ | 19,030 | $ | (7,085 | ) | |||||
Preferred dividends |
¾ | ¾ | (487 | ) | ||||||||
Earnings (loss) for purposes of computing
diluted earnings per common share from
continuing operations |
15,327 | 19,030 | (7,572 | ) | ||||||||
Earnings from discontinued operations |
¾ | ¾ | 20,215 | |||||||||
Earnings for purposes of computing diluted net
earnings per common share |
$ | 15,327 | $ | 19,030 | $ | 12,643 | ||||||
Denominator: |
||||||||||||
Denominator for basic earnings per common share –
weighted-average common shares outstanding |
22,915 | 21,829 | 12,204 | |||||||||
Incremental shares from stock-based compensation plans |
645 | 1,179 | ¾ | |||||||||
Denominator for diluted earnings per common share |
23,560 | 23,008 | 12,204 | |||||||||
Diluted earnings per common share: |
||||||||||||
Earnings (loss) from continuing operations before
discontinued operations |
$ | 0.65 | $ | 0.83 | $ | (0.62 | ) | |||||
Earnings from discontinued operations |
¾ | ¾ | 1.66 | |||||||||
Net earnings |
$ | 0.65 | $ | 0.83 | $ | 1.04 | ||||||
For the years ended December 31, 2009, 2008 and 2007, options to purchase 1.2 million shares,
1.0 million shares and 1.0 million shares of common stock, respectively, were excluded from the
computation of diluted earnings per common share due to their antidilutive effect as the options’
exercise prices were greater than the average market price of the common shares during the periods.
For the year ended December 31, 2007, common shares of 1.4 million underlying Performance Units
(Note 14) outstanding, respectively, were excluded from the computation of diluted earnings per
common share due to their antidilutive effect to earnings per common share from continuing
operations.
61
Table of Contents
PRGX GLOBAL, INC. AND SUBSIDIARIES
NOTES TO CONSOLIDATED FINANCIAL STATEMENTS
(7) GOODWILL AND OTHER INTANGIBLE ASSETS
(a) Goodwill
FASB ASC 350 requires that goodwill and intangible assets with indefinite useful lives not be
amortized, but instead be tested for impairment at least annually. The Company has selected October
1, the first day of its fourth quarter, as its annual assessment date. FASB ASC 350 requires that
the Company perform goodwill impairment testing using a prescribed two-step, fair value approach.
During each of the fourth quarters of 2009, 2008 and 2007, the Company performed the required
annual impairment testing of goodwill in accordance with FASB ASC 350. As a result of these tests,
the Company concluded that there was no impairment of goodwill as of those dates.
All of the goodwill balances for all periods presented relate to the Company’s Recovery Audit
Services – Americas segment.
Goodwill is comprised of gross goodwill of $203.1 million less total accumulated impairment
losses of $198.5 million resulting in reported goodwill of $4.6 million. For the years ended
December 31, 2009 and 2008, there were no changes in the Company’s reported goodwill balances.
(b) Other Intangible Assets
The Company’s other intangible assets were acquired as part of the January 24, 2002
acquisition of the businesses of Howard Schultz & Associates International, Inc. and affiliates and
the July 16, 2009 acquisition of First Audit Partners LLP (“FAP”). Intangible assets associated
with the FAP acquisition are denominated in British Pounds Sterling and are subject to movements in
foreign currency rates. The amounts below are presented in United States dollars utilizing foreign
currency exchange rates as of December 31, 2009. Intangible assets consist of the following at
December 31, 2009 and 2008 (in thousands):
| Estimated | December 31, | December 31, | ||||||||||
| Useful Life | 2009 | 2008 | ||||||||||
Amortized intangible assets: |
||||||||||||
Customer relationships: |
6-20 years | |||||||||||
Gross carrying amount |
$ | 34,181 | $ | 27,700 | ||||||||
Accumulated amortization |
(13,454 | ) | (10,932 | ) | ||||||||
Net carrying amount |
20,727 | 16,768 | ||||||||||
Trademarks: |
6 years | |||||||||||
Gross carrying amount |
523 | ¾ | ||||||||||
Accumulated amortization |
(40 | ) | ¾ | |||||||||
Net carrying amount |
483 | ¾ | ||||||||||
Non-compete agreements: |
4.5 years | |||||||||||
Gross carrying amount |
773 | ¾ | ||||||||||
Accumulated amortization |
(79 | ) | ¾ | |||||||||
Net carrying amount |
694 | ¾ | ||||||||||
Unamortized intangible assets: |
||||||||||||
Trade name |
Indefinite | 2,200 | 2,200 | |||||||||
Total intangible assets |
$ | 24,104 | $ | 18,968 | ||||||||
The provisions of FASB ASC 350 require that the Company review the carrying value of
intangible assets with indefinite useful lives for impairment annually or whenever events and
circumstances indicate that the
62
Table of Contents
PRGX GLOBAL, INC. AND SUBSIDIARIES
NOTES TO CONSOLIDATED FINANCIAL STATEMENTS
carrying value of an asset may not be recoverable from the estimated discounted future cash
flows expected to result from its use and eventual disposition. At the time of adoption of FASB ASC
350, the Company selected October 1, the first day of its fourth quarter, as its annual assessment
date.
During each of the fourth quarters of 2009, 2008 and 2007, the Company performed the required
annual impairment testing of its trade name in accordance with FASB ASC 350. As of January 21,
2010, the Company changed its trade name from PRG-Schultz International, Inc. to PRGX Global, Inc.
and will no longer actively use the previous trade name. However, the Company will maintain the
legal rights to the former name to prevent other companies from using that name. The Company’s
previous trade name intangible asset will be amortized over six years beginning in January 2010.
Management’s evaluation concluded that the six year life was a reasonable estimate of expected
useful life.
During the third quarter of 2007, management re-evaluated its policy related to the
amortization of its customer relationships intangible asset. The customer relationships intangible
asset had been amortized since its acquisition in 2002 using the straight-line method over a twenty
year expected life. Management’s re-evaluation concluded that the original twenty year life
continued to be a reasonable expectation. However, because of the expectation that revenues and
profits from these customers will likely decline in future years, management concluded that an
accelerated method of amortization of the customer relationships intangible asset would be more
appropriate. The accelerated method results in amortization of the net unamortized June 30, 2007
balance over the remaining 14.5 year life at a rate that declines at approximately 8% per year. The
Company adopted the new method in the third quarter of 2007 and the resulting change in
amortization is being accounted for on a prospective basis in accordance with FASB ASC 350.
Amortization expense in 2007 was increased by $0.5 million ($0.04 per weighted-average common
share) as a result of the change in method. Amortization of intangible assets amounted to $2.6
million, $2.2 million and $1.9 million per year for the years ended December 31, 2009, 2008 and
2007, respectively. Based on the current amortization method, intangible asset amortization expense
for each consecutive year for the next five years will be $3.8 million, $3.6 million, $3.5 million,
$3.4 million and $3.0 million, respectively.
(8) DEBT, CAPITAL LEASES AND MANDATORILY REDEEMABLE PARTICIPATING PREFERRED STOCK
2006 Financial Restructuring
On March 17, 2006, the Company completed an exchange offer (the “Exchange Offer”) for its $125
million of 4.75% Convertible Subordinated Notes due 2006 (the “Convertible Subordinated Notes”). As
a result of the Exchange Offer, substantially all of the outstanding Convertible Subordinated Notes
and accrued interest thereon were exchanged for (a) $51.5 million in principal amount of 11.0%
Senior Notes Due 2011, (b) $59.6 million in principal amount of 10.0% Senior Convertible Notes Due
2011, and (c) 124,094 shares, or $14.9 million liquidation preference, of 9.0% Series A Convertible
Participating Preferred Stock. The $0.9 million of Convertible Subordinated Notes that were not
exchanged were redeemed in November 2006.
The new instruments issued in the exchange were initially recorded at their estimated fair
values. Information regarding these estimated fair values is as follows ($ in thousands):
| 10% Senior | 9% Series A | |||||||||||
| 11% Senior | Convertible | Preferred | ||||||||||
| Notes | Notes | Stock | ||||||||||
Imputed borrowing rates used for valuation |
16 | % | 17 | % | 18 | % | ||||||
Fair values of cash flows based on imputed rates |
$ | 42,795 | $ | 42,891 | $ | 10,109 | ||||||
Fair values of conversion features |
— | 21,993 | 16,777 | |||||||||
Total estimated fair value |
42,795 | 64,884 | 26,886 | |||||||||
Face value of instruments issued |
51,455 | 59,566 | 14,891 | |||||||||
Excess of face value over fair value |
$ | 8,660 | ||||||||||
Excess of fair value over face value |
$ | 5,318 | $ | 11,995 | ||||||||
63
Table of Contents
PRGX GLOBAL, INC. AND SUBSIDIARIES
NOTES TO CONSOLIDATED FINANCIAL STATEMENTS
The aggregate fair value of the new instruments issued exceeded the book value of the
exchanged Convertible Subordinated Notes by approximately $10 million. Such amount was recognized
as a loss on financial restructuring in the first quarter of 2006. The Company incurred $1.3
million of costs related to the issuance of the new preferred stock. Such amount was charged to
additional paid-in capital in the first quarter of 2006. The Company incurred costs of $5.1 million
in connection with the issuance of the new senior notes and senior convertible notes. Such amount
was capitalized and was being amortized over the term of the notes.
The excess of the fair value of the preferred stock over its stated liquidation (redemption)
value was credited to additional paid-in capital. The excess of the principal balance of the new
senior notes over their fair value was recorded as a note discount and was being amortized on the
interest method over the term of the notes. The excess of the fair value of the new senior
convertible notes over their principal balance was recorded as a note premium and was being
amortized on the interest method over the term of the notes.
As a part of its financial restructuring in March 2006, the Company entered into a senior
secured credit facility with Ableco LLC (“Ableco”) and The CIT/Group/Business Credit, Inc. The
credit facility included (1) a $25.0 million term loan, and (2) a revolving credit facility that
provided for revolving loan borrowings of up to $20.0 million. The Company incurred $2.6 million of
costs in connection with entering into the senior secured credit facility. Such amount was
capitalized and was being amortized over the term of the indebtedness.
On September 15, 2006, the Company issued $2.9 million of additional senior convertible notes
in lieu of the semiannual cash interest payment thereon. As of December 31, 2006, 37,030 shares of
Series A convertible preferred stock had been converted into 1,618,995 shares of common stock.
2007 Repayments, Conversions, Redemptions and New Credit Facility
During the first quarter of 2007, the Company repaid $9.6 million of the $25 million Ableco
term loan. During the second quarter of 2007, the Company repaid the remaining $15.4 million
balance of the term loan with a portion of the proceeds of the Meridian sale.
In September 2007, the Company initiated the redemption of all of the then outstanding 11%
senior notes, 10% senior convertible notes and 9% Series A convertible preferred stock. In
September 2007, the Company also entered into an amended and restated credit facility with Ableco
consisting of a $20 million revolving credit facility and a $45 million term loan which was funded
in October 2007.
During 2007, prior to redemption, 86,744 shares of Series A convertible preferred stock were
converted into 4,098,541 shares of common stock and $62.4 million in principal value of the 10%
senior convertible notes were converted into 9,593,779 shares of common stock. In addition, during
October 2007, the $51.5 million in principal value of 11% senior notes were fully redeemed, along
with a $1.0 million prepayment premium. The remaining outstanding 10% senior convertible notes and
9% Series A convertible preferred stock which totaled less than $0.2 million were also redeemed.
The redemptions were funded with a portion of the Company’s unrestricted funds and the proceeds of
the Ableco $45 million term loan.
The face amount of the 11% senior notes redeemed exceeded their carrying amount net of
unamortized discount and deferred loan costs by $8.4 million. Such amount, along with the $1.0
million prepayment premium, $9.4 million in total, is reported as a loss on debt extinguishment in
the 2007 Consolidated Statement of Operations. Unamortized deferred loan costs of $2.1 million
related to the senior convertible notes that were converted to common shares were charged to
additional paid-in capital in 2007.
Activity related to the senior notes and senior convertible notes during the year ended
December 31, 2007 is summarized as follows (in thousands):
64
Table of Contents
PRGX GLOBAL, INC. AND SUBSIDIARIES
NOTES TO CONSOLIDATED FINANCIAL STATEMENTS
| 10% Senior | ||||||||
| 11% Senior | Convertible | |||||||
| Notes | Notes | |||||||
Carrying value December 31, 2006 |
$ | 43,796 | $ | 68,030 | ||||
Amortization of discount (premium) |
1,016 | (853 | ) | |||||
Carrying value of notes converted into common
stock prior to redemption (Face value of
$62,360) |
— | (67,015 | ) | |||||
Carrying value of notes redeemed in October 2007 |
(44,812 | ) | (162 | ) | ||||
Balance December 31, 2007 |
$ | — | $ | — | ||||
Activity related to the Series A preferred stock during the year ended December 31, 2007
is summarized as follows (in thousands):
| 9% Series A | ||||
| Preferred Stock | ||||
Liquidation value at December 31, 2006 (accrual basis) |
$ | 11,199 | ||
Accumulated dividends (accrual basis) |
487 | |||
Liquidation value of preferred shares converted to common
shares prior to redemption |
(11,642 | ) | ||
Liquidation value of preferred shares redeemed in October 2007 |
(44 | ) | ||
Balance at December 31, 2007 |
$ | — | ||
As a consequence of the early repayment of the $25 million Ableco term loan in 2007 and
the replacement of the revolving credit facility, the Company wrote-off $1.7 million of unamortized
deferred loan costs in 2007. Such amount is included in 2007 interest expense. The Company incurred
approximately $3.1 million of costs in connection with its entry into the amended and restated
Ableco credit facility in September 2007. Such amount has been capitalized and is being amortized
over the life of the facility.
2008 and 2009 Repayments
During 2008, the Company reduced the balance of the Ableco term loan by $25.9 million. This
amount included $10.9 million of mandatory payments, including contingent payments (see below), as
well as a voluntary prepayment of $15.0 million. During the first quarter of 2008, the Company
completed an amendment of its credit facility, permitting the $15.0 million pre-payment without
penalty and increasing the initial borrowing capacity under the revolver portion of the facility by
$10 million. Certain components of the borrowing availability calculation were reduced over the
term of the loan and availability was based on eligible accounts receivable and other factors.
During 2009, the Company paid the required quarterly payments and reduced the balance on its
term loan by $5.0 million. In March 2009, the Company entered into the second amendment of its
credit facility, lowering certain of the debt covenant thresholds through March 10, 2010 and
revising the borrowing base calculation. The borrowing availability calculation was modified for
the remaining term of the credit facility. Availability was based on eligible accounts receivable
and other factors.
The Ableco term loan required quarterly principal payments of $1.25 million commencing in
April 2008. The loan agreement also required an annual additional prepayment contingently payable
based on an excess cash flow calculation as defined in the agreement. The first such payment was
made in April 2008. The Company was not required to make an excess cash flow payment in 2009. Since
the credit facility was replaced in January 2010, the annual additional contingent payment based on
2009 excess cash flow due in April 2010 will not be required. The remaining balance of the Ableco
term loan was due in September 2011. Interest was payable monthly and accrued at the Company’s
option at either prime plus 2.0% or at LIBOR plus 4.75%, but under either option could not
have been less than 9.75%. Interest on outstanding balances under the revolving credit
facility, if any, accrued at the Company’s option at either prime plus 0.25% or at LIBOR plus
2.25%. The Company also paid a commitment fee of 0.5% per annum, payable monthly, on the unused
portion of the $22.5 million Ableco revolving credit facility. As of December 31, 2009, there were
no outstanding borrowings under the Ableco revolving credit
65
Table of Contents
PRGX GLOBAL, INC. AND SUBSIDIARIES
NOTES TO CONSOLIDATED FINANCIAL STATEMENTS
facility. The weighted-average interest
rates on term loan balances outstanding under the Ableco credit facility during 2009, 2008 and
2007, including fees, were 11.3%, 10.9% and 10.3%, respectively. The Ableco credit facility was
guaranteed by each of the Company’s direct and indirect domestic wholly owned subsidiaries and
certain of its foreign subsidiaries and is secured by substantially all of the Company’s assets
(including the stock of the Company’s domestic subsidiaries and two-thirds of the stock of certain
of the Company’s foreign subsidiaries). The Ableco credit facility would have matured on September
17, 2011.
2010 New Credit Facility
On January 19, 2010, the Company entered into a four-year revolving credit and term loan
agreement with SunTrust Bank (“SunTrust”). The SunTrust credit facility consists of a $15.0
million committed revolving credit facility and a $15.0 million term loan. The SunTrust credit
facility is guaranteed by the Company and its domestic subsidiaries and secured by substantially
all of the assets of the Company. Availability under the SunTrust revolver is based on eligible
accounts receivable and other factors.
The principal portion of the SunTrust term loan must be repaid in quarterly installments of
$0.8 million each commencing in March 2010. The loan agreement requires mandatory prepayments with
the net cash proceeds from certain asset sales, equity offerings and insurance proceeds received by
the Company. The loan agreement also requires an annual additional prepayment contingently payable
based on an excess cash flow calculation as defined in the agreement. The first such payment is
payable in April 2011. The remaining balance of the SunTrust term loan is due in January 2014. As
of February 28, 2010, there were no outstanding borrowings under the SunTrust revolver. Interest on
both the revolver and term loan are payable monthly and accrued at an index rate using the
one-month LIBOR rate, plus an applicable margin as determined by the loan agreement. The applicable
interest rate margin varies from 2.25% per annum to 3.5% per annum, dependent on the Company’s
consolidated leverage ratio, and is determined in accordance with a pricing grid under the SunTrust
loan agreement. The Company also must pay a commitment fee of 0.5% per annum, payable monthly, on
the unused portion of the $15.0 million SunTrust revolving credit facility.
The Company used substantially all the funds from the SunTrust term loan to prepay in full the
$14.2 million outstanding under the Ableco term loan. No draw under the SunTrust revolver was
necessary in connection with the prepayment and termination of the Ableco term loan.
Capital Lease Obligation
In November 2006, the Company entered into a capital lease agreement for the use of copier
equipment to be used throughout its domestic locations. The agreement requires 36 monthly payments
which began November 1, 2007. Payments over the four year life of the agreement aggregate $1.1
million. The present value of payments remaining as of December 31, 2009 is $0.3 million using an
imputed interest rate of 11.3%.
Future Minimum Payments
Minimum principal payments on the Company’s debt, adjusted for the new credit facility entered
into in January 2010, and capital lease obligations for each of the next five years and thereafter
are as follows (in thousands):
| Year Ending December 31, | ||||
2010 |
$ | 3,260 | ||
2011 |
3,000 | |||
2012 |
3,000 | |||
2013 |
3,000 | |||
2014 |
3,000 | |||
Thereafter |
— | |||
| $ | 15,260 | |||
66
Table of Contents
PRGX GLOBAL, INC. AND SUBSIDIARIES
NOTES TO CONSOLIDATED FINANCIAL STATEMENTS
(9) LEASE COMMITMENTS
The Company is committed under noncancelable lease arrangements for facilities and equipment.
Rent expense, excluding costs associated with the termination of noncancelable lease arrangements,
for 2009, 2008 and 2007, was $6.0 million, $6.9 million and $8.0 million, respectively.
FASB ASC 420, “Exit or Disposal Cost Obligations” (“FASB ASC 420”), requires that a liability
for costs to terminate a contract before the end of its term be recognized and measured at its fair
value when the entity terminates the contract in accordance with the contract terms. The Company
incurred approximately $1.2 million in 2007 in termination costs of noncancelable lease
arrangements. The Company recognized a corresponding liability for the fair value of the remaining
lease rentals, reduced by any estimable sublease rentals that could be reasonably obtained for the
properties. This liability is reduced ratably over the remaining term of the cancelled lease
arrangements as cash payments are made. Accretion related to discounting is included in rent
expense.
The Company has entered into several operating lease agreements that contain provisions for
future rent increases, free rent periods or periods in which rent payments are reduced (abated). In
accordance with FASB ASC 840-20, “Operating Leases”, the total amount of rental payments due over
the lease term is being charged to rent expense on the straight-line, undiscounted method over the
lease terms.
In November 2006, the Company entered into a capital lease agreement for the use of copier
equipment to be used throughout its domestic locations. The agreement requires 36 monthly payments
which began on November 1, 2007.
The future minimum lease payments under noncancelable operating and capital leases are
summarized as follows (in thousands):
| Operating | Capital | |||||||
| Year Ending December 31, | Leases | Leases | ||||||
2010 |
$ | 6,958 | $ | 273 | ||||
2011 |
6,442 | ¾ | ||||||
2012 |
6,446 | ¾ | ||||||
2013 |
6,202 | ¾ | ||||||
2014 |
5,822 | ¾ | ||||||
Thereafter |
323 | ¾ | ||||||
Total payments |
$ | 32,193 | 273 | |||||
Less amounts representing interest |
(13 | ) | ||||||
Principal balance at December 31, 2009 |
$ | 260 | ||||||
(10) INCOME TAXES
Income taxes have been provided in accordance with FASB ASC 740, “Income Taxes” (“FASC ASC
740”). Total income tax expense for the years ended December 31, 2009, 2008 and 2007 was allocated
as follows (in thousands):
| 2009 | 2008 | 2007 | ||||||||||
Earnings (loss) from continuing operations |
$ | 3,028 | $ | 3,502 | $ | 1,658 | ||||||
Earnings (loss) from discontinued operations |
— | — | 408 | |||||||||
Effect of cumulative translation adjustment |
— | — | — | |||||||||
| $ | 3,028 | $ | 3,502 | $ | 2,066 | |||||||
Earnings (loss) before income taxes from continuing operations for the years ended December
31, 2009, 2008 and 2007 relate to the following jurisdictions (in thousands):
67
Table of Contents
PRGX GLOBAL, INC. AND SUBSIDIARIES
NOTES TO CONSOLIDATED FINANCIAL STATEMENTS
| 2009 | 2008 | 2007 | ||||||||||
United States |
$ | 4,369 | $ | 18,300 | $ | (9,775 | ) | |||||
Foreign |
13,986 | 4,232 | 4,348 | |||||||||
| $ | 18,355 | $ | 22,532 | $ | (5,427 | ) | ||||||
The provision for income taxes attributable to continuing operations for the years ended
December 31, 2009, 2008 and 2007 consists of the following (in thousands):
| 2009 | 2008 | 2007 | ||||||||||
Current: |
||||||||||||
Federal |
$ | 40 | $ | (130 | ) | $ | 130 | |||||
State |
85 | — | — | |||||||||
Foreign |
3,419 | 3,055 | 1,341 | |||||||||
| 3,544 | 2,925 | 1,471 | ||||||||||
Deferred: |
||||||||||||
Federal |
— | 130 | (130 | ) | ||||||||
State |
— | — | — | |||||||||
Foreign |
(516 | ) | 447 | 317 | ||||||||
| (516 | ) | 577 | 187 | |||||||||
Total |
$ | 3,028 | $ | 3,502 | $ | 1,658 | ||||||
68
Table of Contents
PRGX GLOBAL, INC. AND SUBSIDIARIES
NOTES TO CONSOLIDATED FINANCIAL STATEMENTS
The significant differences between the U.S. federal statutory tax rate and the Company’s
effective tax expense (benefit) for earnings (loss) from continuing operations (in thousands) for
the years ended December 31, 2009, 2008 and 2007 are summarized as follows:
| 2009 | 2008 | 2007 | ||||||||||
Statutory federal income tax rate |
$ | 6,424 | $ | 7,886 | $ | (1,899 | ) | |||||
State income taxes, net of federal benefit |
90 | 362 | (571 | ) | ||||||||
Change in deferred tax asset valuation allowance |
(6,093 | ) | (13,058 | ) | 239 | |||||||
First Audit Partners acquisition – basis difference |
668 | — | — | |||||||||
Foreign loss carry-forward adjustment |
— | 5,115 | — | |||||||||
Loss on extinguishment of debt |
— | — | 2,325 | |||||||||
Foreign taxes |
586 | 1,930 | 1,207 | |||||||||
Compensation deduction limitation |
1,104 | — | — | |||||||||
Other, net |
249 | 1,267 | 357 | |||||||||
| $ | 3,028 | $ | 3,502 | $ | 1,658 | |||||||
The tax effects of temporary differences and carry-forwards that give rise to deferred tax
assets and liabilities as of December 31, 2009 and 2008 consist of the following (in thousands):
| 2009 | 2008 | |||||||
Deferred income tax assets: |
||||||||
Accounts payable and accrued expenses |
$ | 2,165 | $ | 2,582 | ||||
Accrued payroll and related expenses |
3,052 | 2,967 | ||||||
Stock — based compensation |
8,060 | 9,507 | ||||||
Depreciation |
3,482 | 2,744 | ||||||
Noncompete agreements |
122 | 341 | ||||||
Unbilled receivables and refund liabilities |
1,426 | 1,147 | ||||||
Foreign operating loss carry-forwards of foreign subsidiary |
2,071 | 2,842 | ||||||
Federal operating loss carry-forwards |
16,597 | 14,981 | ||||||
Intangible assets |
23,832 | 29,103 | ||||||
State operating loss carry-forwards |
2,624 | 2,665 | ||||||
Other |
4,003 | 4,134 | ||||||
Gross deferred tax assets |
67,434 | 73,013 | ||||||
Less valuation allowance |
58,304 | 64,307 | ||||||
Gross deferred tax assets net of valuation allowance |
9,130 | 8,706 | ||||||
Deferred income tax liabilities: |
||||||||
Intangible assets |
7,340 | 7,293 | ||||||
Capitalized software |
1,206 | 1,204 | ||||||
Other |
303 | 443 | ||||||
Gross deferred tax liabilities |
8,849 | 8,940 | ||||||
Net deferred tax assets (liabilities) |
$ | 281 | $ | (234 | ) | |||
FASB ASC 740 requires that deferred tax assets be reduced by a valuation allowance if it is
more likely than not that some portion or all of a deferred tax asset will not be realized. The
ultimate realization of deferred tax assets is dependent upon the generation of future taxable
income during the periods in which those temporary differences are deductible. In making this
determination, management considers all available positive and negative evidence affecting specific
deferred tax assets, including the Company’s past and anticipated future performance, the reversal
of deferred tax liabilities, the length of carry-back and carry-forward periods and the
implementation of tax planning strategies.
Objective positive evidence is necessary to support a conclusion that a valuation allowance is
not needed for all or a portion of deferred tax assets when significant negative evidence exists.
Cumulative tax losses in recent years are the most compelling form of negative evidence considered
by management in this determination. For the year ended December 31, 2009, management has
determined that based on all available evidence, a valuation allowance of $58.3 million is
appropriate, as compared to a valuation allowance in the amount of $64.3 million as of the year
ended December 31, 2008.
69
Table of Contents
PRGX GLOBAL, INC. AND SUBSIDIARIES
NOTES TO CONSOLIDATED FINANCIAL STATEMENTS
As of December 31, 2009, the Company had approximately $47.4 million of U.S. federal loss
carry-forwards available to reduce future U.S. federal taxable income. The federal loss
carry-forwards expire through 2029. As of December 31, 2009, the Company had approximately $67.3
million of state loss carry-forwards available to reduce future state taxable income. The state
loss carry-forwards expire to varying degrees between 2014 and 2029 and are subject to certain
limitations.
On March 17, 2006, the Company experienced an ownership change as defined under Section 382 of
the Internal Revenue Code (“IRC”). This ownership change resulted in an annual IRC Section 382
limitation that limits the use of certain tax attribute carry-forwards. Of the $47.4 million of
U.S. federal loss carry-forwards available to the Company, $21.9 million of the loss carry-forwards
are subject to an annual usage limitation of $1.4 million.
During 2008, the Company acceded to a position taken by the taxing authorities in the United
Kingdom (“UK”) regarding the denial of certain goodwill deductions taken on UK tax returns for 2003
through 2005. As a result, foreign net operating loss carry-forwards were reduced by approximately
$17.0 million based on December 31, 2008 foreign exchange rates. Accordingly, deferred tax assets
of $5.1 million were written off. This reduction in the Company’s deferred tax assets was offset
by a corresponding reduction in the previously established valuation allowance against these
assets.
FASB ASC 740 prescribes a “more-likely-than-not” recognition threshold and measurement
attribute for the financial statement recognition and measurement of a tax position taken or
expected to be taken in a tax return. FASB ASC 740 also offers guidance on derecognition,
classification, interest and penalties, accounting in interim periods, disclosure, and transition.
In accordance with FASB ASC 740, the Company’s policy for recording interest and penalties
associated with tax positions is to record such items as a component of income before taxes.
The Company recognized interest expense of $0.3 million related to the liability for
unrecognized tax benefits in each of the two years ended December 31, 2009 and 2008. The interest
expense associated with the liability for unrecognized tax benefits is included as a component of
income before taxes. The Company had approximately $1.5 million and $1.2 million accrued for the
payment of interest related to the liability for unrecognized tax benefits as of December 31,
2009, and 2008, respectively.
The Company files U.S., state, and foreign income tax returns in jurisdictions with varying
statutes of limitations. As of December 31, 2009, the 2006 through 2009 tax years generally remain
subject to examination by federal and most state and foreign tax authorities. The use of net
operating losses generated in tax years prior to 2006 may also subject returns for those years to
examination.
The Company has an unrecognized tax benefit of $1.8 million as of December 31, 2009, 2008 and
2007. There have been no additions or reductions to this amount for the years ended December 31,
2009, 2008 and 2007.
(11) EMPLOYEE BENEFIT PLANS
The Company maintains a 401(k) Plan in accordance with Section 401(k) of the Internal Revenue
Code, which allows eligible participating employees to defer receipt of up to 50% of their annual
compensation and contribute such amount to one or more investment funds. Employee contributions are
matched by the Company in a discretionary amount to be determined by the Company each plan year up
to the lesser of 6% of an employee’s annual compensation or $3,000 per participant. The Company may
also make additional discretionary contributions to the Plan as determined by the Company each plan
year. Company matching funds and discretionary contributions vest at the rate of 20% each year
beginning after the participants’ first year of service. Company contributions for continuing and
discontinued operations were approximately $1.0 million in 2009, $1.0 million in 2008 and $0.8
million in 2007.
70
Table of Contents
PRGX GLOBAL, INC. AND SUBSIDIARIES
NOTES TO CONSOLIDATED FINANCIAL STATEMENTS
The Company maintained deferred compensation arrangements for certain key officers and
executives prior to 2007. Total expense related to these deferred compensation arrangements was
less than $0.1 million in 2007. Net payments related to these deferred compensation arrangements
were approximately $0.9 million in 2007. As of December 31, 2009 and 2008, there were no remaining
balances related to these deferred compensation arrangements.
(12) SHAREHOLDER RIGHTS PLAN
On August 1, 2000, the Board authorized a shareholder protection rights plan designed to
protect Company shareholders from coercive or unfair takeover techniques through the use of a
Shareholder Protection Rights Agreement approved by the Board (the “Rights Plan”). The terms of the
Rights Plan, as amended, provide for a dividend of one right (collectively, the “Rights”) to
purchase a fraction of a share of participating preferred stock for each share owned. This dividend
was declared for each share of common stock outstanding at the close of business on August 14,
2000. The Rights, which expire on August 14, 2010, may be exercised only if certain conditions are
met, such as the acquisition (or the announcement of a tender offer, the consummation of which
would result in the acquisition) of 15% or more of the Company’s common stock by a person or
affiliated group in a transaction that is not approved by the Board. Issuance of the Rights does
not affect the finances of the Company, interfere with the Company’s operations or business plans,
or affect earnings per share. The dividend was not taxable to the Company or its shareholders and
did not change the way in which the Company’s shares may be traded.
Effective July 31, 2000, in connection with the Rights Plan, the Board amended the Company’s
Articles of Incorporation to establish a new class of stock, the participating preferred stock. The
Company’s remaining, undesignated preferred stock (1 million shares authorized as of December 31,
2009) may be issued at any time or from time to time in one or more series with such designations,
powers, preferences, rights, qualifications, limitations and restrictions (including dividend,
conversion and voting rights) as may be determined by the Board, without any further votes or
action by the shareholders.
(13) COMMITMENTS AND CONTINGENCIES
Legal Proceedings
On April 1, 2003, Fleming Companies (“Fleming”), one of the Company’s larger U.S. recovery
audit services clients at the time filed for Chapter 11 bankruptcy reorganization. During the
quarter ended March 31, 2003, the Company received approximately $5.6 million in payments on
account from Fleming. On January 24, 2005, the Company received a demand from the Fleming Post
Confirmation Trust (“PCT”), a trust which was created pursuant to Fleming’s Chapter 11
reorganization plan to represent the client, for preference payments received by the Company. The
demand stated that the PCT’s calculation of the preference payments was approximately $2.9 million.
The Company disputed the claim. Later in 2005, the PCT filed suit against the Company seeking to
recover approximately $5.6 million in payments that were made to the Company by Fleming during the
90 days preceding Fleming’s bankruptcy filing, and that were alleged to be avoidable either as
preferences or fraudulent transfers under the Bankruptcy Code.
On July 29, 2009, the Company entered into a settlement agreement in connection with the PCT
lawsuit. Under the terms of the settlement agreement, the Company paid the PCT $1.7 million to
resolve all claims made by the PCT in the litigation. In connection with the settlement, the
Company also agreed to dismiss all proofs of claim it may have against Fleming in connection with
the bankruptcy. Selling, general and administrative expenses for the year ended December 31, 2009
includes a charge of $0.7 million related to the settlement with the PCT for amounts not previously
accrued.
In the normal course of business, the Company is involved in and subject to other claims,
disputes and uncertainties. Management, after reviewing with legal counsel all of such matters,
believes that the aggregate losses, if any, related to such matters will not have a material
adverse effect on the Company’s financial position or results of operations.
71
Table of Contents
PRGX GLOBAL, INC. AND SUBSIDIARIES
NOTES TO CONSOLIDATED FINANCIAL STATEMENTS
(14) STOCK-BASED COMPENSATION
The Company currently has three stock-based compensation plans under which awards have been
granted: (1) the Stock Incentive Plan (“SIP”), (2) the 2006 Management Incentive Plan (“2006 MIP”),
and (3) the 2008 Equity Incentive Plan (“2008 EIP”).
The SIP, as amended, authorized the grant of options or other stock-based awards, with respect
to up to 1,237,500 shares of the Company’s common stock to key employees, directors, consultants
and advisors. The majority of options granted pursuant to the SIP had five to seven year terms and
vested and became fully exercisable on a ratable basis over one to five years of continued
employment or service. The SIP expired in June 2008.
During the first quarter of 2008, the Board of Directors of the Company adopted the 2008 EIP,
which was approved by the shareholders at the annual meeting of the shareholders on May 29, 2008.
The 2008 EIP authorizes the grant of incentive and non-qualified stock options, stock appreciation
rights, restricted stock, restricted stock units and other incentive awards. Two million shares of
the Company’s common stock have been reserved for issuance under the 2008 EIP pursuant to award
grants to key employees, directors and service providers. The options granted pursuant to the 2008
EIP have seven year terms.
72
Table of Contents
PRGX GLOBAL, INC. AND SUBSIDIARIES
NOTES TO CONSOLIDATED FINANCIAL STATEMENTS
The following table summarizes stock option grants during the years ended December 31, 2009,
2008 and 2007:
| # of | Weighted | |||||||||||||||
| Options | Vesting | Average | Grant Date | |||||||||||||
| Granted | Period | Exercise Price | Fair Value | |||||||||||||
2009 |
||||||||||||||||
| 296,296 | 4 years (1) | $ | 3.57 | $ | 763,529 | |||||||||||
| 42,730 | 1 year (2) | 2.82 | 88,011 | |||||||||||||
| 505,755 | 3 years (3) | 2.92 | 1,088,334 | |||||||||||||
2008 |
||||||||||||||||
| 60,135 | 1 year (4) | 9.87 | 393,722 | |||||||||||||
| 211,460 | 3 years (3) | 9.51 | 1,338,330 | |||||||||||||
2007 |
||||||||||||||||
| 104,346 | 1 year (5) | 12.89 | 881,275 | |||||||||||||
| 514,500 | 3 years (6) | 13.54 | 4,659,363 | |||||||||||||
| (1) | During the first quarter of 2009, in connection with his joining the Company as its President and Chief Executive Officer, the Company made inducement grants outside its existing stock-based compensation plans to Mr. Romil Bahl. Mr. Bahl received an option to purchase 296,296 shares of the common stock of the Company. Mr. Bahl’s options were granted in two tranches, the first of which consists of 111,111 shares that vest in four equal annual installments beginning in January 2010. The second tranche consists of 185,185 shares and vests 50% on each of the second and fourth anniversaries of the grant date. | |
| (2) | Non-qualified stock options were granted under the 2008 EIP to the Company’s five non-employee directors. The options vest in full upon the earlier of (i) May 26, 2010, and (ii) the date of, and immediately prior to, the Company’s 2010 annual meeting of shareholders, provided the director has been continuously serving as a member of the Board from the date of grant until the earlier of such dates. Unvested options are forfeited when a director leaves the Board. The options terminate on May 25, 2016, except that vested options held by a director who leaves the Board before a change of control will terminate three years after termination of Board service, if such date occurs before May 25, 2016. | |
| (3) | Non-qualified options were granted to executive and non-executive employees of the Company pursuant to the 2008 EIP. The options vest in three equal annual installments beginning on the first anniversary of the grant date. | |
| (4) | Non-qualified stock options were granted under the 2008 EIP to the Company’s five non-employee directors. The options became fully vested on May 27, 2009, the date of the Company’s 2009 annual meeting of the shareholders. | |
| (5) | Non-qualified stock options were granted to the Company’s six non-employee directors. The options became fully vested on May 29, 2008, the date of the Company’s 2008 annual meeting of the shareholders. | |
| (6) | Non-qualified options were granted to executive and non-executive employees of the Company. The options vest in three equal annual installments beginning on the first anniversary of the grant date. |
73
Table of Contents
PRGX GLOBAL, INC. AND SUBSIDIARIES
NOTES TO CONSOLIDATED FINANCIAL STATEMENTS
The following table summarizes nonvested stock awards (restricted stock and restricted stock
units) grants during the years ended December 31, 2009, 2008 and 2007:
| # of | ||||||||||||
| Shares | Vesting | Grant Date | ||||||||||
| Granted | Period | Fair Value | ||||||||||
2009 |
||||||||||||
| 344,445 | 4 years (1) | $ | 1,229,669 | |||||||||
| 42,730 | 1 year (2) | 120,499 | ||||||||||
| 20,000 | 3 years (3) | 57,400 | ||||||||||
| 522,832 | 3 years (4) | 1,546,636 | ||||||||||
| 25,000 | 3 years (5) | 168,500 | ||||||||||
2008 |
||||||||||||
| 25,325 | 1 year (6) | 249,958 | ||||||||||
| 171,323 | 3 years (7) | 1,629,282 | ||||||||||
| 317,192 | 3 years (8) | 3,016,496 | ||||||||||
2007 |
||||||||||||
| — | — | — | ||||||||||
| (1) | During the first quarter of 2009, in connection with his joining the Company as its President and Chief Executive Officer, the Company made inducement grants outside its existing stock-based compensation plans to Mr. Romil Bahl. Mr. Bahl received nonvested stock awards (restricted stock) representing 344,445 shares of the Company’s common stock. Mr. Bahl’s nonvested stock awards were granted in two tranches, the first of which consists of 233,334 shares that vest in four equal annual installments beginning in January 2010. The second tranche consists of 111,111 shares and vests 50% on each of the second and fourth anniversaries of the grant date. During the vesting period, Mr. Bahl will be entitled to receive dividends with respect to the nonvested shares, if any, and to vote the shares. | |
| (2) | Nonvested stock awards (restricted stock) were granted to the Company’s five non-employee directors pursuant to the 2008 EIP. The shares of restricted stock will vest upon the earlier of (i) May 26, 2010, and (ii) the date of, and immediately prior to, the Company’s 2010 annual meeting of shareholders, provided the director has been continuously serving as a member of the Board from the date of grant until the earlier of such dates. Unvested shares of restricted stock will be forfeited when a director leaves the Board. The shares are generally nontransferable until vesting. During the vesting period, the grantees of the restricted stock will be entitled to receive dividends with respect to the nonvested shares and to vote the shares. | |
| (3) | Nonvested stock awards (restricted stock) granted to an employee of the Company pursuant to the Company’s 2008 EIP. The shares of restricted stock vest 50% on each of the first and third anniversaries of the grant date. During the vesting period, the restricted stock grantee will be entitled to receive dividends, if any, with respect to the nonvested shares and to vote the shares. | |
| (4) | Nonvested stock awards (restricted stock and restricted stock units) granted to executive and non-executive employees of the Company pursuant to the Company’s 2008 EIP. The shares of restricted stock and the restricted stock units vest in three equal annual installments beginning on the first anniversary of the grant date. During the vesting period, the restricted stock grantees will be entitled to receive dividends, if any, with respect to the nonvested shares and to vote the shares. During the vesting period, grantees of restricted stock units will be entitled to receive dividends, if any, with respect to the nonvested shares, but will not be entitled to vote the shares underlying the units. |
74
Table of Contents
PRGX GLOBAL, INC. AND SUBSIDIARIES
NOTES TO CONSOLIDATED FINANCIAL STATEMENTS
| (5) | Nonvested stock awards (restricted stock units) granted to 3 employees of the Company pursuant to the Company’s 2008 EIP. The shares of restricted stock units vest on the third anniversary of the grant date. During the vesting period, grantees of restricted stock units will be entitled to receive dividends, if any, with respect to the nonvested shares, but will not be entitled to vote the shares underlying the units. | |
| (6) | Nonvested stock awards (restricted stock) were granted to the Company’s five non-employee directors pursuant to the 2008 EIP. The shares of restricted stock vested on May 27, 2009, the date of the Company’s 2009 annual meeting of shareholders. | |
| (7) | Nonvested stock awards (restricted stock and restricted stock units) were granted to 68 executive and non-executive employees of the Company pursuant to the 2008 EIP. These shares of restricted stock and restricted stock units vest in three equal annual installments beginning on the first anniversary of the grant date. During the vesting period, the award recipients of restricted stock will be entitled to receive dividends with respect to the nonvested shares and to vote the shares. During the vesting period, award recipients of restricted stock units will be entitled to receive dividends with respect to the nonvested shares, but will not be entitled to vote the shares underlying the units. | |
| (8) | Nonvested stock awards (restricted stock and restricted stock units) were granted to 68 executive and non-executive employees of the Company pursuant to the Company’s 2008 EIP. These shares of restricted stock and restricted stock units will vest on December 31, 2011 provided that Company performance goals outlined in the stock award agreements are met for the three-year period ending December 31, 2011. During the vesting period, the award recipients of restricted stock will be entitled to receive dividends with respect to the nonvested shares and to vote the shares. During the vesting period, award recipients of restricted stock units will be entitled to receive dividends with respect to the nonvested shares, but will not be entitled to vote the shares underlying the units. |
A summary of option activity as of December 31, 2009, and changes during the year then ended
is presented below:
| Weighted- | Weighted- | |||||||||||||||
| Average | Average | Aggregate | ||||||||||||||
| Exercise | Remaining | Intrinsic | ||||||||||||||
| Price | Contractual | Value | ||||||||||||||
| Options | Shares | (Per Share) | Term | ($ 000’s) | ||||||||||||
Outstanding at January 1, 2009 |
1,060,596 | $ | 17.39 | |||||||||||||
Granted |
844,821 | 3.14 | ||||||||||||||
Exercised |
(9,375 | ) | 2.80 | |||||||||||||
Forfeited |
(140,768 | ) | 28.26 | |||||||||||||
Expired |
(14,705 | ) | 99.79 | |||||||||||||
Outstanding at December 31, 2009 |
1,740,569 | $ | 8.98 | 5.18 years | $ | 2,284 | ||||||||||
Exercisable at December 31, 2009 |
710,407 | $ | 14.79 | 3.92 years | $ | 47 | ||||||||||
The weighted-average grant date fair value of options granted during the years ended
December 31, 2009, 2008 and 2007 was $2.31 per share, $6.38 per share and $8.93 per share,
respectively.
A summary of nonvested stock awards (restricted stock and restricted stock units) activity as
of December 31, 2009, and changes during the year then ended is presented below:
75
Table of Contents
PRGX GLOBAL, INC. AND SUBSIDIARIES
NOTES TO CONSOLIDATED FINANCIAL STATEMENTS
| Weighted | ||||||||
| Average Grant | ||||||||
| Date Fair Value | ||||||||
| Nonvested Stock | Shares | (Per Share) | ||||||
Nonvested at January 1, 2009 |
194,759 | $ | 9.56 | |||||
Granted |
955,007 | 3.27 | ||||||
Vested |
(108,767 | ) | 8.67 | |||||
Forfeited |
(45,846 | ) | 6.67 | |||||
Nonvested at December 31, 2009 |
995,153 | $ | 3.75 | |||||
The weighted-average grant date fair value of nonvested stock awards (restricted stock
and restricted stock units) granted during the years ended December 31, 2009 and 2008 was $3.27 per
share and $9.56 per share, respectively. There were no grants of nonvested stock during the year
ended December 31, 2007.
2006 MIP Performance Units
At the annual meeting of shareholders held on August 11, 2006, the shareholders of the Company
approved a proposal granting authorization to issue up to 2.1 million shares of the Company’s
common stock under the 2006 MIP. On September 29, 2006, an aggregate of 682,301 Performance Units
were awarded under the 2006 MIP to the seven executive officers of the Company. The awards had an
aggregate grant date fair value of $4.0 million. At Performance Unit settlement dates (which vary),
participants are paid in common stock and in cash. Participants will receive a number of shares of
Company common stock equal to 60% of the number of Performance Units being paid out, plus a cash
payment equal to 40% of the fair market value of that number of shares of common stock equal to the
number of Performance Units being paid out. The awards were 50% vested at the award date and the
remainder of the awards vests ratably over approximately the following eighteen months. The awards
became fully vested on March 17, 2008. The awards contain certain anti-dilution and change of
control provisions. Also, the number of Performance Units awarded were automatically adjusted on a
pro-rata basis upon the conversion into common stock of any of the Company’s senior convertible
notes or Series A convertible preferred stock. During 2006, an additional 122,073 Performance Units
with aggregate grant date fair values of $1.6 million were granted as a result of this automatic
adjustment provision.
On March 28, 2007, an additional executive officer of the Company was granted 20,000
Performance Units under the 2006 MIP. The award had a grant date fair value of $0.3 million and
vests ratably over four years. During 2007, an additional 1,436,484 Performance Units with
aggregate grant date fair values of $24.0 million were granted to the eight executive officers of
the Company as a result of the automatic adjustment provision related to the conversions of
convertible securities into common stock.
All Performance Units must be settled before April 30, 2016. The Company recognized
compensation expense (credit) of $(0.2 million), $(0.4 million) and $19.6 million during the years
ended December 31, 2009, 2008 and 2007, respectively, related to these 2006 MIP Performance Unit
awards, including $17.7 million related to the automatic adjustments in the year ended December 31,
2007. The amount of compensation expense recognized was based on the assumption that none of the
Performance Unit awards would be forfeited.
During the second quarter of 2009, an aggregate of 1,040,766 Performance Units under the 2006
MIP were settled by seven then current and former executive officers. These settlements resulted in
the issuance of 624,456 shares of common stock and cash payments totaling $1.3 million. In July
2009, 224,154 Performance Units were settled by a former executive officer. This settlement
resulted in the issuance of 134,492 shares of common stock and a cash payment of $0.3 million. In
November 2009, 89,662 Performance Units were settled by a former executive officer. This settlement
resulted in the issuance of 53,797 shares of common stock and a cash payment of $0.2 million. In
December 2009, 119,548 Performance Units were settled by a former executive officer. This
settlement resulted in the issuance of 71,728 shares of common stock and a cash payment of $0.2
million. As of December 31, 2009, a total of 268,988 Performance Units were outstanding and fully
vested under the 2006 MIP.
On April 30, 2008, an aggregate of 493,137 Performance Units under the 2006 MIP were settled
by six executive officers. These settlements resulted in the issuance of 295,879 shares of common
stock and cash payments totaling $2.0 million.
76
Table of Contents
PRGX GLOBAL, INC. AND SUBSIDIARIES
NOTES TO CONSOLIDATED FINANCIAL STATEMENTS
During the years ended December 31, 2009, 2008 and 2007, stock-based compensation charges
aggregated $3.3 million, $2.2 million and $21.0 million, respectively. Such charges are included in
selling, general and administrative expenses in the accompanying Consolidated Statements of
Operations. As of December 31, 2009, there was $5.7 million of unrecognized stock-based
compensation expense related to stock options, nonvested stock and Performance Unit awards which is
expected to be recognized over a weighted average period of 4.86 years.
(15) FAIR VALUE OF FINANCIAL INSTRUMENTS
Effective January 1, 2008, the Company adopted FASB ASC 820, “Fair Value Measurements and
Disclosures” (“FASB ASC 820”), for all financial instruments and non-financial assets and
liabilities accounted for at fair value on a recurring basis. Effective January 1, 2009, the
Company adopted FASB ASC 820 for all non-financial assets and liabilities accounted for at fair
value on a non-recurring basis.
Information regarding assets and liabilities measured at fair value on a recurring basis as of
December 31, 2009 and 2008 follows (in thousands):
| Fair Value Measurements at Reporting Date | ||||||||||||||||
| Using | ||||||||||||||||
| Quoted | ||||||||||||||||
| Prices in | ||||||||||||||||
| Active | Significant | |||||||||||||||
| Markets for | Other | Significant | ||||||||||||||
| Identical | Observable | Unobservable | ||||||||||||||
| Reporting | Assets | Inputs | Inputs | |||||||||||||
| Value | (Level 1) | (Level 2) | (Level 3) | |||||||||||||
As of
December 31, 2009 |
||||||||||||||||
Assets: |
||||||||||||||||
Cash and cash equivalents |
$ | 33,026 | $ | 33,026 | $ | ¾ | $ | ¾ | ||||||||
Liabilities: |
||||||||||||||||
Business acquisition
obligations |
$ | 2,695 | $ | ¾ | $ | ¾ | $ | 2,695 | ||||||||
As of
December 31, 2008 |
||||||||||||||||
Assets: |
||||||||||||||||
Cash and cash equivalents |
$ | 26,688 | $ | 26,688 | $ | ¾ | $ | ¾ | ||||||||
In accordance with the provisions of FASB ASC 350, the Company tests its goodwill and other
intangible assets for impairment at least annually. The annual impairment tests are based on fair
value measurements using Level 3 inputs primarily consisting of estimated discounted cash flows
expected to result from the use of the assets. As of the date of the last test, which was October
1, 2009, management concluded that there was no impairment of goodwill or other intangible assets
as of that date. FASB ASC 350 requires that intangible assets with finite lives be amortized over
their expected lives.
Debt and capital lease obligations of $14.3 million and $19.6 million as of December 31, 2009
and 2008, respectively, are reported at their unpaid balances as of those dates based on their
effective borrowing rates and repayment terms when originated. Management believes that the fair
values of such instruments are approximately equal to their carrying values as of those dates. Fair
value measurements of debt and capital lease obligations are based on Level 2 inputs as defined in
FASB ASC 820 (significant other observable inputs). Significant other observable inputs would
include effective borrowing rates for comparable instruments given the Company’s perceived credit
risk.
(16) WORKFORCE REDUCTION AND RESTRUCTURING
77
Table of Contents
PRGX GLOBAL, INC. AND SUBSIDIARIES
NOTES TO CONSOLIDATED FINANCIAL STATEMENTS
On September 30, 2005, the Company’s Board of Directors approved a restructuring plan and
authorized implementation of the plan. The expense restructuring plan encompassed exit activities,
including reducing the number of clients served, reducing the number of countries in which the
Company operates, reducing headcount, and terminating operating leases. In 2007, the Company
recorded additional restructuring charges for early lease termination costs of $1.3 million and
leasehold improvement impairment charges of $0.3 million under this plan.
The operational restructuring plan as originally contemplated and approved in 2005 has been
completed. The following table summarizes activity by reporting segment associated with the
workforce reduction and restructuring liabilities (in thousands) as of December 31, 2009:
| Recovery | Recovery | |||||||||||||||||||
| Audit | Audit Services | |||||||||||||||||||
| Services– | – Europe | New | Corporate | Restructuring | ||||||||||||||||
| Americas | Asia-Pacific | Services | Support | Liabilities | ||||||||||||||||
Balance as of December 31, 2006 |
$ | 3,928 | ||||||||||||||||||
2007 Accruals: |
||||||||||||||||||||
Lease termination costs |
— | — | — | 1,300 | 1,300 | |||||||||||||||
Non cash impairment charges |
— | — | — | 344 | 344 | |||||||||||||||
2007 Payments |
(2,015 | ) | ||||||||||||||||||
2007 Allocations |
872 | |||||||||||||||||||
Balance as of December 31, 2007 |
4,429 | |||||||||||||||||||
2008 Payments |
(427 | ) | ||||||||||||||||||
Balance as of December 31, 2008 |
4,002 | |||||||||||||||||||
2009 Payments |
(430 | ) | ||||||||||||||||||
Balance as of December 31, 2009 |
$ | 3,572 | ||||||||||||||||||
Allocations reflected above primarily relate to the reclassification of operating lease
liabilities which had already been recorded in accordance with FASB ASC 840-20.
(17) BUSINESS ACQUISTION
Effective July 16, 2009, the Company’s UK subsidiary acquired the business and certain assets
of First Audit Partners LLP (“FAP”), a privately-held European provider of recovery audit services
based in Cambridge, England. The business and assets of FAP have been integrated into the Company’s
European operations (included in the Recovery Audit Services – Europe/Asia-Pacific operating
segment) and expanded the growing list of major European retailers to whom the Company provides
services.
The financial terms of the FAP Asset Purchase Agreement (“APA”) are denominated in British
pounds sterling; parenthetical references to U.S. dollar equivalents below are based on the foreign
exchange rates as of the acquisition date. The APA required an initial payment to the FAP owners of
£1.0 million ($1.6 million) and requires additional deferred payments of £0.5 million ($0.8
million) in January 2010 and £0.8 million ($1.3 million) in July 2010. Additional variable
consideration (“earn-out”) may also be due based on the operating results generated by the acquired
business over the next four years. The Company recorded an additional £1.3 million ($2.1 million)
payable based on management’s estimate of the earn-out liability. The earn-out liability was
calculated based on estimated future discounted cash flows to be generated by the acquired business
over a four year period. The discount rate was determined based on specific business risk, cost of
capital and other factors. The total estimated purchase price is valued at approximately $5.8
million.
The estimated fair values of the assets acquired and purchase price is summarized as follows
(in thousands):
78
Table of Contents
PRGX GLOBAL, INC. AND SUBSIDIARIES
NOTES TO CONSOLIDATED FINANCIAL STATEMENTS
Fair values of assets acquired: |
||||
Equipment |
$ | 56 | ||
Current assets, primarily work in progress |
741 | |||
Intangible assets, primarily customer relationships |
7,830 | |||
| 8,627 | ||||
Fair value of purchase price |
5,839 | |||
Gain on bargain purchase |
$ | 2,788 | ||
Transaction costs |
(400 | ) | ||
Gain on bargain purchase, net |
$ | 2,388 | ||
The estimated fair values of intangible assets were based on management’s estimates of future
discounted cash flows to be generated by the acquired business over the estimated duration of those
cash flows. The estimated cash flows were based on management’s projection of future revenues,
cost of revenues, capital expenditures, working capital needs and tax rates. Although the cash
flow projections are based on FAP’s historical performance, combined with experience with similar
clients in the same market, there could be an unforeseen change in the business that could
negatively impact the estimated future cash flows which would negatively impact the value of the
intangible assets. Management estimated the duration of the cash flows based on historical client
retention experience and other factors specific to FAP’s clients. The discount rate was
determined based on specific business risk, cost of capital and other factors. The excess of fair
values of assets acquired over the purchase price resulted in a gain on bargain purchase of $2.8
million.
(18) QUARTERLY RESULTS
The following tables set forth certain unaudited condensed quarterly financial data for each
of the last eight quarters during the Company’s fiscal years ended December 31, 2009 and 2008. The
information has been derived from unaudited Condensed Consolidated Financial Statements that, in
the opinion of management, reflect all adjustments (consisting only of normal recurring
adjustments) necessary for a fair presentation of such quarterly information. The operating results
for any quarter are not necessarily indicative of the results to be expected for any future period.
| 2009 Quarter Ended | 2008 Quarter Ended | |||||||||||||||||||||||||||||||
| Mar. 31* | June 30* | Sept. 30* | Dec. 31 | Mar. 31 | June 30 | Sept. 30 | Dec. 31 | |||||||||||||||||||||||||
| (In thousands, except per share data) | ||||||||||||||||||||||||||||||||
Revenues |
$ | 39,252 | $ | 45,471 | $ | 45,321 | $ | 49,539 | $ | 48,263 | $ | 49,648 | $ | 49,182 | $ | 48,613 | ||||||||||||||||
Cost of revenues |
26,413 | 28,328 | 28,974 | 33,003 | 30,252 | 32,941 | 31,169 | 31,539 | ||||||||||||||||||||||||
Gross margin |
12,839 | 17,143 | 16,347 | 16,536 | 18,011 | 16,707 | 18,013 | 17,074 | ||||||||||||||||||||||||
Selling, general and
administrative expenses |
9,723 | 10,773 | 11,001 | 12,376 | 12,843 | 11,024 | 12,139 | 8,022 | ||||||||||||||||||||||||
Operating income |
3,116 | 6,370 | 5,346 | 4,160 | 5,168 | 5,683 | 5,874 | 9,052 | ||||||||||||||||||||||||
Gain on bargain purchase, net |
¾ | ¾ | 2,388 | ¾ | ¾ | ¾ | ¾ | ¾ | ||||||||||||||||||||||||
Interest expense, net |
699 | 727 | 728 | 871 | 991 | 765 | 789 | 700 | ||||||||||||||||||||||||
Earnings before income taxes |
2,417 | 5,643 | 7,006 | 3,289 | 4,177 | 4,918 | 5,085 | 8,352 | ||||||||||||||||||||||||
Income tax expense |
544 | 618 | 605 | 1,261 | 593 | 400 | 879 | 1,630 | ||||||||||||||||||||||||
Net earnings |
$ | 1,873 | $ | 5,025 | $ | 6,401 | $ | 2,028 | $ | 3,584 | $ | 4,518 | $ | 4,206 | $ | 6,722 | ||||||||||||||||
Basic earnings per common share |
$ | 0.08 | $ | 0.22 | $ | 0.27 | $ | 0.09 | $ | 0.17 | $ | 0.21 | $ | 0.19 | $ | 0.30 | ||||||||||||||||
Diluted earnings per common share |
$ | 0.08 | $ | 0.21 | $ | 0.27 | $ | 0.08 | $ | 0.16 | $ | 0.20 | $ | 0.18 | $ | 0.29 | ||||||||||||||||
79
Table of Contents
PRGX GLOBAL, INC. AND SUBSIDIARIES
NOTES TO CONSOLIDATED FINANCIAL STATEMENTS
| * | Certain reclassifications were recorded during the fourth quarter of 2009, thus, cost of revenues, selling, general and administrative expenses and gain on bargain purchase, net line items will not agree with previously filed Form 10-Q’s. Income before interest and income taxes did not change for any period previously reported. |
(19) SUBSEQUENT EVENTS
On January 19, 2010, the Company entered into a four-year revolving credit and term loan
agreement with SunTrust Bank (“SunTrust”). The SunTrust credit facility consists of a $15.0
million committed revolving credit facility and a $15.0 million term loan. For additional
information see Note 8 above.
In February 2010, the Company acquired all the issued and outstanding capital stock of Etesius
Limited, a privately-held European provider of purchasing and payables technologies and spend
analytics based in Chelmsford, United Kingdom. The Etesius acquisition is expected to allow the
Company to expand its New Services offering, more specifically, its business analytics and advisory
services businesses.
The financial terms of the Etesius Share Purchase Agreement require an initial payment to the
Etesius shareholders of $2.8 million and require additional deferred payments of $1.2 million to be
paid over four years. Additional variable consideration up to an aggregate of $3.8 million may also
be due based on the financial performance of certain of the Company’s service lines over the next
four years. The Company has not completed the valuations and accounting required under FASB ASC
805.
80
Table of Contents
| ITEM 9. | Changes in and Disagreements with Accountants on Accounting and Financial Disclosure |
None
| ITEM 9A. | Controls and Procedures |
Evaluation of Disclosure Controls and Procedures
The Company carried out an evaluation, under the supervision and with the participation of its
management, including the Chief Executive Officer and Chief Financial Officer, of the effectiveness
of the design and operation of the Company’s “disclosure controls and procedures” (as defined in
the Exchange Act Rule 13a-15(e)) as of the end of the period covered by this report. Based upon
that evaluation, the Chief Executive Officer and Chief Financial Officer concluded that the
Company’s disclosure controls and procedures are effective as of December 31, 2009.
Management’s Annual Report on Internal Control Over Financial Reporting
The Company’s management is responsible for establishing and maintaining an adequate system of
internal control over financial reporting, as defined in the Exchange Act Rule 13a-15(f). Our
internal control system is designed to provide reasonable assurance regarding the preparation and
fair presentation of financial statements for external purposes in accordance with generally
accepted accounting principles. All internal control systems, no matter how well designed, have
inherent limitations and can provide only reasonable assurance that the objectives of the internal
control system are met. Under the supervision and with the participation of the Company’s
management, including the Company’s President and Chief Executive Officer along with the Company’s
Chief Financial Officer and Treasurer, the Company conducted an assessment of the effectiveness of
internal control over financial reporting based on the framework in Internal Control — Integrated
Framework issued by the Committee of Sponsoring Organizations of the Treadway Commission. Based on
the assessment, management concluded that, as of December 31, 2009, the Company’s internal control
over financial reporting is effective.
This annual report does not include an attestation report of our registered public accounting
firm regarding internal control over financial reporting. Management’s report was not subject to
attestation by our registered public accounting firm pursuant to temporary rules of the Securities
and Exchange Commission that permit us to provide only management’s report in this annual report.
Commencing with this annual report on Form 10-K we are not deemed to be an “accelerated filer”
(as defined in Rule 12b-2 of the Securities Exchange Act of 1934, as amended) because our public
float was below the required threshold as of the last business day of our second fiscal quarter of
2009. As a result of becoming a non-accelerated filer, we are not required to provide an
attestation report of our registered public accounting firm regarding our internal control over
financial reporting. We have elected to not include such an attestation report in this annual
report, which election was approved by the Audit Committee of our Board of Directors.
There was no change in the Company’s internal control over financial reporting that occurred
during the Company’s most recently completed fiscal quarter that has materially affected, or is
reasonably likely to materially affect, the Company’s internal control over financial reporting.
Management’s report shall not be deemed filed for purposes of Section 18 of the Exchange Act.
| ITEM 9B. | Other Information. |
None.
81
Table of Contents
PART III
| ITEM 10. | Directors, Executive Officers and Corporate Governance |
Except as set forth below, the information required by Item 10 of this Form 10-K is
incorporated herein by reference to the information contained in the sections captioned “Election
of Directors”, “Information about the Board of Directors and Committees of the Board of Directors”,
“Executive Officers” and “Section 16(a) Beneficial Ownership Reporting Compliance” of our
definitive proxy statement (the “Proxy Statement”) for the 2010 Annual Meeting of Stockholders to
be filed with the Securities and Exchange Commission pursuant to Regulation 14A under the
Securities and Exchange Act of 1934, as amended (the “Exchange Act”).
We have undertaken to provide to any person without charge, upon request, a copy of our code
of ethics applicable to our chief executive officer and senior financial officers. You may obtain a
copy of this code of ethics free of charge from our website, www.prgx.com.
| ITEM 11. | Executive Compensation |
The information required by Item 11 of this Form 10-K is incorporated by reference to the
information contained in the sections captioned “Executive Compensation”, “Information about the
Board of Directors and Committees of the Board of Directors”, and “Report of the Audit Committee”
of the Proxy Statement.
82
Table of Contents
| ITEM 12. | Security Ownership of Certain Beneficial Owners and Management and Related Stockholder Matters |
Except as set forth below, the information required by Item 12 of this Form 10-K is
incorporated by reference to the information contained in the section captioned “Ownership of
Directors, Principal Shareholders and Certain Executive Officers” of the Proxy Statement.
Securities Authorized for Issuance Under Equity Compensation Plans
The Company currently has three stock-based compensation plans under which awards have been
granted: (1) the Stock Incentive Plan (“SIP”), (2) the 2006 Management Incentive Plan (“2006 MIP”),
and (3) the 2008 Equity Incentive Plan (“2008 EIP”). The SIP, as amended, authorized the grant of
options or other stock-based awards, with respect to up to 1,237,500 shares of the Company’s common
stock to key employees, directors, consultants and advisors. The SIP expired in June 2008.
At the annual meeting of shareholders held on August 11, 2006, the shareholders of the Company
approved a proposal granting authorization to issue up to 2.1 million shares of the Company’s
common stock under the 2006 MIP. At Performance Unit settlement dates (which vary), participants
are paid in common stock and in cash. Participants will receive a number of shares of Company
common stock equal to 60% of the number of Performance Units being paid out, plus a cash payment
equal to 40% of the fair market value of that number of shares of common stock equal to the number
of Performance Units being paid out. The awards were 50% vested at the award date and the remainder
of the awards vests ratably over approximately the following eighteen months. The awards contain
certain anti-dilution and change of control provisions. Also, the number of Performance Units
awarded were automatically adjusted on a pro-rata basis upon the conversion into common stock of
any of the Company’s senior convertible notes or Series A convertible preferred stock.
During the first quarter of 2008, the Board of Directors of the Company adopted the 2008 EIP,
which was approved by the shareholders at the annual meeting of the shareholders on May 29, 2008.
The 2008 EIP authorizes the grant of incentive and non-qualified stock options, stock appreciation
rights, restricted stock, restricted stock units and other incentive awards. Two million shares of
the Company’s common stock have been reserved for issuance under the 2008 EIP pursuant to award
grants to key employees, directors and service providers.
The following table presents certain information with respect to compensation plans under
which equity securities of the registrant were authorized for issuance as of December 31, 2009:
| Weighted-average | ||||||||||||
| Number of securities to be | exercise | Number of securities remaining | ||||||||||
| issued | price of outstanding | available for future issuance under | ||||||||||
| upon exercise of outstanding | options, warrants and | equity compensation plans (excluding | ||||||||||
| Plan category | options, warrants and rights | rights | securities reflected in column (a)) | |||||||||
| (a) | (b) | (c) | ||||||||||
Equity compensation plans
approved by security
holders: |
||||||||||||
Stock Incentive Plan |
677,149 | $ | 15.86 | — | ||||||||
2008 Equity Incentive Plan |
1,653,400 | 4.99 | 237,833 | |||||||||
Share awards (1) |
161,391 | — | 77,794 | |||||||||
Equity compensation plans
not approved by security
holders (2) |
640,741 | 3.57 | — | |||||||||
Total |
3,132,681 | $ | 8.98 | 315,627 | ||||||||
| (1) | Amounts presented represent 60% of Performance Unit awards under the Company’s 2006 Management Incentive Plan. Performance Unit awards are required to be settled 60% in common stock and 40% in cash. | |
| (2) | Inducement Option Grant — during the first quarter of 2009, in connection with his joining the Company as its President and Chief Executive Officer, the Company made inducement grants outside its existing stock-based compensation plans to Mr. Romil Bahl. Mr. Bahl received |
83
Table of Contents
| an option to purchase 296,296 shares of the common stock of the Company and nonvested stock awards (restricted stock) representing 344,445 shares of the Company’s common stock. |
| ITEM 13. | Certain Relationships and Related Transactions, and Director Independence |
The information required by Item 13 of this Form 10-K is incorporated by reference to the
information contained in the sections captioned “Information about the Board of Directors and
Committees of the Board of Directors”, “Executive Compensation - Employment Agreements” and
“Certain Transactions” of the Proxy Statement.
| ITEM 14. | Principal Accounting Fees and Services |
The information required by Item 14 of this Form 10-K is incorporated by reference to the
information contained in the sections captioned “Principal Accountants’ Fees and Services” of the
Proxy Statement.
84
Table of Contents
PART IV
| ITEM 15. | Exhibits, Financial Statement Schedules |
(a) Documents filed as part of the report
(1) Consolidated Financial Statements:
For the following consolidated financial information included herein, see Index on Page 42.
| Page | ||||
Report of Independent Registered Public Accounting Firm |
43 | |||
Consolidated Statements of Operations for the Years ended December
31, 2009, 2008 and 2007 |
44 | |||
Consolidated Balance Sheets as of December 31, 2009 and 2008 |
45 | |||
Consolidated Statements of Shareholders’ Equity (Deficit) for the
Years ended December 31, 2009, 2008 and 2007 |
46 | |||
Consolidated Statements of Cash Flows for the Years ended December
31, 2009, 2008 and 2007 |
47 | |||
Notes to Consolidated Financial Statements |
48 | |||
(2) Financial Statement Schedule:
Schedule II – Valuation and Qualifying Accounts |
S-1 |
(3) Exhibits
| Exhibit | ||
| Number | Description | |
2.1
|
Share Purchase Agreement dated February 25, 2010 by and between PRGX U.K. Limited and Etesius Limited. | |
3.1
|
Restated Articles of Incorporation of the Registrant, as amended and corrected through August 11, 2006 (restated solely for the purpose of filing with the Commission) (incorporated by reference to Exhibit 3.1 to the Registrant’s Report on Form 8-K filed on August 17, 2006). | |
3.1.1
|
Articles of Amendment of the Registrant dated January 20, 2010 (incorporated by reference to Exhibit 3.1 to the Registrant’s Form 8-K filed on January 25, 2010). | |
3.2
|
Amended and Restated Bylaws of the Registrant (incorporated by reference to Exhibit 3.1 to the Registrant’s Form 8-K filed on December 11, 2007). | |
4.1
|
Specimen Common Stock Certificate (incorporated by reference to Exhibit 4.1 to the Registrant’s Form 10-K for the year ended December 31, 2001). | |
4.2
|
See Restated Articles of Incorporation and Bylaws of the Registrant, filed as Exhibits 3.1 and 3.2, respectively. | |
4.3
|
Shareholder Protection Rights Agreement, dated as of August 9, 2000, between the Registrant and Rights Agent, effective May 1, 2002 (incorporated by reference to Exhibit 4.3 to the Registrant’s Form 10-Q for the quarterly period ended June 30, 2002). | |
4.3.1
|
First Amendment to Shareholder Protection Rights Agreement, dated as of March 12, 2002, between the Registrant and Rights Agent (incorporated by reference to Exhibit 4.3 to the Registrant’s Form 10-Q for the quarterly period ended September 30, 2002). | |
4.3.2
|
Second Amendment to Shareholder Protection Rights Agreement, dated as of August 16, 2002, between the Registrant and Rights Agent (incorporated by reference to Exhibit 4.3 to the Registrant’s Form 10-Q for the quarterly period ended September 30, 2002). | |
4.3.3
|
Third Amendment to Shareholder Protection Rights Agreement, dated as of November 7, 2006, between the Registrant and Rights Agent (incorporated by reference to Exhibit 4.1 to the Registrant’s Form 8-K filed on November 14, 2005). |
85
Table of Contents
| Exhibit | ||
| Number | Description | |
4.3.4
|
Fourth Amendment to Shareholder Protection Rights Agreement, dated as of November 14, 2006, between the Registrant and Rights Agent (incorporated by reference to Exhibit 4.1 to the Registrant’s Form 8-K filed on November 30, 2005). | |
4.3.5
|
Fifth Amendment to Shareholder Protection Rights Agreement, dated as of March 9, 2006, between the Registrant and Rights Agent (incorporated by reference to Exhibit 4.9 to the Registrant’s Form 10-K for the year ended December 31, 2005). | |
4.3.6
|
Sixth Amendment to Shareholder Protection Rights Agreement, dated as of September 17, 2007, between the Registrant and Rights Agent (incorporated by reference to Exhibit 4.1 to the Registrant’s Form 8-K filed on September 21, 2007). | |
+10.1
|
1996 Stock Option Plan, dated as of January 25, 1996, together with Forms of Non-qualified Stock Option Agreement (incorporated by reference to Exhibit 10.2 to the Registrant’s March 26, 1996 Registration Statement No. 333-1086 on Form S-1). | |
+10.2
|
Form of Indemnification Agreement between the Registrant and Directors and certain officers, including named executive officers, of the Registrant (incorporated by reference to Exhibit 10.4 to the Registrant’s Form 10-K for the year ended December 31, 2003). | |
+10.3
|
Form of the Registrant’s Non-Qualified Stock Option Agreement (incorporated by reference to Exhibit 10.2 to the Registrant’s Form 10-Q for the quarterly period ended June 30, 2001). | |
10.4
|
Noncompetition, Nonsolicitation and Confidentiality Agreement among The Profit Recovery Group International, Inc., Howard Schultz & Associates International, Inc., Howard Schultz, Andrew Schultz and certain trusts, dated January 24, 2002 (incorporated by reference to Exhibit 10.34 to the Registrant’s Form 10-K for the year ended December 31, 2001). | |
10.5
|
Office Lease Agreement between Galleria 600, LLC and PRG-Schultz International, Inc. (incorporated by reference to Exhibit 10.43 to the Registrant’s Form 10-K for the year ended December 31, 2001). | |
10.5.1
|
First Amendment to Office Lease Agreement between Galleria 600, LLC and PRG-Schultz International, Inc. (incorporated by reference to Exhibit 10.65 to the Registrant’s Form 10-K for the year ended December 31, 2002). | |
+10. 6
|
Amended Stock Incentive Plan (incorporated by reference to Exhibit 10.3 to the Registrant’s Form 10-Q for the quarterly period ended June 30, 2002). | |
+10.7
|
Amended HSA-Texas Stock Option Plan (incorporated by reference to Exhibit 10.4 to the Registrant’s Form 10-Q for the quarterly period ended June 30, 2002). | |
10.8
|
Investor Rights Agreement, dated as of August 27, 2002, among PRG-Schultz International, Inc., Berkshire Fund V, LP, Berkshire Investors LLC and Blum Strategic Partners II, L.P. (incorporated by reference to Exhibit 10.7 to the Registrant’s Form 10-Q for the quarterly period ended September 30, 2002). | |
10.8.1
|
Amendment to Investor Rights Agreement dated March 28, 2006 (incorporated by reference to Exhibit 10.8 to the Registrant’s Form 10-Q for the quarter ended March 31, 2006). | |
+10.9
|
Form of Non-employee Director Option Agreement (incorporated by reference to Exhibit 99.1 to the Registrant’s Report on Form 8-K filed on February 11, 2005). | |
+10.10
|
Amended and Restated Employment Agreement between Registrant and Mr. James B. McCurry, dated as of December 17, 2007 (incorporated by reference to Exhibit 10.1 to the Registrant’s Form 8-K filed on December 19, 2007). | |
+10.10.1
|
Release Agreement dated December 1, 2008 between the Registrant and Mr. McCurry (incorporated by reference to Exhibit 10.1 to the Registrant’s Form 8-K filed on December 4, 2008). | |
+10.11
|
Separation and Release Agreement between Registrant and Mr. John M. Cook, dated as of August 2, 2005 (incorporated by reference to Exhibit 99.1 to Registrant’s Form 8-K filed on August 8, 2005). | |
+10.11.1
|
First Amendment to Separation and Release Agreement with John M. Cook dated March 16, 2006 (incorporated by reference to Exhibit 99.1 to the registrant’s Form 8-K filed on March 22, 2006). | |
+10.12
|
Separation and Release Agreement between Registrant and Mr. John M. Toma, dated as of August 2, 2005 (incorporated by reference to Exhibit 99.2 to Registrant’s Form 8-K filed on August 8, 2005). |
86
Table of Contents
| Exhibit | ||
| Number | Description | |
+10.12.1
|
First Amendment to Separation and Release Agreement with John M. Toma dated March 16, 2006 (incorporated by reference to Exhibit 99.2 to the registrant’s Form 8-K filed on March 22, 2006). | |
+10.13
|
Employment Agreement between the Registrant and Peter Limeri entered into on November 28, 2008 (incorporated by reference to Exhibit 10.2 to the Registrant’s Form 8-K filed on December 4, 2008). | |
10.14
|
Amended and Restated Standstill Agreement, dated as of July 16, 2007, between Registrant and Blum Capital Partners, L.P. and certain of its affiliates (incorporated by reference to Exhibit 10.1 to the Registrant’s Form 8-K filed on July 16, 2007). | |
10.15
|
Restructuring Support Agreement dated December 23, 2005 (incorporated by reference to Exhibit 10.66 to the Registrant’s Form 10-K for the year ended December 31, 2005). | |
10.15.1
|
Amended and Restated Restructuring Support Agreement (incorporated by reference to Exhibit 10.1 to the Registrant’s Form 10-Q for the quarter ended March 31, 2006). | |
+10.16
|
Employment Agreement between the Registrant and Larry Robinson dated November 28, 2008 (incorporated by reference to Exhibit 10.3 to the Registrant’s Form 8-K filed on December 4, 2008). | |
+10.17
|
Employment Agreement between the Registrant and Brad Roos dated November 28, 2008 (incorporated by reference to Exhibit 10.4 to the Registrant’s Form 8-K filed on December 4, 2008). | |
+10.18
|
Expatriate Assignment Agreement with Brad Roos (incorporated by reference to Exhibit 10.1 to the Registrant’s Form 8-K filed on February 14, 2008). | |
+10.18.1
|
Separation Agreement between the Registrant and Brad Roos dated May 29, 2009 (incorporated by reference to Exhibit 10.2 to the Registrant’s Form 8-K filed on June 1, 2009). | |
10.19
|
Registration Rights Agreement dated March 17, 2006 (incorporated by reference to Exhibit 10.2 to the Registrant’s Form 10-Q for the quarter ended March 31, 2006). | |
10.20
|
Amended and Restated Financing Agreement dated September 17, 2007 (incorporated by reference to Exhibit 10.1 to the Registrant’s Form 8-K filed on September 21, 2007). | |
10.20.1
|
Amendment Number One to Amended and Restated Financing Agreement (incorporated by reference to Exhibit 10.1 to the Registrant’s Form 8-K filed on April 3, 2008). | |
10.20.2
|
Amendment Number Two to Amended and Restated Financing Agreement (incorporated by reference to Exhibit 10.1 to the Registrant’s Form 8-K filed on April 3, 2009) | |
10.21
|
Security Agreement dated March 17, 2006 (incorporated by reference to Exhibit 10.4 to the Registrant’s Form 10-Q for the quarter ended March 31, 2006). | |
+10.22
|
Amended and Restated 2006 Management Incentive Plan (incorporated by reference to Exhibit 10.1 to the Registrant’s Form 10-Q for the quarter ended September 30, 2006). | |
+10.22.1
|
Form of Performance Unit Agreement under 2006 Amended and Restated Management Incentive Plan (incorporated by reference to Exhibit 10.2 to the Registrant’s Form 10-Q for the quarter ended September 30, 2006). | |
+10.22.2
|
Form of Amendment to Performance Unit Agreement (incorporated by reference to Exhibit 10.1 to the Registrant’s Form 8-K filed on December 11, 2007). | |
+10.23
|
Employment Agreement with Norman Lee White dated June 19, 2006 (incorporated by reference to Exhibit 10.1 to the Registrant’s Report on Form 8-K filed on June 20, 2006). | |
+10.23.1
|
Separation Agreement dated November 30, 2008 between PRG-Schultz USA and Mr. White (incorporated by reference to Exhibit 10.5 to the Registrant’s Form 8-K filed on December 4, 2008). | |
+10.24
|
Form of Non-Employee Director Stock Option Agreement (incorporated by reference to Exhibit 10.1 to the Registrant’s Report on Form 8-K filed on September 18, 2007). | |
+*10.25
|
2008 PRG-Schultz Performance Bonus Plan (incorporated by reference to Exhibit 10.1 to the Registrant’s Report on Form 10-Q for the quarter ended March 31, 2008). | |
+10.26
|
2009 PRG-Schultz Performance Bonus Plan | |
+10.27
|
PRG-Schultz International, Inc. 2008 Equity Incentive Plan (incorporated by reference to Exhibit 10.1 to the Registrant’s Form 8-K filed on June 4, 2008). |
87
Table of Contents
| Exhibit | ||
| Number | Description | |
+10.27.1
|
Form of Restricted Stock Agreement for Non-Employee Directors (incorporated by reference to Exhibit 10.2 to the Registrant’s Form 8-K filed on June 4, 2008). | |
+10.27.2
|
Form of Non-Qualified Stock Option Agreement for Non-Employee Directors (incorporated by reference to Exhibit 10.3 to the Registrant’s Form 8-K filed on June 4, 2008). | |
+10.28
|
Employment Agreement dated January 8, 2009, by and between Mr. Romil Bahl and the Registrant (incorporated by reference to Exhibit 10.1 to the Registrant’s Report on Form 8-K filed on January 14, 2009). | |
+10.28.1
|
Form of Nonqualified Stock Option Agreement (incorporated by reference to Exhibit 10.2 to the Registrant’s Report on Form 8-K filed on January 14, 2009). | |
+10.28.2
|
Form of Restricted Stock Agreement (incorporated by reference to Exhibit 10.3 to the Registrant’s Report on Form 8-K filed on January 14, 2009). | |
+10.29
|
Employment Agreement dated May 26, 2009 by and between the Registrant and Robert B. Lee (incorporated by reference to Exhibit 10.1 to the Registrant’s Form 8-K filed on June 1, 2009). | |
10.30
|
Revolving Credit and Term Loan Agreement dated as of January 19, 2010, by and among PRGX Global, Inc. (formerly PRG-Schultz International, Inc), and PRGX USA, Inc. (formerly PRG-Schultz USA, Inc.), as co-borrowers, the lenders from time to time party thereto, SunTrust Bank, as issuing bank, and SunTrust Bank, as administrative agent (incorporated by reference to Exhibit 10.1 to the Registrant’s Form 8-K filed on January 25, 2010). | |
10.30.1
|
Subsidiary Guaranty Agreement dated as of January 19, 2010 by and among PRGX Global, Inc. (formerly PRG-Schultz International, Inc), and PRGX USA, Inc. (formerly PRG-Schultz USA, Inc.), as borrowers, each of the subsidiaries of PRGX Global, Inc. listed on schedule I thereto, as guarantors, and SunTrust Bank, as administrative agent (incorporated by reference to Exhibit 10.2 to the Registrant’s Form 8-K filed on January 25, 2010). | |
10.30.2
|
Security Agreement dated January 19, 2010 among PRGX Global, Inc. (formerly PRG-Schultz International, Inc), PRGX USA, Inc. (formerly PRG-Schultz USA, Inc.), and the other direct and indirect subsidiaries of PRGX Global, Inc. signatory thereto, as grantors, in favor of SunTrust Bank, as administrative agent (incorporated by reference to Exhibit 10.3 to the Registrant’s Form 8-K filed on January 25, 2010). | |
10.30.3
|
Equity Pledge Agreement dated as of January 19, 2010, made by PRGX Global, Inc. (formerly PRG-Schultz International, Inc), PRGX USA, Inc. (formerly PRG-Schultz USA, Inc.), and the other direct and indirect subsidiaries of PRGX Global, Inc. signatory thereto, as grantors, in favor of SunTrust Bank, as administrative agent (incorporated by reference to Exhibit 10.4 to the Registrant’s Form 8-K filed on January 25, 2010). | |
+10.31
|
Employment Agreement between the Registrant and Victor A. Allums dated November 28, 2008 | |
+10.32
|
Employment Agreement between the Registrant and Jennifer G. Moore dated November 28, 2008 | |
+10.32.1
|
Separation Agreement between the Registrant and Jennifer G. Moore dated October 26, 2009. | |
+10.33
|
Employment Agreement between the Registrant and James Shand dated March 12, 2009. | |
14.1
|
Code of Ethics for Senior Financial Officers (incorporated by reference to Exhibit 14.1 to the Registrant’s Form 10-K for the year ended December 31, 2003). | |
21.1
|
Subsidiaries of the Registrant. | |
23.1
|
Consent of BDO Seidman, LLP | |
31.1
|
Certification of the Chief Executive Officer, pursuant to Rule 13a-14(a) or 15d-14(a), for the year ended December 31, 2009. | |
31.2
|
Certification of the Chief Financial Officer, pursuant to Rule 13a-14(a) or 15d-14(a), for the year ended December 31, 2009. | |
32.1
|
Certification of the Chief Executive Officer and Chief Financial Officer, pursuant to 18 U.S.C. Section 1350, for the year ended December 31, 2009. |
88
Table of Contents
| * | Confidential treatment, pursuant to 17 CFR §§ 200.80 and 240.24b-2, has been granted regarding certain portions of the indicated Exhibit, which portions have been filed separately with the Commission. | |
| + | Designates management contract or compensatory plan or arrangement. |
89
Table of Contents
SIGNATURES
Pursuant to the requirements of Section 13 or 15(d) of the Securities Exchange Act of 1934,
the registrant has duly caused this report to be signed on its behalf by the undersigned, thereunto
duly authorized.
| PRGX GLOBAL, INC. |
||||
| By: | /s/ ROMIL BAHL | |||
| Romil Bahl | ||||
| President, Chief Executive Officer, Director (Principal Executive Officer) |
||||
| Date: March 29, 2010 | ||||
Pursuant to the requirements of the Securities Exchange Act of 1934, this report has been
signed below by the following persons on behalf of the registrant and in the capacities and on the
dates indicated.
| Signature | Title | Date | ||
/s/ ROMIL BAHL
|
President, Chief Executive Officer and Director | March 29, 2010 | ||
| (Principal Executive Officer) | ||||
/s/ ROBERT B. LEE
|
Chief Financial Officer and Treasurer | March 29, 2010 | ||
| (Principal Financial Officer) | ||||
/s/ LEE GENTRY
|
Controller | March 29, 2010 | ||
| (Principal Accounting Officer) | ||||
/s/ DAVID A. COLE
|
Director | March 29, 2010 | ||
/s/ PATRICK G. DILLS
|
Chairman of the Board | March 29, 2010 | ||
/s/ N. COLIN LIND
|
Director | March 29, 2010 | ||
/s/ PHILIP J. MAZZILLI, JR.
|
Director | March 29, 2010 | ||
/s/ STEVEN P. ROSENBERG
|
Director | March 29, 2010 | ||
90
Table of Contents
SCHEDULE II – VALUATION AND QUALIFYING ACCOUNTS
FOR THE YEARS ENDED DECEMBER 31, 2009, 2008 AND 2007
(In thousands)
FOR THE YEARS ENDED DECEMBER 31, 2009, 2008 AND 2007
(In thousands)
| Additions | Deductions | |||||||||||||||
| Charge | ||||||||||||||||
| Balance at | (Credit) to | Credit to | Balance at | |||||||||||||
| Beginning | Costs and | the respective | End of | |||||||||||||
| Description | of Year | Expenses | receivable (1) | Year | ||||||||||||
2009 |
||||||||||||||||
Allowance for doubtful accounts receivable |
$ | 921 | 137 | (26 | ) | $ | 1,032 | |||||||||
Allowance for doubtful employee advances
and miscellaneous receivables |
$ | 311 | 235 | (195 | ) | $ | 351 | |||||||||
Deferred tax valuation allowance |
$ | 64,307 | (6,003 | ) | — | $ | 58,304 | |||||||||
2008 |
||||||||||||||||
Allowance for doubtful accounts receivable |
$ | 826 | 319 | (224 | ) | $ | 921 | |||||||||
Allowance for doubtful employee advances
and miscellaneous receivables |
$ | 1,831 | — | (1,520 | ) | $ | 311 | |||||||||
Deferred tax valuation allowance |
$ | 79,805 | (15,498 | ) | — | $ | 64,307 | |||||||||
2007 |
||||||||||||||||
Allowance for doubtful accounts receivable |
$ | 1,795 | (961 | ) | (8 | ) | $ | 826 | ||||||||
Allowance for doubtful employee advances
and miscellaneous receivables |
$ | 1,306 | 525 | — | $ | 1,831 | ||||||||||
Deferred tax valuation allowance |
$ | 79,240 | 565 | — | $ | 79,805 | ||||||||||
| (1) | Write-offs, net of recoveries |
S-1