Attached files
| file | filename |
|---|---|
| 8-K - FORM 8-K - KAR Auction Services, Inc. | d8k.htm |
 Barclay’s 2010 High Yield Bond and Loan Conference March 25, 2010 KAR Auction Services Exhibit 99.1 |
 2 Forward-Looking Statements This presentation includes forward-looking statements as that term is defined in the Private Securities Litigation Reform Act of 1995. Such forward looking statements are subject to certain risks, trends, and uncertainties that could cause actual results to differ materially from those projected, expressed or implied by such forward-looking statements. Many of these risk factors are outside of the company’s
control, and as such, they involve risks which are not currently known to the company that could cause actual results to differ materially from forecasted results. Factors that could cause or contribute to such differences include those matters disclosed in the company’s Securities and Exchange Commission filings. The forward-looking statements in this document are made as of the date hereof and the company does not undertake to update its forward-looking statements. |
 3 Non-GAAP Financial Measures EBITDA, Adjusted EBITDA and percentages or calculations using these measures, as presented herein, are supplemental measures of the company's performance that are not required by, or presented in accordance with, generally accepted accounting principles in the United States, or GAAP. They are not measurements of the company's financial performance under GAAP and should not be considered as substitutes for net income (loss) or any other performance measures derived in accordance with GAAP or as substitutes for cash flow from operating activities as measures of the company's liquidity. See Appendix for additional information and a reconciliation of these non-GAAP measures to GAAP net income (loss). |
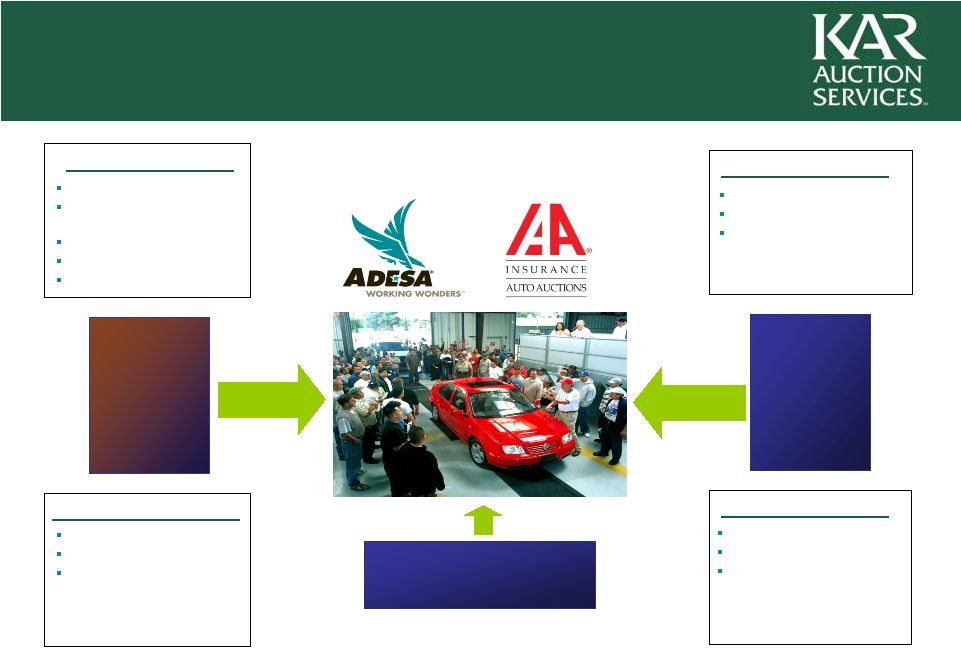
 4 2009 Revenue: $1,730mm 2009 Adj. EBITDA: $426mm¹ ~3.3mm Vehicles Sold in
2009 Top 2 whole car auction position 22% market share 62 North American locations 88 loan origination offices 2009 Revenue: $553mm 2009 Adj. EBITDA: $147mm Top 2 salvage vehicle auction position 35% market share 153 North American locations Leading Provider of Vehicle Auction Services in North America 1 Includes corporate charges of $56mm 2 Includes AFC revenue of $88mm and adjusted EBITDA of $49mm 2009 Revenue²: $1,177mm 2009 Adj. EBITDA²: $335mm |
 5 Leading provider of vehicle auction & related services in North America Highly concentrated industries with significant barriers to entry Comprehensive integrated services offering across entire vehicle remarketing spectrum Longstanding and diverse customer and buyer base Track record of increasing market share and revenue per vehicle Differentiated physical and internet presence in whole car and salvage auction markets Strong margins & low capital intensity generate significant cash flow Investment Highlights |
 6 Brian Clingen Chairman 9 Jim Hallett CEO, KAR Auction Services 33 Tom Caruso President & CEO, ADESA 29 Tom O’Brien President & CEO, IAAI 17 Don Gottwald President & CEO, AFC 22 John Nordin EVP & CIO 6 Eric Loughmiller EVP & CFO 4 Becca Polak EVP, General Counsel & Secretary 5 Benjamin Skuy EVP, International/Strategic Initiatives 10 David Vignes EVP, Enterprise Optimization 3 Installed new management team Track record of organic and acquisitive market share expansion Improved gross margin and reduced corporate overhead Successful integration of ADESA Impact into IAAI Upgraded IT systems and launched numerous internet growth initiatives Deleveraged balance sheet Key Achievements Years in Name Position Industry Strong Management Team with Track Record of Driving Value |
 7 Vehicle Remarketing Life Cycle New Vehicle Registrations 10-15 Million units Removed from Operation 12 Million units Vehicles in Operation 270 Million units Salvage Auctions 3 - 4 Million units Dealer Trades 11 Million units Wholesalers & Virtual Auctions 7 Million units Consumer -to-Consumer 12 Million units KAR’s Core Markets Used Vehicle (Whole Car ) Auctions 9 Million units Used Vehicle Transactions in North America ~40 Million units Source: Used vehicle (whole car) value per National Auto Auction Association. New vehicle
registrations, vehicles in operation and vehicles removed from operation per R.L. Polk
& Co. Used vehicle transactions and consumer to consumer transactions per CNW Marketing for the U.S. and DesRosiers Automotive Consultants for Canada. All other numbers based on company estimates. Estimates based on 2008 data; actual numbers may
differ. |
 8 Value-Added Ancillary Services Seller Whole Car Consignors Dealers OEMs and their Captive Finance Arms Commercial Fleet Customers Financial Institutions Rental Car Companies Salvage Vehicle Consignors Insurance Companies Charities Whole Car Providers Whole Car Buyers Salvage Buyers Buyer Auction Fee Franchised Dealers Independent Dealers Wholesale Dealers Dismantlers Rebuilders & Resellers Recyclers Vehicle Flow – Whole Car and Salvage Markets Auction Fee |
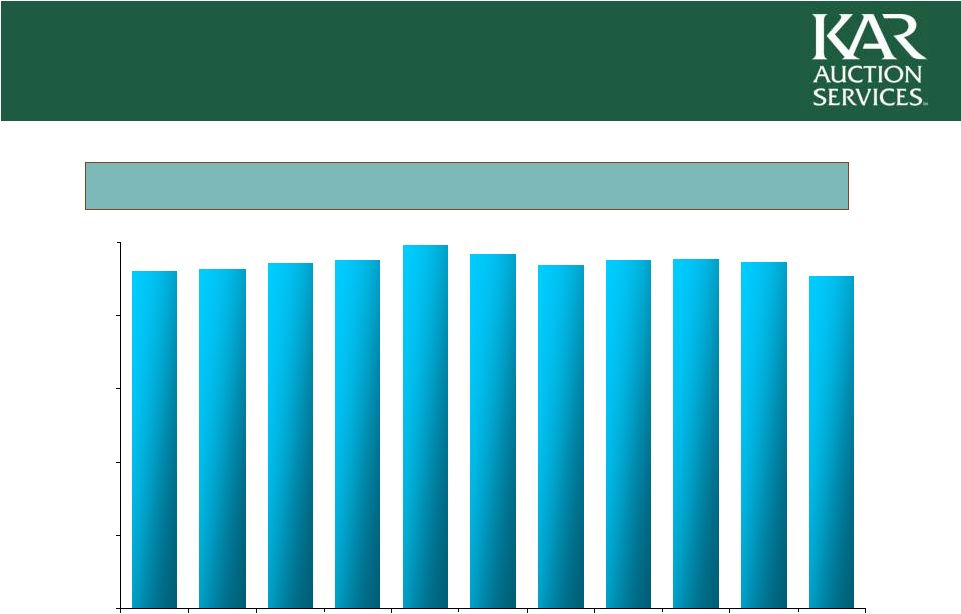 9.1 9.5 9.5 9.5 9.4 9.7 10.0 9.5 9.5 9.3 9.2 0.0 2.0 4.0 6.0 8.0 10.0 1999 2000 2001 2002 2003 2004 2005 2006 2007 2008 2009 North America Whole Car Auction Volume Stability (mm) Stable Whole Car Auction Industry Source: National Auto Auction Association and KAR Auction Services, Inc.
estimates 9 |
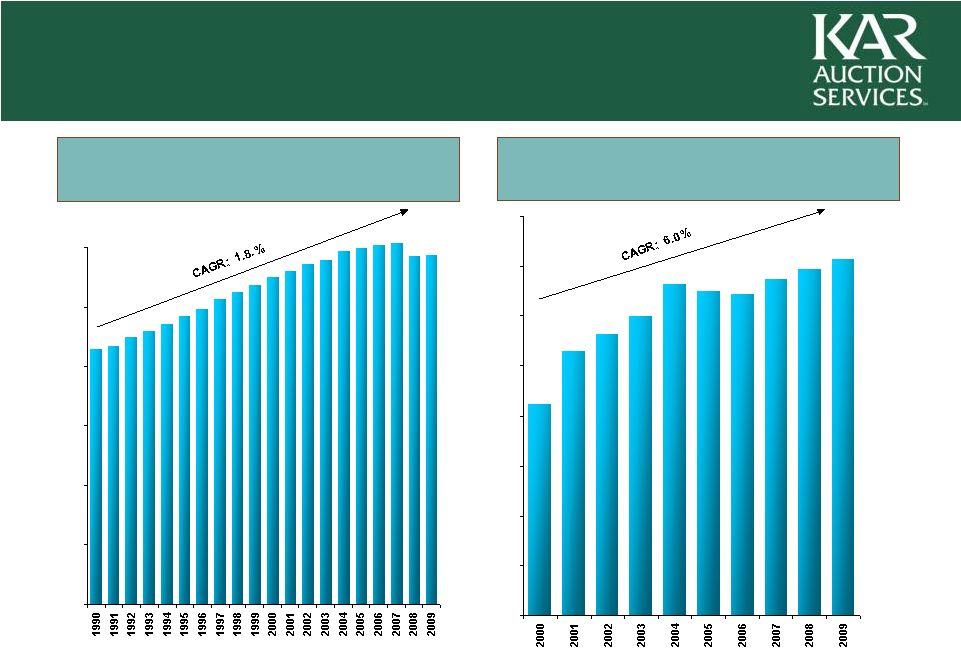 10 14.3% 13.9% 13.5% 8.5% 10.6% 11.3% 12.0% 13.3% 13.0% 12.9% 0.0 2.0 4.0 6.0 8.0 10.0 12.0 14.0 16.0 2.9 2.8 2.4 2.3 2.2 2.2 2.1 2.4 2.5 2.6 2.6 2.7 2.7 2.9 3.0 3.0 3.0 3.0 2.9 2.9 0.0 0.5 1.0 1.5 2.0 2.5 3.0 Driven by Growth in Miles Driven… (mm) ..And Increasing Proportion of “Total Loss” Insurance Claims Consistently Growing U.S. Salvage Industry Source: US DOT Federal Highway Administration, CCC Information Services.
|
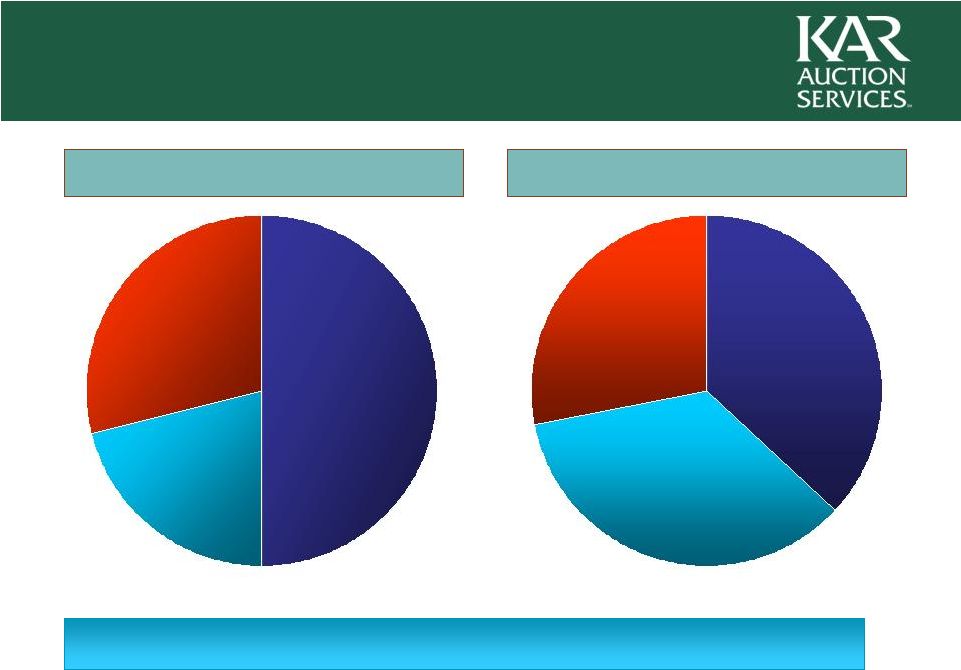 11 Whole Car Market Share Salvage Market Share Manheim Other ADESA Leader in Whole Car and Salvage Auction Markets No other competitor holds more than 3% whole car market share or 10% salvage market share Copart IAAI Other Source: Market share based on company estimates of vehicles sold as of 2009 year
end. Manheim market share includes sales outside of North America. |
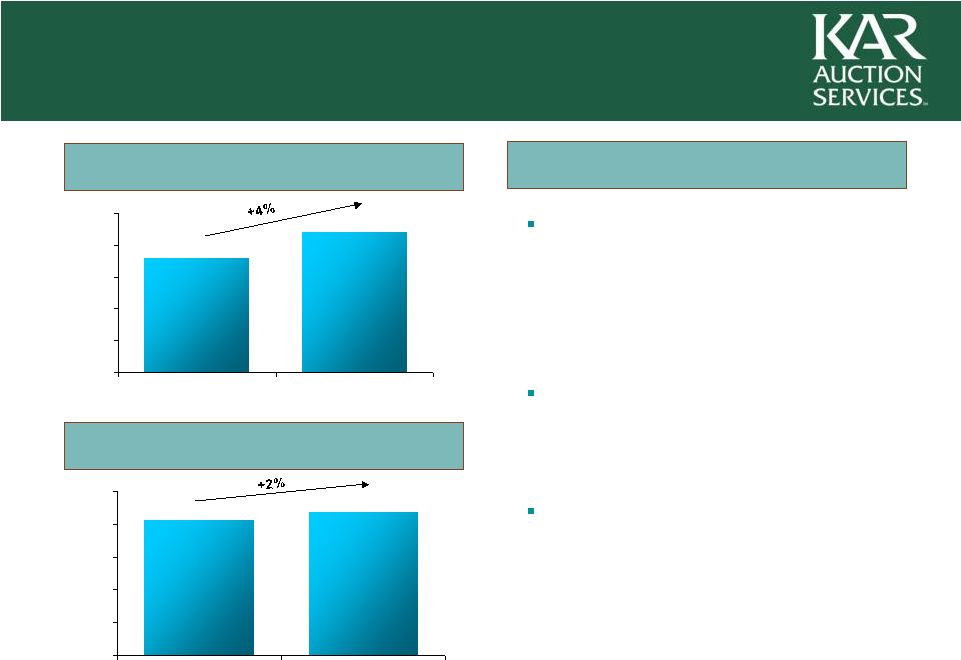 12 Successful sales focus in whole car business • Institutional • Dealer • e-Business Providing best venue for all remarketers • Co-located facilities • e-Business Selected strategic acquisitions, greenfields and relocations • 21 sites acquired • 9 greenfield developments • 3 relocations 18% 22% 0% 5% 10% 15% 20% 25% 2006 2009 33% 35% 0% 8% 16% 24% 32% 40% 2006 2009 Track Record of Market Share Expansion Source: Market share numbers are based on the number of vehicles sold by the
Company in 2006 and 2009 and Company estimates of the number of vehicles
sold by competitors during the same periods. Actual numbers may differ. Salvage Market Share Whole Car Market Share Drivers of Growth |
 13 Differentiated Physical and Internet Presence in Whole Car and Salvage Only company with significant presence in both internet and physical and whole car and salvage markets KAR’s unique presence in whole car and salvage markets affords customers
channel optimization opportunities Internet, physical and hybrid model optimizes results for customers The majority of IAAI salvage vehicles receive internet bids, but less than half of salvage vehicles are sold online Unique presence maximizes proceeds to customer at auction |
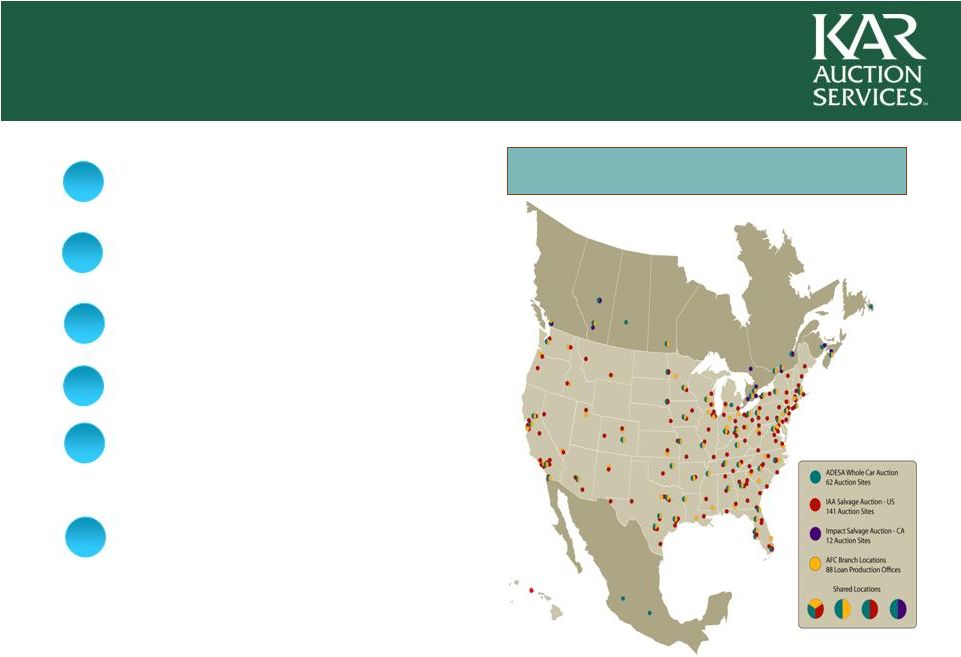 14 Large, established and diverse network of buyers and sellers Local market knowledge and relationships Significant IT and related infrastructure investment Coast to coast North American presence Expansive tracts of land with significant investment in facilities and land improvements Regulatory requirements, including licensing, zoning and use permits Significant Barriers to Entry 1 2 3 4 5 6 KAR’s 215 Auction Locations |
 15 The Company does business with every major supplier of whole car and salvage vehicles Average relationship of over ten years with top ten vehicle suppliers Largest customer less than 4% of 2009 consolidated revenue Over 150,000 registered whole car and salvage buyers from over 100 countries Vehicle Manufacturers & Finance Companies Banks Rental Car Companies Established Relationships with Vehicle Providers & Buyers Insurance Companies Other Salvage Providers |
 16 Recovery administration (PAR) Towing / Transportation Inspections and Condition Reports (AutoVin) Marshalling e-Business Secured storage Inspections Body Mechanical Detailing Glass, Keys, PDR (Dent Demon) Titling e-Business Floorplan financing (AFC) Post-Sale Inspections Reporting Collection and funds transfer Transportation Lot Audits (AutoVin) e-Business Comprehensive Services Offering Maximizes Revenue Over $500mm of non-auction fee services revenue in 2009 Before Auction Site At Auction Site After Auction |
 17 17 Provides competitive advantage by facilitating sales at whole car auctions Compliments KAR’s comprehensive service offerings Enables the company to establish relationships with new vehicle buyers Profitable, high margin business • Short duration loans • Fee driven business (2/3 of net revenue derived from fees) • Adj. EBITDA margin of 67.5% in fourth quarter 2009 Utilize in house subsidiaries to perform lot checks, repossess vehicles and issue condition reports • Retain title to vehicle New management team, updated credit process and focused pricing strategy implemented in early 2009 AFC Business a Key Competitive Advantage with Good Returns
|
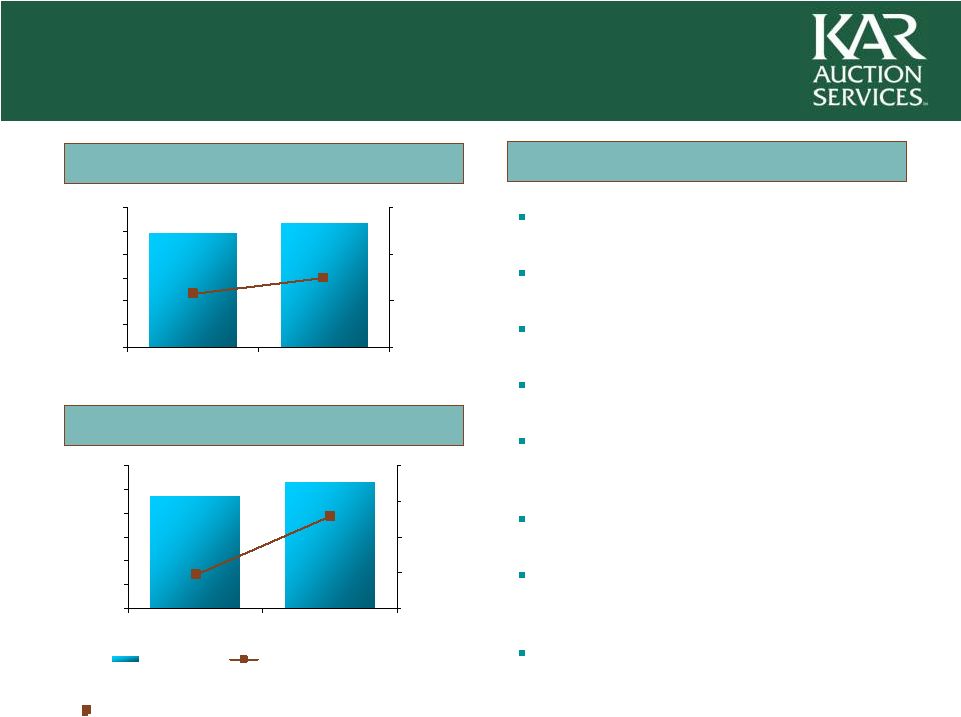 18 Whole Car Adj. EBITDA Margin Key Drivers of Improvement Salvage Adj. EBITDA Margin Implementation of best
practices at whole car (PRIDE) Integration of ADESA’s and IAAI’s salvage operations Co-location of selected whole car and salvage sites Leverage AFC’s services at ADESA and IAAI Continuous operational improvements and restructuring / cost reduction programs Economies of scale – operating leverage as volumes increase Volume and fee increases and operational efficiency gains at acquired facilities e-Business expansion / volume gains 1 Free cash flow conversion defined as (Adj. EBITDA - Capex )/ Adj. EBITDA 24.5% 26.3% 84.8% 81.5% 0.0% 5.0% 10.0% 15.0% 20.0% 25.0% 30.0% 2007 2009 70.0% 80.0% 90.0% 100.0% Strong Margins and Efficient Business Model 23.6% 26.5% 85.9% 69.5% 0.0% 5.0% 10.0% 15.0% 20.0% 25.0% 30.0% 2007 2009 60.0% 70.0% 80.0% 90.0% 100.0% Revenue Free Cash Flow Conversion¹ |
 19 Continue market share gains at ADESA Continue margin expansion through operating efficiencies and growth in volume and revenue per vehicle Increase facility utilization through new services and specialty vehicle sales Bolt-on acquisitions and select greenfields and relocations International opportunities, leveraging technology platform Pursue disciplined growth at AFC Future Growth Strategy
|
 20 Top line growth since 2007 driven by: • Stable industry volumes • Track record of organic and acquisition market share growth • Increasing revenue per unit High margin and low capital intensity business model generates significant free cash flow • History of high and growing margins • Modest working capital requirements • Capex <5% of 2009 sales • Near to medium term objective is continued debt reduction Ample liquidity • Low cost debt, unfunded revolver and strong cash position • Current AFC financing structure in place through April 2012 Financial Highlights |
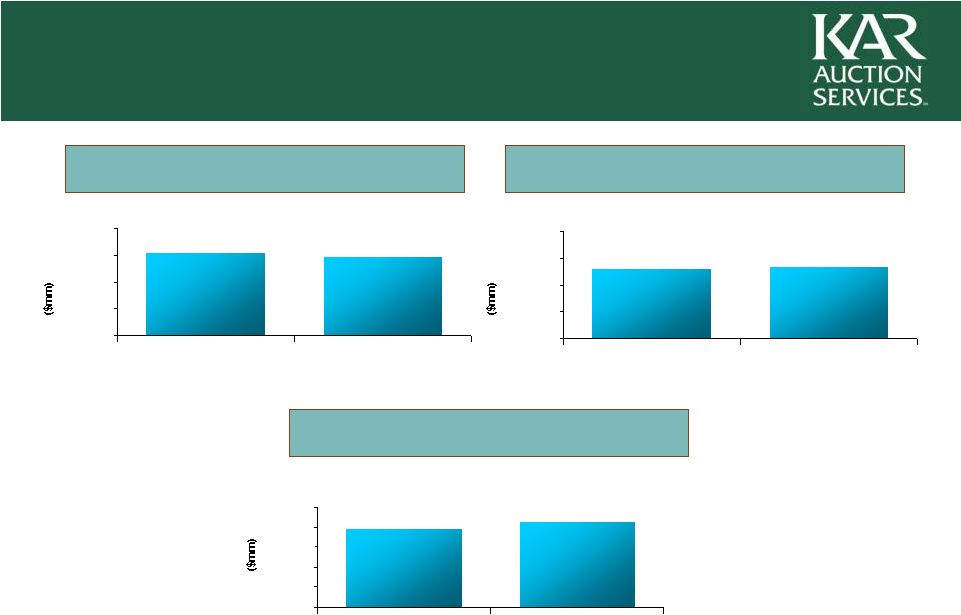 21 21 2009 Consolidated Financial Highlights $1,771 $1,730 $1,000 $1,250 $1,500 $1,750 $2,000 2008 2009 Revenue Revenue Gross Profit Gross Profit $426 $394 $0 $100 $200 $300 $400 $500 2008 2009 Adjusted EBITDA Adjusted EBITDA $718 $732 $200 $400 $600 $800 $1,000 2008 2009 42.3% 40.6% |
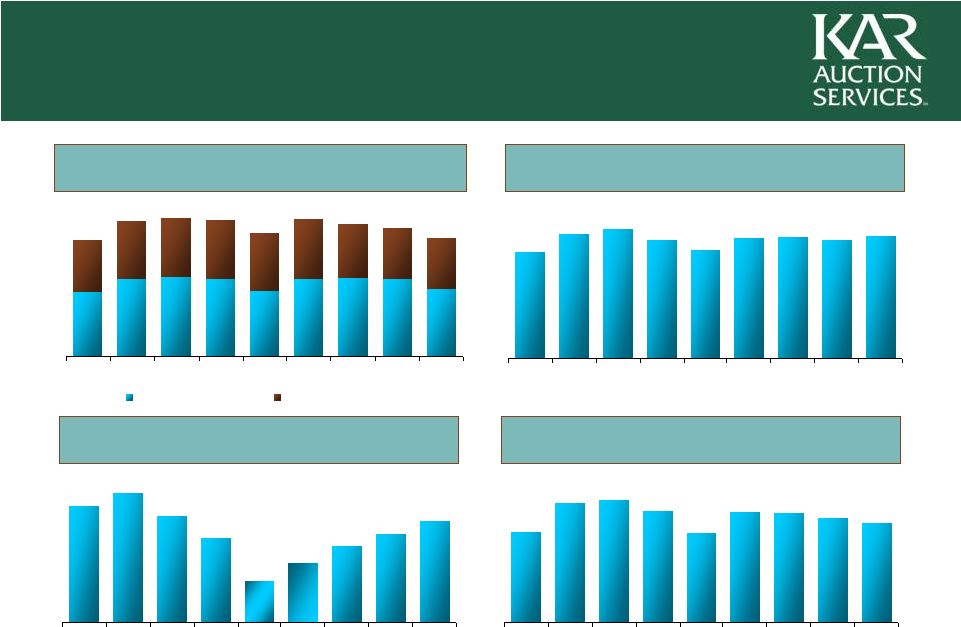 22 ADESA ADESA AFC AFC IAAI IAAI Financial Highlights Quarterly Revenue (US$ in millions) $140.6 $135.5 $121.7 $142.1 $148.5 $135.4 $124.3 $138.0 $139.0 Q4' 07 Q1' 08 Q2' 08 Q3' 08 Q4' 08 Q1' 09 Q2' 09 Q3' 09 Q4' 09 $27.4 $23.8 $31.3 $34.9 $28.8 $22.8 $11.2 $16.2 $20.6 Q4' 07 Q1' 08 Q2' 08 Q3' 08 Q4' 08 Q1' 09 Q2' 09 Q3' 09 Q4' 09 Consolidated Consolidated $417.9 $430.1 $398.4 $462.1 $468.5 $444.6 $396.2 $442.5 $439.1 Q4' 07 Q1' 08 Q2' 08 Q3' 08 Q4' 08 Q1' 09 Q2' 09 Q3' 09 Q4' 09 Q4'07 Q1' 08 Q2' 08 Q3' 08 Q4' 08 Q1' 09 Q2' 09 Q3' 09 Q4' 09 Auction Fees Ancillary Services $285.1 $291.2 $286.4 $260.7 $288.3 $279.5 $270.8 $245.4 $249.9 |
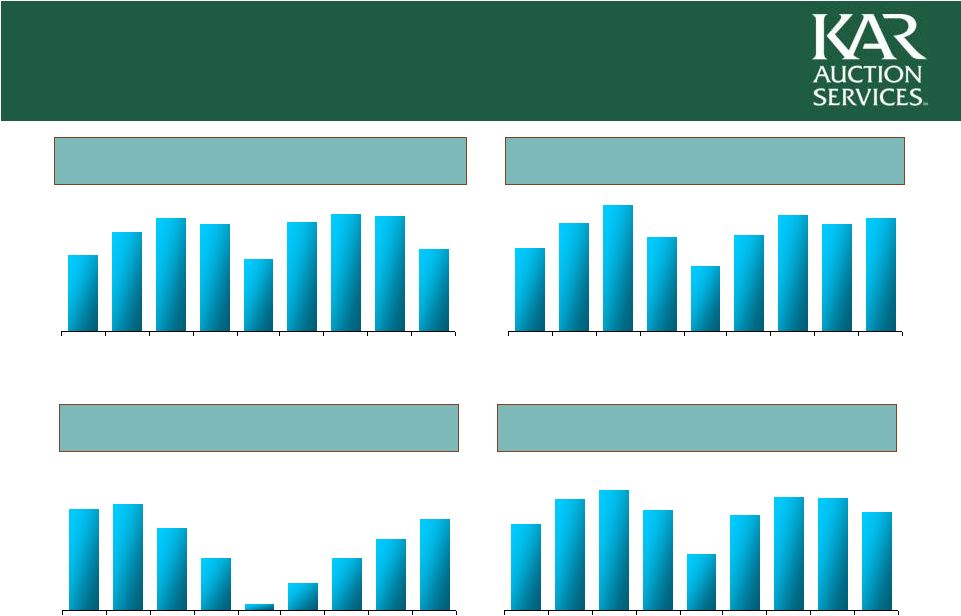 23 ADESA AFC $55.6 $77.8 $51.7 $67.4 $76.3 $72.7 $48.7 $73.6 $79.3 Q4' 07 Q1' 08 Q2' 08 Q3' 08 Q4' 08 Q1' 09 Q2' 09 Q3' 09 Q4' 09 IAAI Financial Highlights Quarterly Adj. EBITDA (US$ in millions) $38.4 $36.3 $28.3 $36.7 $42.6 $31.9 $22.0 $32.6 $39.3 Q4' 07 Q1' 08 Q2' 08 Q3' 08 Q4' 08 Q1' 09 Q2' 09 Q3' 09 Q4' 09 $18.5 $14.4 $20.5 $21.6 $16.7 $10.7 $1.4 $5.6 $10.7 Q4' 07 Q1' 08 Q2' 08 Q3' 08 Q4' 08 Q1' 09 Q2' 09 Q3' 09 Q4' 09 Consolidated $99.7 $114.0 $87.7 $112.7 $121.4 $101.9 $57.5 $97.1 $115.1 Q4' 07 Q1' 08 Q2' 08 Q3' 08 Q4' 08 Q1' 09 Q2' 09 Q3' 09 Q4' 09 1 Includes corporate charges 21.1% 23.6% 26.2% 25.4% 18.7% 25.5% 28.4% 28.7% 22.2% % Margin % Margin 23.3% 25.8% 28.7% 23.6% 17.7% 23.6% 28.3% 26.8% 27.3% 22.0% 24.4% 25.9% 22.9% 14.5% 21.9% 26.2% 26.5% 23.9% 65.5% 61.9% 58.0% 46.9% 12.5% 34.6% 51.9% 60.5% 67.5% % Margin % Margin 1 |
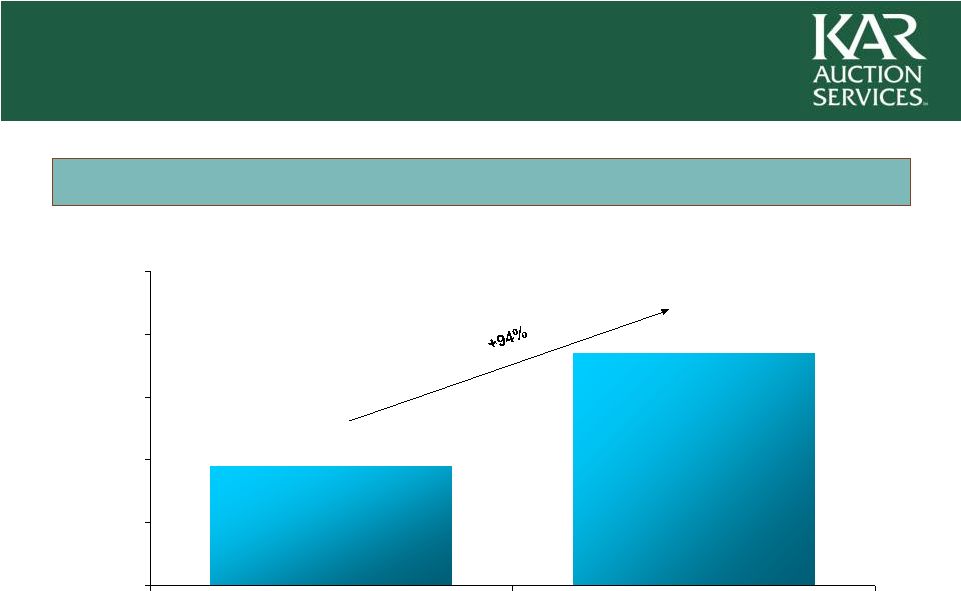 24 Significant Cash Flow Generation (US$ in millions) $185 $95 $0 $50 $100 $150 $200 $250 2008 2009 % of Revenues 5.4% 10.7% Operating Cash Flow Less Capital Expenditures |
 25 $1,947.0 Net Debt 12/31/09 Maturity Available Cash $325.9 Term Loan Facilities 1,247.9 2013 Floating Rate Notes 150.0 2014 Fixed Rate Notes (8.75%) 450.0 2014 Senior Sub. Notes (10%) 425.0 2015 Total Consolidated Debt $2,272.9 Net Debt /Adjusted EBITDA 4.57X December 31, 2009 Capital Structure (US$ in millions) Focused Commitment to Deleveraging |
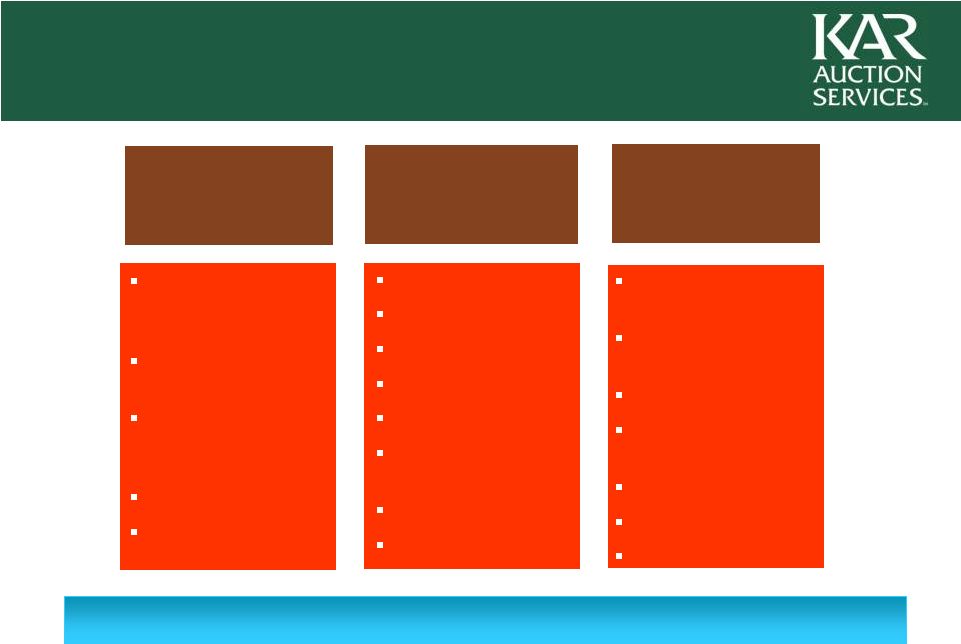
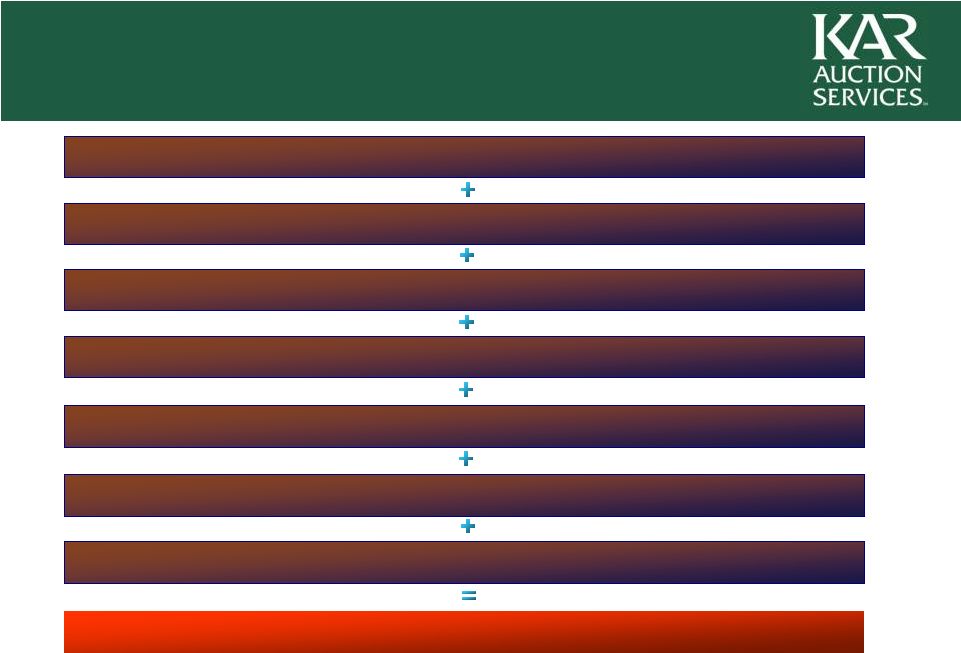 26 Targeted Growth Outlook Industry Volume Growth Revenue / Vehicle Growth Market Share Expansion Continued Operating Efficiencies Operating Leverage Debt Paydown / Re-investment Earnings Growth Selective Acquisitions |
 27 Appendix |
 28 Non-GAAP Financial Measures EBITDA is defined as net income (loss), plus interest expense net of interest income,
income tax provision (benefit), depreciation and amortization.
Adjusted EBITDA is calculated by adjusting EBITDA for the items of income
and expense and expected incremental revenue and cost savings as described
in the company's senior secured credit agreement. Management believes
that the inclusion of supplementary adjustments to EBITDA applied in presenting Adjusted EBITDA is appropriate to provide additional information to investors
about one of the principal internal measures of performance used by them. Management uses the Adjusted EBITDA measure to evaluate the company’s performance and to
evaluate results relative to incentive compensation targets. Adjusted
EBITDA is also used by our creditors in assessing debt covenant compliance
and management believes its inclusion is appropriate to provide additional information to investors about certain covenants required pursuant to our senior secured credit facility and the notes. EBITDA and Adjusted EBITDA have limitations as analytical tools, and should not be considered in isolation, or as a substitute for analysis of the results as reported
under GAAP. These measures may not be comparable to similarly titled
measures reported by other companies. |
 29 2007 Adjusted EBITDA Reconciliation Year Ended December 31, 2007 (Dollars in millions) ADESA IAAI AFC Corporate Consolidated Net Income (Loss) $37.0 $2.2 $25.9 $(103.4) $(38.3) Add Back: ADESA 2007 Net Income 39.4 – 16.2 (28.7) 26.9 Add Back: ADESA 2007 Discontinued Ops 0.1 – – – 0.1 Add back: IAAI 2007 Net Loss – (0.4) – – (0.4) Income (Loss) from Continuing Operations $76.5 $1.8 $42.1 $(132.1) $(11.7) Add Back: Income Taxes $30.0 $2.4 $17.2 $(59.6) $(10.0) ADESA 2007 Income Taxes 22.2 – 10.5 (7.8) 24.9 IAAI 2007 Income Taxes – 1.5 – – 1.5 Interest Expense, Net of Interest Income (0.4) (0.3) – 156.7 156.0 ADESA 2007 Interest Expense, Net of Interest Income (0.1) – – 6.4 6.3 IAAI 2007 Interest Expense, Net of Interest Income – 9.9 – – 9.9 Depreciation and Amortization 64.6 40.0 17.8 4.2 126.6 ADESA 2007 Depreciation and Amortization 14.7 – 0.9 0.3 15.9 IAAI 2007 Depreciation and Amortization – 7.9 – – 7.9 Intercompany 20.2 22.2 1.1 (43.5) – ADESA 2007 Intercompany (4.6) 11.1 2.2 (8.7) – EBITDA $223.1 $96.5 $91.8 $(84.1) $327.3 Adjustments 13.4 17.3 5.5 32.0 68.2 Adjusted EBITDA $236.5 $113.8 $97.3 $(52.1) $395.5 Revenue ADESA - January 1 - April 19, 2007 $287.8 $37.6 $45.9 $– $371.3 IAAI - January 1 - April 19, 2007 – 114.8 – – 114.8 KAR - April 20 - December 31, 2007 677.7 330.1 95.0 – 1,102.8 Total Revenue $965.5 $482.5 $140.9 – $1,588.9 Adjusted EBITDA Margin % 24.5% 23.6% 69.1% 24.9% |
 30 2007 Q4 Adjusted EBITDA Reconciliation Three Months Ended December 31, 2007 (Dollars in millions) ADESA IAAI AFC Corporate Consolidated Net Income (Loss) $(12.0) $(11.2) $6.8 $(17.9) $(34.3) Add back: Income Taxes (1.0) (5.5) 5.3 (15.3) (16.5) Interest Expense, Net of Interest Income (0.1) (0.1) – 56.2 56.0 Depreciation and Amortization 33.6 17.0 6.1 3.1 59.8 Intercompany 25.1 22.0 0.3 (47.4) – EBITDA $45.6 $22.2 $18.5 $(21.3) $65.0 Adjustments 6.1 6.1 2.0 8.5 22.7 Adjusted EBITDA $51.7 $28.3 $20.5 $(12.8) $87.7 Revenue $245.4 $121.7 $31.3 $– $398.4 Adjusted EBITDA Margin % 21.1% 23.3% 65.5% 22.0% |
 31 2008 Quarterly Adjusted EBITDA Reconciliations Three Months Ended March 31, 2008 (Dollars in millions) ADESA IAAI AFC Corporate Consolidated Net Income (Loss) $16.8 $6.2 $8.5 $(34.7) $(3.2) Add back: Income Taxes 11.8 4.3 5.2 (25.0) (3.7) Interest Expense, Net of Interest Income – (0.2) – 57.0 56.8 Depreciation and Amortization 23.7 15.6 6.6 1.4 47.3 Intercompany 9.5 7.7 0.4 (17.6) – EBITDA $61.8 $33.6 $20.7 $(18.9) $97.2 Adjustments 5.6 3.1 0.9 5.9 15.5 Adjusted EBITDA $67.4 $36.7 $21.6 $(13.0) $112.7 Revenue $285.1 $142.1 $34.9 $– $462.1 Adjusted EBITDA Margin % 23.6% 25.8% 61.9% 24.4% Three Months Ended June 30, 2008 (Dollars in millions) ADESA IAAI AFC Corporate Consolidated Net Income (Loss) $22.6 $7.8 $5.8 $(30.0) $6.2 Add back: Income Taxes 13.0 5.4 3.7 (17.3) 4.8 Interest Expense, Net of Interest Income (0.1) – – 51.3 51.2 Depreciation and Amortization 22.4 15.6 6.4 0.6 45.0 Intercompany 9.9 10.6 0.3 (20.8) – EBITDA $67.8 $39.4 $16.2 $(16.2) $107.2 Adjustments 8.5 3.2 0.5 2.0 14.2 Adjusted EBITDA $76.3 $42.6 $16.7 $(14.2) $121.4 Revenue $291.2 $148.5 $28.8 $– $468.5 Adjusted EBITDA Margin % 26.2% 28.7% 58.0% 25.9% Three Months Ended September 30, 2008 (Dollars in millions) ADESA IAAI AFC Corporate Consolidated Net Income (Loss) $14.7 $1.4 $(161.2) $(24.8) $(169.9) Add back: Income Taxes 12.3 0.2 0.9 (18.6) (5.2) Interest Expense, Net of Interest Income – 0.2 – 51.7 51.9 Depreciation and Amortization 23.0 15.4 6.2 0.4 45.0 Intercompany 11.1 10.0 (0.5) (20.6) – EBITDA $61.1 $27.2 $(154.6) $(11.9) $(78.2) Adjustments 11.6 4.7 165.3 (1.5) 180.1 Adjusted EBITDA $72.7 $31.9 $10.7 $(13.4) $101.9 Revenue $286.4 $135.4 $22.8 $– $444.6 Adjusted EBITDA Margin % 25.4% 23.6% 46.9% 22.9% Three Months Ended December 31, 2008 (Dollars in millions) ADESA IAAI AFC Corporate Consolidated Net Income (Loss) $(1.6) $(6.2) $(4.4) $(37.1) $(49.3) Add back: Income Taxes (3.4) (3.6) 0.4 (20.7) (27.3) Interest Expense, Net of Interest Income 0.1 0.2 – 53.2 53.5 Depreciation and Amortization 24.1 15.0 6.1 0.3 45.5 Intercompany 13.9 10.1 (0.9) (23.1) – EBITDA $33.1 $15.5 $1.2 $(27.4) $22.4 Adjustments 15.6 6.5 0.2 12.8 35.1 Adjusted EBITDA $48.7 $22.0 $1.4 $(14.6) $57.5 Revenue $260.7 $124.3 $11.2 $– $396.2 Adjusted EBITDA Margin % 18.7% 17.7% 12.5% 14.5% |
 32 2009 Quarterly Adjusted EBITDA Reconciliations Three Months Ended March 31, 2009 (Dollars in millions) ADESA IAAI AFC Corporate Consolidated Net Income (Loss) $20.7 $3.1 $0.6 $(27.9) $(3.5) Add back: Income Taxes 13.8 2.3 0.4 (19.5) (3.0) Interest Expense, Net of Interest Income – 0.3 – 46.1 46.4 Depreciation and Amortization 24.3 15.1 6.2 0.4 46.0 Intercompany 8.3 10.3 (1.8) (16.8) – EBITDA $67.1 $31.1 $5.4 $(17.7) $85.9 Adjustments 6.5 1.5 0.2 3.0 11.2 Adjusted EBITDA $73.6 $32.6 $5.6 $(14.7) $97.1 Revenue $288.3 $138.0 $16.2 $– $442.5 Adjusted EBITDA Margin % 25.5% 23.6% 34.6% 21.9% Three Months Ended June 30, 2009 (Dollars in millions) ADESA IAAI AFC Corporate Consolidated Net Income (Loss) $26.8 $7.5 $3.6 $(25.1) $12.8 Add back: Income Taxes 17.2 5.1 1.6 (14.3) 9.6 Interest Expense, Net of Interest Income 0.2 0.3 – 46.3 46.8 Depreciation and Amortization 21.5 14.5 6.1 0.2 42.3 Intercompany 9.7 10.6 (2.0) (18.3) – EBITDA $75.4 $38.0 $9.3 $(11.2) $111.5 Adjustments 3.9 1.3 1.4 (3.0) 3.6 Adjusted EBITDA $79.3 $39.3 $10.7 $(14.2) $115.1 Revenue $279.5 $139.0 $20.6 $– $439.1 Adjusted EBITDA Margin % 28.4% 28.3% 51.9% 26.2% Three Months Ended September 30, 2009 (Dollars in millions) ADESA IAAI AFC Corporate Consolidated Net Income (Loss) $29.7 $1.4 $5.9 $(28.4) $8.6 Add back: Income Taxes 12.7 1.0 3.7 (13.0) 4.4 Interest Expense, Net of Interest Income 0.2 0.4 – 38.7 39.3 Depreciation and Amortization 21.0 14.3 6.1 0.2 41.6 Intercompany 9.1 10.9 (1.6) (18.4) – EBITDA $72.7 $28.0 $14.1 $(20.9) $93.9 Adjustments 5.1 8.3 0.3 6.4 20.1 Adjusted EBITDA $77.8 $36.3 $14.4 $(14.5) $114.0 Revenue $270.8 $135.5 $23.8 $– $430.1 Adjusted EBITDA Margin % 28.7% 26.8% 60.5% 26.5% Three Months Ended December 31, 2009 (Dollars in millions) ADESA IAAI AFC Corporate Consolidated Net Income (Loss) $17.2 $13.8 $9.0 $(34.7) $5.3 Add back: Income Taxes 12.3 7.8 2.7 (22.7) 0.1 Interest Expense, Net of Interest Income 0.1 0.4 – 39.2 39.7 Depreciation and Amortization 21.6 14.4 6.3 0.2 42.5 Intercompany 1.8 4.4 (1.4) (4.8) – EBITDA $53.0 $40.8 $16.6 $(22.8) $87.6 Adjustments 2.6 (2.4) 1.9 10.0 12.1 Adjusted EBITDA $55.6 $38.4 $18.5 $(12.8) $99.7 Revenue $249.9 $140.6 $27.4 $– $417.9 Adjusted EBITDA Margin % 22.2% 27.3% 67.5% 23.9% |
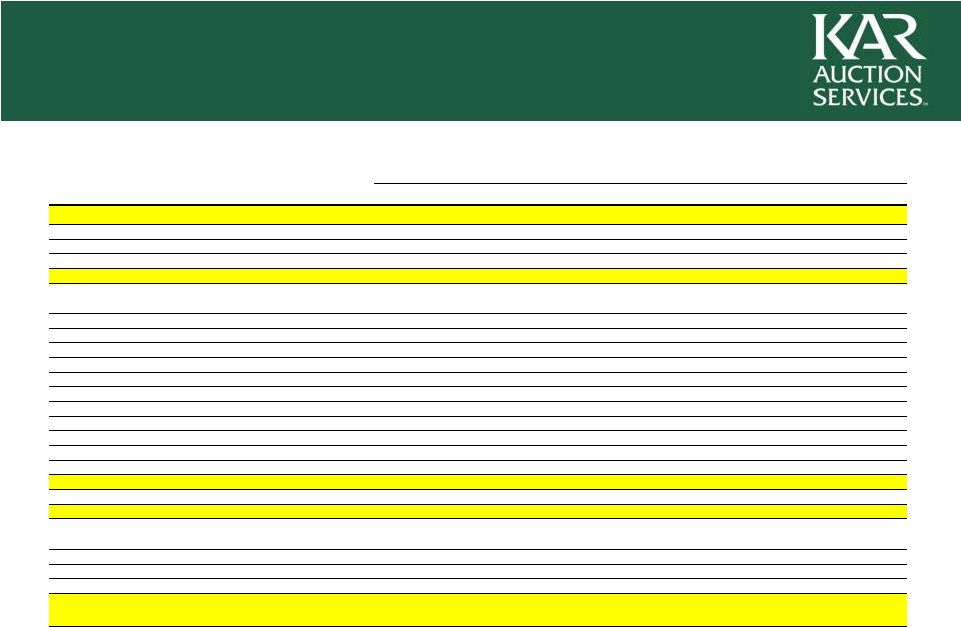
 33 2009 Adjusted EBITDA Reconciliation Year Ended December 31, 2009 (Dollars in millions) ADESA IAAI AFC Corporate Consolidated Net Income (Loss) $94.4 $25.8 $19.1 $(116.1) $23.2 Add back: Income Taxes 56.0 16.2 8.4 (69.5) 11.1 Interest Expense, Net of Interest Income 0.5 1.4 – 170.3 172.2 Depreciation and Amortization 88.4 58.3 24.7 1.0 172.4 Intercompany 28.9 36.2 (6.8) (58.3) – EBITDA $268.2 $137.9 $45.4 $(72.6) $378.9 Adjustments 18.1 8.7 3.8 16.4 47.0 Adjusted EBITDA $286.3 $146.6 $49.2 $(56.2) $425.9 Revenue $1,088.5 $553.1 $88.0 $– $1,729.6 Adjusted EBITDA Margin % 26.3% 26.5% 55.9% 24.6% |