Attached files
| file | filename |
|---|---|
| EX-32 - EXHIBIT 32 - FNB BANCORP/CA/ | ex_32.htm |
| EX-31.1 - EXHIBIT 31.1 - FNB BANCORP/CA/ | ex31_1.htm |
| EX-31.2 - EXHIBIT 31.2 - FNB BANCORP/CA/ | ex31_2.htm |
| EX-23 - EXHIBIT 23 - FNB BANCORP/CA/ | ex23_1.htm |
SECURITIES AND EXCHANGE COMMISSION
WASHINGTON, D.C. 20549
FORM 10-K/A
(Amendment No. 1)
|
x
|
Annual report pursuant to Section 13 or 15 (d) of the Securities Exchange Act of 1934
|
| for the fiscal year ended December 31, 2009 | |
|
or
|
|
|
o
|
Transition report pursuant to Section 13 or 15 (d) of Securities Exchange Act of 1934
|
Commission File No. 000-49693
FNB BANCORP
(Exact name of registrant as specified in its charter)
|
California
|
92-2115369
|
|
|
(State or other jurisdiction of
|
(IRS Employer ID Number)
|
|
|
incorporation or organization)
|
||
|
975 El Camino Real, South San Francisco, California
|
94080
|
|
|
(Address of principal executive offices)
|
(Zip code)
|
|
|
(650) 588-6800
|
||
|
(Registrant’s telephone number, including area code)
|
||
|
Securities registered pursuant to Section 12(b) of the Act:
|
None
|
|
|
Securities registered pursuant to Section 12(g) of the Act:
|
||
|
Title of Class:
|
Common Stock, no par value
|
Indicate by check mark if the registrant is a well-known seasoned issuer, as defined in Rule 405 of the Securities Act.
Yes o No x
Indicate by check mark if the registrant is not required to file reports pursuant to Section 13 or Section 15(d) of the Act.
Yes o No x
Indicate by check mark whether the registrant (1) has filed all reports required to be filed by Section 13 or 15(d) of the Securities Exchange Act of 1934 during the preceding 12 months (or for such shorter period that the registrant was required to file such reports), and (2) has been subject to such filing requirements for the past 90 days.
Yes x No o
Indicate by check mark whether the registrant has submitted electronically and posted on its Website, if any, every Interactive Data File required to be submitted and posted pursuant to Rule 405 of Regulation S-T during the preceding 12 months (or for such shorter period that the registrant was required to submit and post such files).
Yes o No o
Indicate by check mark if disclosure of delinquent filers pursuant to item 405 of Regulation S-K is not contained herein, and will not be contained, to the best of the registrant’s knowledge, in definitive proxy or information statements incorporated by reference in Part III of this Form 10-K or any amendment to this 10-K o
Indicate by check mark whether the registrant is a large accelerated filer, an accelerated filer, a non-accelerated filer or a smaller reporting company. See definition of “large accelerated filer,” “accelerated filer” and “smaller reporting company “ in Rule 12b-2 of the Exchange Act. (Check one):
|
Large accelerated filer o
|
Accelerated filer o
|
Non-accelerated filer x
|
|
Smaller reporting company o
|
Indicate by check mark whether the registrant is a shell company (as defined in Rule 12b-2 of the Act).
Yes o No x
Aggregate market value of the voting and non-voting common equity held by non-affiliates of the registrant, computed by reference to the price at which the common equity was last sold, or the average bid and asked price of such common equity, as of the last business day of the registrant’s most recently completed second fiscal quarter: $28,299,997
Page 1 of 106 pages
Number of shares outstanding of each of the registrant’s classes of common stock, as of March 1, 2010
No par value Common Stock – 3,181,714 shares outstanding.
DOCUMENTS INCORPORATED BY REFERENCE
The following documents are incorporated by reference into this Form 10-K: Part III, Items 10 through 14 from Registrant’s definitive proxy statement for the 2010 annual meeting of shareholders.
EXPLANATORY NOTE
This Form 10-K/A amends our report on Form 10-K for the fiscal year ended December 31, 2009 solely for the purpose of correcting the Total stockholders’ equity to show $78,865,000 at December 31, 2009 and Total Liabilities and stockholders’ equity to show $708,309,000 at December 31, 2009 on page 56, FNB BANCORP AND SUBSIDIARY, Consolidated Balance Sheets, caused by a formula error in the footing of these amounts, and a rounding adjustment to percentages shown in Table 3, Allocation of the Allowance for Loan Losses, for the 2007 column. Except as described above, no attempt has been made in this Form 10-K/A to modify or update other disclosures present in the original report on Form 10-K for the fiscal year ended December 31, 2009. Accordingly this form 10-K/A does not reflect events occurring after the date of the original filing of the form 10-K or modify or update those disclosures affected by subsequent events. Consequently, all other information not affected by this Form 10-K/A is unchanged by this Form 10-K/A and reflects the disclosures made at the time of the original filing of the form 10-K on March 24, 2010.
TABLE OF CONTENTS
| PAGE | |||
| 3 | |||
| 23 | |||
| 29 | |||
| 29 | |||
| 31 | |||
| 31 | |||
| 31 | |||
| 33 | |||
| 34 | |||
| 52 | |||
| 54 | |||
| 94 | |||
| 94 | |||
| 96 | |||
| 96 | |||
| 96 | |||
| 96 | |||
| 96 | |||
| 96 | |||
| 97 | |||
| 97 | |||
| 97 | |||
| 97 | |||
| 102 | |||
|
Exhibit 31 – Rule 13a-14(a)/15d-14(a) Certifications
|
|||
|
Exhibit 32 – Section 1350 Certifications
|
|||
2
Forward-Looking Statements: Certain matters discussed or incorporated by reference in this Annual Report on Form 10-K including, but not limited to, matters described in “Item 7 – Management’s Discussion and Analysis of Financial Condition and Results of Operations,” are “forward-looking statements” within the meaning of Section 21E of the Securities Exchange Act of 1934, as amended, and Section 27A of the Securities Act of 1933, as amended. Such forward-looking statements may contain words related to future projections including, but not limited to, words such as “believe,” “expect,” “anticipate,” “intend,” “may,” “will,” “should,” “could,” “would,” and variations of those words and similar words that are subject to risks, uncertainties and other factors that could cause actual results to differ materially from those projected. Factors that could cause or contribute to such differences include, but are not limited to, the following: (1) variances in the actual versus projected growth in assets; (2) return on assets; (3) loan and lease losses; (4) expenses; (5) changes in the interest rate environment including interest rates charged on loans, earned on securities investments and paid on deposits; (6) competition effects; (7) fee and other noninterest income earned; (8) general economic conditions nationally, regionally, and in the operating market areas of the Company and its subsidiary, including State and local issues being addressed in California; (9) changes in the regulatory environment; (10) changes in business conditions and inflation; (11) changes in securities markets; (12) data processing problems; (13) a further decline in real estate values in the Company’s operating market areas; (14) the effects of terrorism, the threat of terrorism or the impact of the current military conflicts in Iraq and Afghanistan, and the conduct of the war on terrorism by the United States and its allies, as well as other factors. The factors set forth under “Item 1A – Risk Factors” in this report and other cautionary statements and information set forth in this report should be read carefully, considered and understood as being applicable to all related forward-looking statements contained in this report when evaluating the business prospects of the Company and its subsidiary.
Forward-looking statements are not guarantees of performance. By their nature, they involve risks, uncertainties and assumptions. Actual results and shareholder values in the future may differ significantly from those expressed in forward-looking statements. You are cautioned not to put undue reliance on any forward-looking statement. Any such statement speaks only as of the date of the report, and in the case of any documents that may be incorporated by reference, as of the date of those documents. We do not undertake any obligation to update or release any revisions to any forward-looking statements, or to report any new information, future event or other circumstances after the date of this report or to reflect the occurrence of unanticipated events, except as required by law. However, your attention is directed to any further disclosures made on related subjects in our subsequent reports filed with the Securities and Exchange Commission on Forms 10-K, 10-Q and 8-K.
General
FNB Bancorp (the “Company”) is a bank holding company registered under the Bank Holding Company Act of 1956, as amended. The Company was incorporated under the laws of the State of California on February 28, 2001.
3
As a bank holding company, the Company is authorized to engage in the activities permitted under the Bank Holding Company Act of 1956, as amended, and regulations thereunder. Its principal office is located at 975 El Camino Real, South San Francisco, California 94080, and its telephone number is (650) 588-6800.
The Company owns all of the issued and outstanding shares of common stock of First National Bank of Northern California, a national banking association (the “Bank”). The Company has no other subsidiary.
The Bank was organized in 1963 as “First National Bank of Daly City.” In 1995, the shareholders approved a change in the name to “First National Bank of Northern California.” The administrative headquarters of the Bank is located at 975 El Camino Real, South San Francisco, California. The Bank is locally owned and presently operates thirteen full service banking offices in the cities of Colma, Daly City, South San Francisco, Millbrae, Pacifica, Half Moon Bay, San Mateo, Redwood City, Pescadero, as well as its Financial District and Portola offices in San Francisco. The Bank’s primary business is servicing the business or commercial banking needs of individuals and small to mid-sized businesses within San Mateo and San Francisco Counties.
The Bank is chartered under the laws of the United States and is governed by the National Bank Act, and is a member of the Federal Reserve System. The Federal Deposit Insurance Corporation insures the deposits of the Bank up to the applicable legal limits. The Bank is also participating in the FDIC Transaction Account Guarantee Program (“TAGP”). Under that program, through June 30, 2010, all noninterest-bearing transaction accounts are fully guaranteed by the FDIC for the entire amount in the account. Coverage under the TAGP is in addition to and separate from the coverage available under the FDIC’s general deposit insurance rules. The Bank is subject to regulation, supervision and regular examination by the Office of the Comptroller of the Currency. The regulations of the Federal Deposit Insurance Corporation, the Board of Governors of the Federal Reserve System, and the Office of the Comptroller of the Currency govern many aspects of the Bank’s business and activities, including investments, loans, borrowings, branching, mergers and acquisitions, reporting and numerous other areas. The Bank is also subject to applicable provisions of California law to the extent those provisions are not in conflict with or preempted by federal banking law. See “Supervision and Regulation” below.
The Bank offers a broad range of services to individuals and businesses in its primary service area, including a full line of business financial products with specialized services such as courier, appointment banking, and business Internet banking. The Bank offers personal and business checking and savings accounts, including individual interest-bearing negotiable orders of withdrawal (“NOW”), money market accounts and/or accounts combining checking and savings accounts with automatic transfer capabilities, IRA accounts, time certificates of deposit, direct deposit services and computer cash management with access through the Internet. First National Bank also makes available commercial loans and standby letters of credit and construction, accounts receivable, inventory, automobile, home improvement, residential real estate, commercial real estate, Home Equity Lines, Small Business Administration, office equipment, leasehold improvement and consumer loans as well as overdraft protection lines of credit. In addition, the Bank sells travelers checks and cashiers checks, offers automated teller machine (ATM) services tied in with major statewide and national networks and offers other customary commercial banking services.
4
Most of the Bank’s deposits are obtained from commercial and non-profit businesses, professionals and individuals. As of December 31, 2009, First National Bank had a total of 24,398 deposit accounts. On occasion, the Bank has obtained deposits through deposit brokers for which it pays a broker fee. As of December 31, 2009, First National Bank had no such deposits. There is no concentration of deposits or any customer with 5% or more of First National Bank’s deposits.
At December 31, 2009, the Company had total assets of $708,309,000, net loans of $494,349,000, deposits of $598,964,000 and shareholders’ equity of $78,865,000. The Company competes with approximately 33 other banking or savings institutions in its service areas. The Company’s market share of Federal Deposit Insurance Corporation insured deposits in the service area of San Mateo County is approximately 2.29% (based upon the most recent information available by the Federal Deposit Insurance Corporation through June 30, 2009). See “Competitive Data” below.
Employees
At December 31, 2009, The Company employed 185 persons on a full-time equivalent basis. The Company believes its employee relations are good. The Company is not a party to any collective bargaining agreement.
Available Information
The Company and the Bank maintain an Internet website at http://www.FNBNORCAL.com. The Company’s annual report on Form 10-K, quarterly reports on Form 10-Q, current reports on Form 8-K and amendments to those reports, filed or furnished pursuant to Section 13(a) or 15(d) of the Securities Exchange Act of 1934, are made available free of charge on or through such website as soon as reasonably practicable after such material is electronically filed with, or furnished to, the Securities and Exchange Commission. Also made available on or through such website are the Section 16 reports of ownership and changes in ownership of the Company’s common stock which are filed with the Securities and Exchange Commission by the directors and executive officers of the Company and by any persons who own more than 10 percent of the outstanding shares of such stock. Information on such website is not incorporated by reference into this report.
SUPERVISION AND REGULATION
General
FNB Bancorp. The common stock of the Company is subject to the registration requirements of the Securities Act of 1933, as amended, and the qualification requirements of the California Corporate Securities Law of 1968, as amended. FNB Bancorp has registered its common stock under Section 12 (g) of the Securities Exchange Act of 1934, as amended. The Company is also subject to the periodic reporting requirements of Section 13 of the Securities Exchange Act of 1934, as amended, which include, but are not limited to, annual, quarterly and other current reports required to be filed with the Securities and Exchange Commission.
5
The Company is a bank holding company within the meaning of the Bank Holding Company Act of 1956, as amended (the “Bank Holding Company Act”), and is registered as such with, and subject to the supervision of, the Board of Governors of the Federal Reserve System (the “Board of Governors”). The Company is required to obtain the approval of the Board of Governors before it may acquire all or substantially all of the assets of any bank, or ownership or control of the voting shares of any bank if, after giving effect to such acquisition of shares, FNB Bancorp would own or control more than 5% of the voting shares of such bank. The Bank Holding Company Act prohibits the Company from acquiring any voting shares of, or interest in, all or substantially all of the assets of a bank located outside the State of California unless such an acquisition is specifically authorized by the laws of the state in which such bank is located. Any such interstate acquisition is also subject to the provisions of the Riegle-Neal Interstate Banking and Branching Efficiency Act of 1994.
The Company, and any subsidiary which it may acquire or organize, are deemed to be “affiliates” of the Bank within the meaning of that term as defined in the Federal Reserve Act. This means, for example, that there are limitations (a) on loans by First National Bank to its affiliates, and (b) on investments by the Bank in affiliates’ stock as collateral for loans to any borrower. The Company and the Bank are also subject to certain restrictions with respect to engaging in the underwriting, public sale and distribution of securities.
In addition, regulations of the Board of Governors under the Federal Reserve Act require that reserves be maintained by the Bank in conjunction with any liability of the Company under any obligation (promissory note, acknowledgment of advance, banker’s acceptance or similar obligation) with a weighted average maturity of less than seven (7) years to the extent that the proceeds of such obligations are used for the purpose of supplying funds to the Bank for use in its banking business, or to maintain the availability of such funds.
First National Bank of Northern California. As a national banking association licensed under the national banking laws of the United States, the Bank is regularly examined by the Office of the Comptroller of the Currency and is subject to supervision and regulation by the Federal Deposit Insurance Corporation, and the Board of Governors of the Federal Reserve System.
This supervision and regulation includes comprehensive reviews of all major aspects of the Bank’s business and condition, including its capital ratios, allowance for possible loan losses and other factors. However, no inference should be drawn that such authorities have approved any such factors. The Bank is required to file reports with the Office of the Comptroller of the Currency and the Federal Deposit Insurance Corporation. The Bank’s deposits are insured by the Federal Deposit Insurance Corporation up to the applicable legal limits.
Capital Standards.
The Board of Governors, the Federal Deposit Insurance Corporation, and the Office of the Comptroller of the Currency have adopted risk-based guidelines for evaluating the capital adequacy of bank holding companies and banks. The guidelines are designed to make capital requirements sensitive to differences in risk profiles among banking organizations, to take into account off-balance sheet exposures and to aid in making the definition of bank capital uniform internationally.
6
Under the risk-based capital guidelines, assets reported on an institution’s balance sheet and certain off-balance sheet items are assigned to risk categories, each of which has an assigned risk weight. Capital ratios are calculated by dividing the institution’s qualifying capital by its period-end risk-weighted assets. The guidelines establish two categories of qualifying capital: Tier 1 capital (defined to include common shareholders’ equity and noncumulative perpetual preferred stock) and Tier 2 capital which includes, among other items, limited life (and in the case of banks, cumulative) preferred stock, mandatory convertible securities, subordinated debt and a limited amount of reserve for credit losses. Tier 2 capital may also include up to 45% of the pretax unrealized gains on certain available-for-sale equity securities having readily determinable fair values (i.e. the excess, if any, of fair market value over the book value or historical cost of the investment security). The federal regulatory agencies reserve the right to exclude all or a portion of the unrealized gains upon a determination that the equity securities are not prudently valued. Unrealized gains and losses on other types of assets, such as bank premises and available-for-sale debt securities, are not included in Tier 2 capital, but may be taken into account in the evaluation of overall capital adequacy. Net unrealized losses on available-for-sale equity securities will continue to be deducted from Tier 1 capital as a cushion against risk.
A leverage capital standard was adopted as a supplement to the risk-weighted capital guidelines. Under the leverage capital standard, an institution is required to maintain a minimum ratio of Tier 1 capital to the sum of its quarterly average total assets and quarterly average reserve for loan losses, less intangibles not included in Tier 1 capital. Period-end assets may be used in place of quarterly average total assets on a case-by-case basis. The Board of Governors and the Federal Deposit Insurance Corporation have also adopted a minimum leverage ratio for bank holding companies as a supplement to the risk-weighted capital guidelines. The leverage ratio establishes a minimum Tier 1 ratio of 3% (Tier 1 capital to total assets) for the highest rated bank holding companies or those that have implemented the risk-based capital market risk measure. All other bank holding companies must maintain a minimum Tier 1 leverage ratio of 4% with higher leverage capital ratios required for bank holding companies that have significant financial and/or operational weakness, a high risk profile, or are undergoing or anticipating rapid growth.
At December 31, 2009, the Company was in compliance with the risk-weighted capital and leverage ratios. See “Capital” under Item 7 below.
Prompt Corrective Action
The Board of Governors, Federal Deposit Insurance Corporation, and Office of the Comptroller of the Currency have adopted regulations implementing a system of prompt corrective action pursuant to Section 38 of the Federal Deposit Insurance Act and Section 131 of the Federal Deposit Insurance Corporation Improvement Act of 1991 (“FDICIA”). The regulations establish five capital categories with the following characteristics:
(1) “Well capitalized” – consisting of institutions with a total risk-based capital ratio of 10% or greater, a Tier 1 risk-based capital ratio of 6% or greater and a leverage ratio of 5% or greater, and the institution is not subject to an order, written agreement, capital directive or prompt corrective action directive;
7
(2) “Adequately capitalized” – consisting of institutions with a total risk-based capital ratio of 8% or greater, a Tier 1 risk-based capital ratio of 4% or greater and a leverage ratio of 4% or greater, and the institution does not meet the definition of a “well capitalized” institution;
(3) “Undercapitalized” - consisting of institutions with a total risk-based capital ratio less than 8%, a Tier 1 risk-based capital ratio of less than 4%, or a leverage ratio of less than 4%;
(4) “Significantly undercapitalized” – consisting of institutions with a total risk-based capital ratio of less than 6%, a Tier 1 risk-based capital ratio of less than 3%, or a leverage ratio of less than 3%;
(5) “Critically undercapitalized” – consisting of an institution with a ratio of tangible equity to total assets that is equal to or less than 2%.
The regulations established procedures for classification of financial institutions within the capital categories, filing and reviewing capital restoration plans required under the regulations and procedures for issuance of directives by the appropriate regulatory agency, among other matters. The regulations impose restrictions upon all institutions to refrain from certain actions which would cause an institution to be classified within any one of the three “undercapitalized” categories, such as declaration of dividends or other capital distributions or payment of management fees, if following the distribution or payment the institution would be classified within one of the “undercapitalized” categories. In addition, institutions that are classified in one of the three “undercapitalized” categories are subject to certain mandatory and discretionary supervisory actions. Mandatory supervisory actions include:
(1) increased monitoring and review by the appropriate federal banking agency;
(2) implementation of a capital restoration plan;
(3) total asset growth restrictions; and
(4) limitation upon acquisitions, branch expansion, and new business activities without prior approval of the appropriate federal banking agency. Discretionary supervisory actions may include:
(a) requirements to augment capital;
(b) restrictions upon affiliate transactions;
(c) restrictions upon deposit gathering activities and interest rates paid;
(d) replacement of senior executive officers and directors;
(e) restrictions upon activities of the institution and its affiliates;
(f) requiring divestiture or sale of the institution; and
8
(g) any other supervisory action that the appropriate federal banking agency determines is necessary to further the purposes of the regulations. Further, the federal banking agencies may not accept a capital restoration plan without determining, among other things, that the plan is based on realistic assumptions and is likely to succeed in restoring the depository institution’s capital. In addition, for a capital restoration plan to be acceptable, the depository institution’s parent holding company must guarantee that the institution will comply with such capital restoration plan.
The aggregate liability of the parent holding company under the guaranty is limited to the lesser of (i) an amount equal to 5 percent of the depository institution’s total assets at the time it became undercapitalized, and (ii) the amount that is necessary (or would have been necessary) to bring the institution into compliance with all capital standards applicable with respect to such institution as of the time it fails to comply with the plan. If a depository institution fails to submit an acceptable plan, it is treated as if it were “significantly undercapitalized”. FDICIA also restricts the solicitation and acceptance of and interest rates payable on brokered deposits by insured depository institutions that are not “well capitalized.”
An “undercapitalized” institution is not allowed to solicit deposits by offering rates of interest that are significantly higher than the prevailing rates of interest on insured deposits in the particular institution’s normal market areas or in the market areas in which such deposits would otherwise be accepted.
Any financial institution which is classified as “critically undercapitalized” must be placed in conservatorship or receivership within 90 days of such determination unless it is also determined that some other course of action would better serve the purposes of the regulations. Critically undercapitalized institutions are also prohibited from making (but not accruing) any payment of principal or interest on subordinated debt without prior regulatory approval and regulators must prohibit a critically undercapitalized institution from taking certain other actions without prior approval, including (1) entering into any material transaction other than in the usual course of business, including investment expansion, acquisition, sale of assets or other similar actions; (2) extending credit for any highly leveraged transaction; (3) amending articles or bylaws unless required to do so to comply with any law, regulation or order; (4) making any material change in accounting methods; (5) engaging in certain affiliate transactions; (6) paying excessive compensation or bonuses; and (7) paying interest on new or renewed liabilities at rates which would increase the weighted average costs of funds beyond prevailing rates in the institution’s normal market areas.
Additional Regulations
Under FDICIA, the federal financial institution agencies have adopted regulations which require institutions to establish and maintain comprehensive written real estate policies which address certain lending considerations, including loan-to-value limits, loan administrative policies, portfolio diversification standards, and documentation, approval and reporting requirements. FDICIA further generally prohibits an insured bank from engaging as a principal in any activity that is impermissible for a national bank, absent Federal Deposit Insurance Corporation determination that the activity would not pose a significant risk to the Bank Insurance Fund, and that such bank is, and will continue to be, within applicable capital standards.
9
The Federal Financial Institutions Examination Council (“FFIEC”) utilizes the Uniform Financial Institutions Rating System (“UFIRS”), commonly referred to as “CAMELS,” to classify and evaluate the soundness of financial institutions. Bank examiners use the CAMELS measurements to evaluate capital adequacy, asset quality, management, earnings, liquidity and sensitivity to market risk. Effective January 1, 2005, bank holding companies such as the Company, became subject to evaluation and examination under a revised bank holding company rating system. This so-called BOPEC (Bank, Other subsidiaries, Parent, Earnings, Capital) rating system, implemented in 1979, has been focused primarily on financial condition, consolidated capital and consolidated earnings. The new rating system reflects a change toward analysis of risk management (as reflected in bank examination under the CAMELS measurements), in addition to financial factors and the potential impact of nondepository subsidiaries upon depository institution subsidiaries.
The federal financial institution agencies have established bases for analysis and standards for assessing financial institution’s capital adequacy in conjunction with the risk-based capital guidelines including analysis of interest rate risk, concentrations of credit risk, risk posed by non-traditional activities, and factors affecting overall safety and soundness. The safety and soundness standards for insured financial institutions include analysis of (1) internal controls, information systems and internal audit systems; (2) loan documentation; (3) credit underwriting; (4) interest rate exposure; (5) asset growth; (6) compensation, fees and benefits; and (7) excessive compensation for executive officers, directors or principal shareholders which could lead to material financial loss. If an agency determines that an institution fails to meet any standard, the agency may require the financial institution to submit to the agency an acceptable plan to achieve compliance with the standard. If the agency requires submission of a compliance plan and the institution fails to timely submit an acceptable plan or to implement an accepted plan, the agency must require the institution to correct the deficiency. The agencies may elect to initiate enforcement action in certain cases rather than rely on an existing plan particularly where failure to meet one or more of the standards could threaten the safe and sound operation of the institution.
Community Reinvestment Act (“CRA”) regulations evaluate banks’ lending to low and moderate income individuals and businesses across a four-point scale from “outstanding” to “substantial noncompliance,” and are a factor in regulatory review of applications to merge, establish new branches or form bank holding companies. In addition, any bank rated in “substantial noncompliance” with the CRA regulations may be subject to enforcement proceedings. First National Bank has a current rating of “satisfactory” for CRA compliance.
FDIC Insurance
On February 8, 2006, the Federal Deposit Insurance Reform Act of 2005 (the “Reform Act”), was enacted. The Reform Act had the effect of merging the Bank Insurance Fund and the Savings Association Insurance Fund into a new Deposit Insurance Fund (“DIF”). The FDIC released final regulations under the Reform Act on November 2, 2006 that established a revised risk-based deposit insurance assessment rate system for members of the DIF to insure, among other matters, that there will be sufficient assessment income for repayment of DIF obligations and to further refine the differentiation of risk profiles among institutions as a basis for assessments. The Reform Act established a Designated Reserve Ratio (“DRR”) that included a target range for the DRR of 1.15% to 1.50%.
The revised assessment rate system consolidates the nine categories of the prior assessment system into four categories (Risk Categories I, II, III and IV) and three Supervisory Groups (A, B and C) based upon institution’s capital levels and supervisory ratings. Risk Category I includes all well capitalized institutions with the highest supervisory ratings. Risk Category II includes adequately capitalized institutions that are assigned to Supervisory Groups A and B. Risk Category III includes all undercapitalized institutions that are assigned to Supervisory Groups A and B and institutions assigned to Supervisory Group C that are not undercapitalized but have a low supervisory rating. Risk Category IV includes all undercapitalized institutions that are assigned to Supervisory Group C.
10
On October 3, 2008, the Emergency Economic Stabilization Act of 2008 (the “EESA”) was signed into law. The EESA temporarily raised the limit on federal deposit insurance coverage provided by the FDIC from $100,000 to $250,000 per depositor, and on May 20, 2009, this increase was extended to December 31, 2013.
On October 14, 2008, the FDIC implemented the Temporary Liquidity Guarantee Program (the “TLGP”) to strengthen confidence and encourage liquidity in the financial system. The TLGP includes the Transaction Account Guarantee Program (the “TAGP”). The TAGP offers full guarantee for noninterest-bearing transaction accounts held at FDIC-insured depository institutions. The unlimited deposit coverage was voluntary for eligible institutions and was in addition to the $250,000 FDIC deposit insurance per account that was included as part of the EESA. The insured deposit limits are currently scheduled to return to $100,000 on December 31, 2013. The TAGP coverage became effective on October 14, 2008 and is scheduled to continue for participating institutions until June 30, 2010. In addition to the existing risk-based deposit insurance premium assessed on such deposits, TAGP participants will be assessed, on a quarterly basis, an annualized fee, based on the participant’s insurance risk rating up to 25 basis points, on balances in noninterest-bearing transaction accounts that exceed the existing deposit insurance limit of $250,000. The Bank has elected to participate in the TAGP.
On December 16, 2008, the FDIC approved an earlier proposed seven basis point rate increase for the first quarter 2009 assessment period effective January 1, 2009 as part of the DIF (Deposit Insurance Fund) restoration plan to achieve a minimum DRR (Designated Reserve Ratio) of 1.15% within five years.
On February 28, 2009, the FDIC established increased assessment rates effective as of April 1, 2009 and included adjustments to improve differentiation of risk profiles among institutions. The FDIC concurrently adopted an interim rule that imposed a 20 basis point emergency special assessment effective June 30, 2009, to be collected from all insured depository institutions on September 30, 2009, in addition to the imposition of an emergency special assessment of up to 10 basis points at the end of any calendar quarter after June 30, 2009 if the FDIC determines that the DRR will fall to a level that would adversely affect public confidence, among other factors. The changes to differentiate risk profiles will require riskier institutions to pay higher assessment rates based on classification into one of four risk categories. Within each category, the FDIC will be able to assess higher rates to institutions with a significant reliance on secured liabilities, which generally raises the FDIC’s loss in the event of failure without providing additional assessment revenue. Higher rates will be assessed for institutions with a significant reliance on brokered deposits but, for well-managed and well-capitalized institutions, only when accompanied by rapid asset growth. The changes also provide incentives in the form of a reduction in assessment rates for institutions to hold long-term unsecured debt and, for smaller institutions, high levels of Tier 1 capital. Together, the changes would improve the way the system differentiates risk among insured institutions and help ensure that a minimum DRR of at least 1.15% is achieved by the end of 2013.
11
On November 17, 2009, the FDIC amended its regulations and required all insured financial institutions to prepay their estimated quarterly risk-based assessments for the fourth quarter of 2009, and for all of 2010, 2011 and 2012. The prepaid assessment was collected on December 30, 2009 The FDIC also approved a three basis point increase in the assessment rate applied to insured financial institutions beginning in 2011. The amount of the Company’s prepaid assessment was $3,011,000.
Based upon the current assessment rate system, the Bank’s capital ratios and levels of deposits, the Bank anticipates a significant increase in operating expenses due to the FDIC insurance assessment rate expected to be applicable to the Bank during 2010 compared to the rate applicable to the Bank in 2009.
Limitation on Dividends
FNB Bancorp. The Company’s ability to pay cash dividends is subject to restrictions set forth in the California General Corporation Law. Also, the Company is required to make dividend payments to the U. S. Treasury on the shares of Preferred Stock that were issued on February 27, 2009, before the Company can pay dividends on its Common Stock.
Funds for payment of any cash dividends by the Company would be obtained from its investments as well as dividends and/or management fees from the Bank. The Bank’s ability to pay cash dividends is subject to restrictions imposed under the National Bank Act and regulations promulgated by the Office of the Comptroller of the Currency.
The Company has paid quarterly dividends for each quarter commencing with the second quarter of 2002. Future dividends will continue to be determined after consideration of the Company’s earnings, financial condition, future capital funds, regulatory requirements and other factors such as the Board of Directors may deem relevant. It is the intention of the Company to continue to pay cash dividends, subject to legal restrictions on the payment of cash dividends and depending upon the level of earnings, management’s assessment of future capital needs and other factors to be considered by the Board of Directors.
The California General Corporation Law provides that a corporation may make a distribution to its shareholders if the corporation’s retained earnings equal at least the amount of the proposed distribution. The California General Corporation Law further provides that, in the event sufficient retained earnings are not available for the proposed distribution, a corporation may nevertheless make a distribution to its shareholders if, after giving effect to the distribution, it meets two conditions, which generally stated are as follows: (i) the corporation’s assets must equal at least 125% of its liabilities; and (ii) the corporation’s current assets must equal at least its current liabilities or, if the average of the corporation’s earnings before taxes on income and before interest expense for the two preceding fiscal years was less than the average of the corporation’s interest expense for those fiscal years, then the corporation’s current assets must equal at least 125% of its current liabilities.
The Board of Governors of the Federal Reserve System generally prohibits a bank holding company from declaring or paying a cash dividend which would impose undue pressure on the capital of subsidiary banks or would be funded only through borrowing or other arrangements that might adversely affect a bank holding company’s financial position. The Federal Reserve Board policy is that a bank holding company should not continue its existing rate of cash dividends on its common stock unless its net income is sufficient to fully fund each dividend and its prospective rate of earnings retention appears consistent with its capital needs, asset quality and overall financial condition.
12
First National Bank of Northern California. As the Bank’s sole shareholder, the Company is entitled to receive dividends when and as declared by its Board of Directors, out of funds legally available therefore, subject to the restrictions set forth in the National Bank Act.
The payment of cash dividends by the Bank may be subject to the approval of the Office of the Comptroller of the Currency, as well as restrictions established by federal banking law and the Federal Deposit Insurance Corporation. Approval of the Office of the Comptroller of the Currency is required if the total of all dividends declared by the Bank’s board of directors in any calendar year will exceed the Bank’s net profits for that year combined with its retained net profits for the preceding two years, less any required transfers to surplus or to a fund for the retirement of preferred stock.
Additionally, the Federal Deposit Insurance Corporation and/or the Office of the Comptroller of the Currency, might, under some circumstances, place restrictions on the ability of a bank to pay dividends based upon peer group averages and the performance and maturity of that bank.
COMPETITION
Competitive Data
In its market area, the Bank competes for deposit and loan customers with other banks (including those with much greater resources), thrifts and, to a lesser extent, credit unions, finance companies and other financial service providers.
Larger banks may have a competitive advantage because of higher lending limits and major advertising and marketing campaigns, along with significant investment banking, trust and insurance operations, and international banking, services which the Bank is not authorized nor prepared to offer currently. The Bank has made arrangements with its correspondent banks and with others to provide some of these services for its customers. For borrowers requiring loans in excess of the Bank’s legal lending limits, the Bank has offered, and intends to offer in the future, such loans on a participating basis with its correspondent banks and with other independent banks, retaining the portion of such loans which is within its lending limits. As of December 31, 2009, the Bank’s aggregate legal lending limits to a single borrower and such borrower’s related parties were $12,438,000 on an unsecured basis and $20,729,000 on a fully secured basis, based on regulatory capital of $82,917,000. The Bank’s business is concentrated in its service area, which primarily encompasses San Mateo County, but also includes portions of the City and County of San Francisco. The economy of the Bank’s service area is dependent upon government, manufacturing, tourism, retail sales, population growth and smaller service oriented businesses.
Based upon the most recent information made available by the Federal Deposit Insurance Corporation Summary of Deposits at June 30, 2009, there were 33 commercial and savings banking institutions in San Mateo County with a total of $20,528,467,000 in deposits at June 30, 2009. The Bank had a total of 11 offices with total deposits of $470,650,000 at the same date, or 2.29% of the San Mateo County totals.
13
General Competitive Factors
In order to compete with the financial institutions in their primary service areas, community banks use, to the fullest extent possible, the flexibility which is accorded by their independent status. This includes an emphasis on specialized services, local promotional activity, and personal contacts by their respective officers, directors and employees. The Bank’s management and employees develop a thorough knowledge of local businesses and markets.
They also seek to provide special services and programs for individuals in their primary service area who are employed in the agricultural, professional and business fields, such as loans for equipment, furniture and tools of the trade or expansion of practices or businesses. In the event there are customers whose loan demands exceed their respective lending limits, they seek to arrange for such loans on a participation basis with other financial institutions. They also assist those customers requiring services not offered by either bank to obtain such services from correspondent banks.
Banking is a business that depends on interest rate differentials. In general, the difference between the interest rate paid by a bank to obtain their deposits and other borrowings and the interest rate received by a bank on loans extended to customers and on securities held in a bank’s portfolio comprise the major portion of a bank’s earnings. The Bank competes with savings and loan associations, credit unions, other financial institutions and other entities for funds. For instance, yields on corporate and government debt securities and other commercial paper affect the ability of commercial banks to attract and hold deposits. The Bank also competes for loans with savings and loan associations, credit unions, consumer finance companies, banking and other financial institutions, mortgage companies and other lending institutions.
The interest rate differentials of a bank, and therefore its earnings, are affected not only by general economic conditions, both domestic and foreign, but also by statutes and as implemented by federal agencies, particularly the Federal Reserve Board. The Federal Reserve Board can and does implement national monetary policy, such as seeking to curb inflation and combat recession, by its open market operations in United States government securities, adjustments in the amount of interest free reserves that banks and other financial institutions are required to maintain, and adjustments to the discount rates applicable to borrowing by banks from the Federal Reserve Board. These activities influence the growth of bank loans, investments and deposits and also affect interest rates charged on loans and paid on deposits. The nature and timing of any future changes in monetary policies and their impact on the Bank are not predictable.
Legislative and Regulatory Impact
Since 1996, California law implementing certain provisions of prior federal law has (1) permitted interstate merger transactions; (2) prohibited interstate branching through the acquisition of a branch business unit located in California without acquisition of the whole business unit of the California bank; and (3) prohibited interstate branching through de novo establishment of California branch offices. Initial entry into California by an out-of-state institution must be accomplished by acquisition or merger with an existing whole bank, which has been in existence for at least five years.
14
The federal financial institution agencies, especially the Office of the Comptroller of the Currency and the Board of Governors of the Federal Reserve System, have taken steps to increase the types of activities in which national banks and bank holding companies can engage, and to make it easier to engage in such activities. The Office of the Comptroller of the Currency has issued regulations permitting national banks to engage in a wider range of activities through subsidiaries.
“Eligible institutions” (those national banks that are well capitalized, have a high overall rating and a satisfactory CRA rating, and are not subject to an enforcement order) may engage in activities related to banking through operating subsidiaries subject to an expedited application process. In addition, a national bank may apply to the Office of the Comptroller of the Currency to engage in an activity through a subsidiary in which the Bank itself may not engage.
The Gramm-Leach-Bliley Act (the “Act”), eliminated most of the remaining depression-era “firewalls” between banks, securities firms and insurance companies which was established by the Banking Act of 1933, also known as the Glass-Steagall Act (“Glass-Steagall”). Glass-Steagall sought to insulate banks as depository institutions from the perceived risks of securities dealing and underwriting, and related activities. The Act repealed Section 20 of Glass-Steagall, which prohibited banks from affiliating with securities firms. Bank holding companies that can qualify as “financial holding companies” can now, among other matters, acquire securities firms or create them as subsidiaries, and securities firms can now acquire banks or start banking activities through a financial holding company. The Act includes provisions which permit national banks to conduct financial activities through a subsidiary that are permissible for a national bank to engage in directly, as well as certain activities authorized by statute, or that are financial in nature or incidental to financial activities to the same extent as permitted to a “financial holding company” or its affiliates. This liberalization of United States banking and financial services regulation applies both to domestic institutions and foreign institutions conducting business in the United States. Consequently, the common ownership of banks, securities firms and insurance is now possible, as is the conduct of commercial banking, merchant banking, investment management, securities underwriting and insurance within a single financial institution using a structure authorized by the Act.
Prior to the Act, significant restrictions existed on the affiliation of banks with securities firms and related securities activities. Banks were also (with minor exceptions) prohibited from engaging in insurance activities or affiliating with insurers. The Act removed these restrictions and substantially eliminated the prohibitions under the Bank Holding Company Act on affiliations between banks and insurance companies. Bank holding companies which qualify as financial holding companies can now, among other matters, insure, guarantee, or indemnify against loss, harm, damage, illness, disability, or death; issue annuities; and act as a principal, agent, or broker regarding such insurance services.
In order for a commercial bank to affiliate with a securities firm or an insurance company pursuant to the Act, its bank holding company must qualify as a financial holding company. A bank holding company will qualify if (i) its banking subsidiaries are “well capitalized” and “well managed” and (ii) it files with the Board of Governors a certification to such an effect and a declaration that it elects to become a financial holding company. The amendment of the Bank Holding Company Act now permits financial holding companies to engage in activities, and acquire companies engaged in activities, that are financial in nature or incidental to such financial activities. Financial holding companies are also permitted to engage in activities that are complementary to financial activities if the Board of Governors determines that the activity does not pose a substantial risk to the safety or soundness of depository institutions or the financial system in general. These standards expand upon the list of activities “closely related to banking” which to date have defined the permissible activities of bank holding companies under the Bank Holding Company Act.
15
One further effect of the Act was to require that federal financial institution and securities regulatory agencies prescribe regulation to implement the policy that financial institutions must respect the privacy of their customers and protect the security and confidentiality of customers’ non-public personal information. These regulations require, in general, that financial institutions (1) may not disclose non-public information of customers to non-affiliated third parties without notice to their customers, who must have an opportunity to direct that such information not be disclosed; (2) may not disclose customer account numbers except to consumer reporting agencies; and (3) must give prior disclosure of their privacy policies before establishing new customer relationships.
Neither the Company nor the Bank has determined whether or when it may seek to acquire and exercise new powers or activities under the Act, and the extent to which competition will change among financial institutions affected by the Act has not yet become clear.
OTHER LEGISLATION
The Patriot Act
On October 26, 2001, President Bush signed the USA Patriot Act (the “Patriot Act”), which includes provisions pertaining to domestic security, surveillance procedures, border protection, and terrorism laws to be administered by the Secretary of the Treasury. Title III of the Patriot Act entitled, “International Money Laundering Abatement and Anti-Terrorist Financing Act of 2001” includes amendments to the Bank Secrecy Act which expand the responsibilities of financial institutions in regard to anti-money laundering activities with particular emphasis upon international money laundering and terrorism financing activities through designated correspondent and private banking accounts.
Effective December 25, 2001, Section 313(a) of the Patriot Act prohibits any insured financial institution such as First National Bank, from providing correspondent accounts to foreign banks which do not have a physical presence in any country (designated as “shell banks”), subject to certain exceptions for regulated affiliates of foreign banks. Section 313(a) also requires financial institutions to take reasonable steps to ensure that foreign bank correspondent accounts are not being used to indirectly provide banking services to foreign shell banks, and Section 319(b) requires financial institutions to maintain records of the owners and agent for service of process of any such foreign banks with whom correspondent accounts have been established.
Effective July 23, 2002, Section 312 of the Patriot Act created a requirement for special due diligence for correspondent accounts and private banking accounts. Under Section 312, each financial institution that establishes, maintains, administers, or manages a private banking account or a correspondent account in the United States for a non-United States person, including a foreign individual visiting the United States, or a representative of a non-United States person shall establish appropriate, specific, and, where necessary, enhanced, due diligence policies, procedures, and controls that are reasonably designed to detect and record instances of money laundering through those accounts.
16
The Patriot Act contains various provisions in addition to Sections 313(a) and 312 that affect the operations of financial institutions by encouraging cooperation among financial institutions, regulatory authorities and law enforcement authorities with respect to individuals, entities and organizations engaged in, or reasonably suspected of engaging in, terrorist acts or money laundering activities. The Company and the Bank are not currently aware of any account relationships between the Bank and any foreign bank or other person or entity as described above under Sections 313(a) or 312 of the Patriot Act.
Certain surveillance provisions of the Patriot Act were scheduled to expire on December 31, 2005, and actions to restrict the use of the Patriot Act surveillance provisions were filed by the ACLU and other organizations. On March 9, 2006, after temporary extensions of the Patriot Act, President Bush signed the “USA Patriot Improvement and Reauthorization Act of 2005” and the “USA Patriot Act Additional Reauthorizing Amendments Act of 2006,” which reauthorized all expiring provisions of the Act and extended certain provisions related to surveillance and production of business records until December 31, 2009. The extended deadline for those provisions was subsequently further extended to February 28, 2010. On February 24 and 25, 2010, the Senate and the House of Representatives, respectively, voted to further extend the deadline until December 31, 2010 and President Obama has signed the legislation.
The effects which the Patriot Act and any amendments to the Patriot Act or any additional legislation enacted by Congress may have upon financial institutions is uncertain; however, such legislation could increase compliance costs and thereby potentially may have an adverse effect upon the Company’s results of operations.
Sarbanes-Oxley Act of 2002
On July 30, 2002, President George W. Bush signed into law the Sarbanes-Oxley Act of 2002 (the “Act”), legislation designed to address certain issues of corporate governance and accountability. The key provisions of the Act and the rules promulgated by the SEC pursuant to the Act include the following:
|
●
|
Expanded oversight of the accounting profession by creating a new independent public company oversight board to be monitored by the SEC.
|
|
|
●
|
Revised rules on auditor independence to restrict the nature of non-audit services provided to audit clients and to require such services to be pre-approved by the audit committee.
|
|
|
●
|
Improved corporate responsibility through mandatory listing standards relating to audit committees, certifications of periodic reports by the CEO and CFO and making issuer interference with an audit a crime.
|
|
|
●
|
Enhanced financial disclosures, including periodic reviews for largest issuers and real time disclosure of material company information.
|
|
|
●
|
Enhanced criminal penalties for a broad array of white collar crimes and increases in the statute of limitations for securities fraud lawsuits.
|
17
|
●
|
Disclosure of whether a company has adopted a code of ethics that applies to the company’s principal executive officer, principal financial officer, principal accounting officer or controller, or persons performing similar functions, and disclosure of any amendments or waivers to such code of ethics.
|
|
|
●
|
Disclosure of whether a company’s audit committee of its board of directors has a member of the audit committee who qualifies as an “audit committee financial expert.”
|
|
|
●
|
A prohibition on insider trading during pension plan black-out periods.
|
|
|
●
|
Disclosure of off-balance sheet transactions.
|
|
|
●
|
A prohibition on personal loans to directors and officers.
|
|
|
●
|
Conditions on the use of non-GAAP (generally accepted accounting principles) financial measures.
|
|
|
●
|
Standards of professional conduct for attorneys, requiring attorneys having an attorney-client relationship with a company, among other matters, to report “up the ladder” to the audit committee, to another board committee or to the entire board of directors regarding certain material violations.
|
|
|
●
|
Expedited filing requirements for Form 4 reports of changes in beneficial ownership of securities, reducing the filing deadline to within 2 business days of the date on which an obligation to report is triggered.
|
|
|
●
|
Accelerated filing requirements for reports on Forms 10-K and 10-Q by public companies which qualify as “accelerated filers,” with a phased-in reduction of the filing deadline for Form 10-K and Form 10-Q.
|
|
|
●
|
Disclosure concerning website access to reports on Forms 10-K, 10-Q and 8-K, and any amendments to those reports, by “accelerated filers” as soon as reasonably practicable after such reports and material are filed with or furnished to the SEC.
|
|
|
●
|
Rules requiring national securities exchanges and national securities associations to prohibit the listing of any security whose issuer does not meet audit committee standards established pursuant to the Act.
|
The Company’s securities are not currently listed on any exchange. In the event of such a listing in the future, in addition to the rules promulgated by the SEC pursuant to the Act, the Company would be required to comply with the listing standards applicable to all exchange listed companies.
The Company has incurred and it is anticipated that it will continue to incur costs to comply with the Act and the rules and regulations promulgated pursuant to the Act by the Securities and Exchange Commission of approximately $200,000 annually.
18
California Corporate Disclosure Act
Effective January 1, 2003, the California Corporate Disclosure Act (the “CCD Act”) required publicly traded corporations incorporated or qualified to do business in California to disclose information about their past history, auditors, directors and officers. Effective September 28, 2004, the CCD Act, as currently in effect and codified at California Corporations Code Section 1502.1, requires the Company to file with the California Secretary of State and disclose within 150 days after the end of its fiscal year certain information including the following:
|
●
|
The name of the company’s independent auditor and a description of services, if any, performed for a company during the previous two fiscal years and the period from the end of the most recent fiscal year to the date of filing;
|
|
|
●
|
The annual compensation paid to each director and the five most highly compensated non-director executive officers (including the CEO) during the most recent fiscal year, including all plan and non-plan compensation for all services rendered to a company as specified in Item 402 of Regulation S-K such as grants, awards or issuance of stock, stock options and similar equity-based compensation;
|
|
|
●
|
A description of any loans made to a director or executive officer at a “preferential” loan rate during the company’s two most recent fiscal years, including the amount and terms of the loans;
|
|
|
●
|
Whether any bankruptcy was filed by a company or any of its directors or executive officers within the previous 10 years;
|
|
|
●
|
Whether any director or executive officer of a company has been convicted of fraud during the previous 10 years; and
|
|
|
●
|
A description of any material pending legal proceedings other than ordinary routine litigation as specified in Item 103 of Regulation S-K and a description of such litigation where the company was found legally liable by a final judgment or order.
|
The Company does not currently anticipate that compliance with the CCD Act will have a material adverse effect upon its financial position or results of its operations or its cash flows.
Emergency Economic Stabilization Act of 2008
On October 3, 2008, the Emergency Economic Stabilization Act of 2008 (the “EESA”) was signed into law. Pursuant to the EESA, the United States Department of the Treasury (the “U.S. Treasury”) was granted the authority to take a range of actions for the purpose of stabilizing and providing liquidity to the U.S. financial markets and has implemented several programs, including the purchase by the U.S. Treasury of certain troubled assets from financial institutions under the Troubled Asset Relief Program” (the “TARP”) and the direct purchase by the U.S. Treasury of equity securities of financial institutions under the Capital Purchase Program (the “CPP”). A summary of the CPP appears below under “Recent Regulatory Developments.” The EESA also temporarily raised the limit on federal deposit insurance coverage provided by the FDIC from $100,000 to $250,000 per depositor. Please refer to the discussion of liquidity sources, following Table 14 in Item 7 below.
19
On February 27, 2009, as part of the CPP, the Company entered into a Letter Agreement and Securities Purchase Agreement – Standard Terms (collectively, the “Purchase Agreement”) with the U.S. Treasury. Pursuant to the Purchase Agreement, the Company (i) sold to the U.S. Treasury 12,000 shares of the Company’s Fixed Rate Cumulative Perpetual Preferred Stock, Series A (the “Series A Preferred Stock”), having a liquidation preference amount of $1,000 per share, for a purchase price of $12,000,000 in cash, and (ii) issued to the U.S. Treasury a warrant (the “Warrant”) to purchase 600 shares of the Company’s Fixed Rate Cumulative Perpetual Preferred Stock, Series B (the “Series B Preferred Stock”), at an exercise price of $0.01 per share. Immediately after the issuance of the Warrant, the U.S. Treasury exercised the Warrant in a cashless exercise resulting in the net issuance of 600 shares of the Series B Preferred Stock, having a liquidation preference amount of $1,000 per share, to the U.S. Treasury. The Series A Preferred Stock entitles its holder(s) to cumulative dividends on the liquidation preference amount on a quarterly basis at a rate of 5% per annum for the first five years, and 9% per annum thereafter. The Series B Preferred Stock entitles its holder(s) to cumulative dividends on the liquidation preference amount on a quarterly basis at a rate of 9% per annum from the date of issuance. Subject to certain conditions, the Series A and Series B Preferred Stock are redeemable at the option of the Company in whole or in part at a redemption price of 100% of the liquidation preference amount plus any accrued and unpaid dividends. So long as the Series A and Series B Preferred Stock remain outstanding, the Company will be subject to certain executive compensation and corporate governance requirements set forth in the EESA and regulations adopted pursuant to the EESA.
American Recovery and Reinvestment Act of 2009
On February 17, 2009, the American Recovery and Reinvestment Act of 2009 (the “ARRA”) was signed into law. Section 7001 of the ARRA amended Section 111 of the EESA in its entirety. While the U.S. Treasury must promulgate regulations to implement the restrictions and standards set forth in Section 7001, the ARRA, among other things, significantly expands the executive compensation restrictions previously imposed by the EESA. Such restrictions apply to any entity that has received or will receive financial assistance under the TARP, and shall generally continue to apply for as long as any obligation arising from financial assistance provided under the TARP, including preferred stock issued under the CPP, remains outstanding. These ARRA restrictions do not apply to any TARP recipient during such time when the federal government (i) only holds any warrants to purchase common stock of such recipient or (ii) holds no preferred stock or warrants to purchase common stock of such recipient. Since the Company participates in the CPP, the restrictions and standards set forth in Section 7001 of the ARRA are applicable to the Company.
Recent Regulatory Developments
In response to global credit and liquidity issues involving a number of financial institutions, the United States government, particularly the U.S. Treasury and the Federal financial institution regulatory agencies, have taken a variety of extraordinary measures designed to restore confidence in the financial markets and to strengthen financial institutions, including capital injections, guarantees of bank liabilities and the acquisition of illiquid assets from banks.
20
Capital Purchase Program. On October 24, 2008, the U.S. Treasury announced plans to direct $700 billion of the TARP funding into the CPP to acquire preferred stock investments in bank holding companies and banks. Requirements for bank holding companies and banks eligible to participate as a Qualifying Financial Institution (“QFI”) in the CPP include:
| ● |
Submission of an application prior to November 14, 2008 to the QFI’s Federal banking regulator to obtain preliminary approval to participate in the CPP;
|
|
| ● |
If the QFI receives preliminary approval, it will have 30 days within which to submit final documentation and fulfill any outstanding requirements;
|
|
| ● |
The minimum amount of capital eligible for purchase by the U.S. Treasury under the CPP is 1 percent of the Total Risk-Weighted Assets of the QFI and the maximum is the lesser of (i) an amount equal to 3 percent of the Total Risk-Weighted Assets of the QFI or (ii) $25 billion;
|
|
| ● |
Capital acquired by a QFI under the CPP will be accorded Tier 1 capital treatment;
|
|
| ● |
The preferred stock issued to the U.S. Treasury will be non-voting (except in the case of class votes), senior perpetual preferred stock that ranks senior to common stock and pari passu with existing preferred stock (except junior preferred stock);
|
|
| ● |
In addition to the preferred stock, the U.S. Treasury will be issued warrants to acquire shares of the QFI’s common stock equal in value to 15 percent of the amount of capital purchased by the QFI;
|
|
| ● |
Dividends are payable to the U.S. Treasury at the rate of 5% per annum for the first 5 years and 9% per annum thereafter;
|
|
| ● |
Subject to certain exceptions and other requirements, no redemption of the preferred stock is permitted during the first 3 years;
|
|
| ● |
Certain restrictions on the payment of dividends to shareholders of the QFI shall remain in effect while the preferred stock purchased by the U.S. Treasury is outstanding;
|
|
| ● |
Repurchase of the QFI’s stock requires consent of the U.S. Treasury, subject to certain exceptions;
|
|
| ● |
The preferred shares are not subject to any contractual restrictions on transfer by the U.S. Treasury; and
|
|
| ● |
The QFI must agree to be bound by certain executive compensation and corporate governance requirements and senior executive officers must agree to certain compensation restrictions.
|
|
| On February 27, 2009, as part of the CPP, the Company issued and sold shares of its Series A and Series B Preferred Stock to the U.S. Treasury See discussion above under “Emergency Economic Stabilization Act of 2008.” |
Temporary Liquidity Guarantee Program. Among other programs and actions taken by the U.S. Treasury and other regulatory agencies, the FDIC implemented the Temporary Liquidity Guarantee Program (the “TLGP”) to strengthen confidence and encourage liquidity in the financial system. The TLGP is comprised of the Debt Guarantee Program (the “DGP”) and the Transaction Account Guarantee Program (the “TAGP”). The Bank did not participate in the DGP Program. The DGP guarantees all newly issued senior unsecured debt (e.g., promissory notes, unsubordinated unsecured notes and commercial paper) up to prescribed limits issued by participating entities beginning on October 14, 2008 and continuing through April 30, 2010. For eligible debt issued by that date, the FDIC will provide the guarantee coverage until the earlier of the maturity date of the debt or December 31, 2012. The TAGP offers full guarantee for noninterest-bearing transaction accounts held at FDIC-insured depository institutions. The unlimited deposit coverage was voluntary for eligible institutions and was in addition to the $250,000 FDIC deposit insurance per account that was included as part of the EESA. The TAGP coverage became effective on October 14, 2008 and is currently scheduled to continue for participating institutions until June 30, 2010. The Bank has elected to participate in the TAGP.
21
Financial Stability Plan. On February 10, 2009, the U.S. Treasury announced a Financial Stability Plan (the “FSP”) as a comprehensive approach to strengthening the financial system and credit crisis.
The Plan includes a Capital Assistance Program (the “CAP”) that is intended to serve as a bridge to raising private capital and to ensure sufficient capital to preserve or increase lending in a worse-than-expected economic deterioration. Eligibility to participate in the CAP will be consistent with the criteria for QFI’s under the CPP. Eligible institutions with consolidated assets in excess of $100 billion will be able to obtain capital under the CAP, subject to a supervisory review process and comprehensive stress test assessment of the losses that could occur over a two year period in the future across a range of economic scenarios, including conditions more severe than anticipated or as typically used in capital planning processes.
Eligible institutions with consolidated assets below $100 billion will be able to obtain capital under the CAP after a supervisory review. As announced, the CAP includes issuance of a convertible preferred security to the U.S. Treasury at a discount to the participating institution’s stock price as of February 9, 2009, subject to a dividend to be determined. The security instrument will be designed to incentivize institutions to replace the CAP capital with private capital or redeem it. Institutions participating in the CPP under TARP may also be permitted to exchange their CPP preferred stock for the convertible preferred CAP security.
Term Asset-Backed Securities Loan Facility. On March 3, 2009, the U.S. Treasury and the Board of Governors announced the Term Asset-Backed Securities Loan Facility (the “TALF”). The TALF is one of the programs under the Financial Stability Plan announced by the U.S. Treasury on February 10, 2009. The TALF is intended to help stimulate the economy by facilitating securitization activities which allow lenders to increase the availability of credit to consumers and businesses.
Under the TALF, the Federal Reserve Bank of New York (“FRBNY”) will lend up to $200 billion to provide financing to investors as support for purchases of certain AAA-rated asset-backed securities (“ABS”) initially for newly and recently originated auto loans, credit card loans, student loans, SBA-guaranteed small business loans, and rental, commercial, and government vehicle fleet leases, small ticket equipment, heavy equipment, and agricultural equipment loans and leases.
ABS fundings are held monthly. The FRBNY presently intends to cease making new loans on June 30, 2010, but loans collateralized by certain types of ABS will cease on March 31, 2010, unless the Board of Governors extends the facility. The loan asset classes may be expanded in the future to include commercial mortgages, non-Agency residential mortgages, and/or other asset classes. Credit extensions under the TALF will be non-recourse loans to eligible borrowers secured by eligible collateral for a three-year term with interest paid monthly. Any U.S. company that owns eligible collateral may borrow from the TALF, provided the company maintains an account with a primary dealer who will act as agent for the borrower and deliver eligible collateral to the FRBNY custodian in connection with the loan funding. The FRBNY will create a special purpose vehicle (“SPV”) to purchase and manage any assets received by the FRBNY in connection with the TALF loans.
22
The U.S. Treasury will provide $20 billion of credit protection to the FRBNY in connection with the TALF through the Troubled Assets Relief Program (the “TARP”) by purchasing subordinated debt issued by the SPV to finance the first $20 billion of asset purchases. If more than $20 billion in assets are purchased by the SPV, the FRBNY will lend additional funds to the SPV to finance such additional purchases. The FRBNY’s loan to the SPV will be senior to the TARP subordinated loan and secured by all of the assets of the SPV.
Future Legislation and Regulations
Certain legislative and regulatory proposals that could affect the Company, the Bank, and the banking business in general are periodically introduced before the United States Congress, the California State Legislature and Federal and state government agencies. It is not known to what extent, if any, legislative proposals will be enacted and what effect such legislation would have on the structure, regulation and competitive relationships of financial institutions. It is likely, however, that such legislation could subject the Company and the Bank to increased regulation, disclosure and reporting requirements, competition, and costs of doing business.
In addition to legislative changes, the various Federal and state financial institution regulatory agencies frequently propose rules and regulations to implement and enforce already existing legislation. It cannot be predicted whether or in what form any such rules or regulations will be enacted or the effect that such regulations may have on the Company and the Bank.
In addition to the risks associated with the business of banking generally, as described above under Item 1 (Description of Business), the Company’s business, financial condition, operating results, future prospects and stock price can be adversely impacted by certain risk factors, as set forth below, any of which could cause the Company’s actual results to vary materially from recent results or from the Company’s anticipated future results.
Extensive Regulation of Banking. The Company’s operations are subject to extensive regulation by Federal, state and local governmental authorities and are subject to various laws and judicial and administrative decisions imposing requirements and restrictions on part or all of its operations. The Company believes that it is in substantial compliance in all material respects with laws, rules and regulations applicable to the conduct of its business. Because the Company’s business is highly regulated, the laws, rules and regulations applicable to it are subject to regular modification and change. There can be no assurance that these laws, rules and regulations, or any other laws, rules or regulations, will not be adopted in the future, which could make compliance much more difficult or expensive, restrict the Company’s ability to originate, broker or sell loans, further limit or restrict the amount of commissions, interest or other charges earned on loans originated or sold by the Company, or otherwise adversely affect the Company’s results of operations, financial condition, or future prospects.
23
Governmental Fiscal and Monetary Policies. The business of banking is affected significantly by the fiscal and monetary policies of the federal government and its agencies. Such policies are beyond the control of the Company. The Company is particularly affected by the policies established by the Board of Governors in relation to the supply of money and credit in the United States, and the target federal funds rate. The instruments of monetary policy available to the Board of Governors can be used in varying degrees and combinations to directly affect the availability of bank loans and deposits, as well as the interest rates charged on loans and paid on deposits, and this can and does have a material effect on the Company’s business, results of operations and financial condition. Federal monetary policy may also affect the longer-term inflation rate which directly affects the national and local economy.
The Effects of Legislation in Response to Current Credit Conditions. Legislation passed at the federal level and/or by the State of California in response to current conditions affecting credit markets could cause the Company to experience higher credit losses if such legislation reduces the amount that borrowers are otherwise contractually required to pay under existing loan contracts with the Bank. Such legislation could also result in the imposition of limitations upon the Bank’s ability to foreclose on property or other collateral or make foreclosure less economically feasible. Such events could result in increased loan losses and require a material increase in the allowance for loan losses and thereby adversely affect the Company’s results of operations, financial condition, future prospects, profitability and stock price.
Geographic Concentration. All of the banking offices of the Company are located in the Northern California Counties of San Mateo and San Francisco. The Company and the Bank conduct business primarily in the San Francisco Bay area. As a result, our financial condition, results of operations and cash flows are subject to changes in the economic conditions in this area. Our success depends upon the business activity, population, income levels, deposits and real estate activity in these markets, and adverse economic conditions could reduce our growth rate, or affect the ability of our customers to repay their loans, and generally impact our financial condition and results of operations. Economic conditions in the State of California are subject to various uncertainties at this time, including the budgetary and fiscal difficulties facing the State Government. The Company can provide no assurance that conditions in the California economy will not deteriorate further or that such deterioration will not adversely affect the Company.
Competition. Increased competition in the market of the Bank may result in reduced loans and deposits. Ultimately, the Bank may not be able to compete successfully against current and future bank and non bank competitors. Many competitors offer the banking services that are offered by the Bank in its service area. These competitors include national and super-regional banks, finance companies, investment banking and brokerage firms, credit unions, government-assisted farm credit programs, other community banks and technology-oriented financial institutions offering online services. In particular, the Bank’s competitors include several major financial companies whose greater resources may afford them a marketplace advantage by enabling them to maintain numerous banking locations and mount extensive promotional and advertising campaigns. Additionally, banks and other financial institutions with larger capitalization and financial intermediaries not subject to bank regulatory restrictions have larger lending limits and are thereby able to serve the credit needs of larger customers. Areas of competition include interest rates for loans and deposits, efforts to obtain deposits, and range and quality of products and services provided, including new technology-driven products and services. Technological innovation continues to contribute to greater competition in domestic and international financial services markets as technological advances, such as Internet-based banking services that cross traditional geographic bounds, enable more companies to provide financial services. If the Bank is unable to attract and retain banking customers, it may be unable to continue its loan growth and level of deposits, which may adversely affect its and the Company’s results of operations, financial condition and future prospects.
24
The Effects of Changes to FDIC Insurance Coverage Limits and Assessments. These changes are uncertain and increased premiums may adversely affect the Company. The FDIC charges insured financial institutions premiums to maintain the Deposit Insurance Fund. Current economic conditions have increased expectations for bank failures. In such event, the FDIC would take control of failed banks and guarantee payment of deposits up to applicable insured limits from the Deposit Insurance Fund. Insurance premium assessments to insured financial institutions may increase as necessary to maintain adequate funding of the Deposit Insurance Fund.
The Emergency Economic Stabilization Act of 2008 included a provision for an increase in the amount of deposits insured by the FDIC to $250,000. On October 24, 2008, the FDIC announced the Temporary Liquidity Guarantee Program that provides unlimited deposit insurance on funds in noninterest-bearing transaction deposit accounts not otherwise covered by the existing deposit insurance limit of $250,000. All eligible institutions will be covered under the program for the first 30 days without incurring any costs. After the initial period, participating institutions will be assessed a 10 basis point surcharge on the additional insured deposits through the scheduled end of the program, currently June 30, 2010. Increased premiums will negatively impact the Company’s earnings.
It is not clear how depositors may respond regarding the increase in insurance coverage. Despite the increase, some depositors may reduce the amount of deposits held at the Bank if concerns regarding bank failures persist, which could affect the level and composition of the Bank’s deposit portfolio and thereby directly impact the Bank’s funding costs and net interest margin. The Bank’s funding costs may also be adversely affected in the event that activities of the Federal Reserve Board and the U.S. Treasury to provide liquidity for the banking system and improvement in capital markets are curtailed or are unsuccessful. Such events could reduce liquidity in the markets, thereby increasing funding costs to the Bank or reducing the availability of funds to the Bank to finance its existing operations and thereby adversely affect the Company’s results of operations, financial condition, future prospects, profitability and stock price.
Dependence on Key Officers and Employees. We are dependent on the successful recruitment and retention of highly qualified personnel. Our ability to implement our business strategies is closely tied to the strengths of our executive officers who have extensive experience in the banking industry but who are not easily replaced. In addition, business banking, one of the Company’s principal lines of business, is dependent on relationship banking, in which the Bank personnel develop professional relationships with small business owners and officers of larger business customers who are responsible for the financial management of the companies they represent. If these employees were to leave the Bank and become employed by a local competing bank, we could potentially lose business customers. In addition, we rely on our customer service staff to effectively serve the needs of our consumer customers. We actively recruit for all open positions and management believes that its relations with employees are good.
25
Growth strategy. We have pursued and continue to pursue a growth strategy which depends primarily on generating an increasing level of loans and deposits at acceptable risk levels. We may not be able to sustain this growth strategy without establishing new branches or new products. We may attempt to expand in our current market by opening or acquiring branch offices or other financial institutions or branch offices or through a purchase, in whole or in part, of other financial institutions. This expansion may require significant investments in equipment, technology, personnel and site locations. We cannot assure you of our success in implementing our growth strategy either through expansion of our existing branch system or through mergers and acquisitions, and there may be significant increases in our noninterest expenses, without any corresponding balance sheet growth.
Commercial loans. As of December 31, 2009, approximately 13.5% of our loan portfolio consisted of commercial business loans, which could have a higher degree of risk than other types of loans. Commercial lending is dependent on borrowers making payments on their loans and lines of credit in accordance with the terms of their notes. Our current economic recession has made it difficult for many commercial borrowers to make their required loan payments. This credit risk is increased when there is a concentration of principal in a limited number of loans and borrowers, the mobility of collateral, the effect of general economic conditions and the increased difficulty of evaluating and monitoring these types of loans. The availability of funds for the repayment of commercial business loans may be substantially dependent on the success of the business itself and the general economic environment. If the cash flow from business operations is reduced, the borrower’s ability to repay the loan may be impaired. In addition, unlike residential mortgage loans, which generally are made on the basis of the borrower’s ability to make repayment from his or her employment and other income and which are secured by real property whose value tends to be more easily ascertainable, commercial business loans typically are made on the basis of the borrower’s ability to make repayment from the cash flow of the borrower’s business. If the Bank is required to repossess equipment or pursue collection efforts under personal guarantees, there could be a substantial decrease in value of collateral, if any, increased legal costs, and an increased risk of loss on the amount outstanding.
Real Estate Values. A large portion of the loan portfolio of the Company is dependent on the performance of our real estate portfolio. At December 31, 2009, real estate (including construction loans) served as the principal source of collateral with respect to approximately 86.0% of the Company’s loan portfolio. The current substantial decline in the economy in general, coupled with a continued decline in real estate values in the Company’s primary operating market areas could have an adverse effect on the demand for new loans, the ability of borrowers to repay outstanding loans, and the value of real estate and other collateral securing loans. Real estate values have declined, due in part to reduced construction lending, tighter underwriting requirements, and reduced borrower ability to make payments. Real estate loans may pose collection problems, resulting in increased collection expenses, and delays in the ultimate collection of these loans.
In addition, acts of nature, including fires, earthquakes and floods, which may cause uninsured damage and other loss of value to real estate that secures these loans, may also negatively impact the Company’s financial condition.
26
Allowance for Loan and Lease Losses. The Company maintains an allowance for loan losses to provide for loan defaults and non-performance, but its allowance for loan losses may not be adequate to cover actual loan and lease losses. In addition, future provisions for loan and lease losses could materially and adversely affect the Company and therefore the Company’s operating results. The Company’s allowance for loan and lease losses is based on prior experience, as well as an evaluation of the risks in the current portfolio. The amount of future losses is susceptible to changes in economic, operating and other conditions, including changes in interest rates that may be beyond the Company’s control, and these losses may exceed current estimates. Federal regulatory agencies, as an integral part of their examination process, review the Company’s loans and the allowance for loan and lease losses. Although we believe that the Company’s allowance for loan and lease losses is adequate to cover current losses, we cannot assure you that it will not further increase the allowance for loan and lease losses or that the regulators will not require it to increase this allowance. Either of these occurrences could materially and adversely affect the Company’s earnings.
Environmental Liabilities. In the course of our business, we may foreclose and take title to real estate, and could become subject to environmental liabilities with respect to these properties. We may be held liable to a governmental entity or third parties for property damage, personal injury, investigation and clean-up costs incurred by these parties in connection with environmental contamination, or may be required to investigate or clean up hazardous or toxic substances, or chemical releases at a property. The costs associated with investigations or remediation activities could be substantial. In addition, as the owner or former owner of a contaminated site, we could become subject to common law claims by third parties based on damages and costs resulting from environmental contamination emanating from the property. If we ever become subject to significant environmental liabilities, our business prospects, financial condition, liquidity, results of operations and stock price could be materially and adversely affected.
Dilution of Common Stock. Shares of the Company’s common stock eligible for future sale could have a dilutive effect on the market for common stock and could adversely affect the market price.
The Articles of Incorporation of the Company authorize the issuance of 10,000,000 shares of common stock, of which approximately 3,182,000 were outstanding at December 31, 2009. Pursuant to its 1997, 2002 and 2008 Stock Option Plans, at December 31, 2009, the Company had outstanding options to purchase a total of 430,034 shares of common stock. As of December 31, 2009, 269,460 shares of common stock remained available for grants under the 2008 Stock Option Plan as well as an additional 39,020 shares under the 2002 Stock Option Plan. The issuance of substantial amounts of the Company’s newly issued common stock in the public market could adversely affect the market price of the Company’s common stock. The market for the Company’s common stock is limited. The ability to raise funds in the future through a stock offering could be difficult.
Operating Losses. The Company is subject to certain operations risks, including, but not limited to, data processing system failures and errors and customer or employee fraud.
The Company maintains a system of internal controls to mitigate against such occurrences and maintains insurance coverage for such risks, but should such an event occur that is not prevented or detected by the Company’s internal controls, uninsured or in excess of applicable insurance limits, it could have a significant adverse impact on the Company’s business, financial condition or results of operations. Additionally, the Company is dependent on network and computer systems. If these systems and their back-up systems were to fail or were breached, the Company could be adversely affected.
27
Business Confidence Uncertainty. Terrorist activities in the future and the actions taken by the United States and its allies in combating terrorism on a worldwide basis could adversely impact the Company and the extent of such impact is uncertain. Even more so, the problems in the mortgage and credit markets, the government conservatorship of Fannie Mae and Freddie Mac, the failure of investment firms such as Bear Stearns and Lehman Brothers, and the bailout of AIG Inc., the insurance giant, as well as large write-offs at some major financial institutions have had a ripple effect on the entire financial services industry, and may continue to do so for some time. Such events have had and may continue to have an adverse effect on the economy in the Company’s market areas. Such continued economic deterioration could adversely affect the Company’s future results of operations by, among other matters, reducing the demand for loans and the amounts required to be reserved for loan losses, reducing the value of collateral held as security for the Company’s loans, and causing a decline in the Company’s stock price.
Restrictions in Purchase Agreement with U.S. Treasury. The Purchase Agreement between the Company and the U.S. Treasury dated February 27, 2009, pursuant to which the Company sold $12 million of the Company’s Series A Preferred Stock and issued 600 shares of the Company’s Series B Preferred Stock (upon exercise of the Warrant issued to the U.S. Treasury), provides that prior to the earlier of (1) February 27, 2012 and (2) the date on which all of the shares of the U.S. Treasury Preferred Stock have been redeemed by the Company or transferred by the U.S. Treasury to third parties, the Company may not, without the consent of the Treasury, (a) declare or pay any dividend or make any distribution on capital stock or other equity securities of any kind of the Company other than (i) regular quarterly cash dividends of not more than the amount of the last quarterly cash dividend per share declared, or (ii) dividends payable solely in shares of common stock, or (b) subject to limited exceptions, redeem, repurchase or otherwise acquire shares of the Company’s common stock or preferred stock other than the U.S. Treasury Preferred Stock. In addition, the Company is unable to pay any dividends on the Company’s common stock unless the Company is current in the Company’s dividend payments on the U.S. Treasury Preferred Stock. These restrictions could have a negative effect on the value of the Company’s common stock. Dividends paid by the Company on the shares of U.S. Treasury Preferred Stock will reduce the net income available to the holders of Company common stock and the Company’s earnings per common share. The holders of the Company’s common stock are entitled to receive dividends only when, as and if declared by the Company’s Board of Directors. Although the Company has historically paid stock and cash dividends on the Company’s common stock, the Company is not required to do so and the Company’s Board of Directors could reduce or eliminate these common stock dividends in the future, depending on the circumstances.
The U.S. Treasury Preferred Stock will also receive preferential treatment in the event of liquidation, dissolution or winding up of the Company.
Restrictions on Executive Compensation. Pursuant to the terms of the Purchase Agreement, the Company adopted certain standards for executive compensation and corporate governance. These standards generally apply to the Company’s Chief Executive Officer, the Chief Financial Officer and the three next most highly compensated senior executive officers. The standards (1) ensure that incentive compensation for senior executives does not encourage unnecessary and excessive risks that threaten the value of the financial institution; (2) require “clawback” of any bonus or incentive compensation paid to a senior executive based on statements of earnings, gains or other criteria that are later proven to be materially inaccurate; (3) prohibit making golden parachute payments to senior executives; and (4) confirm agreement not to deduct for tax purposes executive compensation in excess of $500,000 for each senior executive. Pursuant to the American Recovery and Reinvestment Act of 2009, further compensation restrictions, including significant limitations on incentive compensation and “golden parachute” payments, have been imposed on the Company’s most highly compensated employees, which could, in the future, make it more difficult for the Company to retain and recruit qualified personnel.
28
Federal Home Loan Bank Risk. The failure of the Federal Home Loan Bank (“FHLB”) of San Francisco or the national Federal Home Loan Bank System may have a material negative impact on our earnings and liquidity.
Even though the FHLB of San Francisco has announced it does not anticipate that additional capital is immediately necessary, nor does it believe that its capital level is inadequate to support realized losses in the future, the FHLB of San Francisco could require its members, including the Bank, to contribute additional capital in order to return the FHLB of San Francisco to compliance with capital guidelines.
At December 31, 2009, we held $4.4 million of common stock in the FHLB of San Francisco. Should the FHLB of San Francisco fail, we anticipate that our investment in the FHLB’s common stock would be “other than temporarily” impaired and may have no value.
At December 31, 2009, we maintained a line of credit with the FHLB of San Francisco equal to approximately 30% of total assets to the extent the Bank provides qualifying collateral and holds sufficient FHLB stock. At December 31, 2009, we were in compliance with collateral requirements. The Company also maintained a Line of Credit available with the Federal Reserve Bank of San Francisco (“FRB”) of $34,124,000 as of December 31, 2009 that was secured by commercial and construction loans. In addition, we have an unsecured Federal Funds line of up to $25,000,000 At year end. We are highly dependent on the FHLB of San Francisco to provide the primary source of wholesale funding for immediate liquidity and borrowing needs. The failure of the FHLB of San Francisco or the FHLB system in general, may materially impair our ability to meet our growth plans or to meet short and long term liquidity demands.
None.
The Company does not own any real property. Since its incorporation on February 28, 2001, the Company has conducted its operations at the administrative offices of the Bank, located at 975 El Camino Real, South San Francisco, California 94080.
The Bank owns the land and building at 975 El Camino Real, South San Francisco, California 94080. The premises consist of a modern, three-story building of approximately 15,000 square feet and off-street parking for employees and customers of approximately 45 vehicles.
29
The Buri Buri Branch Office of the Bank is located on the ground floor of this three-story building and administrative offices, including the offices of senior management, occupy the second and third floors.
The Bank owns the land and two-story building occupied by the Daly City Branch Office (6600 Mission Street, Daly City, CA 94014); the land and two-story building occupied by the Colma Branch Office (1300 El Camino Real, Colma, CA 94014); the land and two-story building occupied by the South San Francisco Branch Office (211 Airport Boulevard, South San Francisco, CA 94080); the land and two-story building occupied by the Redwood City Branch Office (700 El Camino Real, Redwood City, CA 94063); the land and two-story building occupied by the Millbrae Branch Office (1551 El Camino Real, Millbrae, CA 94030); the land and single-story building occupied by the Half Moon Bay Branch Office (756 Main Street, Half Moon Bay, CA 94019); and the land and two-story building occupied by the Pescadero Branch Office (239 Stage Road, Pescadero, CA 94060). All properties include adequate vehicle parking for customers and employees.
The Bank leases premises at 1450 Linda Mar Shopping Center, Pacifica, California 94044, for its Linda Mar Branch Office. This ground floor space of approximately 4,100 square feet is leased from Fifty Associates and Demartini/Linda Mar, LLC. The original lease term was 10 years and expired on September 1, 2009. The lease has been renewed for a further ten years and will expire on August 31, 2019.
The Bank leases premises at 210 Eureka Square, Pacifica, California 94044, for its Eureka Square Branch Office. This ground floor space of approximately 3,000 square feet is leased from Joseph A. Sorci and Eldiva Sorci. The lease term is for 5 years, commencing January 1, 1995, with two 5-year options to extend the lease term, the second of which has been exercised and expired on December 31, 2009. The premises are currently on a month-to-month basis.
The Bank leases premises at 65 Post Street, San Francisco, CA 94104, for its Financial District Office. The current lease term expires April 30, 2013, with one 5-year option to extend the lease remaining. The location consists of approximately 2,826 square feet of street level, 1,322 square feet of basement, and 1,077 square feet of mezzanine space.
The Bank leases premises at 6599 Portola Drive, San Francisco, CA 94127, for its Portola Office. The current lease expires June 30, 2012, and has a remaining 2-year option to extend the lease to June 30, 2014. The location consists of approximately 1,325 square feet of street level space.
The Bank leases premises at 150 East Third Avenue, San Mateo, CA 94401, for its San Mateo Branch Office. The current lease term, expires July 31, 2013. It has one remaining five-year option to extend the lease. The location consists of approximately 4,000 square feet of ground floor usable commercial space.
The Bank leases a warehouse facility at 450 Cabot Road, South San Francisco, CA 94080. The lease term is for 5 years and one half month, and will expire February 28, 2011. The facility consists of approximately 7,600 square feet of office/warehouse space.
30
The foregoing summary descriptions of leased premises are qualified in their entirety by reference to the full text of the lease agreements listed as exhibits to this report.
There are no material legal proceedings adverse to the Company or the Bank to which any director, officer, affiliate of the Company, or 5% shareholder of the Company, or any associate of any such director, officer, affiliate or 5% shareholder of the Company are a party, and none of the foregoing persons has a material interest adverse to the Company or the Bank.
From time to time, the Company and/or the Bank are a party to claims and legal proceedings arising in the ordinary course of business. The Company’s management is not aware of any material pending legal proceedings to which either it or the Bank may be a party or has recently been a party, which will have a material adverse effect on the financial condition or results of operations of the Company and the Bank, taken as a whole.
ITEM 5. MARKET FOR REGISTRANT’S COMMON EQUITY, RELATED STOCKHOLDER MATTERS AND ISSUER PURCHASES OF EQUITY SECURITIES
Since March 18, 2002, the common stock of the Company has been quoted on the OTC Bulletin Board under the trading symbol, “FNBG.” There has been limited trading in the shares of common stock of the Company. On February 28, 2010, the Company had approximately 700 shareholders of common stock of record.
The following table summarizes sales of the Common Stock of the Company during the periods indicated of which management has knowledge, including the approximate high and low bid prices during such periods and the per share cash dividends declared for the periods indicated. All information has been adjusted to reflect 5% stock dividends effected on December 15, 2008 and on December 15, 2009. The prices indicated below reflect inter-dealer prices, without retail mark-up, mark-down or commission and may not necessarily represent actual transactions.
|
Bid Price of FNB Bancorp
|
Cash
|
|||||||||||
|
Common Stock
|
Dividends
|
|||||||||||
|
|
High
|
Low
|
Declared (1)
|
|||||||||
| 2008 | ||||||||||||
|
First Quarter
|
$ | 24.4650 | $ | 21.5250 | $ | 0.15 | ||||||
|
Second Quarter
|
23.1000 | 16.2750 | 0.15 | |||||||||
|
Third Quarter
|
16.9050 | 11.5500 | 0.15 | |||||||||
|
Fourth Quarter
|
13.0000 | 10.1500 | 0.15 | |||||||||
|
2009
|
||||||||||||
|
First Quarter
|
$ | 12.2850 | $ | 10.5105 | $ | 0.15 | ||||||
|
Second Quarter
|
$ | 12.1800 | $ | 10.6575 | 0.15 | |||||||
|
Third Quarter
|
$ | 10.4475 | $ | 7.1925 | 0.05 | |||||||
|
Fourth Quarter
|
10.2500 | 7.0500 | 0.05 | |||||||||
See Item 1, “Limitations on Dividends,” above, for a description of the limitations applicable to the payment of dividends by the Company.
31
STOCK PERFORMANCE GRAPH
Set forth below is a line graph comparing the annual percentage change in the cumulative total return on the Company’s Common Stock with the cumulative total return of the SNL Securities Index of Pink Banks (asset size of over $500 million) and the Russell 2000 Index as of the end of each of the last five fiscal years.
The graph assumes that $100.00 was invested on December 31, 2004 in the Company’s Common Stock and each index, and that all dividends were reinvested. Returns have been adjusted for any stock dividends and stock splits declared by the Company. Shareholder returns over the indicated period should not be considered indicative of future shareholder returns.
| FNB Bancorp |
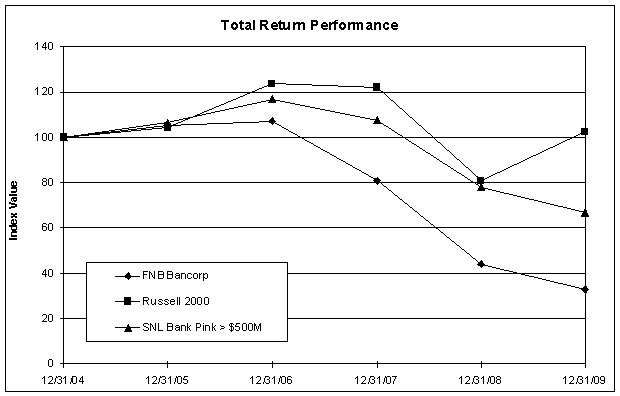
| Period Ending | ||||||||||||||||||
|
Index
|
12/31/04
|
12/31/05
|
12/31/06
|
12/31/07
|
12/31/08
|
12/31/09
|
||||||||||||
|
FNB Bancorp
|
100.00 | 105.10 | 107.30 | 80.75 | 44.05 | 32.85 | ||||||||||||
|
Russell 2000
|
100.00 | 104.55 | 123.76 | 121.82 | 80.66 | 102.58 | ||||||||||||
|
SNL Bank Pink > $500M
|
100.00 | 106.42 | 116.77 | 107.59 | 78.07 | 66.75 | ||||||||||||
ISSUER PURCHASES OF EQUITY SECURITIES
On August 24, 2007, the Board of Directors of the Company authorized a stock repurchase program which calls for the repurchase of up to five percent (5%) of the Company’s then outstanding 2,863,635 shares of Common Stock, or 143,182 shares. There were no repurchases during the quarter ended December 31, 2009. There were 10,457 shares remaining that may be purchased under this Plan as of December 31, 2009. Effective February 27, 2009, based on the Purchase Agreement with the U. S. Treasury, the Company may not repurchase Company common stock so long as the Treasury’s Preferred Stock investment is outstanding.
32
The following table presents a summary of selected financial information that should be read in conjunction with the Company’s consolidated financial statements and notes thereto included under Item 8 - “FINANCIAL STATEMENTS AND SUPPLEMENTARY DATA.”
|
Dollar amounts in thousands, except
|
At and for the years ended December 31, | |||||||||||||||||||
|
per share amounts and ratios
|
2009
|
2008
|
2007
|
2006
|
2005
|
|||||||||||||||
|
STATEMENT OF INCOME DATA
|
||||||||||||||||||||
|
Total interest income
|
$ | 35,817 | $ | 39,427 | $ | 42,290 | $ | 37,196 | $ | 30,732 | ||||||||||
|
Total interest expense
|
9,011 | 11,507 | 13,657 | 9,821 | 5,533 | |||||||||||||||
|
Net interest income
|
26,806 | 27,920 | 28,633 | 27,375 | 25,199 | |||||||||||||||
|
Provision for loan losses
|
4,596 | 3,045 | 690 | 683 | 628 | |||||||||||||||
|
Net interest income after provision for loan losses
|
22,210 | 24,875 | 27,943 | 26,692 | 24,571 | |||||||||||||||
|
Total noninterest income
|
5,387 | 5,045 | 4,300 | 6,259 | 3,841 | |||||||||||||||
|
Total noninterest expenses
|
27,585 | 25,346 | 23,182 | 21,760 | 20,255 | |||||||||||||||
|
Earnings before provision for income taxes
|
12 | 4,574 | 9,061 | 11,191 | 8,157 | |||||||||||||||
|
Provision for income taxes
|
(581 | ) | 611 | 2,382 | 3,609 | 2,429 | ||||||||||||||
|
Net earnings
|
593 | 3,963 | 6,679 | 7,582 | 5,728 | |||||||||||||||
|
Dividends and discount accretion on preferred stock
|
632 |
—
|
—
|
—
|
—
|
|||||||||||||||
|
Net (loss) earnings available to common shareholders
|
$ | (39 | ) | $ | 3,963 | $ | 6,679 | $ | 7,582 | $ | 5,728 | |||||||||
|
PER SHARE DATA - see note (1)
|
||||||||||||||||||||
|
Net earnings per share:
|
||||||||||||||||||||
|
Basic
|
$ | (0.01 | ) | $ | 1.23 | $ | 2.03 | $ | 2.37 | $ | 1.80 | |||||||||
|
Diluted
|
$ | (0.01 | ) | $ | 1.22 | $ | 2.00 | $ | 2.25 | $ | 1.71 | |||||||||
|
Cash dividends per share
|
$ | 0.30 | $ | 0.60 | $ | 0.60 | $ | 0.60 | $ | 0.60 | ||||||||||
|
Weighted average shares outstanding:
|
||||||||||||||||||||
|
Basic
|
3,182,000 | 3,231,000 | 3,296,000 | 3,203,000 | 3,181,000 | |||||||||||||||
|
Diluted
|
3,203,000 | 3,254,000 | 3,332,000 | 3,363,000 | 3,340,000 | |||||||||||||||
|
Shares outstanding at period end
|
3,182,000 | 3,030,000 | 2,965,000 | 2,853,000 | 2,700,000 | |||||||||||||||
|
Book value per share
|
$ | 24.78 | $ | 22.49 | $ | 22.44 | $ | 21.75 | $ | 20.46 | ||||||||||
|
BALANCE SHEET DATA
|
||||||||||||||||||||
|
Investment securities
|
97,188 | 99,221 | 94,432 | 94,945 | 113,463 | |||||||||||||||
|
Net loans
|
494,349 | 497,984 | 489,574 | 419,437 | 380,224 | |||||||||||||||
|
Allowance for loan losses
|
9,829 | 7,075 | 5,638 | 5,002 | 4,374 | |||||||||||||||
|
Total assets
|
708,309 | 660,957 | 644,465 | 581,270 | 569,314 | |||||||||||||||
|
Total deposits
|
598,964 | 500,910 | 499,255 | 481,567 | 507,544 | |||||||||||||||
|
Shareholders’ equity
|
78,865 | 68,149 | 66,545 | 62,063 | 55,243 | |||||||||||||||
|
SELECTED PERFORMANCE DATA
|
||||||||||||||||||||
|
Return on average assets
|
(0.01 | %) | 0.60 | % | 1.07 | % | 1.32 | % | 1.08 | % | ||||||||||
|
Return on average equity
|
(0.05 | %) | 5.87 | % | 10.39 | % | 12.86 | % | 10.75 | % | ||||||||||
|
Net interest margin
|
4.47 | % | 4.75 | % | 5.05 | % | 5.26 | % | 5.27 | % | ||||||||||
|
Average loans as a percentage of average deposits
|
91.32 | % | 97.93 | % | 91.74 | % | 78.92 | % | 77.80 | % | ||||||||||
|
Average total stockholders’ equity as a percentage of average total assets
|
11.31 | % | 10.25 | % | 10.31 | % | 10.25 | % | 10.06 | % | ||||||||||
|
Common dividend payout ratio
|
n/a | 44.71 | % | 25.69 | % | 21.43 | % | 26.92 | % | |||||||||||
|
SELECTED ASSET QUALITY RATIOS
|
||||||||||||||||||||
|
Net loan charge-offs to average loans
|
0.37 | % | 0.32 | % | 0.01 | % | 0.01 | % | 0.02 | % | ||||||||||
|
Allowance for loan losses/Total Loans
|
1.95 | % | 1.40 | % | 1.14 | % | 1.18 | % | 1.14 | % | ||||||||||
|
CAPITAL RATIOS
|
||||||||||||||||||||
|
Total risk-based capital
|
14.29 | % | 11.86 | % | 11.47 | % | 12.00 | % | 11.59 | % | ||||||||||
|
Tier 1 risk-based capital
|
13.04 | % | 10.67 | % | 10.52 | % | 11.05 | % | 10.67 | % | ||||||||||
|
Tier 1 leverage capital
|
10.77 | % | 9.70 | % | 9.89 | % | 10.08 | % | 9.50 | % | ||||||||||
(1) per share data has been adjusted for stock dividends.
33
ITEM 7. MANAGEMENT’S DISCUSSION AND ANALYSIS OF FINANCIAL CONDITION AND RESULTS OF OPERATIONS OF FNB BANCORP AND SUBSIDIARY
Critical Accounting Policies And Estimates
Management’s discussion and analysis of its financial condition and results of operations are based upon the Company’s financial statements, which have been prepared in accordance with accounting principles generally accepted in the United States of America. The preparation of these financial statements requires the Company to make estimates and judgments that affect the reported amounts of assets, liabilities, revenues and expenses, and related disclosure of contingent assets and liabilities. On an on-going basis, the Company evaluates its estimates, including those related to its loans and allowance for loan losses. The Company bases its estimates on current market conditions, historical experience and on various other assumptions that are believed to be reasonable under the circumstances, the results of which form the basis for making judgments about the carrying values of assets and liabilities that are not readily apparent from other sources. Actual results may differ from these estimates under different assumptions or conditions. All adjustments that, in the opinion of management, are necessary for a fair presentation for the periods presented have been reflected as required by Regulation S-X, Rule 10-01. The Company believes the following critical accounting policy requires significant judgments and estimates used in the preparation of the consolidated financial statements.
Allowance for Loan Losses
The allowance for loan losses is periodically evaluated for adequacy by management. Factors considered include the Company’s loan loss experience, known and inherent risks in the portfolio, current economic conditions, known adverse situations that may affect the borrower’s ability to repay, regulatory policies, and the estimated value of underlying collateral. The evaluation of the adequacy of the allowance is based on the above factors along with prevailing and anticipated economic conditions that may impact borrowers’ ability to repay loans. Determination of the allowance is part objective and part a subjective judgment by management given the information it currently has in its possession. Adverse changes in any of these factors or the discovery of new adverse information could result in higher charge-offs and loan loss provisions.
Goodwill
Goodwill arises when the Company’s purchase price exceeds the fair value of net assets of an acquired business. Goodwill represents the value attributable to intangible elements acquired. The value of goodwill is supported ultimately by profit from the acquired business. A decline in earnings could lead to impairment, which would be recorded as a write-down in the Company’s consolidated statements of income. Events that may indicate goodwill impairment include significant or adverse changes in results of operations of the acquired business or asset, economic or political climate; an adverse action or assessment by a regulator; unanticipated competition; and a more-likely-than-not expectation that a reporting unit will be sold or disposed of at a loss.
34
Other Than Temporary Impairment
The decline in the fair value of any security in the Company’s investment portfolio that is considered other than temporarily impaired is written down with a charge to noninterest income in the period in which the impairment occurs in an amount that equals the book value less the fair value of the security. There are many factors that are considered before an other than temporary impairment is recorded. These factors include the length of time and the extent to which market value has been less than cost, reasons for decline in market price – whether an industry issue or issuer specific, changes in the general market condition of the area or issuer’s industry, the Company’s intent to sell the investment security, the possibility the Company may be required to sell the investment security, the issuer’s financial condition, capital strength, ability to make timely future payments and any changes in agencies ratings that drop the security’s rating below investment grade and any potential legal actions.
Provision for Income Taxes
The Company is subject to income tax laws of the United States, its states, and municipalities in which it operates. The Company considers its income tax provision methodology to be critical, as the determination of current and deferred taxes based on complex analyses of many factors including interpretation of federal and state laws, the difference between tax and financial reporting bases of assets and liabilities (temporary differences), estimates of amounts due or owed, the timing of reversals of temporary differences and current financial standards. Actual results could differ significantly from the estimates due to tax law interpretations used in determining the current and deferred income tax liabilities. Additionally, there can be no assurances that estimates and interpretations used in determining income tax liabilities may not be challenged by federal and state taxing authorities.
Recent Accounting Pronouncements
The Company has adopted guidance as codified by the Financial Accounting Standards Board (“FASB”) which refers to “Interim Disclosures about Fair Value of Financial Instruments” which was issued in April 2009. This guidance amends earlier guidance on the same subject as well as guidance regarding “Interim Financial Reporting” by requiring disclosures about fair value of financial instruments for interim reporting periods of publicly traded companies as well as in annual financial statements and requiring disclosures in summarized financial information at interim reporting periods. This guidance is effective for interim reporting periods ending after June 15, 2009; early adoption is permitted for periods ending after March 15, 2009. This guidance did not have a material impact on the Company’s financial statements.
The Company has adopted guidance as codified by the FASB issued in April 2009, which amends the other-than-temporary impairment guidance in U. S. GAAP for debt securities to make the guidance more operational and to improve the presentation and disclosure of other-than-temporary impairments on debt and equity securities in the financial statements. This guidance does not amend an existing recognition and measurement guidance related to other-than-temporary impairments of equity securities.
The Company has adopted guidance as codified by the FASB issued in April 2009, which was adopted to provide additional guidance for estimating fair value in accordance with guidance regarding “Fair Value Measurements”, when the volume and level of activity for the asset or liability have significantly decreased. This guidance also includes guidance on identifying circumstances that indicate a transaction is not orderly.
35
The Company has adopted guidance as codified by the FASB which was issued in June, 2009, “Accounting for Transfers of Financial Assets.” This is a revision to guidance on “Accounting for Transfers and Servicing of Financial Assets and Extinguishments of Liabilities,” and will require more information about transfers of financial assets, including securitization transactions, and where companies have continuing exposure to the risks related to transferred financial assets. It eliminates the concept of a “qualifying special-purpose entity,” changes the requirements for derecognizing financial assets, and requires additional disclosures. This guidance becomes effective at the start of a company’s fiscal year after November 15, 2009. This guidance did not have a material impact on the Company’s financial statements.
The Company has adopted guidance as codified by the FASB issued in June, 2009, “Amendments to Previous Guidance Regarding Consolidation of Variable Interest Entities,” and changes how a company determines when an entity that is insufficiently capitalized or is not controlled through voting (or similar rights) should be consolidated. The determination of whether a company is required to consolidate an entity is based on, among other things, an entity’s purpose and design and a company’s ability to direct the activities of the entity that most significantly impact the entity’s economic performance. This guidance becomes effective at the start of a company’s fiscal year after November 15, 2009. The Company does not expect this guidance to have a material impact on the Company’s financial statements.
The Company has adopted guidance as codified by the FASB issued in June 2009 regarding “The FASB Accounting Standards Codification” and the “Hierarchy of Generally Accepted Accounting Principles” - a replacement of an earlier guidance on the same subject. The FASB Accounting Standards Codification (“Codification”) will become the source of authoritative U.S. generally accepted accounting principles (“GAAP”) recognized by the FASB to be applied by nongovernmental entities. Rules and interpretive releases of the Securities and Exchange Commission (“SEC”) under authority of federal securities laws are also sources of authoritative GAAP for SEC registrants. On the effective date of this Statement, the Codification will supersede all then-existing non-SEC accounting and reporting standards. All other nongrandfathered non-SEC accounting literature not included in the Codification will become nonauthoritative. This guidance is effective for financial statements issued for interim and annual periods ending after September 15, 2009.
Following this guidance, the Board will not issue new standards in the form of Statements, FASB Staff Positions, or Emerging Issues Task Force Abstracts. Instead, it will issue Accounting Standards Updates. The Board will not consider Accounting Standards Updates as authoritative in their own right. Accounting Standards Updates will serve only to update the Codification, provide background information about the guidance, and provide the bases for conclusions on the change(s) in the Codification.
36
Earnings Analysis
Net earnings in 2009 were $593,000, a $3,370,000 or an 85.0% decrease from 2008 earnings of $3,963,000. Net earnings for the year 2008 decreased $2,716,000 or 40.7% from year 2007 earnings of $6,679,000. The principal source of income is interest income on loans. The level of interest income can be affected by changes in interest rate, volume of loans outstanding, and the quality of the Bank’s loan portfolio. Loans that are 90 days or more past due are placed on non-accrual status and interest is recorded on these loans only as payments are made to the Bank. All other loans accrue interest at the stated contract rate.
Basic (loss) earnings per share were ($0.01) in 2009, $1.23 in 2008, and $2.03 in 2007. Diluted (loss) earnings per share were ($0.01) in 2009, $1.22 in 2008 and $2.00 in 2007.
Net interest income for 2009 was $26,806,000, a decrease of $1,114,000 or 4.0% from 2008. In 2008 it was $27,920,000, a decrease of $713,000 or 2.5% from 2007. Interest income was $35,817,000 in 2009, a decrease of $3,610,000 or 9.2% from 2008. Interest income was $39,427,000 in 2008, a decrease of $2,863,000 or 6.8% from 2007. The decrease in net interest income was caused primarily by a decrease in the interest rate on earning assets which exceeded the decrease in the interest rate on interest bearing liabilities, reflecting the actions of the Federal Open Market Committee,which has lowered short term interest rates significantly throughout 2008 and ending in January 2009 with a federal funds target rate range of 0% to 0.25%. Most of the interest earning assets are tied to the prime lending rate, which adjusts immediately, whereas most of the interest-bearing liabilities adjust on a lagged basis, particularly in the case of time deposits, which change only at maturity. An increase in the volume of loans in nonaccrual status of $11,490,000 during 2009 also contributed to the decline. Total nonaccrual loans were $25,592,000 and $14,102,000 as of December 31, 2009 and 2008, respectively. Loans on nonaccrual status, where principal is believed to be fully collectible, are credited to interest income when they are received. Average interest earning assets totaled $608,322,000 in 2009, an increase of $9,923,000 or 1.7% over 2008. Average interest earning assets in 2008 were $598,399,000, an increase of $31,154,000 or 5.5% over 2007. The yield on interest earning assets decreased 72 basis points in 2009 compared to 2008. The yield on interest earning assets decreased 89 basis points in 2008 compared to 2007. The principal earning assets were loans, and average loans outstanding increased $4,707,000 in 2009 versus 2008, and increased $30,100,000 in 2008 versus 2007. Their yield decreased 63 basis points in 2009 versus 2008, and decreased 100 basis points in 2008 versus 2007.
37
Interest expense for 2009 was $9,011,000 compared to $11,507,000 for 2008, a decrease of $2,496,000, or 21.7% Interest expense was $11,507,000 in 2008, compared to $13,657,000 for 2007, a decrease of $2,150,000 or 15.7%. The decrease in interest expense during 2009, 2008 and 2007 was caused by rate decreases on deposits, as rates followed the declines in prevailing short term market interest rates. The Federal Open Market Committee intended federal funds rate was 4.25% on December 31, 2007. By December 31, 2008, that rate had been reduced to a target of 0% to 0.25%. This rate continued throughout 2009. A new consumer product, the Money Market Maximizer, was created, and reached $107,950,000 at year end. Average interest bearing liabilities were $482,900,000 in 2009, $463,546,000 in 2008 and $426,354,000 in 2007. This represented an increase of $19,354,000 in 2009 over 2008, and an increase of $37,192,000 in 2008 over 2007. The cost of these liabilities decreased 61 points in 2009 compared to 2008, and decreased 72 basis points in 2008 compared to 2007. Time deposit costs decreased 130 basis points in 2009 compared to 2008, and decreased 113 basis points in 2008 compared to 2007. Short term deposit rates are expected to remain low so long as the FOMC continues to push down short term interest rates to 25 basis points or less.
Net Interest Income
Net interest income is the difference between interest yield generated by earning assets and the interest expense associated with the funding of those assets. Net interest income is affected by the interest rate earned or paid and by volume changes in loans, investment securities, deposits and borrowed funds.
|
TABLE 1
|
Net Interest Income and Average Balances | ||||||||||||||||||||||||||||||||
| Year ended December 31 | |||||||||||||||||||||||||||||||||
| 2009 | 2008 | 2007 | |||||||||||||||||||||||||||||||
|
(Dollar amounts in thousands)
|
Interest
|
Average
|
Interest
|
Average
|
Interest
|
Average
|
|||||||||||||||||||||||||||
|
Average
|
Income
|
Yield
|
Average
|
Income
|
Yield
|
Average
|
Income
|
Yield
|
|||||||||||||||||||||||||
|
Balance
|
(Expense)
|
(Cost)
|
Balance
|
(Expense)
|
(Cost)
|
Balance
|
(Expense)
|
(Cost)
|
|||||||||||||||||||||||||
|
INTEREST EARNING ASSETS
|
|||||||||||||||||||||||||||||||||
|
Loans, gross (1) (2)
|
$ | 502,239 | $ | 32,718 | 6.51 | % | $ | 497,532 | $ | 35,515 | 7.14 | % | $ | 467,432 | $ | 38,035 | 8.14 | % | |||||||||||||||
|
Taxable securities (3)
|
58,248 | 1,779 | 3.05 | % | 53,328 | 2,248 | 4.22 | % | 34,323 | 1,733 | 5.05 | % | |||||||||||||||||||||
|
Nontaxable securities (3)
|
34,406 | 1,634 | 4.75 | % | 42,809 | 2,044 | 4.77 | % | 56,080 | 2,643 | 4.71 | % | |||||||||||||||||||||
|
Federal funds sold
|
13,429 | 78 | 0.58 | % | 4,730 | 106 | 2.24 | % | 9,410 | 487 | 5.18 | % | |||||||||||||||||||||
|
Total interest earning assets
|
$ | 608,322 | $ | 36,209 | 5.95 | % | $ | 598,399 | $ | 39,913 | 6.67 | % | $ | 567,245 | $ | 42,898 | 7.56 | % | |||||||||||||||
|
NONINTEREST EARNING ASSETS:
|
|||||||||||||||||||||||||||||||||
|
Cash and due from banks
|
$ | 33,933 | $ | 17,155 | 17,487 | ||||||||||||||||||||||||||||
|
Premises and equipment
|
12,417 | 13,648 | 13,735 | ||||||||||||||||||||||||||||||
|
Other assets
|
29,157 | 28,906 | 24,924 | ||||||||||||||||||||||||||||||
|
Total noninterest earning assets
|
$ | 75,507 | $ | 59,709 | $ | 56,146 | |||||||||||||||||||||||||||
|
TOTAL ASSETS
|
$ | 683,829 | $ | 658,108 | $ | 623,391 | |||||||||||||||||||||||||||
|
INTEREST BEARING LIABILITIES:
|
|||||||||||||||||||||||||||||||||
|
Deposits:
|
|||||||||||||||||||||||||||||||||
|
Demand, interest bearing
|
$ | 57,886 | $ | 307 | 0.53 | % | $ | 59,472 | $ | 329 | 0.55 | % | $ | 59,491 | $ | 416 | 0.70 | % | |||||||||||||||
|
Money market
|
198,236 | 4,007 | 2.02 | % | 140,177 | 3,259 | 2.32 | % | 136,672 | 4,656 | 3.41 | % | |||||||||||||||||||||
|
Savings
|
43,531 | 123 | 0.28 | % | 46,695 | 127 | 0.27 | % | 48,633 | 247 | 0.51 | % | |||||||||||||||||||||
|
Time deposits
|
133,388 | 2,637 | 1.98 | % | 142,895 | 4,689 | 3.28 | % | 140,934 | 6,210 | 4.41 | % | |||||||||||||||||||||
|
Fed Home Loan Bank advances
|
49,859 | 1,937 | 3.88 | % | 73,777 | 3,084 | 4.18 | % | 39,482 | 2,070 | 5.24 | % | |||||||||||||||||||||
|
Fed funds purchased
|
—
|
—
|
n/a | 530 | 19 | 3.58 | % | 1,142 | 58 | 5.08 | % | ||||||||||||||||||||||
|
Total interest bearing liabilities
|
$ | 482,900 | $ | 9,011 | 1.87 | % | $ | 463,546 | $ | 11,507 | 2.48 | % | $ | 426,354 | $ | 13,657 | 3.20 | % | |||||||||||||||
|
NONINTEREST BEARING LIABILITIES:
|
|||||||||||||||||||||||||||||||||
|
Demand deposits
|
116,946 | 118,784 | 123,766 | ||||||||||||||||||||||||||||||
|
Other liabilities
|
6,616 | 8,290 | 8,977 | ||||||||||||||||||||||||||||||
|
Total noninterest bearing liabilities
|
$ | 123,562 | $ | 127,074 | $ | 132,743 | |||||||||||||||||||||||||||
|
Total liabilities
|
$ | 606,462 | $ | 590,620 | $ | 559,097 | |||||||||||||||||||||||||||
|
Stockholders’ equity
|
$ | 77,367 | $ | 67,488 | $ | 64,294 | |||||||||||||||||||||||||||
|
TOTAL LIABILITIES AND STOCKHOLDERS’ EQUITY
|
$ | 683,829 | $ | 658,108 | $ | 623,391 | |||||||||||||||||||||||||||
|
NET INTEREST INCOME AND MARGIN ON TOTAL EARNING ASSETS (4)
|
$ | 27,198 | 4.47 | % | $ | 28,406 | 4.75 | % | $ | 29,241 | 5.15 | % | |||||||||||||||||||||
|
(1)
|
Interest on non-accrual loans is recognized into income on a cash received basis.
|
|
(2)
|
Amounts of interest earned included loan fees of $1,249,000 $1,425,000 and $1,593,000 for the years ended December 31, 2009, 2008 and 2007, respectively.
|
|
(3)
|
Tax equivalent adjustments recorded at the statutory rate of 34% that are included in the nontaxable securities portfolio are $392,000, $481,000, and $608,000 for the years ended December 31, 2009, 2008 and 2007, respectively, and were derived from nontaxable municipal interest income. Tax equivalent adjustments recorded at the statutory rate of 34% that are included in taxable securities portfolio were created by a dividends received deduction of $0, $5,000 and $0 in the years ended December 31, 2009, 2008 and 2007, respectively.
|
|
(4)
|
Net interest margin is computed by dividing net interest income by total average interest earning assets.
|
38
The following table analyzes the dollar amount of change in interest income and expense and the changes in dollar amounts attributable to (a) changes in volume (changes in volume at the current year rate), (b) changes in rate (changes in rate times the prior year’s volume) and (c) changes in rate/volume (changes in rate times changes in volume). In this table, the dollar change in rate/volume is prorated to volume and rate proportionately.
|
TABLE 2
|
Rate/Volume Variance Analysis
|
|||||||||||||||||||||||
| (Dollar amounts in thousands) |
Year Ended December 31
|
|||||||||||||||||||||||
| 2009 compared to 2008 |
2008 compared to 2007
|
|||||||||||||||||||||||
|
Increase (decrease)
|
Increase (decrease)
|
|||||||||||||||||||||||
|
Interest
|
Interest
|
|||||||||||||||||||||||
|
Income/
|
Variance
|
Income/
|
Variance
|
|||||||||||||||||||||
|
Expense
|
Attributable To
|
Expense
|
Attributable To
|
|||||||||||||||||||||
|
Variance
|
Rate
|
Volume
|
Variance
|
Rate
|
Volume
|
|||||||||||||||||||
|
INTEREST EARNING ASSETS:
|
|
|
||||||||||||||||||||||
|
Loans
|
$ | (2,797 | ) | $ | (3,104 | ) | $ | 307 | $ | (2,520 | ) | $ | (4,669 | ) | $ | 2149 | ||||||||
|
Taxable securities
|
(469 | ) | (676 | ) | 207 | 515 | (444 | ) | 959 | |||||||||||||||
|
Nontaxable securities
|
(410 | ) | (9 | ) | (401 | ) | (599 | ) | 27 | (626 | ) | |||||||||||||
|
Federal funds sold
|
(28 | ) | (78 | ) | 50 | (381 | ) | (276 | ) | (105 | ) | |||||||||||||
|
Total
|
$ | (3,704 | ) | $ | (3,867 | ) | $ | 163 | $ | (2,985 | ) | $ | (5,362 | ) | 2,377 | |||||||||
| INTEREST BEARING LIABILITIES: |
|
|
||||||||||||||||||||||
|
Demand deposits
|
$ | (22 | ) | $ | (13 | ) | $ | (9 | ) | $ | (87 | ) | $ | (87 | ) | $ |
—
|
|||||||
|
Money market
|
748 | (426 | ) | 1,174 | (1,397 | ) | (1,478 | ) | 81 | |||||||||||||||
|
Savings deposits
|
(4 | ) | 5 | (9 | ) | (120 | ) | (115 | ) | (5 | ) | |||||||||||||
|
Time deposits
|
(2,052 | ) | (1,740 | ) | (312 | ) | (1,521 | ) | (1,607 | ) | 86 | |||||||||||||
|
Federal Home Loan Bank advances
|
(1,147 | ) | (218 | ) | (929 | ) | 1,014 | (420 | ) | 1,434 | ||||||||||||||
|
Federal funds purchased
|
(19 | ) | (19 | ) |
—
|
(39 | ) | (17 | ) | (22 | ) | |||||||||||||
|
Total
|
$ | (2,496 | ) | $ | (2,411 | ) | $ | (85 | ) | $ | (2,150 | ) | $ | (3,724 | ) | $ | 1,574 | |||||||
|
NET INTEREST INCOME
|
$ | (1,208 | ) | $ | (1,456 | ) | $ | 248 | $ | (835 | ) | $ | (1,638 | ) | $ | 803 | ||||||||
The net interest margin on average earning assets was 4.47% in 2009 compared to 4.75% in 2008 and 5.15% in 2007. The average rate earned on interest earning assets was 5.95% in 2009, 6.67% in 2008 and 7.56% in 2007. The average cost for interest-bearing liabilities was 1.87% in 2009 compared to 2.48% in 2008 and 3.20% in 2007. The decline in net interest margin in 2009 and 2008 is related to an overall market rate decline and the fact that the Bank is slightly asset sensitive to interest rates which means in a downward rate environment assets reprice at a faster pace than liabilities.
39
As mentioned above under the heading “Earnings Analysis”, there were decreases in the prime lending rate from 8.25% at the beginning of 2007 to 7.25% at the end of 2007, and 3.25% at the end of 2008 and which has continued at this rate for all of 2009. Action taken by the Federal Open Market Committee of the Federal Reserve, which affect the Prime Rate is indirectly affected by asset/liability pricing decisions, including their decisions regarding the appropriate Prime Rate level.
Yield on average loans was 6.51% in 2009, 7.14% in 2008 and 8.14% in 2007. Interest on average taxable securities was 3.05% in 2009, 4.22% in 2008, and 5.05% in 2007. Interest on average nontaxable securities was 4.75% in 2009, 4.77% in 2008, and 4.71% in 2007. Interest on average federal funds sold was 0.58% in 2009, 2.24% in 2008, and 5.18% in 2007. Interest on average total interest earning assets was 5.95% in 2009, 6.67% in 2008, and 7.56% in 2007. On the expense side, interest on average interest bearing demand deposits was 0.53% in 2009, 0.55% in 2008, and 0.70% in 2007. Interest on average money market accounts was 2.02% in 2009, 2.32% in 2008, and 3.41% in 2007. Interest on average savings accounts was 0.28% in 2009, 0.27% in 2008 and 0.51% in 2007. Interest on average time deposits was 1.98% in 2009, 3.28% in 2008 and 4.41% in 2007. Interest on average Federal Home Loan Bank advances was 3.88% in 2009, 4.18% in 2008 and 5.24% in 2007. Interest on federal funds purchased was 3.58% in 2008 and 5.08% in 2007. There were no federal funds purchased in 2009. Interest on average total interest bearing liabilities was 1.87% in 2009, 2.48% in 2008 and 3.20% in 2007.
Allowance For Loan Losses
The Bank has the responsibility of assessing the overall risks in its loan portfolio, assessing the specific loss expectancy, and determining the adequacy of the loan loss reserve. The level of reserves is determined by internally generated credit quality ratings, a review of the local economic conditions in the Bank’s market area, and consideration of the Bank’s historical loan loss experience. The Bank is committed to maintaining adequate reserves, identifying credit weaknesses through frequent loan reviews, and updating loan risk ratings and changing those risk ratings in a timely manner as circumstances change.
Real estate loans outstanding increased by $33,519,000 in 2009 compared to 2008, and increased by $961,000 in 2008 compared to 2007. Real estate loans increased in 2009 compared to 2008, while remaining nearly the same in 2008 compared to 2007.
During 2009 and 2008, we priced our loans competitively, but did not discount our loans in order to attract new business. The reserve allocated to our loans was increased in 2008 and again in 2009, to reflect the credit risk involved in the our loan portfolio. We experienced increased loan charge-offs and non accrual loans during 2008 and 2009. The credit quality of our underlying collateral also deteriorated during 2008, and 2009, necessitating an increased provision for loan losses.
40
The allowance for loan losses totaled $9,829,000, $7,075,000 and $5,638,000 at December 31, 2009, 2008 and 2007, respectively. This represented 1.95%, 1.40% and 1.14% of total loans outstanding on those dates. These balances reflect amounts that, in management’s judgment, are adequate to provide for probable loan losses based on the considerations listed above. During 2009, the provision for loan losses was $4,596,000, and the charge-offs were $1,921,000. During 2008, the provision for loan losses was $3,045,000, and the charge-offs were $1,788,000. During 2007, the provision for loan losses was $690,000, and the charge-offs were $80,000. Management also performs stress testing of our loan portfolio to gain a better understanding of the portfolio effects of additional declines in Real Estate values and lease rates.
|
TABLE 3
|
Allocation of the Allowance for Loan Losses
|
|||||||||||||||||||||||||||||||||||||||
|
(Dollar amounts in thousands)
|
||||||||||||||||||||||||||||||||||||||||
|
2009
|
2008
|
2007
|
2006
|
2005
|
||||||||||||||||||||||||||||||||||||
|
Percent
|
Percent
|
Percent
|
Percent
|
Percent
|
||||||||||||||||||||||||||||||||||||
|
of loans
|
of loans
|
of loans
|
of loans
|
of loans
|
||||||||||||||||||||||||||||||||||||
|
in each
|
in each
|
in each
|
in each
|
in each
|
||||||||||||||||||||||||||||||||||||
|
category
|
category
|
category
|
category
|
category
|
||||||||||||||||||||||||||||||||||||
|
to total
|
to total
|
to total
|
to total
|
to total
|
||||||||||||||||||||||||||||||||||||
|
Amount
|
Loans
|
Amount
|
Loans
|
Amount
|
Loans
|
Amount
|
Loans
|
Amount
|
Loans
|
|||||||||||||||||||||||||||||||
|
Real Estate
|
$ | 5,881 | 76.6 | % | $ | 4,712 | 69.9 | % | $ | 3,669 | 71.1 | % | $ | 3,864 | 74.9 | % | $ | 3,373 | 78.5 | % | ||||||||||||||||||||
|
Construction
|
3,110 | 9.4 | % | 1,388 | 13.0 | % | 1,576 | 11.6 | % | 539 | 8.7 | % | 365 | 6.8 | % | |||||||||||||||||||||||||
|
Commercial
|
809 | 13.5 | % | 932 | 16.5 | % | 370 | 16.6 | % | 582 | 15.6 | % | 611 | 13.8 | % | |||||||||||||||||||||||||
|
Consumer
|
29 | 0.5 | % | 43 | 0.6 | % | 23 | 0.7 | % | 17 | 0.8 | % | 25 | 0.9 | % | |||||||||||||||||||||||||
|
Total
|
$ | 9,829 | 100.0 | % | $ | 7,075 | 100.0 | % | $ | 5,638 | 100.0 | % | $ | 5,002 | 100.0 | % | $ | 4,374 | 100.0 | % | ||||||||||||||||||||
41
Table 4 summarizes transactions in the allowance for loan losses and details the charge-offs, recoveries and net loan losses by loan category for each of the last five fiscal years ended December 31, 2009. The amount added to the provision and charged to operating expenses for each period is based on the risk profile of the loan portfolio.
|
TABLE 4
|
Allowance for Loan Losses | |||||||||||||||||||
| Historical Analysis | ||||||||||||||||||||
|
(Dollar amounts in thousands)
|
For the year ended December 31, | |||||||||||||||||||
|
2009
|
2008
|
2007
|
2006
|
2005
|
||||||||||||||||
|
Balance at Beginning of Period
|
$ | 7,075 | $ | 5,638 | $ | 5,002 | $ | 4,374 | $ | 3,133 | ||||||||||
|
Provision for Loan Losses
|
4,596 | 3,045 | 690 | 683 | 628 | |||||||||||||||
|
Charge-offs:
|
||||||||||||||||||||
|
Real Estate
|
(1,471 | ) | (493 | ) | (48 | ) | 0 | (70 | ) | |||||||||||
|
Commercial
|
(390 | ) | (1,284 | ) | (19 | ) | (49 | ) | (34 | ) | ||||||||||
|
Consumer
|
(60 | ) | (11 | ) | (13 | ) | (10 | ) | (6 | ) | ||||||||||
|
Total
|
(1,921 | ) | (1,788 | ) | (80 | ) | (59 | ) | (110 | ) | ||||||||||
|
Recoveries:
|
||||||||||||||||||||
|
Real Estate
|
61 | 36 | 15 |
—
|
—
|
|||||||||||||||
|
Commercial
|
18 | 144 | 10 | 3 | 22 | |||||||||||||||
|
Consumer
|
—
|
—
|
1
|
1
|
1 | |||||||||||||||
|
Total
|
79 | 180 | 26 | 4 | 23 | |||||||||||||||
|
Net Charge-offs
|
(1,842 | ) | (1,608 | ) | (54 | ) | (55 | ) | (87 | ) | ||||||||||
|
Allowance acquired in business combination
|
—
|
—
|
—
|
—
|
700 | |||||||||||||||
|
Balance at End of Period
|
$ | 9,829 | $ | 7,075 | $ | 5,638 | $ | 5,002 | $ | 4,374 | ||||||||||
|
Percentages
|
||||||||||||||||||||
|
Allowance for loan losses/total loans
|
1.95 | % | 1.40 | % | 1.14 | % | 1.18 | % | 1.14 | % | ||||||||||
|
Net charge-offs/real estate loans
|
0.38 | % | 0.14 | % | 0.01 | % | 0.00 | % | 0.02 | % | ||||||||||
|
Net charge-offs/commercial loans
|
0.55 | % | 1.37 | % | 0.01 | % | 0.07 | % | 0.06 | % | ||||||||||
|
Net charge-offs/consumer loans
|
2.25 | % | 0.35 | % | 0.33 | % | 0.27 | % | 0.15 | % | ||||||||||
|
Net charge-offs/total loans
|
0.37 | % | 0.32 | % | 0.01 | % | 0.01 | % | 0.02 | % | ||||||||||
|
Allowance for loan losses/non-performing loans
|
38.41 | % | 50.17 | % | 49.18 | % | 190.33 | % | 25729.41 | % | ||||||||||
The increase in charge-offs during 2009 and 2008 is primarily attributable to problems that were identified with specific borrowers rather than problems with a particular segment of the loan portfolio. In particular, borrowers who had exposure to real estate projects outside of San Mateo and San Francisco counties were identified as having a relatively higher risk profile than those operating solely within these two counties. Additionally, there was a high default rate related to purchased single family loans that were serviced by outside third parties. These loan purchase programs have been terminated and the servicing of these loans is now performed by the Bank. If real estate values or lease rates continue to decline in the future, an increase in our allowance for loan losses may be warranted.
Non-performing Assets.
Non-performing assets consist of nonaccrual loans, foreclosed assets, and loans that are 90 days or more past due but are still accruing interest. The accrual of interest on non-accrual loans is discontinued when, in management’s opinion, the borrower may be unable to meet payments as they become due. For the years ended December 31, 2009, 2008 and 2007, had non-accrual loans performed as agreed, approximately $759,000, $692,000 and $547,000, respectively, would have been recognized in additional interest income.
42
Table 5 provides a summary of contractually past due loans for the most recent five years. Nonperforming loans were 5.1% of total loans at December 31, 2009 compared to 2.8% of total loans at December 31, 2008. Nonperforming loans were 2.8% of total loans at December 31, 2008 and 2.3% of total loans at December 31, 2007. Management believes the current list of past due loans are collectible and does not anticipate significant losses. Nonperforming loans at December 31, 2009 include fifteen real estate secured loans compared to five at December 31, 2008.
|
TABLE 5
|
Analysis of Nonperforming Assets | |||||||||||||||||||
|
(Dollar amounts in thousands)
|
Year ended December 31 | |||||||||||||||||||
|
2009
|
2008
|
2007
|
2006
|
2005
|
||||||||||||||||
|
Accruing loans 90 days or more
|
$ |
—
|
$ |
—
|
$ |
—
|
$ |
—
|
$ |
—
|
||||||||||
|
Nonaccrual loans
|
25,592 | 14,102 | 11,465 | 2,628 | 17 | |||||||||||||||
|
Other real estate owned
|
7,320 | 3,557 | 440 |
—
|
—
|
|||||||||||||||
|
Total
|
$ | 32,912 | $ | 17,659 | $ | 11,905 | $ | 2,628 | $ | 17 | ||||||||||
There was no commitment to lend additional funds to any customer whose loan was classified as nonperforming at December 31, 2009, 2008 or 2007.
Nonaccrual loans at December 31, 2009 consist of several single family residence loans, commercial loans and some commercial real estate secured loans. The Bank is working with its borrowers to develop strategies that can give the borrowers time to work through their financial difficulties. The other real estate owned properties consist of two single family residences and a land development parcel. The Bank is actively marketing these properties. However, given current market conditions, there can be no assurance that these properties can be sold in the near future.
As a result of a regularly scheduled and recently concluded Office of the Comptroller of the Currency (“OCC”) examination, management expects to informally agree with the OCC to take actions to further strengthen and improve asset quality including, among other things: to increase our capital levels and restrict our ability to pay dividends as the risk contained in the Bank’s loan portfolio increases (including the risks related to the concentration of commercial real estate (“CRE”) loans within our portfolio), to strengthen our loan policies related to analyzing the risk within the Bank’s CRE portfolio, to reduce the level of our classified assets over an agreed upon timetable, to maintain certain levels of minimum capital above “well capitalized” levels as defined by current regulation, and to address other criticisms from the examination. Management is already developing strategies and taking actions to address these issues.
43
Noninterest Income
The following table sets forth the principal components of noninterest income:
|
TABLE 6
|
Noninterest Income | |||||||||||||||||||||||||
|
Variance
|
Variance
|
|||||||||||||||||||||||||
|
(Dollar amounts in thousands)
|
Years ended December 31, |
2009 vs. 2008
|
2008 vs. 2007
|
|||||||||||||||||||||||
|
2009
|
2008
|
2007
|
Amount
|
Percent
|
Amount
|
Percent
|
||||||||||||||||||||
|
Service charges
|
$ | 2,826 | $ | 2,888 | $ | 2,580 | $ | (62 | ) | -2.1 | % | $ | 308 | 11.9 | % | |||||||||||
|
Death benefit bank owned life insurance policy
|
316 | 760 |
—
|
(444 | ) | -58.4 | % |
—
|
—
|
|||||||||||||||||
|
Credit card fees
|
691 | 749 | 778 | (58 | ) | -7.7 | % | (29 | ) | -3.7 | % | |||||||||||||||
|
Gain (loss) on sale or impairment of securities AFS
|
997 | (290 | ) | 4 | 1,287 | 443.8 | % | (294 | ) | 7350.0 | % | |||||||||||||||
|
Other income
|
557 | 938 | 938 | (381 | ) | -40.6 | % | 0 | 0.0 | % | ||||||||||||||||
|
Total noninterest income
|
$ | 5,387 | $ | 5,045 | $ | 4,300 | $ | 342 | 6.8 | % | $ | (15 | ) | -0.3 | % | |||||||||||
Total noninterest income consists mainly of service charges on deposits. The increase in service charges on deposits in 2008 over 2007 is primarily attributable to an increase in non-sufficient-funds fees and ATM surcharge fees. The increased non-sufficient-funds fees are the result of increased liquidity problems that some of our deposit customers are facing, stemming from the current economic downturn. The increase in ATM surcharge fees is a function of increased demand for cash from our ATM machines by those who do not have a deposit relationship with the Bank. Noninterest income in 2008 included proceeds from a life insurance contract related to death benefits received from a policy that was placed on the life of an executive who is no longer working at the Bank. The remainder of this benefit was collected in 2009. Gain or loss on sale or impairment of securities available-for-sale was a gain of $997,000 in 2009, compared to a loss of $290,000 in 2008. The gain in 2009 was derived primarily from the sale of available for sale municipal securities and mortgage backed securities within our investment portfolio. The principal source of Other Income was policy dividends on Officers’ Life Insurance, which was $315,000, $404,000, and $364,000 in the years 2009, 2008 and 2007, respectively, which reflected an increased investment in these policies during 2008 and 2007, and a decline in the policies during 2009 due to the payout of the death benefit on one policy. Policy dividend rates were also negatively affected by downward market interest rate levels during 2008 and 2009.
44
Noninterest Expenses
The following table sets forth the various components of noninterest expense:
|
TABLE 7
|
Noninterest Expenses | |||||||||||||||||||||||||
|
Variance
|
Variance
|
|||||||||||||||||||||||||
|
(Dollar amounts in thousands)
|
Years ended December 31, |
2009 vs. 2008
|
2008 vs. 2007
|
|||||||||||||||||||||||
|
2009
|
2008
|
2007
|
Amount
|
Percent
|
Amount
|
Percent
|
||||||||||||||||||||
|
Salaries and employee benefits
|
$ | 13,359 | $ | 14,335 | $ | 12,778 | $ | (976 | ) | -6.8 | % | $ | 1,557 | 12.2 | % | |||||||||||
|
Occupancy expense
|
2,084 | 2,081 | 1,975 | 3 | 0.1 | % | 106 | 5.4 | % | |||||||||||||||||
|
Loss on sale of other real estate owned
|
10 | 2 |
—
|
8 | 400.0 | % | 2 |
—
|
||||||||||||||||||
|
Loss on impairment of other real estate owned
|
2,396 | 218 |
—
|
2,178 | 999.1 | % | 218 |
—
|
||||||||||||||||||
|
Equipment expense
|
1,923 | 1,930 | 1,620 | (7 | ) | -0.4 | % | 310 | 19.1 | % | ||||||||||||||||
|
Professional fees
|
1,194 | 1,149 | 1,303 | 45 | 3.9 | % | (154 | ) | -11.8 | % | ||||||||||||||||
|
Telephone, postage, supplies
|
1,068 | 1,029 | 1,017 | 39 | 3.8 | % | 12 | 1.2 | % | |||||||||||||||||
|
Advertising expense
|
439 | 686 | 942 | (247 | ) | -36.0 | % | (256 | ) | -27.2 | % | |||||||||||||||
|
Bankcard expenses
|
633 | 697 | 708 | (64 | ) | -9.2 | % | (11 | ) | -1.6 | % | |||||||||||||||
|
Data processing expense
|
554 | 495 | 503 | 59 | 11.9 | % | (8 | ) | -1.6 | % | ||||||||||||||||
|
Surety insurance
|
1,543 | 842 | 502 | 701 | 83.3 | % | 340 | 67.7 | % | |||||||||||||||||
|
Director expense
|
201 | 180 | 195 | 21 | 11.7 | % | (15 | ) | -7.7 | % | ||||||||||||||||
|
Other
|
2,181 | 1,702 | 1,639 | 479 | 28.1 | % | 63 | 3.8 | % | |||||||||||||||||
|
Total noninterest expense
|
$ | 27,585 | $ | 25,346 | $ | 23,182 | $ | 2,239 | 8.8 | % | $ | 2,164 | 9.3 | % | ||||||||||||
Total noninterest expenses for the year ended December 31, 2009 were $27,585,000 compared to $25,344,000 and $23,182,000 for the years ended December 31, 2008 and 2007. Salaries and employee benefits were $13,359,000 in 2009, $14,335,000 in 2008, and $12,778,000 in 2007. Salaries and employee benefits approximate 50% of noninterest expense. They decreased by 6.9% in 2009 over 2008 and increased 12.2% in 2008 over 2007. During the third quarter of 2008, a Call Center was established; there were also support staff increases in the loan area during 2008. The reduction in salaries and employee benefits in 2009 was primarily the result of a decrease in full time equivalent employees, that resulted from the elimination of the Call Center and other positions during the fourth quarter of 2008. The largest non-salary expense, loss on impairment of other real estate owned, increased by $2,178,000 during 2009. This expense was recorded primarily to reflect the decrease in valuation of the real estate owned properties since their value on the foreclosure date. Surety insurance increased $701,000 in 2009 over 2008, and $340,000 in 2008 over 2007, and the principal reason for the level of the 2009 increase was FDIC deposit insurance assessments, which were $1,128,000 in 2009 compared to $435,000 in 2008 and $57,000 in 2007.
Provision for Loan Losses
There was a provision for loan losses of $4,596,000 for the year ended December 31, 2009 compared to a provision for loan losses of $3,045,000 for the year ended December 31, 2008. The allowance for loan losses was $9,829,000 or 1.95% of total gross loans at December 31, 2009, compared to $7,075,000 or 1.40% of total gross loans at December 31, 2008. The allowance for loan losses is maintained at a level considered adequate for management to provide for probable loan losses inherent in the loan portfolio. During 2009 and 2008, nonaccrual and delinquent loans steadily increased. The level of nonperforming assets peaked during the fourth quarter of 2009. Management is taking the steps necessary to work with borrowers and has granted modified loan terms to borrowers willing to make payments on their residence loans, even though they were delinquent or real estate valuations had declined substantially.
45
Balance Sheet Analysis
Total assets of the Company were $708,309,000, an increase of 7.2% over 2008. Total assets were $660,957,000 at December 2008, an increase of 2.6% over 2007. Assets averaged $683,829,000 million in 2009, compared to $658,108,000 in 2008 and $623,391,000 in 2007. Average earning assets represented 91.0% of total average assets in 2007, 90.9% in 2008 and 89.0% in 2009.
Loans
The loan portfolio is the principal earning asset of the Bank. Gross loans outstanding at December 31, 2009 decreased by $881,000 or 0.2% from December 31, 2008. On December 31, 2008, they increased by $9,847,000 or 2.0% over December 31, 2007. The loan portfolio has experienced higher nonperforming loan levels in 2009 when compared to 2008 levels. This increase in nonperforming loans has had a negative effect on the Company’s net interest income during 2009.
Real estate loans increased by $33,519,000 or 9.5% in 2009 compared to 2008. They increased by $961,000 and $33,395,000 in 2008 and 2007. During 2009, the Bank purchased approximately $19,000,000 in performing real estate loans from another community bank. Construction loans decreased by $18,458,000 million in 2009. Construction loans increased by $8,285,000 in 2008 and $20,268,000 million in 2007. This decrease in 2009 occurred due to a tightening in our underwriting standards, and a reflection of current economic conditions, where very few new construction projects are being undertaken. Commercial loans decreased by $15,465,000 in 2009. Commercial loans increased by $1,214,000 in 2008 and $16,089,000 in 2007. Consumer loans represent a nominal portion of total loans. They decreased by $475,000 in 2009 and $500,000 in 2008. They increased by $357,000 in 2007.
Table 8 presents a detailed analysis of loans outstanding at December 31, 2005 through December 31, 2009.
|
TABLE 8
|
Loan Portfolio | |||||||||||||||||||
|
(Dollar amounts in thousands)
|
December 31 | |||||||||||||||||||
|
2009
|
2008
|
2007
|
2006
|
2005
|
||||||||||||||||
|
Real Estate loans
|
$ | 386,530 | $ | 353,011 | $ | 352,050 | $ | 318,655 | $ | 302,813 | ||||||||||
|
Construction loans
|
47,189 | 65,647 | 57,362 | 37,094 | 26,243 | |||||||||||||||
|
Commercial loans
|
67,977 | 83,442 | 82,228 | 66,139 | 53,070 | |||||||||||||||
|
Consumer loans
|
2,661 | 3,136 | 3,636 | 3,279 | 3,420 | |||||||||||||||
|
Sub total
|
504,357 | 505,236 | 495,276 | 425,167 | 385,546 | |||||||||||||||
|
Net deferred loan fees
|
(179 | ) | (177 | ) | (64 | ) | (728 | ) | (948 | ) | ||||||||||
|
Total
|
$ | 504,178 | $ | 505,059 | $ | 495,212 | $ | 424,439 | $ | 384,598 | ||||||||||
46
The following table shows the Bank’s loan maturities and sensitivities to changes in interest rates as of December 31, 2009.
|
TABLE 9
|
Maturing
|
|||||||||||||||
|
Maturing
|
After 1
|
Maturing
|
||||||||||||||
|
(Dollar amounts in thousands)
|
Within
|
But Within
|
After 5
|
|||||||||||||
|
1 Year
|
5 Years
|
Years
|
Total
|
|||||||||||||
|
Real Estate loans
|
$ | 198,597 | $ | 134,915 | $ | 53,018 | $ | 386,530 | ||||||||
|
Construction loans
|
24,245 | 16,471 | 6,473 | 47,189 | ||||||||||||
|
Commercial loans
|
34,927 | 23,727 | 9,323 | 67,977 | ||||||||||||
|
Consumer loans
|
1,367 | 929 | 365 | 2,661 | ||||||||||||
|
Sub total
|
259,136 | 176,042 | 69,179 | 504,357 | ||||||||||||
|
Net deferred loan fees
|
(92 | ) | (63 | ) | (24 | ) | (179 | ) | ||||||||
|
Total
|
$ | 259,044 | $ | 175,979 | $ | 69,155 | $ | 504,178 | ||||||||
|
With predetermined interest rates
|
$ | 74,262 | $ | 50,449 | $ | 19,825 | $ | 144,536 | ||||||||
|
With floating interest rates
|
184,782 | 125,530 | 49,330 | 359,642 | ||||||||||||
|
Total
|
$ | 259,044 | $ | 175,979 | $ | 69,155 | $ | 504,178 | ||||||||
Investment Portfolio
Investments at December 31, 2009 were $97,188,000, a decrease of $2,033,000 or 2.1% over December 31, 2008. At December 31, 2008 they were $99,221,000, an increase of $4,789,000 or 5.1% over December 31, 2007. At December 31, 2007, they were $94,432,000, a decrease of $513,000 or 0.5% from 2006.
The primary purpose of the Bank’s investment portfolio is to insure the Bank has sufficient available funds to fund loans, or pay down borrowings. The Company’s primary source of funds is the deposit base. If more funds are needed, investment maturities, calls and sales from the Investment Portfolio may be used. The Bank’s investment portfolio is composed primarily of debt securities of U. S. Government Agencies, mortgage-backed securities that have their principal guaranteed by U. S. Government Agencies, and in obligations of States and their political subdivisions. The Bank believes this provides for an appropriate liquidity level and minimal credit risk.
The following table sets forth the maturity distribution and interest rate sensitivity of investment securities at December 31, 2009:
|
TABLE 10
|
|
|
|||||||||||||||||||||||||||||||||
|
(Dollar amounts in thousands)
|
Due
In 1 Year
|
After
1 Year
Through
|
After
5 Years
Through
|
Due
After
|
Fair
|
Maturity
In
|
Average
|
||||||||||||||||||||||||||||
|
Or Less
|
Yield
|
5 Years
|
Yield
|
10 Years
|
Yield
|
10 Years
|
Yield
|
Value
|
Years
|
Yield
|
|||||||||||||||||||||||||
|
U. S. Government Agencies
|
$ | 8,076 | 1.38 | % | $ | 37,231 | 1.92 | % | $ |
—
|
—
|
$ |
—
|
—
|
$ | 45,307 | 2.18 | 1.82 | % | ||||||||||||||||
|
Mortgage-backed securities
|
—
|
—
|
—
|
—
|
—
|
—
|
22,279 | 4.12 | % | 22,279 | 17.98 | 4.12 | % | ||||||||||||||||||||||
|
States & Political Subdivisions
|
1,108 | 3.36 | % | 17,618 | 3.67 | % | 6,087 | 3.74 | % | 1,054 | 4.63 | % | 25,867 | 4.44 | 3.71 | % | |||||||||||||||||||
|
Corporate Debt
|
—
|
—
|
3,735 | 3.28 | % |
—
|
—
|
—
|
—
|
3,735 | 3.78 | 3.28 | % | ||||||||||||||||||||||
|
Total
|
$ | 9,184 | 1.62 | % | $ | 58,584 | 2.52 | % | $ | 6,087 | 3.74 | % | $ | 23,333 | 4.15 | % | $ | 97,188 | 6.48 | 2.90 | % | ||||||||||||||
47
The following table shows the securities portfolio mix at December 31, 2009, 2008 and 2007.
|
TABLE 11
|
Years Ended December 31,
|
|||||||||||||||||||||||
|
2009
|
2008
|
2007
|
||||||||||||||||||||||
|
(Dollar amounts in thousands)
|
Amortized
|
Fair
|
Amortized
|
Fair
|
Amortized
|
Fair
|
||||||||||||||||||
|
Cost
|
Value
|
Cost
|
Value
|
Cost
|
Value
|
|||||||||||||||||||
|
U.S. Government Agencies
|
$ | 45,100 | $ | 45,307 | $ | 44,309 | $ | 45,312 | $ | 30,601 | $ | 30,787 | ||||||||||||
|
Mortgage-backed securities
|
22,185 | 22,279 | 13,686 | 14,130 | 7,769 | 7,885 | ||||||||||||||||||
|
States & Political Subdivisions
|
24,998 | 25,867 | 38,918 | 39,779 | 52,357 | 52,760 | ||||||||||||||||||
|
Corporate Debt
|
3,696 | 3,735 |
—
|
—
|
2,999 | 3,000 | ||||||||||||||||||
|
Total
|
$ | 95,979 | $ | 97,188 | $ | 96,913 | $ | 99,221 | $ | 93,726 | $ | 94,432 | ||||||||||||
Deposits
During 2009, average deposits were $549,987,000, an increase of $41,964,000 or 8.3% over 2008. During 2008, average deposits were $508,023,000, a decrease of $1,473,000, or 0.3% over 2007. The prime lending rate was 8.25% at the beginning of 2007 and the rate did not change again until September 18, 2007, when it dropped to 7.75%, followed by a decrease to 7.50% on October 31, 2007 and 7.25% on December 11, 2007. It continued to decline to 6.50% on January 30,2008, 5.25% on March 18, 2008, 5.00% on April 30, 2008, 4.50% on October 8, 2008, 4.00% on October 29, 2008, and 3.25% on December 16, 2008. This last rate held steady during the entire year 2009. Time deposits lagged the prime rate changes because their rates changed only as certificates matured or new certificates were issued. Thus, interest-bearing demand costs averaged 0.7% in 2007, 0.6% in 2008 and 0.5% in 2009. Money market deposit costs averaged 3.4% in 2007, 2.3% in 2008 and 2.0% in 2009. Savings rates averaged 0.5% in 2007, 0.3% in 2008 and 0.3% in 2009. Average rates on time certificates of deposit of $100,000 or more was 4.9% in 2007, 3.6% in 2008 and 2.0% in 2009. On certificates under $100,000, average rates were 3.7% in 2007, 2.8% in 2008 and 2.0% in 2009. During 2009, the Bank introduced a money market account that carried an interest rate that was linked to the number of products the customer utilized. This product was the primary Bank driver of deposit growth in 2009.
The following table summarizes the distribution of average deposits and the average rates paid for them in the periods indicated:
|
TABLE 12
|
Average Deposits and Average Rates paid for the period ending December 31,
|
|||||||||||||||||||||||||||||||||||
| 2009 | 2008 | 2007 | ||||||||||||||||||||||||||||||||||
|
(Dollar amounts in thousands)
|
Average
|
Average
|
% of total
|
Average
|
Average
|
% of total
|
Average
|
Average
|
% of total
|
|||||||||||||||||||||||||||
|
Balance
|
Rate
|
Deposits
|
Balance
|
Rate
|
Deposits
|
Balance
|
Rate
|
Deposits
|
||||||||||||||||||||||||||||
|
Deposits:
|
||||||||||||||||||||||||||||||||||||
|
Interest-bearing demand
|
$ | 57,886 | 0.5 | % | 10.5 | $ | 59,472 | 0.6 | % | 10.8 | $ | 59,491 | 0.7 | % | 11.7 | % | ||||||||||||||||||||
|
Money market
|
198,236 | 0.2 | % | 36.0 | 140,177 | 2.3 | % | 25.5 | 136,672 | 3.4 | % | 26.9 | ||||||||||||||||||||||||
|
Savings
|
43,531 | 0.3 | % | 7.9 | 46,695 | 0.3 | % | 8.5 | 48,633 | 0.5 | % | 9.6 | ||||||||||||||||||||||||
|
Time deposits $100,000 or more
|
83,846 | 2.0 | % | 15.2 | 89,705 | 3.6 | % | 16.3 | 85,115 | 4.9 | % | 16.8 | ||||||||||||||||||||||||
|
Time deposits under $100,000
|
49,542 | 2.0 | % | 9.0 | 53,190 | 2.8 | % | 9.7 | 55,819 | 3.7 | % | 11.0 | ||||||||||||||||||||||||
|
Total interest bearing deposits
|
$ | 433,041 | 1.6 | % | 78.7 | 389,239 | 2.2 | % | 70.8 | 385,730 | 3.0 | % | 75.9 | |||||||||||||||||||||||
|
Demand deposits
|
116,946 |
—
|
21.3 | 118,784 |
—
|
21.6 | 123,766 |
—
|
24.4 | |||||||||||||||||||||||||||
|
Total deposits
|
$ | 549,987 | 1.3 | % | 100.0 | $ | 508,023 | 1.7 | % | 92.4 | $ | 509,496 | 2.3 | % | 100.3 | % | ||||||||||||||||||||
48
The following table indicates the maturity schedule of time deposits of $100,000 or more:
|
TABLE 13
|
Analysis of Time Deposits $100,000 or more at December 31, 2009 | |||||||
|
(Dollar amounts in thousands)
Total Deposits
$100,000 or more
|
Three Months
Or Less
|
Over Three
To Six
Months
|
Over Six
To Twelve
Months
|
Over
Twelve
Months
|
||||
|
$79,662
|
44,065 |
10,998
|
21,041 | 3,558 | ||||
Capital
At December 31, 2009, shareholders’ equity of the Company was $78,865,000, an increase of $10,716,000 or 15.7% over 2008. At December 31, 2008, shareholders’ equity of the Company was $68,149,000 an increase of $1,604,000 or 2.4% over 2007. During 2009, the primary reason for the increase in capital was the issuance of $12,600,000 of liquidation value of preferred stock to the U. S. Treasury in conjunction with the Treasury’s Capital Purchase Program (“CPP”). The increases were primarily attributable to retention of net income less cash dividends on common stock of $916,000 in 2009, $2,226,000 in 2008, and $1,716,000 in 2007.
In February of 2009, a total of $12,000,000 was issued to the U.S. Treasury as part of the Treasury’s Capital Purchase Program, in the form of Series A Preferred Stock with a 5% annual dividend rate, paid quarterly, and Series B Preferred Stock with a 9% annual dividend rate, paid quarterly which accounted for the major part of the 2008-2009 variance.
In 1989, banking regulatory authorities established risk-based capital guidelines requiring banks to maintain certain ratios of “qualifying capital” to “risk-weighted assets”.
Under the guidelines, qualifying capital is classified into two tiers, referred to as Tier 1 (core) and Tier 2 (supplementary) capital. The Company’s Tier 1 capital consists of common shareholders’ equity and preferred stock issued to the U.S. Treasury during 2009. The Company’s Tier 2 capital consists of eligible reserves for possible loan losses. Total capital is the sum of Tier 1 plus Tier 2 capital. Risk-weighted assets are calculated by applying risk percentages specified by the FDIC to categories of both balance sheet assets and off-balance sheet obligations. At year-end 1990, the FDIC also adopted a leverage ratio requirement. This ratio supplements the risk-based capital ratios and is defined as Tier 1 capital divided by quarterly average assets during the reporting period. This requirement established a minimum leverage ratio of 3.0% for the highest rated banks and ratios of 100 to 200 basis points higher for most other banks. To qualify as “well-capitalized” as defined by regulation, financial institutions must maintain risk-based Tier 1 and total capital ratios of at least 6.0% and 10.0% respectively. “Well-capitalized” financial institutions must also maintain a leverage ratio equal to or exceeding 5.0%.
49
The following table shows the risk-based capital ratios and the leverage ratios at December 31, 2009, 2008 and 2007 for the Bank.
|
TABLE 14
|
Minimum
|
||||||||||||
|
“Well Capitalized”
|
|||||||||||||
|
Risk-Based Capital Ratios
|
2009
|
2008
|
2007
|
Requirements
|
|||||||||
|
Total Capital
|
14.24 | % | 11.84 | % | 11.42 | % |
≥
|
10.00 | % | ||||
|
Tier 1 Capital
|
12.99 | % | 10.65 | % | 10.47 | % |
≥
|
6.00 | % | ||||
|
Leverage ratios
|
10.73 | % | 9.68 | % | 9.84 | % |
≥
|
5.00 | % | ||||
Liquidity
The Company’s primary source of liquidity on a stand-alone basis is dividends from the Bank. The payment of dividends by the Bank is subject to regulatory restrictions.
Liquidity is a measure of the Company’s ability to convert assets into cash. Liquidity consists of cash and due from other banks accounts, including time deposits, federal funds sold, and Securities Available-for-Sale. The Company’s policy is to maintain a liquidity ratio of 5% or greater of total assets. As of December 31, 2009, the Company’s primary liquidity was 22.59%, compared to 17.26% in 2008, and 17.10% in 2007. Total Liquid Assets were $160,041,000 in 2009, $114,086,000 in 2008, and $110,182,000 in 2007. The objective of liquidity management is to ensure that the Company has funds available to meet all present and future financial obligations and to take advantage of business opportunities as they occur. Financial obligations arise from withdrawals of deposits, repayment on maturity of purchased funds, extension of loans or other forms of credit, payment of operating expenses and payments of dividends.
Core deposits, which consist of all deposits other than time deposits, have provided the Company with a sizable source of relatively stable low-cost funds. The Company’s average core deposits represented 68.7% of average total liabilities of $606,462,000 for the year ended December 31, 2009, 61.8% of average total liabilities of $590,620,000 for the year ended December 31, 2008, and 65.9% of average total liabilities of $559,097,000 for the year ended December 31, 2007.
As of December 31, 2009, the Company had contractual obligations and other commercial commitments totaling approximately $116,864,000. The following table sets forth the Company’s contractual obligations and other commercial commitments as of December 31, 2009. These obligations and commitments can be funded from other loan repayments, the Company’s liquidity sources such as cash and due from other banks, federal funds sold, securities available for sale, as well as from the Bank’s line of credit with the Federal Home Loan Bank of San Francisco and the Federal Reserve Bank.
50
|
TABLE 15
|
Payments Due by Period
|
|||||||||||||||||||
|
(Dollar amounts in thousands)
|
1 year
|
Over 1 to
|
Over 3 to
|
Over
|
||||||||||||||||
|
Contractual Obligations
|
Total
|
or less
|
3 years
|
5 years
|
5 years
|
|||||||||||||||
|
Federal Home Loan Bank Advances
|
$ | 25,000 | $ | 20,000 | $ | 5,000 | $ |
—
|
$ |
—
|
||||||||||
|
Operating Leases
|
2,909 | 640 | 1,073 | 522 | $ | 674 | ||||||||||||||
|
Salary Continuation Agreements
|
1,616 | 130 | 260 | 260 | 966 | |||||||||||||||
|
Total Contractual Cash Obligations
|
$ | 29,525 | $ | 20,770 | $ | 6,333 | $ | 782 | $ | 1,640 | ||||||||||
|
Amount of Commitment Expirations Per Period
|
||||||||||||||||||||
|
Total
|
||||||||||||||||||||
|
(Dollar amounts in thousands)
|
Amounts
|
1 year
|
Over 1 to
|
Over 3 to
|
Over
|
|||||||||||||||
|
Other Commercial Commitments
|
Committed
|
or less
|
3 years
|
5 years
|
5 years
|
|||||||||||||||
|
Lines of Credit
|
$ | 57,832 | $ | 48,190 | $ | 3,136 | $ | 4,302 | $ | 2,204 | ||||||||||
|
Standby Letters of Credit
|
2,092 | 2,092 |
—
|
—
|
—
|
|||||||||||||||
|
Guarantees
|
—
|
—
|
—
|
—
|
—
|
|||||||||||||||
|
Other Commercial Commitments
|
30,324 | 27,646 | 2,678 |
—
|
—
|
|||||||||||||||
|
Total Commercial Commitments
|
$ | 90,248 | $ | 77,928 | $ | 5,814 | $ | 4,302 | $ | 2,204 | ||||||||||
The largest component of the Company’s earnings is net interest income, which can fluctuate widely when significant interest rate movements occur. The prime lending rate was 8.25% at the end of 2006. The rate decreased to 7.25% at the end of 2007, and to 3.25% at the end of 2008. It remained the same at 3.25% for all of 2009. The decline in short term market rates has contributed to the decline in the Bank’s net interest margin during 2008 and 2009.
The Company’s management is responsible for minimizing the Bank’s exposure to interest rate risk and assuring an adequate level of liquidity. This is accomplished by developing objectives, goals and strategies designed to enhance profitability and performance.
In order to ensure that sufficient funds are available for loan growth and deposit withdrawals, as well as to provide for general needs, the Company must maintain an adequate level of liquidity. Asset liquidity comes from the Company’s ability to convert short-term investments into cash and from the maturity and repayment of loans and investment securities. Liability liquidity is provided by the Company’s ability to attract deposits and obtain short term credit through established borrowing lines. The primary source of liability liquidity is the Bank’s customer base, which provides core deposit growth. The overall liquidity position of the Company is closely monitored and evaluated regularly. The Company has federal fund borrowing facilities for a total of $25,000,000, a Federal Home Loan Bank line of credit of up to 30% of total assets, and a Federal Reserve Bank borrowing facility of approximately $34,124,000. Management believes the Company’s liquidity sources at December 31, 2009 are adequate to meet its operating needs in 2010 and into the foreseeable future. In February, 2009, the Company received $12,000,000 in net proceeds from an investment in Company Preferred Stock by the U. S. Department of the Treasury. This investment was then contributed to the Bank as an additional capital contribution. These funds are intended to fund loan workout programs and to bolster lending activity of the Bank.
51
Effect of Changing Prices
The results of operations and financial conditions presented in this report are based on historical cost information and are not adjusted for the effects of inflation. Since the assets and liabilities of banks are primarily monetary in nature (payable in fixed, determinable amounts), the performance of the Company is affected more by changes in interest rates than by inflation. Interest rates generally increase as the rate of inflation increases, but the magnitude of the change in rates may not be the same.
The effect of inflation on banks is normally not as significant as its influence on those businesses that have large investments in plant and inventories. During periods of high inflation, there are normally corresponding increases in the money supply, and banks will normally experience above average growth in assets, loans and deposits. Also, increases in the price of goods and services will result in increased operating expenses.
The following table includes key ratios, including returns on average assets and equity.
|
TABLE 16
|
Return on Equity and Assets | |||||||||||
| (Key financial ratios are computed on average balances) |
||||||||||||
| Year Ended December 31, | ||||||||||||
|
2009
|
2008
|
2007
|
||||||||||
|
Return on average assets
|
0.09 | % | 0.60 | % | 1.07 | % | ||||||
|
Return on average equity
|
0.77 | % | 5.87 | % | 10.39 | % | ||||||
|
Dividend payout ratio
|
n/a | 44.71 | % | 25.69 | % | |||||||
|
Average equity to assets ratio
|
11.31 | % | 10.25 | % | 10.31 | % | ||||||
Interest Rate Risk
Closely related to the concept of liquidity is the concept of interest rate sensitivity (i. e., the extent to which assets and liabilities are sensitive to changes in interest rates). Management uses an asset/liability model that considers the relative sensitivities of the balance sheet, including the effect of interest rate caps on adjustable rate mortgages and the relatively stable aspects of core deposits. As such, management can model a net interest income simulation that is designed to address the probability of interest rate changes and behavioral response of the balance sheet to those changes. Market value of portfolio equity represents the fair value of the net present value of assets, liabilities and off-balance sheet items. The starting point (or “base case”) for the following table is the Company’s net portfolio at December 31, 2009, using current discount rates, and an estimate of net interest income for 2010 assuming that both interest rates and the Company’s interest-sensitive assets and liabilities remain at December 31, 2009 levels. The “rate shock” information in the table shows estimates of net portfolio value at December 31, 2009 and net interest income for 2010 assuming fluctuations or “rate shocks” of minus 100 and 200 basis points and plus 100 and 200 basis points. Rate shocks assume that current interest rates change immediately. The information set forth in the following table is based on significant estimates and assumptions, and constitutes a forward-looking statement within the meaning of that term set forth in Rule 175 under the Securities Act of 1933 and Rule 3b-6(c) of the Securities Exchange Act of 1934.
52
|
TABLE 17
|
Market Risk in Securities | |||||||||||||||||||
|
(Dollar amounts in thousands)
|
Interest Rate Shock | |||||||||||||||||||
| At December 31, 2009 | ||||||||||||||||||||
|
Available for Sale securities
|
||||||||||||||||||||
|
Rates Decline
|
Rates Increase
|
|||||||||||||||||||
|
Rate change
|
(2 | %) | (1 | %) |
Current
|
+1 | % | +2 | % | |||||||||||
|
Unrealized gain (loss)
|
$ | 4,407 | $ | 3,110 | $ | 1,208 | $ | (1,454 | ) | $ | (4,183 | ) | ||||||||
|
Change from current
|
$ | 3,199 | $ | 1,902 | $ | (2,662 | ) | $ | (5,391 | ) | ||||||||||
| Market Risk on Net Interest Income | ||||||||||||||||||||
|
(Dollar amounts in thousands)
|
At December 31, 2009 | |||||||||||||||||||
|
Rates Decline
|
Rates Increase
|
|||||||||||||||||||
|
Rate change
|
(2 | %) | (1 | %) |
Current
|
+1 | % | +2 | % | |||||||||||
|
Change in net interest income
|
$ | 28,288 | $ | 27,794 | $ | 26,806 | $ | 26,626 | $ | 26,783 | ||||||||||
|
Change from current
|
$ | 1,482 | $ | 988 | $ | (180 | ) | $ | (23 | ) | ||||||||||
53
|
INDEX TO FINANCIAL STATEMENTS
|
Page
|
|
|
55
|
||
|
56
|
||
|
57
|
||
| 58 | ||
| 59 | ||
|
60
|
||
54
To the Board of Directors and Stockholders
FNB Bancorp
We have audited the accompanying consolidated balance sheets of FNB Bancorp and subsidiary (the “Company”) as of December 31, 2009 and 2008 and the related consolidated statements of earnings, changes in stockholders’ equity and comprehensive earnings, and cash flows for each of the years in the three-year period ended December 31, 2009. These financial statements are the responsibility of the Company’s management. Our responsibility is to express an opinion on these financial statements based on our audits.
We conducted our audits in accordance with the standards of the Public Company Accounting Oversight Board (United States). Those standards require that we plan and perform the audit to obtain reasonable assurance about whether the financial statements are free of material misstatement. The Company is not required to have, nor were we engaged to perform, an audit of its internal control over financial reporting. Our audits included consideration of internal control over financial reporting as a basis for designing audit procedures that are appropriate in the circumstances, but not for the purpose of expressing an opinion on the effectiveness of the Company’s internal control over financial reporting. Accordingly, we express no such opinion. An audit includes examining, on a test basis, evidence supporting the amounts and disclosures in the financial statements. An audit also includes assessing the accounting principles used and significant estimates made by management, as well as evaluating the overall financial statement presentation. We believe that our audits provide a reasonable basis for our opinion.
In our opinion, the financial statements referred to above present fairly, in all material respects, the consolidated financial position of FNB Bancorp and subsidiary as of December 31, 2009 and 2008, and the results of their operations and their cash flows for each of the years in the three-year period ended December 31, 2009 in conformity with accounting principles generally accepted in the United States of America.
| /s/ Moss Adams LLP |
Stockton, California
March 24, 2010
55
|
(Dollar amounts in thousands)
|
|
2009
|
|
|
2008
|
|
||
|
Assets
|
|
|
|
|
|
|
||
|
Cash and due from banks
|
|
$
|
62,853
|
|
|
$
|
14,865
|
|
|
Cash and equivalents
|
|
|
62,853
|
|
|
|
14,865
|
|
|
|
|
|
|
|
|
|
|
|
|
Securities available-for-sale
|
|
|
97,188
|
|
|
|
99,221
|
|
|
Loans, net of allowance for loan losses of $9,829 and $7,075 on December 31, 2009 and December 31, 2008
|
|
|
494,349
|
|
|
|
497,984
|
|
|
Bank premises, equipment, and leasehold improvements, net
|
|
|
11,784
|
|
|
|
13,030
|
|
|
Other real estate owned, net
|
|
|
7,320
|
|
|
|
3,557
|
|
|
Goodwill
|
|
|
1,841
|
|
|
|
1,841
|
|
|
Accrued interest receivable and other assets
|
|
|
32,974
|
|
|
|
30,459
|
|
|
Total assets
|
|
$
|
708,309
|
|
|
$
|
660,957
|
|
|
|
|
|
|
|
|
|
|
|
|
Liabilities & Stockholders’ Equity
|
|
|
|
|
|
|
|
|
|
|
|
|
|
|
|
|
|
|
|
Deposits
|
|
|
|
|
|
|
|
|
|
Demand, noninterest bearing
|
|
|
120,515
|
|
|
|
121,237
|
|
|
Demand, interest bearing
|
|
|
57,368
|
|
|
|
58,451
|
|
|
Savings and money market
|
|
|
293,758
|
|
|
|
179,382
|
|
|
Time
|
|
|
127,323
|
|
|
|
141,840
|
|
|
Total deposits
|
|
|
598,964
|
|
|
|
500,910
|
|
|
|
|
|
|
|
|
|
|
|
|
Federal Home Loan Bank advances
|
|
|
25,000
|
|
|
|
86,100
|
|
|
Accrued expenses and other liabilities
|
|
|
5,480
|
|
|
|
5,798
|
|
|
Total liabilities
|
|
|
629,444
|
|
|
|
592,808
|
|
|
|
|
|
|
|
|
|
|
|
|
Commitments and contingencies (notes 10 and 14)
|
|
|
|
|
|
|
|
|
|
|
|
|
|
|
|
|
|
|
|
Stockholders’ equity
|
|
|
|
|
|
|
|
|
|
Preferred stock - series A - no par value, authorized and outstanding 12,000 shares, issued on February 27, 2009 (liquidation preference of $1,000 per share plus accrued dividends)
|
|
|
11,534
|
|
|
—
|
|
|
|
Preferred stock - series B - no par value, authorized and outstanding 600 shares, issued on February 27, 2009 (liquidation preference of $1,000 per share plus accrued dividends)
|
|
|
629
|
|
|
—
|
|
|
|
Common stock, no par value, authorized 10,000,000 shares; issued and outstanding 3,182,000 shares at December 31, 2009 and 3,030,000 shares at December 31, 2008
|
|
|
45,044
|
|
|
|
43,827
|
|
|
Retained earnings
|
|
|
20,945
|
|
|
|
22,960
|
|
|
Accumulated other comprehensive income, net of tax
|
|
|
713
|
|
|
|
1,362
|
|
|
Total stockholders’ equity
|
|
|
78,865
|
|
|
|
68,149
|
|
|
Total liabilities and stockholders’ equity
|
|
$
|
708,309
|
|
|
$
|
660,957
|
|
See accompanying notes to consolidated financial statements.
56
FNB BANCORP AND SUBSIDIARY
Years ended December 31, 2009, 2008 and 2007
|
(Amounts in thousands, except per share)
|
2009
|
2008
|
2007
|
|||||||||
|
Interest income:
|
||||||||||||
|
Interest and fees on loans
|
$ | 32,718 | $ | 35,515 | $ | 38,035 | ||||||
|
Interest and dividends on taxable securities
|
1,779 | 2,243 | 1,733 | |||||||||
|
Interest on tax-exempt securities
|
1,242 | 1,563 | 2,035 | |||||||||
|
Federal funds sold
|
78 | 106 | 487 | |||||||||
|
Total interest income
|
35,817 | 39,427 | 42,290 | |||||||||
|
Interest expense:
|
||||||||||||
|
Deposits
|
7,074 | 8,404 | 11,529 | |||||||||
|
Federal Home Loan Bank advances
|
1,937 | 3,084 | 2,070 | |||||||||
|
Fed funds purchased
|
—
|
19 | 58 | |||||||||
|
Total interest expense
|
9,011 | 11,507 | 13,657 | |||||||||
|
Net interest income
|
26,806 | 27,920 | 28,633 | |||||||||
|
Provision for loan losses
|
4,596 | 3,045 | 690 | |||||||||
|
Net interest income after provision for loan losses
|
22,210 | 24,875 | 27,943 | |||||||||
|
Noninterest income:
|
||||||||||||
|
Service charges
|
2,826 | 2,888 | 2,580 | |||||||||
|
Death benefit bank owned life insurance policy
|
316 | 760 |
—
|
|||||||||
|
Credit card fees
|
691 | 749 | 778 | |||||||||
|
Gain (loss) on sale or impairment of securities AFS
|
997 | (290 | ) | 4 | ||||||||
|
Other income
|
557 | 938 | 938 | |||||||||
|
Total noninterest income
|
5,387 | 5,045 | 4,300 | |||||||||
|
Noninterest expense:
|
||||||||||||
|
Salaries and employee benefits
|
13,359 | 14,335 | 12,778 | |||||||||
|
Loss on sale of other real estate owned
|
10 | 2 |
—
|
|||||||||
|
Loss on impairment of other real estate owned
|
2,396 | 218 |
—
|
|||||||||
|
Occupancy expense
|
2,084 | 2,081 | 1,975 | |||||||||
|
Equipment expense
|
1,923 | 1,930 | 1,620 | |||||||||
|
Professional fees
|
1,194 | 1,149 | 1,303 | |||||||||
|
Telephone, postage, supplies
|
1,068 | 1,029 | 1,017 | |||||||||
|
Advertising expense
|
439 | 686 | 942 | |||||||||
|
Bankcard expense
|
633 | 697 | 708 | |||||||||
|
Data processing expense
|
554 | 495 | 503 | |||||||||
|
Surety insurance
|
1,543 | 842 | 502 | |||||||||
|
Director expense
|
201 | 180 | 195 | |||||||||
|
Other expense
|
2,181 | 1,702 | 1,639 | |||||||||
|
Total noninterest expense
|
27,585 | 25,346 | 23,182 | |||||||||
|
Earnings before provision for income taxes
|
12 | 4,574 | 9,061 | |||||||||
|
Income taxes (benefit) or provision for income taxes
|
(581 | ) | 611 | 2,382 | ||||||||
|
Net earnings
|
593 | 3,963 | 6,679 | |||||||||
|
Dividends and discount accretion on preferred stock
|
632 |
—
|
—
|
|||||||||
|
Net (loss) earnings available to common shareholders
|
$ | (39 | ) | $ | 3,963 | $ | 6,679 | |||||
|
(Loss) earnings per share data:
|
||||||||||||
|
Basic
|
$ | (0.01 | ) | $ | 1.23 | $ | 2.03 | |||||
|
Diluted
|
$ | (0.01 | ) | $ | 1.22 | $ | 2.00 | |||||
|
Weighted average shares outstanding:
|
||||||||||||
|
Basic
|
$ | 3,182 | $ | 3,231 | $ | 3,296 | ||||||
|
Diluted
|
$ | 3,203 | $ | 3,254 | $ | 3,332 | ||||||
See accompanying notes to consolidated financial statements.
57
FNB BANCORP AND SUBSIDIARY
Years ended December 31, 2009, 2008 and 2007
| (Dollar amounts in thousands) | Preferred |
Accumulated
|
||||||||||||||||||||||||||||||
|
stock
|
stock
|
other
|
Compre-
|
|||||||||||||||||||||||||||||
|
Common stock
|
series
|
series
|
Retained
|
comprehensive
|
hensive
|
|||||||||||||||||||||||||||
|
Shares
|
Amount
|
A | B |
earnings
|
earnings(loss)
|
earnings
|
Total
|
|||||||||||||||||||||||||
|
Balance at December 31, 2006
|
2,853 | $ | 39,965 | $ | — | $ | — | $ | 22,102 | $ | (4 | ) | $ | 62,063 | ||||||||||||||||||
|
Net earnings
|
6,679 | $ | 6,679 | 6,679 | ||||||||||||||||||||||||||||
|
Other comprehensive earnings:
|
||||||||||||||||||||||||||||||||
|
Unrealized gain on securities, net of tax provision of $292
|
— | — | — | 421 | 421 | 421 | ||||||||||||||||||||||||||
|
Total comprehensive earnings
|
$ | 7,100 | ||||||||||||||||||||||||||||||
|
Cash dividends of $0.15 per share, quarterly
|
— | — | (1,716 | ) | — | (1,716 | ) | |||||||||||||||||||||||||
|
Stock dividend of 5%
|
141 | 4,022 | (4,022 | ) | — | — | ||||||||||||||||||||||||||
|
Cash on fractional shares related to stock dividend
|
— | — | (4 | ) | — | (4 | ) | |||||||||||||||||||||||||
|
Stock-based compensation expense
|
— | 68 | — | — | 68 | |||||||||||||||||||||||||||
|
Stock repurchased and retired
|
(46 | ) | (1,334 | ) | — | — | (1,334 | ) | ||||||||||||||||||||||||
|
Stock options exercised, including tax benefit of $22
|
17 | 368 | — | — | 368 | |||||||||||||||||||||||||||
|
Balance at December 31, 2007
|
2,965 | 43,089 | — | — | 23,039 | 417 | 66,545 | |||||||||||||||||||||||||
|
Net earnings
|
— | — | 3,963 | — | $ | 3,963 | 3,963 | |||||||||||||||||||||||||
|
Other comprehensive earnings:
|
||||||||||||||||||||||||||||||||
|
Unrealized gain on securities, net of tax provision of $657
|
— | — | — | 945 | 945 | 945 | ||||||||||||||||||||||||||
|
Total comprehensive earnings
|
$ | 4,908 | ||||||||||||||||||||||||||||||
|
Cash dividends of $0.15 per share, quarterly
|
— | — | (2,226 | ) | — | (2,226 | ) | |||||||||||||||||||||||||
|
Stock dividend of 5%
|
146 | 1,816 | (1,816 | ) | — | — | ||||||||||||||||||||||||||
|
Stock-based compensation expense
|
— | 171 | — | — | 171 | |||||||||||||||||||||||||||
|
Stock repurchased and retired
|
(92 | ) | (1,464 | ) | — | — | (1,464 | ) | ||||||||||||||||||||||||
|
Stock options exercised, including tax benefit of $8
|
11 | 215 | — | — | 215 | |||||||||||||||||||||||||||
|
Balance at December 31, 2008
|
3,030 | 43,827 | — | — | 22,960 | 1,362 | 68,149 | |||||||||||||||||||||||||
|
Preferred stock issued
|
11,360 | 640 | 12,000 | |||||||||||||||||||||||||||||
|
Net earnings
|
593 | $ | 593 | 593 | ||||||||||||||||||||||||||||
|
Other comprehensive earnings:
|
||||||||||||||||||||||||||||||||
|
Unrealized loss on securities, net of tax benefit of $42
|
(61 | ) | (61 | ) | (61 | ) | ||||||||||||||||||||||||||
|
Gain of sale of securities reclassification adjustment
|
(588 | ) | (588 | ) | (588 | ) | ||||||||||||||||||||||||||
|
Total comprehensive loss
|
$ | (56 | ) | |||||||||||||||||||||||||||||
|
Dividends and accretion on preferred stock
|
174 | (11 | ) | (632 | ) | (469 | ) | |||||||||||||||||||||||||
|
Cash dividends of $0.15 per share
|
|
(462 | ) | (462 | ) | |||||||||||||||||||||||||||
|
Cash dividends of $0.05 per share
|
|
(454 | ) | (454 | ) | |||||||||||||||||||||||||||
|
Stock dividend of 5%
|
152 | 1,060 | (1,060 | ) | ||||||||||||||||||||||||||||
|
Stock-based compensation expense
|
157 | 157 | ||||||||||||||||||||||||||||||
|
Balance at December 31, 2009
|
3,182 | $ | 45,044 | $ | 11,534 | $ | 629 | $ | 20,945 | $ | 713 | $ | 78,865 | |||||||||||||||||||
See accompanying notes to consolidated financial statements.
58
FNB BANCORP AND SUBSIDIARY
Years ended December 31, 2009, 2008 and 2007
|
2009
|
2008
|
2007
|
||||||||||
|
(Dollar amounts in thousands)
|
||||||||||||
|
Cash flows from operating activities:
|
||||||||||||
|
Net earnings
|
$ | 593 | $ | 3,963 | $ | 6,679 | ||||||
|
Adjustments to reconcile net earnings to net cash provided by operating activities:
|
||||||||||||
|
Depreciation,amortization and accretion
|
2,217 | 1,928 | 1,264 | |||||||||
|
(Gain) loss on sale or impairment of securities available-for-sale
|
(997 | ) | 290 | (4 | ) | |||||||
|
Loss (gain) on sale of other real estate owned
|
10 | 2 | — | |||||||||
|
Write-down of other real estate owned
|
— | 398 | — | |||||||||
|
Loss on impairment of other real estate owned
|
2,396 | 218 | — | |||||||||
|
Increase in other real estate owned valuation reserve
|
1,831 | — | — | |||||||||
|
Stock-based compensation expense
|
157 | 171 | 68 | |||||||||
|
Provision for loan losses
|
4,596 | 3,045 | 690 | |||||||||
|
Deferred taxes
|
(2,173 | ) | (470 | ) | (306 | ) | ||||||
|
Increase in interest receivable and other assets
|
(2,748 | ) | (1,467 | ) | (1,806 | ) | ||||||
|
Increase (decrease) in accrued expenses and other liabilities
|
429 | (2,385 | ) | (861 | ) | |||||||
|
Net cash provided by operating activities
|
6,311 | 5,693 | 5,724 | |||||||||
|
Cash flows from investing activities:
|
||||||||||||
|
Proceeds from matured/called securities available-for-sale
|
73,879 | 58,445 | 37,159 | |||||||||
|
Purchases of securities available-for-sale
|
(72,613 | ) | (62,253 | ) | (38,005 | ) | ||||||
|
Proceeds from sale of other real estate owned
|
2,291 | — | — | |||||||||
|
Net increase in loans
|
(8,846 | ) | (14,970 | ) | (71,267 | ) | ||||||
|
Proceeds from sales of bank premises, equipment, and leasehold improvements
|
— | 15 | — | |||||||||
|
Purchases of bank premises, equipment, and leasehold improvements
|
(307 | ) | (956 | ) | (1,479 | ) | ||||||
|
Net cash used in investing activities
|
(5,596 | ) | (19,719 | ) | (73,592 | ) | ||||||
|
Cash flows from financing activities:
|
||||||||||||
|
Net increase (decrease) in demand and savings deposits
|
112,571 | (3,843 | ) | 15,736 | ||||||||
|
Net (decrease) increase in time deposits
|
(14,517 | ) | 5,499 | 1,951 | ||||||||
|
(Decrease) increase in FHLB advances
|
(61,100 | ) | 20,100 | 36,000 | ||||||||
|
Net (decrease) increase in federal funds purchased
|
— | (5,595 | ) | 5,595 | ||||||||
|
Cash dividends paid on common stock
|
(1,212 | ) | (1,771 | ) | (1,720 | ) | ||||||
|
Cash dividends paid of preferred stock series A and B
|
(469 | ) | — | — | ||||||||
|
Issuance of preferred stock series A
|
11,360 | — | — | |||||||||
|
Issuance of preferred stock series B
|
640 | — | — | |||||||||
|
Exercise of stock options including tax benefit of $8 in 2008, $22 in 2007
|
— | 215 | 368 | |||||||||
|
Repurchases of common stock
|
— | (1,464 | ) | (1,334 | ) | |||||||
|
Net cash provided by financing activities
|
47,273 | 13,141 | 56,596 | |||||||||
|
Net increase (decrease) in cash and cash equivalents
|
47,988 | (885 | ) | (11,272 | ) | |||||||
|
Cash and cash equivalents at beginning of year
|
14,865 | 15,750 | 27,022 | |||||||||
|
Cash and cash equivalents at end of year
|
$ | 62,853 | $ | 14,865 | $ | 15,750 | ||||||
|
Additional cash flow information:
|
||||||||||||
|
Interest paid
|
$ | 9,517 | $ | 12,226 | $ | 13,215 | ||||||
|
Income taxes paid
|
843 | 1,590 | 2,335 | |||||||||
|
Non-cash investing and financing activities:
|
||||||||||||
|
Accrued dividends
|
159 | 4,141 | 4,022 | |||||||||
|
Change in fair value of available-for-sale securities
|
(649 | ) | 945 | 421 | ||||||||
|
Loans transferred to other real estate owned
|
7,885 | 3,515 | 440 | |||||||||
|
Deemed dividends on preferred stock
|
163 | — | — | |||||||||
See accompanying notes to consolidated financial statements.
59
FNB BANCORP AND SUBSIDIARY
December 31, 2009, 2008 and 2007
|
(1)
|
The Company and Summary of Significant Accounting Policies | |
| FNB Bancorp (the “Company”) is a bank holding company registered under the Bank Holding Company Act of 1956, as amended. The Company was incorporated under the laws of the State of California on February 28, 2001. The consolidated financial statements include the accounts of FNB Bancorp and its wholly owned subsidiary, First National Bank of Northern California (the “Bank”). The Bank provides traditional banking services in San Mateo and San Francisco counties. | ||
| The preparation of consolidated financial statements in conformity with accounting principles generally accepted in the United States of America requires management to make estimates and assumptions that affect the reported amounts of assets and liabilities and the disclosure of contingent assets and liabilities at the date of the financial statements and revenue and expenses during the reporting period. Actual results could differ from those estimates. For the Bank, the significant accounting estimate is the allowance for loan losses (note 1f), the valuation of goodwill and the valuation of the allowance for deferred tax assets. A summary of the significant accounting policies applied in the preparation of the accompanying consolidated financial statements follows. | ||
|
(a)
|
Basis of Presentation
|
|
|
The accounting and reporting policies of the Company and its wholly owned subsidiary are in accordance with accounting principles generally accepted in the United States of America. All intercompany balances and transactions have been eliminated.
|
||
|
(b)
|
Cash and Cash Equivalents
|
|
|
Cash and cash equivalents include cash on hand, amounts due from banks, and federal funds sold. Generally, federal funds are sold for one-day periods. The cash equivalents are readily convertible to known amounts of cash and present insignificant risk of changes in value due to original maturity dates of 90 days or less. Included in cash and cash equivalents are restricted balances at the Federal Reserve Bank which relate to a minimum cash reserve requirement of approximately $855,000 and $3,046,000 at December 31, 2009 and 2008, respectively.
|
||
|
(c)
|
Investment Securities
|
|
|
Investment securities consist of U.S. Treasury securities, U.S. agency securities, obligations of states and political subdivisions, obligations of U.S. corporations, mortgage-backed securities and other securities. At the time of purchase of a security, the Company designates the security as held-to-maturity or available-for-sale, based on its investment objectives, operational needs, and intent to hold. The Company classifies securities as held to maturity only if and when it has the positive intent and ability to hold the security to maturity. The Company does not purchase securities with the intent to engage in trading activity. Held to maturity securities are recorded at amortized cost, adjusted for amortization of premiums or accretion of discounts. The Company did not have any investments in the held-to-maturity portfolio at December 31, 2009 or 2008.
|
||
60
FNB BANCORP AND SUBSIDIARY
Notes to Consolidated Financial Statements
December 31, 2009, 2008 and 2007
|
Securities available-for-sale are recorded at fair value with unrealized holding gains or losses, net of the related tax effect, reported as a separate component of stockholders’ equity until realized.
|
|
An impairment charge would also be recorded if the Company has the intent to sell a security that is currently in an unrealized loss position or where the Company may be required to sell a security that is currently in an unrealized loss position. A decline in the market value of any security available-for-sale or held-to-maturity below cost that is deemed other than temporary results in a charge to earnings and the corresponding establishment of a new cost basis for the security. Amortization of premiums and accretion of discounts on debt securities are included in interest income over the life of the related security held-to-maturity or available-for-sale using the effective interest method. Dividend and interest income are recognized when earned. Realized gains and losses for securities classified as available-for-sale and held-to-maturity are included in earnings and are derived using the specific identification method for determining the cost of securities sold.
|
||
|
Investments with fair values that are less than amortized cost are considered impaired. Impairment may result from either a decline in the financial condition of the issuing entity or, in the case of fixed interest rate investments, from rising interest rates. At each consolidated financial statement date, management assesses each investment to determine if impaired investments are temporarily impaired or if the impairment is other than temporary. This assessment includes a determination of whether the Company intends to sell the security, or if it is more likely than not that the Company will be required to sell the security before recovery of its amortized cost basis less any current-period credit losses. For debt securities that are considered other than temporarily impaired and that the Company does not intend to sell and will not be required to sell prior to recovery of the amortized cost basis, the amount of impairment is separated into the amount that is credit related (credit loss component) and the amount due to all other factors. The credit loss component is recognized in earnings and is calculated as the difference between the security’s amortized cost basis and the present value of its expected future cash flows. The remaining difference between the security’s fair value and the present value of the future expected cash flows is deemed to be due to factors that are not credit related and is recognized in other comprehensive income.
|
||
|
(d)
|
Derivatives
|
|
|
All derivatives contracts are recognized as either assets or liabilities in the balance sheet and measured at fair value. The Company did not hold any derivative contracts at December 31, 2009 and 2008.
|
61
FNB BANCORP AND SUBSIDIARY
Notes to Consolidated Financial Statements
December 31, 2009, 2008 and 2007
|
(e)
|
Loans
|
|
|
Loans are reported at the principal amount outstanding, net of deferred loan fees and the allowance for loan losses. A loan is considered impaired when, based on current information and events, it is probable that the Company will be unable to collect all amounts due according to the contractual terms of the loan agreement, including scheduled interest payments. For a loan that has been restructured, the contractual terms of the loan agreement refer to the contractual terms specified by the original loan agreement, not the contractual terms specified by the restructuring agreement. An impaired loan is measured based upon the present value of future cash flows discounted at the loan’s effective rate, the loan’s observable market price, or the fair value of collateral if the loan is collateral dependent. Interest on impaired loans is recognized on a cash basis. If the measurement of the impaired loan is less than the recorded investment in the loan, an impairment is recognized by a charge to the allowance for loan losses. An unearned discount on installment loans is recognized as income over the terms of the loans by the interest method. Interest on other loans is alculated by using the simple interest method on the daily balance of the principal amount outstanding.
|
||
|
Loan fees net of certain direct costs of origination, which represent an adjustment to interest yield, are deferred and amortized over the contractual term of the loan using the interest method.
|
||
|
Loans on which the accrual of interest has been discontinued are designated as nonaccrual loans. Accrual of interest on loans is discontinued either when reasonable doubt exists as to the full and timely collection of interest or principal when a loan becomes contractually past due by 90 days or more with respect to interest or principal. When a loan is placed on nonaccrual status, all interest previously accrued but not collected is reversed against current period interest income. Interest accruals are resumed on such loans only when they are brought fully current with respect to interest and principal and when, in the judgment of management, the loans are estimated to be fully collectible as to both principal and interest. Restructured loans are loans on which concessions in terms have been granted because of the borrowers’ financial difficulties. Interest is generally accrued on such loans in accordance with the new terms.
|
||
|
(f)
|
Allowance for Loan Losses
|
|
|
The allowance for loan losses is established through a provision for loan losses charged to expense. Loans are charged off against the allowance for loan losses when management believes that the collectibility of the principal is unlikely. The allowance is an amount that management believes will be adequate to absorb probable losses inherent in existing loans, standby letters of credit, overdrafts, and commitments to extend credit based on evaluations of collectibility and prior loss experience. The evaluations take into consideration such factors as changes in the nature and volume of the portfolio, overall portfolio quality, loan concentrations, specific problem loans and current and anticipated economic conditions that may affect the borrowers’ ability to pay. While management uses these evaluations to determine the level of the allowance for loan losses, future provisions may be necessary based on changes in the factors used in the evaluations. Material estimates relating to the determination of the allowance for loan losses are particularly susceptible to significant change in the near term. Management believes that the allowance for loan losses is adequate as of December 31, 2009. While management uses available information to recognize losses on loans, future additions to the allowance may be necessary based on changes in economic conditions, and our borrowers ability to pay. In addition, the banking regulators, as an integral part of its examination process, periodically review the Bank’s allowance for loan losses. The banking regulators may require the Bank to recognize additions to the allowance based on their judgment about information available to them at the time of their examination.
|
62
FNB BANCORP AND SUBSIDIARY
Notes to Consolidated Financial Statements
December 31, 2009, 2008 and 2007
|
(g)
|
Premises and Equipment
|
|
|
Premises and equipment are reported at cost less accumulated depreciation using the straight-line method over the estimated service lives of related assets ranging from 3 to 50 years original life. Leasehold improvements are amortized over the estimated lives of the respective leases or the service lives of the improvements, whichever is shorter.
|
||
|
(h)
|
Other Real Estate Owned
|
|
|
Real estate properties acquired through, or in lieu of, loan foreclosure are to be sold and are initially recorded at the lower of the carrying amount of the loan or fair value of the property at the date of foreclosure less selling costs. Subsequent to foreclosure, valuations are periodically performed, and any subsequent revisions in the estimate of fair value are reported as an adjustment to the carrying value of the real estate, provided the adjusted carrying amount does not exceed the original amount at foreclosure. Revenues and expenses from operations and changes in the valuation allowance are included in other operating expenses.
|
||
|
(i)
|
Goodwill and Other Intangible Assets
|
|
|
Goodwill is recognized in a business acquisition transaction when the acquisition purchase price exceeds the fair market value of identified tangible andintangible assets and liabilities. Goodwill is subsequently evaluated for possible impairment at least annually. If impairment is determined to exist, it is recorded in the period it is identified. The Company evaluated goodwill at December 31, 2009, and found no impairment.
|
||
|
Other intangible assets consist of core deposit and customer intangible assets that are initially recorded at fair value and subsequently amortized over their estimated useful lives, usually no longer than a seven year period.
|
||
|
(j)
|
Cash Dividends
|
|
|
The Company’s ability to pay cash dividends is subject to restrictions set forth in the California General Corporation Law. Funds for payment of any cash dividends by the Company would be obtained from its investments as well as dividends and/or management fees from the Bank. The Bank’s ability to pay cash dividends is subject to restrictions imposed under the National Bank Act and regulations promulgated by the Office of the Comptroller of the Currency.
|
||
|
(k)
|
Stock Dividend
|
|
|
On September 28, 2009, the Company announced that its Board of Directors had declared a five percent (5%) stock dividend resulting in approximately 151,521 shares, payable at the rate of one share of Common Stock for every twenty (20) shares of Common Stock owned. The stock dividend was paid on December 15, 2009, to stockholders of record on November 30, 2009. The earnings per share data for all periods presented has been adjusted for this stock dividend.
|
63
FNB BANCORP AND SUBSIDIARY
Notes to Consolidated Financial Statements
December 31, 2009, 2008 and 2007
|
(l)
|
Income Taxes
|
|
|
Deferred income taxes are determined using the asset and liability method. Under this method, the net deferred tax asset or liability is recognized for tax consequences of temporary differences by applying current tax rates to differences between the financial reporting and the tax basis of existing assets and liabilities. Deferred tax assets and liabilities are reflected at currently enacted income tax rates applicable to the period in which the deferred tax assets or liabilities are expected to be realized or settled. A valuation allowance is established through the provision for income taxes for any deferred tax assets where the collectibility of the asset is in doubt. During 2009, the Company recorded an addition to the deferred tax asset valuation allowance of $264,000 related to tax credit carryforwards from the Bank’s investment in low income housing real estate partnerships. As changes in tax laws or rates are enacted, deferred tax assets and liabilities are adjusted through the provision for income taxes.
|
||
|
Accounting for Income Tax Uncertainties
|
||
|
The Company had unrecognized tax benefits of $375,000 and $37,500 as of December 31, 2009 and 2008, respectively. These unrecognized tax benefits are related to income tax uncertainties surrounding the Bank’s Enterprise Zone net interest deduction. The Bank is currently being audited by the Franchise Tax Board for the years ended December 31, 2005 and 2006.
|
||
|
The Company recognizes interest accrued and penalties related to unrecognized tax benefits in tax expense. During the years ended December 31, 2009 and 2008 the Company believes that any penalties and interest penalties that may exist are not material and The Company has not accrued for them.
|
||
|
(m)
|
Earnings per Share
|
|
|
Basic earnings per share is computed by dividing net income by the weighted average common shares outstanding. Diluted earnings per share reflects potential dilution from outstanding stock options, using the treasury stock method. There were 342,889, 305,258 and 44,290 antidilutive shares in the years ended December 31, 2009, 2008 and 2007, respectively which were not included in the calculation.
|
64
FNB BANCORP AND SUBSIDIARY
Notes to Consolidated Financial Statements
December 31, 2009, 2008 and 2007
|
Reconciliation of weighted average shares used in computing basic and diluted (loss) earnings per share is as follows:
|
|
(Number of shares in thousands)
|
2009
|
2008
|
2007
|
|||||||||
|
Weighted average common shares outstanding-used in computing basic (loss) earnings per share
|
3,182 | 3,231 | 3,296 | |||||||||
|
Dilutive effect of stock options outstanding, using the treasury stock method
|
21 | 23 | 36 | |||||||||
|
Shares used in computing diluted (loss) earnings per share
|
3,203 | 3,254 | 3,332 | |||||||||
|
(n)
|
Stock Option Plans
|
|
|
Measurement of the cost of stock options granted is based on the grant-date fair value of each stock option granted using the Black-Scholes valuation model. The cost is then amortized to expense on a straight-line basis over each option’s requisite service period. The amortized expense of the stock option’s fair value has been included in salaries and employee benefits expense for the three years ended December 31, 2009, 2008 and 2007. The expected term of options granted is derived from the output of the option valuation model and represents the period of time that options granted are expected to be outstanding. The risk-free rate for periods within the contractual life of the option is based on the U. S. Treasury yield curve in effect at the time of the grant. The Company’s stock has limited liquidity and limited trading activity. Volatility was calculated using historical price changes on a monthly basis over the expected life of the option.
|
||
|
(o)
|
Fair Values of Financial Instruments
|
|
|
Fair Value Measurements establishes a disclosure framework that quantifies fair value estimates by the level of pricing precision. The degree of judgment utilized in measuring the fair value of assets generally correlates to the level of pricing precision. Financial instruments rarely traded or not quoted will generally have a higher degree of judgment utilized in measuring fair value. Pricing precision is impacted by a number of factors including the type of asset, the availability of the asset, the market demand for the asset, and other conditions that were considered at the time of the valuation. See “Fair Value Measurements” for additional information about the level of pricing transparency associated with the financial instruments carried at fair value.
|
||
|
Fair Value Measurement. The following tables present information about the Company’s assets and liabilities measured at fair value as of December 31, 2009, and indicates the fair value techniques used by the Company to determine such fair value. In general, fair values determined by Level 1 inputs utilize quoted prices (unadjusted) in active markets for identical assets or liabilities that the Company has the ability to access. Level 2 inputs include quoted prices for similar assets and liabilities in active markets, and inputs other than quoted prices that are observable for the asset or liability, such as interest rates and yield curves that are observable at commonly quoted intervals. Level 3 inputs are unobservable inputs for the asset or liability, and include situations where there is little, if any, market activity for the asset or liability. In certain cases, the inputs used to measure fair value may fall into different levels of the fair value hierarchy. In such cases, the level in the fair value hierarchy within which the fair value measurement in its entirety falls has been determined based on the lowest level input that is significant to the fair value measurement in its entirety. The Company’s assessment of the significance of a particular input to the fair value measurement in its entirety requires judgment, and considers factors specific to the asset or liability.
|
65
FNB BANCORP AND SUBSIDIARY
Notes to Consolidated Financial Statements
December 31, 2009, 2008 and 2007
|
The following table presents the recorded amounts of assets measured at fair value on a recurring basis:
|
|
Fair Value Measurements
|
||||||||||||||||
|
(Dollar amounts in thousands)
|
at December 31, 2009, Using
|
|||||||||||||||
|
Quoted Prices in
|
Other
|
Significant
|
||||||||||||||
|
Active Markets for
|
Observable
|
Unobservable
|
||||||||||||||
|
Fair Value
|
Identical Assets
|
Inputs
|
Inputs
|
|||||||||||||
|
Description
|
12/31/2009
|
(Level 1)
|
(Level 2)
|
(Level 3)
|
||||||||||||
|
Available-for-sale securities
|
$ | 97,188 | $ | — | $ | 97,188 | $ | — | ||||||||
|
Total assets measured at fair value
|
$ | 97,188 | $ | — | $ | 97,188 | $ | — | ||||||||
|
Fair Value Measurements
|
||||||||||||||||
|
(Dollar amounts in thousands)
|
at December 31, 2008, Using
|
|||||||||||||||
|
Quoted Prices in
|
||||||||||||||||
|
Active Markets
|
Other
|
Significant
|
||||||||||||||
|
for Identical
|
Observable
|
Unobservable
|
||||||||||||||
|
Fair Value
|
Assets
|
Inputs
|
Inputs
|
|||||||||||||
|
Description
|
12/31/2008
|
(Level 1)
|
(Level 2)
|
(Level 3)
|
||||||||||||
|
Available-for-sale securities
|
$ | 99,221 | $ | — | $ | 99,221 | $ | — | ||||||||
|
Total assets measured at fair value
|
$ | 99,221 | $ | — | $ | 99,221 | $ | — | ||||||||
|
Fair values established for available-for-sale investment securities are based on estimates of fair values quoted for similar types of securities with similar maturities, risk and yield characteristics.
|
66
FNB BANCORP AND SUBSIDIARY
Notes to Consolidated Financial Statements
December 31, 2009, 2008 and 2007
|
The following table presents the recorded amount of assets measured at fair value on a non-recurring basis:
|
|
Fair Value Measurements
|
||||||||||||||||||||
|
(Dollar amounts in thousands)
|
at December 31, 2009, Using
|
|||||||||||||||||||
|
Quoted Prices in
|
||||||||||||||||||||
|
Active Markets
|
Other
|
Significant
|
||||||||||||||||||
|
for Identical
|
Observable
|
Unobservable
|
||||||||||||||||||
|
Fair Value
|
Assets
|
Inputs
|
Inputs
|
Total
|
||||||||||||||||
|
Description
|
12/31/2009
|
(Level 1)
|
(Level 2)
|
(Level 3)
|
losses
|
|||||||||||||||
|
Impaired loans
|
$ | 23,743 | $ | — | $ | — | $ | 23,743 | $ | 2,875 | ||||||||||
|
Other real estate owned
|
7,320 | — | — | 7,320 | 1,831 | |||||||||||||||
|
Total impaired assets measured at fair value
|
$ | 31,063 | $ | — | $ | — | $ | 31,063 | $ | 4,706 | ||||||||||
| (Dollar amounts in thousands) |
Fair Value Measurements
|
||||||||||||||||||
|
at December 31, 2008, Using
|
|||||||||||||||||||
| Quoted Prices in | |||||||||||||||||||
| Active Markets | Other |
Significant
|
|||||||||||||||||
| for Identical | Observable |
Unobservable
|
|||||||||||||||||
|
Fair Value
|
Assets | Inputs |
Inputs
|
Total
|
|||||||||||||||
|
Description
|
12/31/2008
|
(Level 1) | (Level 2) |
(Level 3)
|
losses
|
||||||||||||||
|
Impaired loans
|
$ | 13,440 | $ | — | $ | — | $ | 13,440 | $ | (678 | ) | ||||||||
|
Total impaired assets measured at fair value
|
$ | 13,440 | $ | — | $ | — | $ | 13,440 | $ | (678 | ) | ||||||||
|
For assets measured at fair value on a nonrecurring basis using significant unobservable inputs (level 3), this Statement requires a reconciliation of the beginning and ending balances separately for each major category of assets, which may be presented as follows:
|
| Fair Value Measurements Using | ||||||||||||
| Significant Unobservable Inputs | ||||||||||||
| (Level 3) | ||||||||||||
|
Other Real
|
||||||||||||
|
Impaired
|
Estate
|
|||||||||||
|
Loans
|
Owned
|
Losses
|
||||||||||
|
Balance 12/31/2008
|
$ | 13,440 | $ | 3,557 | $ | 678 | ||||||
|
Additions
|
19,769 | 4,120 | 4,698 | |||||||||
|
Deletions
|
(9,466 | ) | (357 | ) | (670 | ) | ||||||
|
Balance 12/31/2009
|
$ | 23,743 | $ | 7,320 | $ | 4,706 | ||||||
|
The Bank does not record loans at fair value. However, from time to time, if a loan is considered impaired, and a specific allowance for loan losses is established, loans for which it is probable that payment of interest and principal will not be made in accordance with the contractual terms of the loan agreement, are considered impaired. Once a loan is identified as individually impaired, management measures impairment in accordance with the Financial Accounting Standards Board Accounting Standards Codification Section 820. In accordance with this guidance, impaired loans that have a specific allowance established based on the fair value of collateral require classification in the fair value hierarchy. If the fair value of the collateral is based on an observable market price, the Bank records the impaired loans as nonrecurring Level 2. When management determines the fair value of the collateral is further impaired below the appraised value and there is no observable market price, the Bank records the impaired loans as nonrecurring Level 3. Specific reserves of $2,875,000 have been established for impaired loans as of December 31, 2009.
|
67
FNB BANCORP AND SUBSIDIARY
Notes to Consolidated Financial Statements
December 31, 2009, 2008 and 2007
|
(p)
|
Income Tax Credits
|
|
|
At December 31, 2009, the Bank had a $2,304,000 net book value investment in three partnerships, which own low-income affordable housing projects that generate tax benefits in the form of federal and state housing tax credits. As a limited partner investor in these partnerships, the Company receives tax benefits in the form of tax deductions from partnership operating losses and federal and state income tax credits. The federal and state income tax credits are earned over a 10-year period as a result of the investment properties meeting certain criteria and are subject to recapture for noncompliance with such criteria over a 15-year period. The expected benefit resulting from the low-income housing tax credits is recognized in the period for which the tax benefit is recognized in the Company’s consolidated tax returns. These investments are accounted for using the historical cost method less depreciation and amortization and are recorded in other assets on the balance sheet. The Company recognizes tax credits as they are allocated and amortizes the initial cost of the investments over the period that tax credits are allocated to the Company.
|
||
|
The expected residual value of the investment at the end of the tax credit allocation period is zero. Cash received from operations of the limited partnership or sale of the properties, if any, will be included in earnings when realized.
|
||
|
(q)
|
Reclassifications
|
|
|
Certain prior year information has been reclassified to conform to current year presentation. The reclassifications had no impact on consolidated net earnings or retained earnings.
|
||
|
(r)
|
Bank Owned Life Insurance
|
|
|
The Company purchased insurance on the lives of certain executives. The policies accumulate asset values to meet future liabilities including the payment of employee benefits such as the deferred compensation plan. Increases in the cash surrender value are recorded as other noninterest income in the consolidated statements of earnings. The cash surrender value of bank owned life insurance is reflected in other assets on the consolidated balance sheets in the amount of $8,866,000 and $10,781,000 at December 31, 2009 and 2008, respectively. During 2009 and 2008, the Company realized $316,000 and $760,000, respectively in death benefits from a life insurance contract covering a former executive of the Company.
|
68
FNB BANCORP AND SUBSIDIARY
Notes to Consolidated Financial Statements
December 31, 2009, 2008 and 2007
|
(s)
|
Federal Home Loan Bank Borrowings
|
|
|
The Bank maintains a collateralized line of credit with the Federal Home Loan Bank (“FHLB”) of San Francisco. Under this line, the Bank may borrow on a short term or a long term (over one year) basis. FHLB advances are recorded and carried at their historical cost. FHLB advances are not transferable and may contain prepayment penalties. In addition to the collateral pledged, the Company is required to hold prescribed amounts of FHLB stock that vary with the usage of FHLB credits.
|
||
|
(t)
|
Recently Issued Accounting Pronouncements
|
|
|
The Financial Accounting Standards Board’s (FASB) Accounting Standards Codification (ASC) became effective on July 1, 2009. At that date, the ASC became FASB’s officially recognized source of authoritative U.S. generally accepted accounting principles (GAAP) applicable to all public and non-public non-governmental entities, superseding existing FASB, American Institute of Certified Public Accountants (AICPA), Emerging Issues Task Force (EITF) and related literature. Rules and interpretive releases of the SEC under the authority of federal securities laws are also sources of authoritative GAAP for SEC registrants. All other accounting literature is considered non-authoritative. The switch to the ASC affects the away companies refer to U.S. GAAP in financial statements and accounting policies. Citing particular content in the ASC involves specifying the unique numeric path to the content through the Topic, Subtopic, Section and Paragraph structure.
|
||
|
The Company has adopted guidance as codified by the Financial Accounting Standards Board (“FASB”) which refers to “Interim Disclosures about Fair Value of Financial Instruments” which was issued in April 2009. This guidance amends earlier guidance on the same subject as well as guidance regarding “Interim Financial Reporting” by requiring disclosures about fair value of financial instruments for interim reporting periods of publicly traded companies as well as in annual financial statements and requiring disclosures in summarized financial information at interim reporting periods.
|
||
|
This guidance is effective for interim reporting periods ending after June 15, 2009; early adoption is permitted for periods ending after March 15, 2009. This guidance did not have a material impact on the Company’s financial statements.
|
||
|
The Company has adopted guidance as codified by the Financial Accounting Standards Board (“FASB”) issued in April 2009, which amends the other-than-temporary impairment guidance in U. S. GAAP for debt securities to make the guidance more operational and to improve the presentation and disclosure of other-than-temporary impairments on debt and equity securities in the financial statements. This guidance does not amend an existing recognition and measurement guidance related to other-than-temporary impairments of equity securities.
|
||
|
The Company has adopted guidance as codified by the Financial Accounting Standards Board (“FASB”) issued in April 2009, which was adopted to provide additional guidance for estimating fair value in accordance with guidance regarding “Fair Value Measurements”, when the volume and level of activity for the asset or liability have significantly decreased. This guidance also includes guidance on identifying circumstances that indicate a transaction is not orderly.
|
69
FNB BANCORP AND SUBSIDIARY
Notes to Consolidated Financial Statements
December 31, 2009, 2008 and 2007
|
FASB ASC Topic 260, “Earnings Per Share.” On January 1, 2009, the Company adopted new authoritative accounting guidance under FASB ASC Topic 260, “Earnings Per Share,” which provides that unvested share-based payment awards that contain nonforfeitable rights to dividends or dividend equivalents (whether paid or unpaid) are participating securities and shall be included in the computation of earnings per share pursuant to the two-class method. Adoption of the new guidance did not significantly impact the Company’s financial statements.
|
||
|
FASB ASC Topic 320, “Investments - Debt and Equity Securities.” New authoritative accounting guidance under ASC Topic 320, “Investments - Debt and Equity Securities,” (i) changes existing guidance for determining whether an impairment is other than temporary to debt securities and (ii) replaces the existing requirement that the entity’s management assert it has both the intent and ability to hold an impaired security until recovery with a requirement that management assert: (a) it does not have the intent to sell the security; and (b) it is more likely than not it will not have to sell the security before recovery of its cost basis. Under ASC Topic 320, declines in the fair value of held-to-maturity and available-for-sale securities below their cost that are deemed to be other than temporary are reflected in earnings as realized losses to the extent the impairment is related to credit losses. The amount of the impairment related to other factors is recognized in other comprehensive income. The Company adopted the provisions of the new authoritative accounting guidance under ASC Topic 320 during the first quarter of 2009. Adoption of the new guidance did not significantly impact the Company’s financial statements.
|
||
|
FASB ASC Topic 715, “Compensation - Retirement Benefits.” New authoritative accounting guidance under ASC Topic 715, “Compensation - Retirement Benefits,” provides guidance related to an employer’s disclosures about plan assets of defined benefit pension or other post-retirement benefit plans. Under ASC Topic 715, disclosures should provide users of financial statements with an understanding of how investment allocation decisions are made, the factors that are pertinent to an understanding of investment policies and strategies, the major categories of plan assets, the inputs and valuation techniques used to measure the fair value of plan assets, the effect of fair value measurements using significant unobservable inputs on changes in plan assets for the period and significant concentrations of risk within plan assets. The disclosures required by ASC Topic 715 are included in the Company’s financial statements beginning with the financial statements for the year-ended December 31, 2009.
|
||
|
FASB ASC Topic 805, “Business Combinations.” On January 1, 2009, new authoritative accounting guidance under ASC Topic 805, “Business Combinations,” became applicable to the Company’s accounting for business combinations closing on or after January 1, 2009. ASC Topic 805 applies to all transactions and other events in which one entity obtains control over one or more other businesses. ASC Topic 805 requires an acquirer, upon initially obtaining control of another entity, to recognize the assets, liabilities and any non-controlling interest in the acquiree at fair value as of the acquisition date. Contingent consideration is required to be recognized and measured at fair value on the date of acquisition rather than at a later date when the amount of that consideration may be determinable beyond a reasonable doubt. This fair value approach replaces the cost-allocation process required under previous accounting guidance whereby the cost of an acquisition was allocated to the individual assets acquired and liabilities assumed based on their estimated fair value. ASC Topic 805 requires acquirers to expense acquisition-related costs as incurred rather than allocating such costs to the assets acquired and liabilities assumed, as was previously the case under prior accounting guidance. Assets acquired and liabilities assumed in a business combination that arise from contingencies are to be recognized at fair value if fair value can be reasonably estimated. If fair value of such an asset or liability cannot be reasonably estimated, the asset or liability would generally be recognized in accordance with ASC Topic 450, “Contingencies.” Under ASC Topic 805, the requirements of ASC Topic 420, “Exit or Disposal Cost Obligations,” would have to be met in order to accrue for a restructuring plan in purchase accounting. Pre-acquisition contingencies are to be recognized at fair value, unless it is a non-contractual contingency that is not likely to materialize, in which case, nothing should be recognized in purchase accounting and, instead, that contingency would be subject to the probable and estimable recognition criteria of ASC Topic 450, “Contingencies.”
|
70
FNB BANCORP AND SUBSIDIARY
Notes to Consolidated Financial Statements
December 31, 2009, 2008 and 2007
|
FASB ASC Topic 810, “Consolidation.” New authoritative accounting guidance under ASC Topic 810, “Consolidation,” amended prior guidance to establish accounting and reporting standards for the non-controlling interest in a subsidiary and for the deconsolidation of a subsidiary. Under ASC Topic 810, a non-controlling interest in a subsidiary, which is sometimes referred to as minority interest, is an ownership interest in the consolidated entity that should be reported as a component of equity in the consolidated financial statements. Among other requirements, ASC Topic 810 requires consolidated net income to be reported at amounts that include the amounts attributable to both the parent and the non-controlling interest. It also requires disclosure, on the face of the consolidated income statement, of the amounts of consolidated net income attributable to the parent and to the non-controlling interest. The new authoritative accounting guidance under ASC Topic 810 became effective for the Company on January 1, 2009 and did not have a significant impact on the Company’s financial statements.
|
||
|
Further new authoritative accounting guidance under ASC Topic 810 amends prior guidance to change how a company determines when an entity that is insufficiently capitalized or is not controlled through voting (or similar rights) should be consolidated. The determination of whether a company is required to consolidate an entity is based on, among other things, an entity’s purpose and design and a company’s ability to direct the activities of the entity that most significantly impact the entity’s economic performance. The new authoritative accounting guidance requires additional disclosures about the reporting entity’s involvement with variable-interest entities and any significant changes in risk exposure due to that involvement as well as its affect on the entity’s financial statements. The new authoritative accounting guidance under ASC Topic 810 will be effective January 1, 2010 and is not expected to have a significant impact on the Company’s financial statements.
|
71
FNB BANCORP AND SUBSIDIARY
Notes to Consolidated Financial Statements
December 31, 2009, 2008 and 2007
|
FASB ASC Topic 815, “Derivatives and Hedging.” New authoritative accounting guidance under ASC Topic 815, “Derivatives and Hedging,” amends prior guidance to amend and expand the disclosure requirements for derivatives and hedging activities to provide greater transparency about (i) how and why an entity uses derivative instruments, (ii) how derivative instruments and related hedge items are accounted for under ASC Topic 815, and (iii) how derivative instruments and related hedged items affect an entity’s financial position, results of operations and cash flows. To meet those objectives, the new authoritative accounting guidance requires qualitative disclosures about objectives and strategies for using derivatives, quantitative disclosures about fair value amounts of gains and losses on derivative instruments and disclosures about credit-risk-related contingent features in derivative agreements. The new authoritative accounting guidance under ASC Topic 815 became effective for the Company on January 1, 2009 and did not have a significant impact on the Company’s financial statements.
|
||
|
FASB ASC Topic 820, “Fair Value Measurements and Disclosures.” New authoritative accounting guidance under ASC Topic 820, ”Fair Value Measurements and Disclosures,” affirms that the objective of fair value when the market for an asset is not active is the price that would be received to sell the asset in an orderly transaction, and clarifies and includes additional factors for determining whether there has been a significant decrease in market activity for an asset when the market for that asset is not active. ASC Topic 820 requires an entity to base its conclusion about whether a transaction was not orderly on the weight of the evidence. The new accounting guidance amended prior guidance to expand certain disclosure requirements. The Company adopted the new authoritative accounting guidance under ASC Topic 820 during the first quarter of 2009. Adoption of the new guidance did not significantly impact the Company’s financial statements.
|
||
|
Further new authoritative accounting guidance (Accounting Standards Update No. 2009-5) under ASC Topic 820 provides guidance for measuring the fair value of a liability in circumstances in which a quoted price in an active market for the identical liability is not available. In such instances, a reporting entity is required to measure fair value utilizing a valuation technique that uses (i) the quoted price of the identical liability when traded as an asset, (ii) quoted prices for similar liabilities or similar liabilities when traded as assets, or (iii) another valuation technique that is consistent with the existing principles of ASC Topic 820, such as an income approach or market approach. The new authoritative accounting guidance also clarifies that when estimating the fair value of a liability, a reporting entity is not required to include a separate input or adjustment to other inputs relating to the existence of a restriction that prevents the transfer of the liability. The forgoing new authoritative accounting guidance under ASC Topic 820 became effective for the Company’s financial statements beginning October 1, 2009 and had no impact on the Company’s financial statements.
|
72
FNB BANCORP AND SUBSIDIARY
Notes to Consolidated Financial Statements
December 31, 2009, 2008 and 2007
|
FASB ASC Topic 825 “Financial Instruments.” New authoritative accounting guidance under ASC Topic 825, “Financial Instruments,” requires an entity to provide disclosures about the fair value of financial instruments in interim financial information and amends prior guidance to require those disclosures in summarized financial information at interim reporting periods.
|
||
|
FASB ASC Topic 860, “Transfers and Servicing.” New authoritative accounting guidance under ASC Topic 860, “Transfers and Servicing,” amends prior accounting guidance to enhance reporting about transfers of financial assets, including securitizations, and where companies have continuing exposure to the risks related to transferred financial assets. The new authoritative accounting guidance eliminates the concept of a “qualifying special-purpose entity” and changes the requirements for derecognizing financial assets. The new authoritative accounting guidance also requires additional disclosures about all continuing involvements with transferred financial assets including information about gains and losses resulting from transfers during the period. The new authoritative accounting guidance under ASC Topic 860 will be effective January 1, 2010 and is not expected to have a significant impact on the Company’s financial statements.
|
||
|
(2)
|
Restricted Cash Balance
|
|
|
Cash and due from banks includes balances with the Federal Reserve Bank (the FRB). The Bank is required to maintain specified minimum average balances with the FRB, based primarily upon the Bank’s deposit balances. As of December 31, 2009 and 2008, the Bank maintained deposits in excess of the FRB reserve requirement.
|
||
|
(3)
|
Securities Available-for-Sale
|
|
|
The amortized cost and carrying values of securities available-for-sale are as follows:
|
||
|
(Dollar amounts in thousands)
|
Amortized
|
Unrealized
|
Unrealized
|
Carrying
|
||||||||||||
|
cost
|
gains
|
losses
|
value
|
|||||||||||||
|
December 31, 2009:
|
||||||||||||||||
|
Obligations of U.S. Government agencies
|
$ | 45,100 | $ | 274 | $ | (67 | ) | $ | 45,307 | |||||||
|
Mortgage-backed securities
|
22,185 | 238 | (144 | ) | 22,279 | |||||||||||
|
Obligations of states and political subdivisions
|
24,998 | 887 | (18 | ) | 25,867 | |||||||||||
|
Corporate debt
|
3,696 | 41 | (2 | ) | 3,735 | |||||||||||
| $ | 95,979 | $ | 1,440 | $ | (231 | ) | $ | 97,188 | ||||||||
|
December 31, 2008:
|
||||||||||||||||
|
Obligations of U.S. Government agencies
|
$ | 44,309 | $ | 1,003 | $ | — | $ | 45,312 | ||||||||
|
Mortgage-backed securities
|
13,686 | 444 | — | 14,130 | ||||||||||||
|
Obligations of states and political subdivisions
|
38,918 | 914 | (53 | ) | 39,779 | |||||||||||
| $ | 96,913 | $ | 2,361 | $ | (53 | ) | $ | 99,221 | ||||||||
73
FNB BANCORP AND SUBSIDIARY
Notes to Consolidated Financial Statements
December 31, 2009, 2008 and 2007
|
An analysis of gross unrealized losses of the available for sale investment securities portfolio as of December 31, 2009 and December 31, 2008 follows.
|
|
December 31, 2009:
|
Total
|
< 12 Months
|
Total
|
12 Months or >
|
Total
|
Total
|
||||||||||||||||||
|
(Dollar amounts
|
Fair
|
Unrealized
|
Fair
|
Unrealized
|
Fair
|
Unrealized
|
||||||||||||||||||
|
in thousands)
|
Value
|
Losses
|
Value
|
Losses
|
Value
|
Losses
|
||||||||||||||||||
|
Obligations of U.S. Government agencies
|
$ | 12,252 | $ | (67 | ) | $ | — | $ | — | $ | 12,252 | $ | (67 | ) | ||||||||||
|
Mortgage-backed securities
|
14,332 | (144 | ) | — | — | 14,332 | (144 | ) | ||||||||||||||||
|
Obligations of states and political subdivisions
|
1,502 | (7 | ) | 439 | (11 | ) | 1,941 | (18 | ) | |||||||||||||||
|
Corporate debt
|
1,058 | (2 | ) | — | — | 1,058 | (2 | ) | ||||||||||||||||
|
Total
|
$ | 29,144 | $ | (220 | ) | $ | 439 | $ | (11 | ) | $ | 29,583 | $ | (231 | ) | |||||||||
|
At December 31, 2008:
|
Total
|
< 12 Months
|
Total
|
12 Months or >
|
Total
|
Total
|
||||||||||||||||||
|
(Dollar amounts
|
Fair
|
Unrealized
|
Fair
|
Unrealized
|
Fair
|
Unrealized
|
||||||||||||||||||
|
in thousands)
|
Value
|
Losses
|
Value
|
Losses
|
Value
|
Losses
|
||||||||||||||||||
|
Obligations of states and political subdivisions
|
$ | 3,039 | $ | (53 | ) | $ | — | $ | — | $ | 3,039 | $ | (53 | ) | ||||||||||
|
Total
|
$ | 3,039 | $ | (53 | ) | $ | — | $ | 0 | $ | 3,039 | $ | (53 | ) | ||||||||||
|
At December 31, 2009, there were two securities in an unrealized loss position for greater than 12 consecutive months. These two securities continue to be of investment grade, and management believes their current market decline is an interest-related temporary valuation impairment caused by a lack of market for the affected issues. Management periodically evaluates each security in an unrealized loss position to determine if the impairment is temporary or other-than-temporary. Management has determined that no investment security is other-than-temporarily impaired at December 31, 2009. The unrealized losses are due solely to interest rate changes and the Company does not intend to sell and will not be required to sell the securities with impairments prior to the earliest of forecasted recovery or the maturity of the underlying investment security. During 2008, the Company wrote off $495,000 in other-than-temporarily impaired securities of Federal Home Loan Mortgage Corporation preferred stock.
|
|
|
The amortized cost and carrying value of debt securities as of December 31, 2009, by contractual maturity, are shown below. Expected maturities may differ from contractual maturities because borrowers may have the right to call or prepay obligations with or without call or prepayment penalties.
|
|
|
Amortized
|
Carrying
|
||||||
| (Dollar amounts in thousands) |
Cost
|
Value
|
||||||
|
Available-for-sale:
|
||||||||
|
Due in one year or less
|
$ | 9,133 | $ | 9,184 | ||||
|
Due after one through five years
|
57,676 | 58,584 | ||||||
|
Due after five years through ten years
|
5,963 | 6,087 | ||||||
|
Due after ten years
|
23,207 | 23,333 | ||||||
| $ | 95,979 | $ | 97,188 | |||||
74
FNB BANCORP AND SUBSIDIARY
Notes to Consolidated Financial Statements
December 31, 2009, 2008 and 2007
|
At December 31, 2009 and 2008, securities with an amortized cost of $87,854,000 and $91,456,000, and fair value of $88,791,000 and $93,635,000, respectively, were pledged as collateral for public deposits and for other purposes required by law.
|
|
|
As of December 31, 2009 and 2008, the Bank had investments in Federal Reserve Bank stock classified as other assets in the accompanying balance sheets of $1,602,000 and $702,000, respectively. These investments in Federal Reserve Bank stock are carried at cost, and evaluated periodically for impairment. As of December 31, 2009 and 2008, the Bank had investments in Federal Home Loan Bank stock classified as other assets in the accompanying balance sheets of $4,432,000 and $4,380,000, respectively. These investments in Federal Home Loan Bank stock are carried at cost, and periodically evaluated for impairment.
|
|
|
(4)
|
Loans
|
|
Loans are summarized as follows at December 31:
|
|
(Dollar amounts in thousands)
|
2009
|
2008
|
||||||
|
Real Estate
|
$ | 386,530 | $ | 353,011 | ||||
|
Construction
|
47,189 | 65,647 | ||||||
|
Commercial
|
67,977 | 83,442 | ||||||
|
Consumer
|
2,661 | 3,136 | ||||||
|
Gross loans
|
504,357 | 505,236 | ||||||
|
Net deferred loan fees
|
(179 | ) | (177 | ) | ||||
|
Allowance for loan losses
|
(9,829 | ) | (7,075 | ) | ||||
|
Net loans
|
$ | 494,349 | $ | 497,984 | ||||
|
The Bank had total impaired loans of $26,532,000 and $14,118,000 at December 31, 2009 and 2008, respectively. The allowance for loan losses related to the impaired loans was $2,875,000 and $678,000 as of December 31, 2009 and 2008, respectively. The amount of the recorded investment in impaired loans for which there is no related allowance is $11,918,000 and $2,558,000 as of December 31, 2009 and 2008. The average recorded investment in impaired loans during 2009, 2008 and 2007 was $20,338,000, $12,193,000 and $6,036,000, respectively. Nonaccrual loans totaled $25,592,000 and $14,102,000 as of December 31, 2009 and 2008. The single largest nonaccrual loan that was added in 2009 was for a multifamily residential loan that totaled $8,718,000 as of December 31, 2009. Subsequent to December 31, 2009, Bank management and the borrower have agreed to the following: the borrower agreed to make a substantial loan prepayment, the bank agreed to waive a significant amount of nonaccrual interest related to this loan, and a loan modification arrangement has been entered whereby the borrower has agreed to make payments according to the modified loan terms in 2010. If the borrower performs under the modified loan terms, this credit will be returned to accrual status in 2010. Interest income on impaired loans of $467,000, $64,000 and $69,000 was recognized for cash payments received in 2009, 2008, and 2007, respectively. The amount of interest on impaired loans not collected in 2009, 2008 and 2007, was $759,000, $692,000 and $547,000, respectively. The cumulative amount of unpaid interest on impaired loans was $806,000, $1,022,000 and $547,000 at December 31, 2009, 2008 and 2007, respectively. During 2009, Bank management was able to come to agreement regarding the restructure of twelve loans with borrowers that were having difficulties making their loan payments. Total loan principle of troubled debt restructurings during 2009 was $11,724,000, of which $3,536,000 was multifamily real estate loans, $3,219,000 was commercial real estate loans, $2,782,000 was single family residence loans, $1,962,000 was land loans, and $225,000 in commercial and industrial loans. The troubled debt restructurings were made at current market rates, with loan terms that allow the borrowers to make interest only payments, reduced principal reductions, or other modifications that helped these borrowers reduce their loan payments.
|
||
75
FNB BANCORP AND SUBSIDIARY
Notes to Consolidated Financial Statements
December 31, 2009, 2008 and 2007
|
(5)
|
Allowance for Loan Losses
|
|
|
Changes in the allowance for loan losses are summarized as follows for the years ended December 31:
|
||
|
(Dollar amounts in thousands)
|
2009
|
2008
|
2007
|
|||||||||
|
Balance, beginning of year
|
$ | 7,075 | $ | 5,638 | $ | 5,002 | ||||||
|
Loans charged off
|
(1,921 | ) | (1,788 | ) | (80 | ) | ||||||
|
Recoveries
|
79 | 180 | 26 | |||||||||
|
Net loans charged off
|
(1,842 | ) | (1,608 | ) | (54 | ) | ||||||
|
Provision for loan losses
|
4,596 | 3,045 | 690 | |||||||||
|
Balance, end of year
|
$ | 9,829 | $ | 7,075 | $ | 5,638 | ||||||
|
(6)
|
Related Party Transactions
|
|
In the ordinary course of business, the Bank made loans and advances under lines of credit to directors, officers, and their related interests. The Bank’s policies require that all such loans be made at substantially the same terms as those prevailing at the time for comparable transactions with unrelated parties and do not involve more than normal risk or unfavorable features. The following summarizes activities of loans to such parties in 2009 and 2008:
|
|
(Dollar amounts in thousands)
|
2009
|
2008
|
||||||
|
Balance, beginning of year
|
$ | 15,530 | $ | 10,374 | ||||
|
Additions
|
11,628 | 8,624 | ||||||
|
Repayments
|
10,622 | 3,468 | ||||||
|
Balance, end of year
|
$ | 16,536 | $ | 15,530 | ||||
|
(7)
|
Bank Premises, Equipment, and Leasehold Improvements
|
|
Bank premises, equipment and leasehold improvements are stated at cost, less accumulated depreciation and amortization, and are summarized as follows at December 31:
|
|
(Dollar amounts in thousands)
|
2009
|
2008
|
||||||
|
Buildings
|
$ | 9,134 | $ | 9,134 | ||||
|
Equipment
|
8,854 | 8,701 | ||||||
|
Leasehold improvements
|
1,152 | 1,043 | ||||||
| 19,140 | 18,878 | |||||||
|
Accumulated depreciation and amortization
|
(11,784 | ) | (10,266 | ) | ||||
| 7,356 | 8,612 | |||||||
|
Land
|
4,428 | 4,418 | ||||||
| $ | 11,784 | $ | 13,030 | |||||
76
FNB BANCORP AND SUBSIDIARY
Notes to Consolidated Financial Statements
December 31, 2009, 2008 and 2007
|
Depreciation and amortization expense for the years ended December 31, 2009, 2008, and 2007 was $1,554,000, $1,597,000 and $1,270,000, respectively.
|
|
|
(8)
|
Deposits
|
|
The aggregate amount of jumbo time certificates, each with a minimum denomination of $100,000 or more, was $79,662,000 and $90,176,000 at December 31, 2009 and 2008, respectively.
|
|
|
At December 31, 2009, the scheduled maturities of all time certificates of deposit are as follows:
|
|
(Dollar amounts in thousands)
|
||||
|
Year endind December 31:
|
||||
|
2010
|
$ | 115,538 | ||
|
2011
|
8,399 | |||
|
2012
|
3,329 | |||
|
2013
|
17 | |||
|
2014
|
3 | |||
|
After
|
37 | |||
| $ | 127,323 | |||
|
(9)
|
Federal Home Loan Bank Advances
|
|
As of December 31, 2009, Federal Home Loan Bank (“FHLB”) advances consisted of $20,000,000 in short-term advances due in one year or less, and $5,000,000 in long-term advances due in more than one year. The interest rate on total advances ranged from 1.84% to 4.62% at year end December 31, 2009. As of December 31, 2008, the short-term advances consisted of $81,100,000 due in one year or less, and in $5,000,000 in long-term advances due in more than one year. The interest rate on total advances ranged from 0.05% to 5.57% at year end December 31, 2008. Average FHLB advances were $49,857,000 and $73,777,000 in 2009 and 2008, respectively. Weighted average rates were 3.88% and 4.18% in 2009 and 2008, respectively. The maximum amount borrowed during 2009 and 2008 was $86,100,000 and $93,200,000, respectively.
|
|
|
At December 31, 2009, the Bank had a maximum borrowing capacity under Federal Home Loan Bank advances of $209,787,000, of which $184,012,000 was available. The Federal Home Loan Bank advances are secured by a blanket collateral agreement pledge of FHLB stock and certain other qualifying collateral, such as commercial and mortgage loans.
|
|
|
(10)
|
Commitments and Contingencies
|
|
The Bank leases a portion of its facilities and equipment under noncancelable operating leases expiring at various dates through 2013. Some of these leases provide that the Bank pay taxes, maintenance, insurance, and other occupancy expenses applicable to leased premises. Generally, the leases provide for renewal for various periods at stipulated rates.
|
77
FNB BANCORP AND SUBSIDIARY
Notes to Consolidated Financial Statements
December 31, 2009, 2008 and 2007
|
The minimum rental commitments under the operating leases as of December 31, 2009 are as follows:
|
|
(Dollars in thousands)
|
||||
|
Year ending December 31:
|
||||
|
2010
|
$ | 640 | ||
|
2011
|
536 | |||
|
2012
|
537 | |||
|
2013
|
353 | |||
|
2014
|
169 | |||
|
Thereafter
|
674 | |||
| $ | 2,909 | |||
|
Total rent expense for operating leases was $669,000, $630,000 and $591,000, in 2009, 2008, and 2007, respectively.
|
|
|
The Bank is engaged in various lawsuits either as plaintiff or defendant in the ordinary course of business and, in the opinion of management, based upon the advice of counsel, the ultimate outcome of these lawsuits will not have a material effect on the Bank’s financial statements.
|
|
|
(11)
|
Bank Savings Plan
|
|
The Bank maintains a salary deferral 401(k) plan covering substantially all employees, known as the FNB Bancorp Savings Plan (the “Plan”). The Plan allows employees to make contributions to the Plan up to a maximum allowed by law and the Bank’s contribution is discretionary. Beginning in 2008, the Board approved a safe harbor election related to the Plan which requires the Company to contribute 3% of qualifying employees wages as a profit sharing contribution. The Bank’s contribution to the Plan for the years ended December 31, 2009, 2008, and 2007 was $310,000, $400,000 and $600,000, respectively.
|
|
|
(12)
|
Salary Continuation and Deferred Compensation Plans
|
|
The Bank maintains a Salary Continuation Plan for certain Bank officers. Officers participating in the Salary Continuation Plan are entitled to receive a monthly payment for a period of fifteen to twenty years upon retirement. The Company accrues such post-retirement benefits over the individual’s employment period. The Salary Continuation Plan expense for the years ended December 31, 2009, 2008, and 2007 was $197,000, $238,000 and $181,000, respectively. Accrued compensation payable under the salary continuation plan totaled $1,616,000 and $1,833,000 at December 31, 2009 and 2008, respectively. The Deferred Compensation Plan allows eligible officers to defer annually their compensation up to a maximum 80% of their base salary and 100% of their cash bonus. The officer will be entitled to receive distribution upon reaching a specified age, passage of at least five years or termination of employment. As of December 31, 2009 and 2008, the related liability included in accrued expenses and other liabilities was $711,000 and $848,000, respectively.
|
78
FNB BANCORP AND SUBSIDIARY
Notes to Consolidated Financial Statements
December 31, 2009, 2008 and 2007
|
(13)
|
Preferred Stock
|
|
Preferred Stock was issued to the U. S. Treasury as part of the Treasury’s Capital Purchase Program. The Preferred Stock consists of two issues, Series A and Series B. The Series A and Series B Preferred Stock are both carried at liquidation value less discounts received plus premiums paid that are amortized over the expected timeframe that the Preferred Shares will be outstanding using the level yield method. The Series A and Series B Preferred Stock must be redeemed after ten years. The Series A Preferred Stock carries a dividend yield of 5% for the first five years. Beginning in year six, the dividend increases to 9% and continues at this rate until repaid. The Series B Preferred Stock pays a 9% dividend until repaid. Allocation of proceeds between the two issues was done in such a manner that the blended level yield of both issues would be 6.83% to the expected repayment date, which is currently anticipated to be three years from the date of issue. Operating restrictions related to the preferred stock are documented on the U. S. Department of the Treasury’s website and include restrictions on dividend payments and executive compensation, the establishment of the requirement that the Preferred Stock be repaid first with the proceeds from any future capital offering before any other use of the proceeds is allowed, establishment of additional reporting requirements related to lending activity of the Bank during the time the Preferred Stock is outstanding, and the execution of documents that allow the U. S. Department of the Treasury to add or change the conditions related to the issuance of the Preferred Stock unilaterally, at their discretion.
|
|
|
(14)
|
Income Taxes
|
|
The provision (benefit) for income taxes for the years ended December 31, consists of the following:
|
|
(Dollar amounts in thousands)
|
2009
|
2008
|
2007
|
|||||||||
|
Current:
|
||||||||||||
|
Federal
|
$ | 828 | $ | 750 | $ | 1,961 | ||||||
|
State
|
764 | 331 | 727 | |||||||||
| $ | 1,592 | $ | 1,081 | $ | 2,688 | |||||||
|
Deferred:
|
||||||||||||
|
Federal
|
$ | (1,775 | ) | $ | (352 | ) | $ | (252 | ) | |||
|
State
|
(398 | ) | (118 | ) | (54 | ) | ||||||
| (2,173 | ) | (470 | ) | (306 | ) | |||||||
| $ | (581 | ) | $ | 611 | $ | 2,382 | ||||||
79
FNB BANCORP AND SUBSIDIARY
Notes to Consolidated Financial Statements
December 31, 2009, 2008 and 2007
|
The reason for the differences between the statutory federal income tax rate and the effective tax rates for the years ending December 31, are summarized as follows:
|
|
2009
|
2008
|
2007
|
||||||||||
|
Statutory rates
|
34.0 | % | 34.0 | % | 34.0 | % | ||||||
|
Increase (decrease) resulting from:
|
||||||||||||
|
Tax exempt Income for federal purposes
|
(5,201.1 | %) | (19.1 | %) | (6.8 | %) | ||||||
|
State taxes on income, net of federal benefit
|
2,051.1 | % | 3.3 | % | 4.9 | % | ||||||
|
Benefits from low income housing credits
|
(1,505.8 | %) | (2.7 | %) | (4.8 | %) | ||||||
|
Other, net
|
(309.6 | %) | (2.2 | %) | (1.0 | %) | ||||||
|
Effective tax rate
|
(4,931.4 | %) | 13.3 | % | 26.3 | % | ||||||
|
The tax effect of temporary differences giving rise to the Bank’s net deferred tax asset is as follows:
|
|
December 31,
|
||||||||
|
(Dollar amounts in thousands)
|
2009
|
2008
|
||||||
|
Deferred tax assets
|
||||||||
|
Allowance for loan losses
|
$ | 4,397 | $ | 3,162 | ||||
|
Accrued salaries and officers compensation
|
1,341 | 1,390 | ||||||
|
Capitalized interest on buildings
|
20 | 23 | ||||||
|
Expenses accrued on books, not yet deductible in tax return
|
1,745 | 803 | ||||||
|
Depreciation
|
565 | 448 | ||||||
|
Net operating loss carryforward
|
727 | 887 | ||||||
|
Tax credit carryforwards
|
632 | 429 | ||||||
| 9,427 | 7,142 | |||||||
|
Less: deferred tax asset valuation allowance
|
(632 | ) | (368 | ) | ||||
| 8,795 | 6,774 | |||||||
|
Deferred tax liabilities
|
||||||||
|
Unrealized appreciation on available-for-sale securities
|
$ | 497 | $ | 950 | ||||
|
State income taxes
|
507 | 478 | ||||||
|
Core deposit intangible
|
185 | 269 | ||||||
|
Income reflected on books, not on tax return
|
— | 93 | ||||||
|
Expenses and credits deducted on tax return, not books
|
5 | 8 | ||||||
|
Total deferred tax liabilities
|
1,194 | 1,798 | ||||||
|
Net deferred tax asset (included in other assets)
|
$ | 7,601 | $ | 4,976 | ||||
|
As of December 31, 2009, the Bank had no state tax credit carryforwards for income tax purposes and there was no valuation allowance related to these credits as of December 31, 2009 or 2008. Additionally, management believes that it is more likely than not that the deferred tax assets will be realized through recovery of taxes previously paid and/or future taxable income, with the exception of a portion of low income housing credit carryforwards. The Bank has federal net operating loss carryforwards resulting from the acquisition of Sequoia National Bank which expire from December 31, 2011 through December 31, 2020, for a total balance of $2,140,000 as of December 31, 2009. These losses are limited to approximately $469,000 per year under IRS regulations.
|
80
FNB BANCORP AND SUBSIDIARY
Notes to Consolidated Financial Statements
December 31, 2009, 2008 and 2007
|
In assessing the Company’s ability to realize the tax benefits of deferred tax assets, management considers whether it is more likely than not that some portion or all of the deferred tax assets will be realized. The ultimate realization of deferred tax assets is dependent upon the generation of future taxable income during the periods in which those temporary differences become deductible. Management considers the scheduled reversal of deferred tax liabilities, projected future taxable income, and tax planning strategies in making this assessment. Based upon the level of historical taxable income and projections for future taxable income over the periods which the deferred tax assets are deductible, management believes it is more likely than not that the Company will realize the recorded benefits of these deductible differences, with the possible exception of our low income housing tax credit carryforwards. The Company owns investments in low income housing tax credit (“LIHTC”) that had a book value of $4,797,000 as of December 31, 2009. LIHTC investments are expected to have a fifteen year life and a residual value of $0. The LIHTC investments are expected to generate operating losses of $4,797,000 and federal tax credits of $1,112,000 over the next eleven years, These tax benefits have value to the Company only to the extent that they offset income taxes created from otherwise taxable earnings generated by the Company. In the opinion of management, a valuation allowance of $632,000 and $368,000 was necessary as of December 31, 2009 and 2008, respectively. The valuation allowance is equivalent to 100% of the low income housing credit carryforwards that existed as of December 31, 2009 and 2008.
|
|
|
|
|
|
(15)
|
Financial Instruments
|
|
The Bank is a party to financial instruments with off-balance-sheet risk in the normal course of business. These financial instruments include commitments to extend credit in the form of loans or through standby letters of credit. These instruments involve, to varying degrees, elements of credit and interest-rate risk in excess of the amount recognized in the balance sheet. The Bank’s exposure to credit loss is represented by the contractual amount of those instruments and is usually limited to amounts funded or drawn. The contract or notional amounts of these agreements, which are not included in the balance sheets, are an indicator of the Bank’s credit exposure. Commitments to extend credit generally carry variable interest rates and are subject to the same credit standards used in the lending process for on-balance-sheet instruments. Additionally, the Bank periodically reassesses the customer’s creditworthiness through ongoing credit reviews. The Bank generally requires collateral or other security to support commitments to extend credit. The following table provides summary information on financial institutions whose contract amounts represent credit risk as of December 31:
|
|
|
December 31
|
|||||||
| (Dollars amounts in thousands) |
2009
|
2008
|
||||||
|
Financial instruments whose contract amounts represent credit risk:
|
||||||||
|
Undisbursed loan commitments
|
$ | 26,064 | $ | 35,403 | ||||
|
Lines of credit
|
57,832 | 73,735 | ||||||
|
Mastercard/Visa lines
|
4,260 | 3,940 | ||||||
|
Standby letters of credit
|
2,092 | 2,743 | ||||||
| $ | 90,248 | $ | 115,821 | |||||
81
FNB BANCORP AND SUBSIDIARY
Notes to Consolidated Financial Statements
December 31, 2009, 2008 and 2007
|
Commitments to extend credit are agreements to lend to a customer as long as there is no violation of any condition established in the contract. Commitments generally have fixed expiration dates or other termination clauses and may require payment of a fee. Since many of the commitments are expected to expire without being drawn upon, the total commitment amounts do not necessarily represent future cash requirements. The Bank evaluates each customer’s creditworthiness on a case-by-case basis, following normal lending policies. The amount of collateral obtained, if deemed necessary by the Bank upon extension of credit, is based on management’s credit evaluation. Collateral held varies but may include accounts receivable, inventory, property, plant and equipment, and income-producing commercial and residential properties. Equity reserves and unused credit card lines are additional commitments to extend credit. Many of these customers are not expected to draw down their total lines of credit, and therefore, the total contract amount of these lines does not necessarily represent future cash requirements.
|
||
| Standby letters of credit are conditional commitments issued by the Bank to guarantee the performance of a customer to a third party. The credit risk involved in issuing letters of credit is essentially the same as that involved in extending loan facilities to customers. The Bank issues both financial and performance standby letters of credit. The financial standby letters of credit are primarily to guarantee payment to third parties. As of December 31, 2009, there were $1,928,000 issued in financial standby letters of credit. The performance standby letters of credit are typically issued to municipalities as specific performance bonds. As of December 31, 2009 there were $164,000 issued in performance standby letters of credit. The terms of the guarantees will expire in 2010. The Bank has experienced no draws on these letters of credit, and does not expect to in the future; however, should a triggering event occur, the Bank either has collateral in excess of the letters of credit or embedded agreements of recourse from the customer. | ||
|
Fair Values of Financial Instruments.
|
||
|
The following methods and assumptions were used by the Company in estimating the fair value disclosures for financial instruments:
|
||
| Cash and Cash Equivalents. | ||
|
The carrying amounts reported in the balance sheet for cash and short-term instruments are a reasonable estimate of fair value, which will approximate their historical cost.
|
||
82
FNB BANCORP AND SUBSIDIARY
Notes to Consolidated Financial Statements
December 31, 2009, 2008 and 2007
|
Securities Available-for-Sale.
|
||
|
Fair values for investment securities are based on quoted market prices, where available. If quoted market prices are not available, fair values are based on quoted market prices of comparable instruments.
|
||
|
Loans Receivable.
|
||
|
For variable-rate loans that reprice frequently and with no significant change in credit risk, fair values are based on carrying values. For fixed rate loans, fair values are based on discounted cash flows.
|
||
|
Bank Owned Life Insurance.
|
||
|
The fair value of bank owned life insurance is the cash surrender value of the policies.
|
||
|
Deposit liabilities.
|
||
|
The fair values disclosed for demand deposits (e.g., interest and non-interest checking, savings, and money market accounts) are, by definition, equal to the amount payable on demand at reporting date (i.e., their carrying amounts). The fair values for fixed-rate certificates of deposit are based on discounted cash flows.
|
||
|
Federal Home Loan Bank Advances.
|
||
|
The fair values of Federal Home Loan Bank Advances were based on discounted cash flows.
|
||
|
Undisbursed loan commitments, lines of credit, Mastercard line and standby letters of credit.
|
||
|
The fair value of these off-balance sheet items are based on discounted cash flows of expected fundings.
|
||
83
FNB BANCORP AND SUBSIDIARY
Notes to Consolidated Financial Statements
December 31, 2009, 2008 and 2007
|
The following table provides summary information on the estimated fair value of financial instruments at December 31, 2009:
|
||
|
|
Carrying
|
Fair
|
||||||
|
(Dollar amounts in thousands)
|
amount
|
value
|
||||||
|
Financial assets:
|
||||||||
|
Cash and cash equivalents
|
$ | 62,853 | $ | 62,853 | ||||
|
Securities available for sale
|
97,188 | 97,188 | ||||||
|
Loans, net
|
494,349 | 515,553 | ||||||
|
Bank owned life insurance
|
8,866 | 8,866 | ||||||
|
Financial liabilities:
|
||||||||
|
Deposits
|
598,964 | 599,619 | ||||||
|
Federal Home Loan Bank advances
|
25,000 | 25,295 | ||||||
|
Off-balance-sheet liabilities:
|
||||||||
|
Undisbursed loan commitments, lines of credit, Mastercard line and standby letters of credit
|
— | 3,384 | ||||||
|
The following table provides summary information on the estimated fair value of financial instruments at December 31, 2008:
|
|
Carrying
|
Fair
|
|||||||
|
(Dollar amounts in thousands)
|
amount
|
value
|
||||||
|
Financial assets:
|
||||||||
|
Cash and cash equivalents
|
$ | 14,865 | $ | 14,865 | ||||
|
Securities available for sale
|
99,221 | 99,221 | ||||||
|
Loans, net
|
497,984 | 533,277 | ||||||
|
Bank owned life insurance
|
10,781 | 10,781 | ||||||
|
Financial liabilities:
|
||||||||
|
Deposits
|
500,910 | 501,436 | ||||||
|
Federal Home Loan Bank advances
|
86,100 | 86,753 | ||||||
|
Off-balance-sheet liabilities:
|
||||||||
|
Undisbursed loan commitments, lines of credit, Mastercard line and standby letters of credit
|
— | 4,343 | ||||||
|
The carrying amounts of loans include $25,592,000 and $14,102,000 of nonaccrual loans (loans that are not accruing interest) at December 31, 2009 and 2008, respectively. Management has determined that primarily because of the uncertainty of predicting an observable market interest rateand lack of a liquid market for nonperforming credits, excessive amounts of time and money would be incurred to estimate the fair values of nonperforming loans. As such, these loans are recorded at their carrying amount in the estimated fair value columns.
|
84
FNB BANCORP AND SUBSIDIARY
Notes to Consolidated Financial Statements
December 31, 2009, 2008 and 2007
|
The following aggregate information is provided at December 31, about the contractual provisions of these loans:
|
|
(Dollars amounts in thousands)
|
2009
|
2008
|
||||||
|
Aggregate carrying amount
|
$ | 25,592 | $ | 14,102 | ||||
|
Effective rate
|
6.07 | % | 7.60 | % | ||||
|
Average term to maturity
|
63 months
|
10 months
|
||||||
|
(16)
|
Significant Group Concentrations of Credit Risk
|
|
Most of the Bank’s business activity is with customers located within San Mateo and San Francisco counties. Generally, loans are secured by assets of the borrowers. Loans are expected to be repaid from cash flows or proceeds from the sale of selected assets of the borrowers. The Bank does not have significant concentrations of loans to any one industry, but does have loan concentrations in commercial real estate loans that are considered high by regulatory standards. The Bank has mitigated this concentration to a large extent by utilizing underwriting standards that are more conservative than regulatory guidelines, and performing stress testing on this segment of the portfolio to insure that the commercial real estate loan portfolio will perform within management expectations given an additional downturn in commercial lease rates and commercial real estate valuations. The distribution of commitments to extend credit approximates the distribution of loans outstanding. Commercial and standby letters of credit were granted primarily to commercial borrowers. The contractual amounts of credit-related financial instruments such as commitments to extend credit, credit-card arrangements, and letters of credit represent the amounts of potential accounting loss should the contract be fully drawn upon, the customer default, and the value of any existing collateral become worthless.
|
|
|
(17)
|
Regulatory matters
|
|
The Company, as a bank holding company, is subject to regulation by the Board of Governors of the Federal Reserve System under the Bank Holding Company Act of 1956, as amended. The Bank is subject to various regulatory capital requirements administered by the federal banking agencies. Failure to meet minimum capital requirements can initiate certain mandatory and possibly additional discretionary actions by regulators that, if undertaken, could have a direct material effect on the Company’s financial statements.
|
|
|
Under capital adequacy guidelines and the regulatory framework for prompt corrective action, the Company and the Bank must meet specific capital guidelines that involve quantitative measures of the Company’s and the Bank’s assets, liabilities and certain off balance-sheet items as calculated under regulatory accounting practices.
|
|
|
The capital amounts and classification are also subject to qualitative judgments by the regulators about asset groupings, risk weightings and other factors. Quantitative measures established by regulation to ensure capital adequacy require the Company and the Bank to maintain minimum amounts and ratios (set forth in the table below) of total and Tier 1 capital (as defined in the regulations) to risk-weighted assets (as defined), and of Tier 1 capital (as defined) to average assets (as defined). Management believes, as of December 31, 2009, that the Company and the Bank have met all regulatory capital requirements.
|
|
|
As of December 31, 2009, the most recent notification from the regulatory agencies categorized the Bank as well capitalized under the regulatory framework for prompt corrective action. To be categorized as well capitalized the Bank must maintain minimum total risk-based, Tier 1 risk-based, and Tier 1 leverage ratios as set forth in the table. There are no conditions or events since that notification that management believes have changed the Bank’s categories.
|
85
FNB BANCORP AND SUBSIDIARY
Notes to Consolidated Financial Statements
December 31, 2009, 2008 and 2007
|
The consolidated actual capital amounts and ratios of the Company and the Bank are also presented in the following table:
|
|
To be well
|
||||||||||||||||||
|
For capital
|
capitalized under
|
|||||||||||||||||
|
adequacy
|
prompt corrective
|
|||||||||||||||||
|
(Dollar amounts in thousands)
|
Actual
|
purposes
|
action provisions
|
|||||||||||||||
|
Amount
|
Ratio
|
Amount
|
Ratio
|
Amount
|
Ratio
|
|||||||||||||
|
December 31, 2009:
|
||||||||||||||||||
|
Total risk-based capital (to risk weighted assets)
|
||||||||||||||||||
|
Consolidated Company
|
$ | 83,206 | 14.29 | % |
46,581
|
≥ | 8.00 | % |
58,228
|
≥ | n/a | |||||||
|
Bank
|
$ | 82,917 | 14.24 | % |
46,583
|
≥ | 8.00 | % |
58,228
|
≥ | 10.00 | % | ||||||
|
Tier 1 capital (to risk weighted assets)
|
||||||||||||||||||
|
Consolidated Company
|
$ | 75,897 | 13.04 | % |
23,281
|
≥ | 4.00 | % |
34,923
|
≥ | n/a | |||||||
|
Bank
|
$ | 75,608 | 12.99 | % |
23,282
|
≥ | 4.00 | % |
34,923
|
≥ | 6.00 | % | ||||||
|
Tier 1 leverage capital (to total average assets)
|
||||||||||||||||||
|
Consolidated Company
|
$ | 75,897 | 10.77 | % |
28,188
|
≥ | 4.00 | % |
35,232
|
≥ | n/a | |||||||
|
Bank
|
$ | 75,608 | 10.73 | % |
28,186
|
≥ | 4.00 | % |
35,232
|
≥ | 5.00 | % | ||||||
|
To be well
|
||||||||||||||||||
|
For capital
|
capitalized under
|
|||||||||||||||||
|
adequacy
|
prompt corrective
|
|||||||||||||||||
|
(Dollar amounts in thousands)
|
Actual
|
purposes
|
action provisions
|
|||||||||||||||
|
Amount
|
Ratio
|
Amount
|
Ratio
|
Amount
|
Ratio
|
|||||||||||||
|
December 31, 2008:
|
||||||||||||||||||
|
Total risk-based capital (to risk weighted assets)
|
||||||||||||||||||
|
Consolidated Company
|
$ | 71,531 | 11.86 | % |
48,250
|
≥ | 8.00 | % |
60,308
|
≥ | n/a | |||||||
|
Bank
|
$ | 71,405 | 11.84 | % |
48,247
|
≥ | 8.00 | % |
60,308
|
≥ | 10.00 | % | ||||||
|
Tier 1 capital (to risk weighted assets)
|
||||||||||||||||||
|
Consolidated Company
|
$ | 64,346 | 10.67 | % |
24,122
|
≥ | 4.00 | % |
36,180
|
≥ | n/a | |||||||
|
Bank
|
$ | 64,220 | 10.65 | % |
24,120
|
≥ | 4.00 | % |
36,180
|
≥ | 6.00 | % | ||||||
|
Tier 1 leverage capital (to total average assets)
|
||||||||||||||||||
|
Consolidated Company
|
$ | 64,346 | 9.70 | % |
26,534
|
≥ | 4.00 | % |
33,171
|
≥ | n/a | |||||||
|
Bank
|
$ | 64,220 | 9.68 | % |
26,537
|
≥ | 4.00 | % |
33,171
|
≥ | 5.00 | % | ||||||
86
FNB BANCORP AND SUBSIDIARY
Notes to Consolidated Financial Statements
December 31, 2009, 2008 and 2007
|
(18)
|
Stock Option Plans
|
|
In 1997, the Company adopted an incentive employee stock option plan, known as the 1997 FNB Bancorp Plan. In 2002, the Company adopted an incentive employee stock option plan known as the 2002 FNB Bancorp Plan. In 2008, the Company adopted an incentive employee stock option plan known as the 2008 FNB Bancorp Stock Option Plan. The Plans allow the Company as of December 31, 2009 to grant options to employees covering 318,687 shares.
|
|
|
Incentive stock options currently outstanding become exercisable in one to five years from the grant date, based on a vesting schedule of 20% per year and expire 10 years after the grant date. Nonqualified options to directors become vested on the date of grant. The options exercise price is the fair value of the per share price of the underlying stock options at the grant date.
|
|
|
The amount of compensation expense for options recorded in the years ended December 31, 2009, December 31, 2008, and December 31 2007 was $157,000, $171,000 and $68,000, respectively. The income tax benefit related to stock option exercises was $0 for 2009, $14,000 for 2008 and $3,000 for 2007.
|
|
|
There were no options exercised during the year ended December 31, 2009.
|
|
|
The amount of total unrecognized compensation expense related to non-vested options at December 31, 2009 was $591,000, and the weighted average period it will be amortized over is 2.6 years.
|
|
|
The fair value of each option granted is estimated on the date of grant using the fair value method with the following weighted average assumptions used for grantsin 2009; dividend yield of 2.68% for the year; risk-free interest rate of 3.20%; expected volatility of 60.59%; expected life of 8.8 years; resulting in a weighted average fair value of $3.77 per share. The assumptions for grants in 2008; dividend yield of 4.86% for the year; risk-free interest rate of 3.51%; expected volatility of 50.92%; expected life of 8.8 years; resulting in a weighted average fair value of $4.22 per share. The assumptions for grants in 2007; dividend yield of 1.97% for the year; risk-free interest rate of 5.11%; expected volatility of 11.32%; expected life of 6.4 years; resulting in a weighted average fair value of $5.82 per share.
|
|
|
A summary of option activity under the 2008 FNB Bancorp Plan as of December 31, 2009 and changes during the year then ended is presented below.
|
87
FNB BANCORP AND SUBSIDIARY
Notes to Consolidated Financial Statements
December 31, 2009, 2008 and 2007
|
Weighted-
|
|||||||||||||
|
Average
|
|||||||||||||
|
2008 FNB Bancorp Plan
|
Weighted
|
Remaining
|
Aggregate
|
||||||||||
|
Average
|
Contractual
|
Intrinsic
|
|||||||||||
|
Exercise
|
Term
|
Value
|
|||||||||||
|
Options
|
Shares
|
Price
|
(in years)
|
(000) | |||||||||
|
Outstanding at January 1, 2009
|
64,699 | $ | 11.20 | ||||||||||
|
Granted
|
87,145 | $ | 7.46 | ||||||||||
|
Exercised
|
— | $ | 0.00 | ||||||||||
|
Forfeited or expired
|
(2,354 | ) | $ | 11.20 | |||||||||
|
Outstanding at December 31, 2009
|
149,490 | $ | 9.02 |
9.5
|
$ | 33,115 | |||||||
|
Exercisable at December 31, 2009
|
30,421 | $ | 9.97 |
9.1
|
$ | 3,800 | |||||||
|
The following supplemental information applies to the three years ended December 31:
|
|
2008 FNB Bancorp Plan
|
|||||||
|
2009
|
2008
|
2007
|
|||||
|
Options outstanding
|
149,490 | 64,699 | n/a | ||||
|
Range of exercise prices
|
$7.46-$11.20 | $11.20-$11.20 | n/a | ||||
|
Weighted average remaining contractual life
|
9.5 | 9.7 | n/a | ||||
|
Fully vested options
|
30,421 | 9,925 | n/a | ||||
|
Weighted average exercise price
|
$9.97 | $11.20 | n/a | ||||
|
Aggregate intrinsic value
|
$3,800 | $0 | |||||
|
Weighted average remaining contractual life (in years)
|
9.1 | 9.7 | n/a |
|
A summary of option activity under the 2002 FNB Bancorp Plan as of December 31, 2009 and changes during the year then ended is presented below.
|
|
Weighted-
|
|||||||||||||
|
Average
|
|||||||||||||
|
2002 FNB Bancorp Plan
|
Weighted
|
Remaining
|
Aggregate
|
||||||||||
|
Average
|
Contractual
|
Intrinsic
|
|||||||||||
|
Exercise
|
Term
|
Value
|
|||||||||||
|
Options
|
Shares
|
Price
|
(in years)
|
(000) | |||||||||
|
Outstanding at January 1, 2009
|
230,724 | $ | 23.68 | ||||||||||
|
Granted
|
— | $ | 0.00 | ||||||||||
|
Exercised
|
— | $ | 0.00 | ||||||||||
|
Forfeited or expired
|
(9,461 | ) | $ | 24.71 | |||||||||
|
Outstanding at December 31, 2009
|
221,263 | $ | 23.63 |
5.0
|
$ | 0 | |||||||
|
Exercisable at December 31, 2009
|
182,445 | $ | 22.86 |
4.7
|
$ | 0 | |||||||
88
FNB BANCORP AND SUBSIDIARY
Notes to Consolidated Financial Statements
December 31, 2009, 2008 and 2007
The following supplemental information applies to the three years ended December 31:
|
2002 FNB Bancorp Plan
|
||||||
|
2009
|
|
2008
|
|
2007
|
||
|
Options outstanding
|
221,263
|
230,724
|
235,384
|
|||
|
Range of exercise prices
|
$17.77-$29.82
|
$17.77-$29.82
|
$17.77-$29.82
|
|||
|
Weighted average remaining contractual life
|
5.0
|
6.0
|
7.1
|
|||
|
Fully vested options
|
182,445
|
160,566
|
122,358
|
|||
|
Weighted average exercise price
|
$22.86
|
$22.34
|
$21.72
|
|||
|
Aggregate intrinsic value
|
$0
|
$0
|
$519,635
|
|||
|
Weighted average remaining contractual life (in years)
|
4.7
|
5.4
|
6.2
|
|||
A summary of option activity under the 1997 FNB Bancorp Plan as of December 31, 2009, and changes during the year then ended is presented below.
|
Weighted-
|
|||||||||||||
|
Average
|
|||||||||||||
|
1997 First National Bank Plan
|
Weighted
|
Remaining
|
Aggregate
|
||||||||||
|
Average
|
Contractual
|
Intrinsic
|
|||||||||||
|
Exercise
|
Term
|
Value
|
|||||||||||
|
Options
|
Shares
|
Price
|
(in years)
|
(000) | |||||||||
|
Outstanding at January 1, 2009
|
69,439 | $ | 19.65 | ||||||||||
|
Granted
|
—
|
$ | 0.00 | ||||||||||
|
Exercised
|
—
|
$ | 0.00 | ||||||||||
|
Forfeited or expired
|
(10,158 | ) | $ | 16.30 | |||||||||
|
Outstanding at December 31, 2009
|
59,281 | $ | 20.22 |
3.7
|
$ | 0 | |||||||
|
Exercisable at December 31, 2009
|
44,414 | $ | 18.17 |
2.5
|
$ | 0 | |||||||
89
FNB BANCORP AND SUBSIDIARY
Notes to Consolidated Financial Statements
December 31, 2009, 2008 and 2007
The following supplemental information applies to the three years ended December 31:
|
1997 FNB Bancorp Plan
|
|||||
|
2009
|
|
2008
|
|
2007
|
|
|
Options outstanding
|
59,281
|
69,439
|
81,656
|
||
|
Range of exercise prices
|
$15.43-$26.35 |
$15.43-$26.35
|
$15.43-$26.35
|
||
|
Weighted average remaining contractual life
|
3.7
|
4.1
|
4.4
|
||
|
Fully vested options
|
44,414
|
49,617
|
56,882
|
||
|
Weighted average exercise price
|
$18.17
|
$16.97
|
$16.29
|
||
|
Aggregate intrinsic value
|
$0
|
$0
|
$523,639
|
||
|
Weighted average remaining contractual life (in years)
|
2.5
|
2.4
|
2.2
|
90
FNB BANCORP AND SUBSIDIARY
Notes to Consolidated Financial Statements
December 31, 2009, 2008 and 2007
(19) Quarterly Data (Unaudited)
|
(Dollars in thousands)
|
First
|
Second
|
Third
|
Fourth
|
||||||||||||
|
2009
|
||||||||||||||||
|
Interest income
|
$ | 8,911 | $ | 8,643 | $ | 9,283 | $ | 8,980 | ||||||||
|
Interest expense
|
2,319 | 2,362 | 2,293 | 2,037 | ||||||||||||
|
Net interest income
|
6,592 | 6,281 | 6,990 | 6,943 | ||||||||||||
|
Provision for loan losses
|
2,140 | 760 | 796 | 900 | ||||||||||||
|
Net interest income, after provision for loan losses
|
4,452 | 5,521 | 6,194 | 6,043 | ||||||||||||
|
Non-interest income
|
1,349 | 1,245 | 1,672 | 1,111 | ||||||||||||
|
Non-interest expense
|
7,420 | 6,758 | 6,427 | 6,970 | ||||||||||||
|
(Loss) income before income taxes
|
(1,619 | ) | 8 | 1,439 | 184 | |||||||||||
|
(Benefit) provision for income taxes
|
(430 | ) | 4 | 176 | (331 | ) | ||||||||||
|
Net (loss) earnings
|
(1,189 | ) | 4 | 1,263 | 515 | |||||||||||
|
Dividends and discount accretion on preferred stock
|
16 | 189 | 214 | 213 | ||||||||||||
|
Net (loss) earnings available to common shareholders
|
$ | (1,205 | ) | $ | (185 | ) | $ | 1,049 | $ | 302 | ||||||
|
Basic (loss) earnings per share
|
$ | (0.38 | ) | $ | (0.06 | ) | $ | 0.33 | $ | 0.09 | ||||||
|
Diluted earnings per share
|
$ | (0.38 | ) | $ | (0.06 | ) | $ | 0.33 | $ | 0.09 | ||||||
|
(Dollars in thousands)
|
First
|
Second
|
Third
|
Fourth
|
||||||||||||
|
2008:
|
||||||||||||||||
|
Interest income
|
$ | 10,371 | $ | 9,657 | $ | 9,787 | $ | 9,612 | ||||||||
|
Interest expense
|
3,322 | 2,841 | 2,725 | 2,619 | ||||||||||||
|
Net interest income
|
7,049 | 6,816 | 7,062 | 6,993 | ||||||||||||
|
Provision for loan losses
|
990 | 300 | 300 | 1,455 | ||||||||||||
|
Net interest income, after provision for loan losses
|
6,059 | 6,516 | 6,762 | 5,538 | ||||||||||||
|
Non-interest income
|
1,261 | 1,137 | 769 | 1,876 | ||||||||||||
|
Non-interest expense
|
6,177 | 6,286 | 6,481 | 6,400 | ||||||||||||
|
Income before income taxes
|
1,143 | 1,367 | 1,050 | 1,014 | ||||||||||||
|
Provision for income taxes
|
256 | 277 | 3 | 75 | ||||||||||||
|
Net earnings
|
$ | 887 | $ | 1,090 | $ | 1,047 | $ | 939 | ||||||||
|
Basic earnings per share
|
$ | 0.27 | $ | 0.33 | $ | 0.33 | $ | 0.29 | ||||||||
|
Diluted earnings per share
|
$ | 0.27 | $ | 0.33 | $ | 0.33 | $ | 0.29 | ||||||||
There may be rounding differences between the sum of the four quarters presented and the annual amounts used throughout the annual report.
91
FNB BANCORP AND SUBSIDIARY
Notes to Consolidated Financial Statements
December 31, 2009, 2008 and 2007
(20) Condensed Financial Information of Parent Company
The parent company-only condensed balance sheets, condensed statements of income, and condensed statements of cash flows information are presented as of and for the year ended December 31, as of and for the year ended December 31, as follows:
|
FNB Bancorp
|
Condensed balance sheets
|
|||||||
|
(Dollars in thousands)
|
2009
|
2008
|
||||||
|
Assets:
|
||||||||
|
Cash and due from banks
|
$ | 67 | $ | 56 | ||||
|
Investments in subsidiary
|
78,576 | 68,023 | ||||||
|
Income tax receivable from subsidiary
|
4 | 2 | ||||||
|
Dividend receivable from subsidiary
|
159 | 455 | ||||||
|
Options expense receivable from subsidiary
|
215 |
—
|
||||||
|
Other assets
|
19 | 79 | ||||||
|
Total assets
|
$ | 79,040 | $ | 68,615 | ||||
|
Liabilities:
|
||||||||
|
Dividend declared
|
$ | 159 | $ | 455 | ||||
|
Other liabilities
|
16 | 11 | ||||||
|
Total liabilities
|
175 | 466 | ||||||
|
Stockholders’equity
|
78,865 | 68,149 | ||||||
|
Total liabilities and stockholders’ equity
|
$ | 79,040 | $ | 68,615 | ||||
|
FNB Bancorp
|
Condensed statements of income
|
|||||||||||
|
(Dollars in thousands)
|
2009
|
2008
|
2007
|
|||||||||
|
Income:
|
||||||||||||
|
Dividends from subsidiary
|
$ | 1,385 | $ | 3,473 | $ | 2,636 | ||||||
|
Other income
|
13 |
—
|
—
|
|||||||||
|
Total income
|
1,398 | 3,473 | 2,636 | |||||||||
|
Expense:
|
||||||||||||
|
Other expense
|
1 | 129 | 72 | |||||||||
|
Total expense
|
1 | 129 | 72 | |||||||||
|
Income before income taxes and equity in undistributed earnings of subsidiary
|
1,397 | 3,344 | 2,564 | |||||||||
|
Income tax expense (benefit)
|
6 | (14 | ) | (4 | ) | |||||||
|
Income before equity in undistributed earnings of subsidiary
|
1,391 | 3,358 | 2,568 | |||||||||
|
Equity in undistributed earnings of subsidiary
|
(798 | ) | 605 | 4,111 | ||||||||
|
Net earnings
|
593 | 3,963 | 6,679 | |||||||||
|
Dividends and discount accretion on preferred stock
|
632 |
—
|
—
|
|||||||||
|
Net earnings available to common shareholders
|
$ | (39 | ) | $ | 3,963 | $ | 6,679 | |||||
92
FNB BANCORP AND SUBSIDIARY
Notes to Consolidated Financial Statements
December 31, 2009, 2008 and 2007
|
FNB Bancorp
|
Condensed statement of cash flows
|
|||||||||||
|
(Dollars in thousands)
|
2009
|
2008
|
2007
|
|||||||||
|
Net earnings
|
$ | 593 | $ | 3,963 | $ | 6,679 | ||||||
|
Income tax receivable from subsidiary
|
(2 | ) | 15 | 66 | ||||||||
|
Options expense receivable from subsidiary
|
(215 | ) |
—
|
—
|
||||||||
|
Capital purchase program funds received
|
12,000 |
—
|
—
|
|||||||||
|
Capital purchase program funds invested in subsidiary
|
(12,000 | ) |
—
|
—
|
||||||||
|
Change in other assets
|
60 | (69 | ) | (8 | ) | |||||||
|
Change in other liabilities
|
5 | 1 | 10 | |||||||||
|
Undistributed earnings of subsidiary
|
798 | (605 | ) | (4,111 | ) | |||||||
|
Stock-based compensation expense
|
157 | 171 | 68 | |||||||||
|
Cash flows from operating activities
|
1,396 | 3,476 | 2,704 | |||||||||
|
Stock options exercised, including tax benefits of $0 in 2009, $8 in 2008 and $22 in 2007
|
—
|
215 | 368 | |||||||||
|
Dividend receivable from subsidiary
|
—
|
(455 | ) |
—
|
||||||||
|
Dividends paid
|
(1,385 | ) | (1,771 | ) | (1,720 | ) | ||||||
|
Repurchases of common stock
|
—
|
(1,464 | ) | (1,334 | ) | |||||||
|
Cash flows provided by financing activities
|
(1,385 | ) | (3,475 | ) | (2,686 | ) | ||||||
|
Net (increase) decrease in cash
|
11 | 1 | 18 | |||||||||
|
Cash, beginning of year
|
56 | 55 | 37 | |||||||||
|
Cash, end of year
|
$ | 67 | $ | 56 | $ | 55 | ||||||
93
Not applicable.
Disclosure Controls and Procedures. Disclosure controls and procedures are designed with the objective of ensuring that information required to be disclosed in reports filed by the Company under the Exchange Act, such as this Annual Report, is recorded, processed, summarized and reported within the time periods specified in the rules and forms of the Securities and Exchange Commission. Disclosure controls and procedures are also designed with the objective of ensuring that such information is accumulated and communicated to management, including the Chief Executive Officer and the Chief Financial Officer, as appropriate to allow timely decisions regarding required disclosure.
Evaluation of Disclosure Controls and Procedures and Internal Control over Financial Reporting. The Company’s management, including the Chief Executive Officer and the Chief Financial Officer, evaluated the Company’s disclosure controls and procedures (as defined in Rule 13a-15(e) under the Exchange Act) as of December 31, 2009. Based on this evaluation, the Chief Executive Officer and the Chief Financial Officer concluded that the Company’s disclosure controls and procedures are effective. There was no change in the Company’s internal control over financial reporting that occurred during the quarter ended December 31, 2009 that has materially affected, or is reasonably likely to materially affect, the Company’s internal control over financial reporting.
Management’s Report on Internal Control over Financial Reporting. Management of the Company is responsible for establishing and maintaining adequate internal control over financial reporting. As defined in Rule 13a-15(f) under the Exchange Act, internal control over financial reporting is a process designed by, or under the supervision of, a company’s principal executive and principal financial officers and effected by a company’s board of directors, management and other personnel, to provide reasonable assurance regarding the reliability of financial reporting and the preparation of financial statements for external purposes in accordance with generally accepted accounting principles. It includes those policies and procedures that:
|
a)
|
Pertain to the maintenance of records that in reasonable detail accurately and fairly reflect the transactions and dispositions of the assets of a company;
|
|
|
b)
|
Provide reasonable assurance that transactions are recorded as necessary to permit preparation of financial statements in accordance with generally accepted accounting principles, and that receipts and expenditures of a company are being made only in accordance with authorizations of management and the board of directors of the company, and
|
|
|
c)
|
Provide reasonable assurance regarding prevention or timely detection of unauthorized acquisition, use or disposition of a company’s assets that could have a material effect on its financial statements.
|
94
Because of the inherent limitations, internal control over financial reporting may not prevent or detect misstatements. Also, projections of any evaluation of effectiveness to future periods are subject to the risk that controls may become inadequate because of changes in conditions, or that the degree of compliance with the policies or procedures may deteriorate.
The Company’s management has used the criteria established in “Internal Control-Integrated Framework” issued by the Committee of Sponsoring Organizations of the Treadway Commission (“COSO”) to evaluate the effectiveness of the Company’s internal control over financial reporting. Management has selected the COSO framework for its evaluation as it is a control framework recognized by the SEC and the Public Company Accounting Oversight Board, that is free from bias, permits reasonably consistent qualitative and quantitative measurement of the Company’s internal controls, is sufficiently complete so that relevant controls are not omitted and is relevant to an evaluation of internal controls over financial reporting.
Based on our assessment, management has concluded that our internal control over financial reporting, based on criteria established in “Internal Control-Integrated Framework” issued by COSO was effective as of December 31, 2009.
Date: March 26, 2010
|
/s/ Thomas C. Mc Graw
|
/s/ David A. Curtis
|
||
|
Thomas C. Mc Graw
|
David A. Curtis
|
||
|
Chief Executive Officer
|
Chief Financial Officer
|
Inherent Limitations on Effectiveness of Controls
The Company’s management, including the Chief Executive Officer and Chief Financial Officer, does not expect that our disclosure controls or our internal control over financial reporting will prevent or detect all error and all fraud. A control system, no matter how well designed and operated, can provide only reasonable, not absolute, assurance that the control system’s objectives will be met. The design of a control system must reflect the fact that there are resource constraints, and the benefits of controls must be considered relative to their costs. Further, because of the inherent limitations in all control systems, no evaluation of controls can provide absolute assurance that misstatements due to error or fraud will not occur or that all control issues and instances of fraud, if any, within the Company have been detected. These inherent limitations include the realities that judgments in decision-making can be faulty and that breakdowns can occur because of simple error or mistake. Controls can also be circumvented by the individual acts of some persons, by collusion of two or more people, or by management override of the controls. The design of any system of controls is based in part on certain assumptions about the likelihood of future events, and there can be no assurance that any design will succeed in achieving its stated goals under all potential future conditions. Projections of any evaluation of controls effectiveness to future periods are subject to risks. Over time, controls may become inadequate because of changes in conditions or deterioration in the degree of compliance with policies or procedures.
95
Not applicable.
The information required by Item 10 of Form 10-K is incorporated by reference to the applicable information contained in the Company’s Proxy Statement for the 2010 Annual Meeting of Shareholders which will be filed pursuant to Regulation 14A.
The information required by Item 11 of Form 10-K is incorporated by reference to the applicable information contained in the Company’s Proxy Statement for the 2010 Annual Meeting of Shareholders which will be filed pursuant to Regulation 14A.
ITEM 12. SECURITY OWNERSHIP OF CERTAIN BENEFICIAL OWNERS AND MANAGEMENT AND RELATED SHAREHOLDER MATTERS
The information required by Item 12 of Form 10-K is incorporated by reference to the applicable information contained in the Company’s Proxy Statement for the 2010 Annual Meeting of Shareholders which will be filed pursuant to Regulation 14A.
The information required by Item 13 of Form 10-K is incorporated by reference to the applicable information contained in the Company’s Proxy Statement for the 2010 Annual Meeting of Shareholders which will be filed pursuant to Regulation 14A.
The information required by Item 14 of Form 10-K is incorporated by reference to the applicable information contained in the Company’s Proxy Statement for the 2010 Annual Meeting of Shareholders which will be filed pursuant to Regulation 14
96
| (a)(1) | Financial Statements. Listed and included in Part II, Item 8. | ||
|
Financial Statement Schedules. All schedules have been omitted since the required information is not present in amounts sufficient to require submission of the schedule or because the information required is included in the Financial Statements or notes thereto.
|
|||
| (3) | Exhibits. | ||
|
Exhibit
Number
|
Document Description
|
|
|
**2.1
|
(deleted)
|
|
|
2.2
|
Acquisition Agreement dated November 5, 2004, signed among First National Bank of Northern California, Sequoia National Bank and Hemisphere National Bank (incorporated by reference from Exhibit 2.2 to the Company’s Current Report on Form 8-K filed with the Commission on November 9, 2004).
|
|
|
2.3
|
First Addendum to Acquisition Agreement, dated December 13, 2004, signed among First National Bank of Northern California, Sequoia National Bank, Hemisphere National Bank and Privee Financial, Inc. (incorporated by reference from Exhibit 2.5 to the Company’s Current Report on Form 8-K filed with the Commission on December 17, 2004)
|
|
|
2.4
|
Second Addendum to Acquisition Agreement. Dated as of April 15, 2005, signed among First National Bank Of Northern California, Sequoia National Bank, Hemisphere National Bank and Privee Financial, Inc. (incorporated by reference from Exhibit 2.4 to the Company’s Current Report on Form 8-K filed with the Commission on May 2, 2005)
|
|
|
**3.1
|
Articles of Incorporation of FNB Bancorp
|
|
|
3.2
|
Certificate of Determination of Fixed Rate Cumulative Perpetual Preferred Stock, Series A (“Series A Preferred Stock”), of FNB Bancorp (incorporated by reference from Exhibit 3.1 to the Company’s Current Report on Form 8-K filed with the Commission on February 27, 2009)
|
|
|
3.3
|
Certificate of Determination of Fixed Rate Cumulative Perpetual Preferred Stock, Series B (“Series B Preferred Stock”), of FNB Bancorp (incorporated by reference from Exhibit 3.2 to the Company’s Current Report on Form 8-K filed with the Commission on February 27, 2009)
|
|
|
3.4
|
Bylaws of FNB Bancorp (as amended through February 27, 2009).
|
|
|
**4.1
|
Specimen of the Registrant’s common stock certificate.
|
|
|
4.2
|
Form of Certificate for the Series A Preferred Stock (incorporated by reference from Exhibit 4.1 to the Company’s Current Report on Form 8-K filed with the Commission on February 27, 2009)
|
|
|
4.3
|
Warrant for Purchase of Shares of Series B Preferred Stock (“Warrant”) (incorporated by reference from Exhibit 4.2 to the Company’s Current Report on Form 8-K filed with the Commission on February 27, 2009)
|
|
|
4.4
|
Form of Certificate for the Series B Preferred Stock (incorporated by reference from Exhibit 4.3 to the Company’s Current Report on Form 8-K filed with the Commission on February 27, 2009)
|
|
|
**10.1
|
Lease agreement dated April 24, 1995, as amended, for Eureka Square Branch Office of First National Bank of Northern California at Eureka Square Shopping Center, Pacifica, California
|
|
|
**10.2
|
(deleted)
|
|
|
10.3
|
(deleted)
|
|
|
10.4
|
(deleted)
|
|
|
10.5
|
(deleted)
|
|
|
10.6
|
(deleted)
|
|
|
10.7
|
(deleted)
|
97
|
10.8(a)
|
(deleted)
|
|
|
10.8(b)
|
(deleted)
|
|
|
**10.9
|
First National Bank Profit Sharing and 401(k) Plan dated August 26, 1969.*
|
|
|
**10.10
|
First National Bank Deferred compensation Plan dated November 1, 1997.*
|
|
|
**10.11
|
Salary Continuation Agreement between First National Bank of Northern California and Michael R. Wyman, dated December 20, 1996.*
|
|
|
**10.12
|
Salary Continuation Agreement between First National Bank of Northern California and Paul B. Hogan dated December 20, 1996.*
|
|
|
**10.13
|
Salary Continuation Agreement between First National Bank of Northern California and James B. Ramsey, dated December 23, 1999.*
|
|
|
**10.14
|
Form of Management Continuity Agreement signed on July 20, 2000, between First National Bank of Northern California and Jim D. Black, Charles R. Key and Anthony J. Clifford.*
|
|
|
10.15
|
(deleted)
|
|
|
**10.16
|
Communications Site Lease Agreement as amended dated March 30, 1999, between First National Bank of Northern California, as Lessor and Nextel of California, Inc., as Lessee, with respect to Redwood City Branch Office.
|
|
|
10.17
|
(deleted)
|
|
|
**10.18
|
Separation Agreement between First National Bank of Northern California and Paul B. Hogan, dated December 5, 2001.*
|
|
|
***10.19
|
First Amendment to Separation Agreement between First National Bank of Northern California and Paul B. Hogan, dated March 22, 2002.*
|
|
|
****10.20
|
FNB Bancorp Stock Option Plan (effective March 15, 2002).*
|
|
|
****10.21
|
FNB Bancorp Stock Option Plan, Form of Incentive Stock Option Agreement.*
|
|
|
****10.22
|
FNB Bancorp Stock Option Plan, Form of Nonstatutory Stock Option Agreement.*
|
|
|
*****10.23
|
FNB Bancorp 2002 Stock option Plan (adopted June 28, 2002).*
|
|
|
*****10.24
|
FNB Bancorp 2002 Stock Option Plan, Form of Incentive Stock Option Agreement.*
|
|
|
*****10.25
|
FNB Bancorp 2002 Stock Option Plan, Form of Nonstatutory Stock option Agreement.*
|
|
|
******10.26
|
Lease Agreement dated August 13, 2003, for San Mateo Branch Office of First National Bank of Northern California, located at 150 East Third Avenue, San Mateo, California.
|
|
|
10.27
|
Salary Continuation Agreement and Split-Dollar Agreement for Jim D. Black (incorporated by reference from Exhibit 10.27 to the Company’s Current Report on Form 8-K filed with the Commission on September 10, 2004).*
|
|
|
10.28
|
Salary Continuation Agreement and Split-Dollar Agreement for Anthony J. Clifford (incorporated by reference from Exhibit 10.28 to the Company’s Current Report on Form 8-K filed with the Commission on September 10, 2004).*
|
|
|
10.29
|
Amended and Restated Salary Continuation and Split-Dollar Agreement for James B. Ramsey (incorporated by reference from Exhibit 10.29 o the company’s current Report on Form 8-K filed with the Commission on September 10, 2004).*
|
98
|
*******10.30
|
Lease Agreement dated May 1, 2003 as amended by Assignment, Assumption and Consent Agreement for the Financial District Branch of First National Bank of Northern California located at 65 Post Street, San Francisco, California.
|
|
|
*******10.31
|
Lease Agreement dated July 1, 1999, as amended by Assignment, Assumption and Consent for the Portola Branch Office of First National Bank of Northern California located at 699 Portola Drive, San Francisco, California.
|
|
|
10.32
|
Amendment to Salary Continuation Agreement for Jim D. Black (incorporated by reference from Exhibit 99.37 to the Company’s Current Report on Form 8-K filed with the Commission on July 26, 2006).*
|
|
|
10.33
|
Amendment to Salary Continuation Agreement for Anthony J. Clifford (incorporated by reference from Exhibit 99.38 to the Company’s Current Report on Form 8-K filed with the Commission on July 26, 2006).*
|
|
|
10.34
|
Amendment to Amended and Restated Salary Continuation Agreement for James B. Ramsey (incorporated by reference from Exhibit 99.39 to the Company’s Current report on Form 8-K filed with the Commission on July 26, 2006).*
|
|
|
10.35
|
Lease Agreement dated February 3, 2006, for warehouse facility of First National Bank of Northern California (incorporated by reference from Exhibit 10.35 to the company’s Annual Report on Form 10-K filed with the Commission on March 13, 2008).
|
|
|
10.36
|
First National Bank Deferred Compensation Plan dated December 1, 2007 (incorporated by reference from Exhibit 10.36 to the Company’s Annual Report on Form 10-K filed with the Commission on March 13, 2008).*
|
|
|
10.37
|
Amendment No. 5 to the First National Bank Profit Sharing and 401(k) Plan dated December 1, 2007 (incorporated by reference from Exhibit 10.37 to the Company’s Annual Report on Form 10-K filed with the Commission on March 13, 2008).*
|
|
|
10.38
|
Executive Supplemental Compensation Agreement between First National Bank of Northern California and David A. Curtis dated March 3, 2008 (incorporated by reference from Exhibit 10.38 to the Company’s Current Report on Form 8-K filed with the Commission on March 6, 2008).*
|
|
|
10.39
|
Split-Dollar Life Insurance Agreement between First National Bank of Northern California and David A. Curtis dated March 3, 2008 (incorporated by reference from Exhibit 10.39 to the Company’s Current Report on Form 8-K filed with the Commission on March 6, 2008).*
|
|
|
********10.40
|
FNB Bancorp 2008 Stock option Plan (adopted February 22, 2008).*
|
|
|
10.41
|
Second 409A Amendment to the Salary Continuation Agreement for Jim D. Black (incorporated by reference from Exhibit 99.66 to the Company’s Current Report on Form 8-K filed with the Commission on December 22, 2008).*
|
|
|
10.42
|
Second 409A Amendment to the Salary Continuation Agreement for Anthony J. Clifford (incorporated by reference from Exhibit 99.67 to the Company’s Current Report on Form 8-K filed with the Commission on December 22, 2008).*
|
|
|
10.43
|
Amendment to the Executive Supplemental Compensation Agreement for David A. Curtis (incorporated by reference from Exhibit 99.68 to the Company’s Current Report on Form 8-K filed with the Commission on December 22, 2008).*
|
|
|
10.44
|
Letter Agreement dated February 27, 2009, between FNB Bancorp and United States Department of the Treasury pertaining to the election of directors by the holder(s) of the Series A and Series B Preferred Stock (incorporated by reference from Exhibit 4.4 to the Company’s Current Report on Form 8-K filed with the Commission on February 27, 2009)
|
|
|
10.45
|
Letter Agreement, including Schedule A and Securities Purchase Agreement Standard Terms, dated February 27, 2009, between FNB Bancorp and United States Department of the Treasury, with respect to to the issuance and sale of the Series A and Series B Preferred Stock and the Warrant (incorporated by reference from Exhibit 10.1 to the Company’s Current Report on Form 8-K filed with the Commission on February 27, 2009)
|
99
|
10.46
|
Letter Agreement dated February 27, 2009, between FNB Bancorp and United States Department of the Treasury pertaining to the American Recovery and Reinvestment Act of 2009 (incorporated by reference from Exhibit 10.2 to the Company’s Current Report on Form 8-K filed with the Commission on February 27, 2009)
|
|
|
10.47
|
Letter Agreement dated February 27, 2009, between FNB Bancorp and United States Department of the Treasury amending certain sections of the Securities Purchase Agreement Standard Terms (incorporated by reference from Exhibit 10.3 to the Company’s Current Report on Form 8-K filed with the Commission on February 27, 2009)
|
|
|
10.48
|
Form of Compensation Modification Agreement and Waiver, dated February 27, 2009, executed by each of:
|
|
|
Thomas C. McGraw
|
||
|
Chief Executive Officer
|
||
|
FNB Bancorp and First National Bank of Northern California
|
||
|
Jim D. Black, President
|
||
|
FNB Bancorp and First National Bank of Northern California
|
||
|
Anthony J. Clifford
|
||
|
Executive Vice President and Chief Operating Officer
|
||
|
FNB Bancorp and First National Bank of Northern California
|
||
|
David A. Curtis
|
||
|
Senior Vice President and Chief Financial Officer
|
||
|
FNB Bancorp and First National Bank of Northern California
|
||
|
Randy R. Brugioni
|
||
|
Senior Vice President and Senior Loan Officer
|
||
|
FNB Bancorp and First National Bank of Northern California
|
||
|
(incorporated by reference from Exhibit 10.4 to the Company’s Current Report on Form 8-K filed with the Commission on February 27, 2009).
|
||
|
10.49
|
Lease agreement dated June 8, 1999, as amended August 18, 2009, for Linda Mar Branch Office of First National Bank of Northern California at Linda Mar Shopping Center, Pacifica, California
|
|
|
******14.0
|
Code of Ethics
|
|
|
21.1
|
The Registrant has one subsidiary, First National Bank of Northern California
|
|
|
23.1
|
Consent of Moss Adams LLP
|
|
|
31.1
|
Rule 13a-14(a)/15d-14(a) Certification
|
|
|
(principal executive officer)
|
||
|
31.2
|
Rule 13a-14(a)/15d-14(a) Certification
|
|
|
(principal financial officer)
|
||
|
32.0
|
Section 1350 Certifications
|
|
*
|
Denotes management contracts, compensatory plans or arrangements.
|
|
|
**
|
Incorporated by reference to registrant’s Quarterly Report on Form 10-Q filed with the Commission on May 15, 2002.
|
|
|
***
|
Incorporated by reference to registrant’s Annual Report on Form 10-K filed with the Commission on March 31, 2002.
|
|
|
****
|
Incorporated by reference to registrant’s Statement on Form S-8 (No. 333-91596) filed with the Commission on July 1, 2002.
|
100
|
*****
|
Incorporated by reference to the registrant’s Registration Statement on Form S-8 (No. 333-98293) filed with the Commission on August 16, 2002.
|
|
|
******
|
Incorporated by reference to registrant’s Annual Report on Form 10-K filed with the Commission on March 30, 2003.
|
|
|
*******
|
Incorporated by reference to registrant’s Annual Report on Form 10-K filed with the Commission on March 29, 2006.
|
|
|
********
|
Incorporated by reference from Appendix A to the Registrant’s Definitive Proxy Statement for its 2008 Annual Meeting of Shareholders, filed with the Commission on April 21, 2008.
|
An Annual Report for the fiscal year ended December 31, 2009, and Notice of Annual Meeting and Proxy Statement for the Company’s 2010 Annual Meeting will be mailed to security holders subsequent to the date of filing this report. Copies of said materials will be furnished to the Commission in accordance with the Commission’s Rules and Regulations.
101
Pursuant to the requirements of Section 13 or 15(d) of the Securities and Exchange Act of 1934, the registrant has duly caused this report to be signed on its behalf by the undersigned, thereunto duly authorized.
| FNB BANCORP | |||
|
Dated: March 26, 2010
|
By:
|
/s/ Thomas C. McGraw
|
|
|
Thomas C. McGraw
|
|||
|
Chief Executive Officer
|
|||
|
(Principal Executive Officer)
|
|||
Pursuant to the requirements of the Securities and Exchange Act of 1934, this report has been signed below by the following persons on behalf of the registrant in the capacities and on the dates indicated.
|
Signature
|
Title
|
Date
|
||
|
/s/ Michael R. Wyman
|
Chairman of the Board
|
March 26, 2010
|
||
|
Michael R. Wyman
|
of Directors
|
|||
|
/s/ Thomas C. McGraw
|
Director, Chief Executive
|
March 26, 2010
|
||
|
Thomas C. McGraw
|
Officer and Secretary
|
|||
|
/s/ David A. Curtis
|
Senior Vice President
|
March 26, 2010
|
||
|
David A. Curtis
|
and Chief Financial Officer
|
|||
|
(Principal Financial Officer
|
||||
|
and Principal Accounting Officer)
|
|
/s/ Lisa Angelot
|
Director
|
March 26, 2010
|
||
|
Lisa Angelot
|
||||
|
/s/ Ronald R. Barels, D.D.S.
|
Director
|
March 26, 2010
|
||
| Ronald R. Barels, D.D.S. | ||||
|
/s/ Merrie Turner Lightner
|
Director
|
March 26, 2010
|
||
|
Merrie Turner Lightner
|
||||
|
/s/ Michael Pacelli
|
Director
|
March 26, 2010
|
||
|
Michael Pacelli
|
||||
|
/s/ Edward J. Watson
|
Director
|
March 26, 2010
|
||
|
Edward J. Watson
|
||||
|
/s/ Anthony J. Clifford
|
Director and Executive
|
March 26, 2010
|
||
|
Anthony J. Clifford
|
Vice President and Chief
|
|||
|
Operating Officer
|
||||
|
/s/ Jim D. Black
|
Director and President
|
March 26, 2010
|
||
|
Jim D. Black
|
102