Attached files
Table of Contents
Exhibit 13

Table of Contents
Common Shares
Common shares are not traded on any stock exchange. Quotations may be
obtained through the OTC Bulletin Board under the trading symbol FCBS.
Stockholder Inquiries
Communications regarding transfer requirements and lost certificates
should be directed to the transfer agent.
Transfer Agent/Registrar
Registrar and Transfer Company, 10 Commerce Drive,
Cranford, NJ 07016-3572, (800) 368-5948, www.rtco.com
Form 10-K Information
Copies of the First Century Bankshares, Inc. Annual Report to the
Securities and Exchange Commission, Form 10–K, may be obtained by
writing J. Ronald Hypes, Treasurer, First Century Bankshares, Inc.,
P.O. Box 1559, Bluefield, WV 24701.
Annual Meeting
The annual meeting of the stockholders will be held at 3:00 p.m., Tuesday,
April 27, 2010, at the First Century Bank Seminar Center, 525 Federal Street,
Bluefield, West Virginia. All stockholders are cordially invited to attend.
| Letter to the Stockholders | 1 |
| Management’s Discussion and Analysis of Financial Condition and Results of Operations |
2 |
| Consolidated Statements of Financial Condition | 23 |
| Consolidated Statements of Income | 24 |
| Consolidated Statements of Changes in Stockholders’ Equity | 25 |
| Consolidated Statements of Cash Flows | 26 |
| Notes to Consolidated Financial Statements | 27 |
| Management’s Annual Report on Internal Control Over Financial Reporting |
50 |
| Report of Independent Registered Public Accounting Firm | 51 |
| Boards of Directors | 52 |
| Corporate and Bank Officers | 54 |
| First Century Bankshares, Inc. Subsidiary Locations | Back Cover |
Table of Contents
Stockholders
To Our Stockholders, Customers, and Friends:
The directors, officers, and employees of First Century Bankshares, Inc. and its wholly owned subsidiary First Century Bank, N.A. are pleased to present this Annual Report for 2009.
First Century Bankshares, Inc. had earnings of $315,000 for the year which was a significant decrease from the prior year earnings of $3,685,000. On a per share basis, net income decreased to $0.17 from $1.93. This equated to a return on average assets of 0.07% and a return on average equity of 0.76%. Earnings for 2009 were impacted due to a weakened national economy which required additional loan loss provisions, along with significant additional FDIC assessments. Additionally, because of further deterioration of a major credit facility we incurred a specific charge off of $2,750,000 in the fourth quarter. Although these issues made for a very challenging year in 2009, we were pleased that the core earnings of the bank remained relatively stable with the net interest margin as a percentage of average assets essentially unchanged from 2008 to 2009.
It is also important to know that the Company continues to be well capitalized at December 31, 2009, with total risk based capital to risk weighted assets of 13.56% and a Tier 1 leverage ratio of 8.92%. These are well above regulatory requirements to be considered well capitalized of 10% and 5% respectively.
We continued to stay focused on asset quality in 2009. We have always made loans to small businesses and consumers in our markets, and, unfortunately, when economic downturns occur, we experience losses in our loan portfolio. Strong underwriting standards and internal risk rating systems are in place to help manage the credit risk of the portfolio. Timely identification of deterioration allows for proper rating of loans and reserving for potential future losses. External credit review is also in place to help monitor these trends. Even with these systems in place we still anticipate a difficult economy in 2010 and beyond. As our customers experience slower growth and reduced earnings, we would anticipate additional downgrades and reserve requirements within our portfolio. As with most community banks we cannot outperform the local and national economy and its impact on our customers. We are a reflection of the communities we serve.
Management and the Board of Directors have updated our strategic plan to move the Company forward for the next three years. We believe that in these uncertain times that to look further ahead would be difficult. Your leadership team knows that the plan is a living document, and it needs to be reviewed and updated constantly. Within the plan, we look at growth of assets, growth of earnings, and maintaining a fair and consistent dividend. We look for the plan to guide us in providing a fair total return to you over time. Your continued support is greatly appreciated.
As we move forward into 2010 we will commit to keep you fully advised of our progress. Together we can achieve the goals set forth in our strategic plan and move forward as a stronger company ready to serve our shareholders, customers, and employees. I welcome your comments and recommendations as we continue to face unprecedented challenges in the local and national economies.
Sincerely,

R. W. “Buz” Wilkinson
President and Chief Executive Officer
First Century Bankshares, Inc. Page 1
Table of Contents
Discussion and Analysis of Financial Condition and Results of Operations
AVERAGE STATEMENTS OF FINANCIAL CONDITION AND NET INTEREST DIFFERENTIAL
| 2009 | 2008 | 2007 | ||||||||||||||||||||||||||||
| (Dollars in Thousands) | (Dollars in Thousands) | (Dollars in Thousands) | ||||||||||||||||||||||||||||
| ASSETS: | Average Balance |
Interest | Average Rate |
Average Balance |
Interest | Average Rate |
Average Balance |
Interest | Average Rate |
|||||||||||||||||||||
| Interest-bearing deposits with banks |
$ | 5,921 | $ | 48 | 0.81 | % | $ | 6,296 | $ | 165 | 2.62 | % | $ | 1,244 | $ | 64 | 5.14 | % | ||||||||||||
| Securities available for sale and other equity securities: |
||||||||||||||||||||||||||||||
| U. S. Treasury securities |
— | — | — | 746 | 35 | 4.69 | % | 999 | 47 | 4.70 | % | |||||||||||||||||||
| U. S. Government agency securities |
66,627 | 2,771 | 4.16 | % | 75,645 | 3,704 | 4.90 | % | 80,226 | 3,549 | 4.42 | % | ||||||||||||||||||
| Other securities |
1,969 | 39 | 1.98 | % | 3,708 | 131 | 3.53 | % | 3,157 | 165 | 5.23 | % | ||||||||||||||||||
| Total securities available for sale |
68,596 | 2,810 | 4.10 | % | 80,099 | 3,870 | 4.83 | % | 84,382 | 3,761 | 4.46 | % | ||||||||||||||||||
| Securities held to maturity: |
||||||||||||||||||||||||||||||
| State and municipal securities |
18,467 | 705 | 3.82 | % | 17,978 | 686 | 3.82 | % | 15,219 | 592 | 3.89 | % | ||||||||||||||||||
| Other securities |
— | — | — | — | — | — | 32 | 2 | 6.25 | % | ||||||||||||||||||||
| Total securities held to maturity |
18,467 | 705 | 3.82 | % | 17,978 | 686 | 3.82 | % | 15,251 | 594 | 3.89 | % | ||||||||||||||||||
| Federal funds sold |
4,398 | 10 | 0.23 | % | 6,100 | 122 | 2.00 | % | 1,094 | 56 | 5.12 | % | ||||||||||||||||||
| Loans |
296,398 | 16,151 | 5.45 | % | 290,928 | 18,008 | 6.19 | % | 295,451 | 22,363 | 7.57 | % | ||||||||||||||||||
| Total interest-earning assets |
393,780 | $ | 19,724 | 5.01 | % | 401,401 | $ | 22,851 | 5.69 | % | 397,422 | 26,838 | 6.75 | % | ||||||||||||||||
| Allowance for loan losses |
(2,944 | ) | (2,481 | ) | (2,526 | ) | ||||||||||||||||||||||||
| Cash and due from banks—demand |
11,105 | 10,685 | 10,916 | |||||||||||||||||||||||||||
| Bank Premises and equipment—net |
13,968 | 14,434 | 12,408 | |||||||||||||||||||||||||||
| Other assets |
9,026 | 10,556 | 10,377 | |||||||||||||||||||||||||||
| TOTAL ASSETS |
$ | 424,935 | $ | 434,595 | $ | 428,597 | ||||||||||||||||||||||||
| LIABILITIES AND STOCKHOLDERS’ EQUITY: |
||||||||||||||||||||||||||||||
| Interest-bearing demand deposits |
$ | 80,032 | $ | 162 | 0.20 | % | $ | 75,056 | $ | 298 | 0.40 | % | $ | 73,923 | $ | 605 | 0.82 | % | ||||||||||||
| Savings deposits |
56,363 | 150 | 0.27 | % | 56,026 | 357 | 0.64 | % | 56,156 | 598 | 1.06 | % | ||||||||||||||||||
| Time deposits |
172,108 | 4,334 | 2.52 | % | 183,041 | 6,820 | 3.73 | % | 190,391 | 8,610 | 4.52 | % | ||||||||||||||||||
| Total interest-bearing deposits |
308,503 | 4,646 | 1.51 | % | 314,123 | 7,475 | 2.38 | % | 320,470 | 9,813 | 3.06 | % | ||||||||||||||||||
| Short-term debt |
20,627 | 278 | 1.35 | % | 21,560 | 341 | 1.58 | % | 18,203 | 652 | 3.58 | % | ||||||||||||||||||
| Total interest-bearing liabilities |
329,130 | 4,924 | 1.50 | % | 335,683 | 7,816 | 2.33 | % | 338,673 | 10,465 | 3.09 | % | ||||||||||||||||||
| Demand deposits |
52,176 | 54,288 | 45,794 | |||||||||||||||||||||||||||
| Other liabilities |
3,282 | 3,128 | 3,519 | |||||||||||||||||||||||||||
| TOTAL LIABILITIES |
384,588 | 393,099 | 387,986 | |||||||||||||||||||||||||||
| Stockholders’ equity |
40,347 | 41,496 | 40,611 | |||||||||||||||||||||||||||
| TOTAL LIABILITIES AND STOCKHOLDERS’ EQUITY |
$ | 424,935 | $ | 434,595 | $ | 428,597 | ||||||||||||||||||||||||
| Average rate paid to fund earning assets |
1.25 | % | 1.95 | % | 2.63 | % | ||||||||||||||||||||||||
| NET INTEREST DIFFERENTIAL |
$ | 14,800 | 3.76 | % | $ | 15,035 | 3.75 | % | $ | 16,373 | 4.12 | % | ||||||||||||||||||
For purposes of this schedule, interest on nonaccrual loans have been included only to the extent reflected in the income statement. However, the nonaccrual loan balance is included in the average amount outstanding. Income on loans includes loan fees of $496,000 in 2009, $257,000 in 2008 and $182,000 in 2007. Average balances of securities available for sale are reported at amortized cost; excludes pretax unrealized gains of $1,563,000 in 2009 and pretax unrealized losses of $461,000 in 2008 and $651,000 in 2007. Interest income on tax exempt securities is shown based on the actual yield.
VOLUME/RATE ANALYSIS
| Increase (Decrease) in Interest | ||||||||||||||||||||||||||||||||||||
| 2009 vs. 2008 | 2008 vs. 2007 | 2007 vs. 2006 | ||||||||||||||||||||||||||||||||||
| (Dollars in Thousands) | (Dollars in Thousands) | (Dollars in Thousands) | ||||||||||||||||||||||||||||||||||
| Due to Change in (1) | Due to Change in (1) | Due to Change in (1) | ||||||||||||||||||||||||||||||||||
| Interest income on: | Volume | Rate | Total | Volume | Rate | Total | Volume | Rate | Total | |||||||||||||||||||||||||||
| Loans |
$ | 318 | $ | (2,175 | ) | $ | (1,857 | ) | $ | (311 | ) | $ | (4,044 | ) | $ | (4,355 | ) | $ | 1,585 | $ | 442 | $ | 2,027 | |||||||||||||
| Securities available for sale and other equity securities |
(513 | ) | (547 | ) | (1,060 | ) | (199 | ) | 308 | 109 | 15 | 466 | 481 | |||||||||||||||||||||||
| Securities held to maturity |
19 | 0 | 19 | 105 | (13 | ) | 92 | 75 | (5 | ) | 70 | |||||||||||||||||||||||||
| Federal funds sold |
(19 | ) | (93 | ) | (112 | ) | 178 | (112 | ) | 66 | 12 | 5 | 17 | |||||||||||||||||||||||
| Interest-bearing deposits with banks |
(6 | ) | (111 | ) | (117 | ) | 196 | (95 | ) | 101 | 52 | (2 | ) | 50 | ||||||||||||||||||||||
| TOTAL INTEREST INCOME |
(201 | ) | (2,926 | ) | (3,127 | ) | (31 | ) | (3,956 | ) | (3,987 | ) | 1,739 | 906 | 2,645 | |||||||||||||||||||||
| Interest expense on: |
||||||||||||||||||||||||||||||||||||
| Interest-bearing demand deposits |
15 | (151 | ) | (136 | ) | 7 | (314 | ) | (307 | ) | (16 | ) | 78 | 62 | ||||||||||||||||||||||
| Savings deposits |
2 | (209 | ) | (207 | ) | (1 | ) | (240 | ) | (241 | ) | (27 | ) | 87 | 60 | |||||||||||||||||||||
| Time deposits |
(341 | ) | (2,145 | ) | (2,486 | ) | (303 | ) | (1,487 | ) | (1,790 | ) | 1,139 | 1,218 | 2,357 | |||||||||||||||||||||
| Short-term borrowings |
(14 | ) | (49 | ) | (63 | ) | 87 | (398 | ) | (311 | ) | (28 | ) | 2 | (26 | ) | ||||||||||||||||||||
| TOTAL INTEREST EXPENSE |
(338 | ) | (2,554 | ) | (2,892 | ) | (210 | ) | (2,439 | ) | (2,649 | ) | 1,068 | 1,385 | 2,453 | |||||||||||||||||||||
| NET INTEREST INCOME |
$ | 137 | $ | (372 | ) | $ | (235 | ) | 179 | $ | (1,517 | ) | $ | (1,338 | ) | $ | 671 | $ | (479 | ) | $ | 192 | ||||||||||||||
(1) Changes due to a combination of volume and rate have been allocated proportionally to volume and rate.
Page 2 First Century Bankshares, Inc.
Table of Contents
This narrative will assist you in your analysis of the accompanying consolidated financial statements and supplemental financial information. It should be read in conjunction with the audited consolidated financial statements and the notes that follow, along with the selected financial data presented elsewhere in this report. We are not aware of any market or institutional trends, events or uncertainties that will have or are reasonably likely to have a material effect on the liquidity, capital resources or operations of the Corporation, except as discussed herein. We are also not aware of any current recommendations by any regulatory authorities, which would have such a material effect if implemented.
Forward-looking Statements
This report contains certain forward-looking statements (as defined in the Private Securities Litigation Act of 1995), including certain plans, expectations, goals and projections, which are inherently subject to numerous assumptions, risks and uncertainties. Actual results could differ materially from those contained in or implied by such statements for a variety of factors including but not limited to: changes in economic conditions which may affect our primary market area; rapid movements in interest rates; competitive pressures on product pricing and services; success and timing of business strategies; the nature and extent of governmental actions and reforms; continuing consolidation on the financial services industry; rapidly changing technology; and evolving financial industry standards.
Corporate Structure and Acquisitions
First Century Bankshares, Inc. (“Corporation”) is chartered under the laws of West Virginia and operates as a financial holding company headquartered in Bluefield, WV. We began active operations in March 1984, in a business combination with our then sole subsidiary, The First National Bank of Bluefield. Through a series of acquisitions and consolidations, we now operate one subsidiary bank, First Century Bank, N.A., Bluefield, WV (“FCBNA”). FCBNA is engaged in commercial banking activities that provide a broad menu of financial services to individuals and businesses. FCBNA operates 12 branch offices and 17 ATM locations throughout southern West Virginia and southwestern Virginia.
During 2001, we formed a financial subsidiary, First Century Financial Services, LLC, (“FCFSLLC”). This entity conducts our insurance activities through its investment in the Banker’s Insurance Corporation, a relationship among several community banks, which offers a full range of insurance products and services. Effective December 31, 2009, FCFSLLC resigned from Banker’s Insurance Corporation and ceased conducting insurance activities with that company. We are evaluating various options for the continued utilization of FCFSLLC to provide nontraditional financial services. We believe the expansion of nontraditional financial service offerings to our customers will enhance the Corporation’s performance, and ultimately, shareholder value. FCFSLLC was formed with a minimal capital investment, which is carried at cost and eliminates upon consolidation.
Critical Accounting Policies
Our accounting policies are an integral part to understanding the results reported. Accounting policies are described in detail in Note 1 to the Consolidated Financial Statements. Our consolidated financial statements are prepared in accordance with accounting principles generally accepted in the United States of America, and follow general practices within the
First Century Bankshares, Inc. Page 3
Table of Contents
financial services industry. Our most complex accounting policies require us to make estimates, assumptions and judgments to ascertain the valuation of assets, liabilities, commitments and contingencies reported in our financial statements and accompanying notes. These estimates, assumptions, and judgments are based on information available as of the date of the financial statements; accordingly, as this information changes, the financial statements could reflect different estimates, assumptions, and judgments. Certain policies inherently have a greater reliance on the use of estimates, assumptions, and judgments and as such have a greater possibility of producing results that could be materially different than originally reported.
Allowance for Loan Losses
We maintain, through the provision expense, an allowance for loan losses that we believe to be adequate to absorb probable credit losses inherent in the portfolio. The procedures that we use entail preparation of a loan watch list and assigning each loan a classification. For those individually significant loans where it is determined that it is not probable that the borrower will make all payments in accordance with the original loan agreement, we perform an impairment analysis. The measurement of impaired loans is based on either the fair value of the underlying collateral, the present value of the future cash flows discounted at the historical effective interest rate stipulated in the loan agreement, or the estimated market value of the loan.
Other classified loans are categorized and allocated appropriate reserves. We also reserve for other loans more than 90 days past due that were not considered in the aforementioned procedures. We segregate the remaining portfolio into consumer, commercial and residential real estate loans, and apply the historical net charge off percentage of each category to the current amount outstanding in those categories. Additionally, as part of this analysis we include such factors as concentrations of credit, collateral deficient loans, volume and trends in delinquencies, loan portfolio composition, loan volume and maturity of the portfolio, national and local economic conditions and the experience, ability and depth of lending management and staff.
Pensions
We have a defined benefit pension plan covering substantially all employees with at least nine months of service who are at least 20½ years of age. Pension expense is determined by an actuarial valuation based on assumptions that are evaluated annually as of December 31, the measurement date for pension obligations. The most significant assumptions are the long-term expected rate of return on plan assets, the discount rate used to determine the present value of the pension obligations, and the weighted-average rate of expected increase in future compensation levels. We review these assumptions with the plan actuaries and modify them as necessary to reflect current market conditions as well as anticipated long-term market conditions.
Page 4 First Century Bankshares, Inc.
Table of Contents
Balance Sheet Analysis
Loans
AMOUNTS OF LOANS OUTSTANDING
| December 31, | |||||||||||||||
| 2009 | 2008 | 2007 | 2006 | 2005 | |||||||||||
| (Dollars in Thousands) | |||||||||||||||
| Commercial, financial and agricultural |
$ | 39,798 | $ | 44,966 | $ | 46,599 | $ | 49,111 | $ | 44,721 | |||||
| Real estate–construction and development |
17,051 | 25,074 | 18,339 | 8,832 | 11,654 | ||||||||||
| Real estate–mortgage |
208,570 | 204,686 | 209,221 | 213,185 | 181,551 | ||||||||||
| Installment loans to individuals |
20,947 | 21,894 | 22,787 | 21,515 | 19,806 | ||||||||||
| TOTAL LOANS OUTSTANDING |
$ | 286,366 | $ | 296,620 | $ | 296,946 | $ | 292,643 | $ | 257,732 | |||||
MATURITY SCHEDULE OF LOANS
| Remaining maturity at December 31, 2009 | ||||||||||||
| (Dollars in Thousands) | ||||||||||||
| 1 Year or Less |
1 to 5 Years |
After 5 Years |
Total | |||||||||
| Commercial, financial and agricultural |
$ | 29,689 | $ | 7,662 | $ | 2,447 | $ | 39,798 | ||||
| Real estate–construction and development |
12,501 | 3,046 | 1,504 | 17,051 | ||||||||
| Real estate–mortgage |
38,879 | 99,177 | 70,514 | 208,570 | ||||||||
| Installment loans to individuals |
2,954 | 14,900 | 3,093 | 20,947 | ||||||||
| TOTAL |
$ | 84,023 | $ | 124,785 | $ | 77,558 | $ | 286,366 | ||||
| With predetermined interest rates |
$ | 62,180 | $ | 114,907 | $ | 48,119 | $ | 225,206 | ||||
| With floating interest rates |
21,843 | 9,878 | 29,439 | 61,160 | ||||||||
| TOTAL |
$ | 84,023 | $ | 124,785 | $ | 77,558 | $ | 286,366 | ||||
Our primary goal is to meet the credit needs of the retail and commercial customers in our primary markets of southern West Virginia and southwestern Virginia. Total loans decreased approximately $10,254,000, or 3.5%, in 2009, following a 0.1% decrease of $326,000 in 2008. Competition in our market is very aggressive for the acquisition of new loans as new, quality loan opportunities are not prevalent. Our participation loan portfolio of approximately $44,000,000 remained level for the year. However, loan demand was down during 2009 in all of our local markets. We continued to adhere to our philosophy of not retaining long-term fixed-rate commitments in order to better manage our interest rate risk. In order to provide consumers with a long term option for home financing, we originate and sell mortgages to the Federal National Mortgage Association (Fannie Mae). During 2009 we originated and sold approximately $50,281,000 in long-term mortgages, which was higher than our traditional production, due to the low interest rate environment. At December 31, 2009, the loan portfolio comprised 76.3% of total interest-earning assets as compared to 75.3% of total interest-earning assets at December 31, 2008, and contributed 81.9% of total interest income in 2009, and 78.8% in 2008.
During 2009, our emphasis continued to be on strong, small to mid-sized companies with known management and excellent financial stability. Most of the commercial loans in the portfolio have variable rates of interest. Additionally, we continued to make loans available in our expanded retail marketplace. We also continued to develop relationships with other
First Century Bankshares, Inc. Page 5
Table of Contents
community banks to seek loan participation opportunities outside of our existing footprint. Consistent with our philosophy on relationship banking, most of our borrowers are also depositors and utilize other banking services. The average yield of the loan portfolio decreased to an average rate of 5.45% in 2009 compared to 6.19% in 2008. Earnings reflect pressure on the net interest margin arising from the rapid reduction in interest rates by the Federal Reserve near the end of 2008 that resulted in lower interest income from our variable rate loans. Additionally, during 2009 we implemented interest rate floors in pricing our variable rate loans in order to establish a baseline of income from any given loan.
Our commercial loan portfolio is generally diversified and geographically dispersed within the region. At December 31, 2009, we had concentrations of $21,258,000, or 53.9% of stockholders’ equity in loans to lessors of residential property, $18,529,000, or 47.0% of stockholders’ equity in loans to lessors of nonresidential property and $11,711,000, or 29.7% of stockholders’ equity in loans to land subdividers and developers. These concentrations are diversified by geography throughout the Mid-Atlantic region. There are no other concentrations of lines of business or industry that represent greater than 25% of stockholders’ equity. Within each specific industry, our borrowers are diversified as to specialty, service or other unique feature of the overall industry. A substantial portion of our customers’ ability to honor their contractual commitment is largely dependent upon the economic health of the respective industry within the overall economic environment of southern West Virginia and southwestern Virginia, which traditionally has been less volatile than many areas of the country. During 2009, our local markets began to see negative effects of the national economy, particularly in the consumer housing markets.
The consumer portion of our loan portfolio consists of both secured and unsecured loans made to individuals and families for various reasons including the purchase of automobiles, home improvements, educational expenses and other worthwhile purposes. We continue to carefully monitor the consumer sector during this period of economic downturn. Rising unemployment and a deepening recession will usually result in higher delinquency rates and other deterioration in this sector. Recent national trends in delinquency and foreclosures do not appear to be as prevalent in our markets as in some other parts of the country. However, we continue to monitor this sector and the local residential housing sector for indications of further deterioration.
Commitments to extend credit are agreements to lend to a customer provided there is no violation of any condition established in the contract. Commitments generally have fixed expiration dates or other termination clauses and may require the payment of a fee. Since many of the commitments are expected to expire without being drawn upon, the total amount of commitments does not necessarily represent future cash requirements. We had outstanding commitments to extend credit of approximately $49,883,000 at December 31, 2009, and $52,623,000 at December 31, 2008. This included $9,284,000 and $9,525,000 of commitments at December 31, 2009 and 2008, respectively, for our overdraft protection product. This also included unfunded loan commitments and unused lines of credit totaling $36,326,000 at December 31, 2009 and $38,661,000 at December 31, 2008. Additionally, standby letters of credit totaled $4,273,000 at December 31, 2009, and $4,437,000 at December 31, 2008. Financial standby letters of credit are conditional commitments that we issue to guarantee the financial performance of a customer to a third party. Those guarantees are primarily used to support public and private borrowing arrangements.
Page 6 First Century Bankshares, Inc.
Table of Contents
The following table details the amount and expected maturities of significant commitments as of December 31, 2009. Further discussion of these commitments is included in Notes 13 and 14 to the Consolidated Financial Statements.
COMMITMENTS
| One Year or Less |
One to Years |
Three to Years |
Over Five Years |
Total | |||||||||||
| Unused lines of credit | (Dollars in Thousands) | ||||||||||||||
| Home equity lines |
$ | 91 | $ | 147 | $ | 628 | $ | 3,232 | $ | 4,098 | |||||
| Commercial real estate, construction and |
16,494 | 132 | 869 | 3,615 | 21,110 | ||||||||||
| Other unused commitments |
20,402 | — | — | — | 20,402 | ||||||||||
| Financial standby letters of credit |
4,273 | — | — | — | 4,273 | ||||||||||
NONPERFORMING ASSETS AND LOAN LOSS ANALYSIS
| Years Ended December 31, | ||||||||||||||||||||
| 2009 | 2008 | 2007 | 2006 | 2005 | ||||||||||||||||
| (Dollars in Thousands) | ||||||||||||||||||||
| Average amount of loans outstanding |
$ | 296,398 | $ | 290,928 | $ | 295,451 | $ | 274,300 | $ | 253,621 | ||||||||||
| Allowance for loan losses: |
||||||||||||||||||||
| Balance at beginning of the year |
2,690 | 2,455 | 2,555 | 2,661 | 2,900 | |||||||||||||||
| Loans charged off |
||||||||||||||||||||
| Commercial, financial and agricultural |
3,038 | — | 12 | 111 | 105 | |||||||||||||||
| Real estate–construction and development |
310 | — | 92 | — | — | |||||||||||||||
| Real estate–mortgage |
302 | 113 | 33 | 132 | 424 | |||||||||||||||
| Installment loans to individuals |
296 | 302 | 283 | 342 | 232 | |||||||||||||||
| TOTAL LOANS CHARGED OFF |
3,946 | 415 | 420 | 585 | 761 | |||||||||||||||
| Loan recoveries |
||||||||||||||||||||
| Commercial, financial and agricultural |
— | 45 | — | 40 | 15 | |||||||||||||||
| Real estate–mortgage |
48 | 78 | 64 | 244 | 40 | |||||||||||||||
| Installment loans to individuals |
73 | 78 | 90 | 115 | 33 | |||||||||||||||
| TOTAL LOAN RECOVERIES |
121 | 201 | 154 | 399 | 88 | |||||||||||||||
| Net loans charged off |
(3,825 | ) | (214 | ) | (266 | ) | (186 | ) | (673 | ) | ||||||||||
| Provision for loan losses |
5,460 | 449 | |
166 |
|
80 | 434 | |||||||||||||
| BALANCE AT END OF THE YEAR |
$ | 4,325 | $ | 2,690 | $ | 2,455 | $ | 2,555 | $ | 2,661 | ||||||||||
| Ratio of net loans charged off to average loans outstanding |
1.29 | % | 0.07 | % | 0.09 | % | 0.07 | % | 0.27 | % | ||||||||||
| Provision for loan losses as a percent of loans |
1.84 | % | 0.15 | % | 0.06 | % | 0.03 | % | 0.17 | % | ||||||||||
| Allowance at year end as a percent of loans |
1.51 | % | 0.91 | % | 0.83 | % | 0.87 | % | 1.03 | % | ||||||||||
| Nonperforming assets (at year end) |
||||||||||||||||||||
| Nonaccrual |
$ | 6,780 | $ | 5,614 | $ | 1,211 | $ | 1,605 | $ | 2,173 | ||||||||||
| Past–due ninety days or more and still accruing |
1,461 | 553 | 711 | 397 | 517 | |||||||||||||||
| Troubled debt restructurings |
989 | 311 | 198 | 272 | 133 | |||||||||||||||
| Other real estate owned |
2,578 | 203 | 135 | 517 | 316 | |||||||||||||||
| TOTAL NONPERFORMING ASSETS |
$ | 11,808 | $ | 6,681 | $ | 2,255 | $ | 2,791 | $ | 3,139 | ||||||||||
| Nonperforming assets/total loans |
4.1 | % | 2.3 | % | 0.8 | % | 1.0 | % | 1.2 | % | ||||||||||
| Nonperforming assets/total assets |
2.9 | % | 1.6 | % | 0.5 | % | 0.7 | % | 0.8 | % | ||||||||||
ALLOCATION OF THE ALLOWANCE FOR LOAN LOSSES
| 2009 | 2008 | 2007 | 2006 | 2005 | ||||||||||||||||||||||||||
| (Dollars in Thousands) | ||||||||||||||||||||||||||||||
| Amount | Percent of Loans in Each Category to Total Loans |
Amount | Percent of Loans in Each Category to Total Loans |
Amount |
Percent of Loans in Each Category to Total Loans |
Amount | Percent of Loans in Each Category to Total Loans |
Amount | Percent of Loans in Each Category to Total Loans |
|||||||||||||||||||||
| Commercial, financial and agricultural |
$ | 752 | 13.90 | % | $ | 463 | 15.16 | % | $ | 523 | 15.69 | % | $ | 569 | 16.78 | % | $ | 495 | 17.35 | % | ||||||||||
| Real estate–construction and development |
939 | 5.95 | % | 382 | 8.45 | % |
|
76 |
6.18 |
% |
|
19 |
3.02 |
% |
|
15 |
4.52 |
% | ||||||||||||
| Real estate–mortgage |
2,094 | 72.83 | % | 1,402 | 69.01 | % | 1,471 | 70.46 | % | 1,463 | 72.85 | % | 1,422 | 70.45 | % | |||||||||||||||
| Installment loans to individuals |
508 | 7.32 | % | 426 | 7.38 | % | 348 | 7.67 | % | 361 | 7.35 | % | 484 | 7.68 | % | |||||||||||||||
| Unallocated |
32 | N/A | 17 | N/A | 37 | N/A | 143 | N/A | 245 | N/A | ||||||||||||||||||||
| TOTAL |
$ | 4,325 | 100.00 | % | $ | 2,690 | 100.00 | % | $ | 2,455 | 100.00 | % | $ | 2,555 | 100.00 | % | $ | 2,661 | 100.00 | % | ||||||||||
First Century Bankshares, Inc. Page 7
Table of Contents
Nonperforming assets, including nonaccrual loans, loans past-due 90 days or more, restructured loans and other real estate owned, increased $5,127,000, or 76.7%, from December 31, 2008 to December 31, 2009, following an increase of $4,426,000, or 196.3% for 2008. Nonperforming assets as a percentage of total assets increased from 1.6% at December 31, 2008 to 2.9% at December 31, 2009. The increase in nonperforming assets during 2009 underscores management’s concerns that the deteriorating national economy is having a negative impact on the Company’s local markets which had been insulated from many of the factors that resulted in higher unemployment and overall credit deterioration in other parts of the country. We continue to monitor our loan portfolio in light of recent declining economic conditions. Management is focusing efforts to evaluate the Company’s commercial real estate exposure to determine the potential impact on future earnings should conditions in this sector continue to deteriorate.
The increase in nonperforming assets also reflects efforts we made to more timely identify problem credits. Our policy is to discontinue the accrual of interest on loans that are past due more than 90 days, unless those loans are well collateralized and in process of collection. We may also classify loans that are on a current payment status or past due less than 90 days as nonaccrual if the repayment of principal or interest is in doubt. Nonaccrual loans were $6,780,000 at December 31, 2009, compared with $5,614,000 at December 31, 2008. Our holdings of other real estate owned increased to $2,578,000 at December 31, 2009, compared with $203,000 at December 31, 2008. This increase was primarily due to the acquisition of a group of convenience store properties from one borrower totaling $1,892,000. Other real estate owned is recorded at fair value less estimated selling costs.
We maintain an allowance for loan losses that we believe to be adequate to absorb probable credit losses inherent in the portfolio. We are committed to the early recognition of problem loans, and to an appropriate and adequate level of allowance. During 2009, we monitored our loan portfolio with enhanced scrutiny in order to identify potential deterioration. The allowance for loan losses was 1.51% of year-end loans at December 31, 2009 and 0.91% at December 31, 2008. The estimation of the adequacy of the allowance for loan losses is the most significant estimate that we determine. Different amounts could result under different conditions or assumptions.
We use an independent third-party firm to enhance our loan review function. This process includes a thorough evaluation of our credit administration systems and personnel. The objective is to have an effective loan review system that provides us with information that will produce a more focused and effective approach in managing credit risk inherent in the loan portfolio. As a part of this process, we use a system of loan grades to further support the adequacy of the loan loss allowance. Loans are categorized into one of nine loan grades with grades 1 through 5 representing various levels of acceptable loans and grades 6 through 9 representing various levels of credit deterioration.
In addition to the review of credit quality through the credit review process, we construct a comprehensive allowance analysis for the loan portfolio at least quarterly. The procedures that we use entail preparation of a loan “watch” list and assigning each loan a classification. We perform an impairment analysis for those individually significant loans where it is determined that it is not probable that the borrower will make all payments in accordance with the original loan agreement. Specific reserves are recorded on impaired loans of $279,000 and $186,000 at December 31, 2009 and 2008, respectively. Other classified loans are categorized and allocated appropriate reserves. Other loans more than 90 days
Page 8 First Century Bankshares, Inc.
Table of Contents
past due that have not been considered in these procedures are assigned a classification of Substandard and are reserved for accordingly.
We segregate the remaining portfolio into consumer, commercial, commercial real estate, both owner and nonowner occupied, and residential real estate loans. The historical net charge off percentage of each category is applied to the current amount outstanding in that category. Also, we review concentrations of credit, classes of loans and pledged collateral to determine the existence of any deterioration. In addition, we consider volume and trends in delinquencies and nonaccrual loans, the loan portfolio composition, loan volume and maturity of the portfolio, national and local economic conditions and the experience, ability and depth of our lending management and staff.
Our methodology used to determine an estimate for the reserve for unfunded lending commitments is inherently similar to the methodology used in calculating the allowance for loan losses adjusted for factors specific to binding commitments, including the probability of funding and exposure at the time of funding. The reserve for unfunded lending commitments is included in other liabilities with increases or decreases included in noninterest expense. The reserve for unfunded lending commitments was $10,000 at December 31, 2009 and 2008, respectively. Estimates may change at some point in the future.
Securities
SECURITIES
The following table shows the carrying values of securities at the respective periods, which is fair value for available for sale securities and amortized cost for securities held to maturity:
| December 31, | |||||||||
| 2009 | 2008 | 2007 | |||||||
| (Dollars in Thousands) | |||||||||
| Securities available for sale: |
|||||||||
| U.S. Government securities |
$ | — | $ | — | $ | 1,009 | |||
| U. S. Government agency securities |
35,638 | 42,004 | 63,195 | ||||||
| U. S. Government agency mortgage-backed securities |
25,202 | 29,878 | 16,588 | ||||||
| Other securities |
— | 967 | 1,971 | ||||||
| TOTAL SECURITIES AVAILABLE FOR SALE |
$ | 60,840 | $ | 72,849 | $ | 82,763 | |||
| Securities held to maturity: |
|||||||||
| State, county and municipal securities |
$ | 19,076 | $ | 17,286 | $ | 18,156 | |||
| TOTAL SECURITIES HELD TO MATURITY |
$ | 19,076 | $ | 17,286 | $ | 18,156 | |||
MATURITIES OF SECURITIES
The following table shows the contractual maturities of debt securities at December 31, 2009 and the weighted average yields of such securities:
| Within One Year |
After One But Within Five Years |
After Five But Within Ten Years |
After Ten Years | Total | ||||||||||||||||||||||||||
| Amount | Yield | Amount | Yield | Amount | Yield | Amount | Yield | Amount | Yield | |||||||||||||||||||||
| (Dollars in Thousands) | ||||||||||||||||||||||||||||||
| Securities available for sale: |
||||||||||||||||||||||||||||||
| U. S. Government agency securities |
$ | 2,021 | 4.03 | % | $ | 22,138 | 3.34 | % | $ | 11,479 | 3.30 | % | $ | — | 0.00 | % | $ | 35,638 | 3.37 | % | ||||||||||
| U. S. Government agency mortgage-backed securities |
— | 0.00 | % | 4,159 | 4.86 | % | 12,741 | 4.35 | % | 8,302 | 4.33 | % | 25,202 | 4.43 | % | |||||||||||||||
| TOTAL SECURITIES AVAILABLE FOR SALE |
$ | 2,021 | 4.03 | % | $ | 26,297 | 3.58 | % | $ | 24,220 | 3.85 | % | $ | 8,302 | 4.33 | % | $ | 60,840 | 3.81 | % | ||||||||||
| Securities held to maturity: |
||||||||||||||||||||||||||||||
| State, county and municipal securities |
$ | 1,270 | 6.89 | % | $ | 6,410 | 6.03 | % | $ | 6,234 | 5.58 | % | $ | 5,162 | 6.04 | % | $ | 19,076 | 5.94 | % | ||||||||||
| TOTAL SECURITIES HELD TO MATURITY |
$ | 1,270 | 6.89 | % | $ | 6,410 | 6.03 | % | $ | 6,234 | 5.58 | % | $ | 5,162 | 6.04 | % | $ | 19,076 | 5.94 | % | ||||||||||
Yields on tax-exempt obligations have been computed based on tax equivalent yield.
First Century Bankshares, Inc. Page 9
Table of Contents
During 2009, securities, our second largest category of assets, decreased by $10,219,000 or 11.3%. At December 31, 2009, securities comprised 21.3% of total interest-earning assets compared to 22.9% of total interest-earning assets at December 31, 2008. The composition of our securities portfolio reflects our investment strategy of maximizing portfolio yields subject to risk and liquidity considerations. The primary objective of our investment strategy is to maintain an appropriate level of asset liquidity and provide us with a tool to assist in controlling and managing our interest rate position while at the same time producing appropriate levels of interest income. In order to maintain liquidity and flexibility, we categorize most investments in the available for sale portfolio. We typically purchase U.S. Government agency securities in order to maintain the maximum liquidity of the portfolio. We have not purchased any of the preferred stocks or private label mortgage products that have resulted in impairment charges for other financial companies. We believe that the potential for increased loan demand as we expand our market footprint requires maintaining adequate liquidity in the securities portfolio.
The remaining securities, primarily state, county and municipal obligations comprise the held to maturity portfolio. Net unrealized gains in the held to maturity portfolio amounted to approximately $340,000 at December 31, 2009, compared to $158,000 at December 31, 2008. The held to maturity portfolio increased to $19,076,000 at December 31, 2009, from $17,286,000 at December 31, 2008. State and municipal securities contained no individual issues in excess of 10% of stockholders’ equity.
Net gains of $138,000 were recognized in 2009 from the sale of available for sale securities. For much of 2009, the Federal Reserve purchased agency mortgage backed securities as part of its economic stimulus efforts. This resulted in prices for these securities being artificially high compared to more normalized pricing. When the Federal Reserve announced in December of 2009 that it would be stopping this program in 2010, we sold a limited number of agency mortgage backed securities in order to retain some of these higher prices. No gains or losses were realized from the sale of securities in 2008.
At December 31, 2009, we held no investments having continuous unrealized loss positions for more than 12 months. We did not recognize any other-than-temporary impairment in 2009 or 2008.
Deposits
Deposits, our major source of funds, decreased approximately $7,711,000 in 2009, following a decrease of $4,724,000 in 2008. Noninterest-bearing deposits decreased $8,050,000 in 2009, following an increase of $8,693,000 in 2008. This decrease in noninterest-bearing deposits demonstrates the effect of normal fluctuations within our commercial depositor base. The average rate paid on interest-bearing deposits in 2009 was 1.51% and 2.38% in 2008. Strong competition for deposits exists in our primary market among commercial banks, savings banks, thrift institutions, credit unions, mutual funds, brokerage houses, insurance companies, and certain national retailers. Despite this intense competition, we continue to evaluate pricing strategies that will insure the long-term benefit of maintaining market share without sacrificing profitability.
Page 10 First Century Bankshares, Inc.
Table of Contents
AVERAGE DEPOSITS
| 2009 Average |
2008 Average |
2007 Average | ||||||||||||
| Amount | Rate | Amount | Rate | Amount | Rate | |||||||||
| (Dollars in Thousands) | ||||||||||||||
| Noninterest–bearing demand deposits |
$ | 52,176 | N/A | $ | 54,288 | N/A | $45,794 | N/A | ||||||
| Interest–bearing demand deposits |
80,032 | 0.20% | 75,056 | 0.40% | 73,923 | 0.82% | ||||||||
| Savings deposits |
56,363 | 0.27% | 56,026 | 0.64% | 56,156 | 1.06% | ||||||||
| Time deposits |
172,108 | 2.52% | 183,041 | 3.73% | 190,391 | 4.52% | ||||||||
| TOTAL AVERAGE DEPOSITS |
$ | 360,679 | 1.29% | $ | 368,411 | 2.03% | $366,264 | 2.68% | ||||||
There are no foreign offices. Average balances are computed on daily balances.
MATURITIES OF TIME CERTIFICATES OF DEPOSIT OF $100,000 OR MORE
| December 31, 2009 | |||
| (Dollars in Thousands) | |||
| Under 3 months |
$ | 17,060 | |
| 3 to 6 months |
12,625 | ||
| 6 to 12 months |
14,915 | ||
| Over 12 months |
8,378 | ||
| TOTAL CERTIFICATES OF DEPOSIT OF $100,000 OR MORE |
$ | 52,978 | |
SHORT-TERM BORROWED FUNDS
| December 31, | |||||||||
| 2009 | 2008 | 2007 | |||||||
| (Dollars in Thousands) | |||||||||
| Federal funds purchased and securities sold under agreements to repurchase |
$ | 15,241 | $ | 22,632 | $ | 27,682 | |||
| Other borrowed funds |
26 | 26 | 26 | ||||||
| TOTAL BORROWED FUNDS |
$ | 15,267 | $ | 22,658 | $ | 27,708 | |||
The approximate average interest rates, average amounts outstanding, and maximum amounts outstanding at any month-end for federal funds purchased and securities sold under agreements to repurchase are as follows:
| 2009 | 2008 | 2007 | |||||||
| (Dollars in Thousands) | |||||||||
| Average interest rates at December 31 |
1.71% | 1.25% | 3.38% | ||||||
| Maximum amounts outstanding at any month-end |
$ | 22,546 | $ | 24,778 | $ | 27,682 | |||
| Average daily amount outstanding |
$ | 20,601 | $ | 21,534 | $ | 18,177 | |||
| Weighted average interest rates |
1.34% | 1.58% | 3.58% | ||||||
The weighted average interest rates are calculated by dividing the annual interest expense by the related average daily amounts outstanding.
Capital Resources
We decreased the total per share dividend for 2009 to $0.96 per share from the $1.11 per share paid in 2008. Cash dividends paid to stockholders during 2009 totaled $1,827,000 and $2,116,000 in 2008. For the fourth quarter of 2009, we reduced the regular dividend to $0.15 per share from the previous level of $0.27 per share. This was a reflection of the lower earnings environment for the quarter and the decline in trading prices for our stock.
We are dependent upon dividends paid by FCBNA to fund dividends to the stockholders and to cover other operating costs. Our board of directors considers historical financial performance, future prospects, and anticipated needs for capital in formulating the divi -
First Century Bankshares, Inc. Page 11
Table of Contents
dend payment policy. Future dividends are dependent upon our financial results, capital requirements and general economic conditions.
One of our primary objectives is to maintain a strong capital position. Stockholders’ equity decreased $1,909,000 or 4.6% in 2009. This decrease resulted primarily from a decrease in retained earnings of $1,512,000. Additionally, during 2009 we did not repurchase any treasury shares through our stock repurchase program. At December 31, 2009, we had approval to repurchase 9,572 shares of the Corporation’s common stock. We will continue to evaluate capital utilization to provide the most long-term value for our shareholders.
Risk-based capital regulations require all banks and bank holding companies to have a minimum total risk-based capital ratio of 8% with half of the capital composed of core capital. Conceptually, risk-based capital requirements assess the risk of a financial institution’s balance sheet and off-balance sheet commitments in relation to its capital. Under the guidelines, capital strength is measured in two tiers which are used in conjunction with risk adjusted assets in determining the risk-based capital ratios. Our Tier I capital, which consists of stockholders’ equity, adjusted for certain intangible assets, amounted to $36,790,000 at December 31, 2009, or 12.31% of total risk-weighted assets, compared to $38,143,000 at December 31, 2008, or 12.42% of total risk-weighted assets. Tier II capital, or supplementary capital, includes capital components such as qualifying allowance for loan losses, and can equal up to 100% of an institution’s Tier I capital with certain limitations. Our Tier II capital amounted to $3,734,000 at December 31, 2009, or 1.25% of total risk-weighted assets, compared to $2,700,000 at December 31, 2008, or 0.88% of total risk-weighted assets. Our total consolidated risk-based capital was $40,524,000 at December 31, 2009, or 13.56% of total risk-weighted assets, compared to $40,843,000, or 13.30% of total risk-weighted assets as of December 31, 2008. Additionally, risk-based capital guidelines require that we maintain a minimum leverage ratio (Tier I capital divided by average adjusted total consolidated assets) of 4%, which may be increased for institutions with higher levels of risk or that are experiencing or anticipating significant growth. We have not been advised by any regulatory agency of any additional specific minimum leverage ratio applicable to us. As of December 31, 2009 and 2008, the Corporation’s leverage ratio was 8.92% and 8.93% respectively; therefore, we exceeded all current minimum capital requirements.
As a result of the strong capital position of the Corporation, along with other general concerns for government intervention in the day-to-day operations of the Corporation, we chose to not participate in the U.S. Government’s Treasury Asset Repurchase Program (TARP) or the Capital Purchase Program (CPP).
Page 12 First Century Bankshares, Inc.
Table of Contents
Asset and Liability Management and Interest Rate Sensitivity
Our income stream is subject to risk resulting from interest rate fluctuations to the extent there is a difference between the amount of our interest-earning assets and the amount of our interest-bearing liabilities that are prepaid, withdrawn, mature or reprice in specified periods. The goal of asset and liability management is to maintain high quality and consistent growth of net interest income with acceptable levels of risk to changes in interest rates.
Interest rate sensitivity varies with different types of interest-earning assets and interest-bearing liabilities. Overnight federal funds, on which rates change daily, and loans that are tied to the prime rate differ considerably from long-term securities and fixed rate loans. Similarly, time deposits of $100,000 and over, NOW accounts and money market deposit accounts are much more interest rate sensitive than passbook savings accounts and other interest-bearing liabilities. We use a number of tools to measure interest rate risk, including simulating net interest income under various rate scenarios, monitoring the change in present value of the asset and liability portfolios under the same rate scenarios and monitoring the difference or gap between rate sensitive assets and liabilities over various time periods.
We have traditionally priced our commercial loans with variable rates tied to the prime rate of interest. With the dramatic reduction in the prime rate at the end of 2008, we implemented interest rate floors during 2009 on new and renewed commercial loans. This allowed us to retain a portion of our interest income, but will delay the repricing opportunities for these loans until the prime rate rises above the floor rates on the loans. Also, with the potential for rising interest rates, our customers are requesting fixed rate commitments for new and renewed loans. See the Analysis of Interest Rate Sensitivity Table for more information regarding our risk to changes in interest rates.
We continue to monitor asset/liability gap positions, while incorporating more sophisticated risk measurement tools, including simulation modeling which calculates expected net interest income based on projected interest-earning assets, interest-bearing liabilities and interest rates. Using simulation modeling allows us to evaluate earnings and capital at risk due to significant changes in interest rates. We monitor exposure to the effect of an instantaneous change in rates of 200 basis points up or down over the same period. As of December 31, 2009 and 2008, simulation indicated the impact of a 200 basis point increase in rates would result in an increase in net interest income of 4.9% and 6.2%, respectively. A 200 basis point decline in rates would result in a decrease in net interest income from an unchanged rate environment of 9.0% and 10.4%, respectively, at December 31, 2009 and 2008. These changes fall within our policy limits for the maximum negative impact to net interest income from a change in interest rates. Because of the historically low interest rate environment, we also evaluate various scenarios to determine the impact of more significant changes in interest rates.
First Century Bankshares, Inc. Page 13
Table of Contents
ANALYSIS OF INTEREST RATE SENSITIVITY
An analysis of interest rate sensitivity as of December 31, 2009, is shown below.
| Months |
Years |
Totals | |||||||||||||||||
| Less Than 3 | 3 – 12 | 1 – 5 | Over 5 | ||||||||||||||||
| (Dollars in Thousands) | |||||||||||||||||||
| Investment securities |
$ | 1,362 | $ | 1,929 | $ | 31,113 | $ | 47,147 | $ | 81,551 | |||||||||
| Federal funds sold and interest-bearing |
7,425 | — | 0 | — | 7,425 | ||||||||||||||
| Loans |
119,908 | 56,272 | 94,282 | 15,904 | 286,366 | ||||||||||||||
| Interest-earning assets |
128,695 | 58,201 | 125,395 | 63,051 | 375,342 | ||||||||||||||
| Time deposits |
49,835 | 86,900 | 31,010 | — | 167,745 | ||||||||||||||
| Other interest-bearing deposits |
60,956 | 30,478 | 45,593 | — | 137,027 | ||||||||||||||
| Other interest-bearing liabilities |
10,110 | 131 | 5,000 | 26 | 15,267 | ||||||||||||||
| Interest-bearing liabilities |
120,901 | 117,509 | 81,603 | 26 | 320,039 | ||||||||||||||
| Interest sensitivity gap |
$ | 7,794 | $ | (59,308 | ) | $ | 43,792 | $ | 63,025 | $ | 55,303 | ||||||||
| Cumulative interest sensitivity gap |
$ | 7,794 | $ | (51,514 | ) | $ | (7,722 | ) | $ | 55,303 | |||||||||
| Ratio of interest-earning assets to |
1.06 | x | 0.50 | x | 1.54 | x | 2425.04 | x | |||||||||||
| Ratio of cumulative interest sensitivity |
2.08 | % | (13.72 | )% | (2.06 | )% | 14.73 | % | |||||||||||
Liquidity Management
Liquidity management involves our ability to meet the cash flow requirements of depositors wanting to withdraw funds or borrowers needing assurance that sufficient funds will be available to meet their credit needs. To ensure that we are positioned to meet immediate and future cash demands, we rely on liquidity analysis, knowledge of business trends over past economic cycles and forecasts of future conditions.
Liquidity can best be demonstrated by an analysis of cash flows. Our primary source of cash flows is from operating activities. Operating activities provided $4,389,000 of liquidity for the year ended December 31, 2009, compared to $5,215,000 in 2008. The principal elements of these operating flows are net income, increased for significant non-cash expenses for the provision for loan losses and depreciation and amortization.
In 2009, cash flows from financing activities decreased $16,929,000, primarily due to decreases in deposits of $7,711,000 and short-term borrowings of $7,391,000. We allowed for measured reductions in these items because of lower loan demand. We still maintained pricing structures to retain longer term customer relationships.
A secondary source of liquidity comes from investing activities, principally the maturities of investment securities. With the low interest rate environment during 2009, maturities and calls of investment securities were $50,282,000, compared to $56,656,000 in 2008. This rapid flow of liquidity allowed us to reallocate a portion of the available for sale portfolio into municipal securities which provided more relative value at various purchasing opportunities during the year. As of December 31, 2009, we had approximately $13,323,000 of investment securities that had scheduled maturities within 36 months. Payments from mortgage-backed securities in excess of this amount will provide additional cash flow for reinvestment.
Page 14 First Century Bankshares, Inc.
Table of Contents
We also have access to additional sources of liquidity through the Federal Reserve System, through our membership in the Federal Home Loan Bank system and through correspondent bank relationships. As of December 31, 2009, FCBNA had a maximum borrowing capacity exceeding $150,000,000 through the Federal Home Loan Bank of Pittsburgh. These funds can be made available with various maturities and interest rate structures. As a member, we are required to own stock in the Federal Home Loan Bank of Pittsburgh. The amount of stock we own is based on the amount of outstanding borrowings at any given point in time. Borrowings are also collateralized by a blanket lien by the Federal Home Loan Bank on its member’s qualifying assets. At December 31, 2009, FCBNA owned $1,252,500 of stock and had nothing outstanding on our overnight repo account. We had no other outstanding advances from the Federal Home Loan Bank of Pittsburgh as of December 31, 2009.
During 2009, our primary correspondent bank failed and was taken over by the FDIC. We were able to secure federal funds lines of credit from two other correspondent banks totaling $8,600,000 to replace the line that we had with the failed institution. We had a small equity position, carried at cost, in our previous correspondent of approximately $168,000 that we wrote off during 2009 through noninterest expense.
As a member of the Federal Reserve System, we have access to funding through the Federal Reserve Bank of Richmond. The Federal Reserve has traditionally required its members to exhaust other sources of liquidity before seeking advances, however, during 2008 and 2009 the Federal Reserve became more of a liquidity provider for the banking system. Any borrowings from the Federal Reserve Bank of Richmond would require us to pledge assets of FCBNA as collateral. We had no outstanding borrowings from the Federal Reserve Bank of Richmond at December 31, 2009.
Income Statement Analysis
Earnings Overview
Net income for the two years ended December 31, 2009 and 2008, was $315,000 and $3,685,000, respectively. On a per share basis, diluted net income was $0.17 in 2009 compared to $1.93 in 2008. Return on average equity was 0.76% in 2009 compared to 8.96% in 2008. Return on average assets for the year ended December 31, 2009 was 0.07% compared to 0.85% in 2008. Earnings for 2009 reflect the impact of the weakness in the national economy on the housing sector, requiring additional loan loss provisions, along with significant additional FDIC assessments during the year. Additionally, the further deterioration of a major credit facility resulted in a $2,750,000 specific charge off in the fourth quarter related to this loan. Core earnings of the bank remained relatively stable with the net interest margin as a percentage of average assets essentially unchanged from 2008.
A summary of the significant factors influencing our results of operations and related ratios is included in the following discussion.
Earnings Per Share
The Earnings Per Share Table summarizes the principal sources of changes in earnings per share for 2009. For further details on the computation of earnings per share, refer to Note 9 of the Notes to Consolidated Financial Statements, presented elsewhere in this report.
First Century Bankshares, Inc. Page 15
Table of Contents
EARNINGS PER SHARE
| Net income per share — 2008 |
$ | 1.93 | ||
| Increase (decrease) due to change in: |
||||
| Net interest income |
(.08 | ) | ||
| Provision for loan losses |
(1.89 | ) | ||
| Other operating income |
.22 | |||
| Personnel expense |
(.06 | ) | ||
| Other expense |
.05 | |||
| Net income per share — 2009 |
$ | 0.17 |
Net Interest Income
The major portion of our earnings is derived from net interest income, which is the interest income on interest-earning assets less the interest expense on interest-bearing liabilities. During 2009 net interest income decreased $235,000 or 1.6%. This followed an 8.2% decrease in 2008. Net interest income resulted in a net interest margin to earning assets ratio of 3.76% for 2009, compared with 3.75% for 2008.
For the year ended December 31, 2009, interest income decreased $3,127,000, or approximately 13.7%, compared to a decrease of $3,987,000, or 14.9% for 2008. Interest on loans decreased $1,857,000 or 10.3% during 2009. Interest on securities increased $1,041,000, or 22.8% for 2009, following an increase of 201,000, or 4.6% for 2008. Interest income reflects a yield on average earnings assets of 5.01% for 2009, compared with 5.69% for 2008.
The decrease in interest income was accompanied by a decrease in interest expense of $2,892,000 or 37.0% for 2009. This followed a decrease in interest expense of $2,649,000, or 25.3% for 2008. Interest expense reflects a cost on average interest-bearing liabilities of 1.50% for 2009, compared with 2.33% for 2008.
Net interest income is affected by many factors, but most significantly by the prevailing interest rates during the period, the spread between the various sources and uses of funds, and by changes in the volume of various assets and liabilities. Earnings reflect pressure on the net interest margin arising from the rapid reduction in interest rates by the Federal Reserve in 2008 that resulted in lower interest income from our variable rate loans. We did implement a pricing strategy that created interest floors on our variable rate loans. We are continuing this strategy as we have renewals and other opportunities to reprice loans. This reduction was not completely offset by lower interest expense as many certificates of deposit remained at previously higher rates, pending the opportunity to renew. Additionally, as previously mentioned, reinvestment opportunities in the investment portfolio were not readily available at comparable rates as the maturing or called security.
Provision for Loan Losses
The most significant impact on our earnings in 2009 was our provision for loan losses of $5,460,000. This was a $5,011,000 increase in the provision for loan losses from 2008. The provision for loan losses as a percentage of average loans was 1.84% for 2009, compared with 0.15% for 2008. Charge-offs increased $3,531,000 during 2009. As previously mentioned, we incurred a specific charge off of $2,750,000 related to one borrower that we
Page 16 First Century Bankshares, Inc.
Table of Contents
had been working with for several quarters while the borrower was attempting to bring a new product to market. When it became apparent that this effort was going to continue beyond our ability to forebear, we took the charge off and began more direct and aggressive collection efforts. Additionally, recoveries of previous charge-offs were down $80,000, or 39.8% in 2009. The ratio of net charge offs to average loans outstanding was 1.29% for 2009, compared with 0.07% for 2008. Additional reserves in excess of net charge-offs of $1,635,000 were added to the allowance for loan losses in 2009. This reflects further weakness in our borrowers’ abilities to manage through this economic downturn and the impact that has on our methodology in determining the adequacy of the allowance for loan losses.
Noninterest Income and Expense
Noninterest income net of securities gains and losses increased $499,000 or 10.4%, following an $8,000 or 0.2% increase in 2008. The largest component of noninterest income is service charges on deposit accounts. These fees increased approximately $77,000 or 4.2% in 2009, following a decrease of $40,000 or 2.1% in 2008. Fierce competition exists in our local markets for “free checking” type products. However, the income from our overdraft protection product grew during 2009 as customer usage increased and we increased our per occurrence fee slightly during the year. The second largest component of noninterest income is fees from fiduciary activities. Fees from fiduciary activities decreased $22,000, or 1.4%, during 2009 after being relatively flat in 2008. The fluctuations in fiduciary fees are attributed to the timing of the receipt of fees from estate settlements, growth of assets under management and changes in overall investment performance. We also experienced additional noninterest income from higher mortgage originations sold to Fannie Mae, and we recognized a gain of $279,000 from the previously mentioned resignation from Bankers Insurance Corporation.
Noninterest expense increased $895,000, or 6.5% in 2009, following a 1.4% decrease in 2008. The most significant increase in noninterest expense was for FDIC insurance premiums and special assessments. Our total expense for FDIC insurance was $890,000 in 2009 compared with $55,000 in 2008. We anticipate these higher levels of FDIC premiums for some time as the fund must rebuild its reserves due to the significant number of bank failures that occurred in 2009 and may continue for some time into the future. Personnel expense is the largest component of noninterest expense. Personnel expense increased 2.6% in 2009, following a decrease of 2.0% in 2008. All of the increase in personnel expense for 2009 is attributed to higher net periodic benefit cost associated with our defined benefit pension plan. For a complete discussion of our employee benefit programs, refer to Note 11 of the Notes to Consolidated Financial Statements, presented elsewhere in this report. Premises and equipment expense decreased 5.7% in 2009 as we did not establish any new branch facilities during the year or make any significant purchases of equipment in an effort to control overall expenses.
Income Taxes
With significantly lower earnings in 2009, our income tax provision resulted in a net tax benefit of $123,000 compared to income tax expense of $2,011,000 in 2008. This reflected an effective income tax rate of (64.1%) for 2009 and 35.3% for 2008. Income taxes computed at the statutory rate are reduced primarily by interest earned on state and municipal
First Century Bankshares, Inc. Page 17
Table of Contents
obligations. For a complete discussion of the Corporation’s tax position, refer to Note 12 of the Notes to Consolidated Financial Statements, presented elsewhere in this report.
RETURN ON EQUITY AND ASSETS
| December 31, | |||||||||
| 2009 | 2008 | 2007 | |||||||
| Percentage of net income to: |
|||||||||
| Average stockholders’ equity |
0.76 | % | 8.96 | % | 11.79 | % | |||
| Average total assets |
0.07 | % | 0.85 | % | 1.10 | % | |||
| Percentage of dividends declared per common share to net income per common share |
564.71 | % | 57.51 | % | 45.83 | % | |||
| Percentage of average stockholders’ equity to average total assets |
9.49 | % | 9.55 | % | 9.48 | % | |||
The Effects of Inflation and Changing Prices
Our company is affected by inflation in several ways, but not to the same extent as a company that makes large capital expenditures or has a large investment in inventory. Our asset and liability structure is primarily monetary in nature and, therefore, its financial results are more affected by changes in interest rates than by inflation. However, the actions of the Federal Reserve Board indicate that interest rate management will continue to be the primary tool used to curtail inflationary pressures. Inflation does affect our noninterest expense, such as personnel expense and the cost of services and supplies. These increases must be offset to the extent possible, by increases in noninterest income and by controlling noninterest expense.
Accounting, Legislative and Regulatory Matters
In June 2009, the Accounting Standards Codification (the “Codification”) became FASB’s officially recognized source of authoritative accounting principles for non-governmental entities in the preparation of financial statements in conformity with general accepted accounting principles. Rules and interpretive releases of the SEC under authority of federal securities laws are also sources of authoritative guidance for SEC registrants. All guidance contained in the Codification carries an equal level of authority. All non-grandfathered, non-SEC accounting literature not included in the codification is superseded and deemed non-authoritative. The “Codification” became effective for the financial statements ending September 30, 2009.
In April 2009, new authoritative guidance under FASB ASC Topic 820 “Fair Value Measurements and Disclosures” was issued. ASC Topic 820 affirms that the objective of fair value when the market for an asset is not active is the price that would be received to sell the asset in an orderly transaction, and clarifies and includes additional factors for determining whether there has been a significant decrease in market activity for an asset when the market for that asset is not active. ASC Topic 820 requires an entity to base its conclusion about whether a transaction was not orderly on the weight of the evidence. FASB ASC Topic 820 also amended prior guidance to expand certain disclosure requirements. The Company adopted the provisions of ASC Topic 820 as of June 30, 2009 and the adoption of ASC Topic 820 did not have a significant impact on the Company’s financial statements.
Page 18 First Century Bankshares, Inc.
Table of Contents
Further new authoritative guidance (Accounting Standards Updated No 2009-5) under ASC Topic 820 provides guidance for measuring the fair value of a liability in circumstances in which a quoted price in an active market for the identical liability is not available. In such instances, a reporting entity is required to measure fair value utilizing a valuation technique that uses (i) the quoted price of the identical liability when traded as an asset, (ii) quoted prices for similar liabilities or similar liabilities when traded as assets, or (iii) another valuation technique that is consistent with the existing principles of ASC Topic 820, such as an income approach or market approach. ASC Topic 820 also clarifies that when estimating the fair value of a liability, a reporting entity is not required to include a separate input or adjustment to other inputs relating to the existence of a restriction that prevents the transfer of the liability. ASC Topic 820 was effective for the Company’s financial statements beginning October 1, 2009 and did not have a significant impact on the Company’s financial statements.
In April 2009, new authoritative guidance under FASB ASC Topic 825 “Financial Instruments” was issued. ASC Topic 825 amends prior guidance to require an entity to provide disclosures about fair value of financial instruments in interim financial information and requires those disclosures in summarized financial information at interim reporting periods. Under ASC Topic 825, a publicly traded company shall include disclosures about the fair value of its financial instruments whenever it issues summarized financial information for interim reporting periods. In addition, entities must disclose, in the body or in the accompanying notes of its summarized financial information for interim reporting periods and in its financial statements for annual reporting periods, the fair value of all financial instruments for which it is practicable to estimate that value, whether recognized or not recognized in the statement of financial position, as required by ASC Topic 825.
In April 2009, new authoritative guidance under FASB ASC Topic 320 “Investments-Debt and Equity Securities” was issued. ASC Topic 320 (i) changes existing guidance for determining whether an impairment is other than temporary to debt securities and (ii) replaces the existing requirement that the entity’s management assert it has both the intent and ability to hold an impaired security until recovery with a requirement that management assert: (a) it does not have the intent to sell the security; and (b) it is more likely than not it will not have to sell the security before recovery of its cost basis. Under ASC Topic 320, declines in the fair value of held-to-maturity and available-for-sale securities below their cost that are deemed to be other than temporary are reflected in earnings as realized losses to the extent the impairment is related to credit losses. The amount of the impairment related to other factors is recognized in other comprehensive income. The Company adopted the provisions of ASC Topic 320 and the adoption did not have a material effect on the Company’s financial statements.
In May 2009, new authoritative guidance under FASB ASC Topic 855 “Subsequent Events” was issued. ASC Topic 855 establishes general standards of accounting for and disclosure of events that occur after the balance sheet date but before financial statements are issued or available to be issued. ASC Topic 855 defines (i) the period after the balance sheet date during which a reporting entity’s management should evaluate events or transactions that may occur for potential recognition or disclosure in the financial statements (ii) the circumstances under which an entity should recognize events or transactions occurring after the balance sheet date in its financial statements, and (iii) the disclosures an entity should make about events or transactions that occurred after the balance sheet date. ASC Topic 855 became effective for the Company during the second quarter of 2009 and did not have a significant impact on the Company’s financial statements.
First Century Bankshares, Inc. Page 19
Table of Contents
The Company evaluated subsequent events through the date on which the financial statements were issued. As a result, no subsequent events were recognized.
In August 2009, the FASB issued ASU 2009-05, “Measuring Liabilities at Fair Value”, to amend ASC Topic 820 to clarify how entities should estimate the fair value of liabilities. The amendments to this update include clarifying guidance for circumstances in which a quoted price in an active market is not available, the effect of the existence of liability transfer restrictions, and the effect of quoted prices for the identical liability, including when the identical liability is traded as an asset. The amended guidance on measuring liabilities at fair value is effective for the first interim or annual reporting period beginning after August 28, 2009. The Company is currently evaluating the impact that adoption of the amendments in this update will have on its consolidated financial statements.
In December 2009, the FASB issued ASU 2009-16, “Accounting for Transfers of Financial Assets”, to amend ASC Topic 860, “Transfers and Servicing”, for the issuance of FASB Statement No. 166, “Accounting for Transfers of Financial Assets—an amendment of FASB Statement No. 140.” The amendments in this update eliminate the exceptions for qualifying special-purpose entities from the consolidation guidance and the exception that permitted sale accounting for certain mortgage securitizations when a transferor has not surrendered control over the transferred financial assets. In addition, the amendments require enhanced disclosures about the risks that a transferor continues to be exposed to because of its continuing involvement in transferred financial assets. The amendments in this update are the result of FASB Statement No. 166 and are effective for annual reporting periods beginning after November 15, 2009 and interim and annual reporting periods thereafter. Adoption of the amendments in this update will have no impact on the Company’s financial position or results of operations.
In January 2010, the Financial Accounting Standards Board (“FASB”) issued Accounting Standards Update (“ASU”) 2010-06, “Improving Disclosures about Fair Value Measurements,” to amend FASB Accounting Standards Codification (“ASC”) Topic 820, “Fair Value Measurements and Disclosures.” The amendments in this update require more robust disclosures about (1) the different classes of assets and liabilities measured at fair value, (2) the valuation techniques and inputs used, (3) the activity in Level 3 fair value measurements, and (4) the transfers between Levels 1, 2, and 3. The new disclosures and clarifications of existing disclosures are effective for interim and annual reporting periods beginning December 15, 2009, except for the disclosures about purchases, sales, issuances, and settlements in the roll forward of activity in Level 3 fair value measurements. Those disclosures are effective for fiscal years beginning after December 15, 2010, and for interim periods within those fiscal years. Adoption of the amendments in this update will have no impact on the Company’s financial position or results of operations.
Other accounting standards that have been issued or proposed by the FASB or other standards-setting bodies are not expected to have a material impact on the Company’s financial position, results of operations and cash flows.
Per Share Data by Quarter
The common stock of the Corporation is quoted on the NASD OTC Bulletin Board under the trading symbol FCBS. The Per Share Data By Quarter Table shows the approximate high and
Page 20 First Century Bankshares, Inc.
Table of Contents
low bid as reported by the transfer agent and market makers for 2009 and 2008. Also presented below are the dividends paid for those respective years. The number of stockholders of record on December 31, 2009, was 451 and outstanding shares totaled 1,903,120.
PER SHARE DATA BY QUARTER
| Market Quotations | ||||||||||||||||||
| Dividends | 2009 | 2008 | ||||||||||||||||
| Quarter | 2009 | 2008 | High | Low | High | Low | ||||||||||||
| First Quarter |
$ | 0.27 | $ | 0.27 | $ | 18.50 | $ | 13.50 | $ | 25.75 | $ | 22.00 | ||||||
| Second Quarter |
0.27 | 0.27 | 15.95 | 12.50 | 23.90 | 18.50 | ||||||||||||
| Third Quarter |
0.27 | 0.27 | 19.99 | 15.25 | 21.00 | 18.60 | ||||||||||||
| Fourth Quarter |
0.15 | 0.30 | 17.34 | 13.70 | 19.75 | 14.70 | ||||||||||||
Trust Asset Responsibility
Assets managed by our Trust Division are presented in the graph below at market value. These assets are not included in the financial statements contained elsewhere in this report.
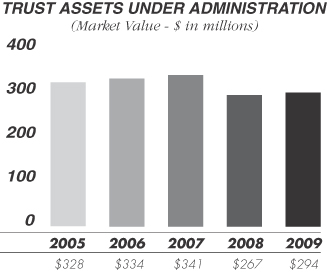
Trust account administration and investment management are linked through the talents of a skilled professional and support staff. Their education and experience through decades of service results in specialization in personal and retirement relationships, foundations, and charitable and endowment entities.
First Century Bankshares, Inc. Page 21
Table of Contents
CONDENSED STATEMENTS OF FINANCIAL CONDITION
Statistical Summary, 2009 — 2005
| December 31, | |||||||||||||||||||||||||||||||||||
| 2009 | % | 2008 | % | 2007 | % | 2006 | % | 2005 | % | ||||||||||||||||||||||||||
| (Dollars in Thousands, Except Per Share Data) | |||||||||||||||||||||||||||||||||||
| Loans |
$ | 286,366 | 70 | $ | 296,620 | 70 | $ | 296,946 | 68 | $ | 292,643 | 71 | $ | 257,732 | 66 | ||||||||||||||||||||
| Securities |
81,551 | 20 | 91,770 | 22 | 102,349 | 24 | 88,127 | 22 | 99,101 | 25 | |||||||||||||||||||||||||
| Federal funds sold |
4,600 | 1 | 3,500 | 1 | — | — | — | — | — | — | |||||||||||||||||||||||||
| Interest–bearing deposits with banks |
2,825 | 1 | 2,051 | — | 65 | — | 50 | — | 6 | — | |||||||||||||||||||||||||
| INTEREST-EARNING ASSETS |
375,342 | 92 | 393,941 | 93 | 399,360 | 92 | 380,820 | 93 | 356,839 | 91 | |||||||||||||||||||||||||
| Cash and due from banks |
9,917 | 2 | 10,908 | 3 | 13,462 | 3 | 10,162 | 2 | 14,293 | 4 | |||||||||||||||||||||||||
| Premises and equipment |
13,566 | 3 | 14,354 | 3 | 13,385 | 3 | 12,202 | 3 | 11,816 | 3 | |||||||||||||||||||||||||
| Other assets |
13,887 | 4 | 9,181 | 2 | 10,127 | 3 | 10,319 | 3 | 10,502 | 3 | |||||||||||||||||||||||||
| Allowance for loan losses |
(4,325 | ) | (1 | ) | (2,690 | ) | (1 | ) | (2,455 | ) | (1 | ) | (2,555 | ) | (1 | ) | (2,661 | ) | (1 | ) | |||||||||||||||
| TOTAL ASSETS |
$ | 408,387 | 100 | $ | 425,694 | 100 | $ | 433,879 | 100 | $ | 410,948 | 100 | $ | 390,789 | 100 | ||||||||||||||||||||
| Savings deposits |
$ | 137,027 | 33 | $ | 130,102 | 30 | $ | 126,653 | 29 | $ | 128,987 | 31 | $ | 137,415 | 35 | ||||||||||||||||||||
| Time deposits |
167,745 | 41 | 174,331 | 41 | 191,197 | 44 | 183,916 | 45 | 144,731 | 37 | |||||||||||||||||||||||||
| Other interest–bearing liabilities |
15,267 | 4 | 22,658 | 5 | 27,708 | 7 | 12,674 | 3 | 19,682 | 5 | |||||||||||||||||||||||||
| INTEREST-BEARING LIABILITIES |
320,039 | 78 | 327,091 | 76 | 345,558 | 80 | 325,577 | 79 | 301,828 | 77 | |||||||||||||||||||||||||
| Demand deposits |
45,548 | 11 | 53,598 | 13 | 44,905 | 10 | 44,452 | 11 | 50,645 | 13 | |||||||||||||||||||||||||
| Other liabilities |
3,344 | 1 | 3,640 | 1 | 3,011 | 1 | 2,487 | 1 | 2,363 | 1 | |||||||||||||||||||||||||
| TOTAL LIABILITIES |
368,931 | 90 | 384,329 | 90 | 393,474 | 91 | 372,516 | 91 | 354,836 | 91 | |||||||||||||||||||||||||
| STOCKHOLDERS’ EQUITY |
39,456 | 10 | 41,365 | 10 | 40,405 | 9 | 38,432 | 9 | 35,953 | 9 | |||||||||||||||||||||||||
| TOTAL LIABILITIES & EQUITY |
$ | 408,387 | 100 | $ | 425,694 | 100 | $ | 433,879 | 100 | $ | 410,948 | 100 | $ | 390,789 | 100 | ||||||||||||||||||||
| TOTAL DEPOSITS |
$ | 350,320 | $ | 358,031 | $ | 362,755 | $ | 357,355 | $ | 332,791 | |||||||||||||||||||||||||
| BOOK VALUE PER SHARE |
$ | 20.73 | $ | 21.74 | $ | 21.16 | $ | 19.58 | $ | 18.36 | |||||||||||||||||||||||||
SUMMARY OF OPERATIONS
Statistical Summary, 2009 — 2005
| Years Ended December 31, | ||||||||||||||||||||
| 2009 | 2008 | 2007 | 2006 | 2005 | ||||||||||||||||
| (Dollars in Thousands, Except Per Share Data) | ||||||||||||||||||||
| Interest income |
$ | 19,724 | $ | 22,851 | $ | 26,838 | $ | 24,193 | $ | 20,418 | ||||||||||
| Interest expense |
4,924 | 7,816 | 10,465 | 8,012 | 4,897 | |||||||||||||||
| NET INTEREST MARGIN |
14,800 | 15,035 | 16,373 | 16,181 | 15,521 | |||||||||||||||
| Provision for loan losses |
5,460 | 449 | 166 | 80 | 434 | |||||||||||||||
| Net credit margin |
9,340 | 14,586 | 16,207 | 16,101 | 15,087 | |||||||||||||||
| Noninterest income |
5,430 | 4,793 | 4,785 | 4,584 | 4,337 | |||||||||||||||
| Noninterest expense |
14,578 | 13,683 | 13,875 | 13,796 | 13,276 | |||||||||||||||
| INCOME BEFORE INCOME TAXES |
192 | 5,696 | 7,117 | 6,889 | 6,148 | |||||||||||||||
| Provision for income taxes |
(123 | ) | 2,011 | 2,429 | 2,400 | 2,144 | ||||||||||||||
| NET INCOME |
$ | 315 | $ | 3,685 | $ | 4,688 | $ | 4,489 | $ | 4,004 | ||||||||||
| EARNINGS PER COMMON SHARE: |
||||||||||||||||||||
| Basic |
$ | 0.17 | $ | 1.93 | $ | 2.40 | $ | 2.29 | $ | 2.03 | ||||||||||
| Diluted |
$ | 0.17 | $ | 1.93 | $ | 2.39 | $ | 2.28 | $ | 2.02 | ||||||||||
| Dividends per common share |
$ | 0.96 | $ | 1.11 | $ | 1.10 | $ | 1.05 | $ | 1.00 | ||||||||||
| Payout ratio |
565 | % | 58 | % | 46 | % | 46 | % | 49 | % | ||||||||||
Page 22 First Century Bankshares, Inc.
Table of Contents
| December 31, | ||||||||
| 2009 | 2008 | |||||||
| ASSETS | (Dollars in Thousands, Except Per Share Data) |
|||||||
| Cash and due from banks |
$ | 9,917 | $ | 10,908 | ||||
| Interest-bearing balances with banks |
2,825 | 2,051 | ||||||
| Federal funds sold |
4,600 | 3,500 | ||||||
| Securities available for sale |
60,840 | 72,849 | ||||||
| Securities held to maturity (estimated fair value of $19,416 in 2009 and $17,444 |
19,076 | 17,286 | ||||||
| Federal Home Loan Bank and Federal Reserve Bank Stock |
1,635 | 1,635 | ||||||
| Loans |
286,366 | 296,620 | ||||||
| Less allowance for loan losses |
4,325 | 2,690 | ||||||
| Net loans |
282,041 | 293,930 | ||||||
| Premises and equipment, net |
13,566 | 14,354 | ||||||
| Other real estate owned |
2,578 | 203 | ||||||
| Goodwill |
5,183 | 5,183 | ||||||
| Other assets |
6,126 | 3,795 | ||||||
| TOTAL ASSETS |
$ | 408,387 | $ | 425,694 | ||||
| LIABILITIES AND STOCKHOLDERS’ EQUITY |
||||||||
| Deposits: |
||||||||
| Noninterest-bearing |
$ | 45,548 | $ | 53,598 | ||||
| Interest-bearing |
304,772 | 304,433 | ||||||
| Total deposits |
350,320 | 358,031 | ||||||
| Short-term borrowings |
15,267 | 22,658 | ||||||
| Other liabilities |
3,344 | 3,640 | ||||||
| TOTAL LIABILITIES |
368,931 | 384,329 | ||||||
| Commitments and contingencies (see Notes 13 and 14) |
||||||||
| STOCKHOLDERS’ EQUITY |
||||||||
| Common stock - $1.25 par value; 10,000,000 shares authorized and |
2,500 | 2,500 | ||||||
| Paid-in capital |
757 | 757 | ||||||
| Retained earnings |
39,727 | 41,239 | ||||||
| Accumulated other comprehensive income (loss), net of tax |
(1,248 | ) | (851 | ) | ||||
| Treasury stock, at cost; 96,880 shares at December 31, 2009 and 2008 |
(2,280 | ) | (2,280 | ) | ||||
| TOTAL STOCKHOLDERS’ EQUITY |
39,456 | 41,365 | ||||||
| TOTAL LIABILITIES AND STOCKHOLDERS’ EQUITY |
$ | 408,387 | $ | 425,694 | ||||
The accompanying notes are an integral part of the consolidated financial statements.
Statements of Financial Condition
First Century Bankshares, Inc. Page 23
Table of Contents
Statements of Income
| Years Ended December 31, | |||||||
| 2009 | 2008 | ||||||
| INTEREST INCOME | (Dollars in Thousands, Except Per Share Data) | ||||||
| Interest and fees on loans |
$ | 16,151 | $ | 18,008 | |||
| Interest on balances with banks |
48 | 165 | |||||
| Interest and dividends from securities available for sale: |
|||||||
| Taxable |
2,810 | 3,870 | |||||
| Interest and dividends from securities held to maturity: |
|||||||
| Taxable |
27 | 54 | |||||
| Tax-exempt |
678 | 632 | |||||
| Interest on federal funds sold |
10 | 122 | |||||
| TOTAL INTEREST INCOME |
19,724 | 22,851 | |||||
| INTEREST EXPENSE |
|||||||
| Interest on time certificates of $100,000 or more |
1,193 | 1,772 | |||||
| Interest on other deposits |
3,453 | 5,703 | |||||
| Interest on federal funds purchased and securities |
275 | 336 | |||||
| Interest on other short-term borrowings |
3 | 5 | |||||
| TOTAL INTEREST EXPENSE |
4,924 | 7,816 | |||||
| Net interest income |
14,800 | 15,035 | |||||
| Provision for loan losses |
5,460 | 449 | |||||
| Net interest income after provision for loan losses |
9,340 | 14,586 | |||||
| NONINTEREST INCOME |
|||||||
| Income from fiduciary activities |
1,583 | 1,605 | |||||
| Service charges on deposit accounts |
1,901 | 1,824 | |||||
| Other noninterest income |
1,808 | 1,364 | |||||
| Securities gains (losses) |
138 | — | |||||
| TOTAL NONINTEREST INCOME |
5,430 | 4,793 | |||||
| NONINTEREST EXPENSE |
|||||||
| Salaries, wages, and other employee benefits |
6,917 | 6,742 | |||||
| Premises and equipment |
2,265 | 2,402 | |||||
| Data processing |
917 | 910 | |||||
| FDIC assessments |
890 | 55 | |||||
| Legal fees |
217 | 36 | |||||
| Advertising and public relations |
233 | 342 | |||||
| Postage |
262 | 259 | |||||
| Supplies and printing |
292 | 287 | |||||
| Other taxes |
301 | 343 | |||||
| Other noninterest expense |
2,284 | 2,307 | |||||
| TOTAL NONINTEREST EXPENSE |
14,578 | 13,683 | |||||
| Income before income taxes |
192 | 5,696 | |||||
| Provision for income taxes |
(123 | ) | 2,011 | ||||
| NET INCOME |
$ | 315 | $ | 3,685 | |||
| NET INCOME PER COMMON SHARE: |
|||||||
| Basic |
$ | 0.17 | $ | 1.93 | |||
| Diluted |
$ | 0.17 | $ | 1.93 | |||
| AVERAGE SHARES OUTSTANDING: |
|||||||
| Basic |
1,903,120 | 1,905,949 | |||||
| Diluted |
1,903,120 | 1,910,192 | |||||
The accompanying notes are an integral part of the consolidated financial statements.
Page 24 First Century Bankshares, Inc.
Table of Contents
| Common Stock |
Paid-in Capital |
Retained Earnings |
Accumulated Other Comprehensive Income (loss) |
Treasury Stock |
Total | ||||||||||||||||||
| (Dollars in Thousands, Except Per Share Data) | |||||||||||||||||||||||
| Balance at December 31, 2007 |
$ | 2,500 | $ | 772 | $ | 39,670 | $ | (393 | ) | $ | (2,144 | ) | $ | 40,405 | |||||||||
| Comprehensive income: |
|||||||||||||||||||||||
| Net income |
— | — | 3,685 | — | — | 3,685 | |||||||||||||||||
| Change in net unrealized gain (loss) on pension and postretirement benefits |
— | — | — | (1,112 | ) | — | (1,112 | ) | |||||||||||||||
| Change in net unrealized gain (loss) on securities available for sale, net of reclassification adjustment and tax effect |
— | — | — | 654 | — | 654 | |||||||||||||||||
| Total comprehensive income (loss) |
— | — | 3,685 | (458 | ) | — | 3,227 | ||||||||||||||||
| Purchase 56,887 treasury shares at $23.99 per average share |
— | — | — | — | (161 | ) | (161 | ) | |||||||||||||||
| Option exercises 3,800 shares |
— | (15 | ) | — | — | 25 | 10 | ||||||||||||||||
| Cash dividends declared—$1.10 per share |
— | — | (2,116 | ) | — | — | (2,116 | ) | |||||||||||||||
| Balance at December 31, 2008 |
$ | 2,500 | $ | 757 | $ | 41,239 | $ | (851 | ) | $ | (2,280 | ) | $ | 41,365 | |||||||||
| Comprehensive income: |
|||||||||||||||||||||||
| Net income |
— | — | 315 | — | — | 315 | |||||||||||||||||
| Change in net unrealized gain (loss) on pension and postretirement benefits |
— | — | — | 22 | — | 22 | |||||||||||||||||
| Change in net unrealized gain (loss) on securities available for sale, net of reclassification adjustment and tax effect |
— | — | — | (419 | ) | — | (419 | ) | |||||||||||||||
| Total comprehensive income (loss) |
— | — | 315 | (397 | ) | — | (82 | ) | |||||||||||||||
| Cash dividends declared—$0.96 per share |
— | — | (1,827 | ) | — | — | (1,827 | ) | |||||||||||||||
| Balance at December 31, 2009 |
$ | 2,500 | $ | 757 | $ | 39,727 | $ | (1,248 | ) | $ | (2,280 | ) | $ | 39,456 | |||||||||
The accompanying notes are an integral part of the consolidated financial statements.
Statements of Changes in Stockholders’ Equity
First Century Bankshares, Inc. Page 25
Table of Contents
Statements of Cash Flows
| Years Ended December 31, |
||||||||
| 2009 | 2008 | |||||||
| CASH FLOWS FROM OPERATING ACTIVITIES | (Dollars in Thousands) | |||||||
| Net income before adjustments to reconcile net income to net cash provided by operating activities: |
$ | 315 | $ | 3,685 | ||||
| Provision for loan losses |
5,460 | 449 | ||||||
| Depreciation and amortization |
902 | 1,039 | ||||||
| Deferred income tax expense (benefit) |
(394 | ) | 47 | |||||
| Securities gains |
(138 | ) | — | |||||
| Loss on equity securities carried at cost |
168 | — | ||||||
| Loss on disposal of fixed assets |
— | 9 | ||||||
| (Increase) decrease in interest receivable |
259 | 969 | ||||||
| Net investment (accretion) amortization |
70 | (229 | ) | |||||
| Net (increase) decrease in other assets |
(2,241 | ) | (74 | ) | ||||
| Net decrease in interest payable and other liabilities |
(12 | ) | (680 | ) | ||||
| NET CASH PROVIDED BY OPERATING ACTIVITIES |
4,389 | 5,215 | ||||||
| CASH FLOWS FROM INVESTING ACTIVITIES |
||||||||
| Purchases of securities held to maturity |
(6,101 | ) | (986 | ) | ||||
| Purchases of securities available for sale |
(41,332 | ) | (43,614 | ) | ||||
| Purchases of Federal Home Loan Bank stock |
— | (205 | ) | |||||
| Proceeds from maturities and calls of securities held to maturity |
4,285 | 1,830 | ||||||
| Proceeds from maturities and calls of securities available for sale |
45,997 | 54,826 | ||||||
| Proceeds from sales of securities available for sale |
6,770 | — | ||||||
| Net (increase) decrease in loans |
3,918 | (76 | ) | |||||
| Acquisition of premises and equipment |
(114 | ) | (2,017 | ) | ||||
| NET CASH PROVIDED BY INVESTING ACTIVITIES |
13,423 | 9,758 | ||||||
| CASH FLOWS FROM FINANCING ACTIVITIES |
||||||||
| Net increase (decrease) in demand and savings deposits |
(1,125 | ) | 12,142 | |||||
| Net increase (decrease) in time deposits |
(6,586 | ) | (16,866 | ) | ||||
| Net increase (decrease) in short-term borrowings |
(7,391 | ) | (5,050 | ) | ||||
| Cash received from stock option exercise |
— | 10 | ||||||
| Purchase of treasury stock |
— | (161 | ) | |||||
| Cash dividends paid |
(1,827 | ) | (2,116 | ) | ||||
| NET CASH PROVIDED (USED) BY FINANCING ACTIVITIES |
(16,929 | ) | (12,041 | ) | ||||
| Net increase in cash and cash equivalents |
883 | 2,932 | ||||||
| Cash and cash equivalents at beginning of year |
16,459 | 13,527 | ||||||
| Cash and cash equivalents at end of year |
$ | 17,342 | $ | 16,459 | ||||
| SUPPLEMENTAL DISCLOSURES OF CASH FLOW INFORMATION |
||||||||
| Cash paid during the year for: |
||||||||
| Interest |
$ | 5,049 | $ | 7,958 | ||||
| Income taxes |
$ | 1,050 | $ | 1,899 | ||||
| Transfers of loans to other real estate owned |
$ | 2,511 | $ | 188 | ||||
The accompanying notes are an integral part of the consolidated financial statements.
Page 26 First Century Bankshares, Inc.
Table of Contents
1. Summary of Significant Accounting and Reporting Policies
First Century Bankshares, Inc. (the “Corporation” or the “Company”), and its wholly owned subsidiaries, First Century Bank, N.A. and First Century Financial Services, LLC, operate twelve branches in southern West Virginia and southwestern Virginia. The Corporation’s primary source of revenue is derived from loans to customers who are predominately small to medium size businesses and middle income individuals. The accounting and reporting policies of the Corporation conform to accounting principles generally accepted in the United States of America and to general practices within the banking industry. The following is a summary of the more significant accounting and reporting policies:
Management Estimates — The preparation of financial statements in conformity with generally accepted accounting principles requires management to make estimates and assumptions that affect the reported amounts of assets and liabilities and disclosure of contingent assets and liabilities at the date of the financial statements and the reported amounts of revenues and expenses during the reporting period. The more significant estimates relate to the calculation of the allowance for loan losses, valuation of impaired loans, goodwill impairment and valuation of pension and postretirement benefits. Actual results could differ from those estimates.
Principles of Consolidation — The consolidated financial statements include the accounts of First Century Bankshares, Inc. and its wholly owned subsidiaries. All significant intercompany balances and transactions have been eliminated in consolidation.
Cash and Cash Equivalents — For purposes of reporting cash flows, cash equivalents include cash on hand and amounts due from banks (including cash items in process of collection); interest–bearing balances with banks and federal funds sold. To comply with Federal Reserve regulations, the subsidiary bank is required to maintain reserve balances with the Federal Reserve Bank of Richmond. The amount of those reserve balances at December 31, 2009 and 2008, was approximately $401,000 and $572,000, respectively.
Securities — Securities are classified as either held to maturity, available for sale or trading. Classification of securities is determined on the date of purchase. In determining such classification, debt securities that the Corporation has the positive intent and ability to hold to maturity are classified as held to maturity and are carried at amortized cost. All other securities are classified as available for sale and are carried at fair value with unrealized gains and losses included in comprehensive income. The Corporation has no securities classified as trading.
Realized gains and losses, determined using the specific identification method, and declines in value judged to be other than temporary are included in noninterest income. Premiums and discounts are amortized into interest income using a level yield method.
Loans — Loans are reported at their principal outstanding balance net of charge-offs and certain other deferred or unearned income. Interest income is recognized as earned using the interest method.
Allowance for Loan Losses and Reserve for Unfunded Lending Commitments — It is the policy of the Corporation to maintain an allowance for loan losses and a reserve for unfunded lending commitments that equals management’s best estimate of probable credit
Consolidated Financial Statements
First Century Bankshares, Inc. Page 27
Table of Contents
1. Summary of Significant Accounting and Reporting Policies (continued)
losses that are inherent in the portfolio at the balance sheet date. The adequacy of the allowance for loan losses is periodically evaluated by the Corporation in order to maintain the allowance at a level that is sufficient to absorb probable credit losses. Management’s evaluation of the adequacy of the allowance is based on a review of the Corporation’s historical loss experience, known and inherent risks in the loan portfolio, including adverse circumstances that may affect the ability of the borrower to repay interest and/or principal, the estimated value of collateral, and an analysis of the levels and trends of delinquencies, charge-offs, and the risk ratings of the various loan categories. Such factors as the level and trend of interest rates and the condition of the national and local economies and industry concentrations are also considered.
The allowance for loan losses is established through charges to earnings in the form of a provision for loan losses. Increases and decreases in the allowance due to changes in the measurement of impaired loans are included in the provision for loan losses. Loans continue to be classified as impaired unless they are brought fully current and the collection of scheduled interest and principal is considered probable.
A loan is considered impaired, based on current information and events, if it is probable that the Corporation will be unable to collect the scheduled payments of principal or interest when due according to the contractual terms of the loan agreement. The measurement of impaired loans that are collateral dependent is based on the fair value of the collateral. The measurement of other impaired loans is generally based on the present value of expected future cash flows discounted at the historical effective interest rate.
The Corporation uses several factors in determining if a loan is impaired. The internal asset classification procedures include a thorough review of significant loans and lending relationships and include the accumulation of related data. This data includes loan payment status, borrowers’ financial data and borrowers’ operating factors such as cash flows, operating income or loss, etc.
When a loan or portion of a loan is determined to be uncollectible, the portion deemed uncollectible is charged against the allowance and subsequent recoveries, if any, are credited to the allowance.
The methodology used to determine an estimate for the reserve for unfunded lending commitments is inherently similar to the methodology used in calculating the allowance for loan losses adjusted for factors specific to binding commitments, including the probability of funding and exposure at the time of funding. The reserve for unfunded lending commitments is included in other liabilities with increases or decreases included in noninterest expense. At December 31, 2009 and 2008, the reserve for unfunded lending commitments was $10,000 respectively. Estimates may change at some point in the future.
Income Recognition on Impaired and Nonaccrual Loans — Loans, including impaired loans, are generally classified as nonaccrual if they are past due as to maturity or payment of principal or interest for a period of more than 90 days, unless such loans are well-collateralized and in the process of collection. If a loan or a portion of a loan is classified as doubtful or is partially charged off, the loan is classified as nonaccrual. Loans that are on a current payment status or past due less than 90 days may also be classified as nonaccrual if repayment in full of principal and/or interest is in doubt.
Page 28 First Century Bankshares, Inc.
Table of Contents
1. Summary of Significant Accounting and Reporting Policies (continued)
Loans may be returned to accrual status when all principal and interest amounts contractually due are reasonably assured of repayment within an acceptable period of time, and there is a sustained period of repayment performance by the borrower, in accordance with the contractual terms of interest and principal.
While a loan is classified as nonaccrual and the future collectibility of the recorded loan balance is doubtful, collections of interest and principal are generally applied as a reduction to principal outstanding. When the future collectibility of the recorded loan balance is expected, interest income may be recognized on a cash basis. In the case where a nonaccrual loan had been partially charged off, recognition of interest on a cash basis is limited to that which would have been recognized on the recorded loan balance at the contractual interest rate. Cash receipts in excess of that amount are recorded as recoveries to the allowance for loan losses until prior charge-offs have been fully recovered.
Loan Servicing — At December 31, 2009 and 2008, the Corporation serviced the home mortgage loans of approximately 1,300 borrowers. Loans are serviced for the Federal National Mortgage Association (Fannie Mae). As of December 31, 2009, the Corporation serviced loans with an aggregate principal amount of approximately $119,391,000 compared to $99,229,000 at December 31, 2008. The average annual servicing fee on its servicing portfolio was 0.246% for 2009 and 0.248% for 2008. The Corporation’s servicing business collects mortgage payments, administers tax and insurance escrows, and seeks to mitigate losses on defaulted loans and responds to borrower inquiries. Fannie Mae reserves the right to change service providers at its discretion. Therefore, the Corporation does not recognize an intangible asset for mortgage servicing rights. During 2009 and 2008, the loan servicing function generated fees of approximately $274,000 and $246,000, respectively.
Other Real Estate Owned — Other real estate owned includes properties on which the Corporation’s subsidiary has foreclosed and taken title. Real estate properties acquired as a result of foreclosures are carried at the lower of the recorded investment in the loan or the fair value less estimated selling costs. Any excess of the outstanding principal loan balance over the fair value less estimated selling costs of the foreclosed property is charged to the allowance for loan losses. Any subsequent fair value adjustments and net operating expenses are charged to noninterest expense.
Premises and Equipment — Premises and equipment are stated at cost less accumulated depreciation. Depreciation is computed by the straight–line method based upon the estimated useful lives of the assets. Buildings and improvements have estimated useful lives of 20 to 40 years. Equipment and fixtures have estimated useful lives of 3 to 10 years. The cost of major improvements is capitalized. The expenditures for maintenance and repairs are charged to expense as incurred. Gains or losses on assets sold are included in other noninterest income or expense.
Accounting for Transfers and Servicing of Financial Assets and Extinguishments of Liabilities — The Corporation applies a financial-components approach that focuses on control when accounting and reporting for transfers and servicing of financial assets and extinguishments of liabilities. Under that approach, after a transfer of financial assets, an entity recognizes the financial and servicing assets it controls and the liabilities it has incurred, derecognizes financial assets when control has been surrendered, and derecognizes
First Century Bankshares, Inc. Page 29
Table of Contents
1. Summary of Significant Accounting and Reporting Policies (continued)
liabilities when extinguished. This approach provides consistent standards for distinguishing transfers of financial assets that are sales from transfers that are secured borrowings.
Goodwill And Other Intangibles — Goodwill and indefinite-lived intangible assets are not amortized, but are reviewed at least annually for impairment. If impaired, goodwill or indefinite-lived intangible assets are written down to fair value, calculated using the discounted cash flow method. The unimpaired balance of goodwill and indefinite-lived intangibles totaled approximately $5,183,000 at December 31, 2009 and 2008.
Income Taxes — The Corporation files a consolidated federal income tax return. Deferred tax assets and liabilities are recognized for the future tax consequences attributable to temporary differences between the financial statement carrying amounts of existing assets and liabilities and their respective tax bases. Deferred tax assets and liabilities are measured using enacted tax rates expected to apply to taxable income in the years in which those temporary differences are expected to be recovered or settled. The effect on deferred tax assets and liabilities of a change in tax rates is recognized as income or expense in the period that includes the enactment date.
Segment Information — Operating segments are components of an enterprise about which separate financial information is available that is evaluated regularly by the chief operating decision maker in deciding how to allocate resources and in assessing performance. The Corporation has determined that it has one significant operating segment, the providing of general commercial financial services to customers located in the geographic areas of southern West Virginia and southwestern Virginia. The various products are those generally offered by community banks, and the allocation of resources is based on the overall performance of the institution, versus the individual branches or products.
Comprehensive Income — The Company classifies items of other comprehensive income by their nature in the financial statements and displays accumulated other comprehensive income separately from retained earnings in the equity section of the balance sheet. Unrealized gains and losses on available for sale securities and net accrued pension benefit liability are the components of the Company’s other accumulated comprehensive income.
Post Employment Benefits — The Corporation has a defined benefit pension plan covering employees meeting certain age and service requirements. There are also two defined benefit post retirement plans that provide medical and life insurance benefits. The net periodic costs of theses plans are computed in accordance with FASB No. 158, “Employers’ Accounting for Defined Benefit Pensions and Other Post Retirement Plans.”
Page 30 First Century Bankshares, Inc.
Table of Contents
2. Securities
Securities available for sale at December 31, 2009 and 2008 are summarized as follows:
| 2009 | ||||||||||||
| Amortized Cost |
Gross Unrealized Gains |
Gross Unrealized Losses |
Fair Value | |||||||||
| (Dollars in Thousands) | ||||||||||||
| U.S. Government agency obligations |
$ | 35,533 | $ | 221 | $ | 116 | $ | 35,638 | ||||
| U.S. Government agency mortgage-backed securities |
24,426 | 787 | 11 | 25,202 | ||||||||
| TOTAL SECURITIES AVAILABLE FOR SALE |
$ | 59,959 | $ | 1,008 | $ | 127 | $ | 60,840 | ||||
| 2008 | ||||||||||||
| Amortized Cost |
Gross Unrealized Gains |
Gross Unrealized Losses |
Fair Value | |||||||||
| (Dollars in Thousands) | ||||||||||||
| U.S. Government agency obligations |
$ | 41,148 | $ | 856 | $ | — | $ | 42,004 | ||||
| U.S. Government agency mortgage-backed securities |
29,131 | 765 | 18 | 29,878 | ||||||||
| Other debt securities |
1,022 | — | 55 | 967 | ||||||||
| TOTAL SECURITIES AVAILABLE FOR SALE |
$ | 71,301 | $ | 1,621 | $ | 73 | $ | 72,849 | ||||
Securities held to maturity at December 31, 2009 and 2008 are summarized as follows:
| 2009 | ||||||||||||
| Amortized Cost |
Gross Unrealized Gains |
Gross Unrealized Losses |
Fair Value | |||||||||
| (Dollars in Thousands) | ||||||||||||
| State and municipal obligations |
$ | 19,076 | $ | 378 | $ | 38 | $ | 19,416 | ||||
| TOTAL SECURITIES HELD TO MATURITY |
$ | 19,076 | $ | 378 | $ | 38 | $ | 19,416 | ||||
| 2008 | ||||||||||||
| Amortized Cost |
Gross Unrealized Gains |
Gross Unrealized Losses |
Fair Value | |||||||||
| (Dollars in Thousands) | ||||||||||||
| State and municipal obligations |
$ | 17,286 | $ | 229 | $ | 71 | $ | 17,444 | ||||
| TOTAL SECURITIES HELD TO MATURITY |
$ | 17,286 | $ | 229 | $ | 71 | $ | 17,444 | ||||
Securities with an aggregate fair value of $38,660,000 at December 31, 2009 and $45,362,000 at December 31, 2008, were pledged to secure public and trust deposits and for other purposes required or permitted by law, including approximately $15,241,000 at December 31, 2009 and $22,632,000 at December 31, 2008 pledged to secure repurchase agreements.
Gross gains of $248,000 and gross losses of $110,000 were recognized on sales of available for sale securities for the year ended December 31, 2009. There were no gains or losses recognized on sales of securities during 2008.
First Century Bankshares, Inc. Page 31
Table of Contents
2. Securities (continued)
The amortized cost and estimated fair value for securities available for sale and securities held to maturity by contractual maturities at December 31, 2009 are shown in the following tables. Expected maturities may differ from contractual maturities because borrowers may have the right to call or prepay obligations.
| Amortized Cost |
Fair Value |
Net Unrealized Gains (Losses) | |||||||
| (Dollars in Thousands) | |||||||||
| Due in one year or less |
$ | 2,000 | $ | 2,021 | $ | 21 | |||
| Due after one year through five years |
26,006 | 26,297 | 291 | ||||||
| Due after five years through ten years |
23,835 | 24,220 | 385 | ||||||
| Due after ten years |
8,118 | 8,302 | 184 | ||||||
| TOTAL SECURITIES AVAILABLE FOR SALE |
$ | 59,959 | $ | 60,840 | $ | 881 | |||
| Amortized Cost |
Fair Value |
Net Unrealized | |||||||
| (Dollars in Thousands) | |||||||||
| Due in one year or less |
$ | 1,270 | $ | 1,280 | $ | 10 | |||
| Due after one year through five years |
6,410 | 6,649 | 239 | ||||||
| Due after five years through ten years |
6,234 | 6,325 | 91 | ||||||
| Due after ten years |
5,162 | 5,162 | — | ||||||
| TOTAL SECURITIES HELD TO MATURITY |
$ | 19,076 | $ | 19,416 | $ | 340 | |||
The following table shows the gross unrealized losses and fair value of the Corporation’s investments with unrealized losses that are not deemed to be other-than-temporarily impaired, aggregated by investment category at December 31, 2009:
| Less Than Twelve Months |
Over Twelve Months | |||||||||||||||
| (Dollars in Thousands) | ||||||||||||||||
| Description of Security | Gross Unrealized Losses |
Fair Value |
Gross Unrealized Losses |
Fair Value | ||||||||||||
| Securities available for sale: |
||||||||||||||||
| U.S. Government agency obligations |
$ | 116 | $ | 2,622 | $ | — | $ | — | ||||||||
| U.S. Government agency mortgage-backed securities |
11 | 11,899 | — | — | ||||||||||||
| Total securities available for sale |
$ | 127 | $ | 14,521 | $ | — | $ | — | ||||||||
| Securities held to maturity: |
||||||||||||||||
| Municipal securities |
$ | 38 | $ | 4,709 | $ | — | $ | — | ||||||||
| Total securities held to maturity |
$ | 38 | $ | 4,709 | $ | — | $ | — | ||||||||
U. S. Government Agency Obligations. The unrealized losses on the Corporation’s investments in direct obligations of U.S. government agencies were the result of interest rate increases. The contractual terms of these investments do not permit the issuer to settle the securities at a price materially less than the amortized cost of the investment.
U.S. Government Agency Mortgage-Backed Securities. The unrealized losses on the Corporation’s investment in agency mortgage-backed securities issued by FNMA and FHLMC were caused by interest rate increases. The Corporation purchased these investments,
Page 32 First Century Bankshares, Inc.
Table of Contents
2. Securities (continued)
most at a premium relative to their face amount, and the contractual cash flows of these investments are guaranteed by the issuer organization. Accordingly, it is expected that the securities would not be settled at a price materially less than the amortized cost of the Corporation’s investment.
Municipal Securities. The unrealized losses on the Corporation’s municipal securities were caused by interest rate increases. The contractual cash flows of these investments are guaranteed by the issuer organization. Accordingly, it is expected that the securities would not be settled at a price materially less than the amortized cost of the Corporation’s investment.
For all of these securities, because the decline in market value is attributable to changes in interest rates and not credit quality and because the Corporation has the ability and intent to hold these investments until a recovery of fair value, which may be maturity, the Corporation does not consider these investments to be other-than-temporarily impaired at December 31, 2009.
3. Loans
Loans at December 31, 2009 and 2008 consisted of the following:
| December 31, | ||||||
| 2009 | 2008 | |||||
| (Dollars in Thousands) | ||||||
| Commercial, financial and agricultural |
$ | 39,798 | $ | 44,966 | ||
| Real estate–construction and development |
17,051 | 25,074 | ||||
| Real estate–mortgage (residential and commercial) |
208,570 | 204,686 | ||||
| Installment loans to individuals |
20,947 | 21,894 | ||||
| Total loans |
286,366 | 296,620 | ||||
| Less: allowance for loan losses |
4,325 | 2,690 | ||||
| NET LOANS |
$ | 282,041 | $ | 293,930 | ||
The Corporation’s subsidiary has had and can be expected to have in the future various banking transactions with directors, executive officers, their immediate families and affiliated companies in which they are principal stockholders (commonly referred to as related parties). The total amount of these loans was $18,291,000 and $20,575,000 at December 31, 2009 and 2008, respectively. During 2009, $612,000 in loan advances were made and repayments were $2,896,000.
First Century Bankshares, Inc. Page 33
Table of Contents
4. Allowance for Loan Losses
An analysis of changes in the allowance for loan losses for 2009 and 2008 is as follows:
| Years Ended December 31, | ||||||||
| 2009 | 2008 | |||||||
| (Dollars in Thousands) | ||||||||
| Balance at beginning of year |
$ | 2,690 | $ | 2,455 | ||||
| Provision for loan losses |
5,460 | 449 | ||||||
| Recoveries on loans previously charged off |
121 | 201 | ||||||
| Loans charged off |
(3,946 | ) | (415 | ) | ||||
| BALANCE AT END OF YEAR |
$ | 4,325 | $ | 2,690 | ||||
The following is a summary of loans considered impaired:
| December 31, | ||||||
| 2009 | 2008 | |||||
| (Dollars in Thousands) | ||||||
| Gross impaired loans |
$ | 7,186 | $ | 5,349 | ||
| Valuation allowance for impaired loans |
279 | 186 | ||||
| Recorded investment in impaired loans |
$ | 6,907 | $ | 5,163 | ||
The average recorded investment in impaired loans for the years ended December 31, 2009 and 2008 was $7,096,000 and $4,210,000, respectively. There was no interest income recognized on impaired loans (during the portion of the year they were impaired) for any of these years. At December 31, 2009 and 2008, the Corporation had nonaccrual loans of $6,780,000 and $5,614,000, respectively. Interest income of $174,000 and ($302,000) was recognized on these loans in 2009 and 2008, respectively. Had these loans performed in accordance with their original terms, additional interest income of $334,000 and $662,000 would have been recorded in 2009 and 2008, respectively.
At December 31, 2009 and 2008, the Corporation had loans past-due 90 days or more and still in accrual status of $1,461,000 and $553,000, respectively. Additionally, at December 31, 2009 and 2008, the Corporation had other real estate owned of $2,578,000 and $203,000, respectively.
5. Premises and Equipment
Premises and equipment at December 31, 2009 and 2008 consisted of the following:
| December 31, | ||||||
| 2009 | 2008 | |||||
| (Dollars in Thousands) | ||||||
| Land |
$ | 2,552 | $ | 2,552 | ||
| Buildings and improvements |
15,691 | 15,691 | ||||
| Equipment and fixtures |
6,321 | 6,447 | ||||
| Total |
24,564 | 24,690 | ||||
| Less accumulated depreciation |
10,998 | 10,336 | ||||
| NET PREMISES AND EQUIPMENT |
$ | 13,566 | $ | 14,354 | ||
Depreciation charged to operating expense amounted to $902,000 in 2009 and $1,039,000 in 2008.
Page 34 First Century Bankshares, Inc.
Table of Contents
5. Premises and Equipment (continued)
Certain premises and equipment are utilized under long-term operating leases. The aggregate minimum annual rental commitments under those leases total approximately 71,000 in 2010, $63,000 in 2011, $55,000 in 2012, $57,000 in 2013 and $53,000 in 2014. Total net rent expense included in the accompanying consolidated financial statements was $85,000 in 2009 and $93,000 in 2008.
6. Deposits
Deposits at December 31, 2009 and 2008 were as follows:
| December 31, | ||||||
| 2009 | 2008 | |||||
| (Dollars in Thousands) | ||||||
| Individuals, partnerships and corporations: |
||||||
| Demand deposits |
$ | 43,100 | $ | 49,691 | ||
| Time and savings deposits |
291,216 | 291,977 | ||||
| U.S. Government |
17 | 35 | ||||
| States and political subdivisions |
13,820 | 14,337 | ||||
| Due to banks |
322 | 248 | ||||
| Certified and official checks |
1,845 | 1,743 | ||||
| TOTAL DEPOSITS |
$ | 350,320 | $ | 358,031 | ||
The scheduled maturities of time deposits at December 31, 2009 were as follows:
| (Dollars in Thousands) | |||
| 2010 |
$ | 136,403 | |
| 2011 |
14,637 | ||
| 2012 |
10,560 | ||
| 2013 |
4,329 | ||
| 2014 |
1,482 | ||
| Thereafter |
334 | ||
| TOTAL TIME DEPOSITS |
$ | 167,745 | |
Time deposits include certificates of deposit issued in amounts of $100,000 or more totaling approximately $52,978,000 and $47,699,000 at December 31, 2009 and 2008, respectively. At December 31, 2009, deposits of executive officers, directors and their related interests were $3,142,000.
7. Short-term Borrowings
Short-term borrowings consist of securities sold under agreements to repurchase. Federal funds purchased and securities sold under agreements to repurchase generally mature within one to four days from the transaction date. Information concerning federal funds purchased and securities sold under agreements to repurchase at December 31, 2009 and 2008 is summarized as follows:
| 2009 | 2008 | |||||||
| (Dollars in Thousands) | ||||||||
| Average balance during the year |
$ | 20,601 | $ | 21,534 | ||||
| Average interest rate during the year |
1.34 | % | 1.58 | % | ||||
| Maximum month-end balance during the year |
$ | 22,546 | $ | 24,778 | ||||
First Century Bankshares, Inc. Page 35
Table of Contents
8. Other Comprehensive Income
Other comprehensive income is defined as comprehensive income exclusive of net income. Other comprehensive income (loss) consists of the following:
| Years Ended December 31, |
||||||||
| 2009 | 2008 | |||||||
| Unrealized losses on pension and postretirement benefit obligations arising during the year |
$ | 35 | $ | (1,773 | ) | |||
| Unrealized gains (losses) on available for sale securities arising during the year |
(530 | ) | 1,042 | |||||
| Reclassification adjustment for (gains) losses included in net income |
(138 | ) | — | |||||
| Other comprehensive income (loss) before tax |
(633 | ) | (731 | ) | ||||
| Income tax (expense) benefit related to other comprehensive income |
236 | 273 | ||||||
| Other comprehensive income (loss), net of tax |
$ | (397 | ) | $ | (458 | ) | ||
9. Earnings Per Share
The following table reconciles the numerator and denominator of the basic and diluted computations for net income per common share for the years ended December 31, 2009 and 2008:
| 2009 | ||||||||
| Income (Numerator) |
Weighted Average Shares (Denominator) |
Per-Share Amount | ||||||
| Basic EPS: |
||||||||
| Income available to common shareholders |
$ | 315,000 | 1,903,120 | $ | 0.17 | |||
| Diluted EPS: |
||||||||
| Effect of dilutive securities—Stock options |
— | |||||||
| Income available to common shareholders and assumed conversions |
$ | 315,000 | 1,903,120 | $ | 0.17 | |||
| 2008 | ||||||||
| Income (Numerator) |
Weighted Average Shares (Denominator) |
Per-Share Amount | ||||||
| Basic EPS: |
||||||||
| Income available to common shareholders |
$ | 3,685,000 | 1,905,949 | $ | 1.93 | |||
| Diluted EPS: |
||||||||
| Effect of dilutive securities—Stock options |
4,243 | |||||||
| Income available to common shareholders and assumed conversions |
$ | 3,685,000 | 1,910,192 | $ | 1.93 | |||
10. Stockholders’ Equity
The authorized capital stock of the Corporation consists of 10,000,000 shares of $1.25 par value common stock. At December 31, 2009 and 2008, 2,000,000 shares were issued. At December 31, 2009 and 2008, 1,903,120 shares were outstanding.
Page 36 First Century Bankshares, Inc.
Table of Contents
10. Stockholders’ Equity (continued)
SHARE REPURCHASE ACTIVITY
During the year ended December 31, 2008, the Corporation repurchased 7,684 shares. No shares were repurchased during 2009. At December 31, 2009, management was authorized to repurchase 9,572 shares.
11. Post Employment Benefits
The Corporation has a noncontributory pension plan covering all eligible employees with six months of service who have attained the age of twenty and one-half. Contributions to the plan are based on computations by independent actuarial consultants. The plan’s assets include common stock, fixed income securities, short-term investments and cash.
The Corporation sponsors two defined benefit post retirement plans that cover both salaried and nonsalaried employees. One plan provides medical benefits, and the other provides life insurance benefits. The post retirement health care plan is contributory and the life insurance plan is noncontributory. The health plan has an annual limitation (a “cap”) on the dollar amount of the employer’s share of the cost of covered benefits incurred by a plan participant. The retiree is responsible, therefore, for the amount by which the cost of the benefit coverage under the plan incurred during a year exceeds that cap. No health care cost increases have been factored into the health plan’s actuarial calculations due to this cap.
First Century Bankshares, Inc. Page 37
Table of Contents
11. Post Employment Benefits (continued)
The following table outlines the changes in the Corporation’s postemployment benefit plan obligations, assets and funded status for the years ended December 31, 2009 and 2008, and the assumptions and components of net periodic benefit costs for the two years in the period ended December 31, 2009.
| Pension Benefits | Other Postretirement Benefits |
|||||||||||||||
| 2009 | 2008 | 2009 | 2008 | |||||||||||||
| (Dollars in Thousands) | ||||||||||||||||
| Change in projected benefit obligation |
||||||||||||||||
| Projected benefit obligation at beginning of year |
$ | 7,249 | $ | 7,298 | $ | 984 | $ | 1,037 | ||||||||
| Service cost |
295 | 284 | 14 | 15 | ||||||||||||
| Interest cost |
436 | 414 | 59 | 58 | ||||||||||||
| Actuarial (gain) loss |
482 | (494 | ) | (5 | ) | (79 | ) | |||||||||
| Benefits paid |
(475 | ) | (253 | ) | (44 | ) | (47 | ) | ||||||||
| Projected benefit obligation at end of year |
7,987 | 7,249 | 1,008 | 984 | ||||||||||||
|
The defined benefit pension plan’s accumulated benefit obligation was $7,682,000 at December 31, 2009, and $6,980,000 at December 31, 2008.
|
| |||||||||||||||
| Change in plan asset |
||||||||||||||||
| Fair value of plan assets at beginning of year |
5,814 | 7,537 | — | — | ||||||||||||
| Actual return on plan assets |
829 | (1,770 | ) | — | — | |||||||||||
| Employer contribution |
300 | 300 | 44 | 47 | ||||||||||||
| Benefits paid |
(475 | ) | (253 | ) | (44 | ) | (47 | ) | ||||||||
| Fair value of plan assets at end of year |
6,468 | 5,814 | — | — | ||||||||||||
| Funded status |
(1,519 | ) | (1,435 | ) | (1,008 | ) | (984 | ) | ||||||||
| Unrecognized net actuarial (gain) loss |
3,859 | 3,959 | (438 | ) | (469 | ) | ||||||||||
| Unrecognized prior service cost |
(716 | ) | (806 | ) | — | — | ||||||||||
| Unrecognized transition obligation |
— | — | 166 | 221 | ||||||||||||
| Prepaid (accrued) benefit cost |
$ | 1,624 | $ | 1,718 | $ | (1,280 | ) | $ | (1,232 | ) | ||||||
| Pension Benefits | Other Postretirement Benefits |
|||||||||||||||
| Weighted-average assumptions as of 12/31 | 2009 | 2008 | 2009 | 2008 | ||||||||||||
| Discount rate |
5.75 | % | 6.16 | % | 5.78 | % | 6.16 | % | ||||||||
| Expected return on plan assets |
8.00 | % | 8.00 | % | N/A | N/A | ||||||||||
| Rate of compensation increase |
3.00 | % | 3.00 | % | N/A | N/A | ||||||||||
| Components of net periodic benefit cost | ||||||||||||||||
| Service cost |
$ | 295 | $ | 284 | $ | 14 | $ | 15 | ||||||||
| Interest cost |
436 | 414 | 59 | 58 | ||||||||||||
| Expected return on plan assets |
(463 | ) | (607 | ) | — | — | ||||||||||
| Amortization of prior service cost |
(90 | ) | (90 | ) | — | — | ||||||||||
| Amortization of transition obligation |
— | — | 55 | 55 | ||||||||||||
| Recognized net actuarial (gain) loss |
216 | 94 | (35 | ) | (28 | ) | ||||||||||
| Net periodic benefit cost |
$ | 394 | $ | 95 | $ | 93 | $ | 100 | ||||||||
Page 38 First Century Bankshares, Inc.
Table of Contents
11. Post Employment Benefits (continued)
Included in Accumulated Other Comprehensive Income at December 31, 2009 and 2008 are the following non-cash pretax charges which have not yet been recognized in net periodic pension cost. Also presented is the estimated portion of each component of Accumulated Other Comprehensive Income which is expected to be recognized as a component of net periodic benefit cost during the year-ending December 31, 2010.
| Amt. recognized in Comp. Income at Dec 31, 2009 |
Amt. recognized in |
Amount expected to net periodic |
||||||||||
| Pension Benefits: |
||||||||||||
| Net actuarial losses |
$ | 3,859 | $ | 3,959 | $ | 219 | ||||||
| Prior service cost |
$ | (716 | ) | $ | (806 | ) | $ | (90 | ) | |||
| Other Postretirement Benefits: |
||||||||||||
| Net actuarial gains |
$ | (438 | ) | $ | (469 | ) | $ | (34 | ) | |||
| Transition obligation |
$ | 166 | $ | 221 | $ | 55 | ||||||
The expected benefits to be paid under the Corporation’s postemployment benefit plans are as follows:
| Pension Benefits |
Other Postretirement Benefits | |||||
| 2010 |
$ | 453 | $ | 57 | ||
| 2011 |
$ | 330 | $ | 56 | ||
| 2012 |
$ | 539 | $ | 60 | ||
| 2013 |
$ | 455 | $ | 61 | ||
| 2014 |
$ | 371 | $ | 61 | ||
| 2015-2019 |
$ | 2,884 | $ | 320 | ||
The asset allocation for the defined benefit pension plan for the years ended December 31, 2009 and 2008, by asset category, is as follows:
ASSET CATEGORY
| Percentage of Plan Assets |
||||||
| 2009 | 2008 | |||||
| Equity securities |
67 | % | 64 | % | ||
| Debt securities |
24 | 17 | ||||
| Real estate |
2 | — | ||||
| Other |
7 | 19 | ||||
| Total |
100 | % | 100 | % | ||
The investment objective for the defined benefit pension plan is to maximize total return with tolerance for slightly above average risk. Asset allocation strongly favors equities, with a target allocation of approximately 65% equity securities, 25% fixed income securities, and 10% cash and cash equivalents. Due to volatility in the market, the target allocation is not always desirable and asset allocations will fluctuate between the acceptable ranges. A core
First Century Bankshares, Inc. Page 39
Table of Contents
11. Post Employment Benefits (continued)
equity position of large cap stocks will be maintained. However, more aggressive or volatile sectors will be meaningfully represented in the asset mix in pursuit of higher returns. Higher volatility investment strategies such as real estate mortgages, limited partnerships, and international equities will be appropriate strategies in conjunction with the core position. It is management’s intent to give the investment managers flexibility within the overall guidelines with respect to investment decisions and their timing. The defined benefit pension plan holds no investments in the Corporation’s common stock.
The following table presents fair value information about the Company’s defined benefit pension plan assets by asset category as of December 31, 2009.
| Fair Value Measurements at December 31, 2009, Using: | ||||||||||||||
| Description |
Fair Value December 31, |
Quoted Prices in Active Markets (Level 1) |
Significant Other (Level 2) |
Significant Inputs (Level 3) | ||||||||||
| Equity securities |
$ | 3,117 | $ | 3,117 | $ | — | $ | — | ||||||
| Indexed funds |
1,590 | 1,590 | ||||||||||||
| Debt securities |
893 | — | 893 | — | ||||||||||
| Preferred stocks |
288 | — | 288 | — | ||||||||||
| Real estate mortgages |
80 | — | 80 | — | ||||||||||
| Other investments, includes cash and cash equivalents |
500 | — | 500 | — | ||||||||||
| Total |
$ | 6,468 | $ | 4,707 | $ | 1,761 | $ | — | ||||||
Equity securities and indexed funds: Valued at the closing prices reported on the active market on which the individual securities are traded.
All other investments: Valued at fair value based on models that consider criteria such as dealer quotes, available trade date, issuer credit worthiness, and bond and swap yield curves.
The Corporation made discretionary contributions of $300,000 to the pension plan in 2009 and 2008 and expects to do so for 2010.
The Corporation maintains a qualified 401(k) retirement savings plan. All employees age 21 and over are eligible to participate on a voluntary basis. Prior to 2008, pretax contributions up to a maximum of fifteen percent (15%) of salary, were matched fifty percent (50%) by the Corporation. For 2008, the Corporation adopted a safe-harbor match of 100% up to 6% of compensation. Total amounts charged to operating expense for payments pursuant to this plan were approximately $246,000 in 2009 and $253,000 in 2008.
Page 40 First Century Bankshares, Inc.
Table of Contents
12. Income Taxes
The provision for income taxes consisted of the following:
| Years Ended December 31, | |||||||
| Tax provision attributed to income from operations: | 2009 | 2008 | |||||
| Current: | (Dollars in Thousands) | ||||||
| Federal |
$ | 204 | $ | 1,669 | |||
| State |
67 | 309 | |||||
| Deferred expense (benefit) |
(394 | ) | 33 | ||||
| PROVISION FOR INCOME TAX |
$ | (123 | ) | $ | 2,011 | ||
The components of deferred tax assets and liabilities at December 31, 2009 and 2008 were as follows:
| 2009 | 2008 | |||||||
| (Dollars in Thousands) | ||||||||
| Allowance for loan losses |
$ | 1,258 | $ | 747 | ||||
| Retirement plans |
942 | 903 | ||||||
| Other |
177 | 250 | ||||||
| Gross deferred tax assets |
2,377 | 1,900 | ||||||
| Depreciation |
(323 | ) | (396 | ) | ||||
| Goodwill |
(1,269 | ) | (1,110 | ) | ||||
| Unrealized gains on securities available for sale |
(328 | ) | (577 | ) | ||||
| Other |
(227 | ) | (200 | ) | ||||
| Gross deferred tax liabilities |
(2,147 | ) | (2,283 | ) | ||||
| NET DEFERRED TAX ASSET (LIABILITY) |
$ | 230 | $ | (383 | ) | |||
The principal differences between the effective tax rate and the federal statutory rate were as follows:
| Years Ended December 31, | ||||||||||||||
| 2009 | 2008 | |||||||||||||
| (Dollars in Thousands) | ||||||||||||||
| Amount | % | Amount | % | |||||||||||
| Provision at statutory rate |
$ | 65 | 34 | $ | 1,937 | 34 | ||||||||
| Tax-exempt interest income from certain investment |
(252 | ) | (131 | ) | (233 | ) | (4 | ) | ||||||
| Nondeductible capital losses |
47 | 25 | — | — | ||||||||||
| State income tax expense, net of federal benefit |
14 | 7 | 208 | 3 | ||||||||||
| Other, net |
3 | 1 | 99 | 2 | ||||||||||
| PROVISION FOR INCOME TAXES |
$ | (123 | ) | (64 | ) | $ | 2,011 | 35 | ||||||
First Century Bankshares, Inc. Page 41
Table of Contents
13. Commitments and Contingencies
In the normal course of business, the Corporation is involved in various legal suits and proceedings. In the opinion of management, based on the advice of legal counsel, these suits are without substantial merit and should not result in judgments which in the aggregate would have a material adverse effect on the Corporation’s financial statements.
14. Financial Instruments, Concentrations of Credit and Fair Values
The subsidiary of the Corporation is party to various financial instruments with off-balance sheet risk arising in the normal course of business to meet the financing needs of its customers. Those financial instruments include commitments to extend credit in the form of unused lines of credit and financial standby letters of credit. These instruments contain various elements of credit and interest rate risk in excess of the amount recognized in the consolidated statements of financial condition.
Unused lines of credit represent agreements to lend to a customer as long as there is no violation of any condition established in the contract, and generally have fixed expiration dates or other termination clauses and may require payment of a fee. Financial standby letters of credit are conditional commitments issued by the subsidiary to guarantee the financial performance of a customer to a third party. Those guarantees are primarily used to support public and private borrowing arrangements.
The subsidiary’s exposure to credit loss, in the event of nonperformance by the other party to the financial instrument for commitments to extend credit and standby letters of credit, is the contractual amount of those instruments. The subsidiary uses the same credit policies in making commitments and conditional obligations that it does for on-balance sheet instruments.
The components of the Corporation’s off-balance sheet financial commitments at December 31, 2009 and 2008 are as follows:
| December 31, | ||||||
| 2009 | 2008 | |||||
| Unused lines of credit | (Dollars in Thousands) | |||||
| Home equity lines |
$ | 4,098 | $ | 4,517 | ||
| Commercial real estate, construction and land development secured by real estate |
21,110 | 20,665 | ||||
| Other unused commitments |
20,402 | 23,004 | ||||
| Total unused lines of credit | $ | 45,610 | $ | 48,186 | ||
| Financial standby letters of credit |
$ | 4,273 | $ | 4,437 | ||
At December 31, 2009 and 2008, the carrying amount and fair value of financial standby letters of credit was $6,000 and $4,000, respectively. Also, at December 31, 2009 and 2008, the Corporation had residential mortgage loan commitments outstanding of $1,995,000 and $3,700,000, respectively. Derivative financial instruments related to these commitments at December 31, 2009 and 2008 were $32,000 and $29,000, respectively.
Page 42 First Century Bankshares, Inc.
Table of Contents
14. Financial Instruments, Concentrations of Credit and Fair Values (continued)
The Corporation’s subsidiary grants various types of credit including, but not limited to, agriculture, commercial, consumer, and residential loans to customers primarily located throughout southern West Virginia and southwestern Virginia. Each customer’s creditwor-thiness is examined on a case by case basis. The amount of collateral obtained, if any, is determined by management’s credit evaluation of the customer. Collateral held varies, but may include property, accounts receivable, inventory, plant and equipment, securities, or other income producing property. The loan portfolio is generally well diversified and geographically dispersed within the region. Within each specific industry, borrowers are well diversified as to specialty, service, or other unique feature of the overall industry.
A substantial portion of the customers’ ability to honor their contractual commitment is largely dependent upon the economic conditions of the respective industry and overall economic conditions of the region. At December 31, 2009, the Corporation had concentrations of $21,258,000, or 53.9% of stockholders’ equity in loans to lessors of residential real property, $18,529,000, or 47.0% of stockholders’ equity in loans to lessors of nonresidential real property and $11,711,000, or 29.7% of stockholders’ equity in loans to land subdividers and developers. These concentrations are diversified by geography throughout the Mid-Atlantic region.
Accounting standards require the disclosure of the estimated fair value of on and off-balance sheet financial instruments. For the Corporation, as for most financial institutions, most of its assets and liabilities are considered financial instruments. Most of the Corporation’s financial instruments, however, lack an available trading market characterized by a willing buyer and a willing seller engaging in an exchange transaction. It is also the Corporation’s general practice and intent to hold its financial instruments to maturity and not to engage in trading or sales activities. Therefore, significant estimations and present value calculations were used by the Corporation for the purposes of this disclosure.
Fair values are based on quoted market prices for similar instruments or estimated using discounted cash flow analysis. The discount rates used are estimated using comparable market rates for similar types of instruments adjusted to be commensurate with the credit risk, overhead costs, and optionality of such instruments.
First Century Bankshares, Inc. Page 43
Table of Contents
14. Financial Instruments, Concentrations of Credit and Fair Values (continued)
The estimated fair value and the recorded book balances at December 31, 2009 and 2008 were as follows:
| 2009 | 2008 | |||||||||||
| Estimated Fair Value |
Carrying Amount |
Estimated Fair Value |
Carrying Amount | |||||||||
| (Dollars in Thousands) | (Dollars in Thousands) | |||||||||||
| Assets: |
||||||||||||
| Cash and cash equivalents |
$ | 17,342 | $ | 17,342 | $ | 16,459 | $ | 16,459 | ||||
| Securities available for sale |
60,840 | 60,840 | 72,849 | 72,849 | ||||||||
| Securities held to maturity |
19,416 | 19,076 | 17,444 | 17,286 | ||||||||
| Federal Home Loan Bank and Federal Reserve Bank stock |
1,635 | 1,635 | 1,635 | 1,635 | ||||||||
| Net loans |
292,380 | 282,041 | 306,707 | 293,930 | ||||||||
| Liabilities: |
||||||||||||
| Noninterest-bearing deposits |
$ | 45,548 | $ | 45,548 | $ | 53,598 | $ | 53,598 | ||||
| Deposits with no stated maturities |
137,027 | 137,027 | 130,102 | 130,102 | ||||||||
| Deposits with stated maturities |
169,093 | 167,745 | 178,167 | 174,331 | ||||||||
| Short-term borrowings |
15,267 | 15,267 | 22,658 | 22,658 | ||||||||
The estimation methodologies used to determine fair value are as follows: For those loans and deposits with floating interest rates it was presumed that the estimated fair value generally approximated the recorded book balances. Securities actively traded in a secondary market have been valued using quoted available market prices. Deposits with stated maturities have been valued using a present value discounted cash flow with a discount rate approximating current market rates for similar assets and liabilities. Deposits with no stated maturities have an estimated fair value equal to the amount payable on demand which is the recorded book balance. The net loan portfolio has been valued using a present value discounted cash flow. The discount rate used in these calculations is the federal funds sold rate adjusted for noninterest operating costs, credit losses, and assumed prepayment risk. Fair values for nonperforming loans are estimated using discounted cash flow analysis, or underlying collateral values, where applicable. Changes in assumptions or estimation methodologies may have a material effect on these estimated fair values.
The Corporation utilizes fair value measurements to record fair value adjustments to certain assets and to determine fair value disclosures. Securities available-for-sale are recorded at fair value on a recurring basis. Additionally, from time to time, the Corporation may be required to record at fair value other assets on a nonrecurring basis. These nonrecurring fair value adjustments typically involve application of lower of cost or market accounting or write-downs of individual assets.
Fair Value Hierarchy
The Corporation groups assets and liabilities at fair value in three levels, based on the markets in which the assets and liabilities are traded and the reliability of the assumptions used to determine fair value. These levels are:
Level 1 — Valuation is based upon quoted prices for identical instruments traded in active markets.
Level 2 — Valuation is based upon quoted prices for similar instruments in active markets, quoted prices for identical or similar instruments in markets that are not active, and model-based valuation techniques for which all significant assumptions are observable in the market.
Page 44 First Century Bankshares, Inc.
Table of Contents
14. Financial Instruments, Concentrations of Credit and Fair Values (continued)
Level 3 — Valuation is generated from model-based techniques that use at least one significant assumption not observable in the market. These unobservable assumptions reflect estimates of assumptions that market participants would use in pricing the asset or liability. Valuation techniques include use of option pricing models, discounted cash flow models and similar techniques.
Following is a description of valuation methodologies used for assets and liabilities recorded at fair value.
Investment Securities Available-for-Sale:
Investment securities available-for-sale are recorded at fair value on a recurring basis. Fair value measurement is based upon quoted prices, if available. If quoted prices are not available, fair values are measured using independent pricing models or other model-based valuation techniques such as the present value of future cash flows, adjusted for the security’s credit rating, prepayment assumptions and other factors such as credit loss assumptions.
Loans:
The Corporation does not record loans at fair value on a recurring basis. However, from time to time, a loan is considered impaired and an allowance for loan losses is established. Loans for which it is probable that payment of interest and principal will not be made in accordance with the contractual terms of the loan agreement are considered impaired. The fair value of impaired loans is estimated using one of several methods, including collateral value, recent appraisal value and /or tax assessed value, liquidation value and discounted cash flows. Those impaired loans not requiring an allowance represent loans for which the fair value of the expected repayments or collateral exceed the recorded investments in such loans. At December 31, 2009, substantially all of the total impaired loans were evaluated based on the fair value of the collateral. Impaired loans where an allowance is established based on the fair value of collateral require classification in the fair value hierarchy. When the fair value of the collateral is based on an observable market price or a current appraised value, the Corporation records the impaired loan as nonrecurring Level 2. When an appraised value is not available or management determines the fair value of the collateral is further impaired below the appraised value and there is no observable market price, the Corporation records the impaired loan as nonrecurring Level 3.
Foreclosed Assets / Repossessions:
Foreclosed assets and repossessions are adjusted to fair value upon transfer of the loans to foreclosed assets and repossessions. Subsequently, foreclosed asset and repossessions are carried at the lower of carrying value or fair value. Fair value is based upon independent market prices, appraised values of the collateral or management’s estimation of the value of the collateral. When the fair value of the collateral is based on an observable market
First Century Bankshares, Inc. Page 45
Table of Contents
14. Financial Instruments, Concentrations of Credit and Fair Values (continued)
price or a current appraised value, the Corporation records the foreclosed asset as nonrecurring Level 2. When an appraised value is not available or management determines the fair value of the collateral is further impaired below the appraised value and there is no observable market price, the Corporation records the foreclosed asset or repossession as nonrecurring Level 3.
The following table presents information about the Company’s assets and liabilities measured at fair value on a recurring and nonrecurring basis as of December 31, 2009, and indicates the fair value hierarchy of the valuation techniques utilized by the Company to determine such fair value.
| Fair Value Measurements at December 31, 2009, Using | ||||||||||||||||||||
| Description |
|
Fair Value December 31, 2009 |
|
Quoted Prices in Active Markets Identical Assets (Level 1) |
|
Significant Other Observable Inputs (Level 2) |
|
Significant Unobservable Inputs (Level 3) | ||||||||||||
| Assets and liabilities measured on a recurring basis: |
||||||||||||||||||||
| Available-for-sale securities |
$ | 60,840 | $ | — | $ | 60,840 | $ | — | ||||||||||||
| Total |
$ | 60,840 | $ | — | $ | 60,840 | $ | — | ||||||||||||
| Assets and liabilities measured |
||||||||||||||||||||
| on a nonrecurring basis: |
||||||||||||||||||||
| Impaired loans |
$ | 6,907 | $ | — | $ | 6,907 | $ | — | ||||||||||||
| Foreclosures and repossessions |
2,609 | — | 2,609 | — | ||||||||||||||||
| Total |
$ | 9,516 | $ | — | $ | 9,516 | $ | — | ||||||||||||
15. Regulatory Matters
The Corporation’s principal source of funds for dividend payment and debt service is dividends received from the subsidiary bank.
Under applicable Federal laws, the Comptroller of the Currency, the primary regulator of First Century Bank, N.A., restricts the total dividend payments of a national bank in any calendar year to the net profits of that year, as defined, combined with the retained net profits of the two preceding years. At December 31, 2009, FCBNA had negative retained net profits for the years 2009 and 2008, of approximately $405,000.
The Corporation and its subsidiary are subject to various regulatory capital requirements administered by the federal banking agencies. Failure to meet minimum capital requirements can initiate certain mandatory, and possibly additional discretionary, actions by regulators that, if undertaken, could have a direct material effect on the Corporation’s financial statements. Under capital adequacy guidelines and the regulatory framework for prompt corrective action, the Corporation and its subsidiary must meet specific capital guidelines that involve quantitative measures of the Corporation’s assets, liabilities, and certain off-balance-sheet items as calculated under regulatory accounting practices. The Corporation’s capital amounts and classifications are also subject to qualitative judgments by the regulators about components, risk weightings and other factors.
Page 46 First Century Bankshares, Inc.
Table of Contents
15. Regulatory Matters (continued)
Quantitative measures established by regulation to ensure capital adequacy require the Corporation and its subsidiary to maintain minimum amounts and ratios (set forth in the following table) of total and Tier I capital (as defined in the regulations) to risk–weighted assets (as defined), and Tier I capital to average assets (as defined). Management believes, as of December 31, 2009, that the Corporation and its subsidiary meet all capital adequacy requirements to which they are subject.
As of December 31, 2009, First Century Bank, N.A. has received notification from the Office of the Comptroller of the Currency that it is well–capitalized under the regulatory framework for prompt corrective action. To be adequately capitalized, minimum total risk–based, Tier I risk–based, and Tier I leverage ratios as set forth in the following table must be maintained. There are no conditions or events since the recent notification that management believes have changed the institution’s category.
| Actual | For Capital Adequacy Purposes |
To Be Well Capitalized Under Prompt Corrective Action Provisions |
||||||||||||||||||
| Amount | Ratio | Amount | Ratio | Amount | Ratio | |||||||||||||||
| As of December 31, 2009: |
||||||||||||||||||||
| Total Capital (to Risk Weighted Assets): |
||||||||||||||||||||
| Consolidated |
$ | 40,524 | 13.56 | % | ³ | $23,901 | ³ | 8.00 | % | |||||||||||
| First Century Bank, N.A. |
$ | 38,980 | 13.07 | % | ³ | $23,850 | ³ | 8.00 | % | ³ | $29,813 | ³ | 10.00 | % | ||||||
| Tier I Capital (to Risk Weighted Assets): |
||||||||||||||||||||
| Consolidated |
$ | 36,790 | 12.31 | % | ³ | $11,950 | ³ | 4.00 | % | |||||||||||
| First Century Bank, N.A. |
$ | 35,246 | 11.82 | % | ³ | $11,925 | ³ | 4.00 | % | ³ | $17,888 | ³ | 6.00 | % | ||||||
| Tier I Capital (to Average Assets): |
||||||||||||||||||||
| Consolidated |
$ | 36,790 | 8.92 | % | ³ | $16,495 | ³ | 4.00 | % | |||||||||||
| First Century Bank, N.A. |
$ | 35,246 | 8.55 | % | ³ | $16,481 | ³ | 4.00 | % | ³ | $20,602 | ³ | 5.00 | % | ||||||
| Actual | For Capital Adequacy Purposes |
To Be Well Capitalized Under Prompt Corrective Action Provisions |
||||||||||||||||||
| Amount | Ratio | Amount | Ratio | Amount | Ratio | |||||||||||||||
| As of December 31, 2008: |
||||||||||||||||||||
| Total Capital (to Risk Weighted Assets): |
||||||||||||||||||||
| Consolidated |
$ | 40,843 | 13.30 | % | ³ | $24,574 | ³ | 8.00 | % | |||||||||||
| First Century Bank, N.A. |
$ | 39,394 | 12.84 | % | ³ | $24,546 | ³ | 8.00 | % | ³ | $30,683 | ³ | 10.00 | % | ||||||
| Tier I Capital (to Risk Weighted Assets): |
||||||||||||||||||||
| Consolidated |
$ | 38,143 | 12.42 | % | ³ | $12,287 | ³ | 4.00 | % | |||||||||||
| First Century Bank, N.A. |
$ | 36,694 | 11.96 | % | ³ | $12,273 | ³ | 4.00 | % | ³ | $18,410 | ³ | 6.00 | % | ||||||
| Tier I Capital (to Average Assets): |
||||||||||||||||||||
| Consolidated |
$ | 38,143 | 8.93 | % | ³ | $17,087 | ³ | 4.00 | % | |||||||||||
| First Century Bank, N.A. |
$ | 36,694 | 8.60 | % | ³ | $17,073 | ³ | 4.00 | % | ³ | $21,341 | ³ | 5.00 | % | ||||||
First Century Bankshares, Inc. Page 47
Table of Contents
16. Parent Company Financial Data
Condensed financial information of First Century Bankshares, Inc. (parent company only) is presented below:
STATEMENTS OF FINANCIAL CONDITION
| December 31, | ||||||||||
| 2009 | 2008 | |||||||||
| Assets: | (Dollars in Thousands) | |||||||||
| Cash |
$ | 247 | $ | 387 | ||||||
| Investment in subsidiaries at equity |
38,566 | 40,399 | ||||||||
| Other assets |
672 | 839 | ||||||||
| TOTAL ASSETS |
$ | 39,485 | $ | 41,625 | ||||||
| Liabilities: |
||||||||||
| Other liabilities |
$ | 29 | $ | 260 | ||||||
| TOTAL LIABILITIES |
29 | 260 | ||||||||
| Stockholders’ Equity: |
||||||||||
| Common stock–$1.25 par value; 10,000,000 shares authorized and 2,000,000 shares issued at December 31, 2009 and 2008; and 1,903,120 shares outstanding at December 31, 2009, and 2008 |
2,500 | 2,500 | ||||||||
| Paid-in capital |
757 | 757 | ||||||||
| Retained earnings |
38,479 | 40,388 | ||||||||
| Treasury stock, at cost; 96,880 shares at December 31, 2009 and 2008 |
(2,280 | ) | (2,280 | ) | ||||||
| TOTAL STOCKHOLDERS’ EQUITY |
39,456 | 41,365 | ||||||||
| TOTAL LIABILITIES AND STOCKHOLDERS’ EQUITY |
$ | 39,485 | $ | 41,625 | ||||||
| STATEMENTS OF INCOME |
||||||||
| Years Ended December 31, |
||||||||
| 2009 | 2008 | |||||||
| (Dollars in Thousands) |
||||||||
| Income: |
||||||||
| Dividends from subsidiary bank |
$ | 1,830 | $ | 2,565 | ||||
| Other income |
— | — | ||||||
| TOTAL INCOME |
1,830 | 2,565 | ||||||
| Expenses: |
||||||||
| Other |
134 | 136 | ||||||
| TOTAL EXPENSES |
134 | 136 | ||||||
| Applicable income taxes (benefits) |
(55 | ) | (51 | ) | ||||
| Income before equity in undistributed |
1,751 | 2,480 | ||||||
| Equity in undistributed net income of subsidiaries |
(1,436 | ) | 1,205 | |||||
| NET INCOME |
$ | 315 | $ | 3,685 | ||||
Page 48 First Century Bankshares, Inc.
Table of Contents
16. Parent Company Financial Data (continued)
STATEMENT OF CASH FLOWS
| Years Ended December 31, |
||||||||
| 2009 | 2008 | |||||||
| Cash flows from operating activities | (Dollars in Thousands) | |||||||
| Net income |
$ | 315 | $ | 3,685 | ||||
| Adjustments to reconcile net income to net cash |
||||||||
| Equity in undistributed net income of subsidiary |
1,436 | (1,205 | ) | |||||
| Other adjustments, net |
(64 | ) | (58 | ) | ||||
| NET CASH PROVIDED BY OPERATING ACTIVITIES |
1,687 | 2,422 | ||||||
| Cash flows from investing activities |
||||||||
| Investment in subsidiary |
— | — | ||||||
| NET CASH USED BY INVESTING ACTIVITIES |
— | — | ||||||
| Cash flows from financing activities |
||||||||
| Purchase of treasury stock |
— | (161 | ) | |||||
| Cash received from stock option exercise |
— | 10 | ||||||
| Cash dividends paid |
(1,827 | ) | (2,116 | ) | ||||
| NET CASH USED BY FINANCING ACTIVITIES |
(1,827 | ) | (2,267 | ) | ||||
| Net increase (decrease) in cash |
(140 | ) | 155 | |||||
| Cash at January 1, |
387 | 232 | ||||||
| Cash at December 31, |
$ | 247 | $ | 387 | ||||
First Century Bankshares, Inc. Page 49
Table of Contents
Management’s Annual Report on Internal Control Over Financial Reporting.
Our management is responsible for establishing and maintaining adequate internal control over financial reporting (as such term is defined in Rule 13a-15(f) under the Exchange Act). Our internal control over financial reporting includes those policies and procedures that (i) pertain to the maintenance of records that, in reasonable detail, accurately and fairly reflect the transactions and dispositions of our assets; (ii) provide reasonable assurance that transactions are recorded as necessary to permit preparation of financial statements in accordance with generally accepted accounting principles, and that our receipts and expenditures are being made only in accordance with authorizations of our management and directors; and (iii) provide reasonable assurance regarding prevention or timely detection of unauthorized acquisition, use, or disposition of our assets that could have a material effect on the financial statements.
Because of the inherent limitations in any internal control, no matter how well designed, misstatements may occur and not be prevented or detected. Accordingly, even effective internal control over financial reporting can provide only reasonable assurance with respect to financial statement preparation. Further, the evaluation of the effectiveness of internal control over financial reporting was made as of a specific date, and continued effectiveness in future periods is subject to the risks that controls may become inadequate because of changes in conditions or that the degree of compliance with the policies and procedures may decline.
Management conducted an evaluation of the effectiveness of our system of internal control over financial reporting as of December 31, 2009 based on the framework set forth in “Internal Control—Integrated Framework” issued by the Committee of Sponsoring Organizations of the Treadway Commission. Based on its evaluation, management concluded that, as of December 31, 2009, First Century Bankshares, Inc.’s internal control over financial reporting was effective.
This annual report does not include an attestation report of the company’s registered public accounting firm regarding internal control over financial reporting. Management’s report was not subject to attestation by the company’s registered public accounting firm pursuant to temporary rules of the Securities and Exchange Commission that permit the company to provide only management’s report in this annual report.
Date: March 10, 2010
|
|

| |
| R. W. Wilkinson President and Chief Executive Officer |
J. Ronald Hypes, Treasurer (Principal Financial Officer) |
Page 50 First Century Bankshares, Inc.
Table of Contents
Report of Independent Registered Public Accounting Firm
To the Board of Directors and Stockholders
First Century Bankshares, Inc.
and Subsidiaries
Bluefield, West Virginia
We have audited the accompanying consolidated statements of financial condition of First Century Bankshares, Inc. and Subsidiaries as of December 31, 2009 and 2008, and the related consolidated statements of income, changes in stockholders’ equity, and cash flows for the years then ended. The Company’s management is responsible for these consolidated financial statements. Our responsibility is to express an opinion on these consolidated financial statements based on our audits.
We conducted our audits in accordance with the standards of the Public Company Accounting Oversight Board (United States). Those standards require that we plan and perform the audit to obtain reasonable assurance about whether the financial statements are free of material misstatement. The Company is not required to have, nor were we engaged to perform, an audit of its internal control over financial reporting. Our audit included consideration of internal control over financial reporting as a basis for designing audit procedures that are appropriate in the circumstances, but not for the purpose of expressing an opinion on the effectiveness of the Company’s internal control over financial reporting. Accordingly, we express no such opinion. An audit also includes examining, on a test basis, evidence supporting the amounts and disclosures in the financial statements. An audit also includes assessing the accounting principles used and significant estimates made by management, as well as evaluating the overall financial statement presentation. We believe that our audits provide a reasonable basis for our opinion.
In our opinion, the consolidated financial statements referred to above present fairly, in all material respects, the financial position of First Century Bankshares, Inc. and Subsidiaries as of December 31, 2009 and 2008, and the results of its operations and its cash flows for the years then ended in conformity with accounting principles generally accepted in the United States of America.
/s/ Brown, Edwards & Company, L.L.P.
CERTIFIED PUBLIC ACCOUNTANTS
Bluefield, West Virginia
March 13, 2010
First Century Bankshares, Inc. Page 51
Table of Contents
Directors
FIRST CENTURY BANKSHARES, INC.
| J. Richard Chambers CEO and Managing Member J.R. Chambers and Associates, LLC
W. Paul Cole, Jr. President, Cole Chevrolet-Cadillac
B. L. Jackson, Jr. Chairman of the Board First Century Bankshares, Inc.
Robert M. Jones, Jr., M.D. Physician; Vice Chairman, First Century Bankshares, Inc. |
Samuel V. Jones, CPA Hodges, Jones and Mabry, P.C.
Marshall S. Miller President, Marshall Miller & Associates
Charles A. Peters Formerly, President, Peters Equipment, Inc. |
John H. Shott Attorney
Walter L. Sowers President, Pemco Corporation
William Chandler Swope President, Swope Construction Services, Inc.
J. Brookins Taylor, M.D. Physician |
Frank W. Wilkinson President & Chief Operating Officer, First
Century Bank, N.A.,
R. W. Wilkinson President & Chief Chairman & Chief Executive Officer, First Century |
FIRST CENTURY BANK, N.A.
| C. Scott Briers President, Briers, Inc.
W. Paul Cole, Jr. President, Cole Chevrolet-Cadillac
B. L. Jackson, Jr. Chairman of the Board First Century Bankshares, Inc. |
Robert M. Jones, Jr., MD Physician; Vice Chairman, First Century Bankshares, Inc.
Samuel V. Jones, CPA Hodges, Jones and Mabry, P.C.
Charles A. Peters Formerly, President, Peters Equipment, Inc. |
John H. Shott Attorney
Walter L. Sowers President, Pemco Corporation
William Chandler Swope President, Swope Construction Services, Inc.
J. Brookins Taylor, M.D. Physician |
Frank W. Wilkinson President & Chief Operating Officer, First
Century Bank, N.A.,
R. W. Wilkinson President & Chief Chairman & Chief Executive Officer, First Century |
FIRST CENTURY BANK, N.A.
WYOMING COUNTY OPERATIONS ADVISORY BOARD
| Michelle Brown, DDS Oceana Dental Center
Tom Evans, Jr. Private Investor |
Debra L. Brunty Vice President-Loans Wyoming County Operations, First Century Bank, N.A. |
Frank W. Wilkinson President & Chief Operating Officer, First
Century Bank, N.A., |
Dennis Worrell Partner, Worrell Exxon & Owner, D & T Car Wash
R. W. Wilkinson President & Chief Chairman & Chief Executive Officer, First Century |
Page 52 First Century Bankshares, Inc.
Table of Contents
Boards of
Directors
FIRST CENTURY BANK, N.A.
WYTHE COUNTY OPERATIONS ADVISORY BOARD
| Eric Deaton Chief Executive Officer
|
Robert T. Dupuis President, P & T Products, Inc.
Samuel V. Jones, CPA Hodges, Jones & Mabry, PC
|
W. Edward Smith Vice President, Wythe County Operations First Century Bank, N.A.
Frank W. Wilkinson President & Chief Operating |
R. W. Wilkinson President & Chief Chairman & Chief Executive |
FIRST CENTURY BANK, N.A.
SUMMERS COUNTY OPERATIONS ADVISORY BOARD
| C. Scott Briers President, Briers, Inc.
James S. Kerr Owner Kerr Realty |
David L. Parmer Attorney at Law
Bob Richmond Retired, First Century Bank N.A. |
Bill J. Keaton Vice President, Summers County Operations First Century Bank N.A.
Frank W. Wilkinson President & Chief Operating
|
R. W. Wilkinson President & Chief Chairman & Chief Executive |
FIRST CENTURY BANK, N.A.
RALEIGH COUNTY OPERATIONS ADVISORY BOARD
| Thomas S. Acker Executive Director Forward Southern West Virginia
William H. Baker Chairman of the Board Forward Southern West Virginia |
Carl D. Bowman Assistant Vice President & City Executive Raleigh County First Century Bank, N.A. |
R. Woodrow Duba General Manager Beaver Coal Company, Limited Frank W. Wilkinson President & Chief Operating Officer, First Century Bank, N.A., |
R. W. Wilkinson President & Chief Chairman & Chief
Executive Officer, First Century |
First Century Bankshares, Inc. Page 53
Table of Contents
FIRST CENTURY BANKSHARES, INC.
| B. L. Jackson, Jr. |
Robert M. Jones, Jr., MD |
W. E. Albert |
J. Ronald Hypes | |||
| Chairman of the Board | Vice Chairman of the Board |
Assistant Secretary |
Treasurer | |||
| R. W. Wilkinson |
Frank W. Wilkinson |
|||||
| President and Chief Executive Officer |
Secretary |
|||||
| FIRST CENTURY BANK, N.A. | ||||||
| ADMINISTRATION
R. W. Wilkinson Chairman and Chief Executive Officer
Frank W. Wilkinson President & Chief Operating Officer
J. Ronald Hypes Senior Vice President & Chief Financial Officer
John D. Lay Vice President & Controller
Wayne L. Blevins Assistant Controller & Trust Officer
Barbara Moore-Ray Community Development Officer
Cynthia Higgins-Atwell Vice President Internal Audit & Compliance
Lisa A. Huff Vice President Human Resources
Michael G. Scott IT Manager
Deborah L. Bowman Marketing Director
Matthew W. Barnett BSA/Security Officer
BRANCH ADMINISTRATION
Bill J. Keaton Vice President, Summers County Operations
W. Edward Smith Vice President, Wythe County Operations
Debra Brunty Vice President-Loans, Wyoming County Operations |
Carl D. Bowman Assistant Vice President & City Executive Raleigh County
Brenda G. Davidson Branch Manager & Loan Officer, Bluefield, Virginia Office
Karen R. Kidd Branch Manager/ Assistant Cashier, College Avenue Office
Lynn Daniels Assistant Vice President Wyoming County Operations
Sandra K. Taylor Branch Manager, Pineville Office
Wanda Blair Branch Manager & Loan Officer, Fort Chiswell Office
Kathy L. Peters Assistant Vice President,
Linda C. Hamer Customer Service Manager
Michelle L. Beck Assistant Vice President, Princeton Office
Stephanie Bailey Assistant Branch Manager, Oceana Office
Linda C. Rider IRA Coordinator
Sharon Cole Assistant Cashier Hinton Office
Nancy M. Cales Assistant Cashier Hinton Office |
LOANS
Jeffery L. Forlines Senior Vice President, Chief Credit Officer
Garnett L. Little Vice President, Loans
Randall D. Price Vice President, Credit Administration Officer
Hal L. Absher Director of Secondary Mortgage Lending
Randy N. Bowles Assistant Vice President, Summers County Office
Barry W. Whitt Assistant Vice President, Loans
Charlene R. Maynard Assistant Vice President, Loans
Rick D. Blevins Consumer Loan Officer, Princeton Office
Shela D. Acord Consumer Loan Officer, Pineville Office
Vicky C. Eggleston Consumer Loan Officer, Wytheville Office
Charles E. Lester Collections Officer
Jean F. Stanley Assistant Cashier, Princeton Office
Janet L. Whitten Assistant Cashier
Margot A. Bower Mortgage Loan Officer Beckley Office |
OPERATIONS
W. E. Albert Senior Vice President & Cashier
Lonnie E. Cochran Vice President, Operations
Martha B. Cooper Assistant Vice President, Operations
Harold A. Mitchell Assistant Vice President, Imaging
Angela M. James Director of Treasury Management
Judy A. Cecil Assistant Cashier
TRUST
John P. Beckett, Jr. Senior Vice President & Trust Officer
Julie H. Johnson Vice President & Trust Officer
Drew E. Porter Vice President & Trust Officer
Mary A. Musser Trust Officer
Mary Sue Anderson Assistant Trust Officer | |||
Page 54 First Century Bankshares, Inc.
Table of Contents
Bankshares, Inc.
First Century Bank, N.A.
Locations
500 Federal Street
Bluefield, WV 24701
(304) 325–8181
525 Federal Street
Bluefield, WV 24701
(304) 324-3286
2020 College Avenue
Bluefield, WV 24701
(304) 327–5660
1223 Stafford Drive
Pine Plaza, Princeton, WV 24740
(304) 425–0856
145 Springhaven Drive
Princeton, WV 24740
(304) 431-7617
108 Spruce Street
Bluefield, VA 24605
(276) 326-2606
Rt. 10, Cook Parkway
Oceana, WV 24870
(304) 682–6221
Rt. 10, East Pineville
Pineville, WV 24874
(304) 732–8850
321 Temple Street
Hinton, WV 25951
(304) 466-2311
200 Pepper’s Ferry Road
Wytheville, VA 24382
(276) 223–1115
148 Ivanhoe Road
Max Meadows, VA 24360
(276) 637–3100
1826 Harper Road
Beckley, WV 25801
(304) 255-4560