Attached files
| file | filename |
|---|---|
| 8-K - FORM 8-K - Pinnacle Foods Finance LLC | d8k.htm |
 Pinnacle Foods Finance LLC Barclays Capital 2010 High Yield Bond & Syndicated Loan Conference March 25, 2010 Exhibit 99.1 |
 Disclosures Forward-looking statements should not be read as a guarantee of future performance or results, and will not necessarily be accurate indications of the times at, or by which, such performance or results will be achieved or whether such performance or results will ever be achieved. Forward- looking information is based on information available at the time and management’s good faith belief with respect to future events, and is subject to risks and uncertainties that could cause actual performance or results to differ materially from those expressed in the statements. Forward-looking statements speak only as of the date the statements are made. Pinnacle Foods Finance LLC (“Pinnacle Foods,” “Pinnacle” or the “Company”) assumes no obligation to update forward-looking statements
to reflect actual results, changes in assumptions or changes in other
factors affecting forward-looking information except to the extent required
by applicable securities laws. If the Company does update one or more forward-looking statements, no inference should be drawn that the Company will make additional updates with respect thereto or with respect to other forward-looking statements. SEC rules regulate the use of “non-GAAP financial measures” in public disclosures, such as “EBITDA” and “Consolidated EBITDA”, that are derived on the basis of methodologies other than in accordance with generally accepted accounting principles, or “GAAP”. These rules govern
the manner in which non-GAAP financial measures may be publicly
presented and prohibit in all filings with the SEC, among other things: exclusion of charges or liabilities that require, or will require, cash settlement or would have required cash settlement, absent an ability to settle in another manner, from a non-GAAP financial measure; and adjustment of a non-GAAP financial measure to eliminate or smooth items identified as non-recurring, infrequent or unusual, when the nature of the charge or gain is such that it has occurred in the past two years or is reasonably likely to recur within the next two years. We have included non-GAAP financial measures in this presentation, including EBITDA, Consolidated EBITDA and “Inventory (excluding certain items)” that may not comply with the SEC rules governing the presentation of non-GAAP financial measures. In addition, our measurements of Consolidated EBITDA are based on definitions of EBITDA included in the indentures governing the Company’s existing senior notes and senior subordinated notes and our senior credit facilities and, as a result, may not be comparable to those of other companies. For a presentation of net earnings as calculated under GAAP and a reconciliation to our EBITDA and Consolidated EBITDA, later in this presentation. |
 Ideal
Addition to the Pinnacle Portfolio Iconic brand with #1 market position in $2.3B frozen vegetable category Products well aligned with current consumer preferences: health & nutrition, quality and convenience Successful history of innovation and new product development Improves Operating Capabilities of Both Businesses Combination results in diversified scale player with leading EBITDA margins among peer group Combined portfolio enhances retail coverage, especially within frozen food segment Specialty food group complementary to Pinnacle’s baking and canned meat businesses Achievable Integration / Synergies The combination will deliver
strong synergies Similar business lines, sales coverage, and information systems enhance integration |
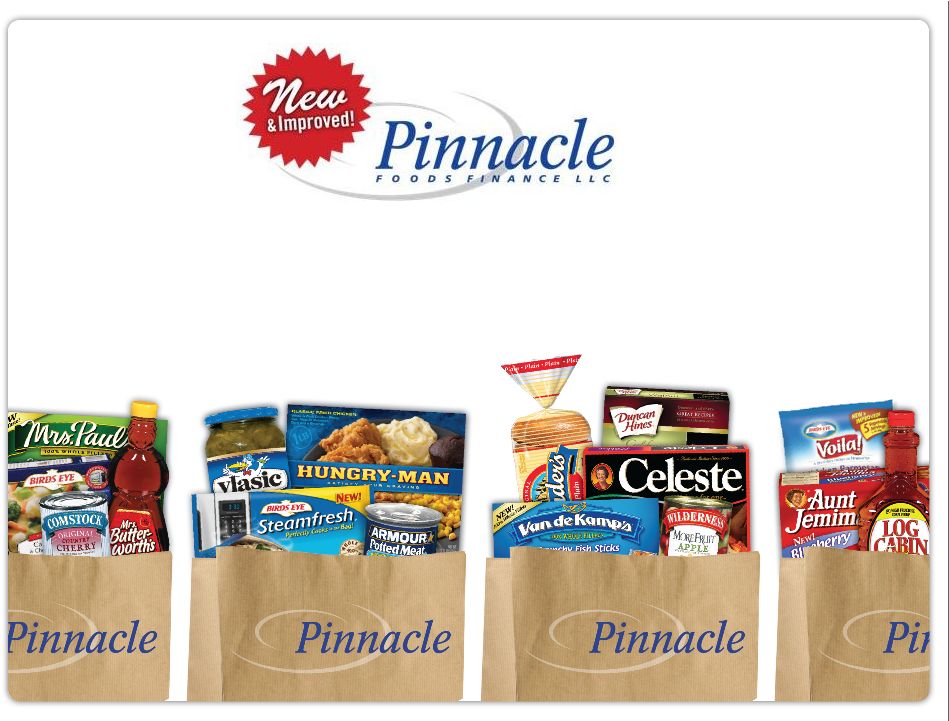
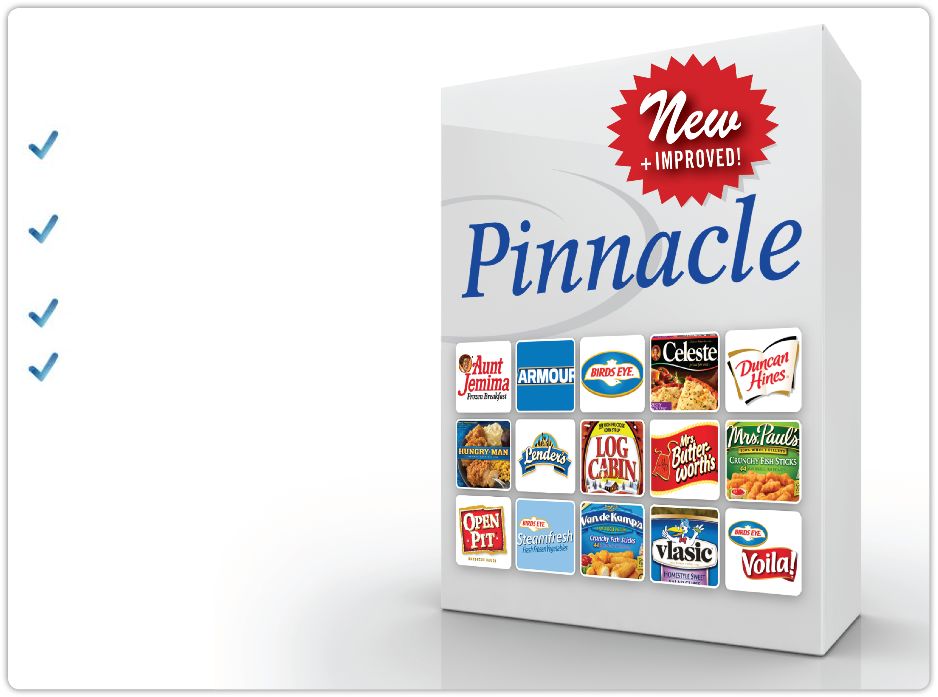
 Combination Delivers Balanced, Complementary Portfolio that Provides Diversity and Stability 1. Baking, Toppings, and Fillings include Duncan Hines, Comstock and Wilderness. Snacks and Enhancers includes Vlasic, Mrs. Butterworth’s, Log Cabin, Country Kitchen, Open Pit, Snyders of Berlin, Tim’s Cascade, and Bernstein’s. Canned Meat and Beans includes Armour, Brooks and Nalley. Frozen Meals and Entrees includes Hungry-Man, Aunt Jemima, Birds Eye Voila!, Birds Eye Steamfresh meals, Van de Kamp’s, Mrs. Paul’s, Celeste, Lender’s and Swanson. Frozen Vegetables and Sides includes Birds Eye and Birds Eye Steamfresh vegetables. Other includes Foodservice, Private Label, Canada, Industrial Frozen and Other Brands. The above brands are registered trademarks or used under license.
($s in millions) Birds Eye 2009 Net Sales: $905 Pinnacle 2009 Net Sales: $1,643 Pro Forma Combined 2009 Net Sales 1 : $2,548 |
 …and Creates a New Mid-Cap Food Company Mid-cap Small-cap EBITDA Pinnacle & Birdseye Pinnacle Stand Alone Birds Eye Stand Alone Company A Company B Company C Company D Company E Company F Company G Company H Company I Company J Company K Company L |
 To become a leading publicly-owned food company by creating a compelling investment opportunity through the strength of our brands and people.
|
 Strategic Summary Become a leading publicly-owned food company by creating a
compelling investment opportunity through the strength of our brands and people. Objective Our Seven Key Strategies 1 2 3 4 5 6 7 Growth Platform People Platform Productivity Platform Maximize the value of our Brands Integrate Birds Eye Win at retail Enhance our corporate reputation Generate productivity for reinvestment Conquer complexity Build a high performing team Brand Portfolio Review Integration Status Productivity Update |
 Iconic, Leading Brand Equities (52-Weeks Ending February 2010) 1. Aunt Jemima holds #1 share in frozen pancakes and French toast. 2. Combined market position among branded players. 3. Birds Eye Voila! holds the #1 market position in the value sub-segment of frozen
complete bagged meals. 4. Armour holds #1 market position in the Vienna sausage, potted meat and sliced beef segments. Category Segments Major Brands Category Size ($mm) Market Position IRI Market Share Frozen Vegetables $2,325 #1 26.8 Shelf-Stable Pickles, Peppers and Relish $975 #1 18.9 Baking Mixes and Frostings $1,448 #2 17.7 Frozen Waffles, Pancakes and French Toast 1 $684 #2 12.4 Frozen Pizza-for-One $703 #2 10.1 Frozen Prepared Seafood 2 $620 #2 18.8 Frozen Complete Bagged Meals 3 $598 #2 15.4 Frozen Breakfast Entrées / Savory Handhelds $740 #2 9.8 Table Syrups 2 $480 #2 19.5 Canned Meat 4 $1,182 #2 7.5 Bagels $652 #3 8.7 Single-Serve Frozen Dinners and Entrées 2 $1,981 #4 10.0 Pinnacle competes in attractive growing categories and holds the #1 or #2 market position in 10 of the 12
major category segments |
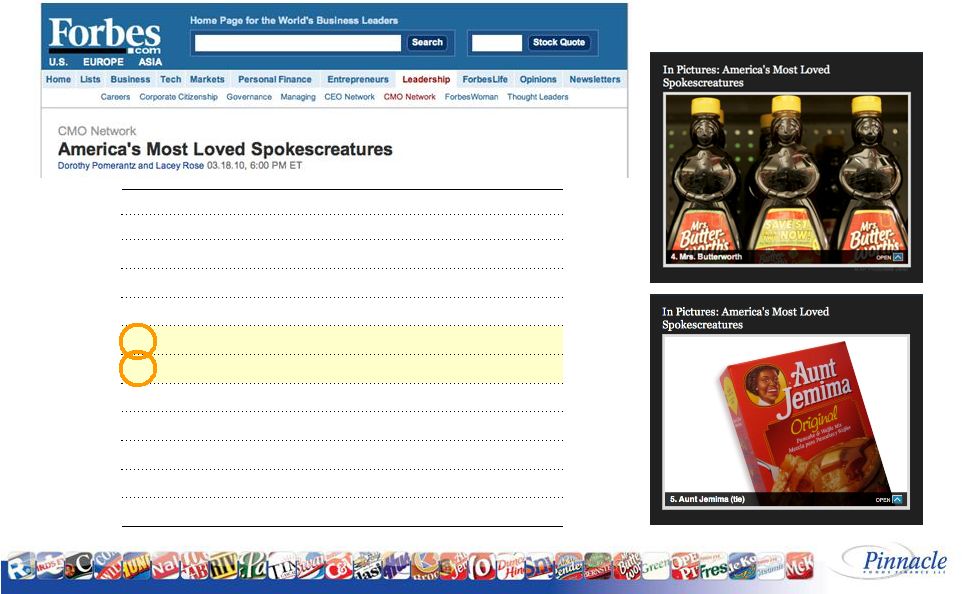 Mrs. Butterworth’s #4 and Aunt Jemima #5 on Forbes’ “America’s Most Loved Spokescreatures” List Forbes America’s Most Loved Spokescreatures Rank Spokescreature 1 M&Ms 2 Pillsbury Doughboy 3 Tony the Tiger 4 Mrs. Butterworth’s 5 Aunt Jemima / Geico Gecko (tie) 6 -- 7 AFLAC Duck 8 Snap, Crackle & Pop 9 Colonel Sanders 10 Kool-Aid Man / Nesquik Bunny (tie) |
 Brand Renovation and Innovation are Important Growth Drivers Updated Packaging Product Improvements Seafood: Whole Fish Fillets Log Cabin: No HFCS Duncan Hines: Whole Grain Muffins New Products |
 Birds Eye Integration Effort is Tightly Managed by a Steering Committee, Program Office and 18 Functional Taskforce Leaders Program Office Steering Committee Cash Management (Cash In) Financial Controls / Shared Services (Cash Out) Customer Service / Order Entry Facilities and Office Space Resolving Corporate Legal Matters Day 1 Org (Retention, Relocation, etc.) Payroll & Benefits Organizational Design (ORG Design, Culture, G&A Synergies) Internal and External Communications IT Systems Logistics / Distribution Procurement Sales Process / Brokerage Synergies S&OP Marketing Strategy Trade Spend / Sales Promotion Manufacturing R&D / QA / New Products 1 2 3 4 5 6 7 13 12 11 10 9 8 14 15 16 17 18 |
 We
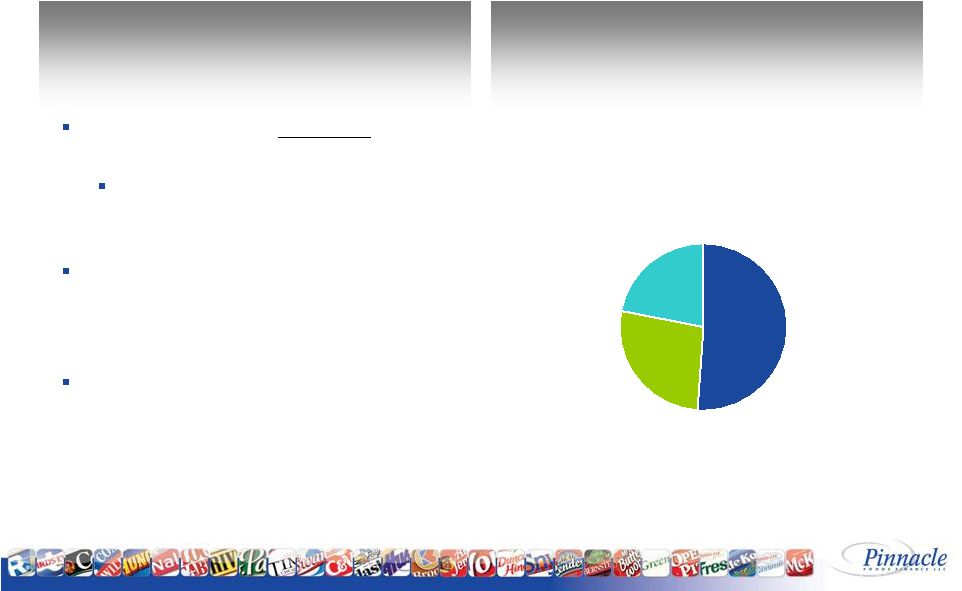
are On Track to Achieve Planned Synergies Significant Identified Synergies Expect to achieve a minimum of $45 million of annual cost savings Requires incremental ~$26 million of one-time costs and $3 million of one-time capex to achieve Synergies achieved through elimination of duplicative functions, procurement savings and optimization of combined distribution network Actions to achieve full synergy run rate will be implemented in the first half, with half the annual savings realized in 2010 and the full annual savings realized in 2011 Synergy Overview Total Synergies = $45 million SG&A 51% Procurement 27% Logistics 22% |
 Accelerating Productivity Initiatives $40 – 50 Million Opportunity Product Design Product Design Product Design Logistics Logistics Logistics Manufacturing Manufacturing Manufacturing Purchasing Purchasing Purchasing 2008 2009 2010 Target Targeting $40-$50 million per year (3.5% 4.0% of costs of products sold) Productivity and pricing actions designed to partially offset commodity increases Structured, multi-functional team and process in place Multi-year capital investment to accelerate productivity |
 2009 Financials |
 2009
Performance ($s in millions) Fiscal 2007 Fiscal 2008 Fiscal 2009 Net Sales $1,515 $1,556 $1,643 % Change from Year Prior 2.9% 2.8% 5.6% Consolidated EBITDA (Excluding Birds Eye and net cost savings projected to be realized) $ 232 $ 223 $ 248 % Change from Year Prior 10.3% -3.7% 11.2% % Net Sales 15.3% 14.3% 15.1% Consolidated EBITDA (per Senior Credit Facility and Bond Indentures) $ 242 $ 232 $ 472 |
 Adjusted EBITDA Reconciliation ($s in millions) Fiscal 2007 Fiscal 2008 Fiscal 2009 Net earnings (loss), as reported and as calculated under GAAP $ (115) $ (29) $ 303 Provision (benefit) for taxes based on income 31 27 (278) Consolidated interest expense 162 153 121 EBIT, as reported 78 151 146 Consolidated depreciation and amortization expense 56 63 65 EBITDA 134 214 211 Adjustments per Senior Credit Facility and Bond Indentures Non-cash items 43 4 5 Non-recurring items 52 3 30 Other adjustment items 3 3 2 Consolidated EBITDA (before acquired EBITDA and net cost savings projected to be realized) $ 232 $ 223 $ 248 Net cost savings projected to be realized as a result of initiatives taken 11 9 12 Acquired EBITDA – Birds Eye acquisition (including variable contribution from brands no longer being offered) 167 Estimated synergies associated with the Birds Eye acquisition 45 Consolidated EBITDA (per Senior Credit Facility and Bond Indentures) $ 242 $ 232 $ 472 |
 Strong Cash Flow Aided by Significant Tax Benefits Diversified portfolio in stable industry Lower cash interest expense Significant tax assets which will result in minimal cash taxes over next several years Continued focus on improving working capital efficiency * Free cash flow defined as Bank Adjusted EBITDA less cash interest, cash taxes, capital
expenditures and change in working capital. Generated $87 million free cash flow* in 2009 |
 2009
Debt Structure ($s in millions) December 2009 Revolving Credit Facility $ -- Term Loan 2,072 Senior Notes 625 Senior Subordinated Notes 199 Other Debt 5 Total Debt 2,901 Cash (60) Total Net Debt 2,841 Total Leverage Ratio (per Senior Credit Facility and Bond Indentures) 6.0 |
 Food for Thought: Strong 2009 Financial Results Acquisition of Birds Eye Strengthens Company Integration Progressing Well Executing Focused Go Forward Strategy |