Attached files
UNITED
STATES SECURITIES AND EXCHANGE COMMISSION
Washington, D.C.
20549
Form 10-K
(Mark
One)
|
þ
|
ANNUAL
REPORT PURSUANT TO SECTION 13 OR 15(d) OF THE SECURITIES EXCHANGE ACT
OF 1934
|
|
For
the fiscal year ended January 25, 2010
|
|
|
or
|
|
|
o
|
TRANSITION
REPORT PURSUANT TO SECTION 13 OR 15(d) OF THE SECURITIES EXCHANGE ACT
OF 1934
|
Commission
File Number 1-11313
CKE
Restaurants, Inc.
(Exact
name of registrant as specified in its charter)
|
Delaware
|
33-0602639
|
|
(State
or other jurisdiction of
|
(I.R.S.
Employer
|
|
incorporation
or organization)
|
Identification
No.)
|
6307
Carpinteria Ave., Ste. A
Carpinteria,
California 93013
(Address
of principal executive offices)
Registrant’s
telephone number, including area code
(805) 745-7500
Securities
Registered Pursuant to Section 12(b) of the Act:
|
Title of Each Class
|
Name of Each Exchange on Which
Registered
|
|
Common
Stock, $.01 par value
|
New
York Stock Exchange
|
Securities
Registered Pursuant to Section 12(g) of the Act:
None
Indicate
by check mark whether the registrant is well-known seasoned issuer, as defined
in Rule 405 of the Securities Act. Yes o No þ
Indicate
by check mark if the registrant is not required to file reports pursuant to
Section 13 or Section 15(d) of the Act. Yes o No þ
Indicate
by check mark whether the registrant (1) has filed all reports required to
be filed by Section 13 or 15(d) of the Securities Exchange Act of 1934
during the preceding 12 months (or for such shorter period that the
registrant was required to file such reports), and (2) has been subject to
such filing requirements for the past 90 days. Yes þ No o
Indicate
by check mark whether the registrant has submitted electronically and posted on
its corporate Website, if any, every Interactive Data File required to be
submitted and posted pursuant to Rule 405 of Regulation S-T (§232.405
of this chapter) during the preceding 12 months (or for such shorter period
that the registrant was required to submit and post such
files). o Yes o No
Indicate
by check mark if disclosure of delinquent filers pursuant to Item 405 of
Regulation S-K (§229.405 of this chapter) is not contained herein, and will
not be contained, to the best of registrant’s knowledge, in definitive proxy or
information statements incorporated by reference in Part III of this
Form 10-K or any amendment to this Form 10-K. o
Indicate
by check mark whether the registrant is a large accelerated filer, an
accelerated filer, a non-accelerated filer, or a smaller reporting company. See
the definitions of “large accelerated filer,” “accelerated filer” and “smaller
reporting company” in Rule 12b-2 of the Exchange Act. (Check
one):
|
Large
accelerated filer o
|
Accelerated
filer þ
|
Non-accelerated
filer o
|
Smaller
reporting company o
|
||
|
(Do
not check if a smaller reporting company)
|
|||||
Indicate
by check mark if the registrant is a shell company (as defined in
Rule 12b-2 of the Act). Yes o No þ
The
aggregate market value of the voting stock held by non-affiliates of the
registrant as of August 10, 2009 was $455,282,234.
The
number of outstanding shares of the registrant’s common stock was 55,292,177 as
of March 17, 2010.
DOCUMENTS
INCORPORATED BY REFERENCE:
In
accordance with Instruction G(3) to Form 10-K, certain information required by
Part III of Form 10-K is incorporated into this Annual Report on Form 10-K by
reference to the registrant’s definitive proxy statement for its 2010 annual
meeting of stockholders, or to an amendment to this Annual Report on Form 10-K,
either of which will be filed within 120 days after the end of the registrant’s
fiscal year, which ended on January 25, 2010.
CKE
RESTAURANTS, INC. AND SUBSIDIARIES
INDEX
TO ANNUAL REPORT ON FORM 10-K
For
the Fiscal Year Ended January 25, 2010
|
Page
No.
|
|||||
|
PART I
|
|||||
|
1
|
|||||
|
9
|
|||||
|
15
|
|||||
|
16
|
|||||
|
17
|
|||||
|
18
|
|||||
|
PART II
|
|||||
|
19
|
|||||
|
21
|
|||||
|
23
|
|||||
|
45
|
|||||
|
45
|
|||||
|
45
|
|||||
|
45
|
|||||
|
48
|
|||||
|
PART III
|
|||||
|
49
|
|||||
|
49
|
|||||
|
49
|
|||||
|
49
|
|||||
|
49
|
|||||
|
PART IV
|
|||||
|
50
|
|||||
PART I
CKE
Restaurants, Inc. (“CKE” or the “Company”), through its wholly-owned
subsidiaries, owns, operates, franchises and licenses the Carl’s Jr.®,
Hardee’s®,
Green Burrito® and
Red Burrito®
concepts. References to CKE Restaurants, Inc. throughout this Annual Report on
Form 10-K are made using the first person notations of “we,” “us” and
“our.”
Our
fiscal year ends on the last Monday in January each year. In this Annual Report
on Form 10-K, we refer to our fiscal years by reference to the calendar
year in which they end, and we generally label all fiscal years presented
as if the fiscal year ended January 31 (e.g., the fiscal year ended January
25, 2010, is referred to as fiscal 2010 or the fiscal year ended January 31,
2010). All dollar amounts, except per share amounts, presented in this Annual
Report on Form 10-K are in thousands, unless otherwise noted.
Merger
Agreement
On
February 26, 2010, we entered into an Agreement and Plan of Merger (the “Merger
Agreement”) with Western Acquisition Holdings, Inc. (“Parent”), and Western
Acquisition Corp., a wholly-owned subsidiary of Parent (“Merger Sub”), providing
for the merger of Merger Sub with and into the Company (the “Merger”), with the
Company surviving the Merger as a wholly-owned subsidiary of
Parent. Parent and Merger Sub are affiliates of Thomas H. Lee
Partners, L.P. (“THL”). If the Merger is completed, each share of our
common stock issued and outstanding immediately prior to closing will be
automatically cancelled and converted into the right to receive $11.05 in cash,
and the Company will cease to be a publicly traded company. Completion of
the Merger is subject to approval by the holders of a majority of the
outstanding shares of the Company’s common stock entitled to vote on the Merger,
the receipt of any required approvals, or the expiration or termination of the
applicable waiting periods, under the Hart-Scott-Rodino Antitrust Improvements
Act of 1976 (the "HSR Act"), and other customary closing conditions. On March
19, 2010, we received notice from the Federal Trade Commission that early
termination of the waiting period under the HSR Act has been granted effective
immediately. In addition, on the same date, we filed a preliminary
proxy statement with the Securities and Exchange Commission (the “SEC”) relating
to the proposed special meeting of our stockholders to consider and vote on a
proposal to adopt the Merger Agreement.
Company
Overview
We own,
operate, franchise and/or license more than 3,100 quick-service restaurants
(“QSR”), primarily under the brand names Carl’s Jr.® and
Hardee’s®, both
of which offer innovative, premium products intended to appeal to our target
audience of “young, hungry guys.” Our focus on this customer type is
enhanced through edgy, breakthrough advertising; high visibility sports
sponsorships in major markets; a creative internet presence; and a menu anchored
by a variety of big, juicy charbroiled hamburgers. According to the
June 29, 2009 issue of Nation’s Restaurant News, our Hardee’s and Carl’s
Jr. chains are the tenth and twelfth largest sandwich restaurant chains in the
United States, respectively, based on U.S. system-wide foodservice sales.
As of January 31, 2010, our system-wide restaurant portfolio consisted
of:
|
Carl’s
Jr.
|
Hardee’s
|
Other
|
Total
|
|||||||||||||
|
Company-operated
|
422
|
475
|
1
|
898
|
||||||||||||
|
Franchised
|
666
|
1,228
|
11
|
1,905
|
||||||||||||
|
Licensed
|
136
|
202
|
—
|
338
|
||||||||||||
|
Total
|
1,224
|
1,905
|
12
|
3,141
|
||||||||||||
The
following is a brief description of our primary restaurant
concepts:
Carl’s
Jr.
The first
Carl’s Jr. restaurant was opened by Carl N. Karcher in 1956. Our Carl’s Jr.
restaurants, which are located predominantly in the Western United States, offer
superior quality food at reasonable prices and emphasize attentive customer
service to create an enjoyable QSR dining experience. Carl’s Jr. utilizes
cutting edge commercials to promote big, juicy burgers and other premium
products to young, hungry guys and to emphasize the value-for-the-money of our
menu items. Carl’s Jr. is a well-recognized brand that has operated profitably
in each of the past twelve fiscal years. Carl’s Jr. is predominantly a lunch and
dinner concept, with approximately 84% of Carl’s Jr. company-operated
restaurants revenue coming from the lunch and dinner portion of its business in
fiscal 2010. As of January 31, 2010, 233 of our 422 company-operated
Carl’s Jr. restaurants were dual-branded with Green Burrito®.
These dual-branded Carl’s Jr. restaurants typically have both higher sales and
profits. Carl’s Jr. is currently focused on growing same-store sales and
remodeling its existing company-operated, franchised and licensed
restaurants. As of January 31, 2010, approximately 81% of our
company-operated restaurants have been recently remodeled or
developed.
Carl’s
Jr. focuses on selling its signature products, such as the Western Bacon
Cheeseburger ® and
a full line of Six Dollar Burgers, and on developing innovative and exciting
premium products, such as the Big Carltm,
Parmesan Chicken Sandwich, Portabello Mushroom Six Dollar Burgertm, and
Grilled Cheese Bacon Burger. Also, Carl’s Jr. has begun to emphasize a number of
healthier menu items including indulgent warm grilled chicken salads and gluten
free burgers. The brand’s growth in recent years has come from new
company-operated restaurants and from those built by its strong franchise
community, as well as dual-branding opportunities. Carl’s Jr.
sponsors a number of professional sports teams in its major markets, including
the National Basketball Association’s (“NBA”) Los Angeles Lakers and Sacramento
Kings, the National Football League’s San Diego Chargers and Major League
Baseball’s (“MLB”) Los Angeles Dodgers, Los Angeles Angels of Anaheim, and San
Diego Padres.
Hardee’s
The first
Hardee’s restaurant was opened by Wilbur Hardee in 1960. Our Hardee’s
restaurants are located predominantly in the Southeastern and Midwestern United
States. Hardee’s marketing campaigns primarily promote our premium burgers and
breakfast items, in addition to emphasizing the value-for-the money of our menu
items. Hardee’s lunch and dinner menu is anchored by its premium quality line of
1/3- to 2/3-lb. 100% Black Angus beef Thickburgerstm,
which are complemented with best-in-class charbroiled and crispy chicken
sandwiches. Historically, Hardee’s has also been known as the best choice for
breakfast in the QSR industry, with approximately 48% of fiscal 2010
company-operated restaurants revenue coming from breakfast. Hardee’s breakfast
menu can attribute much of its success to the industry-first Made From Scratch
biscuits and biscuit breakfast sandwiches.
There are
several key initiatives and areas of focus at Hardee’s. The brand’s
emphasis on superior customer service coupled with its balanced menu gives
Hardee’s an ideal opportunity to build sales during all meal
occasions. While we believe the greatest opportunity for the brand is
building the lunch and dinner day parts at our existing restaurants, we expect
to gradually increase the number of new restaurants built and will continue to
dual-brand with our Red Burrito®
concept. As of January 31, 2010, 113 of our 475 company-operated Hardee’s
restaurants were dual-branded with Red Burrito. The key driver in
improving Hardee’s profitability is increasing sales. For fiscal 2010, the
average unit volume ("AUV") at our company-operated Hardee’s restaurants was
approximately $1,002, up from $993 in fiscal 2009 and $954 in fiscal 2008.
Franchise-operated AUV was approximately $976 at the end of fiscal 2010, up from
$970 at the end of fiscal 2009 and $964 in fiscal 2008. Hardee’s is currently
focusing on remodeling its existing company-operated, franchised and licensed
restaurants. As of January 31, 2010, approximately 67% of the
company-operated restaurants have been recently remodeled or
developed.
Hardee’s
is a well-recognized brand focused on selling its signature products, such as
its line of 100% Black Angus beef Thickburger and Made From Scratch breakfast
biscuits, and on developing inventive and exciting premium products, such as the
Biscuit Holes, Oscar Mayer Fried Bologna Biscuit, the Little Thickburger, French
Dip Thickburger ®, and
Portabello Mushroom Melt Thickburger ®.
Hardee’s sponsors a number of professional sports teams in its major markets,
including the NBA’s Indiana Pacers and MLB’s St. Louis
Cardinals.
Business
Strategy
Our
business strategy focuses on strengthening our competitive position, growing
same-store sales, enhancing profitability at both the Carl’s Jr. and Hardee’s
concepts, and differentiating our Carl’s Jr. and Hardee’s brands from our
competitors. In response to the current economic environment, a
number of our major competitors have implemented heavy discounts on certain menu
items and actively promoted $1 menu items in order to maintain or increase their
sales. While our restaurants offer a number of relatively low-priced,
high-value menu items, we have resisted the deep-discounting
trend. Instead, we have developed and implemented a long-term
strategy which includes the following elements:
|
·
|
Continuing
development and promotion of distinctive, premium-quality, great tasting
products such as the Carl’s Jr. line of 100% Black Angus beef Six Dollar
Burgerstm
and Hand-Scooped Ice Cream Shakes and Maltstm;
as well as Hardee’s line of 1/3- to 2/3-lb. 100% Black Angus beef
Thickburgers, and Made From Scratch breakfast
biscuits;
|
|
·
|
Correcting
consumer misperceptions of affordability by advertising products with
excellent value-for-the-money such as the Grilled Cheese Bacon Burger and
Big Carltm
at Carl’s Jr., as well as the Big Hardeetm
at Hardee’s;
|
|
·
|
Increasing
customer awareness of existing healthy menu choices and developing new
healthy products such as the new Carl’s Jr’s line of premium entrée
salads;
|
|
·
|
Emphasizing
and capitalizing on our unique brand positioning through cutting-edge and
attention-grabbing advertising in order to increase our market
share;
|
|
·
|
Remodeling
existing company-operated and franchised Carl’s Jr. and Hardee’s
restaurants to improve customer perception of our brands, so that we will
be well-positioned to benefit from a recovery in consumer
spending;
|
|
·
|
Capitalizing
on dual-branding opportunities available with our Green Burrito and Red
Burrito concepts;
|
|
·
|
Growing
our restaurant base through increasing development of new franchised
restaurants in both new and existing markets in the U.S., increasing
licensed restaurants internationally for both Carl’s Jr. and Hardee’s, and
opening new company-operated Carl’s Jr. and Hardee’s restaurants in our
existing core markets; and
|
|
·
|
Remaining
focused on core restaurant fundamentals of quality, service and
cleanliness.
|
Franchise
Strategy
Our
franchise and licensing strategy depends upon on our franchisees’ active
involvement in and management of restaurant operations. Candidates are reviewed
for appropriate operational experience and financial stability, including
specific net worth and liquidity requirements.
Carl’s
Jr. Franchise agreements with Carl’s Jr. franchisees, which
operate restaurants predominantly in the Western United States, generally
provide for the payment of franchise fees plus continuing royalty and
advertising fees to us based upon a percentage of gross sales (typically 4% for
royalties and 5% to 6% for advertising). As of January 31, 2010, our Carl’s Jr.
franchisees and licensees operated 802 Carl’s Jr. restaurants, or approximately
66% of the Carl’s Jr. system. The Carl’s Jr. franchise community is actively
developing new restaurants across the Carl’s Jr. system. The majority of our
Carl’s Jr. franchisees own more than one restaurant, with 23 franchisees owning
ten or more restaurants.
Hardee’s. Franchise
agreements with Hardee’s franchisees, which operate restaurants predominantly in
the Southeastern and Midwestern United States, generally provide for the payment
of franchise fees and royalty fees to us, and advertising fees to a national
fund and/or a regional cooperative fund, based upon a percentage of gross sales
(typically 4% for royalties and 4% to 6% for advertising). As of January 31,
2010, our Hardee’s franchisees and licensees operated 1,430 Hardee’s
restaurants, or approximately 75% of the Hardee’s system. The majority of our
Hardee’s franchisees own more than one restaurant, with 26 franchisees owning
ten or more restaurants. Our refranchising program, combined with
improving sales and store economics, has stimulated new franchise restaurant
growth in the Hardee’s system in recent years.
International. International
licensee development is an integral part of our growth strategy. Our
international expansion efforts focus on penetrating existing markets while
targeting new markets that have been identified as part of our strategic
planning process. In fiscal 2010, we, through our licensees, opened 35
international locations. Carl’s Jr. licensed restaurants currently operate in
American Samoa, Malaysia, Mexico, Singapore, the Russian Federation and China.
Hardee’s licensed restaurants are concentrated in the Middle East in the
countries of Bahrain, Egypt, Jordan, Kuwait, Lebanon, Oman, Pakistan, Qatar,
Saudi Arabia, and United Arab Emirates.
Development Agreements. Area
development agreements require franchisees to open a specified number of
restaurants in a designated geographic area within a specified period of time.
Our franchise strategy is designed to accelerate the development of our
restaurant chains and reduce the total capital we need to invest in order to
develop our brands. As of January 31, 2010, we have 60 franchise development
agreements representing commitments to build a total of 730 restaurants,
consisting of 495 domestic and 235 international restaurants. Our two most
significant domestic development agreements call for the development of 193
new restaurants in Texas over the next ten years. Our three most
significant international development agreements provide for the development of
160 new restaurants in China, Russia, and Pakistan over the next four to eight
years.
Restaurant
Development
We have a
detailed two-year capital spending plan to develop new company-operated
restaurants and remodel and maintain existing restaurants. Based on
our current capital spending projections, we expect capital expenditures to be
between $85,000 and $95,000 for fiscal 2011; and between $75,000 and $85,000 for
fiscal 2012. We perform extensive due diligence on prospective restaurant
sites before we commit to opening or permitting a franchisee to open a
restaurant at a location. We intend to continue to penetrate existing markets,
while exploring new market opportunities as they arise. In fiscal 2010, we
opened 15 new company-operated restaurants, and our franchisees and licensees
opened 65 new restaurants. The average development cost for company-operated
restaurants opened in fiscal 2010 is summarized in the following
table:
|
Average
per
restaurant(1)(2)
|
||||||||
|
Carl’s
Jr.
|
Hardee’s
|
|||||||
|
Building
and leasehold improvements
|
$ | 1,019 | $ | 853 | ||||
|
Equipment
|
396 | 345 | ||||||
|
Total
|
$ | 1,415 | $ | 1,198 | ||||
_________
|
(1)
|
Averages
are contingent upon a number of factors including, but not limited to,
restaurant prototype, geographical area and local zoning
requirements.
|
|
(2)
|
The
majority of these restaurants were constructed on leased
land. One Hardee’s restaurant was constructed on land we
purchased at a cost of $546.
|
Our goal
is to quickly serve the highest quality products to our guests in a clean and
inviting environment with superior customer service. We adhere to very strict
procedures for cleanliness, food preparation, safety and sanitation, food
quality and guest service. This is accomplished through two guiding
principles — Operation QSC and Six Dollar Service.
Operation
QSC puts in place the processes and procedures to operate our restaurants in the
most efficient manner. Six Dollar Service ensures our crew members are doing
everything possible to exceed our guests’ expectations while providing a very
pleasant QSR dining experience.
We
charbroil our burgers for maximum flavor. We cook all of our fried foods in zero
trans fat shortening. We cook, heat and assemble our lunch and dinner burgers
and sandwiches after our guests place their orders for guaranteed freshness. Our
Hardee’s breakfast menu, built on our Made From Scratch biscuits, continues to
lead the industry.
Our
commitment to quality in both our products and operations is supported by a
variety of training programs. A general manager oversees the operation of each
company-operated Carl’s Jr. and Hardee’s restaurant. Our general managers are
required to complete a comprehensive training course which covers restaurant
operations, product quality, safety awareness, inter-personal skills, and food
safety. These training programs include a combination of instructor-led
classroom training and in-restaurant, hands-on experience in a certified
training restaurant.
Our other
training initiatives include Operation Drive-thru, which focuses on labor
scheduling optimization and achieving drive-thru service standards. We offer
English as a Second Language tools for our Spanish-speaking crew members. We
developed and implemented a Learning Management System (“LMS”), which is a
web-based tool that enables us to deliver and track learning and training
throughout the organization. LMS’ benefits include consistent delivery of
training, an audit trail for compliance, a culture of recognition and
accountability, and talent management to develop management from
within. We completed the LMS integration for all company-operated
restaurants during fiscal 2010, and LMS is now available to all
franchise-operated restaurants for a small fee.
At the
restaurant level, our general managers hire, train and supervise our crew
members in accordance with our operations’ guidelines. Crew members who
demonstrate a desire and aptitude for advancement can enter our Shift Leader
Development Program to begin their careers in management. LMS training kiosks
are available in all company-operated restaurants to better prepare our crew
members and management teams for their careers with us.
Our
general managers are supervised, coached and developed by district managers, who
are typically responsible for six to eight restaurants each. District managers
are, in turn, supervised, coached and developed by either a Regional Vice
President or a Regional Director of Operations.
Supply
Chain
We
purchase most of the food products and packaging supplies that are used in our
Carl’s Jr. restaurant system, and we distribute these items to both
company-operated and franchised Carl’s Jr. restaurants. A small percentage of
franchised Carl’s Jr. restaurants, which are located outside our distribution
service area, receive food, packaging and supplies from The SYGMA Network, Inc.
(“SYGMA”). Additionally, a small percentage of company-operated and
franchised restaurants receive such products from Meadowbrook Meat Company,
Inc., dba MBM, Inc. (“MBM”). Our agreements with SYGMA and MBM expire on
December 31, 2011 and July 14, 2010, respectively.
Our
Carl’s Jr. franchisees in California, some adjacent states, and many licensees
in Mexico purchase their food, packaging and supplies from us. Our current
distribution agreement with Carl’s Jr. franchisees expired on March 12, 2010.
Carl’s Jr. is currently considering outsourcing our distribution needs to a
third party distributor as an alternative to our existing Carl’s Jr.
distribution operations. We plan to continue to provide distribution services to
our franchisees and licensees on a month-to-month basis until a future decision
is made related to the Carl's Jr. distribution operations. Carl’s Jr. has
received a number of proposals from third party foodservice distributors, but no
decision has been made whether to retain our existing distribution operations or
to outsource distribution to a third party. We expect the ultimate decision to
be driven by cost, service and quality assurance requirements and the extent to
which we can leverage the participation of the Carl’s Jr. franchisees in
providing significant purchase economies of scale.
Excluding
fresh baked buns, we purchase substantially all of the food, packaging and
supplies sold or used in our Hardee’s restaurants from MBM. MBM distributes
products to our company-operated and franchised Hardee’s restaurants. Pursuant
to the terms of our distribution agreements we are obligated to purchase
substantially all of our specified product requirements from MBM through
July 14, 2010. We are also presently in the request for proposal process
with MBM, as well as other foodservice distributors, and plan to negotiate a new
distribution agreement for Hardee’s. Regardless of the distributor selected, the
prices and delivery fees we pay for products will be subject to adjustment,
which may include increases or decreases resulting from changes in the
supplier’s cost structure.
We seek
competitive bids from suppliers of our products, and we require approved
suppliers of those products to comply with certain quality assurance
requirements including facility standards and product
specifications.
Information
about our unconditional purchase obligations can be found under the heading
“Long-Term Obligations” in Item 7 of this Annual Report on
Form 10-K.
Our
marketing and advertising initiatives focus on building brand awareness and
image through the balanced use of television, radio, digital and print
advertising. Our on-air advertising campaigns are generally intended
to create buzz around our promotional product offerings and are often
eye-catching or edgy. Our advertising messages seek to emphasize the
quality and taste of our premium menu items and to correct consumers’
misperceptions regarding the affordability of our products by emphasizing
value-for-the-money. During fiscal 2010, Carl’s Jr. company-operated restaurants
contributed 4.6% of their sales for television, radio, internet and print
advertising and spent an additional 1.5% of sales on local advertising,
billboards and point of purchase materials. Carl’s Jr. franchised restaurants
contributed 5.4% of their sales for advertising during fiscal 2010.
During
fiscal 2010, Hardee’s company-operated restaurants contributed 4.3% of their
sales for television, radio, internet and print advertising and spent an
additional 1.5% of sales on local advertising, billboards and point of purchase
materials. Hardee’s franchised restaurants contributed 4.1% to 5.6% of their
sales for advertising during fiscal 2010.
Competition and
Markets
The
restaurant business and the QSR industry are intensely competitive and affected
by changes in a geographic competition, changes in the public’s eating habits
and preferences, local and national economic conditions affecting consumer
spending habits, population trends and local traffic patterns. Key elements of
competition in our industry are the price, quality and value of food products
offered; quality and speed of service; advertising effectiveness; brand name
awareness; restaurant convenience; and attractiveness of
facilities.
We
primarily compete with major restaurant chains, some of which dominate the QSR
industry, and also compete with a variety of other take-out foodservice
companies and fast-food restaurants. Our competitors also include a variety of
mid-price, full-service casual-dining restaurants; health and nutrition-oriented
restaurants; delicatessens and prepared food restaurants; supermarkets; and
convenience stores. In selling franchises, we compete with many other restaurant
franchisors, some of which have substantially greater financial resources and
higher franchise AUVs.
Financial
Information about Operating Segments
We are
engaged in the development, operation and franchising of QSRs, primarily under
the brand names Carl’s Jr. and Hardee’s, principally in the
U.S. Information about our revenues, operating results and assets is
contained in Part II, Items 6 and 7 of this Annual Report on
Form 10-K and in Note 20 of Notes to Consolidated Financial
Statements. In evaluating the profitability of our segments, we
allocate the majority of our general and administrative
expenses to these segments.
Quarterly
operating income (loss) from continuing operations by segment has
been:
|
Carl’s
Jr.
|
Hardee’s
|
Other
|
Consolidated
|
|||||||||||||
|
Fiscal
2010
|
||||||||||||||||
|
First
Quarter
|
$ | 20,497 | $ | 9,003 | $ | 175 | $ | 29,675 | ||||||||
|
Second
Quarter
|
13,510 | 8,598 | 60 | 22,168 | ||||||||||||
|
Third
Quarter
|
10,512 | 5,624 | 126 | 16,262 | ||||||||||||
|
Fourth
Quarter
|
8,908 | 2,535 | (53 | ) | 11,390 | |||||||||||
|
Fiscal
2009
|
||||||||||||||||
|
First
Quarter
|
$ | 24,051 | $ | 5,468 | $ | 111 | $ | 29,630 | ||||||||
|
Second
Quarter
|
16,672 | 6,125 | 88 | 22,885 | ||||||||||||
|
Third
Quarter
|
12,871 | 4,801 | 83 | 17,755 | ||||||||||||
|
Fourth
Quarter
|
13,911 | (241 | ) | 80 | 13,750 | |||||||||||
Our
same-store sales trends for company-operated restaurants, for each brand by
quarter were:
|
Carl’s
Jr.
|
Hardee’s
|
|||||||
|
Fiscal
2010
|
||||||||
|
First
Quarter
|
(5.1)%
|
2.5%
|
||||||
|
Second
Quarter
|
(6.1)%
|
(2.7)%
|
||||||
|
Third
Quarter
|
(5.2)%
|
(1.8)%
|
||||||
|
Fourth
Quarter
|
(8.7)%
|
(2.5)%
|
||||||
|
Fiscal
2009
|
||||||||
|
First
Quarter
|
3.9%
|
(0.6)%
|
||||||
|
Second
Quarter
|
3.8%
|
3.3%
|
||||||
|
Third
Quarter
|
0.5%
|
1.3%
|
||||||
|
Fourth
Quarter
|
(0.6)%
|
1.5%
|
||||||
We
selectively evaluate opportunities to acquire additional interests in other
restaurant concepts, and we may make such investments and/or acquisitions in the
future depending on the business prospects of the restaurant concept, the
availability of financing at attractive terms, alternative business
opportunities available to us, the consent of our senior lenders, if required,
and general economic conditions.
Trademarks
and Service Marks
We own
numerous trademarks and service marks, and have registered many of those marks
with the United States Patent and Trademark Office, including Carl’s Jr.,
the Happy Star logo, Hardee’s, Green Burrito, Red Burrito and proprietary names
for a number of our menu items. We believe our trademarks and service marks have
value and play an important role in our marketing efforts.
Government
Regulation
Each
company-operated and franchised restaurant must comply with regulations adopted
by federal agencies and with licensing and other regulations enforced by state
and local health, sanitation, safety, fire and other departments. Stringent and
varied requirements of local governmental bodies with respect to zoning, land
use and environmental factors can delay and sometimes prevent development of new
restaurants and remodeling of existing restaurants in particular
locations.
We are
also subject to federal laws and a substantial number of state laws regulating
the offer and sale of franchises. Such laws impose registration and disclosure
requirements on franchisors in the offer and sale of franchises and may include
substantive standards regarding the relationship between franchisor and
franchisee, including limitations on the ability of franchisors to terminate
franchise agreements or otherwise alter franchise arrangements. We believe we
are operating in substantial compliance with applicable laws and regulations
governing our franchise operations.
We, and
our franchisees, must comply with the Fair Labor Standards Act (“FLSA”) and
various federal and state laws governing employment matters, such as minimum
wage, overtime pay practices, child labor laws, citizenship requirements and
other working conditions. Many of our employees are paid hourly rates related to
the federal and state minimum wage laws and, accordingly, increases in the
minimum wage increase our labor costs. Federal and state laws may also require
us to provide new or increased levels of employee benefits to our employees,
many of whom are not currently eligible for such benefits. We believe we are
operating in substantial compliance with all such laws and
regulations.
We
monitor our facilities for compliance with the Americans with Disabilities Act
of 1990 (“ADA”) in order to conform to its requirements. Under the ADA, we could
be required to expend funds to modify our restaurants to better provide service
to, or make reasonable accommodation for the employment of, disabled persons. We
believe that such expenditures, if required, would not have a material adverse
effect on our consolidated financial position or results of
operations.
Environmental
Matters
We are
subject to various federal, state and local environmental laws and regulations
that govern discharges to air and water from our restaurants, as well as
handling and disposal practices for solid and hazardous wastes. These laws may
impose liability for damages from and the costs of cleaning up sites of spills,
disposals or other releases of hazardous materials. We may be responsible for
environmental conditions relating to our restaurants and the land on which our
restaurants are located, regardless of whether we lease or own the restaurants
or land in question and regardless of whether such environmental conditions were
created by us or by a prior owner or tenant.
We cannot
provide assurance that all such environmental conditions have been identified by
us. These conditions include the presence of asbestos-containing materials,
leaking underground storage tanks and on-site spills. Further, certain
properties formerly had landfills, historic industrial use, gasoline stations
and/or dry cleaning businesses located on or near the premises. Corrective
action, as required by the regulatory agencies, has been undertaken at some of
the sites by former landowners or tenants. The enforcement of our rights against
third parties for environmental conditions, such as off-site sources of
contamination, may result in additional costs for us. However, we do not believe
that any such costs, if incurred, would have a material adverse effect on our
consolidated financial position or results of operations.
Our
restaurant sales and, therefore, our profitability are subject to seasonal
fluctuations and are traditionally higher during the spring and summer months
because of factors such as increased travel during school vacations and improved
weather conditions, which affect the public’s dining habits.
Government
Contracts
No
material portion of our business is subject to renegotiation of profits or
termination of contracts or subcontracts at the election of the
U.S. government.
Employees
As of
January 31, 2010, we employed approximately 21,300 persons, primarily in
company-operated restaurants and in our corporate offices and distribution
facilities. Past attempts to unionize our distribution center employees have
been rejected by employee votes. We believe our employee relations are
good.
Working
Capital Practices
Information
about our liquidity is contained under the caption “Liquidity and Capital
Resources” in Item 7 of this Annual Report on Form 10-K and the
Consolidated Statements of Cash Flows for the fiscal years ended January 31,
2010, 2009 and 2008.
Use
of Non-GAAP Financial Measures
In
various places throughout this Annual Report on Form 10-K, we use certain
financial measures which are not prepared in accordance with accounting
principles generally accepted in the United States (“Non-GAAP”), which we
believe provide valuable information to our stockholders. Examples of such
Non-GAAP financial measures include Adjusted EBITDA, which is a measure used by
our lenders under our senior credit facility ("Facility") to evaluate our
ability to service debt and fund capital expenditures; company-operated
restaurant-level margin, which is a measure of restaurant profitability;
franchise contribution, which is a measure of our operating results related to
franchised and licensed restaurants; and diluted income per common share,
excluding mark-to-market adjustments, which is a financial metric used by
management to measure our performance. Additional information regarding the
Non-GAAP financial measures used in this Annual Report can be found under the
heading “Presentation of Non-GAAP Measures” in Item 7 of this Annual
Report on Form 10-K.
Contact
Information; Obtaining Copies of this Annual Report
We are
incorporated in the State of Delaware. Our principal offices are located at 6307
Carpinteria Avenue, Suite A, Carpinteria, California, 93013. Our general
website address is www.ckr.com.
Electronic
copies of our Annual Report on Form 10-K, Quarterly Reports on
Form 10-Q and Current Reports on Form 8-K, and any amendments to those
reports filed or furnished pursuant to Section 13(a) or 15(d) of the
Securities Exchange Act of 1934 ("Exchange Act"), are available free of charge
by visiting the “Investors” section of www.ckr.com. These
reports are posted as soon as reasonably practicable after they are
electronically filed with the SEC. You may read and copy any materials we file
with the SEC at www.sec.gov.
In
addition, print copies of any of the foregoing documents may be obtained free of
charge by visiting the “Contact” section of www.ckr.com, or by
contacting Investor Relations at (805) 745-7500.
Information
contained in our website is not deemed to be a part of this Annual Report on
Form 10-K.
The names
and ages, as of March 24, 2010, of our executive officers are as
follows:
|
Name
|
Age
|
Position
|
||
| Andrew F. Puzder | 59 | Chief Executive Officer ("CEO") | ||
|
E.
Michael Murphy
|
58
|
President
and Chief Legal Officer
|
||
|
Theodore
Abajian
|
46
|
Executive
Vice President and Chief Financial Officer
("CFO")
|
||
|
Bradford
R. Haley
|
51
|
Executive
Vice President, Marketing — Carl’s Jr. and
Hardee’s
|
||
|
Noah
J. Griggs Jr.
|
46
|
Executive
Vice President, Training
|
||
|
Richard
E. Fortman
|
60
|
Executive
Vice President, Carl's Jr. Operations
|
||
|
Robert
J. Starke
|
57
|
Executive
Vice President, Hardee’s
Operations
|
Andrew F. Puzder was
appointed to our Board of Directors in May 2001. Mr. Puzder became
our CEO in September 2000. From September 2000 to January 2009, he also
served as our President and from February 1997 to September 2000, he served as
our Executive Vice President, General Counsel and Secretary. Mr. Puzder was
also Executive Vice President of Fidelity National Financial, Inc. (“FNF”) from
January 1995 to June 2000. Mr. Puzder was a partner in the Costa Mesa,
California law firm of Lewis, D’Amato, Brisbois & Bisgaard from
September 1991 to March 1994, and a shareholder in the Newport Beach, California
law firm of Stradling Yocca Carlson & Rauth from March 1994 until
joining FNF in 1995.
E. Michael Murphy became our
President and Chief Legal Officer in January 2009 and continues to serve as our
Secretary. From January 2001 to January 2009, he served as our
Executive Vice President, General Counsel, and previously served as Senior Vice
President of CKE and Senior Vice President, General Counsel of Hardee’s Food
Systems, Inc. from July 1998. He also served as our Chief Administrative Officer
from August 2006 to January 2009. For the ten years prior to 1998,
Mr. Murphy was a partner of The Stolar Partnership law firm in
St. Louis, Missouri.
Theodore Abajian was
appointed our Executive Vice President and CFO in May 2003. From March 2002
to May 2003, he served as our Executive Vice President, Chief Administrative
Officer. From November 2000 to March 2002, Mr. Abajian served as President
and CEO of Santa Barbara Restaurant Group (“SBRG”), and as its Executive
Vice President and CFO from May 1998. In addition, from January 2000 to
October 2000, Mr. Abajian held the position of Senior Vice President
and CFO for Checkers Drive-In Restaurants, Inc., and served as the CFO
of Star Buffet, Inc. from July 1997 to May 1998. Mr. Abajian also served as
a director of Staceys Buffet, Inc. from October 1997 to February 1998, and was
Vice President and Controller with Summit Family Restaurants, Inc. from 1994 to
1998.
Bradford R. Haley was
appointed Executive Vice President, Marketing for Hardee’s in September 2000. He
also assumed responsibility for Carl’s Jr. marketing in January 2004. Prior to
joining Hardee’s, Mr. Haley worked as Chief Marketing Officer for Church’s
Chicken. From 1992 to 1999, Mr. Haley served as Corporate Vice President of
Marketing Communications for Jack in the Box Inc.
Noah J. Griggs, Jr. was
named Executive Vice President, Training of Carl’s Jr. and Hardee’s in May 2007.
Prior to that appointment, Mr. Griggs served as Executive Vice President,
Hardee’s Operations for company-operated restaurants beginning in July 2000 and
franchisee-operated restaurants beginning in July 2002. Mr. Griggs joined
Hardee’s in July 1996 as Vice President of Quality and Standards and was named
Senior Vice President of Operations in April 1998. Prior to joining Hardee’s,
Mr. Griggs worked as Vice President of Operations for one of Hardee’s
largest franchisees.
Richard E. Fortman was named Executive Vice
President, Operations for Carl’s Jr. in September 2000. Before assuming this
position, Mr. Fortman was a Senior Area Vice President for Hardee’s, a position
he had held since April 1998. Mr. Fortman first joined the Company in 1969
beginning in the restaurants and has had a long career in Carl’s Jr.
operations.
Robert J. Starke was named
Executive Vice President, Hardee’s Operations in May 2007. Mr. Starke first
joined Hardee’s in 1975 and has had a long career in Hardee’s
operations. He began his career with Hardee’s in the restaurants and
later became a Regional Vice President. He had served as Senior Vice President
of Restaurant Operations from 2002 until being promoted to his current
position.
Matters
discussed in this Annual Report on Form 10-K contain forward-looking
statements relating to future plans and developments, financial goals and
operating performance that are based on our current beliefs and assumptions.
Such statements are subject to risks and uncertainties that are often difficult
to predict, are beyond our control and which may cause results to differ
materially from expectations. Factors that could cause our results to differ
materially from those described include, but are not limited to, the Company’s
ability to compete with other restaurants, supermarkets and convenience stores;
the effectiveness of operating initiatives and advertising and promotional
effort; changes in economic conditions which may affect the Company’s business
and stock price; the effect of restrictive covenants in the Company’s credit
facility on the Company’s business; the Company’s ability to attract and retain
key personnel; the Company’s franchisees’ willingness to participate in the
Company’s strategy; the operational and financial success of the Company’s
franchisees; changes in consumer preferences and perceptions; changes in the
price or availability of commodities; changes in the Company’s suppliers’
ability to provide quality products to the Company in a timely manner; the
effect of the media’s reports regarding food-borne illnesses and other
health-related issues on the Company’s reputation and its ability to obtain
products; the seasonality of the Company’s operations; increased insurance
and/or self-insurance costs; the Company’s ability to select appropriate
restaurant locations, construct new restaurants, complete remodels of existing
restaurants and renew leases with favorable terms; the Company’s ability to
comply with existing and future health, employment, environmental and other
government regulation; the completion and timing of the proposed merger; and
other factors as discussed under the caption “Risk Factors” in Item 1A of this
Annual Report on Form 10-K and in our other filings with the SEC.
Forward-looking
statements speak only as of the date they are made. We undertake no obligation
to publicly update or revise any forward-looking statement, whether as a result
of new information, future events or otherwise, except as required by law or the
rules of the New York Stock Exchange ("NYSE").
We are
engaged in a business strategy that includes the long-term growth of our
operations. The success of a business strategy, by its very nature, involves a
significant number of risks and uncertainties. The risk factors
listed below are important factors that could cause actual results to differ
materially from our historical results and from projections in forward-looking
statements contained in this report, in our other filings with the SEC, in our
news releases and in oral statements by our representatives. However, other
factors that we do not anticipate or that we do not consider significant based
on currently available information may also have an adverse effect on our
results.
Our
success depends on our ability to compete with others.
The
foodservice industry is intensely competitive with respect to the quality and
value of food products offered, service, price, convenience, and dining
experience. We compete with major restaurant chains, some of which dominate the
QSR industry. Our competitors also include a variety of mid-price, full-service
casual-dining restaurants, health and nutrition-oriented restaurants,
delicatessens and prepared food restaurants, take-out food service companies,
fast food restaurants, supermarkets and convenience stores. In addition to
competing with such companies for customers, we also must compete with them for
access to qualified employees and management personnel, suitable restaurant
locations and capable franchisees. Many of our competitors have substantially
greater brand recognition, as well as greater financial, marketing, operating
and other resources than we have, which may give them competitive advantages
with respect to some or all of these areas of competition. Some of our
competitors have engaged and may continue to engage in substantial price
discounting, which may adversely impact our sales and operating results. As our
competitors expand operations and marketing campaigns, we expect competition to
intensify. Such increased competition could have a material adverse
effect on our consolidated financial position and results of
operations.
Restrictive
covenants in our credit facility could adversely affect our
business.
Our
Facility contains restrictive covenants and requirements that we comply with
certain financial ratios. Certain of these covenants limit our ability to take
various actions, including incurring additional debt, guaranteeing indebtedness
and engaging in various types of transactions, including mergers and sales of
assets, and making specified distributions or other restricted payments,
including capital expenditures and other investments. These covenants could have
an adverse effect on our business by limiting our ability to take advantage of
business opportunities. Failure to maintain financial ratios required by our
Facility or to comply with the covenants in our Facility could also result in
acceleration of our indebtedness, which would impair our liquidity and limit our
ability to operate. If the current economic conditions and decreases
in discretionary consumer spending continue for a prolonged period of time, our
results of operations may be materially impacted and we may fail to maintain the
financial ratios required by our Facility.
The
recent worldwide financial crisis has resulted in diminished liquidity and
credit availability, and future turmoil in the financial markets could make it
more difficult and more costly for us to refinance our Facility (if necessary)
or incur additional indebtedness and could impact the ability of banks to honor
draws on our existing credit facilities.
Changes in consumer preferences and perceptions, economic, market and other conditions could adversely affect our operating results.
The QSR
industry is affected by changes in economic conditions, consumer preferences and
spending patterns, demographic trends, consumer perceptions of food safety,
weather, traffic patterns, the type, number and location of competing
restaurants, and other factors. Multi-location foodservice businesses such as
ours can also be materially and adversely affected by publicity resulting from
poor food quality, food tampering, illness, injury or other health concerns or
operating issues stemming from one or a limited number of restaurants. We can be
similarly affected by consumer concerns with respect to the nutritional value of
quick-service food.
Our
ability to anticipate and respond to trends and changes in consumer preferences
may affect our future operating results. Additionally, current
economic conditions may cause changes in consumer preferences, and if such
economic conditions persist for an extended period of time, this may result in
consumers making long-lasting changes to their spending behaviors. A
number of our major competitors have been increasing their “value item”
offerings and implementing certain pricing promotions for various other menu
items. If consumer preference continues to shift towards these “value
items”, it may become necessary for us to implement temporary promotional
pricing offerings. If we implement such promotional offerings our
operating margins may be adversely impacted. Any promotional
offerings or temporary price cuts implemented by us are not expected
to represent a permanent change in our business strategy, and would only be
temporary in duration.
Factors
such as interest rates, inflation, gasoline prices, commodity costs, labor and
benefits costs, legal claims, and the availability of management and hourly
employees also affect restaurant operations and administrative expenses. In
particular, increases in interest rates may impact land and construction costs
and the cost and availability of borrowed funds, and thereby adversely affect
our ability and our franchisees’ ability to finance new restaurant development
and improve existing restaurants. In addition, inflation can cause increased
commodity and labor and benefits costs and can increase our operating
expenses.
We
depend on a limited number of key suppliers to deliver quality products to us at
moderate prices.
Our
profitability is dependent on, among other things, our continuing ability to
offer premium-quality food at moderate prices. While we continue to operate our
own distribution business for most of our Carl’s Jr. system, we rely upon an
independent distributor for our Hardee’s restaurants. Our Hardee’s restaurants
depend on the distribution services of MBM, a national distributor of food and
other products. MBM is responsible for delivering food, packaging and other
products from our suppliers to our Hardee’s restaurants on a frequent and
routine basis. MBM also provides distribution services to nearly all of our
Hardee’s franchisees. Pursuant to the terms of our distribution agreement, we
are obligated to purchase substantially all of our specified product
requirements from MBM through July 14, 2010. We are currently in discussions
with MBM, as well as other distribution service providers, to negotiate a new
distribution agreement. There can be no assurance that the new or revised
distribution agreement will contain similar or favorable terms. Additionally,
should we successfully enter into a new agreement, we cannot predict the future
terms or prices after expiration of the renewed agreement.
Our
suppliers may be adversely impacted by current economic conditions, such as the
tightening of the credit markets, decreased transaction volumes, fluctuating
commodity prices and various other factors. As a result, our suppliers may seek
to change the terms on which they do business with us in order to lessen the
impact of any current and future economic challenges on their businesses. If we
are forced to renegotiate the terms upon which we conduct business with our
suppliers or find alternative suppliers to provide key services, it could
adversely impact our financial condition or results of operations.
In
addition, the current economic environment has forced some food suppliers to
seek financing in order to stabilize their businesses, and others have ceased
operations completely. If MBM or a large number of other suppliers
suspend or cease operations, we may have difficulty keeping our restaurants
fully supplied with the high quality ingredients we require. If we
were forced to suspend serving one or more of our menu items that could have a
significant adverse impact on our restaurant traffic and public perceptions of
us, which would be harmful to our business.
Our financial
results may be impacted by our ability to successfully enter new markets, select
appropriate restaurant locations,
construct new restaurants, complete remodels or renew leases with desirable
terms.
Our
growth strategy includes opening new restaurants in markets where we have
relatively few or no existing restaurants. There can be no assurance that we
will be able to successfully expand or acquire critical market presence for our
brands in new geographical markets. Consumer characteristics and competition in
new markets may differ substantially from those in the markets where we
currently operate. Additionally, we may be unable to identify appropriate
locations, develop brand recognition, successfully market our products or
attract new customers. It may also be difficult for us to recruit and
retain qualified personnel to manage restaurants. Should we not succeed in
entering new markets, there may be adverse impacts to our financial condition
and results of operations.
Our
strategic plan, and a component of our business strategy, includes the
construction of new restaurants and the remodeling of existing restaurants. We
face competition from other restaurant operators, retail chains, companies and
developers for desirable site locations, which may adversely affect the cost,
implementation and timing of our expansion plans. If we experience delays in the
construction or remodel processes, we may be unable to complete such activities
at the planned cost, which would adversely affect our future results of
operations. Additionally, we cannot guarantee that such remodels
will increase the revenues generated by these restaurants or that any such
increases will be sustainable. Likewise, we cannot be sure that the sites we
select for new restaurants will result in restaurants whose sales results meet
our expectations.
We lease
a substantial number of our restaurant properties. The terms of our leases and
subleases vary in length, with primary terms (i.e., before consideration of
option periods) expiring on various dates through fiscal 2036. We do not expect
the expiration of these leases to have a material impact on our operations in
any particular year, as the expiration dates are staggered over a number of
years and many of the leases contain renewal options. As our leases and
available option periods expire, we will need to negotiate new leases with our
landlords for those leased restaurants that we intend to continue operating. If
we are unable to negotiate acceptable lease terms for them, we may decide to
close the restaurants, or the new lease terms may negatively impact our
consolidated results of operations.
Our
business and stock price may be adversely impacted by economic
conditions.
Our
financial condition and results of operations are dependent upon consumer
discretionary spending, which is influenced by general economic
conditions. Worldwide economic conditions and consumer spending have
deteriorated and may remain depressed for some time. Current economic
conditions have resulted in higher levels of unemployment, reductions in
disposable income for many consumers and lower levels of consumer
confidence. If these economic conditions persist for an extended
period of time, consumers may make long-lasting changes to their spending habits
and behavior. In addition, real or perceived concerns about the
economy may seriously harm the market price of our common stock regardless of
our operating performance.
In
addition, unfavorable macroeconomic trends or developments concerning factors
such as increased food, fuel, utilities, labor and benefits costs may also
adversely affect our financial condition and results of
operations. Current economic conditions may prevent us from
increasing prices to match increased costs without further harming our
sales. If we were unable to raise prices in order to recover
increased costs for food, packaging, fuel, utilities, wages, clothing and
equipment, our profitability would be negatively affected.
We have a
geographic concentration of restaurants in certain states and regions, which can
cause economic conditions in particular areas of the country to have a
disproportionate impact on our overall results of operations. As of
January 31, 2010, we and our franchisees operated restaurants in 42 states and
14 foreign countries. By number of restaurants, our operations are
most concentrated in California, North Carolina and Virginia. Adverse
economic conditions in states or regions that contain a high concentration of
Carl’s Jr. and Hardee’s restaurants could have a material adverse impact on our
results of operations in the future.
Our
success depends on our ability to attract and retain certain key
personnel.
We
believe that our success will depend, in part, on continuing services from
certain of our key senior management team. The failure by us to retain members
of our senior management team could adversely affect our ability to successfully
execute key strategic business decisions and negatively impact the profitability
of our business. Additionally, our success may depend on our ability to attract
and retain additional skilled senior management personnel.
Our
success depends on our franchisees’ participation in our strategy.
Our
franchisees are an integral part of our business. We may be unable to
successfully implement our brand strategies if our franchisees do not actively
participate in such implementation. The failure of our franchisees to focus on
the fundamentals of restaurant operations, such as quality, service and
cleanliness, would have a negative impact on our success. It may be
more difficult for us to monitor our international licensees’ implementation of
our brand strategies due to our lack of personnel in the markets served by such
licensees.
Our financial results are affected by the financial results of our franchisees.
We
receive royalties from our franchisees. As a result, our financial results are
somewhat dependent upon the operational and financial success of our
franchisees, including their implementation of our strategic plans, and their
ability to secure adequate financing. If sales trends or economic conditions
worsen for our franchisees, and they are unable to secure adequate sources of
financing, their financial health may worsen, our collection rates may decline
and we may be required to assume the responsibility for additional lease
payments on franchised restaurants. Additionally, refusal on the part of
franchisees to renew their franchise agreements may result in decreased
royalties. Entering into restructured franchise agreements may result in reduced
franchise royalty rates in the future. Furthermore, due to the
current economic conditions, our franchisees may not be able to obtain the
financing necessary to complete planned remodel and construction projects, and
may be forced to postpone or cancel such projects.
The
financial conditions of our international licensees may also be adversely
impacted by political, economic or other changes in the global markets in which
they operate. As a result, the royalties we receive from our
international licensees may be affected by recessionary or expansive trends in
international markets, increasing labor costs in certain international markets,
changes in applicable tax laws, changes in inflation rates, changes in exchange
rates and the imposition of restrictions on currency conversion or the transfer
of funds, expropriation of private enterprises, political and economic
instability and other external factors.
Our international
operations are subject to various risks and uncertainties and there is no
assurance that our international operations will be
successful.
An
important component of our growth strategy involves increasing our net
restaurant count in international markets. The execution of this
growth strategy depends upon the opening of new restaurants by our existing
licensees and by new licensees. We and our current or future licensees face many
risks and uncertainties in opening new international restaurants, including
international economic and political conditions, differing cultures and consumer
preferences, diverse government regulations and tax systems, securing acceptable
suppliers, difficulty in collecting our royalties and longer payment cycles,
uncertain or differing interpretations of rights and obligations in connection
with international license agreements, the selection and availability of
suitable restaurant locations, currency regulation and fluctuation, and other
external factors.
In
addition, our current licensees may be unwilling or unable to increase their
investment in our system by opening new restaurants. Moreover, our international
growth also depends upon the availability of prospective licensees or joint
venture partners with the experience and financial resources to be effective
operators of our restaurants. There can be no assurance that we will
be able to identify future licensees who meet our criteria, or that, once
identified, they will successfully implement their expansion plans.
We
face commodity price and availability risks.
We and
our franchisees purchase large quantities of food and supplies which may be
subject to substantial price fluctuations. We purchase agricultural and
livestock products that are subject to price volatility caused by weather,
supply, global demand, fluctuations in the value of the U.S. dollar, commodity
market conditions and other factors that are not predictable or within our
control. Increases in commodity prices could result in higher restaurant
operating costs. Since we have a higher concentration of company-operated
restaurants than many of our competitors, we may have greater operating cost
exposure than those competitors who are more heavily franchised. Occasionally,
the availability of commodities can be limited due to circumstances beyond our
control. If we are unable to obtain such commodities, we may be unable to offer
related products, which would have a negative impact on our operating
expenses and profitability.
Our
business may be impacted if we do not successfully manage changes to the Carl’s
Jr. distribution center operations.
We
currently supply food, packaging and other supplies both to company-operated
Carl’s Jr. restaurants and to a majority of Carl’s Jr. franchised and licensed
restaurants through our two distribution center facilities in
California. Our current distribution agreement with Carl’s Jr.
franchisees expired on March 12, 2010. Carl’s Jr. is currently considering
outsourcing our distribution needs to a third party distributor as an
alternative to our existing Carl’s Jr. distribution operations. We plan to
continue to provide distribution services to our franchisees and licensees on a
month-to-month basis until a future decision is made related to the Carl's Jr.
distribution operations. Carl’s Jr. has received a number of proposals from
third party distributors, but a decision has not yet been made whether to retain
the existing distribution operations or outsource to a third party distributor.
The joint participation in the distribution arrangement with Carl’s Jr.
franchisees provides significant economies of scale. There can be no assurance
that Carl’s Jr. franchisees will participate in the distribution strategy that
results in the most favorable terms for us, which could adversely impact our
results of operations.
Events reported
in the media, such as incidents involving food-borne illnesses or food tampering,
whether accurate or not, could reduce the production and supply of important food
products, cause damage to our reputation and adversely affect our sales and
profitability.
Reports,
whether true or not, of food-borne illnesses, such as those caused by E. coli,
Listeria or Salmonella, in addition to Avian Influenza (commonly known as bird
flu) and Bovine Spongiform Encephalopathy (commonly known as BSE or mad cow
disease), and injuries caused by food tampering have, in the past, severely
impacted the production and supply of certain food products, including poultry
and beef. A reduction in the supply of such food products could have a material
effect on the price at which we could obtain them. Failure to procure food
products, such as poultry or beef, at reasonable terms and prices or any
reduction in consumption of such food products by consumers could have a
material adverse effect on our consolidated financial condition and results of
operations.
In
addition, reports, whether or not true, of food-borne illnesses or the use of
hormones, antibiotics or pesticides in the production of certain food products
may cause consumers to reduce or avoid consumption of such food products. Our
brands’ reputations are important assets to us, and any such reports could
damage our brands’ reputations and immediately and severely hurt sales and
profits. If customers become ill from food-borne illnesses or food tampering, we
could be forced to temporarily close some, or all, of our restaurants. In
addition, instances of food-borne illnesses or food tampering occurring at the
restaurants of competitors, could, by resulting in negative publicity about the
QSR industry, adversely affect our sales on a local, regional, or national
basis.
Our
operations are seasonal and heavily influenced by weather
conditions.
Weather,
which is unpredictable, can adversely impact our sales. Harsh weather conditions
that discourage customers from dining out result in lost opportunities for our
restaurants. A heavy snowstorm can leave an entire metropolitan area snowbound,
resulting in a reduction in sales. Our first and fourth quarters, most notably
the fourth quarter, include winter months when there is historically a lower
level of sales. Because a significant portion of our restaurant operating costs
is fixed or semi-fixed in nature, the loss of sales during these periods
adversely impacts our profitability. These adverse, weather-driven events have a
more pronounced impact on our Hardee’s restaurants. For these reasons,
sequential quarter-to-quarter comparisons may not be a good indication of our
performance or how we may perform in the future.
Our
business may suffer due to our inability to hire and retain qualified personnel
and due to higher labor costs.
Given
that our restaurant-level workforce requires large numbers of both entry-level
and skilled employees, low levels of unemployment could compromise our ability
to provide quality service in our restaurants. From time to time, we have had
difficulty hiring and maintaining qualified restaurant management personnel.
Increases in minimum wage levels have negatively impacted our labor costs.
Due to the labor-intensive nature of our business, further increases in minimum
wage levels could have additional negative effects on our consolidated results
of operations.
Our
business may be impacted by increased insurance and/or self-insurance
costs.
From time
to time, we have been negatively affected by increases in both workers’
compensation and general liability insurance and claims expense due to our
claims experience and rising healthcare costs. Although we seek to manage our
claims to prevent increases, such increases can occur unexpectedly and without
regard to our efforts to limit them. If such increases occur, we may be unable
to pass them along to the consumer through product price increases, resulting in
decreased operating results.
We are subject to
certain health, employment, environmental and other government regulations, and
failure to comply with existing or future government regulations could expose us
to litigation, damage to our reputation and lower profits.
We, and
our franchisees, are subject to various federal, state and local laws. The
successful development and operation of restaurants depend to a significant
extent on the selection and acquisition of suitable sites, which are subject to
zoning, land use, environmental, traffic and other regulations. Restaurant
operations are also subject to licensing and regulation by state and local
departments relating to health, food preparation, sanitation and safety
standards, federal and state labor and immigration law, (including applicable
minimum wage requirements, overtime pay practices, working and safety conditions
and citizenship requirements), federal and state laws prohibiting discrimination
and other laws regulating the design and operation of facilities, such as the
ADA. If we fail to comply with any of these laws, we may be subject to
governmental action or litigation, and our reputation could be harmed. Injury to
our reputation would, in turn, likely reduce revenues and profits.
In recent
years, there has been an increased legislative, regulatory and consumer focus on
nutrition and advertising practices in the food industry, particularly among
restaurants. As a result, we may become subject to regulatory initiatives in the
area of nutrition disclosure or advertising, such as requirements to provide
information about the nutritional content of our food products, which could
increase expenses. The operation of our franchise system is also subject to
franchise laws and regulations enacted by a number of states and rules
promulgated by the U.S. Federal Trade Commission. Any future legislation
regulating franchise relationships may negatively affect our operations,
particularly our relationship with our franchisees. Failure to comply with new
or existing franchise laws and regulations in any jurisdiction or to obtain
required government approvals could result in a ban or temporary suspension on
future franchise sales. Changes in applicable accounting rules imposed by
governmental regulators or private governing bodies could also affect our
reported results of operations.
We are
subject to the FLSA, which governs such matters as minimum wage, overtime and
other working conditions, along with the ADA, various family leave mandates and
a variety of other laws enacted, or rules and regulations promulgated, by
federal, state and local governmental authorities that govern these and other
employment matters. We have experienced and expect further increases in payroll
expenses as a result of federal and state mandated increases in the minimum
wage. In addition, our vendors may be affected by higher minimum wage standards,
which may increase the price of goods and services they supply to
us. Additionally, we offer access to healthcare benefits to certain
of our employees. The imposition of any requirement that we provide
health insurance to all employees on terms that differ significantly from our
existing programs could have a material adverse impact on our results of
operations and financial condition.
We are
also subject to various federal, state and local environmental laws and
regulations that govern discharges to air and water, as well as handling and
disposal practices for solid and hazardous wastes. These laws may also impose
liability for damages from and the costs of cleaning up sites of spills,
disposals or other releases of hazardous materials. We may be responsible for
environmental conditions or contamination relating to our restaurants and the
land on which our restaurants are located, regardless of whether we lease or own
the restaurant or land in question and regardless of whether such environmental
conditions were created by us or by a prior owner or tenant. The costs of any
cleanup could be significant and have a material adverse effect on our
consolidated financial position and results of operations.
We may not be
able to adequately protect our intellectual property, which could decrease the
value of our brands and products.
The
success of our business depends on the continued ability to use existing
trademarks, service marks and other components of our brands in order to
increase brand awareness and further develop branded products. All of the steps
we have taken to protect our intellectual property may not be
adequate.
Provisions of our
Certificate of Incorporation and Bylaws could limit the ability of our stockholders
to effect a change in control.
Our
Certificate of Incorporation and Bylaws include several provisions and features
intended to render more difficult certain unsolicited or hostile attempts to
acquire our business. In addition, our Board of Directors has the authority,
without further action by our stockholders, to issue up to 5,000,000 shares of
preferred stock in one or more series, and to fix the rights, preferences and
restrictions of such preferred stock.
These
provisions may discourage a third party from attempting to acquire control of us
and could limit the price that investors might be willing to pay in the future
for shares of our common stock.
We
face risks related to interest rates.
Our
principal exposures to financial market risks are the impact that interest rate
changes could have on our Facility, the magnitude of which depends on the amount
of borrowings we have outstanding, and on the fair value of our interest rate
swap agreements. As of January 31, 2010, we had borrowings outstanding of
$247,432 and $30,000 under the term loan and revolving portions of our Facility,
respectively. As of January 31, 2010, borrowings under the revolving portion of
our Facility bore interest at a weighted-average rate of 1.75% per annum, and
borrowings on the term loan bore interest at the London Inter Bank Offering Rate
(“LIBOR”) plus 1.38%.
The fair
value of our interest rate swap agreements, which effectively fix future
interest payments on $200,000 of our term loan debt at 6.12% through March 2012,
is directly linked both to current interest rates and to expected future
interest rates over their remaining term. These interest rate swap agreements
are highly sensitive to interest rate fluctuations, which could result in
significant variability in their future fair value.
We
are subject to litigation from customers, franchisees, and employees in the
ordinary course of business that could adversely affect us.
We may be
subject to claims, including class action lawsuits, filed by customers,
franchisees, employees, and others in the ordinary course of business.
Significant claims may be expensive to defend and may divert time and money away
from our operations causing adverse impacts to our operating results. In
addition, adverse publicity or a substantial judgment against us could
negatively impact our brand reputation resulting in further adverse impacts to
our financial condition and results of operations.
In
addition, the restaurant industry has been subject to claims that relate to the
nutritional content of food products, as well as claims that the menus and
practices of restaurant chains have led to the obesity of some customers. We may
also be subject to this type of claim in the future and, even if we are not
specifically named, publicity about these matters may harm our reputation and
have adverse impacts on our financial condition and results of
operations.
A
significant failure, interruption or security breach of our computer systems or
information technology may adversely affect our business.
We are
significantly dependent upon our computer systems and information technology to
properly conduct our business. A significant failure or interruption of service,
or a breach in security of our computer systems could cause reduced efficiency
in operations, loss of data and business interruptions, and significant capital
investment could be required to rectify the problems. In addition, any security
breach involving our point of sale or other systems could result in loss of
consumer confidence and potential costs associated with consumer
fraud.
Catastrophic
events may disrupt our business.
Unforeseen
events, including war, terrorism and other international conflicts, public
health issues, and natural disasters such as hurricanes, earthquakes, or other
adverse weather and climate conditions, whether occurring in the U.S. or abroad,
could disrupt our operations, disrupt the operations of franchisees,
distributors, suppliers or customers, or result in political or economic
instability. These events could reduce demand for our products or make it
difficult or impossible to receive products from our distributors or
suppliers.
Failure
to complete the proposed Merger could adversely affect our
business.
On
February 26, 2010, we entered into the Merger Agreement, pursuant to which we
may be acquired for $11.05 per share in cash. There is no assurance
that our shareholders will approve the Merger Agreement or that other closing
conditions will be satisfied. We are subject to several risks as a result of
this Merger Agreement, including the following:
|
|
•
|
If
the proposed Merger is not completed, the share price of our common stock
may change to the extent that the current market price of our common stock
reflects an assumption that the proposed Merger will be
completed;
|
|
|
•
|
Certain
costs related to the proposed Merger, including the fees and/or expenses
of our legal, accounting and financial advisors, must be paid even if the
proposed Merger is not completed;
|
|
|
•
|
Under
circumstances as defined in the Merger Agreement, we may be required to
pay a termination fee and/or reimburse expenses if the Merger Agreement is
terminated;
|
• Additional
shareholder lawsuits may be filed against us in connection with the Merger
Agreement;
• Our
management and employees’ attention may have been diverted from day-to-day
operations;
• The
terms of the financing for the proposed Merger may change; and
|
|
•
|
A
failed Merger may result in negative publicity and/or a negative
impression of us in the investment community or business community
generally.
|
None.
The
following table sets forth information regarding our restaurant properties as of
January 31, 2010:
|
Land
and
Building
Owned
|
Land
Leased
and
Building
Owned
|
Land
and
Building
Leased
|
Total
|
|||||||||||||
|
Carl’s
Jr.:
|
||||||||||||||||
|
Company-operated
|
23
|
146
|
253
|
422
|
||||||||||||
|
Franchise-operated(1)
|
9
|
45
|
159
|
213
|
||||||||||||
|
Third
party-operated/vacant(2)
|
4
|
2
|
10
|
16
|
||||||||||||
|
Subtotal
|
36
|
193
|
422
|
651
|
||||||||||||
|
Hardee’s:
|
||||||||||||||||
|
Company-operated
|
252
|
102
|
121
|
475
|
||||||||||||
|
Franchise-operated(1)
|
53
|
72
|
123
|
248
|
||||||||||||
|
Third
party-operated/vacant(2)
|
8
|
9
|
37
|
54
|
||||||||||||
|
Subtotal
|
313
|
183
|
281
|
777
|
||||||||||||
|
Other:
|
||||||||||||||||
|
Company-operated
|
—
|
—
|
1
|
1
|
||||||||||||
|
Third
party-operated/vacant(2)
|
—
|
—
|
1
|
1
|
||||||||||||
|
Subtotal
|
—
|
—
|
2
|
2
|
||||||||||||
|
Total:
|
||||||||||||||||
|
Company-operated
|
275
|
248
|
375
|
898
|
||||||||||||
|
Franchise-operated(1)
|
62
|
117
|
282
|
461
|
||||||||||||
|
Third
party-operated/vacant(2)
|
12
|
11
|
48
|
71
|
||||||||||||
|
Total
|
349
|
376
|
705
|
1,430
|
||||||||||||
__________
|
(1)
|
“Franchise-operated”
properties are those which we own and lease to franchisees, or lease and
sublease to franchisees.
|
|
(2)
|
“Third
party-operated/vacant” properties are those we own or lease that are
either leased or subleased by unaffiliated entities or are currently
vacant.
|
The terms
of our leases and subleases vary in length, with primary terms (i.e., before
consideration of option periods) expiring on various dates through fiscal 2036.
We do not expect the expiration of these leases to have a material impact on our
operations in any particular year, as the expiration dates are staggered over a
number of years and many of the leases contain renewal options.
Our
corporate headquarters and Carl’s Jr. brand headquarters are both located in
Carpinteria, California, and combined they contain approximately
78,000 square feet of space. During fiscal 2010, we relocated our primary
administrative service center in Anaheim, California. The new facility contains
approximately 93,000 square feet of space. Our primary distribution center for
the Carl’s Jr. brand is located in Ontario, California, and contains
approximately 201,000 square feet of space. A secondary distribution center
is located in Manteca, California, and contains approximately 52,000 square
feet of space. Our Hardee’s corporate facility is located in St. Louis,
Missouri, and contains approximately 54,000 square feet of space. Our
Hardee’s equipment distribution center is located in Rocky Mount, North
Carolina, and contains approximately 82,000 square feet of
space.
There are
currently a number of claims and lawsuits pending against us. These claims and
lawsuits cover a variety of allegations spanning our entire business. The
following is a brief description of the more significant of these categories of
claims and lawsuits. In addition, we are subject to various federal, state and
local regulations that affect our business.
Litigation
Related to the Proposed Merger
In
connection with the Merger Agreement, pursuant to which we may be acquired by an
affiliate of THL (the “Proposed Merger”), six putative stockholder class action
lawsuits have been filed in the Delaware Court of Chancery and in the Superior
Court of California for the County of Santa Barbara.
On March
1, 2010, a putative stockholder class action, named Pieces of Eight Master Fund LP v.
CKE Restaurants, Inc. et al., Case No. 5290, was filed in the Delaware
Court of Chancery against the Company, each of our directors, and THL, asserting
that the Company and our directors breached their fiduciary duties in connection
with the Proposed Merger and asserting that THL aided and abetted those alleged
breaches of duty.
On March
3, 2010, a putative stockholder class action, named Hendricks v. CKE Restaurants, Inc.
et al., Case No. 1342245, was filed in the Superior Court of California
for the County of Santa Barbara against the Company, our directors, and
THL. The lawsuit alleges that the Company’s directors breached their
fiduciary duties in connection with the Proposed Merger. The Complaint also
names the Company and THL as defendants and charges them with aiding and
abetting the directors’ alleged breaches of fiduciary duty.
On March
5, 2010, a putative stockholder class action, named Inglima v. Allumbaugh et al.,
Case No. 1342293, was filed in the Superior Court of California for the County
of Santa Barbara against the Company, each of its directors, Parent and Merger
Sub. The lawsuit alleges that the directors breached their fiduciary
duties in connection with the Proposed Merger. The complaint also names the
Company, Parent and Merger Sub as defendants and charges them with aiding and
abetting the directors’ alleged breaches of fiduciary duty. Also on
March 5, 2010, a putative stockholder class action, named Curtis v. Allumbaugh et al.,
Case No. 1342349, was filed in the Superior Court of California for the County
of Santa Barbara against the Company, each of our directors, THL, Parent and
Merger Sub. The lawsuit alleges that the directors breached their fiduciary
duties in connection with the Proposed Merger. The complaint also
names THL, Parent and Merger Sub as defendants and charges them with aiding and
abetting the directors’ alleged breaches of fiduciary duty.
On March
11, 2010, a putative stockholder class action, named McDonald v. CKE Restaurants, Inc. et
al., Case No. 1342415, was filed in the Superior Court of California for
the County of Santa Barbara against the Company, each of our directors, and
THL. The lawsuit alleges that the directors breached their fiduciary
duties in connection with the Proposed Merger. The complaint also names the
Company and THL as defendants and charges both parties with aiding and abetting
the directors’ alleged breaches of fiduciary duty.
On March
12, 2010, a putative stockholder class action, named Richard F. Warnock SEP IRA et al. v.
Allumbaugh et al., Case No. 5340, was filed in the Delaware Chancery
Court against the Company, each of our directors, Parent and Merger
Sub. The lawsuit alleges that the directors breached their fiduciary
duties in connection with the Proposed Merger. The complaint also names
Parent and Merger Sub as defendants and charges both parties with aiding and
abetting the directors’ alleged breaches of fiduciary duty.
Among
other remedies, the complaints in the six actions seek to enjoin the Proposed
Merger. The Company believes these lawsuits are without merit and intends
to defend them vigorously; however, we are presently unable to predict the
ultimate outcome of this litigation.
Employees
We employ
many thousands of persons in our company-operated restaurants, distribution
facilities and corporate offices, both by us and in restaurants owned and
operated by our subsidiaries. In addition, thousands of persons from time to
time seek employment in such restaurants. In the ordinary course of business,
disputes arise regarding hiring, firing, harassment, rest breaks, promotion
practices and other employee related matters. With
respect to employment matters, our most significant legal disputes relate to
employee meal and rest breaks, and wage and hour disputes. Several potential
class action lawsuits have been filed in the state of California, each of which
is seeking injunctive relief and monetary compensation on behalf of current and
former employees. The Company intends to vigorously defend against all claims in
these lawsuits; however, we are presently unable to predict the ultimate outcome
of this litigation.
Customers
Our
restaurants serve a large cross-section of the public and, in the course of
serving that many people, disputes arise as to products, services, accidents and
other matters typical of an extensive restaurant business such as
ours.
Suppliers
We rely
on large numbers of suppliers who are required to meet and maintain our high
standards. On occasion, disputes may arise with our suppliers on a number of
issues including, but not limited to, compliance with product specifications and
certain business concerns. Additionally, disputes may arise on a number of
issues between us and individuals or entities who claim they should have been
granted the approval or opportunity to supply products or services to our
restaurants.
Franchising
A
substantial number of our restaurants are franchised to independent
entrepreneurs operating under contractual arrangements with us. In the course of
the franchise relationship, disputes occasionally arise between us and our
franchisees relating to a broad range of subjects including, without limitation,
quality, service and cleanliness issues, contentions regarding terminations of
franchises, and delinquent payments. Additionally, occasional disputes arise
between us and individuals who claim they should have been granted a
franchise.
Intellectual
Property
We have
registered trademarks and service marks, patents and copyrights, some of which
are of material importance to our business. From time to time, we may become
involved in litigation to defend and protect our use of our intellectual
property.
PART II
Our
common stock is listed on the NYSE under the symbol “CKR”. As of
March 17, 2010, there were approximately 1,492 record holders of our common
stock. The following table sets forth, for the periods indicated, the high and
low sales prices of our common stock, as reported on the NYSE Composite
Tape:
|
High
|
Low
|
|||||||
|
Fiscal
2010
|
||||||||
|
First
Quarter
|
$ | 10.16 | $ | 5.65 | ||||
|
Second
Quarter
|
9.86
|
7.60
|
||||||
|
Third
Quarter
|
11.52
|
8.51
|
||||||
|
Fourth
Quarter
|
9.63
|
8.00
|
||||||
|
Fiscal
2009
|
||||||||
|
First
Quarter
|
$ | 13.35 | $ | 10.25 | ||||
|
Second
Quarter
|
14.32
|
8.82
|
||||||
| Third Quarter | 14.45 | 6.36 | ||||||
|
Fourth
Quarter
|
10.09
|
4.88
|
||||||
During
fiscal 2010 and 2009, we declared aggregate annual cash dividends of $0.24 per
share of common stock, for a total of $13,178 and $12,859,
respectively. In accordance with the terms of the Merger Agreement,
our ability to declare dividends is restricted. See further discussion in Note
25 of Notes to Consolidated Financial Statements included herein. If the Merger
is not completed, we will continue to base future dividend decisions on a number
of factors, including our operating results and financial
condition.
Pursuant
to the Stock Repurchase Plan authorized by our Board of Directors, and announced
on April 13, 2004, as modified during fiscal 2008, we are allowed to repurchase
up to an aggregate of $400,000 of our common stock. During fiscal 2010, we
repurchased 191,062 shares of common stock at an average price of $9.02 per
share, for a total of $1,724, including commissions. Based on our
Board of Directors’ authorization and the amount of cumulative repurchases of
our common stock that we have already made thereunder, we are permitted to make
additional repurchases of our common stock up to $36,875 under the Stock
Repurchase Plan as of January 31, 2010.
There was
no common stock held in treasury as of January 31, 2010 and 2009.
The
following table provides information with respect to shares of common stock
repurchased by us during the fiscal quarter ended January 25, 2010:
|
(a)
|
(b)
|
(c)
|
(d)
|
|||||||||||||
| Period |
Total
Number
of
Shares
Purchased
|
Average
Price
Paid
per
Share
|
Total
Number of
Shares
Purchased
as
Part of
Publicly
Announced
Plans
or
Programs
|
Maximum
Dollar
Value
of Shares
that
May Yet Be
Purchased
Under
the
Plans or
Programs
|
||||||||||||
|
November 3,
2009 — November 30, 2009
|
— | $ | — | — | $ | 36,909 | ||||||||||
|
December 1,
2009 — December 28, 2009
|
— | — | — | 36,909 | ||||||||||||
| December 29, 2009 — January 25, 2010 | 4,216 | 8.05 | 4,216 | 36,875 | ||||||||||||
| Total | 4,216 | $ | 8.05 | 4,216 | $ | 36,875 | ||||||||||
The graph
below shows the cumulative total stockholder return of an investment of $100
(and the reinvestment of any dividends thereafter) on January 31, 2005 in
(i) our common stock, (ii) the QSR Peer Group and (iii) the
Standard and Poor (“S&P”) Small Cap 600 Index. Our stock price performance
shown in the graph below may not be indicative of future stock price
performance.
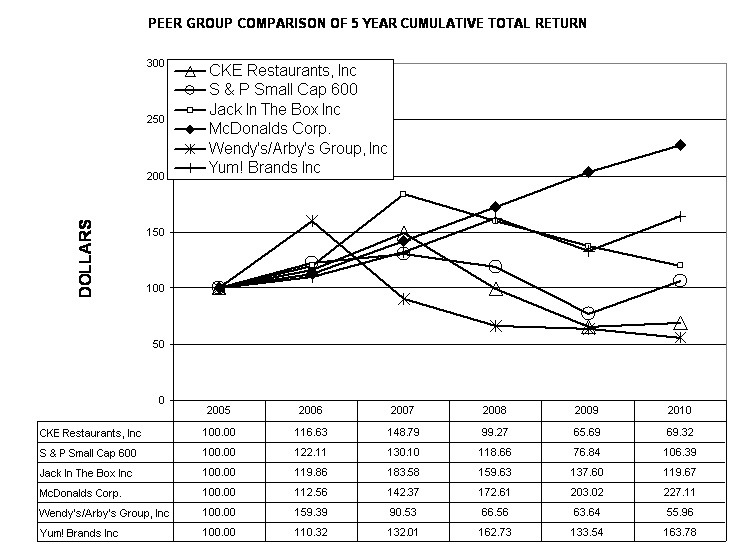
______________________
* $100 invested
on January 31, 2005 in stock or index, including reinvestment of
dividends.
The
information set forth below should be read in conjunction with the Consolidated
Financial Statements and related notes and Management’s Discussion and Analysis
of Financial Condition and Results of Operations included elsewhere in this
Annual Report on Form 10-K. All amounts, except per share and ratio
amounts, presented in Item 6 are in thousands.
Selected
Financial and Operating Data
|
Fiscal
Year Ended January 31,(1)
|
||||||||||||||||||||
|
2010
|
2009
|
2008
|
2007
|
2006
|
||||||||||||||||
|
Consolidated
Statements of Income Data:
|
||||||||||||||||||||
|
Revenue:
|
||||||||||||||||||||
|
Company-operated
restaurants
|
$
|
1,084,474
|
$
|
1,131,312
|
$
|
1,201,577
|
$
|
1,225,227
|
$
|
1,162,179
|
||||||||||
|
Franchised
and licensed restaurants and other
|
334,259
|
351,398
|
333,057
|
316,844
|
307,012
|
|||||||||||||||
|
Total revenue
|
$
|
1,418,733
|
$
|
1,482,710
|
$
|
1,534,634
|
$
|
1,542,071
|
$
|
1,469,191
|
||||||||||
|
Operating
income(2)
|
$
|
79,495
|
$
|
84,020
|
$
|
88,327
|
$
|
110,694
|
$
|
80,368
|
||||||||||
|
Interest
expense(3)
|
19,254
|
28,609
|
33,033
|
19,768
|
22,988
|
|||||||||||||||
|
Income
tax expense (benefit)(4)
|
14,978
|
21,533
|
24,659
|
34,019
|
(122,962
|
)
|
||||||||||||||
|
Income
from continuing operations
|
48,198
|
36,956
|
35,072
|
54,194
|
182,709
|
|||||||||||||||
|
Loss
from discontinued operations(5)
|
—
|
—
|
(3,996
|
)
|
(4,022
|
)
|
(1,570
|
)
|
||||||||||||
|
Net
income
|
48,198
|
36,956
|
31,076
|
50,172
|
181,139
|
|||||||||||||||
|
Basic
income from continuing operations per common
share
|
0.88
|
0.69
|
0.58
|
0.85
|
3.08
|
|||||||||||||||
|
Diluted
income from continuing operations per common share
|
0.87
|
0.68
|
0.56
|
0.77
|
2.53
|
|||||||||||||||
|
Diluted
loss from discontinued operations per common share
|
—
|
—
|
(0.06
|
)
|
(0.05
|
)
|
(0.02
|
)
|
||||||||||||
|
Diluted
income per common share
|
0.87
|
0.68
|
0.50
|
0.72
|
2.51
|
|||||||||||||||
|
Diluted
income per common share, excluding mark-to-market
adjustments(6)
|
0.95
|
0.78
|
0.61
|
|||||||||||||||||
|
Cash
dividends declared per common share
|
0.24
|
0.24
|
0.24
|
0.16
|
0.16
|
|||||||||||||||
|
Ratio
of earnings to fixed charges(7)
|
2.3
|
x
|
2.0
|
x
|
2.0
|
x
|
2.8
|
x
|
2.1
|
x
|
||||||||||
|
Blended
same-store sales (decrease) increase(8)
|
(3.9
|
)%
|
1.7
|
%
|
1.5
|
%
|
4.8
|
%
|
1.0
|
%
|
||||||||||
|
Company-operated
restaurant-level margin(6)
|
18.6
|
%
|
18.9
|
%
|
18.9
|
%
|
20.8
|
%
|
19.4
|
%
|
||||||||||
|
Franchise
contribution(6)
|
$
|
80,409
|
$
|
81,699
|
$
|
74,762
|
$
|
77,324
|
$
|
69,937
|
||||||||||
|
Segment
Operating Data:
|
||||||||||||||||||||
|
Carl’s
Jr.:
|
||||||||||||||||||||
|
Total revenue
|
$
|
852,479
|
$
|
886,349
|
$
|
845,634
|
$
|
830,961
|
$
|
802,761
|
||||||||||
|
Operating income
|
53,427
|
67,505
|
66,801
|
80,692
|
80,047
|
|||||||||||||||
|
Hardee’s:
|
||||||||||||||||||||
|
Total revenue
|
565,462
|
595,487
|
685,273
|
706,884
|
661,509
|
|||||||||||||||
|
Operating income
|
25,760
|
16,153
|
21,227
|
30,201
|
11,600
|
|||||||||||||||
|
Consolidated
Balance Sheet Data:
|
||||||||||||||||||||
|
Cash
and cash equivalents
|
$
|
18,246
|
$
|
17,869
|
$
|
19,993
|
$
|
18,620
|
$
|
21,279
|
||||||||||
|
Working
capital deficit
|
(53,408
|
)
|
(38,779
|
)
|
(47,510
|
)
|
(33,631
|
)
|
(27,038
|
)
|
||||||||||
|
Total
assets
|
823,543
|
804,687
|
791,711
|
796,638
|
795,428
|
|||||||||||||||
|
Total
long-term debt and capital lease obligations, including current
portion
|
329,008
|
357,450
|
392,036
|
178,055
|
264,662
|
|||||||||||||||
|
Stockholders’
equity
|
236,175
|
194,276
|
145,242
|
378,846
|
308,938
|
|||||||||||||||
________
|
(1)
|
Our
fiscal year is 52 or 53 weeks, ending the last Monday in January. For
clarity of presentation, we generally label all fiscal years presented as
if the fiscal year ended January 31. All years presented include
52 weeks.
|
|
(2)
|
Fiscal
2010, 2009, 2008, 2007, and 2006, include $4,695, $4,139, $(577), $3,543,
and $6,481, respectively, of facility action charges, net, which are
included in operating income.
|
|
(3)
|
Fiscal
2010, 2009 and 2008 include $6,803, $9,010 and $11,380, respectively, of
interest expense related to changes in the fair value of our interest rate
swap agreements.
|
|
(4)
|
Fiscal
2010 and 2006 include income tax benefits of $9,894
and $147,988, respectively, related to the reversal of previously
established valuation allowance against deferred income tax
assets.
|
|
(5)
|
Discontinued
operations contain the financial results of La Salsa in fiscal 2008,
2007, and 2006.
|
|
(6)
|
Refer
to definition of company-operated restaurant-level margin, franchise
contribution and diluted income per common share, excluding mark-to-market
adjustments, within subheading “Presentation of Non-GAAP Measures” in Item
7 of this Annual Report on Form10-K. We entered into our interest rate
swap agreements during fiscal 2008. Accordingly, diluted income per share,
excluding mark-to-market adjustments is not applicable for fiscal 2007 and
2006.
|
|
(7)
|
For
purposes of calculating the ratio of earnings to fixed charges,
(a) earnings represent income before income taxes, discontinued
operations and fixed charges, and (b) fixed charges consist of
interest on all indebtedness, interest related to capital lease
obligations, amortization of debt issuance costs and a portion of rental
expense that is representative of the interest factor (deemed by us to be
one-third).
|
|
(8)
|
Blended
same-store sales are calculated by using a weighted average of the
company-operated same-store sales for our Carl’s Jr. and Hardee’s
brands.
|
Selected
Financial and Operating Data by Segment
|
Fiscal
Year Ended January 31,(1)
|
||||||||||||||||||||
|
2010
|
2009
|
2008
|
2007
|
2006
|
||||||||||||||||
|
Carl’s
Jr. Restaurants
|
||||||||||||||||||||
|
Restaurants
open (at end of fiscal year):
|
||||||||||||||||||||
|
Company-operated
|
422
|
416
|
406
|
393
|
428
|
|||||||||||||||
|
Franchised
|
666
|
658
|
632
|
608
|
552
|
|||||||||||||||
|
Licensed
|
136
|
121
|
103
|
86
|
69
|
|||||||||||||||
|
Total
|
1,224
|
1,195
|
1,141
|
1,087
|
1,049
|
|||||||||||||||
|
Restaurant
revenue:
|
||||||||||||||||||||
|
Company-operated restaurants
|
$
|
604,937
|
$
|
625,109
|
$
|
595,272
|
$
|
590,613
|
$
|
574,663
|
||||||||||
|
Franchised and licensed restaurants(2)
|
859,672
|
894,611
|
853,391
|
795,520
|
700,590
|
|||||||||||||||
|
Company-operated AUV
(trailing-13 periods)
|
1,438
|
1,528
|
1,493
|
1,440
|
1,341
|
|||||||||||||||
|
Franchise-operated AUV
(trailing-13 periods)
|
1,123
|
1,182
|
1,197
|
1,205
|
1,160
|
|||||||||||||||
|
Company-operated
same-store sales (decrease) increase
|
(6.2
|
)%
|
2.1
|
%
|
0.9
|
%
|
4.9
|
%
|
2.2
|
%
|
||||||||||
|
Franchise-operated
same-store sales (decrease) increase
|
(5.6
|
)%
|
(1.6
|
)%
|
(0.6
|
)%
|
5.4
|
%
|
0.7
|
%
|
||||||||||
|
Restaurant
operating costs as a percentage of company-operated restaurants
revenue
|
80.0
|
%
|
78.8
|
%
|
78.5
|
%
|
76.3
|
%
|
76.6
|
%
|
||||||||||
|
Company-operated
restaurant-level margin (3)
|
20.0
|
%
|
21.2
|
%
|
21.5
|
%
|
23.7
|
%
|
23.4
|
%
|
||||||||||
|
Franchise
contribution (3)
|
$
|
31,460
|
$
|
31,509
|
$
|
30,987
|
$
|
31,514
|
$
|
31,126
|
||||||||||
|
Hardee’s
Restaurants
|
||||||||||||||||||||
|
Restaurants open (at end of fiscal year):
|
||||||||||||||||||||
|
Company-operated
|
475
|
482
|
560
|
696
|
663
|
|||||||||||||||
|
Franchised
|
1,228
|
1,231
|
1,187
|
1,058
|
1,184
|
|||||||||||||||
|
Licensed
|
202
|
195
|
179
|
152
|
146
|
|||||||||||||||
|
Total
|
1,905
|
1,908
|
1,926
|
1,906
|
1,993
|
|||||||||||||||
|
Restaurant
revenue:
|
||||||||||||||||||||
|
Company-operated restaurants
|
$
|
479,289
|
$
|
505,919
|
$
|
605,986
|
$
|
634,264
|
$
|
587,082
|
||||||||||
|
Franchised and licensed restaurants(2)
|
1,380,503
|
1,314,624
|
1,196,505
|
1,156,201
|
1,173,442
|
|||||||||||||||
|
Company-operated AUV
(trailing-13 periods)
|
1,002
|
993
|
954
|
916
|
874
|
|||||||||||||||
|
Franchise-operated AUV
(trailing-13 periods)
|
976
|
970
|
964
|
949
|
897
|
|||||||||||||||
|
Company-operated
same-store sales (decrease) increase
|
(0.9
|
)%
|
1.2
|
%
|
2.0
|
%
|
4.8
|
%
|
(0.2
|
)%
|
||||||||||
|
Franchise-operated
same-store sales (decrease) increase
|
(0.3
|
)%
|
1.3
|
%
|
0.4
|
%
|
4.3
|
%
|
(2.2
|
)%
|
||||||||||
|
Restaurant
operating costs as a percentage of company-operated restaurants
revenue
|
83.2
|
%
|
83.9
|
%
|
83.6
|
%
|
81.9
|
%
|
84.5
|
%
|
||||||||||
|
Company-operated
restaurant-level margin (3)
|
16.8
|
%
|
16.1
|
%
|
16.4
|
%
|
18.1
|
%
|
15.5
|
%
|
||||||||||
|
Franchise
contribution (3)
|
$
|
48,409
|
$
|
49,600
|
$
|
43,266
|
$
|
45,324
|
$
|
38,367
|
||||||||||
__________
|
(1)
|
Our
fiscal year is 52 or 53 weeks, ending the last Monday in January. For
clarity of presentation, we generally label all fiscal years presented as
if the fiscal year ended January 31. All years presented include
52 weeks.
|
|
(2)
|
Franchised
and licensed restaurant operations are not included in our Consolidated
Statements of Income; however, franchised and licensed restaurants
revenues result in royalties and rental revenues, which are included in
franchised and licensed restaurants and other
revenue.
|
|
(3)
|
Refer
to definition of company-operated restaurant-level margin and franchise
contribution within subheading “Presentation of Non-GAAP Measures” in Item
7 of this Annual Report on
Form10-K.
|
The
following discussion should be read in conjunction with the Consolidated
Financial Statements and related notes and Selected Financial and Operating Data
included elsewhere in this Annual Report on Form 10-K.
Merger
Agreement
On
February 26, 2010, we entered into the Merger Agreement, which provides for the
Merger of the Company with and into the Merger Sub with the Company surviving as
a wholly-owned subsidiary of Parent, which is an affiliate of THL. If
the Merger is completed, each share of our common stock issued and outstanding
immediately prior to closing automatically will be cancelled and converted into
the right to receive $11.05 in cash, and the Company will cease to be a publicly
traded company.
Overview
Highlights
from fiscal 2010 include:
|
·
|
We
remodeled 55 Carl’s Jr. and 102 Hardee’s company-operated
restaurants, and we also completed a combined 42 dual-branded Green
Burrito and Red Burrito company-operated restaurant conversions. In
addition, our franchisees and licensees remodeled 38 Carl’s Jr. and 63
Hardee’s restaurants and completed 14 dual-branded restaurant
conversions.
|
|
·
|
Carl’s
Jr. and Hardee’s systemwide restaurant count increased by 26 restaurants,
marking our third straight year of net restaurant growth. We opened 15
company-operated and our franchisees and licensees opened 30 domestic and
35 international restaurants,
respectively.
|
|
·
|
A
total of 4 development agreements were signed with new and existing
franchisees representing commitments to build a total of 106 restaurants
domestically and internationally.
|
|
·
|
Bank
and other long-term debt decreased by $36,324, or 11.5%, to
$278,464.
|
|
·
|
During
fiscal 2010, we declared cash dividends of $0.06 per share of our common
stock each quarter for an annual total of $0.24 per share, or
$13,178.
|
|
·
|
Restaurant
operating costs as a percentage of company-operated restaurants revenue on
a consolidated basis increased 0.3% to 81.4% due to higher depreciation
and amortization expense as well as payroll and other employee benefits,
partially offset by lower food and packaging
costs.
|
|
·
|
General
and administrative expense decreased $7,168, or 5.1%, in fiscal 2010,
which is our third consecutive year of declining general and
administrative expense.
|
|
·
|
Consolidated
revenue decreased 4.3%, to $1,418,733 in fiscal 2010 from $1,482,710 in
fiscal 2009.
|
|
·
|
Net
income increased
$11,242 to $48,198, or $0.87 per diluted common share in
fiscal 2010, versus $36,956, or $0.68 per diluted common share in fiscal
2009. Net income in fiscal 2010 includes an income tax benefit of $9,894
related to a reduction in our valuation allowance for deferred income tax
assets.
|
|
·
|
Same-store
sales decreased 6.2% and 0.9% at Carl’s Jr. and Hardee’s company-operated
restaurants, respectively.
|
|
·
|
Average
unit volumes decreased to $1,438 and increased to $1,002 for the
trailing-13 periods at company-operated Carl’s Jr. and Hardee’s
restaurants, respectively.
|
We are an
international owner, operator and franchisor of QSRs, operating principally
under the Carl’s Jr. and Hardee’s brand names. As of January 31, 2010, we
operated 422 and our franchisees and licensees operated 666 domestic and 136
international Carl’s Jr. restaurants. These 1,224 Carl’s Jr. restaurants are
predominately located in the Western United States, primarily in California,
with a strong international presence in Mexico. As of January 31, 2010, we
operated 475 and our franchisees and licensees operated 1,228 domestic and 202
international Hardee’s restaurants. These 1,905 Hardee’s restaurants are located
predominately throughout the Southeastern and Midwestern United States, with a
growing international presence in the Middle East.
23
CKE
RESTAURANTS, INC. AND SUBSIDIARIES
Management’s
Discussion and Analysis – (Continued)
(Dollars
in thousands)
We derive
our revenue primarily from sales at company-operated restaurants and revenue
from franchisees and licensees, including franchise and royalty fees, sales to
Carl’s Jr. franchisees and licensees of food and packaging products, rental
revenue under real property leases and revenue from the sale of equipment to our
franchisees. Restaurant operating expenses consist primarily of food and
packaging costs, payroll and other employee benefits and occupancy and other
operating expenses of company-operated restaurants. Franchise operating costs
include the cost of food and packaging products sold to Carl’s Jr. franchisees
and licensees, lease payments or depreciation expense on properties leased or
subleased to our franchisees, the cost of equipment sold to franchisees and
franchise administrative support. Our revenue and expenses are directly affected
by the number and sales volume of company-operated restaurants and, to a lesser
extent, by the number and sales volume of franchised and licensed
restaurants.
Operating
Review
The
following table is presented to facilitate Management’s Discussion and Analysis
of Financial Condition and Results of Operations.
|
Fiscal
|
Fourth
Quarter Fiscal
|
|||||||||||||||||||
|
2010
|
2009
|
2008
|
2010
|
2009
|
||||||||||||||||
|
Company-operated
restaurants revenue
|
$
|
1,084,474
|
$
|
1,131,312
|
$
|
1,201,577
|
$
|
236,820
|
$
|
250,454
|
||||||||||
|
Restaurant
operating costs:
|
||||||||||||||||||||
|
Food
and packaging
|
310,483
|
335,707
|
356,332
|
68,417
|
73,493
|
|||||||||||||||
|
Payroll
and other employee benefits
|
312,571
|
322,936
|
350,526
|
71,429
|
72,587
|
|||||||||||||||
|
Occupancy
and other
|
260,061
|
258,995
|
267,372
|
58,600
|
59,308
|
|||||||||||||||
|
Total
restaurant operating costs
|
883,115
|
917,638
|
974,230
|
198,446
|
205,388
|
|||||||||||||||
|
Franchised
and licensed restaurants and other revenue:
|
||||||||||||||||||||
|
Royalties
|
84,447
|
83,600
|
75,690
|
18,840
|
18,843
|
|||||||||||||||
|
Distribution
centers
|
213,818
|
228,480
|
219,441
|
47,831
|
49,787
|
|||||||||||||||
|
Rent
|
33,596
|
33,625
|
29,659
|
7,738
|
7,520
|
|||||||||||||||
|
Retail
sales of variable interest entity
|
—
|
—
|
2,954
|
—
|
—
|
|||||||||||||||
|
Franchise
fees
|
2,398
|
5,693
|
5,313
|
516
|
850
|
|||||||||||||||
|
Total
franchised and licensed restaurants and other revenue
|
334,259
|
351,398
|
333,057
|
74,925
|
77,000
|
|||||||||||||||
|
Franchised
and licensed restaurants and other expenses:
|
||||||||||||||||||||
|
Administrative
expense
|
15,218
|
14,542
|
11,951
|
3,685
|
3,397
|
|||||||||||||||
|
Distribution
centers
|
210,913
|
228,360
|
219,350
|
47,242
|
49,842
|
|||||||||||||||
|
Rent
and other occupancy
|
27,719
|
26,797
|
24,095
|
6,243
|
6,329
|
|||||||||||||||
|
Operating
costs of variable interest entity
|
—
|
—
|
2,899
|
—
|
—
|
|||||||||||||||
|
Total
franchised and licensed restaurants and other expenses
|
253,850
|
269,699
|
258,295
|
57,170
|
59,568
|
|||||||||||||||
|
Advertising
expense
|
64,443
|
66,911
|
70,324
|
12,992
|
15,009
|
|||||||||||||||
|
General
and administrative expense
|
133,135
|
140,303
|
144,035
|
30,074
|
32,266
|
|||||||||||||||
|
Facility
action charges, net
|
4,695
|
4,139
|
(577
|
)
|
1,673
|
1,473
|
||||||||||||||
|
Operating
income
|
$
|
79,495
|
$
|
84,020
|
$
|
88,327
|
$
|
11,390
|
$
|
13,750
|
||||||||||
|
Blended
same-store sales (decrease) increase(1)
|
(3.9
|
)%
|
1.7
|
%
|
1.5
|
%
|
(6.0
|
)%
|
0.3
|
%
|
||||||||||
|
Blended
AUV (trailing-13 periods) (1)
|
$
|
1,206
|
$
|
1,232
|
$
|
1,162
|
||||||||||||||
|
Company-operated
restaurant-level margin(2)
|
18.6
|
%
|
18.9
|
%
|
18.9
|
%
|
16.2
|
%
|
18.0
|
%
|
||||||||||
|
Franchise
contribution(2)
|
$
|
80,409
|
$
|
81,699
|
$
|
74,762
|
$
|
17,755
|
$
|
17,432
|
||||||||||
________
|
(1)
|
Blended
same-store sales is calculated by using a weighted average of the
company-operated same-store sales for our Carl’s Jr. and Hardee’s brands.
Blended AUV is calculated by using the company-operated AUV from the
trailing-13 periods for our Carl’s Jr. and Hardee’s brands.
|
|
(2)
|
Refer
to definition of company-operated restaurant-level margin and franchise
contribution within subheading “Presentation of Non-GAAP Measures” in Item
7 of this Annual Report on Form
10-K.
|
24
CKE
RESTAURANTS, INC. AND SUBSIDIARIES
Management’s
Discussion and Analysis – (Continued)
(Dollars
in thousands)
The
following table sets forth the percentage relationship to total revenue, unless
otherwise indicated, of certain items included in our Consolidated Statements of
Income for fiscal 2010, 2009, and 2008, and our unaudited Condensed Consolidated
Statements of Income for the fourth quarters of fiscal 2010 and
2009:
|
Fiscal
|
Fourth
Quarter Fiscal
|
|||||||||||||||||||
|
2010
|
2009
|
2008
|
2010
|
2009
|
||||||||||||||||
|
Revenue:
|
||||||||||||||||||||
|
Company-operated
restaurants
|
76.4
|
%
|
76.3
|
%
|
78.3
|
%
|
76.0
|
%
|
76.5
|
%
|
||||||||||
|
Franchised
and licensed restaurants and other
|
23.6
|
23.7
|
21.7
|
24.0
|
23.5
|
|||||||||||||||
|
Total revenue
|
100.0
|
100.0
|
100.0
|
100.0
|
100.0
|
|||||||||||||||
|
Operating
costs and expenses:
|
||||||||||||||||||||
|
Restaurant
operating costs(1):
|
||||||||||||||||||||
|
Food and packaging
|
28.6
|
29.7
|
29.7
|
28.9
|
29.3
|
|||||||||||||||
|
Payroll and other employee benefits
|
28.8
|
28.5
|
29.2
|
30.2
|
29.0
|
|||||||||||||||
|
Occupancy and other
|
24.0
|
22.9
|
22.3
|
24.7
|
23.7
|
|||||||||||||||
|
Total restaurant operating costs
|
81.4
|
81.1
|
81.1
|
83.8
|
82.0
|
|||||||||||||||
|
Franchised
and licensed restaurants and other(2)
|
75.9
|
76.8
|
77.6
|
76.3
|
77.4
|
|||||||||||||||
|
Advertising
expense(1)
|
5.9
|
5.9
|
5.9
|
5.5
|
6.0
|
|||||||||||||||
|
General
and administrative expense
|
9.4
|
9.5
|
9.4
|
9.6
|
9.9
|
|||||||||||||||
|
Facility
action charges, net
|
0.3
|
0.3
|
—
|
0.5
|
0.4
|
|||||||||||||||
|
Operating
income
|
5.6
|
5.7
|
5.8
|
3.7
|
4.2
|
|||||||||||||||
|
Interest
expense
|
(1.4
|
)
|
(1.9
|
)
|
(2.2
|
)
|
(1.4
|
)
|
(3.7
|
)
|
||||||||||
|
Other
income, net
|
0.2
|
0.2
|
0.3
|
0.3
|
0.2
|
|||||||||||||||
|
Income
before income taxes and discontinued operations
|
4.5
|
3.9
|
3.9
|
2.5
|
0.7
|
|||||||||||||||
|
Income
tax expense (benefit)
|
1.1
|
1.5
|
1.6
|
(2.4
|
) |
(0.1
|
)
|
|||||||||||||
|
Income
from continuing operations
|
3.4
|
%
|
2.5
|
%
|
2.3
|
%
|
4.9
|
%
|
0.8
|
%
|
||||||||||
_________
|
(1)
|
As
a percentage of company-operated restaurants revenue.
|
|
(2)
|
As
a percentage of franchised and licensed restaurants and other
revenue.
|
25
CKE
RESTAURANTS, INC. AND SUBSIDIARIES
Management’s
Discussion and Analysis – (Continued)
(Dollars
in thousands)
The
following tables show the change in restaurant portfolios, consolidated and by
brand, for fiscal 2009 and 2010:
|
Consolidated
|
Company-
operated
|
Franchised
|
Licensed
|
Total
|
||||||
|
Open
as of January 31, 2008
|
967 | 1,834 | 282 | 3,083 | ||||||
|
New
|
24 | 45 | 40 | 109 | ||||||
|
Closed
|
(24 | ) | (46 | ) | (6 | ) | (76 | ) | ||
|
Divested
|
(105 | ) | (37 | ) | - | (142 | ) | |||
|
Acquired
|
37 | 105 | - | 142 | ||||||
|
Open
as of January 31, 2009
|
899 | 1,901 | 316 | 3,116 | ||||||
|
New
|
15 | 30 | 35 | 80 | ||||||
|
Closed
|
(14 | ) | (28 | ) | (13 | ) | (55 | ) | ||
|
Divested
|
(4 | ) | (2 | ) | - | (6 | ) | |||
|
Acquired
|
2 | 4 | - | 6 | ||||||
|
Open
as of January 31, 2010
|
898 | 1,905 | 338 | 3,141 | ||||||
|
Carl's Jr.
|
Company-
operated
|
Franchised
|
Licensed
|
Total
|
||||||
|
Open
as of January 31, 2008
|
406 | 632 | 103 | 1,141 | ||||||
|
New
|
17 | 29 | 19 | 65 | ||||||
|
Closed
|
(4 | ) | (6 | ) | (1 | ) | (11 | ) | ||
|
Divested
|
(3 | ) | - | - | (3 | ) | ||||
|
Acquired
|
- | 3 | - | 3 | ||||||
|
Open
as of January 31, 2009
|
416 | 658 | 121 | 1,195 | ||||||
|
New
|
12 | 19 | 20 | 51 | ||||||
|
Closed
|
(5 | ) | (12 | ) | (5 | ) | (22 | ) | ||
|
Divested
|
(3 | ) | (2 | ) | - | (5 | ) | |||
|
Acquired
|
2 | 3 | - | 5 | ||||||
|
Open
as of January 31, 2010
|
422 | 666 | 136 | 1,224 | ||||||
|
Hardee's
|
Company-
operated
|
Franchised
|
Licensed
|
Total
|
||||||
|
Open
as of January 31, 2008
|
560 | 1,187 | 179 | 1,926 | ||||||
|
New
|
7 | 16 | 21 | 44 | ||||||
|
Closed
|
(20 | ) | (37 | ) | (5 | ) | (62 | ) | ||
|
Divested
|
(102 | ) | (37 | ) | - | (139 | ) | |||
|
Acquired
|
37 | 102 | - | 139 | ||||||
|
Open
as of January 31, 2009
|
482 | 1,231 | 195 | 1,908 | ||||||
|
New
|
3 | 11 | 15 | 29 | ||||||
|
Closed
|
(9 | ) | (15 | ) | (8 | ) | (32 | ) | ||
|
Divested
|
(1 | ) | - | - | (1 | ) | ||||
|
Acquired
|
- | 1 | - | 1 | ||||||
|
Open
as of January 31, 2010
|
475 | 1,228 | 202 | 1,905 | ||||||
26
CKE
RESTAURANTS, INC. AND SUBSIDIARIES
Management’s
Discussion and Analysis – (Continued)
(Dollars
in thousands)
The
following tables are presented to facilitate Management’s Discussion and
Analysis of Financial Condition and Results of Operations and are classified in
the same way as we present segment information (see Note 20 of Notes to
Consolidated Financial Statements).
|
Carl’s
Jr.
|
Fiscal
|
Fourth
Quarter Fiscal
|
||||||||||||||||||
|
2010
|
2009
|
2008
|
2010
|
2009
|
||||||||||||||||
|
Company-operated
restaurants revenue
|
$
|
604,937
|
$
|
625,109
|
$
|
595,272
|
$
|
132,636
|
$
|
142,440
|
||||||||||
|
Restaurant
operating costs:
|
||||||||||||||||||||
|
Food and packaging
|
171,458
|
182,705
|
172,990
|
38,564
|
40,952
|
|||||||||||||||
|
Payroll and other employee benefits
|
165,034
|
166,833
|
159,828
|
37,315
|
38,490
|
|||||||||||||||
|
Occupancy and other
|
147,326
|
143,149
|
134,685
|
33,815
|
33,019
|
|||||||||||||||
|
Total restaurant operating costs
|
483,818
|
492,687
|
467,503
|
109,694
|
112,461
|
|||||||||||||||
|
Franchised
and licensed restaurants and other revenue:
|
||||||||||||||||||||
|
Royalties
|
32,346
|
33,375
|
31,851
|
7,443
|
7,372
|
|||||||||||||||
|
Distribution centers
|
192,188
|
204,834
|
195,144
|
44,268
|
44,958
|
|||||||||||||||
|
Rent
|
21,674
|
21,216
|
21,751
|
5,054
|
4,901
|
|||||||||||||||
|
Franchise fees
|
1,334
|
1,815
|
1,616
|
296
|
298
|
|||||||||||||||
|
Total franchised and licensed restaurants and other
revenue
|
247,542
|
261,240
|
250,362
|
57,061
|
57,529
|
|||||||||||||||
|
Franchised
and licensed restaurants and other expenses:
|
||||||||||||||||||||
|
Administrative expense
|
7,671
|
7,318
|
5,845
|
1,866
|
1,765
|
|||||||||||||||
|
Distribution centers
|
189,346
|
203,898
|
194,929
|
43,621
|
44,601
|
|||||||||||||||
|
Rent and other occupancy
|
19,065
|
18,515
|
18,601
|
4,449
|
4,324
|
|||||||||||||||
|
Total franchised and licensed restaurants and other
expenses
|
216,082
|
229,731
|
219,375
|
49,936
|
50,690
|
|||||||||||||||
|
Advertising
expense
|
36,730
|
36,963
|
34,424
|
7,304
|
8,406
|
|||||||||||||||
|
General
and administrative expense
|
60,203
|
60,012
|
56,501
|
13,698
|
14,210
|
|||||||||||||||
|
Facility
action charges, net
|
2,219
|
(549
|
)
|
1,030
|
157
|
291
|
||||||||||||||
|
Operating
income
|
$
|
53,427
|
$
|
67,505
|
$
|
66,801
|
$
|
8,908
|
$
|
13,911
|
||||||||||
|
Company-operated AUV
(trailing-13 periods)
|
$
|
1,438
|
$
|
1,528
|
$
|
1,493
|
||||||||||||||
|
Franchise-operated AUV
(trailing-13 periods)
|
$
|
1,123
|
$
|
1,182
|
$
|
1,197
|
||||||||||||||
|
Company-operated
same-store sales (decrease) increase
|
(6.2
|
)%
|
2.1
|
%
|
0.9
|
%
|
(8.7
|
)%
|
(0.6
|
)%
|
||||||||||
|
Franchise-operated
same-store sales decrease
|
(5.6
|
)%
|
(1.6
|
)%
|
(0.6
|
)%
|
(5.8
|
)%
|
(3.6
|
)%
|
||||||||||
|
Company-operated
same-store transaction decrease
|
(4.2
|
)%
|
(0.6
|
)%
|
(2.9
|
)%
|
(4.7
|
)%
|
(0.4
|
)%
|
||||||||||
|
Average
check (actual $)
|
$
|
6.91
|
$
|
7.01
|
$
|
6.80
|
$
|
6.82
|
$
|
7.06
|
||||||||||
|
Restaurant
operating costs as a percentage of company-operated restaurants
revenue:
|
||||||||||||||||||||
|
Food and packaging
|
28.3
|
%
|
29.2
|
%
|
29.1
|
%
|
29.1
|
%
|
28.8
|
%
|
||||||||||
|
Payroll and employee benefits
|
27.3
|
%
|
26.7
|
%
|
26.8
|
%
|
28.1
|
%
|
27.0
|
%
|
||||||||||
|
Occupancy and other
|
24.4
|
%
|
22.9
|
%
|
22.6
|
%
|
25.5
|
%
|
23.2
|
%
|
||||||||||
|
Total restaurant operating costs
|
80.0
|
%
|
78.8
|
%
|
78.5
|
%
|
82.7
|
%
|
79.0
|
%
|
||||||||||
|
Company-operated
restaurant-level margin (1)
|
20.0
|
%
|
21.2
|
%
|
21.5
|
%
|
17.3
|
%
|
21.0
|
%
|
||||||||||
|
Franchise
contribution (1)
|
$
|
31,460
|
$
|
31,509
|
$
|
30,987
|
$
|
7,125
|
$
|
6,839
|
||||||||||
|
Advertising
as a percentage of company-operated restaurants revenue
|
6.1
|
%
|
5.9
|
%
|
5.8
|
%
|
5.5
|
%
|
5.9
|
%%
|
||||||||||
_______
|
(1)
|
Refer
to definition of company-operated restaurant-level margin and franchise
contribution within subheading “Presentation of Non-GAAP Measures” in Item
7 of this Annual Report on
Form10-K.
|
27
CKE
RESTAURANTS, INC. AND SUBSIDIARIES
Management’s
Discussion and Analysis – (Continued)
(Dollars
in thousands)
| Hardee's |
Fiscal
|
Fourth
Quarter Fiscal
|
||||||||||||||||||
|
2010
|
2009
|
2008
|
2010
|
2009
|
||||||||||||||||
|
Company-operated
restaurants revenue
|
$ | 479,289 | $ | 505,919 | $ | 605,986 | $ | 104,129 | $ | 107,952 | ||||||||||
|
Restaurant
operating costs:
|
||||||||||||||||||||
|
Food and packaging
|
138,939 | 152,889 | 183,228 | 29,835 | 32,506 | |||||||||||||||
|
Payroll and other employee benefits
|
147,407 | 155,973 | 190,567 | 34,083 | 34,069 | |||||||||||||||
|
Occupancy and other
|
112,635 | 115,755 | 132,577 | 24,765 | 26,269 | |||||||||||||||
|
Total restaurant operating costs
|
398,981 | 424,617 | 506,372 | 88,683 | 92,844 | |||||||||||||||
|
Franchised
and licensed restaurants and other revenue:
|
||||||||||||||||||||
|
Royalties
|
51,557 | 49,646 | 43,375 | 11,276 | 11,341 | |||||||||||||||
|
Distribution centers
|
21,630 | 23,646 | 24,307 | 3,562 | 4,829 | |||||||||||||||
|
Rent
|
11,922 | 12,411 | 7,908 | 2,803 | 2,618 | |||||||||||||||
|
Franchise fees
|
1,064 | 3,865 | 3,697 | 220 | 552 | |||||||||||||||
|
Total franchised and licensed restaurants and other
revenue
|
86,173 | 89,568 | 79,287 | 17,861 | 19,340 | |||||||||||||||
|
Franchised
and licensed restaurants and other expenses:
|
||||||||||||||||||||
|
Administrative expense
|
7,544 | 7,224 | 6,106 | 1,817 | 1,633 | |||||||||||||||
|
Distribution centers
|
21,567 | 24,462 | 24,421 | 3,620 | 5,241 | |||||||||||||||
|
Rent and other occupancy
|
8,653 | 8,282 | 5,494 | 1,793 | 2,005 | |||||||||||||||
|
Total franchised and licensed restaurants and other
expenses
|
37,764 | 39,968 | 36,021 | 7,230 | 8,879 | |||||||||||||||
|
Advertising
expense
|
27,713 | 29,948 | 35,897 | 5,688 | 6,617 | |||||||||||||||
|
General
and administrative expense
|
72,768 | 80,113 | 87,363 | 16,338 | 18,012 | |||||||||||||||
|
Facility
action charges, net
|
2,476 | 4,688 | (1,607 | ) | 1,516 | 1,181 | ||||||||||||||
|
Operating
income (loss)
|
$ | 25,760 | $ | 16,153 | $ | 21,227 | $ | 2,535 | $ | (241 | ) | |||||||||
|
Company-operated AUV
(trailing-13 periods)
|
$ | 1,002 | $ | 993 | $ | 954 | ||||||||||||||
|
Franchise-operated AUV
(trailing-13 periods)
|
$ | 976 | $ | 970 | $ | 964 | ||||||||||||||
|
Company-operated
same-store sales (decrease) increase
|
(0.9 | )% | 1.2 | % | 2.0 | % | (2.5 | )% | 1.5 | % | ||||||||||
|
Franchise-operated
same-store sales (decrease) increase
|
(0.3 | )% | 1.3 | % | 0.4 | % | (2.6 | )% | 3.0 | % | ||||||||||
|
Company-operated
same-store transaction increase (decrease)
|
0.8 | % | (1.8 | )% | 0.8 | % | (0.7 | )% | 3.8 | % | ||||||||||
|
Average
check (actual $)
|
$ | 5.03 | $ | 5.13 | $ | 4.97 | $ | 5.01 | $ | 5.09 | ||||||||||
|
Restaurant
operating costs as a percentage of company-operated restaurants
revenue:
|
||||||||||||||||||||
|
Food and packaging
|
29.0 | % | 30.2 | % | 30.2 | % | 28.7 | % | 30.1 | % | ||||||||||
|
Payroll and employee benefits
|
30.8 | % | 30.8 | % | 31.4 | % | 32.7 | % | 31.6 | % | ||||||||||
|
Occupancy and other
|
23.5 | % | 22.9 | % | 21.9 | % | 23.8 | % | 24.3 | % | ||||||||||
|
Total restaurant operating costs
|
83.2 | % | 83.9 | % | 83.6 | % | 85.2 | % | 86.0 | % | ||||||||||
|
Company-operated
restaurant-level margin (1)
|
16.8 | % | 16.1 | % | 16.4 | % | 14.8 | % | 14.0 | % | ||||||||||
|
Franchise
contribution (1)
|
$ | 48,409 | $ | 49,600 | $ | 43,266 | $ | 10,631 | $ | 10,461 | ||||||||||
|
Advertising
as a percentage of company-operated restaurants
revenue
|
5.8 | % | 5.9 | % | 5.9 | % | 5.5 | % | 6.1 | % | ||||||||||
__________
|
(1)
|
Refer
to definition of company-operated restaurant-level margin and franchise
contribution within subheading “Presentation of Non-GAAP Measures” in Item
7 of this Annual Report on
Form10-K.
|
28
CKE
RESTAURANTS, INC. AND SUBSIDIARIES
Management’s
Discussion and Analysis – (Continued)
(Dollars
in thousands)
Fiscal
2010 Compared with Fiscal 2009
Carl’s
Jr.
Company-Operated
Restaurants
Revenue
from company-operated restaurants decreased $20,172 or 3.2%, to $604,937 during
fiscal 2010, as compared to the prior year, due primarily to a 6.2% decrease in
same-store sales. This decrease was partially offset by a net increase of six
company-operated restaurants since the end of fiscal 2009, resulting primarily
from the opening of twelve new restaurants and the closing of five restaurants.
AUV for the trailing-13 periods ended January 31, 2010, decreased 5.9% from the
prior fiscal year to $1,438. During the same period, the average guest check
decreased by 1.4%, and same-store transactions decreased by 4.2%. Sales at Carl’s Jr. were
negatively impacted during fiscal 2010 by continuing weakness in the overall
economy and the resulting impact on unemployment rates and consumer spending,
particularly in California where we have more than 350 company-operated Carl’s
Jr. restaurants. Our sales were also negatively impacted by the
deep-discounting of products by certain of our competitors.
The
changes in restaurant operating costs as a percentage of company-operated
restaurants revenue are explained as follows:
|
Restaurant
operating costs for fiscal 2009
|
78.8
|
%
|
||
|
Decrease
in food and packaging costs
|
(0.9
|
)
|
||
|
Increase
in depreciation and amortization expense
|
0.7
|
|||
|
Increase
in labor costs, excluding workers’ compensation
|
0.6
|
|||
|
Increase
in rent expense
|
0.4
|
|||
|
Increase
in banking and ATM costs
|
0.2
|
|||
|
Increase
in property tax expense
|
0.2
|
|||
|
Decrease
in utilities expense
|
(0.2
|
)
|
||
|
Other,
net
|
0.2
|
|||
|
Restaurant
operating costs for fiscal 2010
|
80.0
|
%
|
Food and
packaging costs decreased as a percent of company-operated restaurants revenue
during fiscal 2010, as compared to fiscal 2009, due primarily to decreased
commodity costs for beef, cheese, and oil products, and reduced distribution
costs related to lower fuel and administrative costs.
Depreciation
and amortization expense increased as a percentage of company-operated
restaurants revenue during fiscal 2010, as compared to fiscal 2009, mainly due
to asset additions related to remodels, new store openings and equipment
upgrades as well as the deleveraging impact of the decrease in same-store sales
and the relatively fixed nature of depreciation and amortization
expense.
Labor
costs, excluding workers’ compensation, increased as a percent of
company-operated restaurants revenue during fiscal 2010, as compared to fiscal
2009, primarily due to the deleveraging impact of the decrease in same-store
sales and the relatively fixed nature of restaurant management
costs.
Rent
expense increased as a percent of company-operated restaurants revenue during
fiscal 2010, as compared to fiscal 2009, due primarily to the deleveraging
impact of the decrease in same-store sales and the relatively fixed nature of
rent expense as well as an increase in rent expense for CPI
adjustments.
Franchised
and Licensed Restaurants
Total
franchised and licensed restaurants and other revenue decreased by $13,698, or
5.2%, to $247,542 in fiscal 2010, as compared to the prior year. Distribution
center sales of food, packaging and supplies to franchisees decreased by
$12,646, or 6.2%, during fiscal 2010 as compared to fiscal 2009, primarily due
to the 5.6% decline in franchisee same-store sales and a decrease in the cost of
food upon which the sales price of those items is based. Royalty revenues
decreased by $1,029, or 3.1%, due to lower international royalties primarily
resulting from declines in foreign currency exchange rates and lower domestic
royalties related to the decline in same-store sales. These decreases were
partially offset by an increase in the franchise store base over the comparable
prior fiscal year. Additionally, franchise fee revenues decreased by $481, or
26.5%, due to a reduction in new store franchise fees and development
fees.
29
CKE
RESTAURANTS, INC. AND SUBSIDIARIES
Management’s
Discussion and Analysis – (Continued)
(Dollars
in thousands)
Total
franchised and licensed operating and other expenses decreased by $13,649, or
5.9%, to $216,082 in fiscal 2010, as compared to fiscal 2009. This decrease is
mainly due to a decrease in distribution center sales to franchisees and the
relatively proportional decrease in the cost of food, packaging and supplies
sold, partially offset by an increase in rent and other occupancy
costs. This increase in rent and other occupancy costs is due
primarily to increases in rent for CPI adjustments and additional
leases.
As of
January 31, 2010, approximately 84.3% of Carl’s Jr. franchised and licensed
restaurants purchased food, packaging and supplies from us.
Hardee’s
Company-Operated
Restaurants
Revenue
from company-operated restaurants decreased $26,630 or 5.3%, to $479,289 in
fiscal 2010 from fiscal 2009. The decrease is mostly due to the impact of a net
decrease of 78 company-operated restaurants during fiscal 2009 in connection
with our successful refranchising program and a net decrease of seven
company-operated restaurants since the end of fiscal 2009. In addition, Hardee’s
same-store sales decreased by 0.9% during fiscal 2010. Our successful promotion
of premium products such as the French Dip Thickburger and popular breakfast
items including Biscuit Holes and Made From Scratch Blueberry Biscuits helped to
offset the negative impacts caused by economic weakness and deep-discounting by
certain of our competitors in the markets that Hardee’s serves.
The
changes in restaurant operating costs as a percentage of company-operated
restaurants revenue are explained as follows:
|
Restaurant
operating costs for fiscal 2009
|
83.9
|
%
|
||
|
Decrease
in food and packaging costs
|
(1.2
|
)
|
||
|
Increase
in depreciation and amortization expense
|
1.1
|
|||
|
Decrease
in utilities expense
|
(0.3
|
)
|
||
|
Decrease
in general liability insurance expense
|
(0.2
|
)
|
||
|
Other,
net
|
(0.1
|
)
|
||
|
Restaurant
operating costs for fiscal 2010
|
83.2
|
%
|
Food and
packaging costs decreased as a percent of company-operated restaurants revenue
during fiscal 2010, as compared to the prior year, primarily due to lower
commodity costs for beef, cheese, oil, and flour products.
Depreciation
and amortization expense increased as a percent of company-operated restaurants
revenue during fiscal 2010, as compared to fiscal 2009, mainly due to asset
additions from remodels and equipment upgrades.
Utilities
expense decreased as a percent of company-operated restaurants revenue during
fiscal 2010, as compared to fiscal 2009, mainly due to natural gas rate
decreases.
Franchised
and Licensed Restaurants
Total
franchised and licensed restaurants and other revenue decreased $3,395, or 3.8%,
to $86,173 during fiscal 2010, as compared to fiscal 2009. Franchise fee revenue
decreased by $2,801, or 72.5%. During fiscal 2009, franchise fee
revenues included $2,640 in franchise fees associated with the refranchising of
102 company-operated restaurants, which did not recur in the current fiscal
year. Distribution center revenues decreased by $2,016, or 8.5%, primarily as a
result of a decrease in equipment sales related to reduced remodeling activity
by our franchisees as compared to the prior fiscal year. Rent revenues decreased
$489 due primarily to a $1,609 decrease in collection of previously unrecognized
rent from financially troubled franchisees as compared to the prior fiscal year,
partially offset by an increase in rent revenues due to an increase in the
number of domestic franchised restaurants in connection with our refranchising
program, which was completed in fiscal 2009. These decreases were partially
offset by an increase in royalty revenues of $1,911, or 3.8%, over the prior
year due to an increase in the number of domestic franchised restaurants,
resulting from our refranchising program, a net increase of seven international
restaurants since the end of fiscal 2009, and a $366 increase in collections of
previously unrecognized royalties from financially troubled franchisees, as
compared with the prior fiscal year.
Total
franchised and licensed restaurants and other expenses decreased by $2,204, or
5.5%, to $37,764 in fiscal 2010, as compared to fiscal 2009, mainly due to
decreases of $2,895, or 11.8%, in distribution center costs related to the
decrease in remodel equipment sales, as well as a bad debt recovery of $225
related to equipment sales to a franchisee. This decrease was partially offset
by a $371, or 4.5% increase in rent expense related to an increase in the number
of franchised restaurants that sublease property from us as a result of our
refranchising program.
30
CKE
RESTAURANTS, INC. AND SUBSIDIARIES
Management’s
Discussion and Analysis – (Continued)
(Dollars
in thousands)
Consolidated
Expenses
Advertising
Expense
Advertising
expense decreased $2,468, or 3.7%, to $64,443 during fiscal 2010 from fiscal
2009, but remained a consistent 5.9% as a percentage of company-operated
restaurants revenue.
General
and Administrative Expenses
General
and administrative expenses decreased $7,168, or 5.1%, to $133,135 in fiscal
2010 from fiscal 2009. This decrease was mainly due to the implementation of
various cost-reduction initiatives, resulting in a reduction of general
corporate expenses of $4,713. Additionally, there was a $4,401 decrease in
share-based compensation expense which is attributable to a number of factors,
including our performance against specified goals for fiscal 2010 and the
decline in our stock price. These decreases were partially offset by a $3,253
increase in bonus expense, which is based on our performance relative to
executive management and operations bonus criteria. General and administrative
expenses, as a percentage of total revenue, decreased by 0.1% to 9.4% in fiscal
2010.
Facility
Action Charges
Facility
action charges arise from closure of company-operated restaurants, sublease of
closed facilities at amounts below our primary lease obligation, impairment of
long-lived assets to be disposed of or held and used, gains or losses upon
disposal of surplus property and refranchising transactions, and discount
amortization for obligations related to closed or subleased
facilities.
Net
facility action charges increased $556 or 13.4%, to 4,695 in fiscal 2010 from
fiscal 2009. The increase is mainly due to a $1,163 increase in impairment
charges, which was partially offset by a $480 increase in gains on sales of
restaurants and surplus properties.
See
Note 15 of Notes to Consolidated Financial Statements included herein for
additional detail of the components of facility action charges.
Interest
Expense
Interest
expense decreased $9,355 or 32.7% in fiscal 2010, as compared with 2009,
primarily due to a $7,406 decrease in the interest expense on our Facility due
to decreased average outstanding borrowings and lower interest rates. In
addition, there was a decrease of $2,207 in the charge recorded to adjust the
carrying value of our interest rate swap agreements to fair value. These
decreases were partially offset by an increase of $834 in the interest expense
on our capital lease obligations over the prior fiscal year.
Income
Taxes
Income
tax expense for fiscal 2010 and 2009 consisted of the following:
|
2010
|
2009
|
|||||||
|
Federal
income taxes
|
$
|
27,078
|
$
|
19,564
|
||||
|
State
income taxes
|
(13,130
|
) |
358
|
|||||
|
Foreign
income taxes
|
1,030
|
1,611
|
||||||
|
Income
tax expense
|
$
|
14,978
|
$
|
21,533
|
||||
|
Effective
income tax rate
|
23.7
|
% |
36.8
|
%
|
||||
As of
January 31, 2009, we maintained a valuation allowance of $24,675 against
substantially all of our net deferred income tax assets related to various
states in which one or more of our entities file separate state income tax
returns because we had concluded that realization of such deferred income tax
assets was not more likely than not. During the fourth quarter of
fiscal 2010, after considering all available evidence, positive and negative,
including cumulative historical earnings in recent years, estimated future
taxable income exclusive of reversing temporary differences on a jurisdictional
basis and statutory expiration dates of net operating loss ("NOL")
carryforwards, we concluded that we will more likely than not realize future tax
benefits related to a portion of these deferred income tax assets. As
a result, we reduced our valuation allowance related
to separate state deferred income tax assets by $15,222, which resulted
in a $9,894 decrease of income tax expense for fiscal 2010, net of the related
federal income tax effect.
Our
effective income tax rate differs from the federal statutory rate primarily as a
result of state income taxes, changes in our valuation allowance and
certain expenses that are nondeductible for income tax purposes, the impact of
which can vary significantly from year to year. Our effective income tax rate is
also impacted by the amount of federal and state income tax credits we are able
to generate and by the relative amounts of income we earn in various state and
foreign jurisdictions. Our income tax expense for fiscal 2009 also benefited
from the impact of favorable tax regulations recognized during the first quarter
of fiscal 2009.
31
CKE
RESTAURANTS, INC. AND SUBSIDIARIES
Management’s
Discussion and Analysis – (Continued)
(Dollars
in thousands)
As of
January 31, 2010, we have federal alternative minimum tax (“AMT”) credit,
general business tax credit and foreign tax credit carryforwards of
approximately $14,445, which we expect to utilize to offset federal income taxes
that would otherwise be payable in future years. As of January 31,
2010, we have recognized
$3,240 of net deferred income tax assets related to our state income tax credit
carryforwards and $11,392 of net deferred income tax assets related to
our state NOL carryforwards, which represent our expected future tax savings
from such carryforwards.
We have
recognized a net deferred income tax asset of $66,816 as of January 31, 2010,
which resulted from our net deferred income tax assets and valuation allowance
of approximately $79,947 and $13,131, respectively.
Fiscal
2009 Compared with Fiscal 2008
Carl’s
Jr.
Company-Operated
Restaurants
Revenue
from company-operated restaurants increased $29,837, or 5.0%, to $625,109 during
fiscal 2009 as compared to the prior year, due primarily to a 2.1% increase in
same-store sales and the addition of 17 new company-operated restaurants,
partially offset by the closing of four restaurants and the divestiture of three
restaurants to franchisees during fiscal 2009. Same-store sales were positively
impacted by a number of factors including the successful promotion of the Prime
Rib Burger, Chili Cheese Burgers and Fries and the Guacamole Bacon Burgers. In
addition, we had successful menu additions such as the Monster Breakfast
Sandwich, the Big Country Breakfast Burrito and the latest Hand-Scooped Ice
Cream Shakes and Malts flavors. AUV for the trailing-13 periods ended January
31, 2009, reached $1,528, a 2.3% increase over the prior year. During the same
period, the average guest check increased by 3.1%. In addition, price increases
were implemented in fiscal 2008 and 2009 that also contributed to the overall
fiscal 2009 increase in revenue.
The
changes in restaurant operating costs as a percentage of company-operated
restaurants revenue are explained as follows:
|
Restaurant
operating costs for fiscal 2008
|
78.5
|
%
|
||
|
Increase
in depreciation and amortization expense
|
0.4
|
|||
|
Increase
in utilities expense
|
0.3
|
|||
|
Decrease
in workers’ compensation expense
|
(0.2
|
)
|
||
|
Decrease
in repairs and maintenance expense
|
(0.2
|
)
|
||
|
Restaurant
operating costs for fiscal 2009
|
78.8
|
%
|
Depreciation
and amortization expense as a percentage of company-operated restaurants revenue
increased during fiscal 2009 as compared to fiscal 2008, mainly due to asset
additions from restaurant remodeling activity and the opening of new
restaurants.
Utilities
expense as a percentage of company-operated restaurants revenue increased during
fiscal 2009 as compared to fiscal 2008, mainly due to rate increases for natural
gas and electricity.
Franchised
and Licensed Restaurants
Total
franchised and licensed restaurants and other revenue increased by $10,878, or
4.3%, to $261,240 in fiscal 2009, as compared to the prior year. Distribution
center sales of food, packaging and supplies to franchisees increased by $9,690,
or 5.0%, during fiscal 2009 as compared to fiscal 2008, due primarily to the
increase in the franchise store base over the comparable prior year period.
Franchise royalties grew $1,524, or 4.8%, during fiscal 2009 as compared to
fiscal 2008 due to the net increase of 26 domestic franchised and 18
international licensed restaurants during fiscal 2009 and a 1.6% decrease in
franchise-operated same-store sales.
Total
franchised and licensed operating and other expenses increased by $10,356, or
4.7%, to $229,731 in fiscal 2009, as compared to fiscal 2008. This increase was
mainly due to the corresponding increase in distribution center sales of food,
packaging and supplies to franchisees, the increase in the franchise store base
in fiscal 2009 and an increase in distribution costs related to higher fuel and
other costs.
32
CKE
RESTAURANTS, INC. AND SUBSIDIARIES
Management’s
Discussion and Analysis – (Continued)
(Dollars
in thousands)
Hardee’s
Company-Operated
Restaurants
Revenue
from company-operated restaurants decreased $100,067 or 16.5%, to $505,919 in
fiscal 2009 from fiscal 2008. The decrease was mostly due to our successful
refranchising program, which resulted in net decreases of 78 and 136
company-operated restaurants during fiscal 2009 and 2008, respectively. During
fiscal 2009, we opened seven new company-operated restaurants, acquired 37
restaurants from franchisees, sold 102 restaurants to franchisees and closed 20
restaurants. This decrease in the company-operated restaurant base was partially
offset by a 1.2% increase in same-store sales. AUV for the trailing-13 periods
ended January 31, 2009, reached $993, an increase of 4.1% over the comparable
period ended January 31, 2008. During the same period, the average guest
check increased by 3.2% due to the introduction of several new innovative
premium products, such as the Made from Scratch Strawberry Biscuit, Ham and
Three Cheese Breakfast Burrito, Country Potatoes, Chicken Fillet Biscuit, Pork
Chop ‘N’ Gravy Biscuit, the Little Thickburger and Prime Rib Thickburger. In
addition, price increases were implemented in fiscal 2008 and 2009 that also
contributed to the fiscal 2009 increase in same-store sales.
The
changes in restaurant operating costs as a percentage of company-operated
restaurants revenue are explained as follows:
|
Restaurant
operating costs for fiscal 2008
|
83.6
|
%
|
||
|
Increase
in depreciation and amortization expense
|
0.7
|
|||
|
Decrease
in labor costs, excluding workers’ compensation
|
(0.5
|
)
|
||
|
Decrease
in repairs and maintenance expense
|
(0.4
|
)
|
||
|
Increase
in utilities expense
|
0.3
|
|||
|
Increase
in rent, property tax and license expense
|
0.2
|
|||
|
Increase
in asset disposal expense
|
0.2
|
|||
|
Other,
net
|
(0.2
|
)
|
||
|
Restaurant
operating costs for fiscal 2009
|
83.9
|
%
|
Depreciation
and amortization expense as a percentage of company-operated restaurants revenue
increased during fiscal 2009 as compared to fiscal 2008 primarily due to
increased restaurant remodeling activity, asset additions from new restaurant
openings and the impact of refranchising company-operated restaurants that had a
higher proportion of fully depreciated assets.
Labor
costs, excluding workers’ compensation, decreased as a percentage of
company-operated restaurants revenue in fiscal 2009 as compared to fiscal 2008
due primarily to sales leverage and more efficient use of labor, partially
offset by the impact of minimum wage rate increases.
Repairs
and maintenance expense as a percentage of company-operated restaurants revenue
decreased during fiscal 2009, due to the impact of additional spending controls.
In addition, fiscal 2008 included significant repairs and maintenance costs
related to the restaurants acquired in connection with the termination of a
franchise agreement.
Utilities
expense increased as a percent of company-operated restaurants revenue during
fiscal 2009 as compared to fiscal 2008, mainly due to natural gas and
electricity rate increases.
Franchised
and Licensed Restaurants
Total
franchised and licensed restaurants and other revenue increased $10,281, or
13.0%, to $89,568 during fiscal 2009 as compared to fiscal 2008. The increase is
primarily due to a $6,271, or 14.5%, increase in royalty revenues, which is
primarily due to the increase in the number of franchised restaurants resulting
from our refranchising program. In addition, rent revenues increased $4,503, or
56.9%, during fiscal 2009 from fiscal 2008, which is mainly due to sublease
rental income from restaurants that were divested in our refranchising efforts
and an increase in collections of previously unrecognized rent from financially
troubled franchisees. During fiscal 2009, we collected $1,784 of previously
unrecognized rent from significantly past due franchisees, compared to $419 of
collections in the prior year. Franchise fees in fiscal 2009 and 2008
include $2,640 and $2,735, respectively, of initial franchise fees received in
connection with our refranchising program, which we completed in late fiscal
2009.
Total
franchised and licensed restaurants and other expenses increased by $3,947, or
11.0%, to $39,968 in fiscal 2009, as compared to fiscal 2008, mainly due to
increases of $2,788, or 50.7%, in rent expense related to an increase in the
number of franchised restaurants that sublease property from us as a result of
our refranchising program. We also had increased administrative costs of
$1,118, or 18.3%, as compared to fiscal 2008. This increase is mainly due to
increased salaries and benefits expense due to the addition of new
positions to support our refranchising efforts and international licensee
expansion, an increase in bad debt expense and various other
expenses.
33
CKE
RESTAURANTS, INC. AND SUBSIDIARIES
Management’s
Discussion and Analysis – (Continued)
(Dollars
in thousands)
Consolidated
Expenses
Advertising
Expense
Advertising
expense decreased $3,413, or 4.9%, to $66,911 during fiscal 2009 from fiscal
2008, but remained a consistent 5.9% as a percentage of company-operated
restaurants revenue.
General
and Administrative Expenses
General
and administrative expenses decreased $3,732, or 2.6%, to $140,303 in fiscal
2009 from fiscal 2008. This decrease was mainly due to a $3,901 decrease in
training costs, primarily for operations, a $3,895 decrease in regional
administrative costs, due to overall headcount reductions and cost decreases
resulting from our refranchising program, a $1,491 decrease in software
depreciation, and a $438 decrease in aviation costs. These decreases were
partially offset by an increase of $4,127 in management bonus expense based on
our performance relative to executive management and operations bonus criteria,
and increased share-based compensation expense of $1,226, due to the issuance of
additional options and restricted stock awards. In addition, in fiscal 2008, we
had a credit of $830 related to the elimination of a liability for
post-employment benefits for our former Chairman Emeritus as the benefits
terminated upon his death in fiscal 2008. General and administrative expenses,
as a percentage of total revenue, increased by 0.1% to 9.5% in fiscal
2009.
Facility
Action Charges
Net
facility action charges increased $4,716 from a credit of $(577) in fiscal 2008
to a charge of $4,139 in fiscal 2009. The increase is mainly due to a $3,184
decrease in gains on sales of restaurants and surplus properties. In fiscal
2008, we had a gain of $2,964, and in fiscal 2009, we had a loss of $220. In
addition, we experienced a $1,146 increase in asset impairments during fiscal
2009.
See
Note 15 of Notes to Consolidated Financial Statements included herein for
additional detail of the components of facility action charges.
Interest
Expense
Interest
expense decreased $4,424 or 13.4% from fiscal 2008 to fiscal 2009 primarily due
to a $2,370 decrease in interest expense related to the change in the fair value
of our interest rate swap agreements from fiscal 2008 to fiscal 2009. In
addition, there was a reduction of $1,513 of interest expense on our Facility
due to decreased average outstanding borrowings and lower interest rates during
fiscal 2009 as compared to fiscal 2008. We also had a continued reduction in
interest expense related to our capital lease obligations.
Income
Taxes
Income
tax expense for fiscal 2009 and 2008 consisted of the following:
|
2009
|
2008
|
|||||||
|
Federal
income taxes
|
$
|
19,564
|
$
|
20,183
|
||||
|
State
income taxes
|
358
|
3,312
|
||||||
|
Foreign
income taxes
|
1,611
|
1,164
|
||||||
|
Income
tax expense
|
$
|
21,533
|
$
|
24,659
|
||||
|
Effective
income tax rate
|
36.8
|
%
|
41.3
|
%
|
||||
Our
effective income tax rate differs from the federal statutory rate primarily as a
result of state income taxes and certain expenses that are nondeductible for
income tax purposes, the impact of which can vary significantly from year to
year. Our effective income tax rate is also impacted by the relative amounts of
income we earn in various state and foreign jurisdictions. Our income tax
expense for fiscal 2009 benefited from the impact of recent tax law changes and
an increase in the amount of state tax credits that we were able to
generate.
34
CKE
RESTAURANTS, INC. AND SUBSIDIARIES
Management’s
Discussion and Analysis – (Continued)
(Dollars
in thousands)
Fiscal Fourth Quarter 2010 Compared with Fiscal Fourth
Quarter 2009
Carl’s
Jr.
Company-Operated
Restaurants
Company-operated
restaurants revenue decreased by $9,804, or 6.9%, for the fourth quarter of
fiscal 2010, as compared to the fourth quarter of fiscal 2009, due mainly to the
8.7% decrease in same-store sales for the quarter. This decrease was partially
offset by a net increase of six company-operated restaurants since the end of
the fourth quarter of fiscal 2009.
The
changes in the restaurant operating costs as a percentage of company-operated
restaurants revenue are explained as follows:
|
Restaurant
operating costs for the fiscal fourth quarter 2009
|
79.0
|
%
|
||
|
Increase
in labor costs, excluding workers’ compensation
|
1.2
|
|||
|
Increase
in depreciation and amortization expense
|
0.8
|
|||
|
Increase
in repairs and maintenance expense
|
0.5
|
|||
|
Increase
in rent expense
|
0.4
|
|||
|
Increase
in food and packaging costs
|
0.3
|
|||
|
Increase
in utilities expense
|
0.3
|
|||
|
Increase
in property tax expense
|
0.2
|
|||
|
Decrease
in asset disposal expense
|
(0.2
|
)
|
||
|
Other,
net
|
0.2
|
|||
|
Restaurant
operating costs for the fiscal fourth quarter 2010
|
82.7
|
%
|
Labor
costs, excluding workers’ compensation, increased as a percent of
company-operated restaurants revenue during the fourth quarter of fiscal 2010,
as compared to the comparable fiscal 2009 period, primarily due to the
deleveraging impact of the decrease in same-store sales and the relatively fixed
nature of restaurant management costs.
Depreciation
and amortization expense increased as a percent of company-operated restaurants
revenue during the fourth quarter of fiscal 2010, as compared to the comparable
fiscal 2009 period, mainly due to asset additions related to remodels, new store
openings and equipment upgrades as well as the deleveraging impact of the
decrease in same-store sales and the relatively fixed nature of depreciation and
amortization expense.
Repairs
and maintenance expense increased as a percentage of company-operated
restaurants revenue during the fourth quarter of fiscal 2010, as compared to the
comparable prior year period, primarily due to increased repair costs incurred
for contract services, kitchen equipment and buildings.
Rent
expense increased as a percent of company-operated restaurants revenue during
the fourth quarter of fiscal 2010, as compared to the comparable fiscal 2009
period, due primarily to the deleveraging impact of the decrease in same-store
sales and the relatively fixed nature of rent expense as well as an increase in
rent expense for CPI adjustments.
Food and
packaging costs increased as a percent of company-operated restaurants revenue
during the fourth quarter of fiscal 2010, as compared to the comparable fiscal
2009 period, primarily due to changes in our menu mix and sales of
promotional products.
Utilities
expense increased as a percent of company-operated restaurants revenue during
the fourth quarter of fiscal 2010, as compared to the comparable fiscal 2009
period, mainly due to the deleveraging impact of the decrease in same-store
sales.
Franchised
and Licensed Restaurants
Total
franchised and licensed restaurants and other revenue decreased $468, or 0.8%,
in the fourth quarter of fiscal 2010 from the comparable fiscal 2009 period due
to a decrease of $690, or 1.5%, in distribution center sales of food, packaging
and supplies to franchisees, due primarily to a 5.8% decrease in
franchise-operated same-store sales, partially offset by an increase in the cost
of food upon which the sales price of those items is based.
35
CKE
RESTAURANTS, INC. AND SUBSIDIARIES
Management’s
Discussion and Analysis – (Continued)
(Dollars
in thousands)
Total
franchised and licensed restaurants and other expenses decreased $754, or 1.5%,
in the fourth quarter of fiscal 2010 from the fourth quarter of fiscal 2009
primarily due to a decrease in distribution center sales to
franchisees.
Hardee’s
Company-Operated
Restaurants
Revenue
from company-operated restaurants decreased $3,823, or 3.5%, in the fourth
quarter of fiscal 2010, as compared to the fourth quarter of fiscal 2009. This
decrease is due mainly to the 2.5% decrease in same-store sales and a net
decrease of seven restaurants since the fourth quarter of fiscal
2009.
The
changes in the restaurant operating costs as a percentage of company-operated
restaurants revenue are explained as follows:
|
Restaurant
operating costs for the fiscal fourth quarter
2009
|
86.0
|
%
|
||
|
Decrease
in food and packaging costs
|
(1.4
|
)
|
||
|
Increase
in labor costs, excluding workers’ compensation
|
1.4
|
|||
|
Increase
in depreciation and amortization expense
|
1.1
|
|||
|
Decrease
in utilities expense
|
(1.0
|
)
|
||
|
Decrease
in general liability insurance expense
|
(0.9
|
)
|
||
|
Increase
in asset disposal expense
|
0.5
|
|||
|
Decrease
in workers’ compensation expense
|
(0.3
|
)
|
||
|
Decrease
in repairs and maintenance expense
|
(0.2
|
)
|
||
|
Other,
net
|
—
|
|||
|
Restaurant
operating costs for the fiscal fourth quarter 2010
|
85.2
|
%%
|
Food and
packaging costs decreased as a percent of company-operated restaurants revenue,
during the fourth quarter of fiscal 2010, as compared to the comparable fiscal
2009 period, primarily due to lower commodity costs for beef, cheese, oil, and
flour products.
Labor
costs, excluding workers’ compensation expense, increased as a percent of
company-operated restaurants revenue during the fourth quarter of fiscal 2010,
as compared to the comparable fiscal 2009 period, due primarily to the impact of
minimum wage rate increases, the deleveraging impact of the decrease in
same-store sales and the relatively fixed nature of restaurant management
costs.
Depreciation
and amortization expense increased as a percent of company-operated restaurants
revenue during the fourth quarter of fiscal 2010, as compared to the comparable
fiscal 2009 period, mainly due to asset additions from remodels and equipment
upgrades.
Utilities
expense decreased as a percent of company-operated restaurants revenue during
the fourth quarter of fiscal 2010, as compared to the comparable fiscal 2009
period, mainly due to decreases in natural gas and electricity rates and
usage.
General
liability insurance expense decreased as a percent of company-operated
restaurants revenue during the fourth quarter of fiscal 2010, as compared to the
comparable fiscal 2009 period, due primarily to a favorable claims reserve
adjustment as a result of actuarial analyses of outstanding claims reserves
in the fourth quarter
of fiscal 2010 and an unfavorable claims reserve adjustment in the comparable
prior year period.
Asset
disposal expense increased as a percent of company-operated restaurants revenue
during the fourth quarter of fiscal 2010, as compared to the comparable fiscal
2009 period, mainly due to increased asset write-offs in connection with our
ongoing remodel program and asset disposals related to one restaurant that was
rebuilt in the current year period.
Workers’
compensation expense decreased as a percent of company-operated restaurants
revenue during the fourth quarter of fiscal 2010, as compared to the comparable
fiscal 2009 period, due to favorable claims reserves adjustments as a result of
actuarial analyses of outstanding claims reserves, which did not occur to the
same extent in the prior fiscal year period.
36
CKE
RESTAURANTS, INC. AND SUBSIDIARIES
Management’s
Discussion and Analysis – (Continued)
(Dollars
in thousands)
Franchised and Licensed Restaurants
Total
franchised and licensed restaurants and other revenue decreased by $1,479, or
7.6%, in the fourth quarter of fiscal 2010 from the fourth quarter of fiscal
2009. This decrease is mainly due to a decrease of $1,267, or 26.2%, in
distribution center revenues related to a decrease in equipment sales as a
result of reduced remodeling activity by our franchisees in the current year
period. We also experienced a $332 decrease in franchise fees, as our
refranchising program was completed in the fourth quarter of fiscal
2009.
Total
franchised and licensed restaurants and other expenses decreased $1,649, or
18.6%, during the fourth quarter of fiscal 2010 from the fourth quarter of
fiscal 2009 primarily due to a $1,621 decrease in distribution center costs
related to the decrease in remodel equipment sales.
Discontinued
Operations
We sold
our La Salsa Fresh Mexican Grill restaurants and the related franchise
operations to LAS Acquisition, LLC (“Buyer”) on July 16, 2007. Under the
agreement, Santa Barbara Restaurant Group, Inc. a wholly-owned subsidiary of the
Company, sold its 100 percent equity interest in La Salsa, Inc. and La Salsa of
Nevada, Inc. (collectively “La Salsa”) for adjusted consideration of $15,889.
Pursuant to the agreement, we have retained contingent liabilities related to
tax matters and certain litigation matters arising prior to the completion of
the sale of La Salsa. In addition, we remain contingently liable for
certain lease obligations and self-insurance exposures arising prior to the
completion of the sale. As of January 31, 2010, the outstanding
principal balance under our note receivable from Buyer is $2,491. The
note is secured by the personal property of Buyer, a pledge of the La Salsa
equity interests acquired by Buyer, and certain personal and corporate
guarantees.
Liquidity
and Capital Resources
On
February 26, 2010, we entered into the Merger Agreement, which provides for the
Merger of the Company with and into the Merger Sub, with the Company surviving
as a wholly-owned subsidiary of Parent, which is an affiliate of
THL. If the Merger is completed, each share of our common stock
issued and outstanding immediately prior to closing automatically will be
cancelled and converted into the right to receive $11.05 in cash, and the
Company will cease to be a publicly traded company. The closing of
the Merger Agreement is subject to approval by the holders of a majority of the
outstanding shares of our common stock entitled to vote on the Merger, the
receipt of any required approvals, or the expiration or termination of the
applicable waiting periods, under the HSR Act, and other customary closing
conditions. On March
19, 2010, we received notice from the Federal Trade Commission that early
termination of the waiting period under the HSR Act has been granted effective
immediately. In addition, on the same date, we filed a preliminary
proxy statement with the SEC relating to the proposed special meeting of our
stockholders to consider and vote on a proposal to adopt the Merger
Agreement.
Parent
and Merger Sub have obtained equity and debt financing commitments for the
transaction contemplated by the Merger Agreement, the aggregate proceeds of
which will be sufficient for Parent to pay the aggregate amount of the merger
consideration and all related fees and expenses. Thomas H. Lee Equity Fund VI,
L.P., an equity investment fund affiliated with THL, has committed to purchase
equity interests in Parent in an amount up to $444,000 in the aggregate on the
terms and subject to the conditions set forth in an equity commitment
letter. Affiliates of Bank of America, N.A., Banc of America Bridge
LLC, Banc of America Securities LLC and Barclays Capital (collectively, the
"Commitment Parties") have committed to provide a $450,000 senior secured credit
facility, comprised of a $375,000 term loan facility and a $75,000 revolving
credit facility, on the terms and subject to the conditions set forth in a debt
commitment letter. It is expected that upon completion of the Merger,
senior unsecured notes will be issued and sold by Merger Sub (and assumed by the
Company) in a Rule 144A or other private placement which will yield at least
$150,000 in gross cash proceeds on the terms and subject to the conditions set
forth in the debt commitment letter. The obligations of the Commitment Parties
to provide financing under the debt commitment letter are subject to a number of
conditions, including, without limitation, execution of definitive loan
documents consistent with the terms of the debt commitment letter, the receipt
by Merger Sub of the proceeds of the equity financing under the equity
commitment letter, consummation of the Merger in accordance with the Merger
Agreement, and verification that no material adverse effect has occurred with
respect to the Company.
The
Merger Agreement contains certain termination rights and reimbursement
obligations. Upon termination of the Merger Agreement, under specified
circumstances, the Company will be required to pay Parent a termination fee of
$9,283 to $15,471, and to reimburse transaction expenses incurred by Parent and
Merger Sub up to $5,000. If the Merger Agreement is not consummated,
we will continue to be a publicly traded company.
Over the
past several quarters, worldwide capital and credit markets have seen
unprecedented volatility. We are continuing to monitor the potential impact of
these market conditions on our liquidity. To date, these market conditions have
not had any material adverse impact on our liquidity or the availability of
committed funds under our Facility. Based on information available to
us, all of the financial institutions syndicated under our Facility are
able to fulfill their commitments as of March 24, 2010. However, there can
be no assurance that one or more of them may not be able to fulfill their future
funding obligations.
37
CKE
RESTAURANTS, INC. AND SUBSIDIARIES
Management’s
Discussion and Analysis – (Continued)
(Dollars
in thousands)
Notwithstanding
the above, we expect that our cash on hand, coupled with future cash flows from
operations and borrowings under our Facility will provide sufficient liquidity
to allow us to service existing debt and to meet our operating and capital
requirements for at least the next 12 months. We believe our most significant
cash use during the next 12 months will be for capital expenditures. Based on
our current capital spending projections, we expect capital expenditures to be
between $85,000 and $95,000 for fiscal 2011. Under the terms of our Facility, we
may be required to make an annual principal prepayment, based on excess cash
flows (as defined in our Facility). Other than these prepayments, we have
no significant debt maturities coming due until March 27, 2012. See Note 10 of
Notes to Consolidated Financial Statements for more information on our existing
debt.
We, and
the restaurant industry in general, maintain relatively low levels of accounts
receivable and inventories, and vendors grant trade credit for purchases such as
food and supplies. We also continually invest in our business through the
addition of new sites and the refurbishment of existing sites, which are
reflected as long-term assets and not as part of working capital. As a result,
we typically maintain current liabilities in excess of current assets, resulting
in a working capital deficit. As of January 31, 2010, our current ratio was 0.73
to 1.
Our
Facility provides for a $470,000 senior secured credit facility consisting of a
$200,000 revolving credit facility and a $270,000 term loan. The revolving
credit facility matures on March 27, 2012, and includes an $85,000 letter of
credit sub-facility. During fiscal 2010, we made aggregate principal payments of
$4,303 on the term loan, including a payment of $1,616 based on excess cash
flows for fiscal 2009, as required by the terms of our Facility. As of January
31, 2010, we had (i) borrowings outstanding under the term loan portion of our
Facility of $247,432, (ii) borrowings outstanding under the revolving portion of
our Facility of $30,000, (iii) outstanding letters of credit under the revolving
portion of our Facility of $35,363, and (iv) availability under the revolving
portion of our Facility of $134,637. During the first quarter of fiscal 2011,
we expect to make a $9,630 principal payment on the term loan portion
of our Facility based on excess cash flows for fiscal 2010, as required by the
terms of our Facility. Accordingly, this amount has been included in the current
portion of bank indebtedness and other long-term debt in our Consolidated
Balance Sheet as of January 31, 2010. If the Merger is consummated, all amounts
outstanding under the Facility will be repaid at or prior to
closing.
The terms
of our Facility include financial performance covenants, which include a maximum
leverage ratio, and certain restrictive covenants. Our maximum leverage ratio
may not exceed 2.75, 2.50 and 2.25 in fiscal 2010, 2011 and 2012,
respectively. As of January 31, 2010, our leverage ratio was 2.10. Our
most significant restrictive covenants limit our ability to incur debt, incur
liens on our assets, make any significant change in our corporate structure or
the nature of our business, prepay certain debt, engage in a change of control
transaction without the member banks’ consents and make investments or
acquisitions. If the
Merger is consummated, it would constitute a change of control for purposes of
the Facility. However, in connection with the consummation of the Merger,
all amounts outstanding under the Facility will be repaid in full and the
Facility will be terminated.
Our
Facility permits us to spend an aggregate of $369,883 to repurchase our common
stock and/or pay cash dividends, of which $58,074 remains for additional common
stock repurchases and/or cash dividend payments, as of January 31, 2010. The
aggregate amount allowed for common stock repurchases and/or cash dividend
payments is increased each year by a portion of excess cash flows (as defined in
our Facility). In addition to being limited by our Facility, our ability to
repurchase common stock is limited by our Board of Directors’ authorization and
the amount of cumulative repurchases of our common stock that we have already
made thereunder. As of January 31, 2010, we are permitted to make additional
repurchases of our common stock up to $36,875 under the Stock Repurchase Plan.
In accordance with the terms of the Merger Agreement, we are restricted from
certain repurchases of our common stock. See further discussion in Note 25 of
Notes to Consolidated Financial Statements included herein.
Our
Facility permits us to make annual capital expenditures in the amount of
$85,000, plus 80% of the amount of actual Adjusted EBITDA (as defined in our
Facility) in excess of $150,000. In addition, we may reinvest proceeds from the
sale of assets and carry forward certain unused capital expenditure amounts to
the following year. As of January 31, 2010, we expect to be permitted to make
total capital expenditures of $134,430 in fiscal 2011.
Our
Facility is collateralized by a lien on all of our personal property assets and
liens on certain restaurant properties. We were in compliance with these
covenants and all other requirements of our Facility as of January 31, 2010. See
Note 10 of Notes to Consolidated Financial Statements for additional
details about our Facility, such as repayment schedule and events that could
result in an acceleration of amounts due.
We have
fixed rate swap agreements with various counterparties to effectively fix future
interest payments on $200,000 of our term loan debt at 6.12%. These
agreements will expire on March 12, 2012. These derivative
instruments were not designated as cash flow hedges at inception. Accordingly,
the change in the fair value of the interest rate swap agreements is recognized
in interest expense in our Consolidated Statements of Income. During
fiscal 2010, we paid $8,912 for net settlements under our fixed rate swap
agreements. As a matter of policy, we do not enter into derivative
instruments unless there is an underlying exposure. These interest rate swap
agreements are highly sensitive to interest rate fluctuations, which could
result in significant variability in their future value.
38
CKE
RESTAURANTS, INC. AND SUBSIDIARIES
Management’s
Discussion and Analysis – (Continued)
(Dollars
in thousands)
The terms
of our Facility are not impacted by any changes in our credit rating. We believe
the key Company-specific factors affecting our ability to maintain our existing
debt financing relationships and to access such capital in the future are our
present and expected levels of profitability, cash flows from operations,
capital expenditures, asset collateral bases and the level of our Adjusted
EBITDA relative to our debt obligations. In addition, as noted above, our
existing debt agreements include significant restrictions on future financings
including, among others, limits on the amount of indebtedness we may incur or
which may be secured by any of our assets.
During
fiscal 2010, we declared cash dividends of $0.24 per share of common stock, for
a total of $13,178. Dividends payable of $3,317 and $3,279 have been included in
other current liabilities in our Consolidated Balance Sheets as of January 31,
2010 and 2009, respectively. The dividends declared during the quarter ended
January 31, 2010 were subsequently paid on February 16, 2010.
During
fiscal 2010, cash provided by operating activities was $149,766, an increase of
$4,029, or 2.8%, from the prior year. An increase in net income adjusted for
non-cash items (primarily depreciation and amortization, share-based
compensation, and deferred income tax expenses) was partially offset by the
impact of fluctuations in the timing of receipts and disbursements related to
operating asset and liability balances. Working capital account balances can
vary significantly, depending upon the timing of large customer receipts and
payments to vendors, but they are not anticipated to be a significant source or
use of cash over the long term.
Cash used
in investing activities during fiscal 2010 totaled $95,356, which principally
consisted of purchases of property and equipment, was partially offset by
proceeds from the sale of property and equipment. Our capital expenditures
consist of non-discretionary items, which are expenditures we believe necessary
to sustain our business, and discretionary items, which are expenditures related
to the growth of our business. Capital expenditures for fiscal 2010 and
2009 were as follows:
|
2010
|
2009
|
|||||||
|
Non-discretionary:
|
||||||||
|
Remodels
|
||||||||
|
Carl’s
Jr.
|
$
|
10,920
|
$
|
10,199
|
||||
|
Hardee’s
|
22,912
|
20,506
|
||||||
|
Capital
maintenance
|
||||||||
|
Carl’s
Jr.
|
14,886
|
11,981
|
||||||
|
Hardee’s
|
17,947
|
16,758
|
||||||
|
Corporate
and other
|
2,740
|
4,302
|
||||||
|
Total
non-discretionary
|
69,405
|
63,746
|
||||||
|
Discretionary:
|
||||||||
|
New
restaurants and rebuilds
|
||||||||
|
Carl’s
Jr.
|
14,156
|
24,349
|
||||||
|
Hardee’s
|
4,605
|
10,470
|
||||||
|
Dual-branding
|
||||||||
|
Carl’s
Jr.
|
727
|
901
|
||||||
|
Hardee’s
|
642
|
2,327
|
||||||
|
Real
estate and franchise acquisitions
|
5,457
|
9,881
|
||||||
|
Corporate
and other
|
7,436
|
4,839
|
||||||
|
Total
discretionary
|
33,023
|
52,767
|
||||||
|
Total
|
$
|
102,428
|
$
|
116,513
|
||||
Capital
expenditures for fiscal 2010 decreased $14,085, or 12.1%, from the prior year
mainly due to a $16,058 decrease in new restaurants and rebuilds and $4,424
decrease in real estate and franchise acquisitions, which were partially offset
by a $5,659 increase in non-discretionary items. Based on our current capital
spending projections, we expect capital expenditures to be between $85,000 and
$95,000 for fiscal 2011 and to be between $75,000 and $85,000 for fiscal
2012.
Cash used
in financing activities during fiscal 2010 was $54,033, which principally
consisted of net repayments of borrowings under our revolving credit facility of
$32,000, dividend payments of $13,140, repayments of capital lease obligations
of $7,277, repayments of $4,303 on the term loan portion of our Facility and
payments to repurchase common stock of $1,724.
39
CKE
RESTAURANTS, INC. AND SUBSIDIARIES
Management’s
Discussion and Analysis – (Continued)
(Dollars
in thousands)
Long-Term
Obligations
Contractual
Cash Obligations
The
following table presents our long-term contractual cash obligations as of
January 31, 2010:
|
Payments
Due by Periods
|
||||||||||||||||||||
|
Total
|
Less
Than
One
Year
|
1-3 Years
|
3-5 Years
|
After
5 Years
|
||||||||||||||||
| Long-term debt | $ | 278,464 | $ | 12,262 | $ | 265,259 | $ | 71 | $ | 872 | ||||||||||
|
Capital
lease obligations(1)(2)
|
71,522
|
12,265
|
21,788
|
15,375
|
22,094
|
|||||||||||||||
|
Operating
leases(1)
|
664,568
|
88,402
|
150,382
|
123,358
|
302,426
|
|||||||||||||||
|
Unconditional
purchase obligations(3)
|
68,031
|
52,545
|
10,615
|
3,348
|
1,523
|
|||||||||||||||
|
Other
commitments(4)
|
1,931
|
1,931
|
—
|
—
|
—
|
|||||||||||||||
|
Total contractual cash obligations
|
$
|
1,084,516
|
$
|
167,405
|
$
|
448,044
|
$
|
142,152
|
$
|
326,915
|
||||||||||
__________
|
(1)
|
The
amounts reported above as operating leases and capital lease obligations
include leases contained in the estimated liability for closed restaurants
and leases for which we sublease the related properties to others.
Additional information regarding operating leases and capital lease
obligations can be found in Note 7 of Notes to Consolidated Financial
Statements.
|
|
(2)
|
Represents
the undiscounted value of capital lease
payments.
|
|
(3)
|
Unconditional
purchase obligations include contracts for goods and services, primarily
related to system restaurant operations and contractual commitments for
marketing and sponsorship
arrangements.
|
|
(4)
|
Other
commitments shown in the table above are comprised of obligations which
represent uncertain tax positions. The years for which the uncertain tax
positions will be effectively settled or paid, have been estimated in
scheduling the obligations within the table. In addition to the
obligations in the table above, approximately $2,851 of unrecognized tax
benefits have been recorded as an offset to deferred tax assets, of which
$1,372 is anticipated to be effectively settled or paid within one year
and the remainder of which we are uncertain as to if or when such amounts
may be settled. Additionally, there is $11,123 of unrecognized tax
positions which are fully offset by a valuation allowance of which we are
uncertain as to if or when such amounts may be
settled.
|
Other
Commercial Commitments
The
following table presents our other commercial commitments as of January 31,
2010. The specific commitments are discussed previously in Item 7, as well
as in Note 24 of Notes to Consolidated Financial Statements.
|
Amount
of Commitment Expirations Per Period
|
||||||||||||||||||||
|
Total
Amounts
Committed
|
Less
Than
One
Year
|
1-3
Years
|
3-5
Years
|
>5
Years
|
||||||||||||||||
| Standby letters of credit under our Facility | $ | 35,363 | $ | 10,218 | $ | 25,145 | $ | — | $ | — | ||||||||||
|
Other
|
4,560
|
1,516
|
2,208
|
836
|
—
|
|||||||||||||||
|
Total other commercial commitments
|
$
|
39,923
|
$
|
11,734
|
$
|
27,353
|
$
|
836
|
$
|
—
|
||||||||||
40
CKE
RESTAURANTS, INC. AND SUBSIDIARIES
Management’s
Discussion and Analysis – (Continued)
(Dollars
in thousands)
Critical
Accounting Policies and Estimates
Our
reported results are impacted by the application of certain accounting policies
that require us to make subjective or complex judgments. These judgments involve
making estimates about the effect of matters that are inherently uncertain and
may significantly impact our consolidated financial position and results of
operations. Information regarding our significant accounting policies and
estimates can be found in Note 1 of Notes to Consolidated Financial
Statements. Our most critical accounting policies and estimations are
described in the following paragraphs.
Impairment of
Property and Equipment and Other Amortizable Long-Lived Assets Held and
Used, Held
for Sale or To Be Disposed of Other Than By Sale\
During
the second and fourth quarter of each fiscal year, and whenever events or
circumstances indicate that the carrying value of assets may be impaired, we
perform an asset recoverability analysis. In connection with this analysis, we
estimate future cash flows for each of our restaurants over their estimated
useful life. Assets are not deemed to be recoverable if their
carrying value is less than the undiscounted future cash flows that we expect to
generate from their use. Future cash flows are estimated based upon experience
gained, current intentions about refranchising restaurants and closures, recent
and expected sales trends, internal plans, the period of time since the
restaurant was opened or remodeled and other relevant information. We generally
estimate the useful life of restaurants on owned property to be 20 to
40 years and estimate the useful life of restaurants subject to leases to
range from the end of the lease term then in effect to the end of such lease
term including option periods. We also make assumptions about future same-store
sales and operating expenses. Restaurant assets that are not deemed to be
recoverable are written down to their estimated fair value. We determine fair
value by assessing the highest and best use of an asset and the amounts that
would be received for such asset in orderly transaction between market
participants. Fair value is typically determined using discounted cash flows to
estimate the price that a franchisee would pay for the restaurant and its
related assets.
Same-store
sales and the rates at which restaurant operating costs will increase in the
future are key assumptions used to estimate future cash flows for evaluating
recoverability. If our same-store sales do not perform at or above our
forecasted level, or if restaurant operating cost increases exceed our forecast
and we are unable to recover such costs through price increases, the carrying
value of certain of our restaurants may prove to be unrecoverable and we may
incur additional impairment charges in the future.
As of
January 31, 2010, we had a total of 59 restaurants within our two major
restaurant concepts that generated negative cash flows on a trailing-13 period
basis. These restaurants had combined net book values of $27,569. If these
negative cash flow restaurants were not to begin generating positive cash flows
within a reasonable period of time, the carrying value of these restaurants may
prove to be not fully recoverable, and we may recognize additional impairment
charges in the future. During fiscal 2010, we recorded impairment charges of
$3,480 related to long-lived assets.
Impairment
of Goodwill
We test
goodwill for impairment, on an annual basis, during the first quarter of our
fiscal year, or more frequently if events and/or circumstances indicate that the
asset might be impaired. The impairment test is performed at the reporting unit
level, and an impairment loss is recognized to the extent that the carrying
amount exceeds the asset’s fair value. During the first quarter of fiscal 2010,
we performed our evaluation and concluded that no impairment charge was
required.
Estimated
Liability for Closed Restaurants
We use
certain assumptions to determine the amount of the estimated liability for
closed restaurants. The most significant assumptions relate to the determination
of the estimated liability for future lease payments and other contractual
obligations on vacant restaurants, and the extent to which these costs may be
reasonably expected to be recovered by future sublease income. We estimate the
cost to maintain leased vacant properties until the lease can be abated. If the
costs to maintain properties increase, or it takes longer than anticipated to
sublease such properties, we may need to record additional estimated
liabilities. If the vacant restaurants are not subleased on the terms that we
used to estimate the liabilities, we may be required to record losses in future
periods. Conversely, if the leases on the vacant restaurants are terminated or
subleased on more favorable terms than we used to estimate the liabilities, we
reverse previously established estimated liabilities, resulting in an increase
in operating income. Our estimated liability for closed restaurants
was $7,273 as of January 31, 2010.
41
CKE
RESTAURANTS, INC. AND SUBSIDIARIES
Management’s
Discussion and Analysis – (Continued)
(Dollars
in thousands)
Estimated
Liability for Self-Insurance
We are
self-insured for a portion of our current and prior years’ losses related to
workers’ compensation, general and auto liability insurance
programs. We have stop loss insurance for individual workers’
compensation and general liability claims over $500 and auto liability claims
over $250. We estimate our self-insurance exposure based on the average
historical losses on claims we have incurred and on actuarial observations of
historical claim loss development and our actuary’s estimate of unpaid losses
for each loss category. We record our accrued liabilities for self-insurance at
present value, based on an estimated risk-free interest rate at the balance
sheet date. Our actual future claim loss development may be better or worse than
the development we estimated in conjunction with our actuary, in which case our
reserves would require adjustment. If we experience a higher than expected
number of claims or the costs of claims rise more than expected, then we would
be required to adjust the expected losses upward and increase our future
self-insurance expense. Our estimated liability for self-insurance
was $37,228 as of January 31, 2010.
Loss
Contingencies
We
routinely assess loss contingencies to develop estimates of the likelihood and
range of possible settlement. Those contingencies that are deemed to be
probable, and for which the expected loss is reasonably estimable, are accrued
in our Consolidated Financial Statements. If only a range of loss can be
determined, with no amount in the range representing a better estimate than any
other amount within the range, we record an accrued liability equal to the low
end of the range. As of January 31, 2010, we have recorded an accrued liability
for contingencies related to litigation in the amount of $225 (see Notes 9
and 24 of Notes to Consolidated Financial Statements for further information).
The assessment of contingencies is highly subjective and requires judgments
about future events. Contingencies are reviewed at least quarterly to determine
the adequacy of the recorded liabilities and related consolidated financial
statement disclosure. The ultimate resolution of such loss contingencies may
differ materially from amounts we have accrued in our Consolidated Financial
Statements.
In
addition, as of January 31, 2010, we estimated our potential exposure for those
loss contingencies related to other litigation claims that we believe are
reasonably possible to result in an adverse outcome, to be in the range of $655
to $2,245.
Accounting
for Lease Obligations
We lease
a substantial number of our restaurant properties. At the inception of the
lease, each property is evaluated to determine whether the lease is an operating
or capital lease. The lease accounting evaluation may require significant
judgment in estimating the fair value and useful life of the leased property and
to establish the appropriate lease term. The lease term used for this evaluation
includes renewal option periods only in instances in which the exercise of the
renewal option can be reasonably assured because failure to exercise such option
would result in an economic penalty. Such economic penalty would typically
result from our having to abandon buildings and other non-detachable
improvements with remaining economic value upon vacating the
property.
The lease
term may also include a “rent holiday”, which begins on the date we are given
control of the leased premises and typically ends upon restaurant opening.
Factors that may affect the length of the rent holiday period include
construction-related delays. Extension of the rent holiday period due to such
delays would result in greater rent expense recognized during the rent holiday
period.
Franchised
and Licensed Operations
We
sublease a number of restaurant properties to our franchisees. As such, we
remain principally liable for these leases. If sales trends or economic
conditions worsen for our franchisees, their financial health may worsen, our
collection rates may decline and we may be required to assume the responsibility
for additional lease payments on franchised restaurants. The likelihood of
needing to increase the estimated liability for future lease obligations is
primarily related to the success of our Hardee’s brand. We do not expect Carl’s
Jr. franchisees to experience the same level of financial difficulties as
Hardee’s franchisees have encountered in the past; however, we can provide no
assurance that this will not occur.
42
CKE
RESTAURANTS, INC. AND SUBSIDIARIES
Management’s
Discussion and Analysis – (Continued)
(Dollars
in thousands)
Our
franchising income is dependent on both the number of restaurants operated by
our franchisees and licensees and their operational and financial success, such
that they can make their royalty and rent payments to us. When appropriate, we
establish notes receivable pursuant to completing workout agreements with
financially troubled franchisees. We cease accruing royalties and rental revenue
from franchisees during the fiscal quarter in which we determine that
collectability of such revenue is not reasonably assured. As of January 31,
2010, we have not recognized, on a cumulative basis, $244 in accounts receivable
and $4,227 in notes receivable, nor the royalty and rental revenue associated
with these accounts and notes receivable, due from franchisees that are in
default under the terms of their franchise agreements.
Our
consolidated allowances for doubtful accounts on accounts receivable and notes
receivable are 0.6% and 19.7% of the gross accounts and notes receivable
balances, respectively, as of January 31, 2010. Although we regularly review the
allowances for doubtful accounts, there can be no assurance that the number of
franchisees or franchised restaurants experiencing financial difficulties will
not increase from our current assessments, nor can there be any assurance that
we will be successful in resolving financial issues relating to any specific
franchisee.
Income
Taxes
Our
income tax expense, deferred income tax assets and liabilities, valuation
allowance against deferred income tax assets and reserves for uncertain tax
positions reflect management’s best assessment of estimated current and future
taxes to be paid. We are subject to income taxes in both the U.S. and
various foreign jurisdictions. Significant judgments and estimates are required
in determining our consolidated income tax expense.
Deferred
income taxes are provided for the estimated income tax effect of temporary
differences between the financial and tax bases of assets and liabilities using
the asset and liability method. Deferred tax assets are also provided for NOL
and income tax credit carryforwards. A valuation allowance to reduce the
carrying amount of deferred tax assets is established when it is more likely
than not that we will not realize some portion or all of the tax benefit of our
deferred tax assets. We evaluate, on a quarterly basis, whether it is more
likely than not that our deferred income tax assets are realizable. In
performing this analysis, we consider all available evidence, both positive and
negative, including historical operating results, the estimated timing of future
reversals of existing taxable temporary differences, estimated future taxable
income exclusive of reversing temporary differences and carryforwards, and
potential tax planning strategies that may be employed to prevent operating loss
or tax credit carryforwards from expiring unused.
As of
January 31, 2009, we maintained a valuation allowance of $24,675 against
substantially all of our net deferred income tax assets related to various
states in which one or more of our entities file separate state income tax
returns because we had concluded that realization of such deferred income tax
assets was not more likely than not. During the fourth quarter of
fiscal 2010, after considering all available evidence, positive and negative,
including cumulative historical earnings in recent years, estimated future
taxable income exclusive of reversing temporary differences on a jurisdictional
basis and statutory expiration dates of NOL carryforwards, we concluded that we
will more likely than not realize future tax benefits related to a portion of
these deferred income tax assets. As a result, we reduced our
valuation allowance related to separate state deferred income tax assets by
$15,222, which resulted in a $9,894 decrease of income tax expense for fiscal
2010, net of the related federal income tax effect.
We
maintain a liability for underpayment of income taxes and related interest and
penalties, if any, for uncertain income tax positions. In considering the need
for and magnitude of a liability for uncertain income tax positions, we must
make certain estimates and assumptions regarding the amount of income tax
benefit that will ultimately be realized. The ultimate resolution of an
uncertain tax position may not be known for a number of years, during which time
we may be required to adjust these reserves in light of changing facts and
circumstances.
New
Accounting Pronouncements
See Note
2 of Notes to Consolidated Financial Statements.
Presentation
of Non-GAAP Measures
Company-Operated
Restaurant-Level Margin
Company-operated
restaurant-level margin, which is expressed as a percentage, is a Non-GAAP
measure utilized by management internally to evaluate and compare our restaurant
operating performance between periods. We define company-operated
restaurant-level margin as restaurant-level income divided by company-operated
restaurants revenue. Restaurant-level income is company-operated restaurants
revenue less restaurant operating costs, which are the expenses incurred
directly by our company-operated restaurants in generating revenues and do not
include advertising costs, general and administrative expenses or facility
action charges. Because not all companies calculate restaurant-level
margin identically, our presentation of company-operated restaurant-level margin
may not be comparable to similarly titled measures of other
companies.
Franchise
Contribution
Franchise
contribution, which is expressed in dollars, is a Non-GAAP measure utilized by
management internally to evaluate and compare the impact of franchised and
licensed restaurants on our operating results between periods. We
define franchise contribution as franchised and licensed restaurants and other
revenue less franchised and other restaurants and other
expense. Franchise contribution does not include corporate general
and administrative expenses or facility action charges. Because not
all companies calculate franchise contribution, our presentation of franchise
contribution may not be comparable to similarly titled measures of other
companies.
43
CKE
RESTAURANTS, INC. AND SUBSIDIARIES
Management’s
Discussion and Analysis – (Continued)
(Dollars
in thousands)
Diluted
Income per Common Share, Excluding Mark-to-Market Adjustments
Management
internally utilizes diluted income per common share, excluding the expense
recorded to adjust the carrying value of our interest rate swap agreements to
fair value, as a financial measure to evaluate and compare our operating results
between periods and believe this is an important metric to consider in
evaluating our performance. Investors should consider this Non-GAAP financial
metric in addition to, and not as a substitute for, or superior to, measures of
financial performance prepared in accordance with GAAP. Diluted income per
common share, excluding mark-to-market adjustments, is calculated by adding the
mark-to-market charge from our interest rate swap agreements, net of tax, to the
numerator of the diluted income per common share computation. The
following calculation should be read in conjunction with Note 1 of Notes to
Consolidated Financial Statements:
|
2010
|
2009
|
2008
|
||||||||||
|
|
(In thousands, except per share amounts) | |||||||||||
|
Numerator:
|
||||||||||||
|
Income
used in computation of diluted income per common share
|
$ | 47,357 | $ | 36,611 | $ | 31,141 | ||||||
|
Mark-to-market
loss
|
6,803 | 9,010 | 11,380 | |||||||||
|
Tax
effect of mark-to-market adjustments
|
(2,606 | ) | (3,442 | ) | (4,336 | ) | ||||||
|
Mark-to-market
adjustment allocated to restricted stock awards
|
(75 | ) | (96 | ) | (84 | ) | ||||||
|
Adjusted
numerator
|
$ | 51,479 | $ | 42,083 | $ | 38,101 | ||||||
|
Denominator:
|
||||||||||||
|
Denominator
used for computation of diluted income per common share
|
54,211 | 54,079 | 62,411 | |||||||||
|
Diluted
income per common share, excluding mark-to-market
adjustments
|
$ | 0.95 | $ | 0.78 | $ | 0.61 | ||||||
Adjusted
EBITDA
Adjusted
EBITDA is a Non-GAAP measure used by our senior lenders under our Facility to
evaluate our ability to service debt and fund capital expenditures. Adjusted
EBITDA is not a recognized term under GAAP and does not purport to be an
alternative to income from operations, an indicator of cash flow from operations
or a measure of liquidity. As shown in the table below and defined in our
Facility, Adjusted EBITDA is calculated as earnings before cumulative effect of
accounting changes, interest expense, income taxes, depreciation and
amortization, facility action charges, share-based compensation expense,
impairment of goodwill and impairment of assets held for sale. Because not all
companies calculate Adjusted EBITDA identically, this presentation of Adjusted
EBITDA may not be comparable to similarly titled measures of other companies.
Adjusted EBITDA is not intended to be a measure of free cash flow for
management’s discretionary use, as it does not consider certain cash
requirements such as interest expense, income taxes, debt service payments and
cash costs arising from facility actions.
|
Fiscal
|
||||||||||||
|
2010
|
2009
|
2008
|
||||||||||
| Net income | $ | 48,198 | $ | 36,956 | $ | 31,076 | ||||||
|
Interest
expense
|
19,254
|
28,609
|
33,055
|
|||||||||
|
Income
tax expense
|
14,978
|
21,533
|
26,612
|
|||||||||
|
Depreciation
and amortization
|
71,064
|
63,497
|
64,102
|
|||||||||
|
Facility
action charges, net
|
4,695
|
4,139
|
(1,282
|
)
|
||||||||
|
Share-based
compensation expense
|
8,156
|
12,534
|
11,378
|
|||||||||
|
Adjusted
EBITDA
|
$
|
166,345
|
$
|
167,268
|
$
|
164,941
|
||||||
Impact
of Inflation
Inflation
has an impact on food and packaging, construction, occupancy, labor and
benefits, and general and administrative costs, all of which can significantly
affect our operations. Historically, consistent with others in the QSR industry,
we have been able to pass along to our customers, through price increases,
higher costs arising from these inflationary factors.
Interest
Rate Risk
Our
principal exposures to financial market risks relate to the impact that interest
rate changes could have on our Facility and on the fair value of our interest
rate swap agreements. As of January 31, 2010, our Facility is comprised of a
revolving credit facility and a term loan, which bears interest at an annual
rate equal to LIBOR plus 1.50% and LIBOR plus 1.38%, respectively. As of January
31, 2010, we had $277,432 of borrowings and $35,363 of letters of credit
outstanding under our Facility. We have entered into interest rate swap
agreements with a combined notional amount of $200,000. These agreements will
expire on March 12, 2012. The effect of the agreements is to limit the
interest rate exposure on a portion of our term loan debt under our Facility to
a fixed rate of 6.12%. The agreements were not designated as cash flow at
inception. Accordingly, the change in the fair value of the interest
rate swap agreements is recognized in interest expense in our Consolidated
Statements of Income. These interest rate swap agreements are highly sensitive
to interest rate fluctuations which could result in significant variability in
their future fair value.
A
hypothetical increase of 100 basis points in short-term interest rates
would result in a reduction in our annual pre-tax earnings of $774. The
estimated reduction is based upon the outstanding balance of the borrowings
under our Facility that are not covered by our interest rate swaps and the
weighted-average interest rate for the fiscal year and assumes no change in the
volume, index or composition of debt as in effect on January 31,
2010.
Foreign
Currency Risk
Our
objective in managing our exposure to foreign currency fluctuations is to limit
the impact of such fluctuations on earnings and cash flows. Our
business at company-operated restaurants is transacted in U.S.
dollars. Exposure outside of the U.S. relates primarily to the effect
of foreign currency rate fluctuations on royalties paid by franchisees. As of
January 31, 2010, our most significant exposure related to the Mexican Peso.
Foreign exchange rate fluctuations have not historically had a significant
impact on our results of operations.
Commodity
Price Risk
We
purchase certain products that are affected by commodity prices and are,
therefore, subject to price volatility caused by weather, market conditions and
other factors which are not considered predictable or within our control.
Although these products are subject to changes in commodity prices, certain
purchasing contracts or pricing arrangements contain risk management techniques
designed to minimize price volatility. The purchasing contracts and pricing
arrangements we use may result in unconditional purchase obligations, which are
not reflected in our Consolidated Balance Sheets. Typically, we use these types
of purchasing techniques to control costs as an alternative to directly managing
financial instruments to hedge commodity prices. In many cases, we believe we
will be able to address material commodity cost increases by adjusting our menu
pricing or changing our product delivery strategy. However, increases in
commodity prices, without adjustments to our menu prices, could increase
restaurant operating costs as a percentage of company-operated restaurants
revenue.
See the
Index included at Item 15 — Exhibits, Financial Statement
Schedules.
None.
(A) Evaluation
of Disclosure Controls and Procedures
We
maintain disclosure controls and procedures that are designed to ensure that
information required to be disclosed in our reports under the Exchange Act, is
recorded, processed, summarized and reported within the time periods specified
in the SEC’s rules and forms, and that such information is accumulated and
communicated to management, including our principal executive officer and
principal financial officer, to allow timely decisions regarding required
disclosure. In designing and evaluating our disclosure controls and procedures,
our management recognized that any system of controls and procedures, no matter
how well designed and operated, can provide only reasonable assurance of
achieving the desired control objectives, as ours are designed to do, and
management necessarily was required to apply its judgment in evaluating the
cost-benefit relationship of possible controls and procedures.
In
connection with the preparation of this Annual Report on Form 10-K, an
evaluation was performed under the supervision and with the participation of our
management, including our principal executive officer and principal
financial officer, of the effectiveness of the design and operation of our
disclosure controls and procedures (as defined in Rule 13a-15(e) under the
Exchange Act). Based on that evaluation, our principal executive officer
and principal financial officer concluded that our disclosure controls and
procedures were effective as of the end of the period covered by this Annual
Report on Form 10-K to ensure that the information required to be disclosed
by us in reports that we file or submit under the Exchange Act is recorded,
processed, summarized and reported within the time periods specified in the
SEC’s rules and forms, and to ensure that the information required to be
disclosed by us in reports that we file or submit under the Exchange Act is
accumulated and communicated to our management, including our principal
executive officer and principal financial officer, as appropriate, to allow
timely decisions regarding required disclosures.
(B) Management’s
Report on Internal Control over Financial Reporting
Our
management is responsible for establishing and maintaining adequate internal
control over financial reporting as defined in Rule 13a-15(f) under the
Exchange Act. Our internal control system is designed to provide reasonable
assurance to our management and Board of Directors regarding the preparation and
fair presentation of published financial statements. All internal control
systems, no matter how well designed, have inherent limitations. Therefore, even
those systems determined to be effective can provide only reasonable assurance
with respect to the reliability of financial reporting and the preparation of
financial statements for external purposes in accordance with generally accepted
accounting principles.
Management
has assessed the effectiveness of our internal control over financial reporting
as of January 31, 2010. In making its assessment of internal control over
financial reporting, management used the criteria set forth in Internal Control — Integrated Framework
issued by the Committee of Sponsoring Organizations of the Treadway
Commission (COSO).
Management
has concluded that, as of January 31, 2010, our internal control over financial
reporting was effective.
KPMG LLP,
the independent registered public accounting firm that audited our Consolidated
Financial Statements included in this Annual Report on Form 10-K, has
issued an audit report on our internal control over financial
reporting.
(C) Changes
in Internal Control over Financial Reporting
There
have been no changes in our internal control over financial reporting during the
fourth quarter of fiscal 2010 that have materially affected, or are reasonably
likely to materially affect, our internal control over financial
reporting.
(D) Report
of Independent Registered Public Accounting Firm
The Board
of Directors and Stockholders
CKE
Restaurants, Inc.:
We have
audited CKE Restaurants, Inc.’s (the Company) internal control over financial
reporting as of January 31, 2010, based on criteria established in Internal Control - Integrated
Framework issued by the Committee of Sponsoring Organizations of the
Treadway Commission (COSO).
Management of CKE Restaurants, Inc. is responsible for maintaining
effective internal control over financial reporting and for its assessment of
the effectiveness of internal control over financial reporting, included in the
accompanying Management’s
Report on Internal Control over Financial Reporting (Item 9A(B)). Our
responsibility is to express an opinion on the Company’s internal control over
financial reporting based on our audit.
We
conducted our audit in accordance with the standards of the Public Company
Accounting Oversight Board (United States). Those standards require that we plan
and perform the audit to obtain reasonable assurance about whether effective
internal control over financial reporting was maintained in all material
respects. Our audit included obtaining an understanding of internal control over
financial reporting, assessing the risk that a material weakness exists, and
testing and evaluating the design and operating effectiveness of internal
control based on the assessed risk. Our audit also included performing such
other procedures as we considered necessary in the circumstances. We believe
that our audit provides a reasonable basis for our opinion.
A
company's internal control over financial reporting is a process designed to
provide reasonable assurance regarding the reliability of financial reporting
and the preparation of financial statements for external purposes in accordance
with generally accepted accounting principles. A company's internal
control over financial reporting includes those policies and procedures that (1)
pertain to the maintenance of records that, in reasonable detail, accurately and
fairly reflect the transactions and dispositions of the assets of the company;
(2) provide reasonable assurance that transactions are recorded as necessary to
permit preparation of financial statements in accordance with generally accepted
accounting principles, and that receipts and expenditures of the company are
being made only in accordance with authorizations of management and directors of
the company; and (3) provide reasonable assurance regarding prevention or timely
detection of unauthorized acquisition, use, or disposition of the company’s
assets that could have a material effect on the financial
statements.
Because
of its inherent limitations, internal control over financial reporting may not
prevent or detect misstatements. Also, projections of any evaluation
of effectiveness to future periods are subject to the risk that controls may
become inadequate because of changes in conditions, or that the degree of
compliance with the policies or procedures may deteriorate.
In our
opinion, CKE Restaurants, Inc. maintained, in all material respects, effective
internal control over financial reporting as of January 31, 2010, based on
criteria established in Internal Control - Integrated
Framework issued by the Committee of Sponsoring Organizations of the
Treadway Commission (COSO).
We also
have audited, in accordance with the standards of the Public Company Accounting
Oversight Board (United States), the consolidated balance sheets of CKE
Restaurants, Inc. and subsidiaries as of January 31, 2010 and 2009, and the
related consolidated statements of income, stockholders’ equity, and cash flows
for each of the years in the three-year period ended January 31, 2010, and our
report dated March
24, 2010, expressed an
unqualified opinion on those consolidated financial statements.
/s/ KPMG
LLP
Irvine,
California
March 24,
2010
(E) Certifications
The
certifications of our CEO and CFO required under Section 302 of
the Sarbanes-Oxley Act of 2002 have been filed as Exhibits 31.1 and 31.2,
respectively, to this Annual Report on Form 10-K. Additionally, in 2009
our CEO submitted to the NYSE an Annual Chief Executive Officer
Certification, as required by Section 303A.12(a) of the NYSE Listed Company
Manual, indicating that he was not aware of any violations by the Company of the
NYSE’s corporate governance listing standards. Such certification was
unqualified.
Not
Applicable.
PART III
The
information pertaining to directors and executive officers of the registrant is
incorporated into this Annual Report on Form 10-K by reference to our definitive
proxy statement for our 2010 annual meeting of stockholders, or to an amendment
to this Annual Report on Form 10-K, either of which will be filed within 120
days after our fiscal year ended January 25, 2010. Certain information
concerning the current executive officers is contained in Item 1 of
Part I of this Annual Report on Form 10-K.
Code
of Ethics and Corporate Governance Information
We have
adopted a code of business conduct and ethics (“Code of Conduct”) to help ensure
our directors and employees conduct the business of CKE fairly, free of
conflicts of interest, and in an ethical and proper manner. We have also adopted
a code of ethics (“Code of Ethics”) for our CEO and senior financial officers,
including our principal financial officer and principal accounting officer or
controller, or persons performing similar functions. The Code of Conduct and the
Code of Ethics can be found on our website at www.ckr.com. We will
satisfy the disclosure requirement under Item 5.05 of Form 8-K, as
necessary, regarding any amendment to, or waiver from, any applicable provision
(related to elements listed under Item 406(b) of Regulation S-K) of
the Code of Conduct or the Code of Ethics by posting such information on our
website.
The Board
of Directors has adopted and approved the Code of Conduct, Code of Ethics,
Corporate Governance Guidelines, and written charters for its Nominating and
Corporate Governance, Audit and Compensation Committees. All of the foregoing
documents are available on our website at www.ckr.com, and a
copy of the foregoing will be made available (without charge) to any stockholder
upon request.
The
information pertaining to executive compensation is incorporated into this
Annual Report on Form 10-K by reference to our definitive proxy statement for
our 2010 annual meeting of stockholders, or to an amendment to this Annual
Report on Form 10-K, either of which will be filed within 120 days after our
fiscal year ended January 25, 2010.
The
information pertaining to security ownership of certain beneficial owners and
management and related stockholder matters is incorporated into this Annual
Report on Form 10-K by reference to our definitive proxy statement for our 2010
annual meeting of stockholders, or to an amendment to this Annual Report on Form
10-K, either of which will be filed within 120 days after our fiscal year ended
January 25, 2010.
Equity
Compensation Plan Information
Equity
compensation plans as of January 31, 2010 were:
|
(a)
|
(b)
|
(c)
|
||||||||||
|
Plan
Category
|
Number
of Securities
to
be Issued Upon
Exercise
of
Outstanding
Options,
Warrants
and Rights
|
Weighted-Average
Exercise
Price of
Outstanding
Options,
Warrants
and
Rights
|
Number
of Securities
Remaining
Available
for
Future Issuance
Under
Equity
Compensation
Plans
(Excluding
Securities
Reflected
in
Column (a))
|
|||||||||
|
Equity
compensation plans approved by security holders
|
4,109,499
|
$
|
10.79
|
2,415,000
|
||||||||
|
Equity
compensation plans not approved by security holders(1)
|
324,942
|
8.62
|
9,648
|
|||||||||
|
Total
|
4,434,441
|
$
|
10.63
|
2,424,648
|
||||||||
__________
|
(1)
|
Represents
options that are part of a “broad-based plan” as defined by the NYSE. See
Note 16 of Notes to Consolidated Financial
Statements.
|
The
information pertaining to certain relationships and related transactions and
director independence is incorporated into this Annual Report on Form 10-K by
reference to our definitive proxy statement for our 2010 annual meeting of
stockholders, or to an amendment to this Annual Report on Form 10-K, either of
which will be filed within 120 days after our fiscal year ended January 25,
2010.
The
information pertaining to principal accounting fees and services is incorporated
into this Annual Report on Form 10-K by reference to our definitive proxy
statement for our 2010 annual meeting of stockholders, or to an amendment to
this Annual Report on Form 10-K, either of which will be filed within 120 days
after our fiscal year ended January 25, 2010.
PART IV
|
Page
|
|||||
|
(a)(1)
|
Index
to Consolidated Financial Statements:
|
||||
|
52
|
|||||
|
53
|
|||||
|
54
|
|||||
|
55
|
|||||
|
56
|
|||||
|
57
|
|||||
|
All
schedules are omitted since the required information is not present in
amounts sufficient to require submission of the schedule, or because the
information required is included in the Consolidated Financial Statements
or the notes thereto.
|
|||||
|
(a)(2)
|
|||||
SIGNATURES
Pursuant
to the requirements of Section 13 or 15(d) of the Securities Exchange Act
of 1934, the registrant has duly caused this report to be signed on its behalf
by the undersigned, thereunto duly authorized.
|
CKE
RESTAURANTS, INC.
|
||
|
Date:
March 24, 2010
|
By:
|
/s/ Andrew
F. Puzder
|
|
Andrew
F. Puzder,
|
||
|
Chief
Executive Officer
|
||
POWER
OF ATTORNEY
Each
person whose signature appears below constitutes and appoints Andrew F. Puzder
and Theodore Abajian, or either of them, as his or her attorney-in-fact, with
full power of substitution, for him or her in any and all capacities, to sign
any amendments to this Annual Report on Form 10-K, and to file the same, with
all exhibits thereto and other documents in connection therewith, with the
Securities and Exchange Commission, hereby ratifying and confirming all that
each attorney-in-fact, or his substitute, may do or cause to be done by virtue
hereof.
Pursuant
to the requirements of the Securities Exchange Act of 1934, this report has been
signed below by the following persons on behalf of the registrant and in the
capacities and on the dates indicated.
|
Signature
|
Title
|
Date
|
|
/s/ Byron
Allumbaugh
|
Chairman
of the Board
|
March
24, 2010
|
|
Byron
Allumbaugh
|
||
|
/s/ Frank
P. Willey
|
Vice
Chairman of the Board
|
March
24, 2010
|
|
Frank
P. Willey
|
||
|
/s/ Andrew
F. Puzder
|
Chief
Executive Officer (Principal
|
March
24, 2010
|
|
Andrew
F. Puzder
|
Executive
Officer) and Director
|
|
|
/s/ Theodore
Abajian
|
Executive
Vice President and Chief Financial
|
March
24, 2010
|
|
Theodore
Abajian
|
Officer
(Principal Financial Officer)
|
|
|
/s/ Reese
Stewart
|
Senior
Vice President and Chief Accounting
|
March
24, 2010
|
|
Reese
Stewart
|
Officer
(Principal Accounting Officer)
|
|
|
/s/ Peter
Churm
|
Director
|
March
24, 2010
|
|
Peter
Churm
|
||
|
/s/ Matthew
Goldfarb
|
Director
|
March
24, 2010
|
|
Matthew
Goldfarb
|
||
|
/s/ Carl
L. Karcher
|
Director
|
March
24, 2010
|
|
Carl
L. Karcher
|
||
|
/s/ Janet
E. Kerr
|
Director
|
March
24, 2010
|
|
Janet
E. Kerr
|
||
|
/s/ Daniel
D. Lane
|
Director
|
March
24, 2010
|
|
Daniel
D. Lane
|
||
|
/s/ Daniel
E. Ponder, Jr.
|
Director
|
March
24, 2010
|
|
Daniel
E. Ponder, Jr.
|
||
|
/s/ Jerold
H. Rubinstein
|
Director
|
March
24, 2010
|
|
Jerold
H. Rubinstein
|
The Board
of Directors and Stockholders
CKE
Restaurants, Inc.:
We have
audited the accompanying consolidated balance sheets of CKE Restaurants, Inc.
and subsidiaries
as of January 31, 2010 and 2009, and the related consolidated statements of
income, stockholders’ equity, and cash flows for each of the years in the
three-year period ended January 31, 2010. These consolidated financial
statements are the responsibility of the Company’s management. Our
responsibility is to express an opinion on these consolidated financial
statements based on our audits.
We
conducted our audits in accordance with the standards of the Public Company
Accounting Oversight Board (United States). Those standards require
that we plan and perform the audit to obtain reasonable assurance about whether
the financial statements are free of material misstatement. An audit
includes examining, on a test basis, evidence supporting the amounts and
disclosures in the financial statements. An audit also includes assessing the
accounting principles used and significant estimates made by management, as well
as evaluating the overall financial statement presentation. We
believe that our audits provide a reasonable basis for our opinion.
In our
opinion, the consolidated financial statements referred to above present fairly,
in all material respects, the financial position of CKE Restaurants, Inc.
and subsidiaries
as of January 31, 2010 and 2009, and the results of their operations and their
cash flows for each of the years in the three-year period ended January 31,
2010, in conformity with U.S. generally accepted accounting
principles.
As
discussed in Note 1 to the consolidated financial statements, the Company
changed its method of accounting for uncertainties in income taxes in fiscal
2008, and its method of presenting earnings per share in fiscal 2010 due to the
adoption of new accounting pronouncements.
We also
have audited, in accordance with the standards of the Public Company Accounting
Oversight Board (United States), the Company’s internal control over financial
reporting as of January 31, 2010, based on criteria established
in Internal Control -
Integrated Framework issued by the Committee of Sponsoring Organizations
of the Treadway Commission (COSO), and our report dated March 24, 2010,
expressed an unqualified opinion on the effectiveness of the Company’s internal
control over financial reporting.
/s/ KPMG
LLP
Irvine,
California
March 24,
2010
CKE
RESTAURANTS, INC. AND SUBSIDIARIES
AS
OF JANUARY 31, 2010 AND 2009
(In
thousands, except par values)
|
2010
|
2009
|
|||||||
|
ASSETS
|
||||||||
|
Current
assets:
|
||||||||
|
Cash
and cash equivalents
|
$ | 18,246 | $ | 17,869 | ||||
|
Accounts
receivable, net
|
35,016
|
40,738
|
||||||
|
Related
party trade receivables
|
5,037
|
4,923
|
||||||
|
Inventories,
net
|
24,692
|
24,215
|
||||||
|
Prepaid
expenses
|
13,723
|
13,445
|
||||||
|
Assets
held for sale
|
500
|
805
|
||||||
|
Advertising
fund assets, restricted
|
18,295
|
16,340
|
||||||
|
Deferred
income tax assets, net
|
26,517
|
20,781
|
||||||
|
Other
current assets
|
3,829
|
1,843
|
||||||
|
Total current assets
|
145,855
|
140,959
|
||||||
|
Notes
receivable, net
|
1,075
|
3,259
|
||||||
|
Property
and equipment, net
|
568,334
|
543,770
|
||||||
|
Property
under capital leases, net
|
32,579
|
23,403
|
||||||
|
Deferred
income tax assets, net
|
40,299
|
57,832
|
||||||
|
Goodwill
|
24,589
|
23,688
|
||||||
|
Intangible
assets, net
|
2,317
|
2,508
|
||||||
|
Other
assets, net
|
8,495
|
9,268
|
||||||
|
Total assets
|
$
|
823,543
|
$
|
804,687
|
||||
|
LIABILITIES
AND STOCKHOLDERS’ EQUITY
|
||||||||
|
Current
liabilities:
|
||||||||
|
Current
portion of bank indebtedness and other long-term
debt
|
$
|
12,262
|
$
|
4,341
|
||||
|
Current
portion of capital lease obligations
|
7,445
|
6,389
|
||||||
|
Accounts
payable
|
65,656
|
60,903
|
||||||
|
Advertising
fund liabilities
|
18,295
|
16,340
|
||||||
|
Other
current liabilities
|
95,605
|
91,765
|
||||||
|
Total current liabilities
|
199,263
|
179,738
|
||||||
|
Bank
indebtedness and other long-term debt, less current
portion
|
266,202
|
310,447
|
||||||
|
Capital
lease obligations, less current portion
|
43,099
|
36,273
|
||||||
|
Other
long-term liabilities
|
78,804
|
83,953
|
||||||
|
Total liabilities
|
587,368
|
610,411
|
||||||
|
Commitments
and contingencies (Notes 7, 9, 10, 11 and 24)
|
||||||||
|
Subsequent
events (Notes 12, 16 and 25)
|
||||||||
|
Stockholders’
equity:
|
||||||||
|
Preferred
stock, $.01 par value; authorized 5,000 shares; none issued or
outstanding
|
—
|
—
|
||||||
|
Series A
Junior Participating Preferred stock, $.01 par value; none and
1,500 shares authorized as of January 31, 2010 and 2009,
respectively; none issued or outstanding as of January 31, 2010 and
2009
|
—
|
—
|
||||||
|
Common
stock, $.01 par value; authorized 100,000 shares;
55,291 shares issued and outstanding as of January 31, 2010 and
54,653 shares issued and outstanding as of January 31,
2009
|
553
|
546
|
||||||
|
Additional
paid-in capital
|
282,904
|
276,068
|
||||||
|
Accumulated
deficit
|
(47,282
|
)
|
(82,338
|
)
|
||||
|
Total stockholders’ equity
|
236,175
|
194,276
|
||||||
|
Total liabilities and stockholders’ equity
|
$
|
823,543
|
$
|
804,687
|
||||
See
Accompanying Notes to Consolidated Financial Statements
CKE
RESTAURANTS, INC. AND SUBSIDIARIES
FOR
THE FISCAL YEARS ENDED JANUARY 31, 2010, 2009 AND 2008
(In
thousands, except per share amounts)
|
2010
|
2009
|
2008
|
||||||||||
|
Revenue:
|
||||||||||||
|
Company-operated
restaurants
|
$
|
1,084,474
|
$
|
1,131,312
|
$
|
1,201,577
|
||||||
|
Franchised
and licensed restaurants and other
|
334,259
|
351,398
|
333,057
|
|||||||||
|
Total revenue
|
1,418,733
|
1,482,710
|
1,534,634
|
|||||||||
|
Operating
costs and expenses:
|
||||||||||||
|
Restaurant
operating costs:
|
||||||||||||
|
Food and packaging
|
310,483
|
335,707
|
356,332
|
|||||||||
|
Payroll and other employee benefits
|
312,571
|
322,936
|
350,526
|
|||||||||
|
Occupancy and other
|
260,061
|
258,995
|
267,372
|
|||||||||
|
Total restaurant operating costs
|
883,115
|
917,638
|
974,230
|
|||||||||
|
Franchised
and licensed restaurants and other
|
253,850
|
269,699
|
258,295
|
|||||||||
|
Advertising
|
64,443
|
66,911
|
70,324
|
|||||||||
|
General
and administrative
|
133,135
|
140,303
|
144,035
|
|||||||||
|
Facility
action charges, net
|
4,695
|
4,139
|
(577
|
)
|
||||||||
|
Total operating costs and expenses
|
1,339,238
|
1,398,690
|
1,446,307
|
|||||||||
|
Operating
income
|
79,495
|
84,020
|
88,327
|
|||||||||
|
Interest
expense
|
(19,254
|
)
|
(28,609
|
)
|
(33,033
|
)
|
||||||
|
Other
income, net
|
2,935
|
3,078
|
4,437
|
|||||||||
|
Income
before income taxes and discontinued operations
|
63,176
|
58,489
|
59,731
|
|||||||||
|
Income
tax expense
|
14,978
|
21,533
|
24,659
|
|||||||||
|
Income
from continuing operations
|
48,198
|
36,956
|
35,072
|
|||||||||
|
Discontinued
operations:
|
||||||||||||
|
Loss
from discontinued operations (net of income tax expense of $1,953 for
2008)
|
—
|
—
|
(3,996
|
)
|
||||||||
|
Net
income
|
$
|
48,198
|
$
|
36,956
|
$
|
31,076
|
||||||
|
Basic
income per common share:
|
||||||||||||
|
Continuing
operations
|
$
|
0.88
|
$
|
0.69
|
$
|
0.58
|
||||||
|
Discontinued
operations
|
—
|
—
|
(0.06
|
)
|
||||||||
|
Basic
income per common share
|
$
|
0.88
|
$
|
0.69
|
$
|
0.52
|
||||||
|
Diluted
income per common share:
|
||||||||||||
|
Continuing
operations
|
$
|
0.87
|
$
|
0.68
|
$
|
0.56
|
||||||
|
Discontinued
operations
|
—
|
—
|
(0.06
|
)
|
||||||||
|
Diluted
income per common share
|
$
|
0.87
|
$
|
0.68
|
$
|
0.50
|
||||||
|
Dividends
per common share
|
$
|
0.24
|
$
|
0.24
|
$
|
0.24
|
||||||
See
Accompanying Notes to Consolidated Financial Statements
CKE
RESTAURANTS, INC. AND SUBSIDIARIES
FOR
THE FISCAL YEARS ENDED JANUARY 31, 2010, 2009 AND 2008
(In
thousands)
|
Common
Stock
|
Additional
|
Total
|
|||||||||||||||||||
|
Common
Stock
|
Held
in Treasury
|
Paid-In
|
Accumulated
|
Stockholders’
|
|||||||||||||||||
|
Shares
|
Amount
|
Shares
|
Amount
|
Capital
|
Deficit
|
Equity
|
|||||||||||||||
|
Balance
as of January 31, 2007
|
67,247
|
$
|
672
|
(18
|
)
|
$
|
(360
|
)
|
$
|
501,437
|
$
|
(122,903
|
)
|
$
|
378,846
|
||||||
|
Cash
dividends declared
|
—
|
—
|
—
|
—
|
—
|
(13,850
|
)
|
(13,850
|
)
|
||||||||||||
|
Issuance
of restricted stock awards, net of forfeitures
|
643
|
6
|
—
|
—
|
(6
|
)
|
—
|
—
|
|||||||||||||
|
Exercise
of stock options
|
459
|
5
|
—
|
—
|
3,317
|
—
|
3,322
|
||||||||||||||
|
Net
tax benefit from exercise of stock options and vesting of restricted stock
awards
|
—
|
—
|
—
|
—
|
1,904
|
—
|
1,904
|
||||||||||||||
|
Share-based
compensation expense
|
—
|
—
|
—
|
—
|
11,355
|
—
|
11,355
|
||||||||||||||
|
Repurchase
and retirement of common stock
|
(15,845
|
)
|
(158
|
)
|
(10
|
)
|
1
|
(266,483
|
)
|
—
|
(266,640
|
)
|
|||||||||
|
Net
income
|
—
|
—
|
—
|
—
|
—
|
31,076
|
31,076
|
||||||||||||||
|
Transition
amount for uncertain tax positions
|
—
|
—
|
—
|
—
|
—
|
(771
|
)
|
(771
|
)
|
||||||||||||
|
Balance
as of January 31, 2008
|
52,504
|
525
|
(28
|
)
|
(359
|
)
|
251,524
|
(106,448
|
)
|
145,242
|
|||||||||||
|
Cash
dividends declared
|
—
|
—
|
—
|
—
|
—
|
(12,846
|
)
|
(12,846
|
)
|
||||||||||||
|
Issuance
of restricted stock awards, net of forfeitures
|
636
|
6
|
—
|
—
|
(6
|
)
|
—
|
—
|
|||||||||||||
|
Exercise
of stock options
|
218
|
2
|
—
|
—
|
1,624
|
—
|
1,626
|
||||||||||||||
|
Conversion
of 2023 Convertible Notes into common stock
|
1,787
|
18
|
—
|
—
|
15,149
|
—
|
15,167
|
||||||||||||||
|
Net
tax deficiency from exercise of stock options and vesting of restricted
stock awards
|
—
|
—
|
—
|
—
|
(242
|
)
|
—
|
(242
|
)
|
||||||||||||
|
Share-based
compensation expense
|
—
|
—
|
—
|
—
|
12,521
|
—
|
12,521
|
||||||||||||||
|
Repurchase
and retirement of common stock
|
(492
|
)
|
(5
|
)
|
28
|
359
|
(4,502
|
)
|
—
|
(4,148
|
)
|
||||||||||
|
Net
income
|
—
|
—
|
—
|
—
|
—
|
36,956
|
36,956
|
||||||||||||||
|
Balance
as of January 31, 2009
|
54,653
|
546
|
—
|
—
|
276,068
|
(82,338
|
)
|
194,276
|
|||||||||||||
|
Cash
dividends declared
|
—
|
—
|
—
|
—
|
—
|
(13,142
|
)
|
(13,142
|
)
|
||||||||||||
|
Issuance
of restricted stock awards, net of forfeitures
|
638
|
7
|
—
|
—
|
(7
|
)
|
—
|
—
|
|||||||||||||
|
Exercise
of stock options
|
191
|
2
|
—
|
—
|
836
|
—
|
838
|
||||||||||||||
|
Net
tax deficiency from exercise of stock options and vesting of restricted
stock awards
|
—
|
—
|
—
|
—
|
(391
|
)
|
—
|
(391
|
)
|
||||||||||||
|
Share-based
compensation expense
|
—
|
—
|
—
|
—
|
8,120
|
—
|
8,120
|
||||||||||||||
|
Repurchase
and retirement of common stock
|
(191
|
)
|
(2
|
)
|
—
|
—
|
(1,722
|
)
|
—
|
(1,724
|
)
|
||||||||||
|
Net
income
|
—
|
—
|
—
|
—
|
—
|
48,198
|
48,198
|
||||||||||||||
|
Balance
as of January 31, 2010
|
55,291
|
$
|
553
|
—
|
$
|
—
|
$
|
282,904
|
$
|
(47,282
|
)
|
$
|
236,175
|
||||||||
See
Accompanying Notes to Consolidated Financial Statements
CKE
RESTAURANTS, INC. AND SUBSIDIARIES
FOR
THE FISCAL YEARS ENDED JANUARY 31, 2010, 2009 AND 2008
(In
thousands)
|
2010
|
2009
|
2008
|
||||||||||
|
Cash
flows from operating activities:
|
||||||||||||
| Net income | $ | 48,198 | $ | 36,956 | $ | 31,076 | ||||||
|
Adjustments
to reconcile net income to net cash provided by operating
activities:
|
||||||||||||
|
Depreciation and amortization
|
71,064
|
63,497
|
64,102
|
|||||||||
|
Amortization of deferred loan fees included in interest
expense
|
1,035
|
1,186
|
930
|
|||||||||
|
Share-based compensation expense
|
8,120
|
12,521
|
11,355
|
|||||||||
|
(Recovery of) provision for losses on accounts and notes
receivable
|
(212
|
)
|
309
|
(1,070
|
)
|
|||||||
|
Loss on investments, sale of property and equipment, capital leases and
extinguishment of debt
|
2,341
|
2,353
|
4,429
|
|||||||||
|
Facility action charges, net
|
4,695
|
4,139
|
(1,282
|
)
|
||||||||
|
Deferred income taxes
|
11,797
|
18,033
|
14,979
|
|||||||||
|
Other non-cash charges
|
34
|
34
|
48
|
|||||||||
|
Net changes in operating assets and liabilities:
|
||||||||||||
|
Receivables, inventories, prepaid expenses and other current and
non-current assets
|
1,905
|
6,298
|
(8,431
|
)
|
||||||||
|
Estimated liability for closed restaurants and estimated liability for
self-insurance
|
(3,618
|
)
|
(4,140
|
)
|
(5,028
|
)
|
||||||
|
Accounts payable and other current and long-term
liabilities
|
4,407
|
|
4,551
|
10,257
|
||||||||
|
Net cash provided by operating activities
|
149,766
|
145,737
|
121,365
|
|||||||||
|
Cash
flows from investing activities:
|
||||||||||||
|
Purchases
of property and equipment
|
(102,306
|
)
|
(114,165
|
)
|
(133,816
|
)
|
||||||
|
Proceeds
from sale of property and equipment
|
4,457
|
22,689
|
56,419
|
|||||||||
|
Collections
of non-trade notes receivable
|
3,399
|
3,048
|
5,406
|
|||||||||
|
Decrease
in cash upon deconsolidation of variable interest
entity
|
—
|
—
|
(49
|
)
|
||||||||
|
Disposition
of La Salsa, net of cash surrendered
|
—
|
—
|
5,720
|
|||||||||
|
Acquisition
of restaurants, net of cash received
|
(1,041
|
)
|
(3,477
|
)
|
—
|
|||||||
|
Other
investing activities
|
135
|
87
|
70
|
|||||||||
|
Net cash used in investing activities
|
(95,356
|
)
|
(91,818
|
)
|
(66,250
|
)
|
||||||
|
Cash
flows from financing activities:
|
||||||||||||
|
Net
change in bank overdraft
|
3,295
|
(13,424
|
)
|
8,791
|
||||||||
|
Borrowings
under revolving credit facility
|
122,000
|
153,000
|
372,500
|
|||||||||
|
Repayments
of borrowings under revolving credit facility
|
(154,000
|
)
|
(157,500
|
)
|
(351,500
|
)
|
||||||
|
Borrowings
under credit facility term loan
|
—
|
—
|
200,179
|
|||||||||
|
Repayments
of credit facility term loan
|
(4,303
|
)
|
(16,490
|
)
|
(1,775
|
)
|
||||||
|
Repayments
of other long-term debt
|
(21
|
)
|
(161
|
)
|
(160
|
)
|
||||||
|
Repayments
of capital lease obligations
|
(7,277
|
)
|
(5,725
|
)
|
(5,340
|
)
|
||||||
|
Payment
of deferred loan fees
|
—
|
(399
|
)
|
(1,279
|
)
|
|||||||
|
Repurchase
of common stock
|
(1,724
|
)
|
(4,416
|
)
|
(266,732
|
)
|
||||||
|
Exercise
of stock options
|
838
|
1,626
|
3,322
|
|||||||||
|
Tax
impact of stock option and restricted stock award
transactions
|
299
|
174
|
1,611
|
|||||||||
|
Dividends
paid on common stock
|
(13,140
|
)
|
(12,728
|
)
|
(13,419
|
)
|
||||||
|
Net cash used in financing activities
|
(54,033
|
)
|
(56,043
|
)
|
(53,802
|
)
|
||||||
|
Net
increase (decrease) in cash and cash equivalents
|
377
|
(2,124
|
)
|
1,313
|
||||||||
|
Cash
and cash equivalents at beginning of year
|
17,869
|
19,993
|
18,680
|
|||||||||
|
Cash
and cash equivalents at end of year
|
$
|
18,246
|
$
|
17,869
|
$
|
19,993
|
||||||
See
Accompanying Notes to Consolidated Financial Statements
56
CKE
RESTAURANTS, INC. AND SUBSIDIARIES
NOTES TO
CONSOLIDATED FINANCIAL STATEMENTS
FOR
THE FISCAL YEARS ENDED JANUARY 31, 2010, 2009 AND 2008
(Dollars
in thousands, except per share amounts)
Description
of Business
CKE
Restaurants, Inc. ®
(“CKE” or “Company”), through its wholly-owned subsidiaries, owns, operates,
franchises and licenses the Carl’s Jr.®,
Hardee’s
®, Green Burrito ® and
Red Burritotm
concepts. References to CKE Restaurants, Inc. throughout these Notes to
Consolidated Financial Statements are made using the first person notations of
“we,” “us” and “our.”
Carl’s
Jr. restaurants are primarily located in the Western United States. Hardee’s
restaurants are located throughout the Southeastern and Midwestern United
States. Green Burrito restaurants are primarily located in dual-branded Carl’s
Jr. restaurants. The Red Burrito concept is located in dual-branded Hardee’s
restaurants. As of January 31, 2010, our system-wide restaurant portfolio
consisted of:
|
Carl’s
Jr.
|
Hardee’s
|
Other
|
Total
|
|||||||||||||
|
Company-operated
|
422
|
475
|
1
|
898
|
||||||||||||
|
Franchised
|
666
|
1,228
|
11
|
1,905
|
||||||||||||
|
Licensed
|
136
|
202
|
—
|
338
|
||||||||||||
|
Total
|
1,224
|
1,905
|
12
|
3,141
|
||||||||||||
On
February 26, 2010, we entered into an Agreement and Plan of Merger (the “Merger
Agreement”) with Western Acquisition Holdings, Inc. (“Parent”), and Western
Acquisition Corp., a wholly-owned subsidiary of Parent (“Merger Sub”), providing
for the merger of Merger Sub with and into the Company, with the Company
surviving the merger as a wholly-owned subsidiary of Parent
(“Merger”). Parent and Merger Sub are affiliates of Thomas H. Lee
Partners, L.P. (“THL”). If the Merger is completed, each share of our common
stock issued and outstanding immediately prior to closing automatically will be
cancelled and converted into the right to receive $11.05 in cash, and the
Company will cease to be a publicly traded company. The closing of the Merger
Agreement is subject to approval by the holders of a majority of the outstanding
shares of our common stock entitled to vote on the Merger, the receipt of any
required approvals, or the expiration or termination of the applicable waiting
periods, under the Hart-Scott-Rodino Antitrust Improvements Act of 1976 (the
"HSR Act"), and other customary closing conditions. On March
19, 2010, we received notice from the Federal Trade Commission that early
termination of the waiting period under the HSR Act has been granted effective
immediately. In addition, on the same date, we filed a preliminary
proxy statement with the Securities and Exchange Commission (the “SEC”) relating
to the proposed special meeting of our stockholders to consider and vote on a
proposal to adopt the Merger Agreement.
Basis
of Presentation and Fiscal Year
Our
accompanying Consolidated Financial Statements include the accounts of CKE, our
wholly-owned subsidiaries, and certain variable interest entities (“VIE”) for
which we are the primary beneficiary and have been prepared in accordance with
accounting principles generally accepted in the United States
(“GAAP”). All significant intercompany transactions are
eliminated.
We
operate on a retail accounting calendar. Our fiscal year is comprised of 13
four-week accounting periods and ends on the last Monday in January each year.
The first quarter of our fiscal year has four periods, or 16 weeks. All other
quarters have three periods, or 12 weeks. For clarity of presentation, we
generally label all years presented as if the fiscal year ended
January 31. The fiscal year ended January 25, 2010 is referred
to herein as fiscal 2010 or the fiscal year ended January 31,
2010. The fiscal year ended January 26, 2009 is referred to herein as
fiscal 2009 or the fiscal year ended January 31, 2009. The fiscal
year ended January 28, 2008 is referred to herein as fiscal 2008 or the fiscal
year ended January 31, 2008.
Certain
prior year amounts in the accompanying Consolidated Financial Statements have
been reclassified to conform to current year presentation.
Variable
Interest Entities
We
consolidate one national and approximately 80 local co-operative advertising
funds (“Hardee’s Funds”) as we have concluded that they are VIEs for which we
are the primary beneficiary. We have included $18,295 of advertising fund
assets, restricted, and advertising fund liabilities in our accompanying
Consolidated Balance Sheet as of January 31, 2010, and $16,340 of advertising
fund assets, restricted, and advertising fund liabilities in our accompanying
Consolidated Balance Sheet as of January 31, 2009. Advertising fund assets,
restricted, are comprised primarily of cash and receivables. These assets are
restricted to funding the advertising fund liabilities. Advertising fund
liabilities are comprised primarily of accounts payable and deferred
obligations. Consolidation of the Hardee’s Funds had no impact on our
accompanying Consolidated Statements of Income and Cash Flows.
57
CKE
RESTAURANTS, INC. AND SUBSIDIARIES
NOTES TO
CONSOLIDATED FINANCIAL STATEMENTS (Continued)
Although
the VIEs referred to above have been included in our accompanying Consolidated
Financial Statements, we have no rights to the assets, nor do we have any
obligation with respect to the liabilities, of these VIEs, and none of our
assets serve as collateral for the creditors of these VIEs.
Certain
of our franchisees, which combine to operate approximately 6.6% of all our
franchised restaurants, are VIEs in which we hold a significant variable
interest, but for which we are not the primary beneficiary. As of January 31,
2010, we had trade receivables related to these VIEs of $2,003, which are
included in related party trade receivables in the accompanying Consolidated
Balance Sheet. Additionally, as of January 31, 2010, there was $10,803 in other
exposures related to lease obligations for properties subleased to these
VIEs.
Estimations
The
preparation of financial statements in conformity with GAAP requires management
to make estimates and assumptions that affect the reported amounts of assets and
liabilities and disclosure of contingent assets and liabilities at the date of
the financial statements and the reported amounts of revenue and expenses during
the reporting period. Actual results could differ from those
estimates.
Our most
significant areas of estimation are:
|
•
|
estimation
of future cash flows used to assess the recoverability of long-lived
assets, including goodwill, and to establish the estimated liability for
closed restaurants and subsidizing lease payments of
franchisees;
|
|
•
|
estimation,
using actuarially determined methods, of our self-insured claim losses
under our workers’ compensation, general and auto liability insurance
programs;
|
|
•
|
determination
of appropriate estimated liabilities for loss
contingencies;
|
|
•
|
determination
of appropriate assumptions to use in evaluating leases for capital versus
operating lease treatment, establishing depreciable lives for leasehold
improvements and establishing straight-line rent expense
periods;
|
|
•
|
estimation
of the appropriate allowances associated with franchisee, licensee and
other receivables;
|
|
•
|
determination
of the appropriate assumptions to use to estimate the fair value of
share-based compensation; and
|
|
•
|
estimation
of our deferred income tax asset valuation allowance, liabilities related
to uncertain tax positions and effective tax
rate.
|
Cash
and Cash Equivalents
For
purposes of reporting cash and cash equivalents, highly liquid investments
purchased with original maturities of three months or less are considered cash
equivalents.
Inventories
Inventories
are stated at the lower of cost (on a first-in, first-out basis) or market and
consist primarily of restaurant food, packaging, equipment and
supplies.
Assets
Held for Sale
Assets
held for sale consist of surplus restaurant properties and company-operated
restaurants that we expect to sell within one year. We no longer depreciate
assets once classified as held for sale. As of January 31, 2010,
total assets held for sale were $500 and were comprised of two surplus
properties in our Hardee’s operating segment. As of January 31,
2009, total assets held for sale were $805 and were comprised of four surplus
properties in our Hardee’s operating segment.
58
CKE
RESTAURANTS, INC. AND SUBSIDIARIES
NOTES TO
CONSOLIDATED FINANCIAL STATEMENTS (Continued)
Property
and Equipment
Property
and equipment are recorded at cost, less accumulated depreciation, amortization
and impairment write-downs. Depreciation is computed using the straight-line
method based on the assets’ estimated useful lives, which generally range from
three to 40 years.
Leasehold
improvements are amortized on a straight-line basis over the shorter of the
estimated useful lives of the assets or the related lease terms. In
circumstances in which leasehold improvements are made during the course of a
lease term such that the exercise of options available to us to extend the lease
term becomes reasonably assured, such leasehold improvements may be amortized
over periods that include one or more lease option terms.
Leases
At the
inception of each lease, we perform an evaluation to determine whether the lease
is an operating or capital lease. The lease term used for this evaluation
includes renewal option periods only in instances in which the exercise of the
renewal option can be reasonably assured because failure to exercise such option
would result in an economic penalty. Such economic penalty would typically
result from our having to abandon buildings and other non-detachable
improvements with remaining economic value upon vacating the
property.
We record
rent expense for leases that contain scheduled rent increases on a straight-line
basis over the term of the lease. The lease term used for straight-line rent
expense is calculated from the date we are given control of the leased premises
through the end of the lease term, which may include a rent holiday period prior
to our opening the restaurant on the leased premises. The lease term used for
this evaluation also provides the basis for establishing depreciable lives for
buildings subject to lease and leasehold improvements, as well as the period
over which we record straight-line rent expense. Contingent rentals are
generally based on revenue in excess of stipulated amounts, and thus are not
considered minimum lease payments and are included in rent expense as they are
incurred. We generally do not receive rent concessions or leasehold improvement
incentives upon opening a store that is subject to a lease.
Capitalized
Costs
We
capitalize direct costs and interest costs associated with construction projects
that have a future benefit. If we subsequently make a determination that a site
for which development costs have been capitalized will not be acquired or
developed, any previously capitalized development costs are expensed and
included in general and administrative expenses.
Goodwill
We test
goodwill for impairment annually, or more frequently if events or circumstances
indicate that the asset might be impaired. We perform our annual impairment test
during the first quarter of our fiscal year. An impairment loss is recognized to
the extent that the carrying amount exceeds the asset’s fair value. The
impairment test is performed at the reporting unit level. We consider the
reporting unit level to be the brand level as the components (e.g., restaurants)
within each brand have similar economic characteristics, including products and
services, production processes, types or classes of customers and distribution
methods.
During
the first quarter of fiscal 2010, we completed our annual assessments of the
valuation of the Carl’s Jr. and Hardee’s brands. During the first quarters of
fiscal 2009 and 2008, we completed our annual assessments of the valuation of
the Carl’s Jr. reporting unit only, since the Hardee’s reporting unit had no
recorded goodwill. Each of those assessments concluded that the fair value of
the brand exceeded the carrying value and no impairment was recorded. As of
January 31, 2010 and 2009, we had $24,589 and $23,688, respectively, in goodwill
recorded in our accompanying Consolidated Balance Sheets.
Deferred
Loan Fees
Costs
related to the issuance of debt are deferred and amortized, utilizing the
effective interest method, as a component of interest expense over the terms of
the respective debt issues.
Revenue
Recognition
Company-operated
restaurants revenue is recognized upon the sale of food or beverage to a
customer in the restaurant. Franchised and licensed restaurants and other
revenue includes continuing rent and service fees, initial fees and royalties.
Continuing fees and royalties are recognized in the period earned. Initial fees
are recognized upon the opening of a restaurant, which is when we have performed
substantially all initial services required by the franchise agreement. Renewal
fees are recognized when a renewal agreement becomes effective. Rental revenue
is recognized in the period earned. Sales of food, packaging, supplies and
equipment to franchisees are recognized at the time of delivery to the
franchisees. Our accounting policy is to present the taxes collected from
customers and remitted to government authorities on a net basis.
59
CKE
RESTAURANTS, INC. AND SUBSIDIARIES
NOTES TO
CONSOLIDATED FINANCIAL STATEMENTS (Continued)
Franchised
and Licensed Operations
Franchise
or license agreements set out the terms of our arrangements with our franchisees
and licensees. Our franchise and certain license agreements require the
franchisee or licensee to pay an initial, non-refundable fee and continuing fees
based upon a percentage of sales. Subject to our approval and payment
of a renewal fee, a franchisee may generally renew the franchise agreement upon
its expiration.
We incur
expenses that benefit both our franchisee and licensee communities. These
expenses, along with other costs of sales and servicing of franchise and license
agreements, are charged to franchised and licensed restaurants and other expense
as incurred. Franchised and licensed restaurants and other revenue also includes
rental revenue from leasing or subleasing restaurants to franchisees. The
related occupancy costs are included in franchised and licensed restaurants and
other expense. If we sublease restaurants to a franchisee that results in a
probable loss over the term of the lease, a lease subsidy allowance is
established at inception and charged to facility action charges, net. (See
accounting policy for Facility Action Charges, Store Closure Costs,
below.)
Each
quarter, we perform an analysis to estimate bad debts for each franchisee,
compare the aggregate result of that analysis to the allowances for doubtful
accounts and adjust the allowances as appropriate. Additionally, we cease
accruing royalties and rental revenue from franchisees during the fiscal quarter
in which we determine that collectability of such amounts is not reasonably
assured. Over time, our assessment of individual franchisees may change. For
instance, we have had some franchisees, who in the past we had determined
required an estimated loss equal to the total amount of the receivable, which
have paid us in full or established a consistent record of payments (generally
six months) such that we determined an allowance was no longer
required.
Depending
on the facts and circumstances, there are a number of different actions we
and/or our franchisees may take to resolve franchise collections issues. These
actions may include the purchase of franchise restaurants by us or by other
franchisees, a modification to the franchise agreement (which may include a
provision to defer certain royalty payments or reduce royalty rates in the
future), a restructuring of the franchisee’s business and/or finances (including
the restructuring of subleases for which we are the primary obligee to the
landlord— see further discussion below) or, if necessary, the termination
of the franchise agreement. The allowance established is based on our assessment
of the most likely course of action that will occur.
Advertising
We
utilize a single advertising fund to administer our Carl’s Jr. advertising
programs (“Carl’s Jr. Fund”) and the Hardee’s Funds to administer our Hardee’s
advertising programs. As the contributions to these cooperatives are designated
and segregated for advertising, we act as an agent for the franchisees and
licensees with regard to these contributions. We record contributions from
franchisees to the Carl’s Jr. Fund as a liability until such funds are expended.
To the extent we participate in Hardee’s advertising cooperatives, our
contributions are expensed as incurred. We consolidate the Hardee’s Funds into
our accompanying Consolidated Financial Statements.
We charge
Carl’s Jr. marketing costs to expense ratably in relation to revenues over the
year in which incurred and, in the case of advertising production costs, when
the commercial is first aired. To the extent we participate in Hardee’s
advertising cooperatives, our contributions are expensed as
incurred.
Share-Based
Compensation
We use
the modified prospective approach, under which share-based compensation cost is
recognized ratably over the requisite service period and includes
(i) previously unrecognized compensation cost for all share-based payments
granted prior to, but not yet vested, as of January 31, 2006 based on their
fair values measured at the grant date, (ii) compensation cost of all
share-based payments granted subsequent to January 31, 2006 based on their
respective grant date fair value, and (iii) the incremental fair value of
awards modified subsequent to January 31, 2006 measured as of the date of
such modification. In addition, these amounts are adjusted for forfeitures,
estimated at the time of the grant, subsequently revised to reflect actual
forfeitures.
60
CKE
RESTAURANTS, INC. AND SUBSIDIARIES
NOTES TO
CONSOLIDATED FINANCIAL STATEMENTS (Continued)
For tax
purposes, we expect to be entitled to a tax deduction, subject to certain
limitations, based on the fair value of certain equity awards when the
restrictions lapse or stock options are exercised. The cumulative
compensation cost recognized for certain equity awards and amounts that
ultimately will be deductible for tax purposes are temporary differences as
prescribed by the FASB authoritative guidance for income tax. The tax effect of
compensation deductions for tax purposes in excess of compensation cost
recognized in our financial statements, if any, will be recorded as an increase
to additional paid-in capital when realized. However, if the tax benefit
ultimately realized is less than the amounts recognized in our financial
statements, the difference is first offset against amounts previously recognized
as additional paid-in capital from excess tax deductions from previous
share-based awards. Any remaining shortfall is recognized as tax
expense.
As of
January 31, 2010, we had several share-based compensation plans in effect, which
are described more fully in Note 16.
Loss
Contingencies
We
routinely assess loss contingencies to develop estimates of likelihood and range
of possible settlement. Those contingencies that are deemed to be probable, and
for which the amount of expected loss is reasonably estimable, are accrued in
our accompanying Consolidated Financial Statements. We do not record liabilities
for losses we believe are only reasonably possible to result in an adverse
outcome. See Note 24 for further discussion.
Self-Insurance
We are
self-insured for a portion of our current and prior years’ losses related to
workers’ compensation, general and auto liability insurance programs. We have
stop-loss insurance for individual workers’ compensation and general liability
claims over $500 and auto liability claims over $250. Accrued liabilities for
self-insurance are recorded based on the present value of actuarial estimates of
the amounts of incurred and unpaid losses, based on an estimated risk-free
interest rate of 3.25% as of January 31, 2010. In determining our estimated
liability, management, with the assistance of our actuary, develops assumptions
based on the average historical losses on claims we have incurred, actuarial
observations of historical claim loss development, and our actuary’s estimate of
unpaid losses for each loss category. As of January 31, 2010, our estimated
liability for self-insured workers’ compensation, general and auto liability
losses was $37,228.
Facility
Action Charges
From time
to time, we identify under-performing restaurants that have carrying values in
excess of their fair values and, as a result, we may record an impairment
charge. We may also close or refranchise these or other restaurants and lease or
sublease the restaurant property to a franchisee or to a business other than one
of our restaurant concepts. The following costs that result from these actions
are recorded in our accompanying Consolidated Statements of Income as facility
action charges, net:
(i) impairment
of long-lived assets for under-performing restaurants to be disposed of or held
and used;
(ii) store
closure costs, including sublease of closed facilities at amounts below our
primary lease obligations;
(iii) gain
or loss on the sale of restaurants and refranchising
transactions; and
(iv) amortization
of discount related to estimated liability for closed restaurants.
Considerable
management judgment is necessary to estimate future cash flows, including cash
flows from continuing use, terminal value, closure costs, expected sublease
income and refranchising proceeds. Accordingly, actual results could vary
significantly from our estimates.
(i)
Impairment of Long-Lived Assets
During
the second and fourth quarter of each fiscal year and whenever events or changes
in circumstances indicate that the carrying amount of an asset may not be
recoverable, we review long-lived assets, such as property and equipment and
purchased intangibles subject to amortization, for impairment. Assets
are not deemed to be recoverable if their carrying value is less than the
undiscounted future cash flows that we expect to generate from their
use. Assets that are not deemed to be recoverable are written down to
their estimated fair value. Fair value is typically determined using
discounted cash flows to estimate the price that a franchisee would be expected
to pay for a restaurant and its related assets.
For
purposes of the recoverability analysis, assets are grouped at the lowest level
for which identifiable cash flows are largely independent of the cash flows of
other assets and liabilities, which is generally the individual restaurant level
for fixed assets, capital lease assets and favorable leases. However, intangible
assets, such as trademarks and franchise agreements, are grouped at a higher
level, such as the concept level or franchise operations thereof, since we have
determined such groupings to be the lowest level at which largely independent
cash flows associated with these assets can be identified
61
CKE
RESTAURANTS, INC. AND SUBSIDIARIES
NOTES TO
CONSOLIDATED FINANCIAL STATEMENTS (Continued)
(ii)
Store Closure Costs
We
typically make decisions to close restaurants based on prospects for estimated
future profitability. However, sometimes we are forced to close restaurants due
to circumstances beyond our control (e.g., a landlord’s refusal to negotiate a
new lease). When restaurants continue to perform poorly, we consider a number of
factors, including the demographics of the location and the likelihood of being
able to improve an unprofitable restaurant. Based on the operators’ judgment and
a financial review, we estimate the future cash flows. If we determine that the
restaurant will not, within a reasonable period of time, operate at break-even
cash flow or be profitable, and we are not contractually obligated to continue
operating the restaurant, we may decide to close the restaurant.
The
estimated liability for closed restaurants on properties vacated is based on the
future lease payments and other contractual obligations for such properties
until the lease has been abated. The amount of the estimated liability
established is the present value of these estimated future payments, net of the
present value of expected sublease income. The interest rate used to calculate
the present value of these liabilities is based on an estimated credit-adjusted
risk-free rate at the time the liability is established. The related discount is
amortized and shown in facility action charges, net in our accompanying
Consolidated Statements of Income.
(iii)
Gain or Loss on the Sale of Restaurants
We record
gains and losses on the sale of restaurants as the difference between the net
proceeds received and net carrying values of the net assets of the restaurants
sold.
(iv) Amortization of Discount
Related to Estimated Liability for Closed Restaurants
When we
calculate the present value of the estimated liability for closed restaurants,
we use an interest rate that is based on an estimated credit-adjusted risk-free
rate at the time the liability is established. This estimated credit-adjusted
risk-free rate was 6.0% as of January 31, 2010. We amortize the discount over
the expected term of the lease.
Income
Taxes
Our
current provision for income taxes is based on our estimated taxable income in
each of the jurisdictions in which we operate, after considering the impact on
our taxable income of temporary differences resulting from disparate treatment
of items, such as depreciation, estimated liability for closed restaurants,
estimated liabilities for self-insurance, tax credits and net operating losses
(“NOL”) for tax and financial reporting purposes. Deferred income taxes are
provided for the estimated future income tax effect of temporary differences
between the financial and tax bases of assets and liabilities using the asset
and liability method. Deferred tax assets are also provided for NOL and income
tax credit carryforwards. A valuation allowance to reduce the carrying amount of
deferred income tax assets is established when it is more likely than not that
we will not realize some portion or all of the tax benefit of our deferred
income tax assets. We evaluate, on a quarterly basis, whether it is more likely
than not that our deferred income tax assets are realizable. In performing this
analysis, we consider all available evidence, both positive and negative,
including historical operating results, the estimated timing of future reversals
of existing taxable temporary differences, estimated future taxable income
exclusive of reversing temporary differences and carryforwards and potential tax
planning strategies that may be employed to prevent operating loss or tax credit
carryforwards from expiring unused. Deferred tax assets and liabilities are
measured using enacted tax rates expected to apply to taxable income in the
years in which those temporary differences are expected to be recovered or
settled. The effect on deferred income tax assets and liabilities of a change in
tax rates is recognized in income in the period that includes the enactment
date.
We
maintain a liability for underpayment of income taxes and related interest and
penalties, if any, related to uncertain income tax positions. The tax benefit
from an uncertain tax position is recognized either upon expiration of the
statutory audit period or when it is more likely than not that the position will
be sustained upon examination, including resolutions of any related appeals or
litigation processes, based on the technical merits. Our policy on the
classification of interest and penalties related to the underpayment of income
taxes and uncertain tax positions is to record interest in interest expense, and
to record penalties, if any, in general and administrative expense, in our
accompanying Consolidated Statements of Income. Accrued interest and penalties
are included in our liability for uncertain tax positions.
Income
Per Share
We present basic and diluted income per
common share pursuant to the two-class method. Effective as of the beginning of
fiscal 2010, we adopted the Financial Accounting Standards Board (“FASB”)
authoritative guidance that requires unvested share-based payment awards
containing non-forfeitable rights to dividends to be included as participating
securities in the income per share calculation pursuant to the two-class
method. Our calculations of basic and diluted income per common share
reflect the adoption of this guidance and, accordingly, prior period
calculations have been adjusted retrospectively.
Basic
income per common share represents the income attributable to common
shareholders divided by weighted-average common shares outstanding. Diluted
income per common share represents income attributable to common shareholders
plus the interest and fees relating to any dilutive convertible debt
outstanding, divided by weighted-average common shares outstanding, including
all potentially dilutive securities and excluding all potentially anti-dilutive
securities. The dilutive effect of stock options is determined using the
“treasury stock” method, whereby exercise is assumed at the beginning of the
reporting period and proceeds from such exercise, unamortized compensation on
share-based awards, and excess tax benefits arising in connection with
share-based compensation are assumed to be used to purchase our common stock at
the average market price during the period.
62
CKE
RESTAURANTS, INC. AND SUBSIDIARIES
NOTES TO
CONSOLIDATED FINANCIAL STATEMENTS (Continued)
The table
below presents the computation of basic and diluted income per common share for
fiscal 2010, 2009 and 2008 as follows:
|
2010
|
2009
|
2008
|
||||||||||
|
(In
thousands, except per share amounts)
|
||||||||||||
|
Continuing
Operations:
|
||||||||||||
|
Income
from continuing operations
|
$
|
48,198
|
$
|
36,956
|
$
|
35,072
|
||||||
|
Less:
Distributed and undistributed income from continuing operations
attributable to unvested restricted stock awards
|
(846
|
)
|
(646
|
)
|
(434
|
)
|
||||||
|
Income
from continuing operations attributable to common shareholders for basic
income per common share
|
47,352
|
36,310
|
34,638
|
|||||||||
|
Add:
Interest and amortization costs for 2023 Convertible Notes, net of related
tax effect
|
—
|
292
|
444
|
|||||||||
|
Add:
Undistributed income from continuing operations attributable to unvested
restricted stock awards
|
635
|
430
|
266
|
|||||||||
|
Less:
Undistributed income from continuing operations reallocated to unvested
restricted stock awards
|
(630
|
)
|
(421
|
)
|
(259
|
)
|
||||||
|
Income
from continuing operations attributable to common shareholders for diluted
income per common share
|
$
|
47,357
|
$
|
36,611
|
$
|
35,089
|
||||||
|
Discontinued
Operations:
|
||||||||||||
|
Loss
from discontinued operations
|
$
|
—
|
$
|
—
|
$
|
(3,996
|
)
|
|||||
|
Add:
Loss from discontinued operations attributable to unvested restricted
stock awards
|
—
|
—
|
50
|
|||||||||
|
Loss
from discontinued operations attributable to common shareholders for basic
income per common share
|
—
|
—
|
(3,946
|
)
|
||||||||
|
Less:
Loss from discontinued operations attributable to unvested restricted
stock awards
|
—
|
—
|
(50
|
)
|
||||||||
|
Add:
Loss from discontinued operations reallocated to unvested restricted stock
awards
|
—
|
—
|
48
|
|||||||||
|
Loss
from discontinued operations attributable to common shareholders for
diluted income per common share
|
$
|
—
|
$
|
—
|
$
|
(3,948
|
)
|
|||||
|
Net
Income:
|
||||||||||||
|
Net
income
|
$
|
48,198
|
$
|
36,956
|
$
|
31,076
|
||||||
|
Less:
Distributed and undistributed income attributable to unvested restricted
stock awards
|
(846
|
)
|
(646
|
)
|
(384
|
)
|
||||||
|
Income
attributable to common shareholders for basic income per common
share
|
47,352
|
36,310
|
30,692
|
|||||||||
|
Add:
Interest and amortization costs for 2023 Convertible Notes, net of related
tax effect
|
—
|
292
|
444
|
|||||||||
|
Add:
Undistributed income attributable to unvested restricted stock
awards
|
635
|
430
|
216
|
|||||||||
|
Less:
Undistributed income reallocated to unvested restricted stock
awards
|
(630
|
)
|
(421
|
)
|
(211
|
)
|
||||||
|
Income
attributable to common shareholders for diluted income per common
share
|
$
|
47,357
|
$
|
36,611
|
$
|
31,141
|
||||||
|
Denominator:
|
||||||||||||
|
Weighted-average
shares for computation of basic income per common share
|
53,792
|
52,254
|
59,410
|
|||||||||
|
Dilutive
effect of stock options
|
419
|
637
|
1,249
|
|||||||||
|
Dilutive
effect of 2023 Convertible Notes
|
—
|
1,188
|
1,752
|
|||||||||
|
Weighted-average
shares for computation of diluted income per common share
|
54,211
|
54,079
|
62,411
|
|||||||||
|
Basic
income per common share:
|
||||||||||||
|
Basic
income per common share from continuing operations
|
$
|
0.88
|
$
|
0.69
|
$
|
0.58
|
||||||
|
Basic
loss per share from discontinued operations
|
—
|
—
|
(0.06
|
)
|
||||||||
|
Basic
income per common share
|
$
|
0.88
|
$
|
0.69
|
$
|
0.52
|
||||||
|
Diluted
income per common share:
|
||||||||||||
|
Diluted
income per common share from continuing operations
|
$
|
0.87
|
$
|
0.68
|
$
|
0.56
|
||||||
|
Diluted
loss per share from discontinued operations
|
—
|
—
|
(0.06
|
)
|
||||||||
|
Diluted
income per common share
|
$
|
0.87
|
$
|
0.68
|
$
|
0.50
|
||||||
We
excluded 3,274, 3,018 and 1,289 potentially dilutive shares of our common stock
related to stock options and 992, 949 and 752 potentially dilutive shares of our
common stock related to restricted stock awards, in thousands, from the
computation of diluted income per common share as their effect would have been
anti-dilutive for fiscal 2010, 2009 and 2008, respectively.
63
Derivative
Financial Instruments
We do not
use derivative instruments for trading purposes. Currently our only derivative
instruments are interest rate swap agreements with various
counterparties.
We
recognize all derivative instruments at fair value as either assets or
liabilities on our balance sheet. The fair value of the derivative financial
instruments is determined using valuation models that are based on the net
present value of estimated future cash flows and incorporated market data
inputs. Our interest rate swap agreements are not designated as hedging
instruments. Accordingly, the gain or loss as a result of the change in fair
value is recognized in our results of operations immediately. See Note 10
for a discussion of our use of interest rate swap agreements.
Credit
Risks
Accounts
receivable consists primarily of amounts due from franchisees and licensees for
initial and continuing fees. In addition, we have notes and lease receivables
from certain of our franchisees. The financial condition of these franchisees
and licensees is largely dependent upon the underlying business trends of our
brands. This concentration of credit risk is mitigated, in part, by the large
number of franchisees and licensees of each brand and the short-term nature of
the franchise and license fee receivables.
Credit
risk from our interest rate swap agreements is dependent both on movement in
interest rates and the possibility of non-payment by counterparties. We limit
our credit risk exposure by entering into these agreements with high-quality
counterparties.
Comprehensive
Income
We did
not have any items of other comprehensive income during fiscal 2010, 2009 and
2008.
Segment
Information
Operating
segments are defined as components of an enterprise for which separate financial
information is available that is evaluated regularly by the chief operating
decision maker in deciding how to allocate resources and in assessing
performance. Our segments are determined at the brand level (see
Note 20).
Financial
Statement Misstatement Evaluation
We apply
the provisions of Staff Accounting Bulletin (“SAB”) 108, Considering the Effects of Prior Year Misstatements
when Quantifying Misstatements in Current Year Financial Statements.
SAB 108 provides interpretive guidance on how the effects of the
carryover or reversal of prior year misstatements should be considered in
quantifying a current year misstatement for the purpose of the materiality
assessment.
64
CKE
RESTAURANTS, INC. AND SUBSIDIARIES
NOTES TO
CONSOLIDATED FINANCIAL STATEMENTS (Continued)
Note 2 —
Adopted and Recently Issued Accounting Standards
In June
2009, the FASB issued authoritative guidance on the Accounting Standards
Codification (“ASC” or “Codification”) and the Hierarchy of GAAP which
establishes the Codification as the single source of authoritative guidance for
nongovernmental financial statements prepared in accordance with GAAP, except
for the Securities and Exchange Commission (“SEC”) rules and interpretive
releases, which is also authoritative guidance for SEC registrants. This
guidance is effective for financial statements issued for interim and annual
periods ending after September 15, 2009 and supersedes existing non-SEC
accounting and reporting standards. We adopted the Codification during the
quarter ended November 2, 2009, and there was no impact on our consolidated
financial statements other than the removal of specific references to GAAP
accounting pronouncements.
In
September 2006, the FASB issued authoritative guidance for fair value
measurements and disclosures which defines fair value, establishes a framework
for measuring fair value and expands disclosures related to assets and
liabilities measured at fair value. In February 2008, the FASB issued additional
authoritative guidance which delayed the effective date for fair value
measurements to fiscal years beginning after November 15, 2008 for all
nonfinancial assets and nonfinancial liabilities that are recognized or
disclosed at fair value in the financial statements on a nonrecurring basis. We
adopted all provisions of the authoritative guidance as of the beginning of
fiscal 2009 except for the guidance applicable to non-recurring nonfinancial
assets and nonfinancial liabilities. As of the beginning of fiscal 2010, we
adopted the remaining provisions of the authoritative guidance and there was no
material impact on our consolidated financial position or results of
operations.
In
December 2007, the FASB issued revised authoritative guidance for business
combinations which establishes principles and requirements for how an acquirer
in a business combination transaction recognizes and measures in its financial
statements the identifiable assets acquired, the liabilities assumed, and any
noncontrolling interest in the acquiree at the acquisition date. The provisions
of the guidance also establish disclosure requirements which will enable
financial statement users to evaluate the nature and financial effects of the
business combination. In April 2009, the FASB issued additional authoritative
guidance for business combinations relating to the initial recognition and
measurement, subsequent measurement and accounting and disclosures of assets and
liabilities that arise from contingencies in a business combination. The
effective date of the authoritative guidance is for fiscal years beginning after
December 15, 2008. We adopted the provisions of the authoritative guidance as of
the beginning of fiscal 2010 and there was no material impact on our
consolidated financial position or results of operations.
In March
2008, the FASB issued authoritative guidance for derivatives and hedging which
requires companies with derivative instruments to disclose information that
should enable financial statement users to understand how and why a company uses
derivative instruments, how derivative instruments and related hedged items are
accounted for under the guidance, and how derivative instruments and related
hedged items affect a company’s financial position, financial performance and
cash flows. This guidance is effective for fiscal years and interim periods
beginning after November 15, 2008. We adopted the authoritative guidance as of
the beginning of fiscal 2010 and provided the required expanded disclosures (see
Notes 3 and 10).
In June
2008, the FASB issued authoritative guidance for earnings per share. The
guidance addresses whether instruments granted in share-based payment
transactions may be participating securities prior to vesting and, therefore,
need to be included in the earnings allocation in computing basic earnings per
share pursuant to the two-class method. This guidance is effective for financial
statements issued for fiscal years beginning after December 15, 2008 and interim
periods within those years. We adopted the authoritative guidance as of the
beginning of fiscal 2010 and presented income per share for the current and
prior periods in accordance with the authoritative guidance (see Note
1).
In May
2009, and subsequently amended in February 2010, the FASB issued authoritative
guidance for subsequent events, which provides rules on recognition and
disclosure for events and transactions occurring after the balance sheet date
but before the financial statements are issued or available to be issued. This
guidance is effective for interim and annual periods ending after June 15, 2009.
We adopted the authoritative guidance during the quarter ended August 10,
2009.
65
CKE
RESTAURANTS, INC. AND SUBSIDIARIES
NOTES TO
CONSOLIDATED FINANCIAL STATEMENTS (Continued)
In June
2009, the FASB issued authoritative guidance that changes how a reporting entity
determines when an entity that is insufficiently capitalized or is not
controlled through voting (or similar rights) should be consolidated and
requires companies to more frequently assess whether they must consolidate VIEs.
The determination of whether a reporting entity is required to consolidate
another entity is based on, among other things, the other entity’s purpose and
design and the reporting entity’s ability to direct the activities that most
significantly impact the other entity’s economic performance. The provisions are
effective for annual periods beginning after November 15, 2009, which for us is
fiscal 2011. We have not yet evaluated the impact of adopting the requirements
of the authoritative guidance on our consolidated financial position or results
of operations.
In
January 2010, the FASB issued new guidance on the disclosure requirements for
fair value measurements and provided clarification of the existing disclosure
requirements. This guidance requires separate disclosures for significant
transfers in and out of Level 1 and 2 fair value measurements and the reasons
for the transfers. In the reconciliation for Level 3 fair value
measurements, the new guidance requires separate disclosures for purchases,
sales, issuances, and settlements on a gross basis. This guidance revises
the existing disclosure requirements to provide an increased level of
disaggregation for classes of assets and liabilities measured at fair value, and
require disclosures about the valuation techniques and inputs for fair value
measurements using Level 2 and Level 3 inputs. This guidance is
effective for interim and annual reporting periods beginning after December 15,
2009, except for the disclosures about purchases, sales, issuances, and
settlements in the roll forward of activity in Level 3 fair value measurements,
which are effective for interim and annual reporting periods beginning after
December 15, 2010. We have not yet evaluated the impact of adopting the
requirements of the authoritative guidance on our consolidated financial
position or results of operations.
Note 3 —
Fair Value Measurements
The
following table presents information on our financial instruments as of January
31, 2010 and 2009:
|
2010
|
2009
|
|||||||||||||||
|
Carrying
Amount
|
Estimated
Fair
Value
|
Carrying
Amount
|
Estimated
Fair
Value
|
|||||||||||||
|
Financial
assets:
|
||||||||||||||||
|
Cash
and cash equivalents
|
$ | 18,246 | $ | 18,246 | $ | 17,869 | $ | 17,869 | ||||||||
| Notes receivable | 2,183 | 2,534 | 5,406 | 5,171 | ||||||||||||
| Financial liabilities: | ||||||||||||||||
| Long-term debt and bank indebtedness, including current portion | 278,464 | 250,798 | 314,788 | 269,186 | ||||||||||||
The fair
value of cash and cash equivalents approximates its carrying amount due to its
short maturity. The estimated fair value of notes receivable was determined by
discounting future cash flows using current rates at which similar loans might
be made to borrowers with similar credit ratings. The estimated fair
value of long-term debt was determined by discounting future cash flows using
rates currently available to us for debt with similar terms and remaining
maturities.
Fair
value is defined as the exchange price that would be received for an asset or
paid to transfer a liability (an exit price) in the principal or most
advantageous market for the asset or liability in an orderly transaction between
market participants on the measurement date. Entities are required to
maximize the use of observable inputs and minimize the use of unobservable
inputs when measuring fair value based on the following fair value
hierarchy:
|
Level 1 -
|
Quoted
prices in active markets for identical assets or
liabilities;
|
|
Level 2 -
|
Observable
inputs other than Level 1 prices, such as quoted prices for similar assets
or liabilities; quoted prices in markets that are not active; or other
inputs that are observable or can be corroborated by observable market
data for substantially the full term of the assets or liabilities;
and
|
|
Level 3 -
|
Unobservable
inputs that are supported by little or no market activity and that are
significant to the fair value of the assets or
liabilities.
|
66
CKE
RESTAURANTS, INC. AND SUBSIDIARIES
NOTES TO
CONSOLIDATED FINANCIAL STATEMENTS (Continued)
The
following table summarizes the financial assets and liabilities measured at fair
value on a recurring basis as of January 31, 2010 and 2009:
|
Level
|
2010
|
2009
|
||||||||||
|
Interest
rate swap agreements
|
2 | $ | 15,482 | $ | 17,590 | |||||||
The
interest rate swap agreements are recorded at fair value based upon valuation
models which utilize relevant factors such as the contractual terms of our
interest rate swap agreements, credit spreads for the contracting parties and
interest rate curves.
The
following table presents the fair values for those assets and liabilities
measured at fair value during fiscal 2010 on a non-recurring basis, and
remaining on our Consolidated Balance Sheet as of January 31,
2010. Total losses include losses recognized from all non-recurring
fair value measurements during fiscal 2010:
|
Total
|
Level
1
|
Level
2
|
Level
3
|
Total
losses
|
||||||||||||||||
|
Long-lived
assets held and used
|
$ | 36 | $ | — | $ | — | $ | 36 | $ | 3,480 | ||||||||||
The fair
value of long-lived assets held and used, is typically determined using
discounted cash flows to estimate the price that a franchisee would be expected
to pay for a restaurant and its related assets. See Note 1 for further
discussion.
Note 4 —
Accounts Receivable, Net and Notes Receivable, Net
Accounts
receivable, net, as of January 31, 2010 and 2009 consisted of the
following:
|
2010
|
2009
|
|||||||
|
Trade
receivables
|
$
|
26,676
|
$
|
34,888
|
||||
|
Income
taxes receivable
|
7,259
|
4,231
|
||||||
|
Notes
receivable, current portion
|
1,263
|
2,217
|
||||||
|
Other
|
176
|
122
|
||||||
|
Allowance
for doubtful accounts
|
(358
|
)
|
(720
|
)
|
||||
|
$
|
35,016
|
$
|
40,738
|
|||||
The
long-term portion of notes receivable, net, as of January 31, 2010 and 2009
consisted of the following:
|
2010
|
2009
|
|||||||
|
Franchisees
|
$ | 379 | $ | 676 | ||||
|
Other
|
1,075 | 3,112 | ||||||
|
Allowance
for doubtful accounts
|
(379 | ) | (529 | ) | ||||
| $ | 1,075 | $ | 3,259 | |||||
The
following table summarizes the activity in the allowances for doubtful accounts
for fiscal 2008, 2009 and 2010:
|
Accounts
Receivable
|
Notes
Receivable
|
Total
|
||||||||||
|
Balance
as of January 31, 2007
|
$
|
821
|
$
|
2,786
|
$
|
3,607
|
||||||
|
Recovery
of provision
|
(24
|
)
|
(1,170
|
)
|
(1,194
|
)
|
||||||
|
Charge-offs
|
(42
|
)
|
(1,008
|
)
|
(1,050
|
)
|
||||||
|
Balance
as of January 31, 2008
|
755
|
608
|
1,363
|
|||||||||
|
Provision
|
272
|
53
|
325
|
|||||||||
|
Charge-offs
|
(307
|
)
|
(132
|
)
|
(439
|
)
|
||||||
|
Balance
as of January 31, 2009
|
720
|
529
|
1,249
|
|||||||||
|
Recovery
of provision
|
(62
|
)
|
(150
|
)
|
(212
|
)
|
||||||
|
Charge-offs
|
(300
|
)
|
—
|
(300
|
)
|
|||||||
|
Balance
as of January 31, 2010
|
$
|
358
|
$
|
379
|
$
|
737
|
||||||
67
CKE
RESTAURANTS, INC. AND SUBSIDIARIES
NOTES TO
CONSOLIDATED FINANCIAL STATEMENTS (Continued)
Note 5 —
Property and Equipment, Net
Property
and equipment, net, consisted of the following as of January 31, 2010 and
2009:
|
Estimated
Useful
Life
|
2010
|
2009
|
||||||||
|
Land
|
$
|
126,366
|
$
|
124,492
|
||||||
|
Leasehold
improvements
|
3-25 years
|
211,410
|
202,598
|
|||||||
|
Buildings
and improvements
|
3-40 years
|
368,448
|
340,777
|
|||||||
|
Equipment,
furniture and fixtures
|
3-10 years
|
307,143
|
296,278
|
|||||||
|
1,013,367
|
964,145
|
|||||||||
|
Less
accumulated depreciation and amortization
|
(445,033
|
)
|
(420,375
|
)
|
||||||
|
$
|
568,334
|
$
|
543,770
|
|||||||
During
fiscal 2010, 2009 and 2008, we capitalized interest costs in the amounts of
$766, $1,294 and $2,059, respectively.
Note 6
— Purchase and Sale of Assets
Hardees’s
Refranchising Program
During
fiscal 2009, we completed our refranchising program for our Hardee’s concept.
The following table summarizes the sale of company-operated Hardee’s restaurants
to franchisees and the related impact on our consolidated financial statements
for fiscal 2009 and 2008:
|
2009
|
2008
|
|||||||
| Number of franchisees | 6 | 7 | ||||||
|
Company-operated
restaurants sold
|
102
|
136
|
||||||
|
Net
book value of restaurants sold
|
$
|
14,454
|
$
|
46,328
|
||||
|
Net
proceeds
|
16,979
|
53,009
|
||||||
|
Initial
franchise fees received
|
2,640
|
2,735
|
||||||
|
Net
(loss) gain from refranchising
|
(2,036
|
)
|
2,457
|
|||||
As part
of these transactions, the franchisees acquired the real property and/or
subleasehold interest in real property related to the restaurant
locations. Initial franchise fees received from franchisees are
included in franchised and licensed restaurants and other revenue, and net
(loss) gain from refranchising is included in facility action charges, net, in
our accompanying Consolidated Statements of Income, in our Hardee’s
segment.
Related
Party Transactions
During
fiscal 2010, we sold three company-operated Carl’s Jr. restaurants and related
real property with a net book value of $965 to a former executive and new
franchisee. In connection with this transaction, we received aggregate
consideration of $1,300, including $100 in initial franchise fees, which is
included in franchised and licensed restaurants and other revenue, and we
recognized a net gain of $233, which is included in facility action charges,
net, in our accompanying Consolidated Statement of Income for fiscal 2010, in
our Carl’s Jr. segment. As part of this transaction, the franchisee acquired the
real property and/or subleasehold interest in the real property related to the
restaurant locations.
During
fiscal 2009, we sold three company-operated Carl’s Jr. restaurants and related
real property with a net book value of $1,068 to two former executives and new
franchisee. In connection with this transaction, we received aggregate
consideration of $2,173, including $100 in initial franchise fees, which is
included in franchised and licensed restaurants and other revenue, and we
recognized a net gain of $983, which is included in facility action charges,
net, in our accompanying Consolidated Statement of Income for fiscal 2009, in
our Carl’s Jr. segment. As part of this transaction, the franchisee acquired the
real property and/or subleasehold interest in the real property related to the
restaurant locations.
During
fiscal 2009, we purchased the lease rights for a restaurant property, including
the right to purchase the underlying land for an amount substantially below its
fair value, and the building constructed on the leased land from a Trust, which
is a related party of a member of our Board of Directors. In connection
with this transaction, we paid aggregate consideration of $1,868, recorded
the building at its estimated fair market value of $100, and included the
remaining $1,768 in land, in property and equipment, net in our accompanying
Consolidated Balance Sheet, as of January 31, 2009. During fiscal 2010, we
exercised the lease’s bargain purchase option and paid $160 to acquire the
land.
68
CKE
RESTAURANTS, INC. AND SUBSIDIARIES
NOTES TO
CONSOLIDATED FINANCIAL STATEMENTS (Continued)
Purchase
of Restaurant Assets.
During
fiscal 2010, we purchased two Carl’s Jr. restaurants from two of our franchisees
for $1,041. As a result of these transactions, we recorded inventories of $15,
property and equipment of $122, identifiable intangible assets of $3, and
goodwill of $901 in our Carl’s Jr. segment.
During
fiscal 2009, we purchased five Hardee’s restaurants from one of our franchisees
for $3,477, net of cash acquired. As a result of this transaction, we recorded
inventories of $38, property and equipment of $2,348, identifiable intangible
assets of $52 and goodwill of $1,039.
Note 7 —
Leases
We occupy
land and buildings under lease agreements expiring on various dates through
fiscal 2036. Many leases provide for future rent escalations and renewal
options. In addition, contingent rentals, determined as a percentage of revenue
in excess of specified levels, are often required. Most leases obligate us to
pay costs of maintenance, insurance and property taxes.
Property
under capital leases, net, consisted of the following as of January 31, 2010 and
2009:
|
2010
|
2009
|
|||||||
| Buildings | $ | 60,435 | $ | 66,999 | ||||
|
Equipment
|
18,234
|
4,745
|
||||||
|
78,669
|
71,744
|
|||||||
|
Less
accumulated amortization
|
(46,090
|
)
|
(48,341
|
)
|
||||
|
$
|
32,579
|
$
|
23,403
|
|||||
Amortization
of property under capital leases is included with depreciation expense. We
sublease to our franchisees some of our property under capital leases. These
assets are recorded as lease receivables and are included in other current
assets and other assets instead of property under capital leases.
Net
leases receivable consisted of the following, as of January 31, 2010 and
2009:
|
2010
|
2009
|
|||||||
|
Lease
payments receivable
|
$
|
3,778
|
$
|
3,420
|
||||
|
Less:
unearned income
|
(1,284
|
)
|
(1,250
|
)
|
||||
|
2,494
|
2,170
|
|||||||
|
Less:
leases receivable in other current assets
|
(175
|
)
|
(123
|
)
|
||||
|
Net
leases receivable in other assets, net
|
$
|
2,319
|
$
|
2,047
|
||||
We have
leased and subleased land and buildings to others, primarily as a result of the
refranchising of certain restaurants. Many of these leases provide for fixed
payments, while others provide for contingent rent when revenue exceeds certain
levels, or for monthly rentals based on a percentage of revenue. Lessees
generally bear the cost of maintenance, insurance and property taxes. The
carrying value of assets leased to others as of January 31, 2010 and 2009 was as
follows:
|
2010
|
2009
|
|||||||
|
Land
|
$
|
17,962
|
$
|
18,231
|
||||
|
Leasehold
improvements
|
5,811
|
5,477
|
||||||
|
Buildings
and improvements
|
25,161
|
26,017
|
||||||
|
Equipment,
furniture and fixtures
|
1,298
|
975
|
||||||
|
50,232
|
50,700
|
|||||||
|
Less
accumulated depreciation and amortization
|
(17,977
|
)
|
(17,511
|
)
|
||||
|
$
|
32,255
|
$
|
33,189
|
|||||
69
CKE
RESTAURANTS, INC. AND SUBSIDIARIES
NOTES TO
CONSOLIDATED FINANCIAL STATEMENTS (Continued)
Minimum
lease payments for all leases, including those in the estimated liability for
closed restaurants, and the present value of net minimum lease payments for
capital leases as of January 31, 2010 are as follows:
|
Capital
|
Operating
|
|||||||
|
Fiscal:
|
||||||||
|
2011
|
$
|
12,265
|
$
|
88,402
|
||||
|
2012
|
11,379
|
79,165
|
||||||
|
2013
|
10,409
|
71,217
|
||||||
|
2014
|
8,642
|
65,881
|
||||||
|
2015
|
6,733
|
57,477
|
||||||
|
Thereafter
|
22,094
|
302,426
|
||||||
|
Total
minimum lease payments
|
71,522
|
$
|
664,568
|
|||||
|
Less
amount representing interest
|
(20,978
|
)
|
||||||
|
Present
value of minimum lease payments (interest rates primarily ranging from 6%
to 14%)
|
50,544
|
|||||||
|
Less
current portion
|
(7,445
|
)
|
||||||
|
Capital
lease obligations, excluding current portion
|
$
|
43,099
|
||||||
Total
minimum lease payments have not been reduced for future minimum sublease rentals
expected to be received. As of January 31, 2010, future minimum lease and
sublease rental revenue expected to be received including amounts reducing the
estimated liability for closed restaurants but not including contingent rentals
(which may be received under certain leases), are as follows:
|
Capital
Subleases
|
Operating
Leases
or
Subleases
|
|||||||
|
Fiscal:
|
||||||||
|
2011
|
$
|
352
|
$
|
31,468
|
||||
|
2012
|
352
|
26,610
|
||||||
|
2013
|
352
|
22,909
|
||||||
|
2014
|
363
|
20,106
|
||||||
|
2015
|
263
|
15,904
|
||||||
|
Thereafter
|
2,096
|
75,250
|
||||||
|
Total
future minimum rentals
|
$
|
3,778
|
$
|
192,247
|
||||
Net rent
expense under non-cancelable operating leases for fiscal 2010, 2009 and 2008
were as follows:
|
2010
|
2009
|
2008
|
||||||||||
|
Minimum
rentals
|
$ | 86,460 | $ | 84,723 | $ | 81,894 | ||||||
|
Contingent
rentals
|
4,718
|
5,498
|
5,703
|
|||||||||
|
Gross
rent expense
|
91,178
|
90,221
|
87,597
|
|||||||||
|
Less
minimum sublease rentals
|
(32,401
|
)
|
(31,969
|
)
|
(28,606
|
)
|
||||||
|
Less
contingent sublease rentals
|
(3,476
|
)
|
(3,350
|
)
|
(3,407
|
)
|
||||||
|
$
|
55,301
|
$
|
54,902
|
$
|
55,584
|
|||||||
During
fiscal 2002, we entered into certain sale leaseback transactions relating to
restaurant properties we currently operate through which we generated net gains
of $5,158. The net gains from such transactions were deferred and are being
amortized as a reduction to occupancy and other operating costs over the terms
of the leases. During fiscal 2010, 2009 and 2008, we recognized gains of $336,
$342, and $339, respectively.
70
CKE
RESTAURANTS, INC. AND SUBSIDIARIES
NOTES TO
CONSOLIDATED FINANCIAL STATEMENTS (Continued)
Note 8 —
Intangible Assets, Net
As of
January 31, 2010 and 2009, intangible assets with finite useful lives were
primarily comprised of intangible assets obtained through our acquisition of
Santa Barbara Restaurant Group, Inc. (“SBRG”) in fiscal 2003 and our
Hardee’s acquisition transactions in fiscal 1999 and 1998. We amortize these
assets on the straight-line basis over amortization periods ranging from 11 to
43 years.
The table
below presents identifiable, definite-lived intangible assets as of January 31,
2010 and 2009:
|
Weighted-
|
January
31, 2010
|
January 31,
2009
|
||||||||||||||||||||||||||
|
Average
|
Gross
|
Net
|
Gross
|
Net
|
||||||||||||||||||||||||
|
Average
Life
|
Carrying
|
Accumulated
|
Carrying
|
Carrying
|
Accumulated
|
Carrying
|
||||||||||||||||||||||
|
Intangible
Asset
|
(Years)
|
Amount
|
Amortization
|
Amount
|
Amount
|
Amortization
|
Amount
|
|||||||||||||||||||||
|
Trademarks
|
20
|
$
|
3,166
|
$
|
(1,251
|
)
|
$
|
1,915
|
$
|
3,166
|
$
|
(1,093
|
)
|
$
|
2,073
|
|||||||||||||
|
Favorable
lease agreements
|
22
|
1,076
|
(756
|
)
|
320
|
1,089
|
(706
|
)
|
383
|
|||||||||||||||||||
|
Franchise
agreements and other
|
11
|
90
|
(8
|
)
|
82
|
52
|
—
|
52
|
||||||||||||||||||||
|
$
|
4,332
|
$
|
(2,015
|
)
|
$
|
2,317
|
$
|
4,307
|
$
|
(1,799
|
)
|
$
|
2,508
|
|||||||||||||||
Amortization
expense related to these intangible assets for fiscal 2010, 2009 and 2008 was
$216, $225 and $213, respectively. For fiscal 2011 through 2012,
amortization expense is expected to be $228 annually. For fiscal 2013, 2014 and
2015 amortization expense is expected to be $220, $208 and $196,
respectively.
Note 9 —
Other Current Liabilities
Other
current liabilities as of January 31, 2010 and 2009 consisted of the
following:
|
2010
|
2009
|
|||||||
|
Salaries,
wages and other benefits
|
$
|
33,066
|
$
|
30,094
|
||||
|
Estimated
liability for self-insurance, current portion
|
10,876
|
10,547
|
||||||
|
Interest
rate swaps, current portion
|
8,542
|
7,234
|
||||||
|
State
sales taxes
|
5,481
|
5,643
|
||||||
|
Accrued
property taxes
|
5,057
|
5,070
|
||||||
|
Accrued
utilities
|
4,011
|
3,670
|
||||||
|
Estimated
liability for closed restaurants, current portion
|
2,924
|
3,367
|
||||||
|
Accrued
interest
|
337
|
415
|
||||||
|
Estimated
liability for litigation
|
225
|
215
|
||||||
|
Other
accrued liabilities
|
25,086
|
25,510
|
||||||
|
$
|
95,605
|
$
|
91,765
|
|||||
Note 10 —
Long-Term Debt and Bank Indebtedness
Long-term
debt and bank indebtedness as of January 31, 2010 and 2009 consisted of the
following:
|
2010
|
2009
|
|||||||
|
Borrowings
under revolving portion of our Facility
|
$
|
30,000
|
$
|
62,000
|
||||
|
Term
loan under our Facility
|
247,432
|
251,735
|
||||||
|
Other
long-term debt
|
1,032
|
1,053
|
||||||
|
278,464
|
314,788
|
|||||||
|
Less
current portion
|
(12,262
|
)
|
(4,341
|
)
|
||||
|
$
|
266,202
|
$
|
310,447
|
|||||
Interest
expense for fiscal 2010, 2009 and 2008 consisted of the following:
|
2010
|
2009
|
2008
|
||||||||||
| Facility | $ | 5,174 | $ | 12,580 | $ | 14,093 | ||||||
|
Change
in fair value of interest rate swap agreements
|
6,803
|
9,010
|
11,380
|
|||||||||
|
Capital
lease obligations
|
5,380
|
4,546
|
5,074
|
|||||||||
|
2023
Convertible Notes, interest at 4%
|
—
|
404
|
608
|
|||||||||
|
Amortization
of deferred loan fees
|
1,016
|
1,081
|
918
|
|||||||||
|
Letter
of credit fees and other
|
881
|
988
|
960
|
|||||||||
|
Total
interest expense
|
$
|
19,254
|
$
|
28,609
|
$
|
33,033
|
||||||
71
CKE
RESTAURANTS, INC. AND SUBSIDIARIES
NOTES TO
CONSOLIDATED FINANCIAL STATEMENTS (Continued)
Our
senior credit facility (“Facility”) provides for a $470,000 senior secured
credit facility consisting of a $200,000 revolving credit facility and a
$270,000 term loan. The revolving credit facility matures on March 27,
2012, and includes an $85,000 letter of credit sub-facility. During the first
quarter of fiscal 2011, we expect to make a principal payment of
$10,301 on the term loan portion of our Facility, which includes a payment of
$9,630 based on excess cash flows for fiscal 2010, as required by the terms
of our Facility. Accordingly, this amount has been included in the current
portion of bank indebtedness and other long-term debt in our accompanying
Consolidated Balance Sheet as of January 31, 2010. The remaining principal
amount of the term loan is scheduled to be repaid in quarterly installments of
$645 through January 1, 2012, three quarterly payments of $61,274,
beginning on April 1, 2012, and a final payment of $48,794 due on
January 1, 2013.
During
fiscal 2010, we made $4,303 of regularly scheduled principal payments on the
term loan, including a payment of $1,616 based on excess cash flows for fiscal
2009, as required by the terms of our Facility. As of January 31, 2010, we
had (i) borrowings outstanding under the term loan portion of our Facility
of $247,432, (ii) borrowings outstanding under the revolving portion of our
Facility of $30,000, (iii) outstanding letters of credit under the
revolving portion of our Facility of $35,363, and (iv) availability under
the revolving portion of our Facility of $134,637. If the Merger is consummated,
all amounts outstanding under the Facility will be repaid at or prior to
closing.
As of
January 31, 2010, the applicable interest rate on the term loan was the London
Inter Bank Offering Rate (“LIBOR”) plus 1.38% per annum. Our outstanding
borrowings under the revolving loan portion of our Facility bore interest at
rates that were locked in for fixed terms of approximately 30 days, at LIBOR
plus 1.50%, per annum, at January 31, 2010, and 2009. As of January 31, 2010 and
2009, borrowings under the revolving loan bore interest at weighted-average
rates of 1.75% and 1.93% per annum, respectively. We also incur fees on
outstanding letters of credit under our Facility at a per annum rate equal to
1.50% times the stated amounts.
We have
fixed rate swap agreements with various counterparties to effectively fix future
interest payments on $200,000 of our term loan debt at 6.12%. These agreements
will expire on March 12, 2012. These derivative instruments were not
designated as cash flow hedges at inception. Accordingly, the change in the fair
value of the interest rate swap agreements is recognized in interest expense in
our accompanying Consolidated Statements of Income. We recorded interest expense
under the swaps of $6,803, $9,010 and $11,380 during fiscal 2010, 2009 and 2008,
respectively, to adjust the carrying value of the interest rate swap agreements
to fair value. During fiscal 2010 and 2009, we paid $8,912 and $2,800,
respectively, for net settlements under our fixed rate swap agreements. As
a matter of policy, we do not enter into derivative instruments unless there is
an underlying exposure.
The
following table identifies our derivative instruments and their location in our
accompanying Consolidated Balance Sheets:
|
|
January
31, 2010
|
January
31, 2009
|
|||||||||
|
Balance
Sheet Location
|
Fair
Value
|
Balance
Sheet Location
|
Fair
Value
|
||||||||
|
Derivatives
not designated as hedging instruments:
|
|||||||||||
|
Interest
rate swap agreements
|
Other
current liabilities
|
$ | 8,542 |
Other
current liabilities
|
$ | 7,234 | |||||
|
Interest
rate swap agreements
|
Other
long-term liabilities
|
6,940 |
Other
long-term liabilities
|
10,356 | |||||||
| $ | 15,482 | $ | 17,590 | ||||||||
The terms
of our Facility include financial performance covenants, which include a maximum
leverage ratio, and certain restrictive covenants. The maximum leverage covenant
requires us to maintain a leverage ratio not to exceed 2.75, 2.50 and 2.25 in
fiscal 2010, 2011 and 2012, respectively. As of January 31, 2010, our
leverage ratio was 2.10. Our most significant restrictive covenants limit our
ability to incur debt, incur liens on our assets, make any significant change in
our corporate structure or the nature of our business, prepay certain debt,
engage in a change of control transaction without the member banks’ consents and
make investments or acquisitions. If the Merger is consummated, it would
constitute a change of control for purposes of the Facility. However,
in connection with the consummation of the Merger, all amounts outstanding
under the Facility will be repaid in full and the Facility will be terminated.
Our Facility is collateralized by a lien on all of our personal property assets
and liens on certain restaurant properties.
Our
Facility permits us to spend an aggregate of $369,883 to repurchase our common
stock and/or pay cash dividends, of which $58,074 remains for additional common
stock repurchases and/or cash dividend payments, as of January 31, 2010. The
aggregate amount allowed for common stock repurchases and/or cash dividend
payments is increased each year by a portion of excess cash flows (as defined in
our Facility). In addition to being limited by our Facility, our ability to
repurchase common stock is limited by our Board of Directors’ authorization and
the amount of cumulative repurchases of our common stock that we have already
made thereunder. As of January 31, 2010, we are permitted to make additional
repurchases of our common stock up to $36,875 under the Stock Repurchase Plan.
In accordance with the terms of the Merger Agreement, we are restricted from
certain repurchases of our common stock.
72
CKE
RESTAURANTS, INC. AND SUBSIDIARIES
NOTES TO
CONSOLIDATED FINANCIAL STATEMENTS (Continued)
Our
Facility permits us to make annual capital expenditures in the amount of
$85,000, plus 80% of the amount of actual Adjusted EBITDA (as defined in our
Facility) in excess of $150,000. In addition, we may reinvest proceeds from the
sale of assets and carry forward certain unused capital expenditure amounts to
the following year.
The full
text of the contractual requirements imposed by our Facility is set forth in the
Seventh Amended and Restated Credit Agreement, dated as of March 27, 2007,
and the amendments thereto, which we have filed with the Securities and Exchange
Commission, and in the ancillary loan documents described therein. Subject to
cure periods in certain instances, the lenders under our Facility may demand
repayment of borrowings prior to stated maturity upon certain events of default,
including, but not limited to, if we breach the terms of the agreement, suffer a
material adverse change, engage in a change of control transaction, suffer
certain adverse legal judgments, in the event of specified events of insolvency
or if we default on other significant obligations.
Long-term
debt matures as follows:
|
Fiscal:
|
||||
| 2011 | $ | 12,262 | ||
|
2012
|
2,609
|
|||
|
2013
|
262,650
|
|||
|
2014
|
34
|
|||
|
2015
|
37
|
|||
|
Thereafter
|
872
|
|||
|
$
|
278,464
|
|||
Note 11 —
Other Long-Term Liabilities
Other
long-term liabilities as of January 31, 2010 and 2009 consisted of the
following:
|
2010
|
2009
|
|||||||
|
Estimated
liability for self-insurance
|
$ | 26,352 | $ | 26,425 | ||||
|
Estimated
liability for deferred rent
|
14,767
|
13,620
|
||||||
|
Interest
rate swaps
|
6,940
|
10,356
|
||||||
|
Estimated
liability for closed restaurants
|
4,349
|
6,233
|
||||||
|
Other
|
26,396
|
27,319
|
||||||
|
$
|
78,804
|
$
|
83,953
|
|||||
We are
self-insured for our primary workers’ compensation, general and auto liability
insurance exposures not covered by our stop-loss policy. A total of $37,228 and
$36,972 was accrued as of January 31, 2010 and 2009, respectively (including the
long-term portions noted in the above table and the current portions included in
other current liabilities, as discussed in Note 9). See Note 1 for
further discussion regarding our estimation process.
Note 12 —
Stockholders’ Equity
Common
Stock Repurchases
Pursuant
to a program (“Stock Repurchase Plan”) authorized by our Board of Directors, we
are allowed to repurchase up to an aggregate of $400,000 of our common
stock.
The
following table summarizes the repurchase of shares of common stock for fiscal
2010:
| Shares repurchased | 191,062 | |||
|
Average
price per share
|
$
|
9.02
|
||
|
Total
cost, including trading commissions
|
$
|
1,724
|
||
|
Shares
retired
|
191,062
|
73
CKE
RESTAURANTS, INC. AND SUBSIDIARIES
NOTES TO
CONSOLIDATED FINANCIAL STATEMENTS (Continued)
Based on
our Board of Directors’ authorization and the amount of cumulative repurchases
of our common stock that we have already made thereunder (21,933,283 shares
at an average price of $16.56 per share, for a total cost, including trading
commissions, of $363,125), we are permitted to make additional repurchases of
our common stock up to $36,875 under the Stock Repurchase Plan as of January 31,
2010. In accordance with the terms of the Merger Agreement, we are restricted
from certain repurchases of our common stock.
During
fiscal 2010, we declared cash dividends of $0.24 per share of common stock, for
a total of $13,178. Dividends payable of $3,317 and $3,279 have been included in
other current liabilities in our accompanying Consolidated Balance Sheets as of
January 31, 2010 and 2009, respectively. The dividends declared during the
quarter ended January 31, 2010 were subsequently paid on February 16, 2010.
In accordance with the terms of the Merger Agreement, our ability to
declare dividends is restricted.
Stockholder Rights
Plan
During
fiscal 2009, our Board of Directors approved the adoption of a Stockholder
Rights Plan and declared a dividend distribution of one right (“Right”) for each
outstanding share of our common stock to stockholders of record as of the close
of business on January 7, 2009. The Rights were distributed as a
non-taxable distribution. Each Right entitled the registered holder
to purchase from us a unit consisting of one one-hundredth of a share (“Unit”)
of Series A Junior Participating Preferred Stock, $0.01 par value (“Series A
Preferred Stock”), at a purchase price of $40.00 per Unit, subject to
adjustment. As of December 31, 2009, the Rights expired, and the
Stockholder Rights Plan was effectively terminated.
Note 13 —
Franchised and Licensed Operations
Franchise
arrangements generally provide for initial fees and continuing royalty payments
to us based upon a percentage of revenue. We generally charge an initial
franchise fee for each new franchised restaurant that is added to our system,
and in some cases, an area development fee, which grants exclusive rights to
develop a specified number of restaurants in a designated geographic area within
a specified time period. Similar fees are charged in connection with our
international licensing operations. These fees are recognized ratably when
substantially all the services required of us are complete and the restaurants
covered by these agreements commence operations.
Certain
franchisees also purchase food, packaging, supplies and equipment from us.
Additionally, franchisees may be obligated to remit lease payments for the use
of restaurant facilities owned or leased by us, generally for periods up to
20 years. Under the terms of these leases, franchisees are generally
required to pay related occupancy costs, which include maintenance, insurance
and property taxes.
Franchised
and licensed restaurants and other revenue for fiscal 2010, 2009 and 2008
consisted of the following:
|
2010
|
2009
|
2008
|
||||||||||
|
Royalties
|
$
|
84,447
|
$
|
83,600
|
$
|
75,690
|
||||||
|
Distribution
center — food, packaging and supplies
|
192,188
|
204,834
|
195,144
|
|||||||||
|
Distribution
center — equipment
|
21,630
|
23,646
|
24,297
|
|||||||||
|
Rent
|
33,596
|
33,625
|
29,659
|
|||||||||
|
Franchise
fees and other
|
2,398
|
5,693
|
8,267
|
|||||||||
|
$
|
334,259
|
$
|
351,398
|
$
|
333,057
|
|||||||
Franchised
and licensed restaurants and other expenses for fiscal 2010, 2009 and 2008
consisted of the following:
|
2010
|
2009
|
2008
|
||||||||||
|
Distribution
center — food, packaging and supplies
|
$
|
189,346
|
$
|
203,898
|
$
|
194,929
|
||||||
|
Distribution
center — equipment
|
21,567
|
24,462
|
24,421
|
|||||||||
|
Rent
and other occupancy
|
27,719
|
26,797
|
24,095
|
|||||||||
|
Other
operating expenses
|
15,218
|
14,542
|
14,850
|
|||||||||
|
$
|
253,850
|
$
|
269,699
|
$
|
258,295
|
|||||||
74
CKE
RESTAURANTS, INC. AND SUBSIDIARIES
NOTES TO
CONSOLIDATED FINANCIAL STATEMENTS (Continued)
Note 14 — Termination of Franchise Agreements
During
the third and fourth quarters of fiscal 2009, we terminated our franchise
agreements with two Hardee’s franchisees that operated 32 and 27 franchised
restaurants, respectively, as a result of their inability to remedy, on a timely
basis, certain defaults under the terms of the agreements. During the
third quarter of fiscal 2009, we assumed full operational control of 32
restaurants formerly operated by the first franchisee, six of which were
subsequently closed, 23 of which we continue to operate, and three of which
were refranchised during the fourth quarter of fiscal 2009. We recorded a gain
of $615, which is included in facility action charges, net, in connection
with this refranchising transaction. During fiscal 2010, a new franchisee
purchased the 27 restaurants from the second former franchisee.
Note 15 —
Facility Action Charges, Net
The
components of facility action charges, net, for fiscal 2010, 2009 and 2008 were
as follows:
|
2010
|
2009
|
2008
|
||||||||||
|
Estimated
liability for new restaurant closures
|
$
|
525
|
$
|
601
|
$
|
221
|
||||||
|
Adjustments
to estimated liability for closed restaurants
|
558
|
540
|
426
|
|||||||||
|
Impairment
of assets to be disposed of
|
—
|
1,528
|
485
|
|||||||||
|
Impairment
of assets to be held and used
|
3,480
|
789
|
686
|
|||||||||
|
(Gain)
loss on sales of restaurants and surplus properties, net
|
(260
|
)
|
220
|
(2,964
|
)
|
|||||||
|
Amortization
of discount related to estimated liability for closed
restaurants
|
392
|
461
|
569
|
|||||||||
|
$
|
4,695
|
$
|
4,139
|
$
|
(577
|
)
|
||||||
Impairment
charges recognized in facility action charges, net were recorded against the
following asset categories during fiscal 2010, 2009 and
2008:
|
2010
|
2009
|
2008
|
||||||||||
|
Property
and equipment:
|
||||||||||||
|
Carl’s
Jr.
|
$
|
2,002
|
$
|
237
|
$
|
120
|
||||||
|
Hardee’s
|
1,245
|
2,080
|
1,034
|
|||||||||
|
3,247
|
2,317
|
1,154
|
||||||||||
|
Property
under capital leases:
|
||||||||||||
|
Carl’s
Jr.
|
40
|
—
|
—
|
|||||||||
|
Hardee’s
|
193
|
—
|
17
|
|||||||||
|
233
|
—
|
17
|
||||||||||
|
Total:
|
||||||||||||
|
Carl’s
Jr.
|
2,042
|
237
|
120
|
|||||||||
|
Hardee’s
|
1,438
|
2,080
|
1,051
|
|||||||||
|
$
|
3,480
|
$
|
2,317
|
$
|
1,171
|
|||||||
75
CKE
RESTAURANTS, INC. AND SUBSIDIARIES
NOTES TO
CONSOLIDATED FINANCIAL STATEMENTS (Continued)
The
following table summarizes the activity in our estimated liability for closed
restaurants for fiscal 2008, 2009 and 2010:
|
Carl’s
Jr.
|
Hardee’s
|
Total
|
||||||||||
|
Balance
as of January 31, 2007
|
$
|
3,186
|
$
|
9,173
|
$
|
12,359
|
||||||
|
Estimated
liability for new restaurant closures
|
—
|
221
|
221
|
|||||||||
|
Estimated
liability for refranchising transactions
|
—
|
1,430
|
1,430
|
|||||||||
|
Usage
|
(1,332
|
)
|
(3,263
|
)
|
(4,595
|
)
|
||||||
|
Adjustments
to estimated liability for closed restaurants
|
770
|
(344
|
)
|
426
|
||||||||
|
Amortization
of discount
|
152
|
417
|
569
|
|||||||||
|
Balance
as of January 31, 2008
|
2,776
|
7,634
|
10,410
|
|||||||||
|
Estimated
liability for new restaurant closures
|
—
|
601
|
601
|
|||||||||
|
Estimated
liability for refranchising transactions
|
—
|
1,924
|
1,924
|
|||||||||
|
Usage
|
(1,009
|
)
|
(3,159
|
)
|
(4,168
|
)
|
||||||
|
Adjustments
to estimated liability for closed restaurants
|
336
|
36
|
372
|
|||||||||
|
Amortization
of discount
|
124
|
337
|
461
|
|||||||||
|
Balance
as of January 31, 2009
|
2,227
|
7,373
|
9,600
|
|||||||||
|
Estimated
liability for new restaurant closures
|
284
|
241
|
525
|
|||||||||
|
Usage
|
(803
|
)
|
(2,834
|
)
|
(3,637
|
)
|
||||||
|
Adjustments
to estimated liability for closed restaurants
|
104
|
289
|
393
|
|||||||||
|
Amortization
of discount
|
91
|
301
|
392
|
|||||||||
|
Balance
as of January 31, 2010
|
1,903
|
5,370
|
7,273
|
|||||||||
|
Less
current portion, included in other current
liabilities
|
708
|
2,216
|
2,924
|
|||||||||
|
Long-term
portion, included in other long-term liabilities
|
$
|
1,195
|
$
|
3,154
|
$
|
4,349
|
||||||
Note 16 — Share-Based
Compensation
Total
share-based compensation expense and associated tax benefits recognized for
fiscal 2010, 2009 and 2008 were as follows:
|
2010
|
2009
|
2008
|
||||||||||
|
Share-based
compensation expense related to performance-based restricted stock
awards
|
$
|
2,163
|
$
|
4,970
|
$
|
4,231
|
||||||
|
All
other share-based compensation expense
|
5,993
|
7,564
|
7,147
|
|||||||||
|
Total
share-based compensation expense
|
$
|
8,156
|
$
|
12,534
|
$
|
11,378
|
||||||
|
Associated
tax benefits
|
$
|
2,681
|
$
|
3,684
|
$
|
2,338
|
||||||
Employee
Stock Purchase Plan
Under the
terms of our Employee Stock Purchase Plan (“ESPP”) eligible employees may
voluntarily purchase, at current market prices, up to 5,407,500 shares of
our common stock through payroll deductions. Pursuant to the ESPP, employees may
contribute an amount between 3% and 15% of their base salaries. We contribute
varying amounts, as specified in the ESPP. During fiscal 2010, 2009 and 2008,
359,414, 299,335 and 195,665 shares, respectively, were purchased and allocated
to employees, based upon their contributions, at an average price of $8.79,
$9.83 and $16.87 per share, respectively. We contributed $1,019 or an equivalent
of 111,480 shares for fiscal 2010, $1,269 or an equivalent of
120,686 shares for fiscal 2009 and $960 or an equivalent of
50,936 shares for fiscal 2008. As of January 31, 2010,
1,069,379 shares were available for purchase under the ESPP. On February
26, 2010, the ESPP was suspended in connection with our execution of the Merger
Agreement.
76
CKE
RESTAURANTS, INC. AND SUBSIDIARIES
NOTES TO
CONSOLIDATED FINANCIAL STATEMENTS (Continued)
Stock
Incentive Plans
The 2005
Omnibus Incentive Compensation Plan, as amended, (“2005 Plan”) which has been
approved by our stockholders, is an “omnibus” stock plan consisting of a variety
of equity vehicles to provide flexibility in implementing equity awards,
including incentive stock options, non-qualified stock options, restricted stock
awards, unrestricted stock grants, stock appreciation rights and stock units.
Participants in the 2005 Plan may be granted any one of the equity awards or any
combination thereof, as determined by the Compensation Committee of our Board of
Directors. A total of 6,175,000 shares have been authorized for grant under
the 2005 Plan. Options have a term of ten years from the date of grant and vest
as prescribed by the Compensation Committee. Options are granted at a price
equal to the fair market value of the underlying common stock on the date of
grant. Restricted stock awards are awarded with an exercise price of $0. The
2005 Plan will terminate on March 22, 2015, unless the Board of Directors,
at its discretion, terminates the Plan at an earlier date. As of January 31,
2010, 2,415,000 shares are available for future grants of options or other
awards under the 2005 Plan.
Our 2001
Stock Incentive Plan (“2001 Plan”) Plan was established as a “broad-based plan”,
as defined by the New York Stock Exchange, under which 800,000 shares have been
authorized for grant. Awards granted to eligible employees under the 2001 Plan
are not restricted as to any specified form or structure, with such form,
vesting and pricing provisions determined by the Compensation Committee of our
Board of Directors. Options have a term of ten years from the date of grant.
Options are granted at a price equal to the fair market value of the underlying
common stock on the date of grant. As of January 31, 2010, 9,648 shares are
available for future grants of options or other awards under the 2001
Plan.
Our 1999
Stock Incentive Plan, as amended, (“1999 Plan”) was approved by our
stockholders, which authorized 1,500,000 shares originally and an annual
increase of 350,000 shares for grant under this plan. Awards granted to eligible
employees under the 1999 Plan are not restricted as to any specified form or
structure, with such form, vesting and pricing provisions determined by the
Compensation Committee of our Board of Directors. Options have a term of ten
years from the date of grant, except for incentive stock options granted to 10%
or greater stockholders of CKE, which have a term of five years from the date of
grant. Options are at a price equal to the fair market value of the underlying
common stock on the date of grant, except that incentive stock options granted
to 10% or greater stockholders of CKE may not be granted at less than 110% of
the fair market value of the common stock on the date of grant. Restricted stock
awards are awarded with an exercise price of $0 per share. The 1999 Plan
terminated on March 16, 2009.
In
general, options issued under our stock incentive plans have a term of ten years
and vest over a period of three years. We generally issue new shares of common
stock for option exercises. The grant date fair value is calculated using a
Black-Scholes option valuation model.
If the
Merger is consummated, each of the stock options that are outstanding pursuant
to the 2005 Plan, 2001 Plan or 1999 Plan shall become fully vested and
exercisable immediately prior to the closing. To the extent such stock options
have an exercise price less than $11.05 per share, the holders of such stock
options will be entitled to receive an amount in cash equal to $11.05 less the
exercise price of the stock option.
The
weighted-average assumptions used for stock option grants in fiscal 2010, 2009
and 2008 were as follows:
|
2010
|
2009
|
2008
|
||||||||||
|
Annual
dividend yield
|
2.79
|
%
|
2.16
|
%
|
1.32
|
%
|
||||||
|
Expected
volatility
|
46.17
|
%
|
58.07
|
%
|
47.95
|
%
|
||||||
|
Risk-free
interest rate (matched to the expected term of the outstanding
option)
|
3.01
|
%
|
1.84
|
%
|
3.33
|
%
|
||||||
|
Expected
life (years)
|
6.29
|
6.17
|
6.00
|
|||||||||
|
Weighted-average
grant date fair value
|
$
|
3.02
|
$
|
3.93
|
$
|
5.01
|
||||||
77
CKE
RESTAURANTS, INC. AND SUBSIDIARIES
NOTES TO
CONSOLIDATED FINANCIAL STATEMENTS (Continued)
Transactions
under all plans for fiscal 2010 were as follows:
Stock
options outstanding:
|
Shares
|
Weighted-Average
Exercise
Price
|
Weighted-Average
Remaining
Contractual
Life
|
Aggregate
Intrinsic
Value
|
|||||||||||||
|
Outstanding
as of January 31, 2009
|
4,816,269 | $ | 11.40 | |||||||||||||
|
Granted
|
524,000
|
8.14
|
||||||||||||||
|
Exercised
|
(190,986
|
)
|
4.39
|
|||||||||||||
|
Forfeited
|
(65,153
|
)
|
11.70
|
|||||||||||||
|
Expired
|
(649,689
|
)
|
16.09
|
|||||||||||||
|
Outstanding
as of January 31, 2010
|
4,434,441
|
$
|
10.63
|
5.80
|
$
|
3,726
|
||||||||||
|
Exercisable
as of January 31, 2010
|
3,445,665
|
$
|
11.15
|
4.79
|
$
|
3,434
|
||||||||||
|
Expected
to vest as of January 31, 2010
|
907,166
|
$
|
8.87
|
9.26
|
$
|
259
|
||||||||||
The total
intrinsic value of stock options exercised during fiscal 2010, 2009 and 2008 was
$878, $964 and $5,717, respectively.
Restricted
stock awards:
|
Shares
|
Weighted-Average
Grant
Date
Fair
Value
|
|||||||
| Restricted stock awards as of January 31, 2009 | 884,212 | $ | 11.99 | |||||
|
Granted
|
640,750
|
10.44
|
||||||
|
Awards
vested
|
(434,981
|
)
|
12.72
|
|||||
|
Forfeited
|
(3,031
|
)
|
10.80
|
|||||
|
Restricted
stock awards as of January 31, 2010
|
1,086,950
|
10.79
|
||||||
The total
grant date fair value of restricted stock awards vested during fiscal 2010, 2009
and 2008 was $5,532, $11,294 and $6,787, respectively.
Unvested
restricted stock awards as of January 31, 2010 consist of 517,478 restricted
stock awards that have vesting periods ranging from one to four years and
569,472 performance-based restricted stock awards that were awarded to certain
key executives. Pursuant to their amended employment agreements, these
executives are awarded performance-based restricted stock on an annual basis
through fiscal 2011. Annual awards are subject to adjustment, based on the final
performance relative to specified performance goals over a specified performance
period, resulting in minimum annual awards of no shares and maximum annual
awards of 360,000 shares. We begin recognizing the share-based compensation
expense related to these awards when we deem the achievement of performance
goals to be probable. As of January 31, 2010, there was $10,904 of unrecognized
compensation expense related to restricted stock awards. If all performance
goals and service requirements are met for these restricted stock awards, the
unamortized expense will be recognized over a weighted-average period of
1.29 years.
Subsequent
to year-end, the employment agreements of certain key executives were amended,
resulting in certain modifications to existing and future time-based restricted
stock awards and performance-based stock awards. These amendments
reallocate certain of the existing and future performance-based restricted stock
awards to time-based restricted stock awards. Additionally, the employment
agreements amend the future performance criteria for existing and future grants
of performance-based restricted stock awards.
If the
Merger is consummated, each of the shares of restricted stock that are
outstanding pursuant to the 2005 Plan, the 2001 Plan or the 1999 Plan shall
become fully vested immediately prior to the closing and shall be treated as a
share of the Company’s common stock for all purposes under the Merger
Agreement.
78
CKE
RESTAURANTS, INC. AND SUBSIDIARIES
NOTES TO
CONSOLIDATED FINANCIAL STATEMENTS (Continued)
Note 17 —
Employee Benefit and Retirement Plans
Savings
and Profit Sharing Plan
We
sponsor a contributory plan (“401(k) Plan”) to provide retirement benefits under
the provisions of Section 401(k) of the Internal Revenue Code (“IRC”) for
eligible employees other than operations hourly employees and highly compensated
employees. Participants may elect to contribute up to 25% of their annual
salaries on a pre-tax basis to the 401(k) Plan, subject to the maximum
contribution allowed by the IRC. Our matching contributions are determined at
the discretion of our Board of Directors. For fiscal 2010, 2009 and 2008, we did
not make matching contributions to the 401(k) Plan.
Deferred Compensation
Plan
On
June 28, 2005, our Board of Directors approved the CKE Restaurants, Inc.
Deferred Compensation Plan (“Plan”). Under the Plan, participants may elect to
defer, on a pre-tax basis, a portion of their base salary. Any amounts deferred
by a participant will be credited to such participant’s deferred compensation
account and we may make discretionary contributions to a participant’s deferred
compensation account. The Board of Directors amended the Plan during the third
quarter of fiscal 2009 to comply with recent changes to the Internal Revenue
Code of 1986, as amended. The Plan terminated effective December 31,
2008. The participants’ balances, totaling $889, were distributed to
participants in accordance with the terms of the Plan during fiscal 2010. We
made no discretionary contributions to participants’ accounts in fiscal 2010,
2009 or 2008.
Note 18 —
Related Party Transactions
Certain
members of the Board of Directors are also our franchisees. These franchisees
regularly pay royalties and purchase food and other products from us on the same
terms and conditions as our other franchisees. For fiscal 2010, 2009 and 2008,
the total revenue generated from related party franchisees was $78,839,
$83,326
and $85,516,
respectively, which is included in franchised and licensed restaurants and other
revenue in the accompanying Consolidated Statements of Income. As of January 31,
2010 and 2009, our related party trade receivables from franchisees were $5,037
and $4,923, respectively.
We lease
various properties, including certain of our corporate offices and two
restaurants from a Partnership and a Trust, both of which are related parties of
a member of our Board of Directors. Lease payments under these leases for fiscal
2010, 2009 and 2008 amounted to $1,824, $1,034 and $1,063,
respectively.
See Note
6 for discussion of the purchases and sales of assets with related
parties.
Note 19 —
Income Taxes
Income
tax expense for fiscal 2010, 2009 and 2008 consisted of the
following:
|
2010
|
2009
|
2008
|
||||||||||
|
Current:
|
||||||||||||
|
Federal
|
$
|
534
|
$
|
828
|
$
|
6,864
|
||||||
|
State
|
1,617
|
1,061
|
1,676
|
|||||||||
|
Foreign
|
1,030
|
1,611
|
1,164
|
|||||||||
|
3,181
|
3,500
|
9,704
|
||||||||||
|
Deferred:
|
||||||||||||
|
Federal
|
26,544
|
18,736
|
13,319
|
|||||||||
|
State
|
(14,747
|
)
|
(703
|
)
|
1,636
|
|||||||
|
11,797
|
18,033
|
14,955
|
||||||||||
|
Total
|
$
|
14,978
|
$
|
21,533
|
$
|
24,659
|
||||||
79
CKE
RESTAURANTS, INC. AND SUBSIDIARIES
NOTES TO
CONSOLIDATED FINANCIAL STATEMENTS (Continued)
The
following is a reconciliation of income tax expense attributable to continuing
operations at the federal statutory rate of 35% to our income tax expense for
fiscal 2010, 2009 and 2008:
|
2010
|
2009
|
2008
|
||||||||||
|
Income
tax expense at statutory rate
|
$
|
22,112
|
$
|
20,472
|
$
|
20,907
|
||||||
|
State
income taxes, net of federal income tax benefit
|
(8,535
|
)
|
233
|
2,153
|
||||||||
|
Nondeductible
compensation
|
1,877
|
1,750
|
1,416
|
|||||||||
|
Other,
net
|
(476
|
)
|
(922
|
)
|
183
|
|||||||
| $ | 14,978 | $ | 21,533 | $ | 24,659 | |||||||
As of
January 31, 2010 and 2009, temporary differences and carryforwards gave rise to
a significant amount of deferred tax assets and liabilities as
follows:
|
2010
|
2009
|
|||||||
| Estimated liability for closed restaurants | $ | 3,225 | $ | 4,249 | ||||
|
Net
operating loss carryforwards
|
20,101
|
18,858
|
||||||
|
Basis
difference in fixed assets
|
(23,391
|
)
|
(10,080
|
)
|
||||
|
Goodwill
and other intangible assets
|
18,301
|
26,369
|
||||||
|
Reserves
and allowances
|
24,254
|
24,581
|
||||||
|
Capital
leases
|
10,611
|
11,138
|
||||||
|
Federal
and state tax credits
|
17,539
|
14,511
|
||||||
|
Interest
rate swap agreements
|
6,066
|
6,883
|
||||||
|
Other
|
3,241
|
9,232
|
||||||
|
79,947
|
105,741
|
|||||||
|
Valuation
allowance
|
(13,131
|
)
|
(27,128
|
)
|
||||
|
Net
deferred tax asset
|
$
|
66,816
|
$
|
78,613
|
||||
As of
January 31, 2009, we maintained a valuation allowance of $24,675 against
substantially all of our net deferred income tax assets related to various
states in which one or more of our entities file separate state income tax
returns because we had concluded that realization of such deferred income tax
assets was not more likely than not. During the fourth quarter of
fiscal 2010, after considering all available evidence, positive and negative,
including cumulative historical earnings in recent years, estimated future
taxable income exclusive of reversing temporary differences on a jurisdictional
basis and statutory expiration dates of NOL carryforwards, we concluded that we
will more likely than not realize future tax benefits related to a portion of
these deferred income tax assets. As a result, we reduced our
valuation allowance related to separate state deferred income tax assets by
$15,222, which resulted in a $9,894 decrease of income tax expense for fiscal
2010, net of the related federal income tax effect.
Our
remaining valuation allowance of $13,131 as of January 31, 2010, relates to
state capital loss carryforwards, certain state NOL and income tax credit
carryforwards and other temporary differences related to various states in which
one or more of our entities file separate income tax returns. Realization of the
tax benefit of such deferred income tax assets may remain uncertain for the
foreseeable future, even though we expect to generate consolidated taxable
income, since they are subject to various limitations and may only be used to
offset income of certain entities or of a certain character. During
fiscal 2010 and 2009, our total valuation allowance decreased by $13,997 and
$977, respectively.
As of
January 31, 2010, we have federal alternative minimum tax (“AMT”) credit,
general business tax credit and foreign tax credit carryforwards of
approximately $14,445. Our AMT credits will be carried forward until utilized,
and our general business tax credits and foreign tax credits would expire, if
unused, in varying amounts in fiscal 2014 through 2030. As of January 31,
2010, we have state tax credit carryforwards of $5,946, which can be carried
forward indefinitely but are subject to substantive limitations with regard to
utilization. As of January 31, 2010, we have state NOL carryforwards in the
amount of approximately $478,302, which expire in varying amounts in fiscal 2011
through 2030. As of January 31, 2010, we have recognized $3,240 of net deferred
income tax assets related to our state income tax credit carryforwards and
$11,392 of net deferred income tax assets related to our state NOL
carryforwards, which represent our expected future tax savings from such
carryforwards.
The
federal and state tax credits and the state NOL carryforwards reflected in our
income tax returns, as filed, include the impact of uncertain tax positions
taken in open years. Accordingly, they are larger than the tax credits and NOL
for which deferred income tax assets are recognized for financial statement
purposes.
We
adopted the FASB accounting guidance for uncertainty in income taxes at the
beginning of fiscal 2008. The adoption of such guidance resulted in a decrease
of $175 in refundable income taxes, an increase of $642 in income tax
liabilities, an increase of $46 in deferred income tax assets and an increase of
$771 in accumulated deficit.
80
CKE
RESTAURANTS, INC. AND SUBSIDIARIES
NOTES TO
CONSOLIDATED FINANCIAL STATEMENTS (Continued)
The
following is a tabular reconciliation of the total amounts of unrecognized tax
benefits for fiscal 2010, 2009 and 2008:
|
2010
|
2009
|
2008
|
||||||||||
| Unrecognized tax benefits, beginning of year | $ | 17,194 | $ | 19,378 | $ | 15,913 | ||||||
|
Gross
increases related to tax positions taken in prior years
|
13 | 19 | 363 | |||||||||
|
Gross
decreases related to tax positions taken in prior years
|
(320 | ) | (464 | ) | — | |||||||
|
Gross
increases related to tax positions taken in the current
year
|
341 | 424 | 3,102 | |||||||||
|
Gross
decreases related to tax positions taken in the current
year
|
(1,323 | ) | (2,163 | ) | — | |||||||
|
Unrecognized
tax benefits, end of year
|
$ | 15,905 | $ | 17,194 | $ | 19,378 | ||||||
Included
in the balance of unrecognized tax benefits as of January 31, 2010, are $4,269
of tax benefits that, if recognized, would affect the effective tax rate. Also
included in the balance of unrecognized tax benefits as of January 31, 2010, are
$11,636 of tax benefits that, if recognized, would result in adjustments to
other tax accounts, primarily deferred taxes, income taxes payable and valuation
allowance. Amounts recorded for interest and penalties in connection with the
unrecognized tax benefits noted above were not significant as of January 31,
2010 and 2009.
We
believe that it is reasonably possible that decreases in unrecognized tax
benefits of up to $3,323 may be necessary within the coming year as a result of
statutes closing on such items. In addition, we believe that it is reasonably
possible that our unrecognized tax benefits may increase as a result of tax
positions that may be taken in fiscal 2011.
We file
income tax returns in the U.S. federal jurisdiction and various states and
foreign jurisdictions. We have carried forward various federal and state NOL and
income tax credits to income tax years that remain open by statute. As a result,
such NOL and income tax credit carryforwards remain subject to adjustment by the
respective tax authorities. Our federal income tax returns from fiscal 2007 and
subsequent years are open for examination. In addition, our state income tax
returns generally have statutes of limitations ranging from three to four years
from the filing date.
Note 20 —
Segment Information
We are
principally engaged in developing, operating and franchising our Carl’s Jr. and
Hardee’s quick-service concepts, each of which is considered an operating
segment that is managed and evaluated separately. Management evaluates the
performance of our segments and allocates resources to them based on several
factors, of which the primary financial measure is segment operating income or
loss. General and administrative expenses are allocated to each segment based on
management’s analysis of the resources applied to each segment. Interest expense
related to our Facility and the 2023 Convertible Notes has been allocated based
on the use of funds. Certain amounts that we do not believe would be proper to
allocate to the operating segments are included in “Other” (e.g., gains or
losses on sales of long-term investments and the results of operations of
consolidated VIEs). The accounting policies of the segments are the same as
those described in our summary of significant accounting policies (see
Note 1).
81
CKE
RESTAURANTS, INC. AND SUBSIDIARIES
NOTES TO
CONSOLIDATED FINANCIAL STATEMENTS (Continued)
|
Carl’s
Jr.
|
Hardee’s
|
Other
|
Total
|
|||||||||||||
|
2010
|
||||||||||||||||
|
Revenue
|
$
|
852,479
|
$
|
565,462
|
$
|
792
|
$
|
1,418,733
|
||||||||
|
Segment
operating income
|
53,427
|
25,760
|
308
|
79,495
|
||||||||||||
|
Interest
expense
|
2,633
|
5,042
|
11,579
|
19,254
|
||||||||||||
|
Total
assets
|
300,329
|
368,889
|
154,325
|
823,543
|
||||||||||||
|
Capital
expenditures
|
52,038
|
50,390
|
—
|
102,428
|
||||||||||||
|
Goodwill
|
23,550
|
1,039
|
—
|
24,589
|
||||||||||||
|
Depreciation
and amortization
|
36,695
|
34,211
|
158
|
71,064
|
||||||||||||
|
Income
tax expense (benefit)
|
20,052
|
8,640
|
(13,714
|
)
|
14,978
|
|||||||||||
|
2009
|
||||||||||||||||
|
Revenue
|
$
|
886,349
|
$
|
595,487
|
$
|
874
|
$
|
1,482,710
|
||||||||
|
Segment
operating income
|
67,505
|
16,153
|
362
|
84,020
|
||||||||||||
|
Interest
expense
|
2,359
|
6,148
|
20,102
|
28,609
|
||||||||||||
|
Total
assets
|
285,962
|
352,023
|
166,702
|
804,687
|
||||||||||||
|
Capital
expenditures
|
58,822
|
57,691
|
—
|
116,513
|
||||||||||||
|
Goodwill
|
22,649
|
1,039
|
—
|
23,688
|
||||||||||||
|
Depreciation
and amortization
|
33,011
|
30,328
|
158
|
63,497
|
||||||||||||
|
Income
tax expense (benefit)
|
24,530
|
4,246
|
(7,243
|
)
|
21,533
|
|||||||||||
|
2008
|
||||||||||||||||
|
Revenue
|
$
|
845,634
|
$
|
685,273
|
$
|
3,727
|
$
|
1,534,634
|
||||||||
|
Segment
operating income
|
66,801
|
21,227
|
299
|
88,327
|
||||||||||||
|
Interest
expense
|
2,764
|
8,921
|
21,348
|
33,033
|
||||||||||||
|
Capital
expenditures(1)
|
81,298
|
48,966
|
1
|
130,265
|
||||||||||||
|
Depreciation
and amortization(1)
|
31,579
|
31,023
|
159
|
62,761
|
||||||||||||
|
Income
tax expense (benefit)
|
26,283
|
5,552
|
(7,176
|
)
|
24,659
|
|||||||||||
|
(1)
|
The
difference between the total and the amount reported in our accompanying
consolidated financial statements relates to our discontinued
operations.
|
Note 21 —
Discontinued Operations
We sold
our La Salsa Fresh Mexican Grill restaurants and the related franchise
operations to LAS Acquisition, LLC (“Buyer”) on July 16, 2007. Under the
agreement, Santa Barbara Restaurant Group, Inc. a wholly-owned subsidiary of the
Company, sold its 100 percent equity interest in La Salsa, Inc. and La Salsa of
Nevada, Inc. (collectively, “La Salsa”) for adjusted consideration of $15,889.
Pursuant to the agreement, we have retained contingent liabilities related to
tax matters and certain litigation matters arising prior to the completion of
the sale of La Salsa. In addition, we remain contingently liable for
certain lease obligations and self-insurance exposures arising prior to the
completion of the sale.
As of
January 31, 2010, the outstanding principal balance under our note receivable
from Buyer is $2,491. The note is secured by the personal property of
Buyer, a pledge of the La Salsa equity interests acquired by Buyer, and certain
personal and corporate guarantees.
82
CKE
RESTAURANTS, INC. AND SUBSIDIARIES
NOTES TO
CONSOLIDATED FINANCIAL STATEMENTS (Continued)
The
results from discontinued operations for fiscal 2008 were as
follows:
|
2008
|
||||
| Revenue | $ | 20,907 | ||
|
Operating
loss
|
(724
|
)
|
||
|
Interest
expense
|
(22
|
)
|
||
|
Other
income, net
|
92
|
|||
|
Income
tax benefit
|
173
|
|||
|
(481
|
)
|
|||
|
Loss
on disposal of La Salsa
|
(1,389
|
)
|
||
|
Income
tax expense related to disposal of La Salsa
|
(2,126
|
)
|
||
|
Net
loss on disposal of La Salsa
|
(3,515
|
)
|
||
|
Loss
from discontinued operations
|
$
|
(3,996
|
)
|
|
Note 22 —
Supplemental Cash Flow Information
The
following table presents supplemental cash flow information for fiscal 2010,
2009 and 2008:
|
2010
|
2009
|
2008
|
||||||||||
|
Cash
paid for:
|
||||||||||||
|
Interest,
net of amounts capitalized
|
$
|
19,590
|
$
|
21,753
|
$
|
20,235
|
||||||
|
Income taxes, net of refunds received
|
7,747
|
1,252
|
6,703
|
|||||||||
|
Non-cash
investing and financing activities:
|
||||||||||||
|
Dividends declared, not paid
|
3,317
|
3,279
|
3,148
|
|||||||||
|
Capital lease obligations incurred to acquire assets
|
15,951
|
6,485
|
—
|
|||||||||
|
Accrued property and equipment purchases
|
7,152
|
9,486
|
7,307
|
|||||||||
During
fiscal 2009, we redeemed and converted the remaining $15,167 principal amount of
our 2023 Convertible Notes into 1,786,963 shares of our common stock. There were
no conversions during fiscal 2010 or 2008.
The cash
used in financing activities related to the repurchase of common stock for
fiscal 2009 and 2008 differs from the repurchase of common stock in our
accompanying Consolidated Statements of Stockholders’ Equity by $268 and $92,
respectively, reflecting the timing difference between the recognition of share
repurchase transactions and their settlement for cash.
Note 23 —
Selected Quarterly Financial Data (Unaudited)
The
following table presents summarized quarterly results:
|
Quarter
|
||||||||||||||||
|
1st
|
2nd
|
3rd
|
4th
|
|||||||||||||
|
Fiscal
2010
|
||||||||||||||||
|
Total
revenue
|
$
|
446,804
|
$
|
335,967
|
$
|
324,217
|
$
|
311,745
|
||||||||
|
Operating
income
|
29,675
|
22,168
|
16,262
|
11,390
|
||||||||||||
|
Net
income
|
14,395
|
12,250
|
6,157
|
15,396
|
||||||||||||
|
Basic
income per common share
|
0.26
|
0.22
|
0.11
|
0.28
|
||||||||||||
|
Diluted
income per common share
|
0.26
|
0.22
|
0.11
|
0.28
|
||||||||||||
|
Fiscal
2009
|
||||||||||||||||
|
Total
revenue
|
$
|
466,171
|
$
|
352,490
|
$
|
336,595
|
$
|
327,454
|
||||||||
|
Operating
income
|
29,630
|
22,885
|
17,755
|
13,750
|
||||||||||||
|
Net
income
|
16,620
|
12,340
|
5,388
|
2,608
|
||||||||||||
|
Basic
income per common share
|
0.32
|
0.24
|
0.10
|
0.05
|
||||||||||||
|
Diluted
income per common share
|
0.31
|
0.23
|
0.10
|
0.05
|
||||||||||||
83
CKE
RESTAURANTS, INC. AND SUBSIDIARIES
NOTES TO
CONSOLIDATED FINANCIAL STATEMENTS (Continued)
Quarterly
operating results are not necessarily representative of operations for a full
year for various reasons, including the seasonal nature of the quick-service
restaurant industry and unpredictable weather conditions, which may affect sales
volume and food costs. In addition, all quarters presented are comprised of
three four-week accounting periods, except the first quarters of fiscal 2010 and
2009, which are comprised of four four-week accounting periods.
Fourth
Quarter Adjustment
During
the fourth quarter of fiscal 2010, we recorded interest expense of $1,856
related to changes in the fair value of our interest rate swap
agreements.
During the fourth quarter of fiscal 2010, we recorded an income tax
benefit of $9,894 related to a reduction of our valuation allowance for deferred
tax assets.
Note 24 —
Commitments and Contingent Liabilities
Under
various past and present refranchising programs, we have sold restaurants to
franchisees, some of which were on leased sites. We entered into sublease
agreements with these franchisees but remained principally liable for the lease
obligations. We account for the sublease payments received as franchising rental
revenue and the payments on the leases as rental expense in franchised and
licensed restaurants and other expense on our accompanying Consolidated
Statements of Income. As of January 31, 2010, the present value of the lease
obligations under the remaining master leases’ primary terms is $114,082.
Franchisees may, from time to time, experience financial hardship and may cease
payment on the sublease obligation to us. The present value of the exposure to
us from franchisees characterized as under financial hardship is $1,393, of
which $1 is reserved for in our estimated liability for closed restaurants as of
January 31, 2010.
Pursuant
to our Facility, a letter of credit sub-facility in the amount of $85,000 was
established (see Note 10). Several standby letters of credit are
outstanding under this sub-facility, which secure our potential workers’
compensation, general and auto liability obligations. We are required to provide
letters of credit each year, or set aside a comparable amount of cash or
investment securities in a trust account, based on our existing claims
experience. As of January 31, 2010, we had outstanding letters of credit of
$35,363, expiring at various dates through March 2011 to secure our
self-insurance obligations.
As of
January 31, 2010, we had unconditional purchase obligations in the amount of
$68,031, which primarily include contracts for goods and services related to
restaurant operations and contractual commitments for marketing and sponsorship
arrangements.
We have
employment agreements with certain key executives (“Agreements”). These
Agreements include provisions for lump sum payments to the executives that may
be triggered by the termination of employment under certain conditions, as
defined in each Agreement. If such provisions were triggered, each affected
executive would receive an amount ranging from one to three times his base
salary for the remainder of his employment term plus, in some instances, either
all of or a pro-rata portion of the bonus in effect for the year in which the
termination occurs. Additionally, all options and restricted stock awarded to
the affected executives which have not vested as of the date of termination
would vest immediately, and restricted stock awards which have not yet been
awarded would be awarded and would vest immediately. If all of these Agreements
had been triggered as of January 31, 2010, we would have been required to make
cash payments of approximately $15,800.
In the
course of operating our business we are, from time to time, the subject of
complaints or litigation. For example, disputes may arise with current or former
employees regarding our practices relating to hiring, firing, harassment, wages
and overtime, promotions and other employee-related matters. In addition,
disputes may arise with customers alleging illness, injury, food quality, health
or other concerns. We may also be the subject of complaints or litigation from
suppliers, franchisees, landlords and other parties. Adverse publicity resulting
from such complaints and litigation, and the cost of defending such litigation,
may materially adversely affect us and our restaurants, regardless of whether
allegations surrounding the disputes are valid or whether we are ultimately
determined to be liable.
We are
currently involved in legal disputes related to the proposed Merger (see Note
25), employment claims, real estate claims, and other business disputes. With
respect to employment matters, our most significant legal disputes relate to
employee meal and rest breaks, and wage and hour disputes. Several
potential class action lawsuits have been filed in the state of California, each
of which is seeking injunctive relief and monetary compensation on behalf of
current and former employees. The Company intends to vigorously defend against
all claims in these lawsuits; however, we are presently unable to predict the
ultimate outcome of this litigation.
As of
January 31, 2010, our accrued liability for litigation contingencies was $225.
The matters for which we maintain an accrued liability for litigation pose risk
of loss significantly higher than the accrued amounts. As of January 31, 2010,
we estimated the contingent liability of those losses related to other
litigation claims that are not accrued, but that we believe are reasonably
possible to result in an adverse outcome, to be in the range of $655 to
$2,245.
Note 25 —
Merger Agreement
On
February 26, 2010, we entered into the Merger Agreement, which provides for the
Merger of the Company with and into the Merger Sub, with the Company surviving
as a wholly-owned subsidiary of Parent, which is an affiliate of
THL. If the Merger is completed, each share of our common stock
issued and outstanding immediately prior to closing automatically will be
cancelled and converted into the right to receive $11.05 in cash, and the
Company will cease to be a publicly traded company. The closing of
the Merger Agreement is subject to approval by the holders of a majority of the
outstanding shares of our common stock entitled to vote on the Merger, the
receipt of any required approvals, or the expiration or termination of the
applicable waiting periods, under the HSR Act, and other customary closing
conditions. On March
19, 2010, we received notice from the Federal Trade Commission that early
termination of the waiting period under the HSR Act has been granted effective
immediately. In addition, on the same date, we filed a preliminary
proxy statement with the SEC relating to the proposed special meeting of our
stockholders to consider and vote on a proposal to adopt the Merger
Agreement.
The terms
of the Merger Agreement limit our ability to engage in certain business
activities without the prior consent of Parent. The most significant of these
restrictions limit our ability to pay dividends, issue or repurchase shares of
our common stock, incur new indebtedness, modify our existing Facility, enter
into or modify material contracts, grant liens on our assets, and effect any
significant change in our corporate structure or the nature of our
business.
The
Merger Agreement contains certain termination rights and reimbursement
obligations. Upon termination of the Merger Agreement, under specified
circumstances, the Company will be required to pay Parent a termination fee of
$9,283 to $15,471, and to reimburse transaction expenses incurred by Parent and
Merger Sub up to $5,000.
In
connection with the Merger Agreement, to date, a total of six putative
stockholder class action lawsuits have been filed in the Delaware Court of
Chancery and the Superior Court of California for the County of Santa Barbara.
Among other remedies, each of these lawsuits seek to enjoin the proposed Merger.
The Company intends to vigorously defend against all claims in these lawsuits;
however, we are presently unable to predict the ultimate outcome of any of these
lawsuits.
|
Exhibits
|
Description
|
|
2.1
|
Agreement
and Plan of Merger, dated as of February 26, 2010, by and among Western
Acquisition Holdings, Inc., Western Acquisition Corp., and the Company,
incorporated herein by reference to Exhibit 2.1 to the Company's Current
Report on Form 8-K, as filed with the SEC on March 2,
2010.*
|
|
3.1
|
Certificate
of Incorporation of the Company, as amended through December 9, 1997.+
|
|
3.2
|
Bylaws
of the Company, as amended through September 4, 2008, incorporated herein
by reference to Exhibit 3.3 to the Company’s Quarterly Report on Form 10-Q
for the quarter ended August 11, 2008.
|
|
10.1
|
Carl
Karcher Enterprises, Inc. Profit Sharing Plan, as amended, incorporated
herein by reference to Exhibit 10.21 to the Company’s Form S-1
Registration Statement (File Number 2-73695).**
|
|
10.2
|
CKE
Restaurants, Inc. 1994 Stock Incentive Plan, as amended, incorporated
herein by reference to Exhibit 4.1 to the Company’s Form S-8 Registration
Statement (File Number 333-12399), as filed with the SEC on September 20,
1996.**
|
|
10.3
|
CKE
Restaurants, Inc. Amended and Restated 1994 Employee Stock Purchase Plan
(the “ESPP”), effective as of February 26, 2009, incorporated herein by
reference to Exhibit 10.3 to the Company’s Annual Report on Form 10-K for
the fiscal year ended January 26, 2009, as filed with the SEC on March 25,
2009.**
|
|
10.4
|
Amendment
No. 1 to the ESPP, effective as of February 25, 2010.+
|
|
10.5
|
CKE
Restaurants, Inc. 1999 Stock Incentive Plan, incorporated herein by
reference to Exhibit 4.1 to the Company’s Form S-8 Registration Statement
(File Number 333-83601), as filed with the SEC on July 23,
1999.**
|
|
10.6
|
CKE
Restaurants, Inc. 2001 Stock Incentive Plan, incorporated herein by
reference to Exhibit 4.1 to the Company’s Form S-8 Registration Statement
(File Number 333-76884), as filed with the SEC on January 17,
2002.**
|
|
10.7
|
CKE
Restaurants, Inc. 2005 Omnibus Incentive Compensation Plan (the “2005
Plan”), as amended, incorporated herein by reference as Appendix A to the
Company’s Definitive Proxy Statement on Schedule 14A, as filed with the
SEC on May 14, 2009.**
|
|
10.8
|
Form
of Stock Option Agreement under the 2005 Plan, incorporated herein by
reference to Exhibit 10.2 to the Company’s Current Report on Form 8-K, as
filed with the SEC on June 30, 2005.**
|
|
10.9
|
Form
of Restricted Stock Award Agreement under the 2005 Plan, incorporated
herein by reference to Exhibit 10.3 to the Company’s Current Report on
Form 8-K, as filed with the SEC on June 30,
2005.**
|
|
10.10
|
Form
of Stock Appreciation Rights Award Agreement under the 2005 Plan,
incorporated herein by reference to Exhibit 10.4 to the Company’s Current
Report on Form 8-K, as filed with the SEC on June 30,
2005.**
|
|
10.11
|
Form
of Restricted Stock Unit Award Agreement under the 2005 Plan, incorporated
herein by reference to Exhibit 10.5 to the Company’s Current Report on
Form 8-K, as filed with the SEC on June 30,
2005.**
|
|
10.12
|
Form
of Stock Award Agreement under the 2005 Plan, incorporated herein by
reference to Exhibit 10.6 to the Company’s Current Report on Form 8-K, as
filed with the SEC on June 30, 2005.**
|
|
10.13
|
Employment
Agreement, effective as of April 4, 2004, by and between the Company and
Andrew F. Puzder, incorporated herein by reference to Exhibit 10.55 to the
Company’s Annual Report on Form 10-K for the fiscal year ended January 26,
2004, as filed with the SEC on April 7, 2004.**
|
|
10.14
|
Amendment
to Employment Agreement between the Company and Andrew F. Puzder,
effective as of February 1, 2005, incorporated herein by reference to
Exhibit 10.60 to the Company’s Annual Report on Form 10-K for the fiscal
year ended January 31, 2005, as filed with the SEC on April 25,
2005.**
|
|
10.15
|
Amendment
No. 2 to Employment Agreement between the Company and Andrew F. Puzder,
effective as of December 6, 2005, incorporated herein by reference to
Exhibit 10.71 to the Company’s Annual Report on Form 10-K for the fiscal
year ended January 30, 2006, as filed with the SEC on April 6,
2006.**
|
|
10.16
|
Amendment
No. 3 to Employment Agreement between the Company and Andrew F. Puzder,
effective as of October 12, 2006, incorporated herein by reference to
Exhibit 10.1 to the Company’s Current Report on Form 8-K, as filed with
the SEC on October 17, 2006.**
|
|
10.17
|
Amendment
No. 4 to Employment Agreement between the Company and
Andrew F. Puzder, effective as of December 16, 2008,
incorporated herein by reference to Exhibit 10.18 to the Company’s Annual
Report on Form 10-K for the fiscal year ended January 26, 2009, as filed
with the SEC on March 25, 2009.**
|
|
10.18
|
Amendment
No. 5 to Employment Agreement between the Company and Andrew F. Puzder,
effective as of April 1, 2010.+
|
|
10.19
|
Employment
Agreement, effective as of January 27, 2004, by and between the Company
and E. Michael Murphy, incorporated herein by reference to Exhibit 10.56
to the Company’s Annual Report on Form 10-K for the fiscal year ended
January 26, 2004, as filed with the SEC on April 7,
2004.**
|
|
10.20
|
Amendment
No. 1 to Employment Agreement between the Company and E. Michael Murphy,
effective as of December 6, 2005, incorporated herein by reference to
Exhibit 10.72 to the Company’s Annual Report on Form 10-K for the fiscal
year ended January 30, 2006, as filed with the SEC on April 6,
2006.**
|
|
10.21
|
Amendment
No. 2 to Employment Agreement between the Company and E. Michael Murphy,
effective as of October 12, 2006, incorporated herein by reference to
Exhibit 10.2 to the Company’s Current Report on Form 8-K, as filed with
the SEC on October 17, 2006.**
|
|
10.22
|
Amendment
No. 3 to Employment Agreement between the Company and
E. Michael Murphy, effective as of December 16, 2008, incorporated herein
by reference to Exhibit 10.22 to the Company’s Annual Report on Form 10-K
for the fiscal year ended January 26, 2009, as filed with the SEC on March
25, 2009.**
|
|
10.23
|
Amendment
No. 4 to Employment Agreement between the Company and E. Michael Murphy,
effective as of April 1, 2010.+
|
|
10.24
|
Employment
Agreement, effective as of January 27, 2004, by and between the Company
and Theodore Abajian, incorporated herein by reference to Exhibit 10.53 to
the Company’s Annual Report on Form 10-K for the fiscal year ended January
26, 2004.**
|
|
10.25
|
Amendment
No. 1 to Employment Agreement between the Company and Theodore Abajian,
effective as of December 6, 2005, incorporated herein by reference to
Exhibit 10.73 to the Company’s Annual Report on Form 10-K for the fiscal
year ended January 30, 2006, as filed with the SEC on April 6,
2006.**
|
|
10.26
|
Amendment
No. 2 to Employment Agreement between the Company and Theodore Abajian,
effective as of October 12, 2006, incorporated herein by reference to
Exhibit 10.3 to the Company’s Current Report on Form 8-K, as filed with
the SEC on October 17, 2006.**
|
|
10.27
|
Amendment
No. 3 to Employment Agreement between the Company and
Theodore Abajian, effective as of December 16, 2008, incorporated
herein by reference to Exhibit 10.26 to the Company’s Annual Report on
Form 10-K for the fiscal year ended January 26, 2009, as filed with the
SEC on March 25, 2009.**
|
|
10.28
|
Amendment
No. 4 to Employment Agreement between the Company and Theodore Abajian,
effective as of April 1, 2010.+
|
|
10.29
|
Employment
Agreement, effective as of January 27, 2004, by and between the Company
and Brad R. Haley, incorporated herein by reference to Exhibit 10.57 to
the Company’s Quarterly Report on Form 10-Q for the quarter ended May 17,
2004, as filed with the SEC on June 22, 2004.**
|
|
10.30
|
Amendment
No. 1 to Employment Agreement between the Company and Brad R. Haley,
effective as of December 6, 2005, incorporated herein by reference to
Exhibit 10.74 to the Company’s Annual Report on Form 10-K for the fiscal
year ended January 30, 2006, as filed with the SEC on April 6,
2006.**
|
|
10.31
|
Amendment
No. 2 to Employment Agreement between the Company and Brad R. Haley,
effective as of March 20, 2007, incorporated herein by reference to
Exhibit 10.80 to the Company’s Annual Report on Form 10-K for the fiscal
year ended January 29, 2007, as filed with the SEC on March 30,
2007.**
|
|
10.32
|
Amendment
No. 3 to Employment Agreement between the Company and
Brad R. Haley, effective as of December 16, 2008, incorporated
herein by reference to Exhibit 10.30 to the Company’s Annual Report on
Form 10-K for the fiscal year ended January 26, 2009, as filed with the
SEC on March 25, 2009.**
|
|
10.33
|
Amendment
No. 4 to Employment Agreement between the Company and Brad R. Haley,
effective as of January 26, 2010.+
|
|
10.34
|
Employment
Agreement, effective January 2004, by and between Hardee’s Food Systems,
Inc. and Noah J. Griggs, incorporated herein by reference to Exhibit 10.1
to the Company’s Quarterly Report on Form 10-Q for the quarter ended May
21, 2007, as filed with the SEC on June 28,
2007.**
|
|
10.35
|
Amendment
No. 1 to Employment Agreement between the Company and Noah J. Griggs,
effective as of December 6, 2005, incorporated herein by reference to
Exhibit 10.2 to the Company’s Quarterly Report on Form 10-Q for the
quarter ended May 21, 2007, as filed with the SEC on June 28,
2007.**
|
|
10.36
|
Amendment
No. 2 to Employment Agreement between the Company and Noah J. Griggs,
effective as of March 20, 2007, incorporated herein by reference to
Exhibit 10.3 to the Company’s Quarterly Report on Form 10-Q for the
quarter ended May 21, 2007, as filed with the SEC on June 28,
2007.**
|
|
10.37
|
Amendment
No. 3 to Employment Agreement between the Company and Noah J. Griggs,
effective as of June 11, 2007, incorporated herein by reference to Exhibit
10.4 to the Company’s Quarterly Report on Form 10-Q for the quarter ended
May 21, 2007, as filed with the SEC on June 28,
2007.**
|
|
10.38
|
Amendment
No. 4 to Employment Agreement between the Company and
Noah J. Griggs, effective as of December 16, 2008, incorporated
herein by reference to Exhibit 10.35 to the Company’s Annual Report on
Form 10-K for the fiscal year ended January 26, 2009, as filed with the
SEC on March 25, 2009.**
|
|
10.39
|
Amendment
No. 5 to Employment Agreement between the Company and Noah J. Griggs,
effective as of January 26, 2010.+
|
|
10.40
|
Employment
Agreement between the Company and Richard E. Fortman, effective as of
January, 2004, incorporated herein by reference to Exhibit 10.2 to the
Company’s Quarterly Report on Form 10-Q for the quarter ended May 19,
2008, as filed with the SEC on June 25, 2008.**
|
|
10.41
|
Amendment
No. 1 to Employment Agreement between the Company and Richard E. Fortman,
effective as of December 6, 2005, incorporated herein by reference to
Exhibit 10.3 to the Company’s Quarterly Report on Form 10-Q for the
quarter ended May 19, 2008, as filed with the SEC on June 25,
2008.**
|
|
10.42
|
Amendment
No. 2 to Employment Agreement between the Company and Richard E. Fortman,
effective as of March 20, 2007, incorporated herein by reference to
Exhibit 10.4 to the Company’s Quarterly Report on Form 10-Q for the
quarter ended May 19, 2008, as filed with the SEC on June 25,
2008.**
|
|
10.43
|
Amendment
No. 3 to Employment Agreement between the Company and
Richard E. Fortman, effective as of December 16, 2008,
incorporated herein by reference to Exhibit 10.39 to the Company’s Annual
Report on Form 10-K for the fiscal year ended January 26, 2009, as filed
with the SEC on March 25, 2009.**
|
|
10.44
|
Amendment
No. 4 to Employment Agreement between the Company and Richard E. Fortman,
effective as of January 26, 2010.+
|
|
10.45
|
Employment
Agreement between Hardee’s Food Systems, Inc. and
Robert J. Starke, effective as of January 27, 2009, incorporated
herein by reference to Exhibit 10.40 to the Company’s Annual Report on
Form 10-K for the fiscal year ended January 26, 2009, as filed with the
SEC on March 25, 2009.**
|
|
10.46
|
Amendment
No. 1 to Employment Agreement between the Company and Robert J. Starke,
effective as of January 26, 2010.+
|
|
10.47
|
Seventh
Amended and Restated Credit Agreement, dated as of March 27, 2007, by and
among the Company, the Lenders party thereto, and BNP Paribas, a bank
organized under the laws of France acting through its Chicago Branch, as
Administrative Agent, and Citigroup Global Markets, Inc. and Bank of
America, N.A., as Co-Syndication Agents, incorporated herein by reference
to Exhibit 10.79 to the Company’s Annual Report on Form 10-K for the
fiscal year ended January 29, 2007, as filed with the SEC on March 30,
2007.*
|
|
10.48
|
Additional
Loan and First Amendment to Seventh Amended and Restated Credit Agreement,
dated as of May 3, 2007, by and among the Company, the Lenders party
thereto, and BNP Paribas, a bank organized under the laws of France acting
through its Chicago branch, as Administrative Agent, incorporated herein
by reference to Exhibit 10.5 to the Company’s Quarterly Report on Form
10-Q for the quarter ended May 21, 2007, as filed with the SEC on June 28,
2007.
|
|
10.49
|
Additional
Loan and Second Amendment to Seventh Amended and Restated Credit
Agreement, dated as of August 27, 2007, by and among the Company, the
Lenders party thereto, and BNP Paribas, a bank organized under the laws of
France acting through its Chicago branch, as Administrative Agent,
incorporated herein by reference to Exhibit 10.1 to the Company’s Current
Report on Form 8-K, as filed with the SEC on August 29,
2007.
|
|
10.50
|
Third
Amendment to Seventh Amended and Restated Credit Agreement, dated as of
March 7, 2008, by and among the Company, BNP Paribas, a bank organized
under the laws of France acting through its Chicago branch, as
Administrative Agent, and the subsidiaries of the Company, incorporated
herein by reference to Exhibit 10.1 to the Company’s Current Report on
Form 8-K filed March 13, 2008.
|
|
11.1
|
Computation
of Per Share Earnings, included in Note 1 of Notes to Consolidated
Financial Statements.
|
|
12.1
|
Computation
of Ratios.
|
|
21.1
|
Subsidiaries
of the Company.
|
|
23.1
|
Consent
of Independent Registered Public Accounting Firm.
|
|
24.1
|
Power
of Attorney (included on signature page).
|
|
31.1
|
Certification
of Chief Executive Officer Pursuant to Rule 13a-14(a) / 15d-14(a) of the
Securities Exchange Act of 1934.
|
|
31.2
|
Certification
of Chief Financial Officer Pursuant to Rule 13a-14(a) / 15d-14(a) of the
Securities Exchange Act of 1934.
|
|
32.1
|
Certification
of Chief Executive Officer Pursuant to Rule 13a-14(b) / 15d-14(b) of the
Securities Exchange Act of 1934 and 18 U.S.C. Section
1350.
|
|
32.2
|
Certification
of Chief Financial Officer Pursuant to Rule 13a-14(b) / 15d-14(b) of the
Securities Exchange Act of 1934 and 18 U.S.C. Section
1350.
|
__________
|
*
|
Schedules
or exhibits omitted. The Company shall furnish supplementally to the SEC a
copy of any omitted schedule or exhibit upon
request.
|
|
**
|
A
management contract or compensatory plan or arrangement required to be
filed as an exhibit to this report pursuant to Item 15(c) of Form
10-K
|
+ Filed
herewith.
86